download - csiro
16
139 Soil–environment impacts Assessment of a Small Catchment on the Loess Plateau Guobin Liu, * Mingxiang Xu, * Li Rui, * Joe Walker † and Weiyin Hu * Abstract The Loess Plateau is being redeveloped to achieve a healthy ecosystem. Taking a small watershed as an example, this study used an analytic hierarchy process to identify different land uses, soil characteristics, crop yield and income for assessment of ecosystem rehabilitation. Various physical and social indicators were also analysed on the catchment scale. The results showed that after about 20 years of soil conservation and restoration, the ecosys- tem health index of the watershed had improved from 0.178 in 1985 to 0.707 in 1999. The research introduced several new indicators (soil organic content, soil antiscourability, total income from industry and off-farm, and the efficiency of integrated control measures in decreasing soil loss) of physical characteristics of soil and sug- gested how these indicators should be weighted for calculation of the ecosystem health index. * Institute of Soil and Water Conservation, Chinese Academy of Sciences and Ministry of Water Resources, NWSUAF, Yangling, Shaanxi 712100, PRC. Email: [email protected] † CSIRO Land and Water, GPO Box 1666, Canberra, ACT 2601, Australia. 10 Guobin Liu, Mingxiang Xu, Li Rui, Walker, J. and Weiyin Hu. 2002. Assessment of a small catchment on the Loess Plateau. In: McVicar, T.R., Li Rui, Walker, J., Fitzpatrick, R.W. and Liu Changming (eds), Regional Water and Soil Assessment for Managing Sustainable Agriculture in China and Australia , ACIAR Monograph No. 84, 139–154.
Transcript of download - csiro

139
Soil–environment impacts
Assessment of a Small Catchment on the Loess Plateau
Guobin Liu,
*
Mingxiang Xu,
*
Li Rui,
*
Joe Walker
†
and Weiyin Hu
*
Abstract
The Loess Plateau is being redeveloped to achieve a healthy ecosystem. Taking a small watershed as an example,this study used an analytic hierarchy process to identify different land uses, soil characteristics, crop yield andincome for assessment of ecosystem rehabilitation. Various physical and social indicators were also analysed onthe catchment scale. The results showed that after about 20 years of soil conservation and restoration, the ecosys-tem health index of the watershed had improved from 0.178 in 1985 to 0.707 in 1999. The research introducedseveral new indicators (soil organic content, soil antiscourability, total income from industry and off-farm, andthe efficiency of integrated control measures in decreasing soil loss) of physical characteristics of soil and sug-gested how these indicators should be weighted for calculation of the ecosystem health index.
* Institute of Soil and Water Conservation, Chinese Academy of Sciences and Ministry of Water Resources, NWSUAF, Yangling, Shaanxi
712100, PRC. Email: [email protected]† CSIRO Land and Water, GPO Box 1666, Canberra, ACT 2601, Australia.
10
Guobin Liu, Mingxiang Xu, Li Rui, Walker, J. and Weiyin Hu. 2002. Assessment of a small catchment on the Loess Plateau. In: McVicar, T.R., Li Rui, Walker, J., Fitzpatrick, R.W. and Liu Changming (eds),
Regional Water and Soil Assessment for Managing Sustainable Agriculture in China and Australia
, ACIAR Monograph No. 84, 139–154.
***China***.book Page 139 Monday, April 29, 2002 9:06 AM

140
Soil–environment impacts
S
OIL
erosion is a serious worldwide environmental
problem and a major threat to the sustainability of
agriculture. The Loess Plateau, with its deep, loose
loess (a loam deposited by wind), is continuously
losing soil and productivity due to severe soil
erosion. Aware of the extent and severity of the
problem, the Chinese government is promoting
measures to control soil erosion and establish a
healthy ecosystem in the Loess Plateau region. A
successful approach is to focus on a small watershed
that can act as a model for the development of similar
watersheds. For example, three projects in the Zhi
Fanggou catchment, each spanning five years, have
produced significant economic, social and ecological
benefits (Liu 1999). However, there is still no
established method for assessing ecosystem health.
Soil is a major ecosystem component, so its charac-
teristics and dynamics are a useful index of health
(Walker and Reuter 1996; Liu Guobin et al. 1999). In
this study, we selected a catchment that had been
managed for several years and measured several soil
physical and chemical properties. We also developed
a method to assess the health of the catchment.
The Zhi Fanggou catchment lies in the central area
of the Loess Plateau in northern Shaanxi province.
The catchment is 8.27 km
2
ranging from 1000 to
1350 m in altitude. Figure 4 of the Overview shows
the main locations on the Loess Plateau.
There are significant topographic variations within
the study area, with typical loess hills and gully
landforms; 32% of land has a slope of more than
35°. The land is a mosaic of slope cropland, fallow
land, grassland, shrubland, orchard land and
woodland. Crops are mainly potatoes (
Solanum tuberosum
), beans (
Phaseolus valgaris
), corn (
Zea mays
L
.
) and millet (
Panicum miliaceum
). The
artificial woods are dominated by locust trees
(
Robinia pseudoacacia
L
.
). The grassland is mainly
covered by annuals such as sweet wormwood
(
Artemisia annua
L
.
), annual fleabane (
Erigeron annuus
Pers
.
) and sandy needlegrass (
Stipa glareosa
p. Smirn). Littleleaf peashrub (
Caragana microphylla
) is found in shrubland, and apple trees
(
Malus pumila mill
) in orchards. Some land became
fallow about two to three years ago when cultivated
plots were abandoned.
The region has a semiarid continental climate with
an average annual temperature of 8.8°C. Monthly
mean temperatures range from 22.5°C in July to
–7°C in January. Average annual precipitation is
485 mm, with 60% of rain falling between July and
September. On average, there are 159 frost-free days
and 2415 hours of sunshine each year.
Thick soils develop on loess parent material,
averaging 50–80 m. The most common soil type in
the catchment is loess with the texture of fine silt.
The soil has little resistance to erosion and is being
lost at the rate of about 10,000–12,000 t/km
2
/year
(Jiang and Fan 1990).
Materials and Methods
Soil characteristics
Twenty plots of different land-use types in the Zhi
Fanggou catchment were selected in 1999. Table 1
shows the basic characteristics of the plots. Soil
samples were taken for five layers at 10 cm intervals,
from the soil surface to a depth of 50 cm. Soil
antiscourability (the ability to resist detachment),
stable rate of infiltration of water, aggregate stability
and organic matter content were measured in these
samples. Cohesion of surface soil when saturated
was also measured.
Antiscourability
Soil antiscourability was measured by a washing
method (Liu 1997), using specialised equipment
referred to as an ‘antiscouring mini-flume’ (Fig. 1).
Soil was placed in a groove and scoured with water
at a rate of 1.4 L/minute, based on the premise that
all the rainfall at 2 mm/minute (the maximum
density in the Loess Plateau) in a standard plot of
5
×
20 m
2
would be lost as runoff. The soil sample
was saturated before washing and the slope of the
groove was regulated according to the selected plot.
***China***.book Page 140 Monday, April 29, 2002 9:06 AM

141
Soil–environment impacts
Four samples were taken at each of the five layers.
Soil antiscourability was calculated from the
following equation:
where
S
0
is soil antiscourability (L/min/g),
Q
is total
runoff for scouring (mL),
T
is scouring time and
M
is the dry soil weight lost in the groove (g).
Steady infiltration rate
The soil infiltration rate was tested using an
infiltration cylinder 12 cm in height and 10 cm in
diameter. Soil samples were saturated for 12 hours
before measurement and a constant head of water of
2 cm was maintained during measurement. The
outflow was measured at three-minute intervals until
the infiltration rate stabilised. Fifteen soil samples
Table 1. Basic characteristics of the experiment plots.
Land-use type Vegetation type No. of plots Topography Sampling date (1999)
Cropland Foxtail millet 1 Steep slope 30 April–28 May
23–31 August
9–22 October
Potato 3 Steep slope, terrace, gentle slope
Pearl millet 3 Gentle slope1, steep slope2
Soybean 2 Gentle slope, steep slope
Corn 1 Terrace
Woodland Poplar, acacia 3 Slope 29 June to 7 August
Shrubland Caragana korshinskii 3 26 June to 14 August
Human-made grassland
Melilot 1 16 July
Natural grassland
Bothriochloa ischaemum, Sophora viciifolia, Artemisia giraldiiStipa bungeana
3 13 July to 7 August
Figure 1. Mini-flume for soil antiscourability test.
SQ T
M0 =×
***China***.book Page 141 Monday, April 29, 2002 9:06 AM

142
Soil–environment impacts
were taken (three repeats in each of five layers). Soil
steady infiltration rate was calculated as follows:
where
V
is the soil steady infiltration rate (mm/
min),
Qi
is the outflow from the cylinder during
infiltrating time
ti
(mL),
S
is the area of the base of
the cylinder (cm
2
),
L
is the height of the soil sample
(cm),
H
is the height of the water head (cm) and
K
t
is the infiltration coefficient when the water
temperature is
t
(°C).
Aggregate stability
Aggregate stability was tested used a modification of
the Yoder method (Zhu 1989). A set of sieves
(5 mm, 2.5 mm, 1 mm, 0.5 mm and 0.25 mm) was
prepared with larger mesh at the top and smaller
mesh at the bottom. The saturated soil sample
(wetted by capillary water to remove air in the soil)
was placed in the sieves, which were then immersed
in water and shaken for one minute. The aggregate
in each sieve was weighed and the percentage of
each particle class calculated. Mean weight diameter
(MWD) of aggregate stability (Le Bissonnais 1996;
Le Bissonnais 1997) was also calculated, using the
following equation:
where
MWD
is mean weight diameter (mm),
X
i
is
the average diameter of each particle class (mm) and
W
i
is the proportion of aggregate relating to
X
i
(%).
Soil cohesion
A pocket shear tester (Fig. 2) was used to measure
soil surface cohesion (Brunori et al. 1989). Soil was
first saturated using a sprinkler. A pocket vane tester
was set at zero and inserted into the ground to a
depth where the vanes were no longer visible. The
tester was turned to the right until the soil failed. If
the value was above 8, a smaller vane was used for
further tests; if it was below 2, a larger vane was used.
The average cohesion value (kg/cm
2
) was calculated
by multiplying by 0.02, 0.10 and 0.25 for the large,
medium-sized and small vane respectively.
Cohesion measurements were repeated 10 times in
each plot.
The average of each parameter in each measuring
period was calculated for each type of land use. A
weighted average of each parameter in the whole
catchment was calculated, based on the area used
for each type of land use. An analysis of variance
was calculated for each parameter from the
measurements taken each year.
Organic matter content
Organic matter content was measured using the
K
2
Cr
2
O
7
oxidation method.
Analytic hierarchy process
Soil characteristics were calculated on catchment
scale (related to land use) and plot scale. The
historical soil characteristics of the catchment were
calculated from current land use and soil
characteristics, based on the premise that soil
characteristics differ markedly between different
land uses and do not readily change within land-use
classes.
VQiS ti
K VL
H L
KK
t
t
ti
= ×
= ×+
=+
10
0 7 0 0310 . .
MWD X Wi ii
n= ⋅∑
=1
Figure 2. Shear tester with different vanes.
***China***.book Page 142 Monday, April 29, 2002 9:06 AM
143
Soil–environment impacts
The analytic hierarchy process (AHP) is a method
to break a complex question into several different
components, structure these components into
layers, then rank the sequence of the components
and weight them. The method described by Zhao
Huancheng et al. (1986) was used to perform the
following three tasks.
•
Construct an analytic hierarchy model
. A complex
situation was divided into different components;
structured into objective, criteria, index, scenario
and measurement layers; and the relation
between these layers structured by a graph.
•
Produce a matrix
. Components were sequenced
by comparing the importance of each factor
with the other factors and assigning them values
as shown in Table 2. A matrix was produced
based on these values, and the maximum
eigenvalue and eigenvector of the matrix were
calculated. The weighted values of the factors in
one layer compared to those in a superior layer
could then be calculated.
•
Test for consistency
. A single order consistency
test was based on the following equation:
where
CI
is the index of consistency,
λ
max
is the
maximum eigenvalue of the matrix,
n
is the rank
value of the matrix,
RI
is the mean random index of
consistency and
CR
is the random consistency ratio.
Table 3 shows the mean random index of
consistency values.
The matrix is consistent if
CR
< 0.10. Otherwise, the
matrix is not consistent and the matrix value should
be adjusted.
An overall consistency test was conducted from the
top layer of the matrix to the interior layers.
The
random ratio of consistency can be obtained using
the following equation:
where
CI
j
is the consistency index of the factors in
the interior layer compared to factor
j
in the
superior layer and
RI
j
is the corresponding mean
random index of consistency. When
RI
< 0.1, the
overall order of the hierarchy is consistent.
Results and Discussion
Ecological indicators
Soil quality
Antiscourability
Table 4 shows the soil indicator characteristics in
different land-use types. Soil antiscourability
Table 2. Value assignment in the assessment matrix.
Value Meaning
1 The two factors are equally important
3 One factor is slightly more important than the other one
5 One factor is obviously more important than the other one
7 One factor is intensively more important than the other one
9 One factor is extremely more important than the other one
2,46,8
Median of the respective values above
CRCIRI
= < 0 10. CIn
n=
−−
λmax
1
CRCI
RIj
j
=
Table 3. Mean random index of consistency.
Valuea 1 2 3 4 5 6 7 8 9
CR 0.00 0.00 0.58 0.90 1.12 1.24 1.32 1.41 1.45
CR = random consistency ratioa See Table 2 for value assignments
***China***.book Page 143 Monday, April 29, 2002 9:06 AM

144
Soil–environment impacts
differed significantly between different land uses in
Zhi Fanggou catchment. Shrubland had the greatest
antiscourability, followed in sequence by natural
grassland, woodland, human-made grassland and
farmland (Table 4). The antiscourability of
shrubland and natural grassland was about 70–90
times greater than that of cropland. Two years after
the conversion of slope cropland to grassland, the
antiscourability had increased 10-fold, suggesting
that soil antiscourability in slope cropland can
improve rapidly when land use is changed.
Figure 3 shows soil indicator characteristics in soil
profiles in the Zhi Fanggou catchment. The soil
antiscourability profile for all types of land use
decreased sharply from upper to lower layers except
in cropland, where the highest value was found in
the 10–20 cm layer, perhaps influenced by the
presence of roots (Fig. 3a,b).
Infiltration rate
Infiltration is the process by which water enters the
soil. It is an important link between precipitation,
surface water, soil moisture and groundwater.
Reduced infiltration can decrease crop yields as it
leads to less water being stored in the soil for use by
crops. Runoff associated with low infiltration is
associated with soil erosion, particularly on slopes
(Radford et al. 1992; Connolly et al. 1998). To build
a healthy ecosystem in the Loess Plateau, increased
infiltration capacity and reduced runoff are needed.
Therefore, it is important to understand the
characteristics of soil infiltration in soil and water
conservation in the catchment.
Table 4 indicates that the infiltration rate varied
widely among different types of land use and
correlated positively with the MWD of soil,
aggregate stability and organic matter content.
Figures 3c and 3d show the organic matter content
and steady infiltration rate, respectively, for
different types of land use.
Vegetation can improve the antiscourability and
infiltration of soil by increasing the content of
organic matter and eliminating the effect of rainfall
splash; plant roots can also increase antiscourability.
Aggregate stability
In general, soil aggregate stability correlates
positively with organic matter content, which
commonly declines under arable cropping, leading
to soil degradation problems such as crusting,
runoff and erosion (Bissonnais et al. 1997; Guerra
1994; Sullivan 1990). The MWD reflects the size of
stable soil aggregate. In general, good soil structure
has a higher MWD, making the soil porous with
high infiltration ability.
In this study, MWD was highest in shrubland,
followed by woodland, natural grassland, human-
made grassland and cropland (Table 4). As a whole,
Table 4. Soil indicator characteristics in different land-use types.
Characteristic Farmland Woodland ShrublandNatural
grasslandPlanting grassland
Stable infiltration rate (mm/min) 0.65 1.11 0.85 1.93 0.78
OMC (%) 0.46 0.95 0.89 1.33 0.43
MWD of water stable aggregate (mm) 1.74 2.81 2.91 2.54 2.06
Antiscourability (L/min/g) 0.042 2.538 4.237 3.470 0.585
Cohesion (kg/cm2) 0.082 0.111 0.082 0.111 0.119
MWD = mean weight diameter ; OMC = organic matter contentNote: The data in the table are the average of five layers from the soil surface to 50 cm down (saturated soil cohesion was measured only in the surfacelayer).
***China***.book Page 144 Monday, April 29, 2002 9:06 AM

145
Soil–environment impacts
0
0.0 5.0 10.0 15.0 20.0
10
20
Dep
th in
pro
file
(cm
)
30
40
50
Antiscourability (L/min/g)
0
0.00 0.02
Antiscourability (L/min/g)
0.04 0.06
10
20
Dep
th in
pro
file
(cm
)
30
40
50
0
0.00 2.001.00
Steady infiltration rate (mm/min)
3.00 4.00
10
20
Dep
th in
pro
file
(cm
)
30
40
50
0
0.0 1.0 2.0 3.0
10
20
Dep
th in
pro
file
(cm
)
30
40
50
Organic matter content (%)
0
0.0 2.0
MWD of water table aggregate (mm)
4.0 6.0
10
20
Dep
th in
pro
file
(cm
)
30
40
50
Natural grassland
Human-made grassland
Woodland
Cropland
Shrubland
(a) (b)
(c) (d)
(e)
Figure 3. Soil indicator characteristics in soil profiles of the Zhi Fanggou catchment ecosystem: (a) and (b) antiscourability; (c) organic matter content; (d) steady infiltration rate; and (e) mean weight diameter.
***China***.book Page 145 Monday, April 29, 2002 9:06 AM

146
Soil–environment impacts
MWD in the soil profile decreased from the upper
to the lower layers (Fig. 3e), but was highest in the
10–20 cm layer in cropland, human-made grassland
and shrubland, possibly due to farming activities on
the topsoil.
Soil cohesion
Soil cohesion is an index of soil resistance related to
the ability to resist external forces. Generally, soil
erosion correlates negatively with soil cohesion,
which is related to factors such as soil type, organic
matter and soil water content (Brunori et al. 1989).
The study showed that soil cohesion for woodland
and grassland was almost the same, and was much
greater than that for shrubland and cropland
(Table 4).
Plant roots, soil moisture content, bulk density,
plasticity index and organic matter affect soil
cohesion. Thus, saturated cohesion (cohesion of the
soil when the soil is saturated) is low in the topsoil
of cropland and shrubland.
Organic matter content
Soil organic matter is the basis of soil fertility and the
formation of stable aggregate. In Zhi Fanggou
catchment, different land-use types have
significantly different soil organic matter content
(Table 4). Levels are similar in cropland and human-
made grassland, but about half to one-third of other
land-use types. The sequence was natural
grassland > woodland > shrubland > cropland and
planting grassland (Table 4). The organic matter
content decreased from the top of the soil to the
lower layer (Fig. 3c).
There were significant positive correlations between
the steady infiltration rate and the organic matter
content:
y
= 0.3583e1.0153x
R
= 0.7973 (
n
=24)
where
y
is
K
10
and
x
is organic matter content.
The analysis showed that soil structure improved
and the soil became more porous as the organic
matter content increased, allowing an increase in
infiltration capacity.
Spatial distribution
In order to better understand how soil
environmental quality had changed after 20 years of
environmental rehabilitation in the catchment, we
analysed several soil characteristics at the plot scale
in different land-use types. We then applied the
plot-scale experimental results to the catchment
and calculated the soil characteristic values for
previous years using data from the year of the
experiment. We made the following assumptions.
• We could ignore changes in soil characteristics
over time, because they are much less significant
than differences in characteristics for different
forms of land use.
• We did not need to include water, bare rock,
villages or roads in the total catchment area
because these features occupied a negligible part
of the total area and because we assumed that
the area had not changed greatly in the previous
20 years.
• In calculating the total antiscourability of the
catchment, we did not need to consider the
antiscourability of terrace because soil is not
usually lost from level terraces.
We classified cropland as either > 20° slope or
≤
20°
slope and calculated the soil characters of the
catchment using the following equation:
V
=
Σ
P
i
×
V
i
where
V
is the value of the soil character on the
catchment scale;
P
i
is the percentage area of land-use
type
i
in the catchment area; and
V
i
is the value of
the soil character in land-use type
i
at the plot scale.
For all the soil indicators we examined, we found
that at 0–20 cm of the soil profile there were obvious
***China***.book Page 146 Monday, April 29, 2002 9:06 AM

147
Soil–environment impacts
differences according to different land-use types
(Fig. 3). In other words, soil characteristics in the
upper layer (0–20 cm) of the soil profile are
important and should receive more attention in
indicator measurements.
Figure 4 shows several soil characteristics in the
catchment for 1938, 1958, 1975 and 1997. For the
same years, we also mapped the occurrence of these
characteristics for different land-use types. Figures
5–10 show the spatial and temporal variation of
several soil characteristics.
Temporal distribution
Figure 4 and Figures 5–10 show the temporal
variation of several soil characters from 1938 to
1999. During the 1930s, the ecosystem was well
developed because most sloping land was
woodland, shrubland and grassland, with only a
small area used for crops. The soil characters we
analysed accordingly reached their highest values in
1938. In 1958, ‘wasteland’ was opened up, leading to
degradation and maladjustment of the ecosystem.
At this time, we found the lowest values for the soil
characters we analysed. From 1958 to the 1970s
values stayed the same or increased slowly. At about
that time, integrated control measures were
implemented in the catchment. These included
changes in land use, the building of level terraces,
vegetation rehabilitation, the development of cash
crops and the planting of trees. Values rose quickly
from the end of the 1970s to the 1990s, becoming
steady in the early and mid-1990s and ascending
again in 1997.
Vegetation
Vegetation plays a very important role in soil and
water conservation. After the integrated control
measures were put in place, the amount of
vegetation cover in the catchment increased
continuously—up to 57% in 1999, compared to
51% in 1938.
Primary cropland
As cropland is better managed and yields increase,
it can be replaced by woodland and grassland, so
that farming activities place less pressure on the
environment. The target area for primary cropland
per capita in Zhi Fanggou catchment is 3 mu
(0.2 ha), which can provide sufficient food in
normal years. We used the ratio of the present
cropland per capita to the target figure of 0.2 ha to
indirectly reflect the degree to which farming
activities affect the environment.
0.0
0.5
1.0
1.5
2.0
2.5
3.0
1936 1946 1956 1966
Year
1976 1986 1996
Soil
ind
icat
ors
val
ue
Anti-scourability
Steady infiltration rate
Organic matter content
Mean weight diameterof aggregate
Figure 4. Soil trend indicators in the Zhi Fanggou catchment ecosystem, 1936–96.
***China***.book Page 147 Monday, April 29, 2002 9:06 AM

148
Soil–environment impacts
Terrace
Cropland
Orchard
Woodland
Young woodland
Grassland
Unusable land
Residential
1938 1958 1975 1987 1997
0.00–0.50
0.50–0.65
0.65–1.00
1.00–2.00
2.00–2.50
1938 1958 1975 1987 1997
0.00–0.50
0.50–0.64
0.64–1.00
1.00–1.40
1.40–4.00
4.00–5.00
1938 1958 1975 1987 1997
Figure 5. Land-use change in the Zhi Fanggou catchment ecosystem, 1938–97.
Figure 6. Organic matter content (%) in soils of the Zhi Fanggou catchment ecosystem, 1938–97.
Figure 7. Infiltration (mm/min) in the Zhi Fanggou catchment ecosystem, 1938–97.
***China***.book Page 148 Monday, April 29, 2002 9:06 AM

149
Soil–environment impacts
0.00–2.00
2.00–2.50
2.50–3.00
3.00–3.10
3.10–4.20
1938 1958 1975 1987 1997
0.00–0.10
0.10–1.00
1.00–2.50
2.50–5.00
5.00–9.00
Terrace
Village
1938 1958 1975 1987 1997
0.00–0.05
0.05–0.10
0.10–0.15
0.15–0.50
0.50–0.70
1938 1958 1975 1987 1997
Figure 9. Antiscourability (L/min/g) in the Zhi Fanggou catchment ecosystem, 1938–97.
Figure 8. Mean weight diameter (mm) of aggregate in the Zhi Fanggou catchment ecosystem, 1938–97.
Figure 10. Cohesion (kg/cm2)of soil in the Zhi Fanggou catchment ecosystem, 1938–97.
***China***.book Page 149 Monday, April 29, 2002 9:06 AM

150
Soil–environment impacts
Socioeconomic indicators
Output/input ratio in agriculture
In agriculture the ratio of outputs to inputs can
reflect the efficiency of capital and energy use. From
1984 the ratio decreased until the middle of 1990s,
when it levelled off. Before integrated control
measures were implemented, agriculture in the Zhi
Fanggou catchment was carried out with little or no
input. In the initial stage of the control measures,
the output/input ratio was very high because soil
productivity was low and potential productivity was
great. When soil productivity increased, actual
productivity was close to the potential and the
output–input ratio stabilised.
Net income per capita
The net income per capita in the Zhi Fanggou
catchment increased gradually from 1985 to 1999,
although it decreased in 1991, 1996 and 1997 due to
drought (Fig. 11a).
Realised potential yield
The realised potential yield (Fig. 11b) is the ratio of
the current yield in the catchment to the potential
maximum yield in the local climate, which is
5745 kg/ha (Liu et al. 1998). The realised potential
yield reflected the industry structure of the Zhi
Fanggou catchment and increases in soil
productivity in the catchment. As a whole, the
realised potential yield gradually increased from
1985 to 1999.
System function indicators
We used the following indexes to indicate how well
the ecosystem was functioning in terms of its
capacity to resist natural disasters and its ability to
sustain stable development. The indicators
demonstrated that, to some extent, damage to
catchment ecosystems had slowed or ceased and
that some recovery was occurring.
Ecosystem restoration
This indicator shows the extent of the effort to
control the destruction of catchment ecosystems and
to restore natural ecosystems. The indicator we used
was the proportion of the actual control achieved as
a percentage of the control that had been required.
Capacity to resist natural disasters
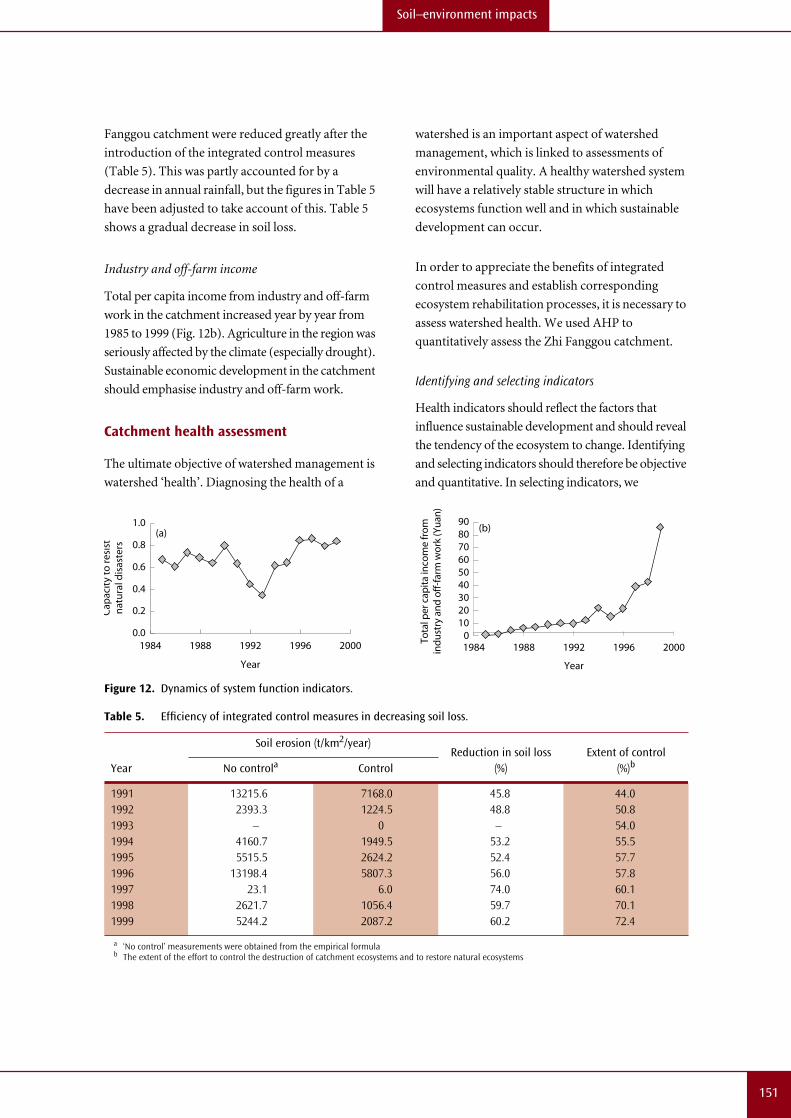
We measured the capacity of the catchment to resist
natural disasters by calculating the production value
in disaster years as a proportion of the mean
production of recent years. The increasing trend in
the capacity of the system to resist disasters
(Fig. 12a) was a strong indication that integrated
control measures in the Zhi Fanggou catchment had
led to an improvement in the comprehensive
functioning of the system.
Reduced soil loss
We measured the efficiency of the integrated
control measures in decreasing soil loss by
calculating the percentage soil loss before and after
the introduction of integrated control measures.
The intensity and amount of soil erosion in the Zhi
0
500
1000
1500
2000
2500
Net
inco
me
per
cap
ita/
yuan
1984 1988 1992
Year
1996 2000
(a)
0
10
20
30
40
50
60
Real
ised
po
ten
tial
yie
ld (%
)
1984 1988 1992
Year
1996 2000
(b)
Figure 11. Changes in socioeconomic indicators in in the Zhi Fanggou catchment.
***China***.book Page 150 Monday, April 29, 2002 9:06 AM
151
Soil–environment impacts
Fanggou catchment were reduced greatly after the
introduction of the integrated control measures
(Table 5). This was partly accounted for by a
decrease in annual rainfall, but the figures in Table 5
have been adjusted to take account of this. Table 5
shows a gradual decrease in soil loss.
Industry and off-farm income
Total per capita income from industry and off-farm
work in the catchment increased year by year from
1985 to 1999 (Fig. 12b). Agriculture in the region was
seriously affected by the climate (especially drought).
Sustainable economic development in the catchment
should emphasise industry and off-farm work.
Catchment health assessment
The ultimate objective of watershed management is
watershed ‘health’. Diagnosing the health of a
watershed is an important aspect of watershed
management, which is linked to assessments of
environmental quality. A healthy watershed system
will have a relatively stable structure in which
ecosystems function well and in which sustainable
development can occur.
In order to appreciate the benefits of integrated
control measures and establish corresponding
ecosystem rehabilitation processes, it is necessary to
assess watershed health. We used AHP to
quantitatively assess the Zhi Fanggou catchment.
Identifying and selecting indicators
Health indicators should reflect the factors that
influence sustainable development and should reveal
the tendency of the ecosystem to change. Identifying
and selecting indicators should therefore be objective
and quantitative. In selecting indicators, we
Table 5. Efficiency of integrated control measures in decreasing soil loss.
Year
Soil erosion (t/km2/year)Reduction in soil loss
(%)Extent of control
(%)bNo controla
a ‘No control’ measurements were obtained from the empirical formulab The extent of the effort to control the destruction of catchment ecosystems and to restore natural ecosystems
Control
199119921993199419951996199719981999
13215.62393.3
–4160.75515.5
13198.423.1
2621.75244.2
7168.01224.5
01949.52624.25807.3
6.01056.42087.2
45.848.8–
53.252.456.074.059.760.2
44.050.854.055.557.757.860.170.172.4
0.0
0.2
0.4
0.6
0.8
1.0
Cap
acit
y to
resi
stn
atu
ral d
isas
ters
1984 1988 1992
Year
1996 2000
(a)
0102030405060708090
Tota
l per
cap
ita
inco
me
from
ind
ust
ry a
nd
off
-far
m w
ork
(Yu
an)
1984 1988 1992
Year
1996 2000
(b)
Figure 12. Dynamics of system function indicators.
***China***.book Page 151 Monday, April 29, 2002 9:06 AM

152
Soil–environment impacts
considered the hilly and gullied nature of the Loess
Plateau; the requirement for environmental
rehabilitation; and the need for indicators to be
objective, scientific, universal, independent and
flexible. Figure 13 shows the indicators we selected.
Figure 14 shows how these indicators were used to
assess health in the Zhi Fanggou catchment.
Weighting the indicators
We assumed that different factors were important at
different stages of ecosystem rehabilitation. Table 6
shows the assessment matrix for weighting indexes
in different periods of ecosystem rehabilitation. The
matrix was graded by experimental experts in soil
and water conservation according to various
development stages (Lu Zongfan et al. 1990, 1997).
Tests using the maximum eigenvalue and
eigenvector of the matrix demonstrated that the
matrix was consistent. The weight of indicators was
calculated from the matrix.
Calculating a health index
In order to calculate the health index, the indicator
unit must be uniform. The minimum and maximum
values of the indicators (indicator criteria) were
defined according to the research results on soil
conservation and environmental rehabilitation, the
historical and current values of the indicators in the
catchment and national regional development
policy. Table 7 shows the results.
The dimensionless values of the indicators were
obtained from the marks of the unifying table. The
health index (Table 8 and Fig. 14) was calculated as
follows:
I = ΣWa1 × Va1
where I is the health index; Wa1 is the weight of the
indicator, a1, to the area of the catchment; and Va1
is the dimensionless value of the indicator, a1. The
terms a1, a2,….a10 identify the 10 indicators
mentioned above.
Conclusions
Table 9 shows the health classification of the Zhi
Fanggou catchment ecosystem. Before integrated
control measures were introduced in the Zhi
Fanggou catchment, catchment health was poor
and there was a vicious circle in which increasing
economic development led to reduced
Objective layer Healthy and sustainable catchment ecosystem
Criteria layer Social economic
function (U 2)
Comprehensive
function (U 3)
Eco-environmental
function (U 1)
Indicator layer
B1
B2 B3 C3 C2
C1A1 A2
A4 A3
Figure 13. Structure of the analytic hierarchy model in assessing the ecosystem health of the Zhi Fanggou catchment. The indicators for environmental function include vegetation coverage (A1), ratio of primary cropland to targeted cropland area (A2), soil antiscourability (A3) and soil organic matter content (A4). The indicators for socioeconomic function include the ratio of outputs to inputs in agriculture (B1), the actual yield as a proportion of potential yield (B2) and the net income per capita (B3). The indicators for comprehensive function were the capacity to resist natural disasters (system resilience) (C1), the efficiency of integrated control measures in decreasing soil loss (C2) and the total income from industry and off-farm work(C3).
***China***.book Page 152 Monday, April 29, 2002 9:06 AM

153
Soil–environment impacts
environmental quality (Zhao Chongyun 1996).
After integrated control measures were introduced,
the catchment ecosystem became relatively stable,
with appropriate development.
Our research demonstrated that there have been
three stages of ecosystem restoration in the Zhi
Fanggou catchment: initial restoration (1985–88),
with a health index of 0.25; stable improvement
(1989–93), with a health index of 0.35–0.45; and a
good development period (1994 on) with a health
index of 0.45–0.70. The results provide scientific
support for the theory that soil and water
conservation measures can be gradually
implemented in the Loess Plateau region. They also
indicate that degraded ecosystems on the Loess
Plateau can be restored with 20 years of integrated
control measures.
Table 6. Assessment matrix for weighting indexes in different periods of ecosystem rehabilitation (see Figure 13 for an explanation of indexes).
A1 A2 A3 A4 B1 B2 B3 C1 C2 C3
Initial restoration 0.0233 0.1129 0.0157 0.0314 0.0684 0.2762 0.2986 0.0186 0.0764 0.0783
Stable improvement 0.0349 0.1313 0.0338 0.0676 0.0555 0.2033 0.2086 0.0319 0.1185 0.1145
Good development 0.0510 0.1545 0.0437 0.0874 0.0513 0.1820 0.1723 0.0388 0.1119 0.1072
Table 7. Combined indicators.
No. Indicatora
Value
1 2 3 4 5 6 7
A1 Vegetation coverage (%) <5 10 15 20 35 50 >70
A2 Ratio of primary cropland to targeted cropland area (%)
<10 20 30 50 55 60 >75
A3 Soil antiscourability (min/L/g)b <0.30 0.40 0.50 0.60 0.80 1.0 >2.0
A4 OMC (%) <0.4 0.5 0.6 0.7 0.8 0.8 >1
B1 Output–input ratio in agriculture 11 10 9 8 7 6 5
B2 Yield as a proportion of potential yield (%) <5 10 15 20 35 50 >75
B3 Net income per capita (yuan) <100 200 500 1000 1500 2000 >3000
C1 System resilience (%)c <5 10 15 20 35 50 >75
C2 Efficiency of integrated control measures in reducing soil loss (%)
<5 10 15 20 35 50 >75
C3 Total income from industry and off-farm work (×103 yuan)
<1 2 5 15 30 60 >140
OMC = organic matter contenta See figure 13 for an explanation of termsb Volume of water (product of volume and time) needed to scour 1 g of dry soil c The capacity to resist natural disasters
0.80
Hea
lth
ind
ex
0.70
0.60
0.50
0.40
0.30
0.20
0.10
0.001984 1988 1992
Year1996 2000
0.3770.559
Figure 14. Changes in the health index of the Zhi Fanggou catchment ecosystem, 1984–2000.
***China***.book Page 153 Monday, April 29, 2002 9:06 AM

154
Soil–environment impacts
References
Bissonnais, Y. Le and Arrouays, D. 1997. Aggregate stability andassessment of soil crustability and erodability: Applicationto humic loamy soils with various organic carbon contents.European Journal of Soil Science, 48, 39–48.
Brunori, F., Penzo, M.C. and Torri, Firenze, D. 1989. Soil shearstrength: its measurement and soil detachability. Catena.
Connolly, R.D., Freebairn, D.M. and Bell, M.J. 1998. Change insoil infiltration associated with leys in south-easternQueensland. Australian Journal of Soil and Research, 36,1057–72.
Guerra, A. 1994. The effect of organic matter content on soilerosion in simulated rainfall experiments in W. Sussex, UK.Soil Use and Management, 10, 60–64.
Jiang Dingsheng and Fan Xingke. 1990. Study on the benefit andoptimal disposition for measures of soil and water conser-vation in hilly and gully region in Loess Plateau. Studies onecological agriculture with soil and water conservation inLoess Hilly Gully Region. Tianze Press, China, 87–100.
Le Bissonnais, Y. 1996. Aggregate stability and assessment ofsoil crustability and erodability: Theory and methodology.European Journal of Soil Science, 47, 425–437.
Le Bissonnais, Y. 1997. Aggregate stability and assessment ofsoil crustability and erodability: Application to humic loamsoils with various organic carbon contents. European Jour-nal of Soil Science, 48, 39–48.
Liu Guobin. 1997. Soil antiscourability research and its perspec-tives in Loess Plateau. Research on Soil and Water Conserva-tion, 5, 91–101 (in Chinese).
Liu Guobin. 1999. Soil conservation and sustainable agricultureon the Loess Plateau: challenges and prospective. AMBIO,Sweden, 28(8), 663–668.
Liu Guobin and Zheng Fengli. 1998. Study on the system stabil-ity of soil and water conservational eco-agriculture in Zhi-fanggou small watershed in Ansai. Progress in Geography,17(supplement), 48–54 (in Chinese).
Liu Guobin, Hu Chunsheng and Joe Walker (eds). 1999. A guideto environmental indicators. CSIRO Land and Water, Can-berra (in Chinese).
Lu Zongfan, Liang Yiming and Wang Jijun. 1990. An approach tothe division of period for ecological agriculture with soiland water conservation. In: Studies on ecological agricul-ture with soil and water conservation in Loess Hilly GullyRegion. Tianze Press, 28–35.
Lu Zongfan, Liang Yimin and Liu Guobin (eds). 1997. Eco-agri-culture in the Loess Plateau of China. Shaanxi Sci-techPress, Shaanxi, China, 205–206 (in Chinese).
Radford, B.J., Gibson, G., Mielsen, T.G.H., Butler, D.G., Smith,G.D. and Orange, D.O. 1992. Fallowing practices, soil waterstorage, plant-available soil nitrogen accumulation andwheat performance in south west Queensland. Soil and Till-age Research, 22, 73–93.
Sullivan, L.A. 1990. Soil organic matter, air encapsulation andwater-stable aggregation. Journal of Soil Science, 41, 529–534.
Walker, J. and Reuter, D.J. 1996. Indicators of CatchmentHealth: a technical perspective. CSIRO Publishing, Colling-wood, Australia.
Zhao Chongyun, Zhang Jianming and Gu Hengyue (eds). 1996.Assessing method and model for the ecological benefit ofintegrated control to small watershed. Water ConservancyPress, Beijing, China, 135–140 (in Chinese).
Zhao Huancheng, Xu Shubuo and He Jingsheng (eds). 1986. Ana-lytic Hierarchy Process—a new decision method for advice.Science Press, Beijing, China. (in Chinese)
Zhu Xianmo. 1989. Soil and agriculture in the Loess Plateau.Chinese Agricultural Press, 216–218.
Table 8. Health indexes for the Zhi Fanggou catchment ecosystem, 1985–99.
Year Health index
1985 0.178
1986 0.197
1987 0.224
1988 0.264
1989 0.310
1990 0.377
1991 0.400
1992 0.380
1993 0.441
1994 0.531
1995 0.503
1996 0.526
1997 0.559
1998 0.664
1999 0.707
Note: See text for explanation of how the index is calculated.
Table 9. Health classification of the Zhi Fanggou catchment ecosystem.
Item
Vici
ous
circ
le
Frai
l
Rela
tivel
y st
able
Good
Wel
l dev
elop
ed
Health index
<0.15 0.15–0.35
0.35–0.55
0.55–0.70
>0.70
***China***.book Page 154 Monday, April 29, 2002 9:06 AM