Rao Balusu - CSIRO Exploration & Mining
36
Longwall Top Coal Caving (LTCC) Face Gas and Dust Flow Patterns ENERGY FLAGSHIP 27-28 October 2014 Rao Balusu 1 , Krishna Tanguturi 1 and Mick Kelly 2 1 CSIRO 2 BMA
-
Upload
informa-australia -
Category
Engineering
-
view
298 -
download
6
description
Lomgwall 2014
Transcript of Rao Balusu - CSIRO Exploration & Mining
Longwall Top Coal Caving (LTCC) Face Gas and Dust Flow Patterns
ENERGY FLAGSHIP
27-28 October 2014
Rao Balusu1, Krishna Tanguturi1 and Mick Kelly2
1 CSIRO 2 BMA
• Introduction
• LTCC method and issues
• Development of CFD models for LTCC face
• Gas flow patterns and control strategies
• LTCC caving dust flow simulations
• Dust and water spray flow patterns and control
• Summary
Presentation Outline
Rao Balusu | Page 2
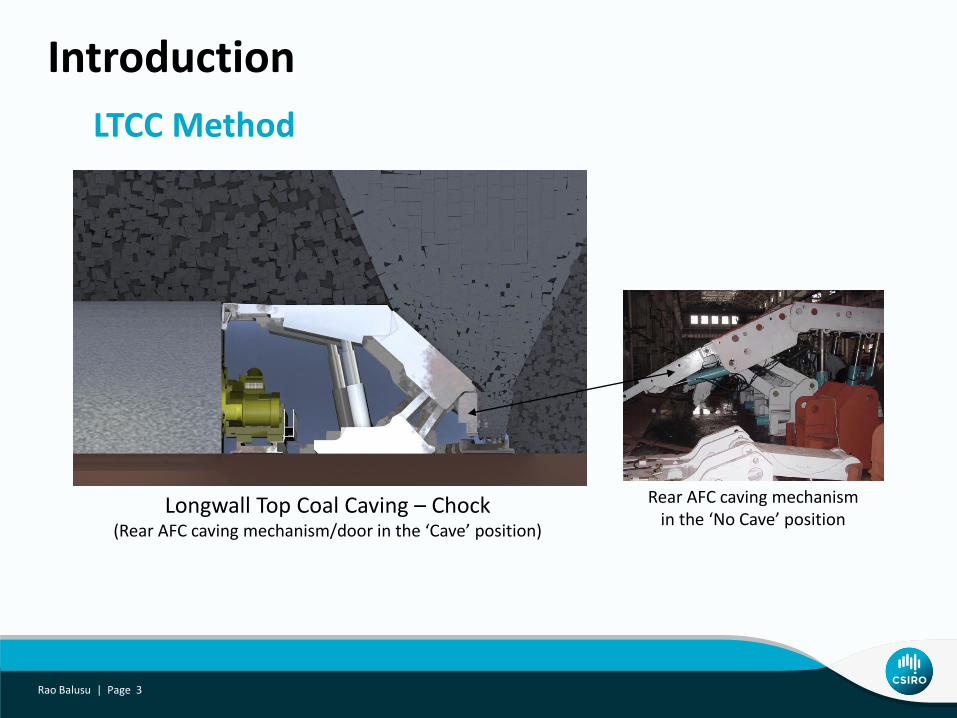
Introduction
LTCC Method
Rao Balusu | Page 3
Longwall Top Coal Caving – Chock(Rear AFC caving mechanism/door in the ‘Cave’ position)
Rear AFC caving mechanismin the ‘No Cave’ position
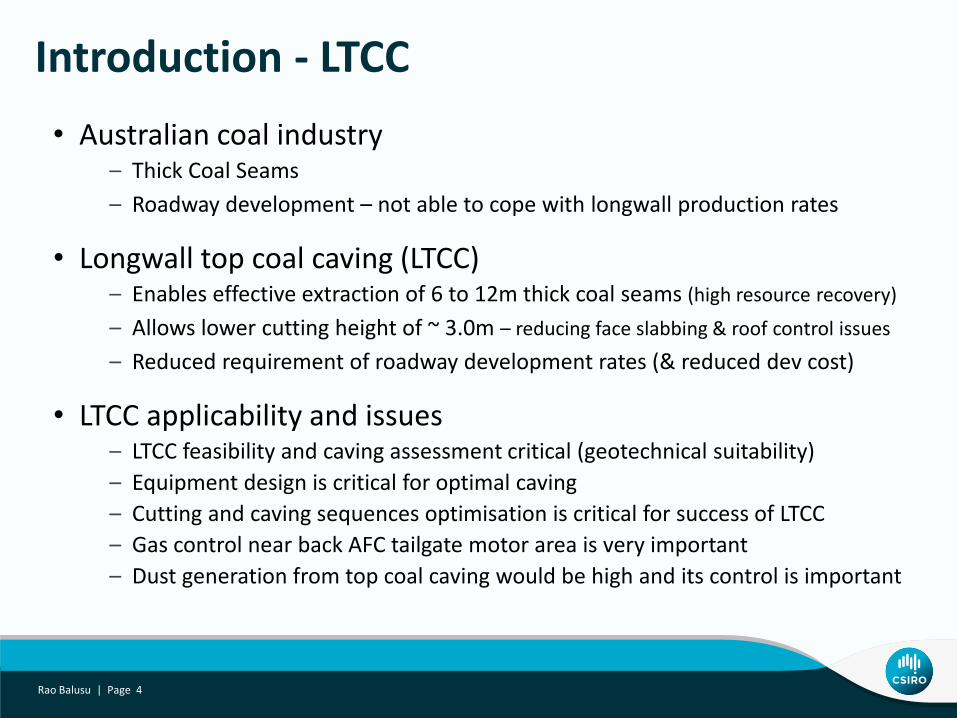
• Australian coal industry – Thick Coal Seams
– Roadway development – not able to cope with longwall production rates
• Longwall top coal caving (LTCC)– Enables effective extraction of 6 to 12m thick coal seams (high resource recovery)
– Allows lower cutting height of ~ 3.0m – reducing face slabbing & roof control issues
– Reduced requirement of roadway development rates (& reduced dev cost)
• LTCC applicability and issues– LTCC feasibility and caving assessment critical (geotechnical suitability)
– Equipment design is critical for optimal caving
– Cutting and caving sequences optimisation is critical for success of LTCC
– Gas control near back AFC tailgate motor area is very important
– Dust generation from top coal caving would be high and its control is important
Introduction - LTCC
Rao Balusu | Page 4

CFD Model Development
Rao Balusu | Page 5
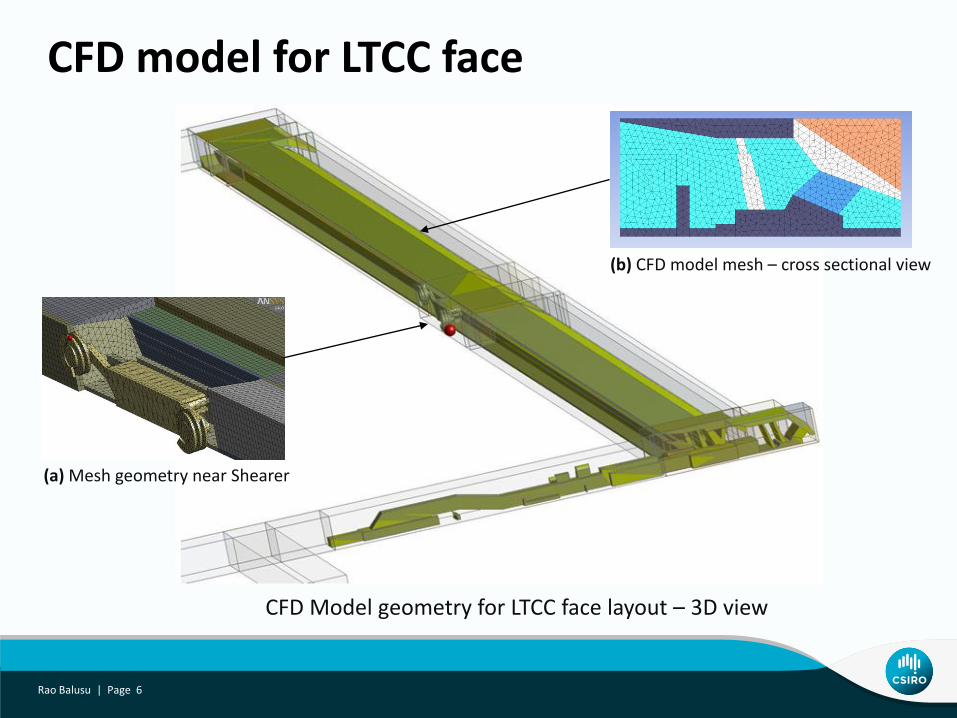
CFD model for LTCC face
Rao Balusu | Page 6
CFD Model geometry for LTCC face layout – 3D view
(b) CFD model mesh – cross sectional view
(a) Mesh geometry near Shearer
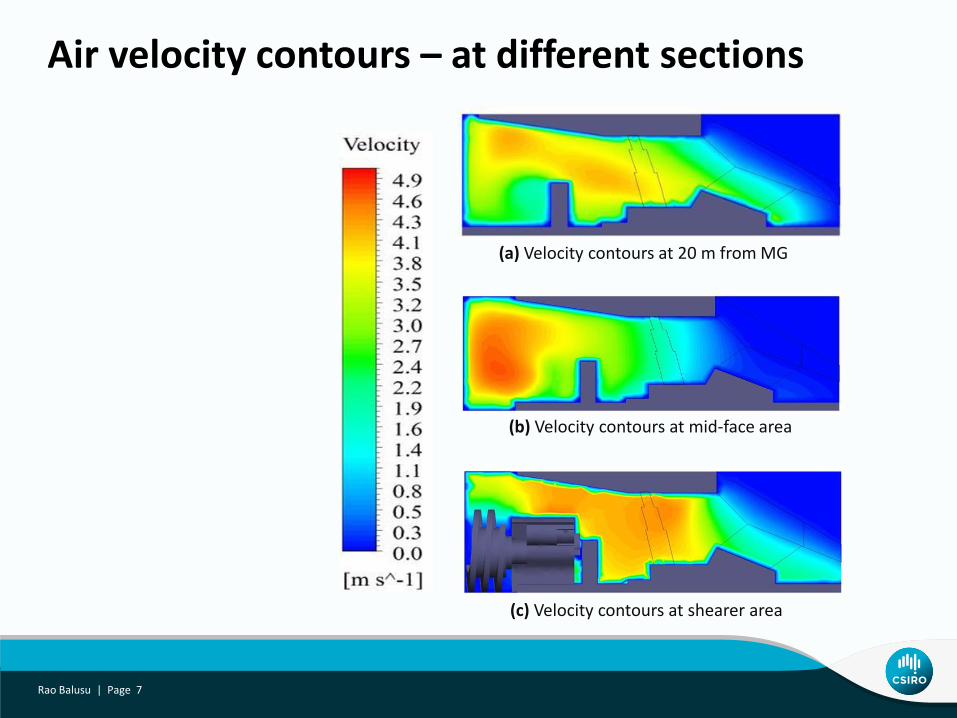
Air velocity contours – at different sections
Rao Balusu | Page 7
(a) Velocity contours at 20 m from MG
(b) Velocity contours at mid-face area
(c) Velocity contours at shearer area
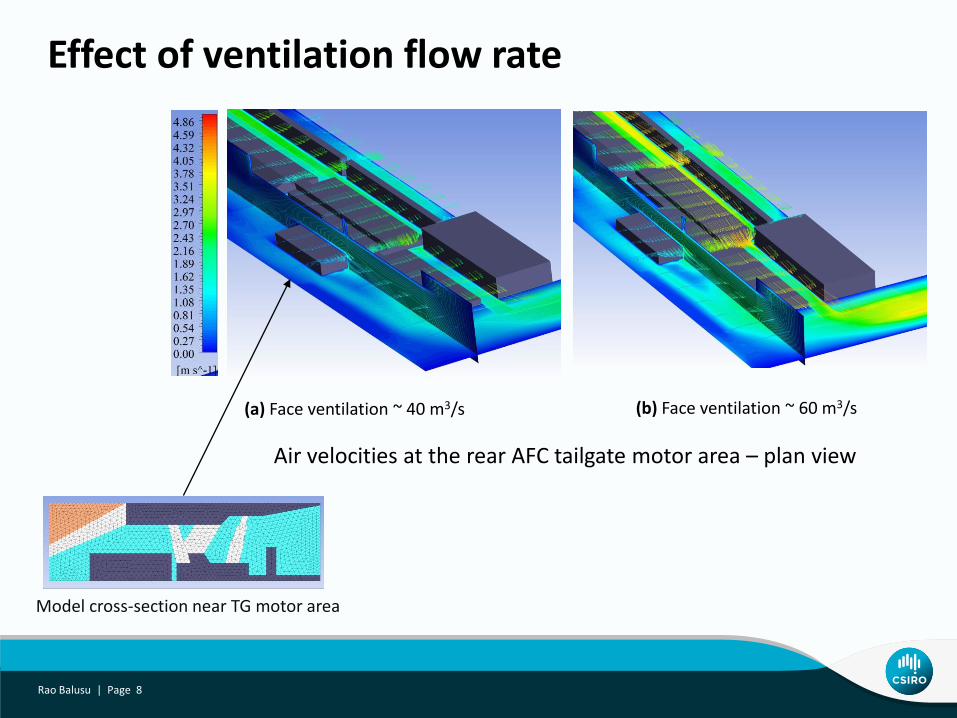
Effect of ventilation flow rate
Rao Balusu | Page 8
(a) Face ventilation ~ 40 m3/s
Air velocities at the rear AFC tailgate motor area – plan view
(b) Face ventilation ~ 60 m3/s
Model cross-section near TG motor area
Gas Simulations and Control Strategies
Rao Balusu | Page 9
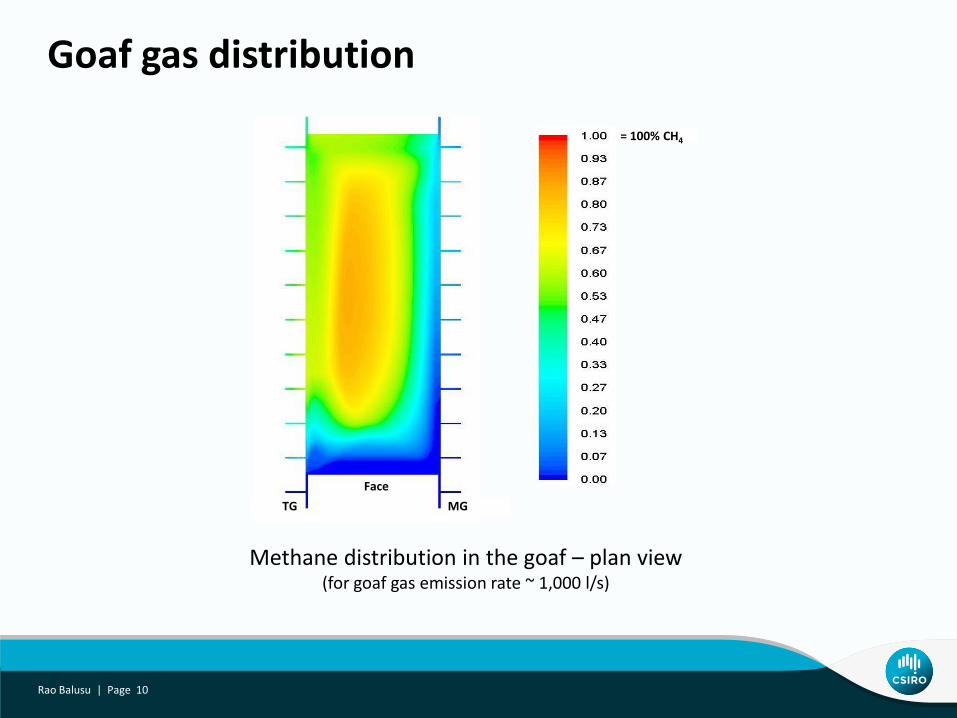
Goaf gas distribution
Methane distribution in the goaf – plan view(for goaf gas emission rate ~ 1,000 l/s)
= 100% CH4
MGTG
Face
Rao Balusu | Page 10
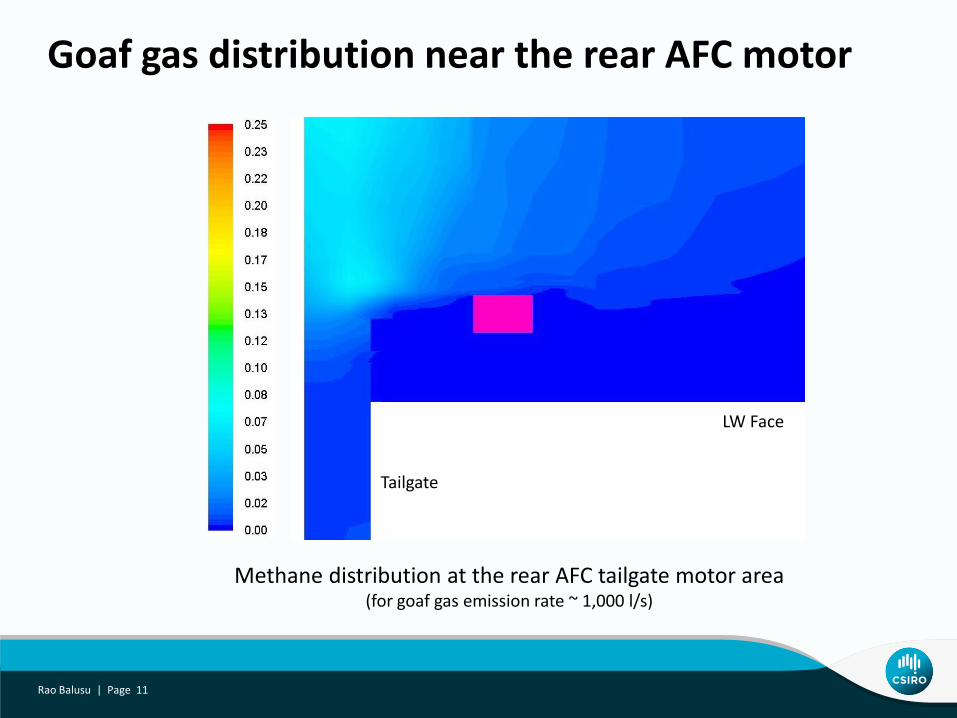
Goaf gas distribution near the rear AFC motor
Rao Balusu | Page 11
Methane distribution at the rear AFC tailgate motor area(for goaf gas emission rate ~ 1,000 l/s)
LW Face
Tailgate
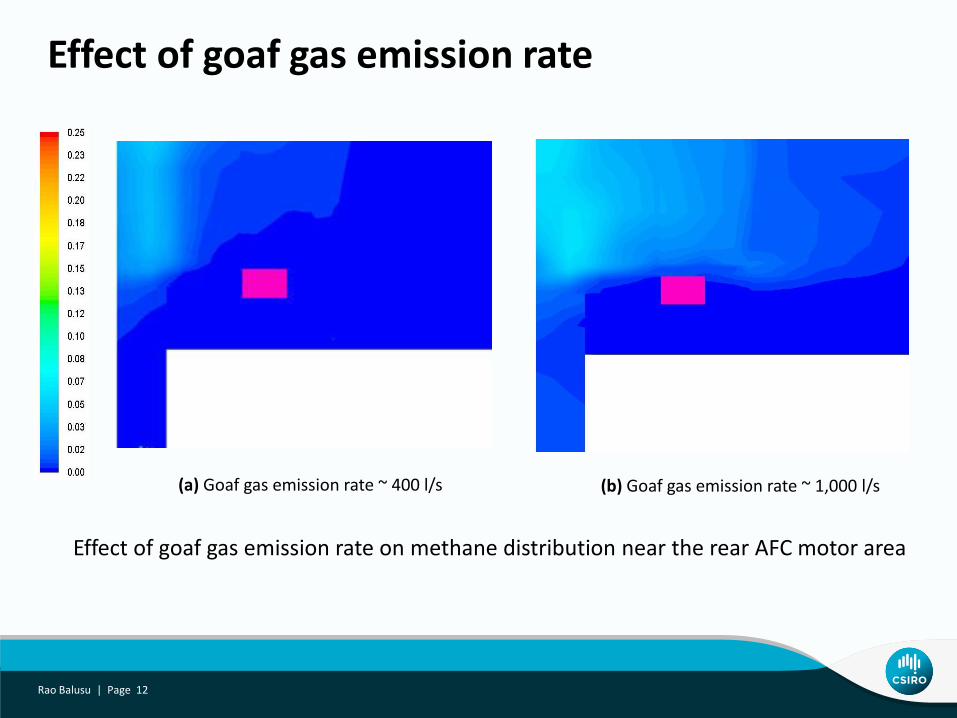
Effect of goaf gas emission rate
Rao Balusu | Page 12
Effect of goaf gas emission rate on methane distribution near the rear AFC motor area
(a) Goaf gas emission rate ~ 400 l/s (b) Goaf gas emission rate ~ 1,000 l/s
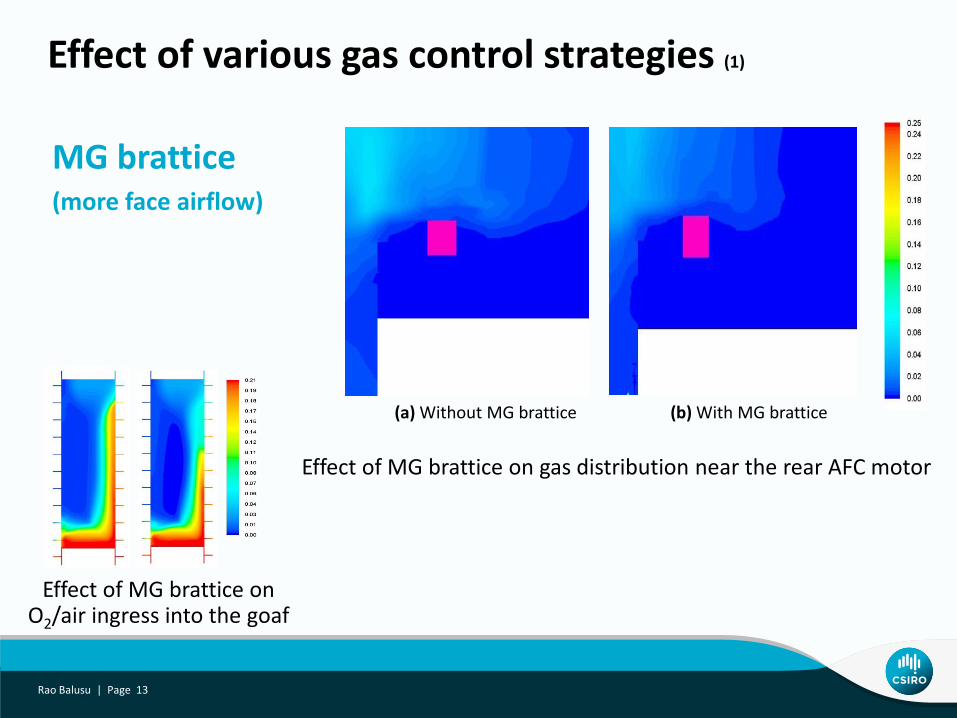
Effect of various gas control strategies (1)
(a) Without MG brattice (b) With MG brattice
Effect of MG brattice on gas distribution near the rear AFC motor
MG brattice(more face airflow)
Effect of MG brattice on O2/air ingress into the goaf
Rao Balusu | Page 13
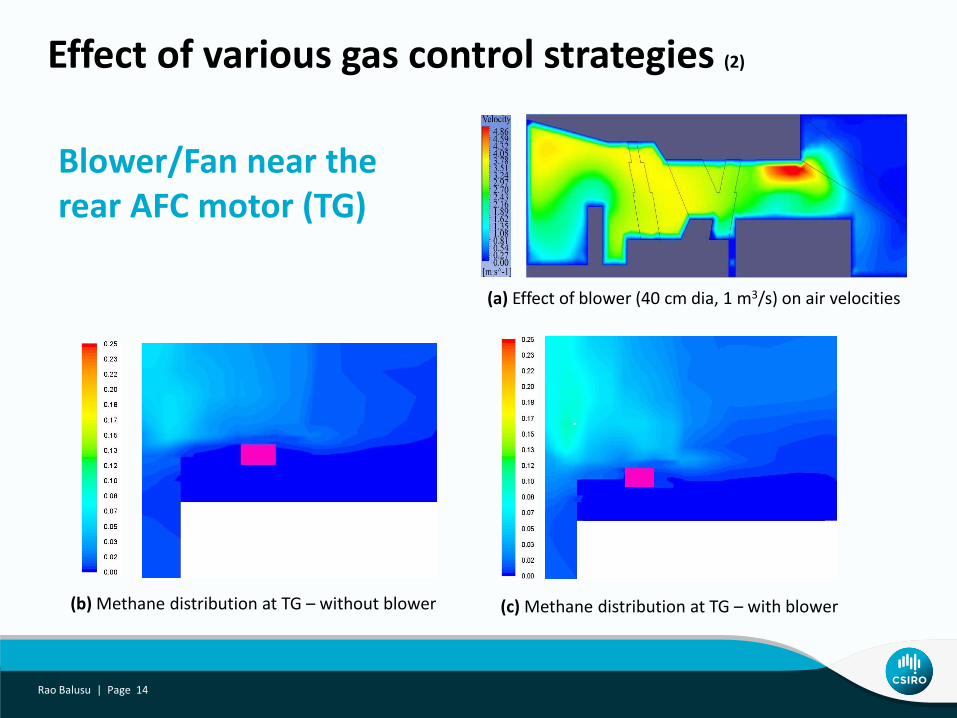
Effect of various gas control strategies (2)
(a) Effect of blower (40 cm dia, 1 m3/s) on air velocities
(c) Methane distribution at TG – with blower (b) Methane distribution at TG – without blower
Blower/Fan near the rear AFC motor (TG)
Rao Balusu | Page 14
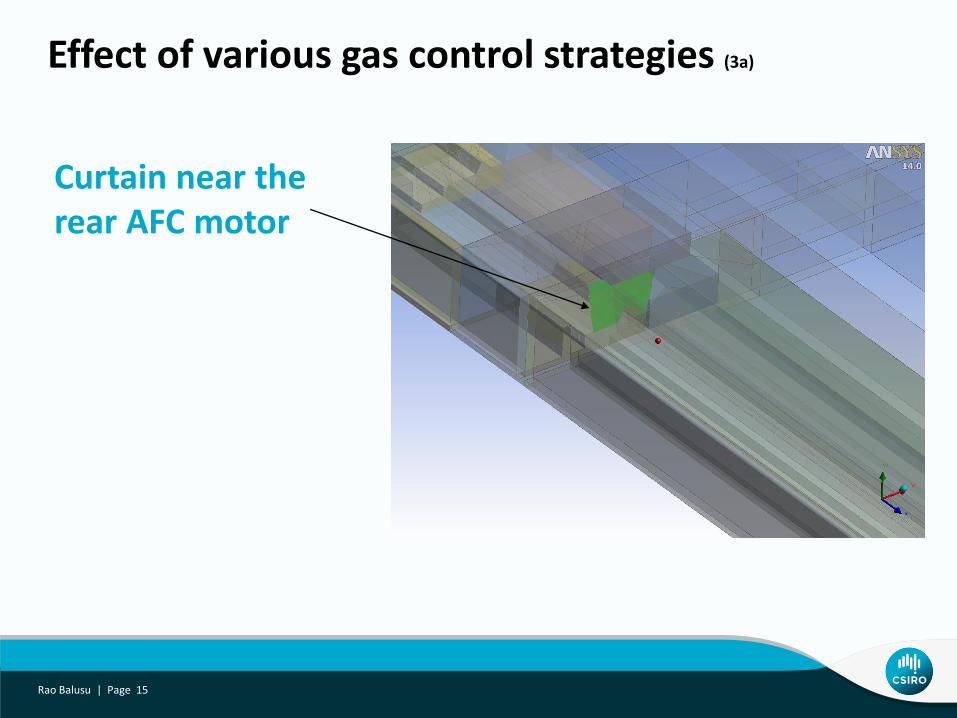
Effect of various gas control strategies (3a)
Rao Balusu | Page 15
Curtain near the rear AFC motor
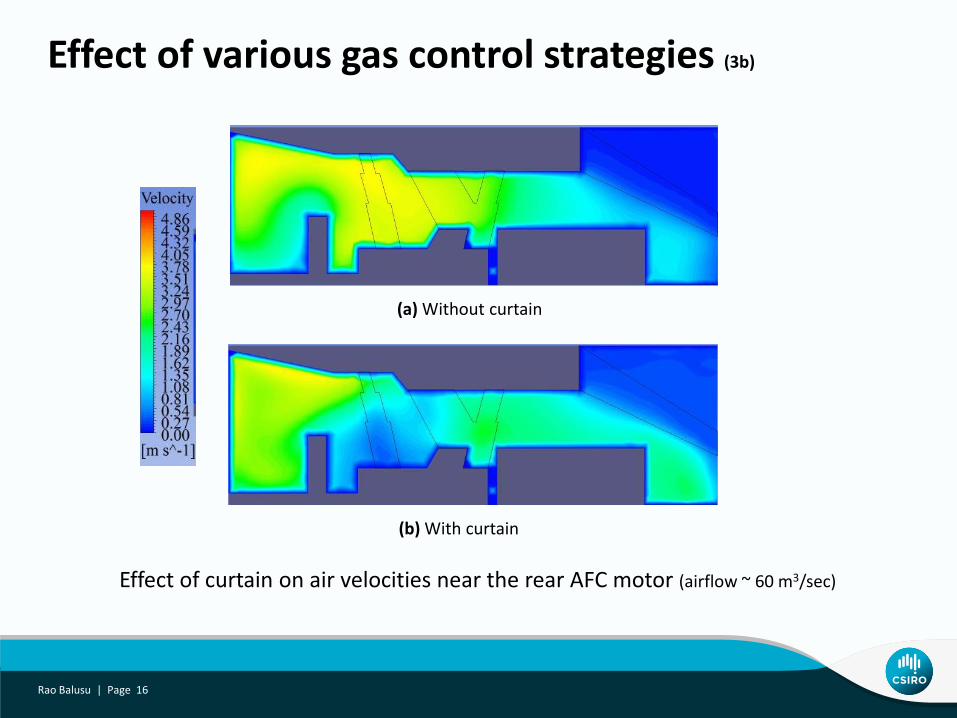
Effect of various gas control strategies (3b)
Rao Balusu | Page 16
Effect of curtain on air velocities near the rear AFC motor (airflow ~ 60 m3/sec)
(a) Without curtain
(b) With curtain
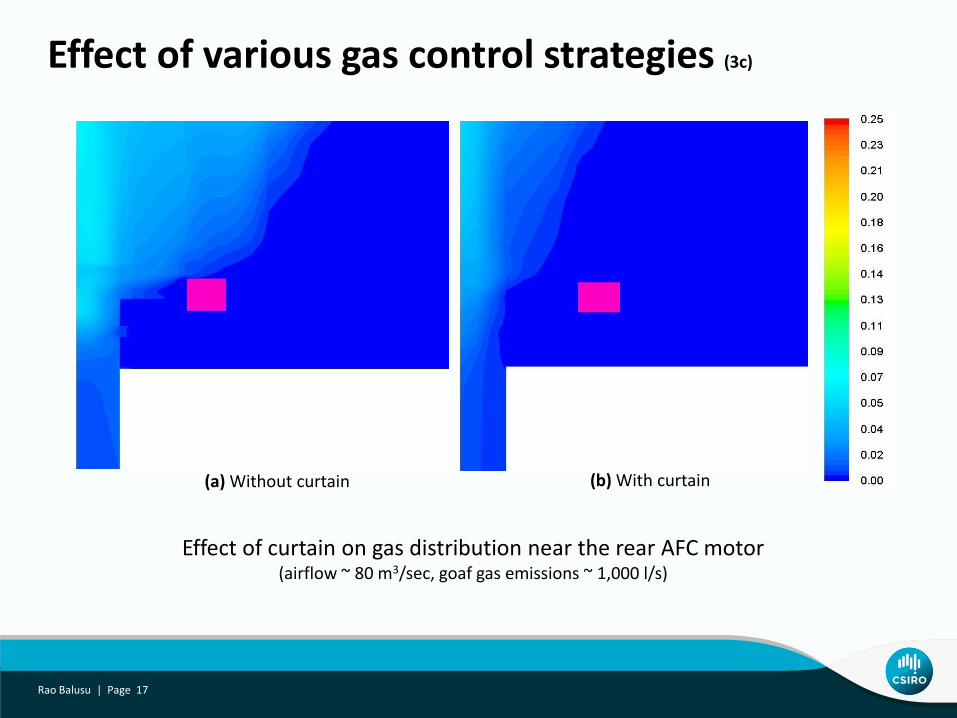
Effect of curtain on gas distribution near the rear AFC motor (airflow ~ 80 m3/sec, goaf gas emissions ~ 1,000 l/s)
(a) Without curtain (b) With curtain
Effect of various gas control strategies (3c)
Rao Balusu | Page 17
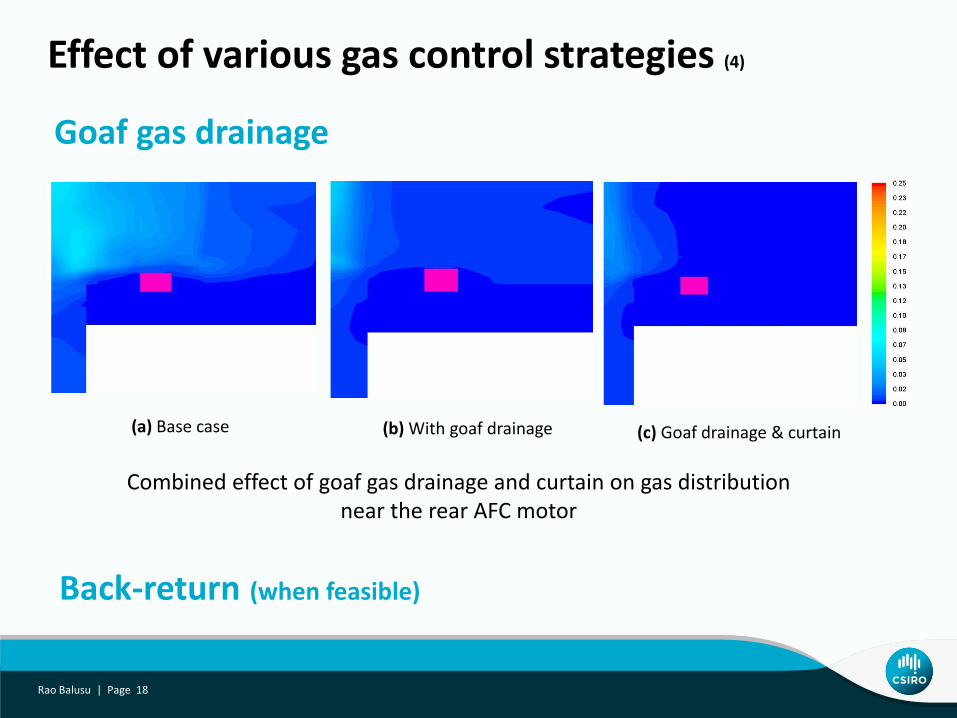
Effect of various gas control strategies (4)
Combined effect of goaf gas drainage and curtain on gas distribution near the rear AFC motor
(a) Base case (b) With goaf drainage (c) Goaf drainage & curtain
Goaf gas drainage
Back-return (when feasible)
Rao Balusu | Page 18
Dust and water spray simulations
and control strategies
Rao Balusu | Page 19
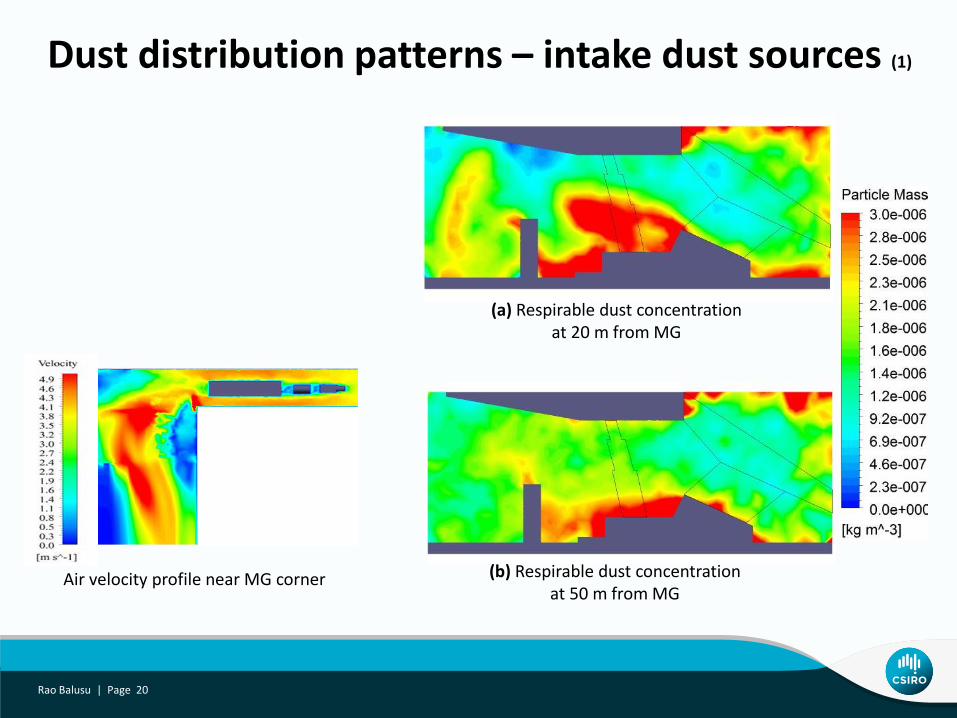
Dust distribution patterns – intake dust sources (1)
Air velocity profile near MG corner
(a) Respirable dust concentration at 20 m from MG
(b) Respirable dust concentration at 50 m from MG
Rao Balusu | Page 20
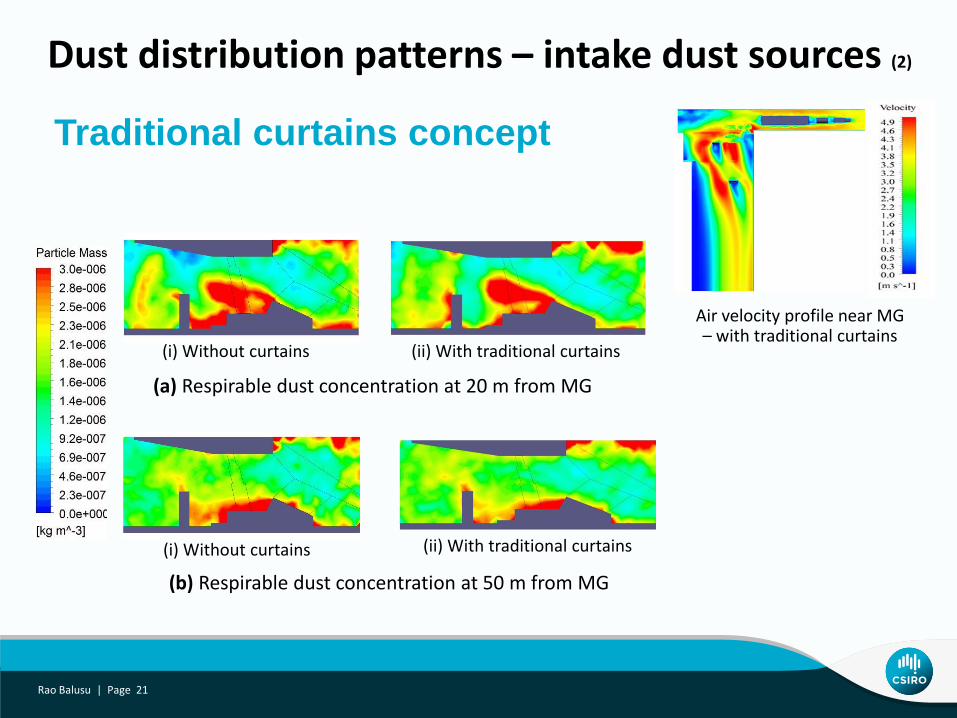
Dust distribution patterns – intake dust sources (2)
Traditional curtains concept
Air velocity profile near MG – with traditional curtains
(a) Respirable dust concentration at 20 m from MG
(i) Without curtains (ii) With traditional curtains
(b) Respirable dust concentration at 50 m from MG
(ii) With traditional curtains(i) Without curtains
Rao Balusu | Page 21
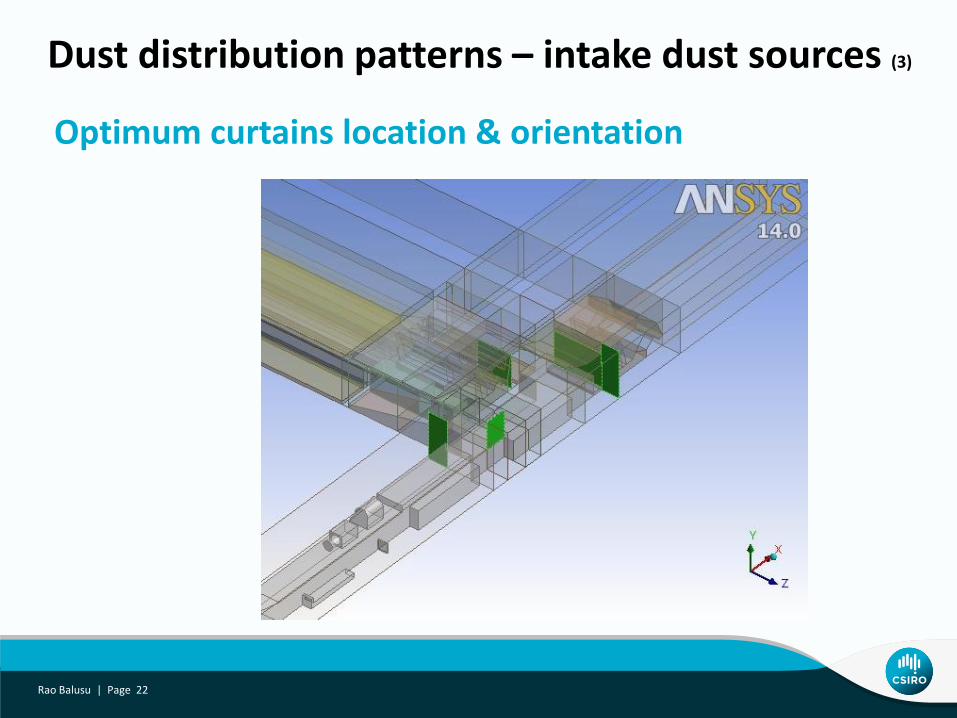
Dust distribution patterns – intake dust sources (3)
Optimum curtains location & orientation
Rao Balusu | Page 22
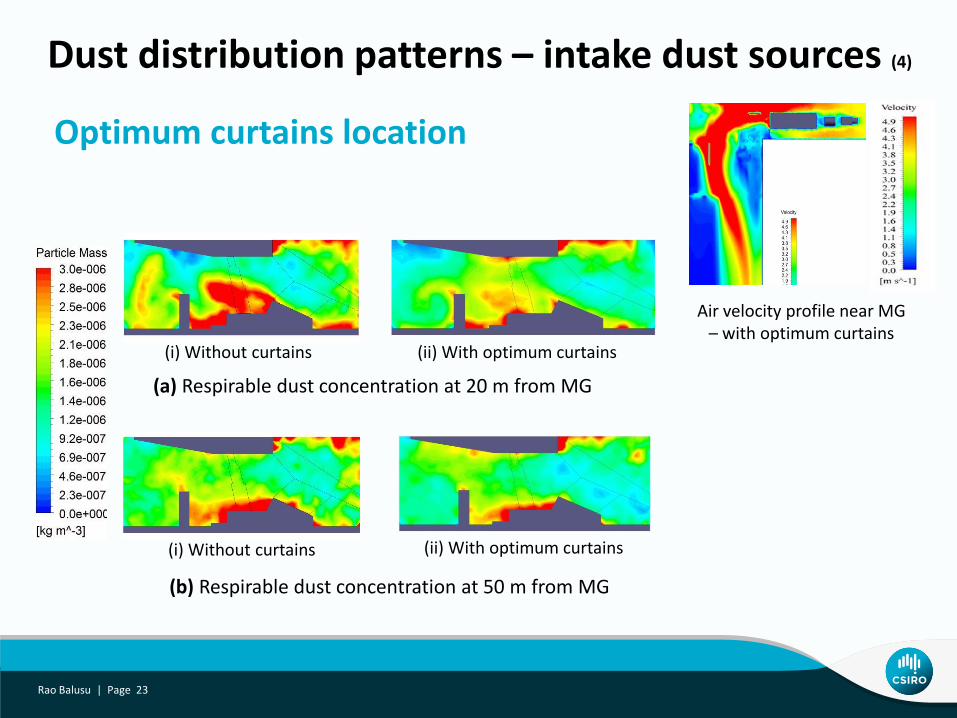
Dust distribution patterns – intake dust sources (4)
Optimum curtains location
Air velocity profile near MG – with optimum curtains
(a) Respirable dust concentration at 20 m from MG
(i) Without curtains (ii) With optimum curtains
(b) Respirable dust concentration at 50 m from MG
(i) Without curtains (ii) With optimum curtains
Rao Balusu | Page 23
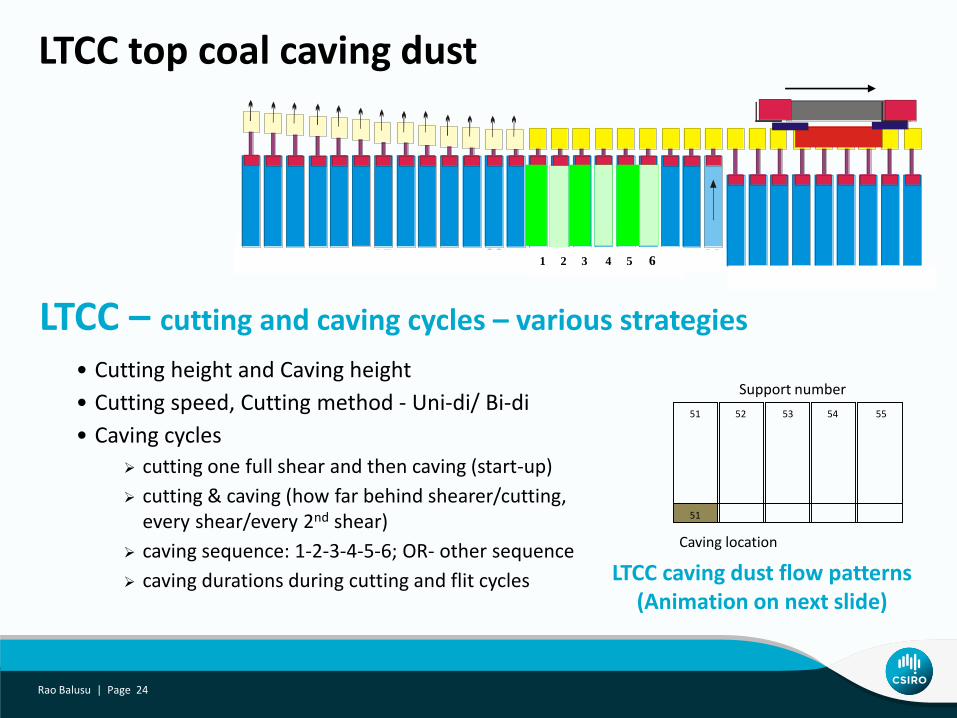
LTCC top coal caving dust
51 52 53 54 55
51
Support number
Caving location
LTCC caving dust flow patterns (Animation on next slide)
• Cutting height and Caving height
• Cutting speed, Cutting method - Uni-di/ Bi-di
• Caving cycles
cutting one full shear and then caving (start-up)
cutting & caving (how far behind shearer/cutting, every shear/every 2nd shear)
caving sequence: 1-2-3-4-5-6; OR- other sequence
caving durations during cutting and flit cycles
LTCC – cutting and caving cycles – various strategies
10 15 20 25 304035
1 2 3 4 5 6
Rao Balusu | Page 24
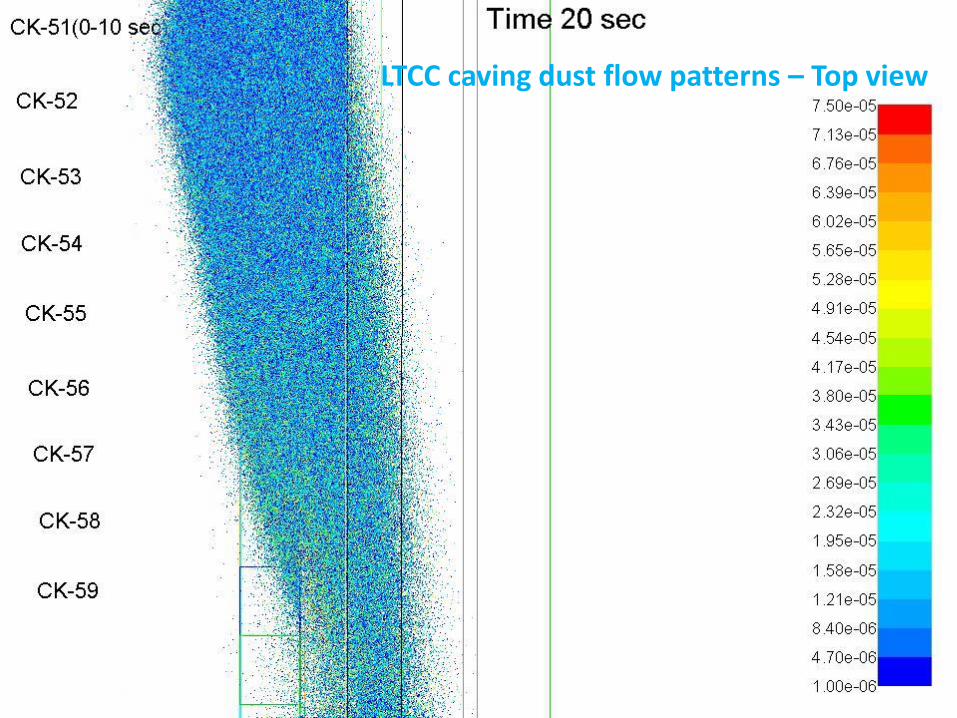
LTCC caving dust flow patterns – Top view
Rao Balusu | Page 25
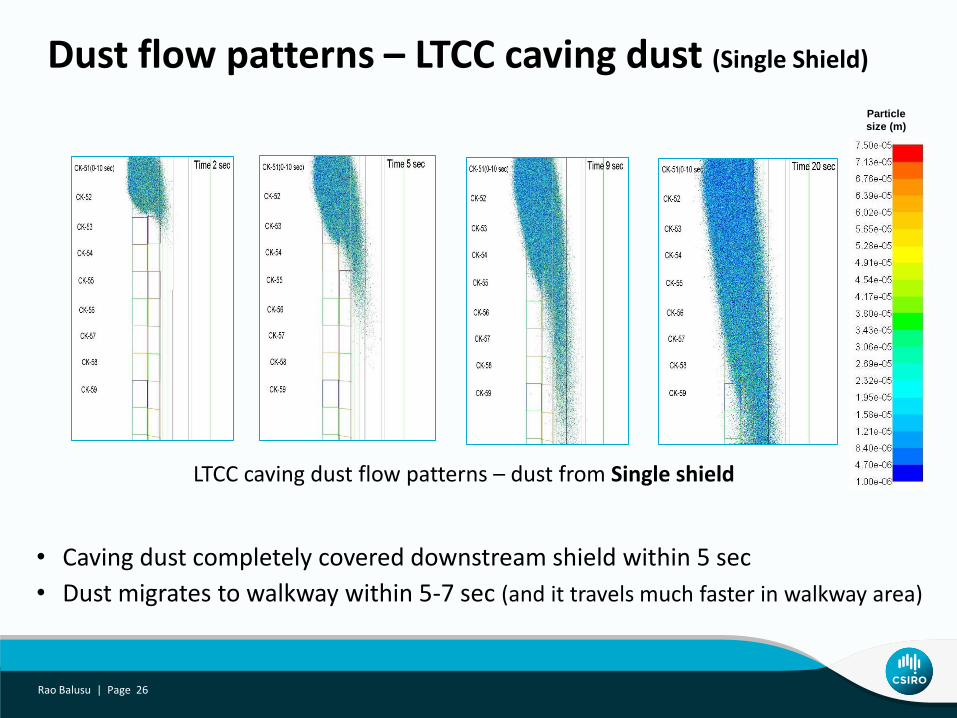
Dust flow patterns – LTCC caving dust (Single Shield)
• Caving dust completely covered downstream shield within 5 sec
• Dust migrates to walkway within 5-7 sec (and it travels much faster in walkway area)
LTCC caving dust flow patterns – dust from Single shield
Particle
size (m)
Rao Balusu | Page 26
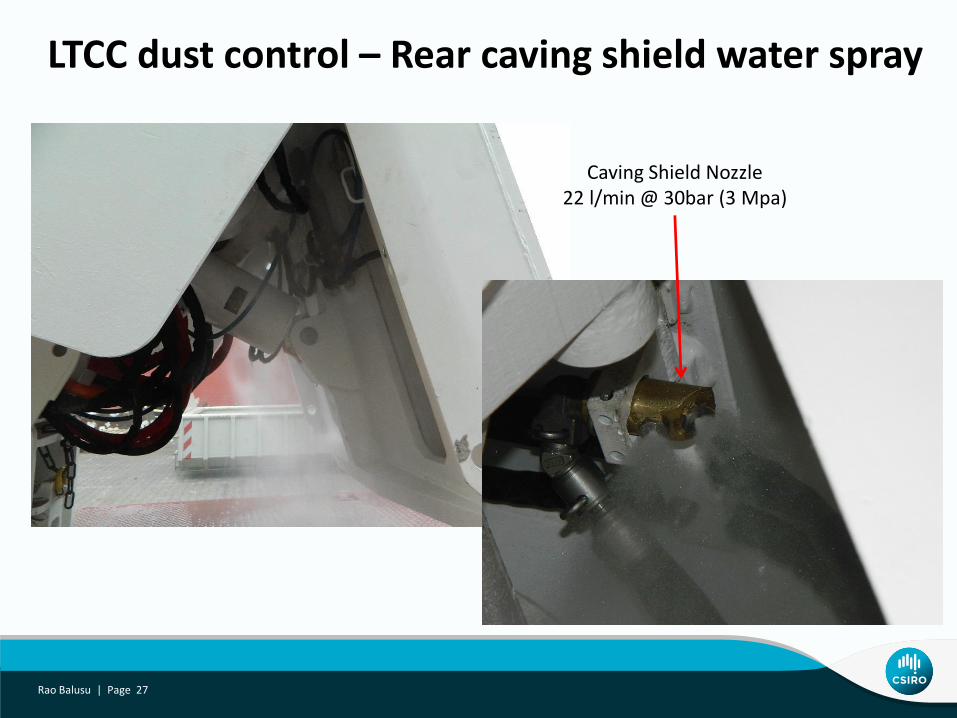
Caving Shield Nozzle22 l/min @ 30bar (3 Mpa)
LTCC dust control – Rear caving shield water spray
Rao Balusu | Page 27
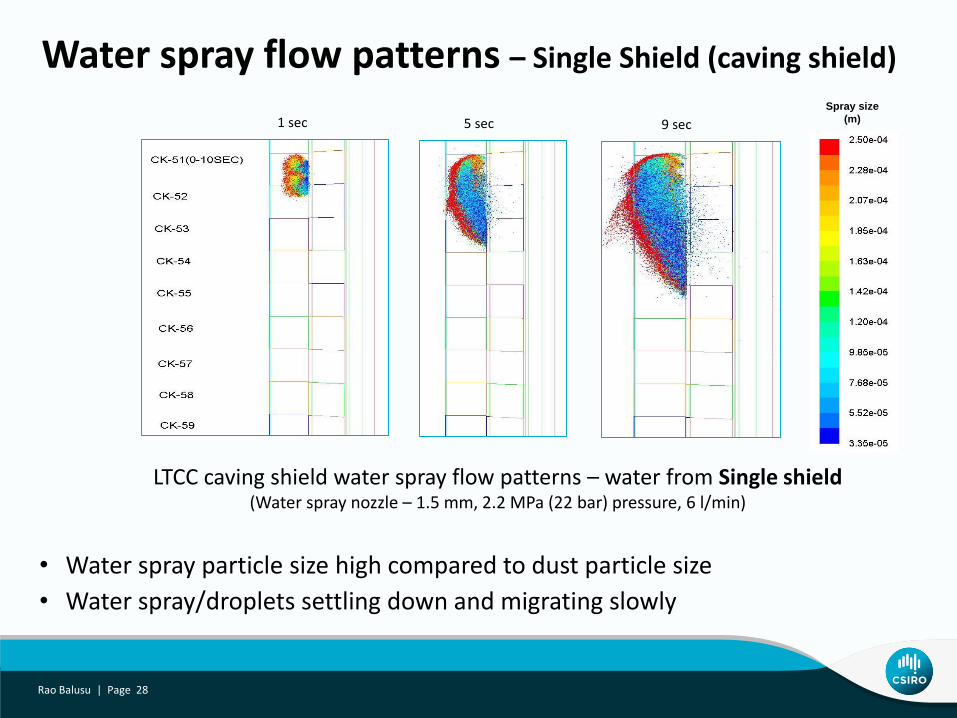
Water spray flow patterns – Single Shield (caving shield)
• Water spray particle size high compared to dust particle size
• Water spray/droplets settling down and migrating slowly
LTCC caving shield water spray flow patterns – water from Single shield(Water spray nozzle – 1.5 mm, 2.2 MPa (22 bar) pressure, 6 l/min)
Spray size
(m)1 sec 5 sec 9 sec
Rao Balusu | Page 28
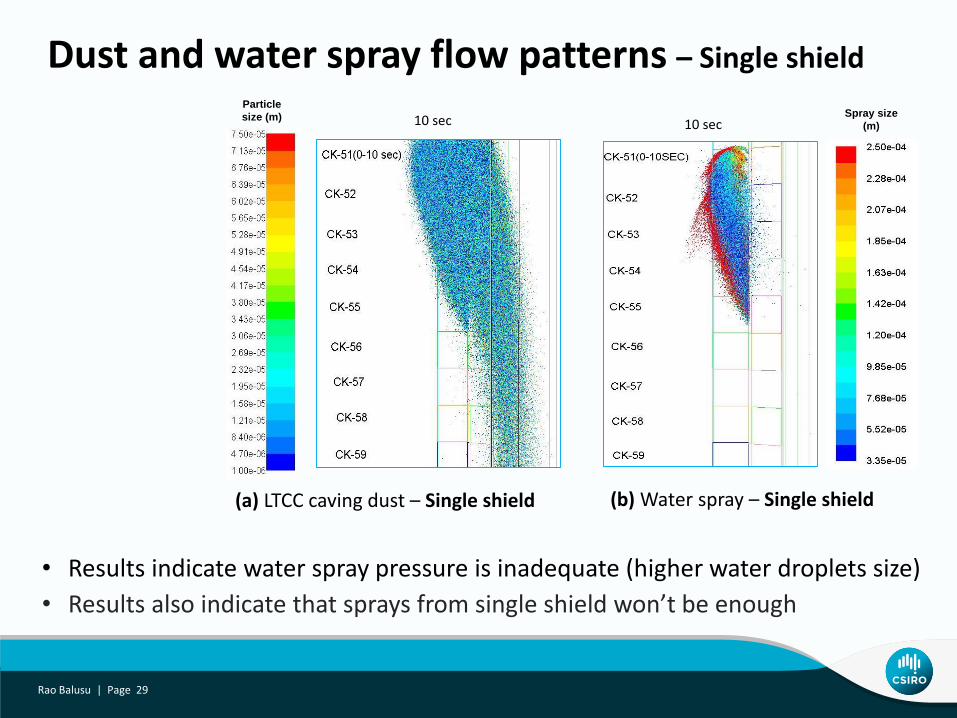
Dust and water spray flow patterns – Single shield
• Results indicate water spray pressure is inadequate (higher water droplets size)
• Results also indicate that sprays from single shield won’t be enough
(a) LTCC caving dust – Single shield (b) Water spray – Single shield
Particle
size (m) 10 secSpray size
(m)10 sec
Rao Balusu | Page 29
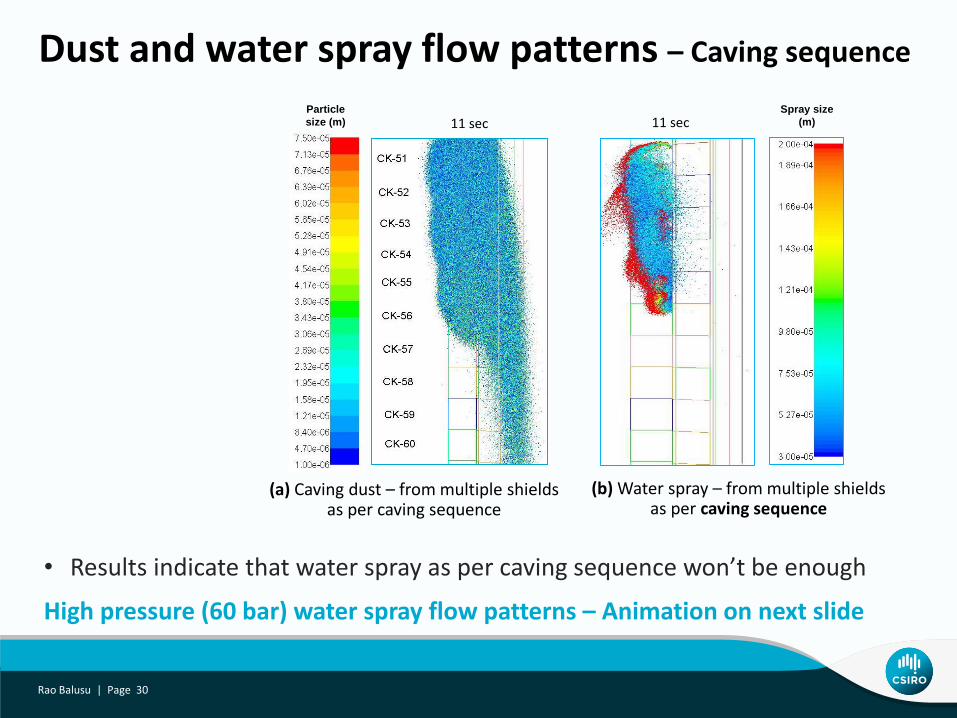
Dust and water spray flow patterns – Caving sequence
• Results indicate that water spray as per caving sequence won’t be enough
High pressure (60 bar) water spray flow patterns – Animation on next slide
Rao Balusu | Page 30
(a) Caving dust – from multiple shields as per caving sequence
(b) Water spray – from multiple shields as per caving sequence
Particle
size (m) 11 secSpray size
(m)11 sec
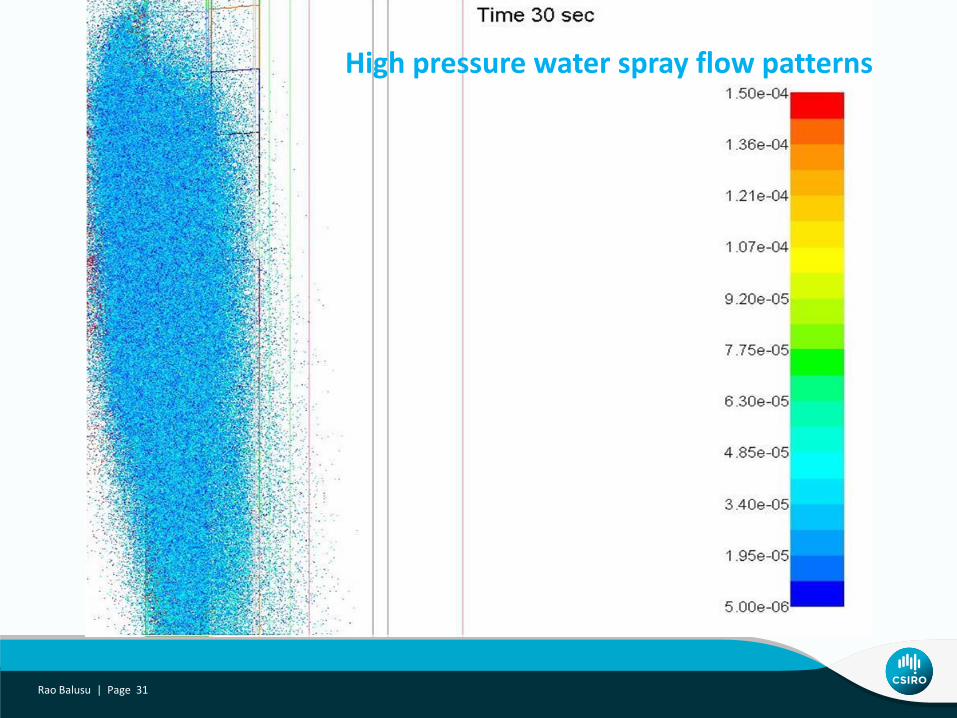
High pressure water spray flow patterns
Rao Balusu | Page 31
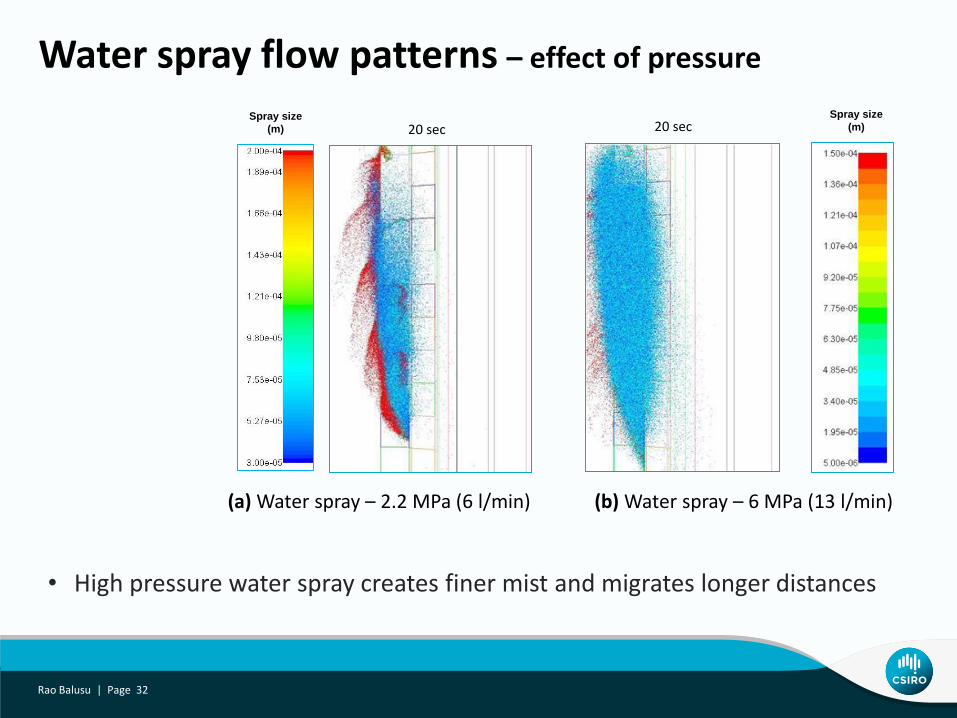
Water spray flow patterns – effect of pressure
• High pressure water spray creates finer mist and migrates longer distances
(a) Water spray – 2.2 MPa (6 l/min) (b) Water spray – 6 MPa (13 l/min)
Spray size
(m)20 secSpray size
(m) 20 sec
Rao Balusu | Page 32
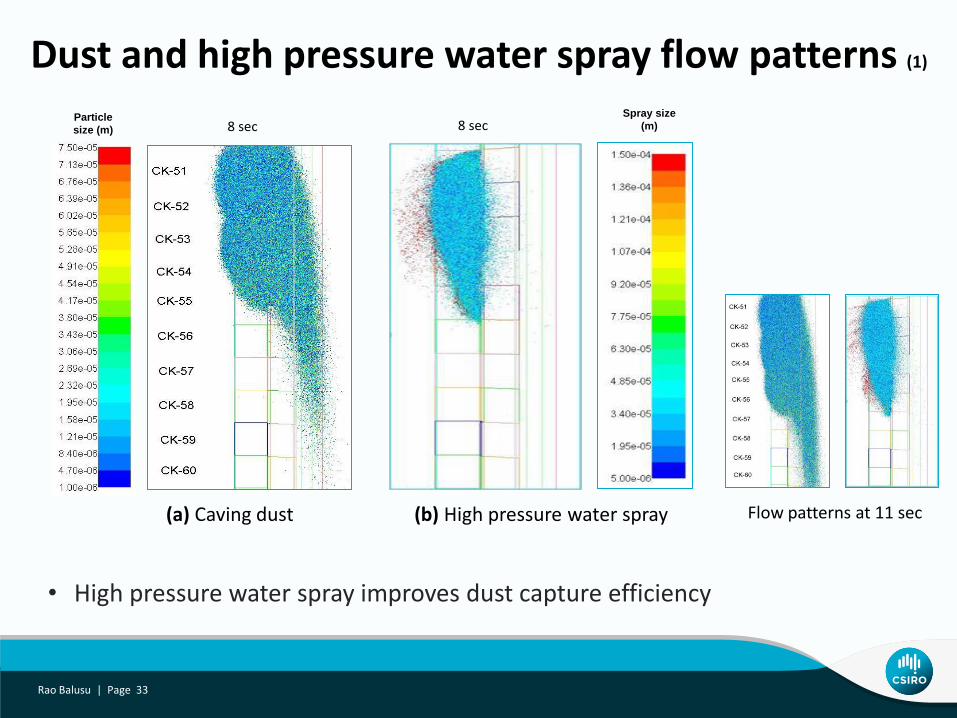
Dust and high pressure water spray flow patterns (1)
• High pressure water spray improves dust capture efficiency
Rao Balusu | Page 33
(a) Caving dust (b) High pressure water spray
Spray size
(m)8 secParticle
size (m) 8 sec
Flow patterns at 11 sec
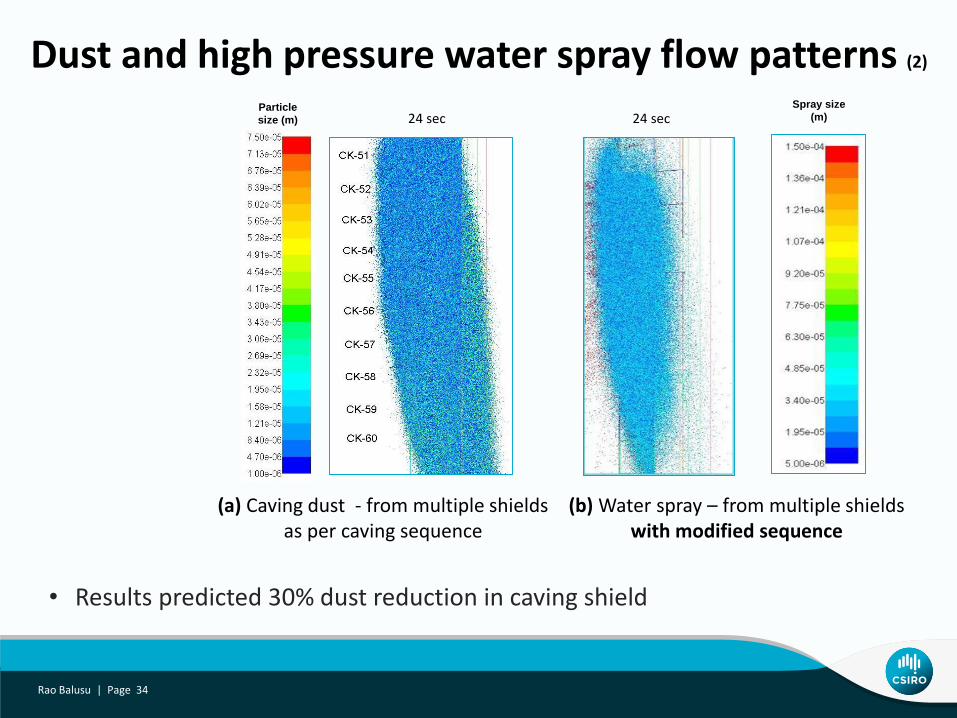
Dust and high pressure water spray flow patterns (2)
• Results predicted 30% dust reduction in caving shield
(a) Caving dust - from multiple shields as per caving sequence
(b) Water spray – from multiple shields with modified sequence
Particle
size (m) 24 secSpray size
(m)24 sec
Rao Balusu | Page 34
Summary
• LTCC offers unique advantages in thick seam environment
• Gas control at rear AFC tailgate motor area is critical In medium to highly gassy mines, gas concentration would be > 1%
Blowers create turbulence and not appropriate
Modification of face airflow patterns with appropriate curtains
Goaf gas drainage and back-return systems are also advantageous
• Dust control – a major issue on LTCC faces Intake and MG corner dust control is also critical
Dust generated during top coal caving migrates into walkway area
Requires water spray at high pressure in the caving shields
Water spray only in the caving shields won’t be enough
Water spray sequence and duration needs to be optimised
• Control of dust from other sources is also important
Rao Balusu | Page 35

Thank youDr Rao BalusuSenior Principal Research Engineert +61 7 3327 4614e [email protected] www.csiro.au
ENERGY FLAGSHIP