Download Appendix (PDF)
29
Supplemental Information Appendix: Reappraisal of hydrocarbon biomarkers in Archean rocks Authors: Katherine L. French * , Christian Hallmann, Janet M. Hope, Petra L. Schoon, J. Alex Zumberge, Yosuke Hoshino, Carl A. Peters, Simon C. George, Gordon D. Love, Jochen J. Brocks, Roger Buick, Roger E. Summons *Correspondence to K.L.F. ([email protected]) 1. Drilling and Sampling At the beginning of the AIDP campaign, all drill rods were cleaned with soap and water, and a new drill bit was used at the beginning of the project. Furthermore, the abrasive action during the drilling of AIDP- 1, which penetrated a greenschist metamorphic grade volcanic sequence that was not expected to contain hydrocarbon biomarkers, was intended to further remove residual organics that may have accumulated on the drill rods during previous drilling projects. The drilling localities and stratigraphy are illustrated in Figures S1 and S2, respectively. AIDP-1 was drilled at 5º with an azimuth of 55º at 50K: 718123 E, 7664005 N using water from a bore in order to recover the Coucal Formation (3.52 Ga) of the Coonterunah Subgroup (1). AIDP-2 was drilled at 77º with an azimuth of 191º at 51K: 275384 E, 7645330 N in the Ripon Hills region of the eastern Pilbara Craton, less than ~1 km from where hole RHDH2A was collared. Water used as a drilling fluid was pumped from a permanent pool in Yilgalong Creek into a large tank, which allowed suspended sediment to settle out. Water was spiked with perdeuterated biphenyl (1 µg/L) and with fluorescein (1 mg/L) as synthetic tracers, which were produced on-site as stock solutions in methanol (MeOH) and added to the tank in regular time intervals to maintain roughly constant concentrations. The rationale was to use easy identifiable hydrophilic and hydrophobic components to assess the core penetration depth of potential contaminants that were brought into contact with the cores during the drilling process. Drilling started in reverse circulation (R/C) mode, during which no cuttings were recovered, which was performed down to a depth of 113.90 m to get below the weathering horizon. The hole was cleaned by flushing with copious amounts of water before diamond drilling started at HQ diameter down to a depth of 298.95 m and NQ diameter until 441.90 m, at which point the hole was terminated. AIDP-3 was drilled at 86º with an azimuth of 35º at 50K: 558753 E, 7591713 N using water from a borehole in order to recover the Marra Mamba Iron Formation and the Jeerinah Formation. The stratigraphic columns in Figure 1 compare the AIDP-2 and RHDH2A stratigraphies, where the RHDH2A stratigraphic column was constructed based on previous descriptions of RHDH2A (2, 3) and previously reported age constraints (1, 4-10). The drillers avoided touching the drill core. Instead, the drilling crew shook the core material from the drilling barrels directly into the aluminum core tray. C.H. and K.L.F. washed their hands with soap prior to collecting each individual sample for organic geochemical analysis. If the sample was too long for collection, the sample was broken into a shorter piece of whole core with a cleaned geological hammer, rinsed with Type-1 ultrapure water and carefully transferred into FEP Teflon bags (Welch Fluorocarbon). The Teflon bags had been previously cleaned by boiling in Aqua Regia (HCl/HNO 3 : 70/30) and repeated rinsing with organic solvents. The bags were tested for hydrocarbons prior to use in the field. All bags contained synthetic spikes d 34 -hexadecane (1 μg/bag) and d 62 -triacontane (500 ng/bag), which were added as aliquots of 1 mL dichloromethane (DCM) that were allowed to distribute evenly at the bottom of the bags before evaporation of the solvent. After the whole core sample was placed in the Teflon bag, a small volume (~10-20 mL) of ultrapure water was added to bags to avoid sample desiccation. Samples were purged with argon before being sealed and immediately frozen in the dark at –20ºC. This sampling procedure ensured that the samples were collected and frozen within 10–20 minutes after the drill core material was recovered from depth. Core samples remained at this temperature throughout the entire drilling campaign and during transport to Canberra, where they were stored frozen at –20ºC. Ultra-clean biomarker samples were selected for sampling with the goal of achieving stratigraphic coverage, a
Transcript of Download Appendix (PDF)
Supplemental Information Appendix: Reappraisal of hydrocarbon biomarkers in Archean rocks Authors: Katherine L. French*, Christian Hallmann, Janet M. Hope, Petra L. Schoon, J. Alex Zumberge, Yosuke Hoshino, Carl A. Peters, Simon C. George, Gordon D. Love, Jochen J. Brocks, Roger Buick, Roger E. Summons *Correspondence to K.L.F. ([email protected]) 1. Drilling and Sampling At the beginning of the AIDP campaign, all drill rods were cleaned with soap and water, and a new drill bit was used at the beginning of the project. Furthermore, the abrasive action during the drilling of AIDP-1, which penetrated a greenschist metamorphic grade volcanic sequence that was not expected to contain hydrocarbon biomarkers, was intended to further remove residual organics that may have accumulated on the drill rods during previous drilling projects. The drilling localities and stratigraphy are illustrated in Figures S1 and S2, respectively. AIDP-1 was drilled at 5º with an azimuth of 55º at 50K: 718123 E, 7664005 N using water from a bore in order to recover the Coucal Formation (3.52 Ga) of the Coonterunah Subgroup (1). AIDP-2 was drilled at 77º with an azimuth of 191º at 51K: 275384 E, 7645330 N in the Ripon Hills region of the eastern Pilbara Craton, less than ~1 km from where hole RHDH2A was collared. Water used as a drilling fluid was pumped from a permanent pool in Yilgalong Creek into a large tank, which allowed suspended sediment to settle out. Water was spiked with perdeuterated biphenyl (1 µg/L) and with fluorescein (1 mg/L) as synthetic tracers, which were produced on-site as stock solutions in methanol (MeOH) and added to the tank in regular time intervals to maintain roughly constant concentrations. The rationale was to use easy identifiable hydrophilic and hydrophobic components to assess the core penetration depth of potential contaminants that were brought into contact with the cores during the drilling process. Drilling started in reverse circulation (R/C) mode, during which no cuttings were recovered, which was performed down to a depth of 113.90 m to get below the weathering horizon. The hole was cleaned by flushing with copious amounts of water before diamond drilling started at HQ diameter down to a depth of 298.95 m and NQ diameter until 441.90 m, at which point the hole was terminated. AIDP-3 was drilled at 86º with an azimuth of 35º at 50K: 558753 E, 7591713 N using water from a borehole in order to recover the Marra Mamba Iron Formation and the Jeerinah Formation. The stratigraphic columns in Figure 1 compare the AIDP-2 and RHDH2A stratigraphies, where the RHDH2A stratigraphic column was constructed based on previous descriptions of RHDH2A (2, 3) and previously reported age constraints (1, 4-10). The drillers avoided touching the drill core. Instead, the drilling crew shook the core material from the drilling barrels directly into the aluminum core tray. C.H. and K.L.F. washed their hands with soap prior to collecting each individual sample for organic geochemical analysis. If the sample was too long for collection, the sample was broken into a shorter piece of whole core with a cleaned geological hammer, rinsed with Type-1 ultrapure water and carefully transferred into FEP Teflon bags (Welch Fluorocarbon). The Teflon bags had been previously cleaned by boiling in Aqua Regia (HCl/HNO3 : 70/30) and repeated rinsing with organic solvents. The bags were tested for hydrocarbons prior to use in the field. All bags contained synthetic spikes d34-hexadecane (1 µg/bag) and d62-triacontane (500 ng/bag), which were added as aliquots of 1 mL dichloromethane (DCM) that were allowed to distribute evenly at the bottom of the bags before evaporation of the solvent. After the whole core sample was placed in the Teflon bag, a small volume (~10-20 mL) of ultrapure water was added to bags to avoid sample desiccation. Samples were purged with argon before being sealed and immediately frozen in the dark at –20ºC. This sampling procedure ensured that the samples were collected and frozen within 10–20 minutes after the drill core material was recovered from depth. Core samples remained at this temperature throughout the entire drilling campaign and during transport to Canberra, where they were stored frozen at –20ºC. Ultra-clean biomarker samples were selected for sampling with the goal of achieving stratigraphic coverage, a
2
diversity of lithologies, and a range of organic carbon content. Samples were labeled according to the following scheme: AIDP hole number/1/order of sample collected–sample depth (m), where the ‘1’ indicates an ultra-clean biomarker sample (Tier-1), so the first sample taken at AIDP-2, for example, was labeled 2/1/1-116.09 m. 2. Stratigraphy and Sedimentology descriptions The biomarker target samples analyzed in this study came from two formations: the Carawine Dolomite and the Jeerinah Formation. In AIDP-2, the Carawine Dolomite conformably overlies the Jeerinah Formation, whereas in AIDP-3, the Marra Mamba Iron Formation, which is absent from the stratigraphic succession at AIDP-2, conformably overlies the Jeerinah Formation. As the Carawine Dolomite is an onshore carbonate platform succession but the Marra Mamba is an offshore banded iron formation, this suggests that AIDP-3 intersects a deeper water region of the Hamersley basin than AIDP-2. However, the stratigraphy is not quite so simple because the occurrence of a diagnostic meteorite impact horizon indicates that the Jeerinah Formation is diachronous across the basin. It occurs as a <1 cm thick impact spherule layer in the upper Jeerinah in AIDP-3 but as a ~20 m thick impact breccia with interstitial glass spherules in the lower Carawine in AIDP-2. Clearly, the lower Carawine in AIDP-2 and the upper Jeerinah in AIDP-3 are contemporaneous. The Carawine Dolomite is dominated by coarse to fine dolarenites and dolosiltites commonly with wavy to wrinkly lamination in coarser facies. In surface exposures, such rocks are stromatolitic with broad domical structures. Finer facies are usually planar laminated and darker colored, containing disseminated kerogen and pyrite. All facies have abundant stylolites, mostly sub-parallel to bedding and undulose but in places more irregular (saw-toothed) and anastomosing forming stylobreccia. The stylolites are generally defined by 1 mm seams of insoluble organic matter that has a shiny submetallic luster and a blocky fracture pattern resembling pyrobitumen. Where such stylolites anastomose, this organic matter can form ellipsoidal to subspheroidal blebs and vughs up to 5 mm across. The Carawine samples at 116.09 m and 170.40 m have both disseminated kerogen in the grey dolosiltite matrix and pyrobitumen in stylolites within them, but the sample at 133.50 m is anomalous in that it consists of a 9 cm thick seam of organic matter and resembles shungite, having a shiny metallic luster on fractured surfaces and a vague lenticular microstructure but lacking obvious dolarenite inclusions (Fig. S3). This unit is bounded above and below by subplanar stylolites. It is underlain by stylobrecciated coarse dolarenite containing angular 1-3 cm fragments bounded by 5 mm thick seams (possibly stylocumulate) of dark grey fine dolarenite and with abundant irregular stylolites, some containing 1 mm pyrobitumen partings, and irregular veins with 1 mm sparry dolomite fill. It is overlain by massive to mottled coarse dolarenite, possibly also a stylobreccia, with abundant irregular sparry dolomite veins to 1 mm thick and some planar to irregular pyrobitumenous stylolites up to 2 mm thick. It may be a stylocumulate of disseminated kerogen that has been converted to pyrobitumen under pressure-solution, but it is possible that it marks a fracture through which later liquid hydrocarbons have passed. However, the adjacent rocks show no signs of shearing and its organic matter is not markedly different from that occurring in thinner stylolite-related organic seams elsewhere in the formation. The terminology used here is according to Flügel et al. (11). The Jeerinah samples from both drill-holes are all of black, highly kerogenous mudstone and shale. These rocks are massive to finely plane-laminated, containing a few percent very fine disseminated pyrite and sometimes centimeter-sized pyrite nodules, lenses and laminae. In general, the samples from AIDP-2 are more pyritic than those from AIDP-3, ranging up to 5% pyrite compared to <1%. Moreover, AIDP-2 samples have shiny black bedding-parallel fracture surfaces resembling pyrobitumen partings that are lacking in AIDP-3. One sample from AIDP-3 (98.36 m) contains 1-5 cm gray chert interbeds with up to 10% 1 mm calcite rhombs and 3% ≤3 mm pyrite cubes. Other samples show evidence of soft-sediment deformation in the form of slump folding or, more rarely, brecciation. Some samples also contain minor calcisiltite lenses and laminae from 0.5-1 mm thick and occasional medium calcarenite planar laminae. The lenticular form of the coarser sediments suggests that the calcareous components may represent starved ripples deposited in a generally low-energy environment in deep water well below wave base.
3
3. Sawing and Sample Distribution at ANU The ANU/MIT team worked together at ANU in order to ensure that the AIDP samples were sawed into duplicate core halves and distributed to the individual laboratories with minimal addition of hydrocarbon contamination. A new saw (NWC 14 model SS Cut-off machine by Nortel machinery, Buffalo, NY) was purchased for the purpose of sawing the AIDP whole core samples at ANU. This saw was selected because it is constructed entirely of stainless steel and aluminum and does not use a pump to recycle water for cooling and lubrication. Instead, the saw blade was cooled and lubricated by Milli-Q water (Millipore Elix 3UV) that was gravity fed to the saw blade and subsequently drained into an underlying tray for disposal after a single use. Prior to sawing the AIDP samples, each step of the laboratory preparation pathway was checked for contribution of hydrocarbon contamination. At least two blanks were prepared for each laboratory step. Solvent rinses of the saw blade were collected for saw blade blanks. Combusted sand was powdered in a shatterbox (Standard Ring Mill by Rocklabs, New Zealand) using a cleaned stainless steel puck mill for puck mill blanks. Combusted ceramic tiles were loaded into clean extraction cells for Accelerated Solvent Extraction (ASE) system blanks using a Dionex ASE 200. Aliquots (~60 mL) of DCM and hexane were evaporated for Turbovap blanks using a TurboVap LV Evaporator (Caliper Life Sciences, Inc.). Small aliquots (~4 mL) of DCM and hexane were evaporated on a warm metal block with a gentle stream of nitrogen for evaporation block blanks. Lastly, a solvent blank was prepared. Each blank was then subjected to all of the downstream steps in the laboratory pathway. For a more comprehensive procedural blank, a combusted brick, which was heated at 550ºC for 12 hours, was fed into the saw blade on a metal tray that was lined with combusted aluminum foil and sliced into small pieces. All material that was being sawed was held using combusted aluminum foil in order to minimize the introduction of surficial contamination. The combusted brick pieces were then dried in an oven at 55°C, powdered in a puck mill, and extracted by ASE. Subsequently, the combusted brick solvent extract was concentrated and transferred to an insert. The set of procedural and process blanks were analyzed by gas chromatography-mass spectrometry (GC-MS) in full scan and metastable reaction monitoring (MRM) modes. The ANU/MIT laboratory and analytical methods are described in greater detail in section 4.1. The blank analyses revealed that the laboratory processes downstream of sawing did not contribute detectable hydrocarbon biomarkers, specifically hopanes and steranes. The ASE extraction added diphenyl sulfone to the solvent extract. However, this compound is not a biomarker of interest, so it was disregarded as a significant hydrocarbon contaminant. In contrast, solvent rinses of multiple saw blades (Nortel Diamond wheel 12”, 0.062 rim and 14”, 0.07 rim and UKAM Industrial Superhard tools) yielded a mixture of hydrocarbons, including alkanes, hopanes, and steranes. These hydrocarbons continued to be detected in saw blade solvent rinses even after a number of physical and organic geochemical cleaning treatments, including scrubbing with steel wool, removing a surface layer with silicon carbide grit, solvent washing, dishwashing, and sand blasting. Moreover, the hydrocarbons associated with the saw blade were transferred to the combusted brick blank during sawing, and the amount of hydrocarbon contamination transferred from the saw blade to the sample was proportional to the newly sawed surface area of the brick. Clearly, sawing is a potential source of contaminant hydrocarbons that could account for the hydrocarbon biomarkers detected in previously analyzed Archean host rocks. As most cores analyzed in previous studies were saw-cut by the drilling operators on-site, reported cumulative blanks failed to capture this important process. After exhausting other methods of hydrocarbon contaminant removal, one of the tested saw blades was heated in a furnace to ~300°C for 1 hour, despite potential safety concerns (i.e. delamination of the blade during sawing). The saw blade was subsequently ultrasonicated in a combusted aluminum foil envelope containing solvent. After this cleaning procedure, the saw blade solvent rinses and combusted brick extracts demonstrated that the sawing procedure was no longer a significant source of detectable hydrocarbon contaminants. In particular, the hopanes and steranes were at or below detection limit, but if a hopane or sterane was detectable the peak size had been reduced to trace levels approaching the detection limit (Table 1).
4
Whole core samples were treated the same way as the combusted brick blanks. Samples were sawed lengthwise into mirrored core halves, which were subsequently distributed to the participating organic geochemistry laboratories, ensuring that every sample would be worked up independently in two separate laboratories. One set of core halves was worked up and analyzed at ANU in Canberra immediately after halving and thawing, implying that the cores were not subjected to potential alteration processes during subsequent storage, which could involve the formation of micro-scale desiccation cracks, pyrite oxidation, evaporation of lighter hydrocarbons from core exteriors, and additional contamination during repackaging and transport. Core halves to be distributed from the ANU laboratory to other laboratories were wrapped in combusted aluminum foil and packed into combusted glass jars, where they were padded and sealed with additional combusted aluminum foil before being screwed close. The samples were sent to Macquarie University frozen, while University of Bremen and University of California Riverside received their samples thawed. Samples were analyzed between three to nineteen months after drilling in the different laboratories. Unlike the samples that were analyzed directly at ANU by the ANU/MIT team, minor alteration of the distributed core halves was evident, such as oxidation of the aluminum foil due to aerial oxidation of reduced phases in the samples, such as pyrite. Sample distributions between the participating laboratory are described in Table S1. 4. Laboratory Methodology 4.1 ANU & MIT joint analysis 4.1.1 Laboratory preparation The ANU and MIT teams worked together at ANU to prepare and analyze the largest set of AIDP samples, so these are the methods described in the main article. However, they are described in greater detail here. Because the frozen whole core samples were sawed in half at ANU, these samples did not undergo the additional steps of sample distribution. Instead, these samples remained frozen and purged with argon for the entire duration of storage, and they were worked up immediately or soon after the whole core was split into half. The methods for testing laboratory procedural and process blanks prior to sample analysis are described in section 3. The samples that were prepared and analyzed at ANU were processed in three different rounds. At least one combusted brick blank was prepared and analyzed at the beginning of each round of sample preparation to ensure that the entire sample preparation pathway was still robust after the lapse of time (weeks or months) between sample preparation rounds. The 11 samples and corresponding 13 blanks (not including process and procedural blanks for initial method optimization) are listed in Table S2 in the order in which they were prepared. The core halves for ANU analysis were sawed into interior and exterior pieces using the same saw described in section 3. Approximately 5–10 mm slabs were removed from the core exterior, including the rounded drilling surface and the exposed core end pieces. As a result, any rock surface that could have come into contact with the Teflon bag or drilling equipment was removed and collected as the exterior sample. The RHDH2A 130.2-130.4 m quarter core sample was sawed into interior and exterior samples using the same saw and procedure. The slicing scheme for the RHDH2A quarter core is illustrated in Fig. 1. The rounded drilling surface was collected as a separate sample denoted “rounded surface”. The two sawed surfaces were sawed off and collected as separate samples: “saw cut surface 1” and “saw cut surface 2.” Compared to the AIDP samples, the RHDH2A sample was markedly drier and more fractured. For all samples, the interior and exterior pieces were sawed into pieces that were small enough to be placed into the stainless steel puck mill at the same time that the sample was being split into interior and exterior samples. After sawing, the interior and exterior pieces were collected as separate samples into combusted glass jars. In order to remove fine particles generated during sawing, the pieces were rinsed with Milli-Q water until the rinse water was clear. The interior and exterior pieces were dried overnight at 55°C in an oven with combusted aluminum foil placed loosely over the top of the glass jar. The stainless steel puck was cleaned using soap and water before being solvent rinsed with MeOH, DCM, and hexane (GC Resolv or Optima solvents from Fisher Chemical). Subsequently, at least four aliquots of combusted sand were powdered in the puck mill. The powdered sand aliquots were discarded with the exception of the last
5
aliquot of powdered sand, which was collected as a sand blank. Next, the interior of the sample was powdered, followed by the exterior. At least four more aliquots of combusted sand were powdered between samples, where again the last sand aliquot was collected as a sand blank for the next sample. Therefore, every sample had a sand blank associated with it. The blank, sample interior, and sample exterior were prepared in parallel during all subsequent downstream procedures, in that order. Sample extraction was performed with a 9:1 (v:v) DCM:MeOH solvent mixture in a Dionex ASE 200. ASE extraction cells were cleaned using soap and water and by solvent cleaning. ASE cells were then pre-extracted using combusted ceramic tile filling. The combusted sand blank was extracted in the pre-extracted ASE cell. The powdered sand was removed from the cell after extraction. The sample interior was then extracted in the same ASE cell without additional cleaning following the sand blank extraction. Similarly, the interior sample powder was removed, and the powdered sample exterior was extracted in the same ASE cell without additional cleaning. The sequential powdering and extraction of sand blank, interior, and exterior ensured that the samples were subjected to the same or cleaner conditions than the sand blank. The total lipid extract (TLE) was concentrated under a stream of purified N2 in a water bath (<40°C) using a Turbovap. However, precaution was taken to ensure that the samples were never blown down to dryness during concentration and transfer steps in order to avoid losing low molecular mass compounds. Solvent cleaned activated copper granules were used to remove elemental sulfur, which was abundant in some of the extracts from the Jeerinah Formation. The concentrated, desulfurized TLE was transferred to a GC microvial insert containing 0.5 ng of D4 (d4-C29-ααα-ethylcholestane) standard. Each sample was then brought up to a volume of 100 µL in n-hexane, so the concentration of the injected D4 standard was 5 pg/µL. After samples were screened in GC/MS full scan mode, 500 ng of 18-methyl eicosanoic acid methyl ester (18-MEME) standard was added to the Carawine Dolomite TLEs in order to quantify PAHs and diamondoids. The samples were then brought up again in 100 µL, so the concentration of the 18-MEME injected was 5 ng/µL. The measured total hopane and sterane concentrations for the blanks and samples are provided in Table 1 of the main article. 4.1.2. GC-MS analytical conditions All samples were analyzed by GC/MS in full scan and MRM modes. Carawine Dolomite samples were also analyzed for aromatic steroids by selected ion monitoring (SIM). GC-MS analyses of the saturate and aromatic fractions were carried out on a Micromass AutoSpec Premier equipped with a 6890 gas chromatograph (Agilent) and a DB-5 capillary column (60 m × 0.25 mm i.d., 0.25 µm film thickness) using helium as carrier gas. The MS source was operated at 260°C in EI-mode at 70 eV ionization energy and with 8000 V acceleration voltage. Samples were injected in splitless mode into a PTV injector, which was ramped from 60°C (hold for 0.1 min) to 300°C at 260°C/min and held at the maximum temperature for the remaining duration of the analysis. For full-scan analyses, the GC oven was programmed at 60°C (4 min), heated to 315°C at 4°C/min, with a final hold time of 22.3 min. The AutoSpec full-scan duration was 0.7 s plus 0.2 s interscan delay over a mass range of 55–600 Da. For MRM and SIM, the GC oven used the same temperature program except that it held the final temperature for 32.3 minutes. The MRM channel that included hopane and sterane transitions had a cycle time of 918.4 milliseconds and an inter scan delay of 0.1 seconds. All samples were injected in n-hexane (0.5 or 1 µL out of a total volume of 100 µL) to avoid deterioration of chromatographic signals by FeCl2 build-up in the MS ion source caused by the use of halogenated solvents (12). 4.1.3. Compound-specific isotope analyses (CSIA) of extractable PAHs at Geoscience Australia The carbon isotopic composition of individual hydrocarbons was determined by gas chromatography-isotopic ratio mass spectroscopy (GC-IRMS). The analytical system included a Thermo Finnigan Trace GC interfaced via a Thermo Finnigan GC Combustion III to a Thermo Scientific MAT 253 isotope-ratio mass spectrometer. Depending on solvent volume, samples were injected on-column either manually or automatically (GC PAL autosampler). Helium was used as the carrier gas at a constant flow of 2 mL/min. The GC capillary column was a DB-5 (60 m x 0.32 mm i.d., 0.25 µm film thickness) and the GC oven was programmed at 40°C for 10 min, heated to 310°C at 4°C/min and held at the final temperature for up to 10 min. Data was acquired and processed using the software package ISODAT 3.0. The system was calibrated and corrected for instrument drift by co-injecting internal standards of perdeuterated n-alkanes (C16D34, C20D42, C24D50; Chevron) with known isotopic compositions. All δ13C values are reported in ‰

6
relative to the Pee Dee Belemnite (VPDB) standard. Isotopic analyses were carried out in duplicates with reported data achieving an error within ±0.5–1.0‰ for polyaromatic hydrocarbons. The results are included in Table S6. 4.1.4. Total organic carbon and bulk organic δ13C Approximately 0.5 g of unextracted interior sample powder was weighed into a test tube for decarbonation using 3N hydrochloric acid (HCl). The samples were allowed to react at room temperature over night before they were centrifuged and decanted. Each sample was tested to ensure that additional HCl did not generate further reaction. The residual material was rinsed with Milli-Q water until the supernatant was pH neutral. The samples were then dried over night in a 60°C oven. The remaining sample material was weighed in order to calculate the percent carbonate. The sample material was further homogenized using a glass rod before being transferred to combusted 4 mL glass vials. The total organic carbon (TOC) and bulk organic δ13C was performed in the Fallon laboratory at ANU. A preliminary test run using 10 mg of sample was performed in order to estimate how much carbon was in each sample. Based on the test results, the amount of sample weighed into the tin capsule was modified in order to introduce approximately 0.25 mg of carbon into the mass spectrometer for every sample. For the final analysis, ~4 mg of vanadium pentoxide (Carlo Erba) was weighed into each sample and standard capsule to enhance combustion efficiency. Each sample was prepared in duplicate. An empty tin capsule was analyzed in between samples to assess and prevent sample carry over. Eighteen polyethylene standards (IAEA-CH-7; 85.7% C; δ13CVPDB= -32.15 +/- 0.05‰) were prepared and used to bracket groups of five samples and five tin capsules. USGS-40 (L-glutamic acid; δ13CVPDB = -26.389 +/- 0.04‰; 40.8% C), USGS-41 (L-glutamic acid; δ13C= +37.63 +/- 0.05‰), and IAEA-600 (caffeine; δ13CVPDB = -27.771 +/- 0.043‰; 49.48% C) were prepared in duplicate for secondary standards that were analyzed at the beginning and end of the sample sequence. A set of six glycine standards (32% C; δ13CVPDB =-48.26‰) with masses ranging from 0.15 mg to 0.9 mg of C were used to test the linearity of the measurement. A SerCon 20–22 continuous flow isotope ratio mass spectrometer (CS-IRMS) coupled to an Automated Nitrogen Carbon Analyser-Gas Solids and Liquids Elemental Analyzer (ANCA-GSL EA) was used to analyze the sample set in continuous flow mode. The average carbon isotopic value of the IAEA-CH-7 polyethylene standard, which was measured throughout the sample sequence, was within 0.15‰ of the accepted δ13CVPDB value and the average carbon percentage was within 0.2% of the accepted carbon percentage. The TOC and bulk δ13C results are given in Table S5. The bulk δ13C is the average of the δ13C sample duplicates with the difference between the average δ13C and individual measurements reported as the corresponding standard deviation. The uncertainty of the TOC measurements cannot be accurately determined since they rely on the uncertainty of the carbonate percentage calculations, but the duplicate measurements of the decarbonated material were never greater than 0.5% from the average value. 4.2 Analyses at U. Bremen & MPI Jena 4.2.1 Laboratory preparation Before analyzing the AIDP half core samples, the cleanliness of the laboratory procedure was tested with a series of process blanks, which tested individual steps of the workup path, and cumulative procedural blanks, which are subjected to the full equivalent sample workup. For procedural blanks we used pieces of brick that were cut to sticks with dimensions of ca. 3 x 3 x 10 cm, wrapped in aluminum foil and baked at 500ºC for 10 hours to remove potential organic contaminants by combustion. Given the focus on diagnostic biomarker hydrocarbons, the cleanliness was determined by target compound analysis for hopanes and steranes. While process blanks with biomarker levels below detection limit could be achieved, this could not be accomplished for procedural blanks. Workup of core samples was initiated once we consistently achieved a level of steroid contamination of <100 fg per chromatographic peak and levels of hopanoid contamination < ca. 300 fg per peak over three consecutive procedural blanks (see section S5 for discussion of blank concentrations). The persistent but trace contaminants had a non-fossil signature (e.g. only C27 ααR amongst the regular steranes).
7
Six AIDP half core samples and two brick blanks were sawed into interior and exterior portions, removing ca. 1 cm of material from all core edges, by using an all-stainless steel trim saw that was fitted with a diamond-rimmed blade. The blade had undergone multiple cleaning steps that involved repeated ultrasonication in organic solvents and baking at 400ºC before an acceptable level of blade cleanliness was achieved. Core samples were held with pieces of baked aluminum foil and the blade was lubricated with a continuous stream of doubly purified, deionized and organic-clean water (0.055 µS/cm; 2–7 ppb TOC) that was not recirculated. Core pieces were subsequently transferred to beakers and dried on a hot plate at 60ºC until dry and tightly covered with aluminum foil for temporary storage. Subsequently, core interiors and one brick blank were fully processed before workup of core exteriors was initiated. Fragments were wrapped in a piece of thick (50 µm) aluminum foil and crushed by the impact of a DCM-cleaned hammer on a DCM-cleaned steel plate. Fragments were transferred to clean aluminum-foil covered beakers, where they were stored until powdering. The latter was performed in a Siebtechnik Shatterbox equipped with a stainless steel puck mill that was cleaned by baking at 500ºC. All core interiors were powdered first, followed by all core exteriors, where the puck and container was baked in between. For both interiors and exteriors, the sequence of powdering was brick blank, negative control chert sample, sample 2/1/014, sample 2/1/010, sample 2/1/008, sample 2/1/007, sample 2/1/004, and sample 2/1/001. The powdered samples were transferred to glass jars for long-term storage. In between samples, the puck and milling container were cleaned by grinding combusted quartz sand four times and rinsing with DCM. Sample powder aliquots of ca. 8 g were transferred into pre-cleaned Teflon tubes, in which they were microwave-extracted (CEM Mars-6; 30 minutes at 110ºC) under stirring with 50 mL of DCM (Merck, UniSolv grade) (Table S3). All of the Teflon tubes had previously undergone the extraction of process blanks, which confirmed their cleanliness. After centrifugation the extracts were decanted and the extraction step was repeated. Pooled extracts were evaporated at 40ºC and 800 mbar to a residual volume of 1 mL. The extracts were replenished with 10 mL cyclopentane (Merck, OmniSolv grade; double distilled before use) before being reduced again to a volume of 1 mL under the same conditions. The concentrated extracts were transferred in cyclopentane to total-recovery GC-vials spiked with 20 ng of d14-p-terphenyl and 500 pg of d4-ααR-cholestane. Subsequently core exteriors were processed following the same protocol, using the same Teflon tubes that were employed for corresponding core interior samples. No preparative chromatographic separation of compound classes was undertaken to minimize the potential addition of contaminants during the laboratory workup. 4.2.2. GC-MS analytical conditions Extracts were analyzed in full scan mode using an Almsco BenchTOF-dx mass spectrometer coupled to a Thermo Trace GC Ultra. Volumes of 2 out of ca. 1000 µL (samples dissolved in c-pentane) were injected in splitless mode (PTV injector ramped from 60ºC to 315ºC with 14.5ºC/sec at 72.4 psi) and separated on a VF-1MS capillary column (40 m x 0.15 mm I.D. x 0.15 µm film thickness) using Helium 5.0 carrier gas at a constant flow rate of 1.4 mL/minute and a temperature program starting at 60ºC (2 minutes), ramped to 325ºC at 4.5º C/min and held at final temperature for 15 minutes. A constant split flow (apart from 1 minute of splitless flow during sample injection) of 100:1 ensured a minimum of atmospheric components in the carrier gas. Ionization was achieved by electron impact at 70 eV and 250ºC with a filament current of ca. 4 A. Data was measured from m/z 30–800 but was only recorded from m/z 50–550 at ~1000 mass resolution using 2469 scans per scanset and a scanset period of 250 ms. Compounds were quantified by comparison of base peak areas to that of d14-p-terphenyl on ion trace m/z 244 without correcting for differential response factors. PAH and diamondoid ratios and calculated vitrinite reflectances are given in Tables S8 and S9, respectively. Target compound analysis for hopanoids and steroids was performed on a Thermo Quantum XLS Ultra triple quadrupole MS coupled to a Thermo Trace GC Ultra. Volumes of 6 out of ca. 1000 µL (samples dissolved in c-pentane) were injected on column at 70ºC. We used a 60 m DB-5MS capillary column (0.25 mm I.D., 0.25 µm film thickness) linked to a 10 m deactivated pre-column (0.53 µm I.D.). Helium 5.0 was used as a carrier gas with a constant flow of 1.3 mL/min. The oven was held isothermal at 70ºC for 5 minutes before ramping with 4ºC/minute to 335ºC, where it was held isothermal for 9 minutes. Ionization was achieved by electron impact at 70 eV and 250ºC, with an emission current of 50 µA. Q1 and Q3 were each operated in 0.7 Da resolution with a cycle time of 0.5 seconds. Q2 was operated with Argon 5.0 collision gas at a pressure of 1.1 mTorr and varying collision voltages depending on the target
8
analyte. Compounds were quantified relative to d4-cholestane without correcting for differential response factors. 4.2.3. Compound-specific stable carbon isotope analyses of extractable PAH at U. Bremen CSIA were performed at the University of Bremen on a Thermo Finnigan MAT-252 coupled to a Thermo Trace GC via a modified combustion interface using Ni wire and oxygen trickle flow at 1000ºC. Volumes of 5 out of 25–50 µL (samples dissolved in n-hexane) were injected on-column at 70ºC. A 60 m DB-5MS capillary column 0.32 mm I.D., 0.25 µm film thickness) linked to a 2 m deactivated pre-column (0.53 µm I.D.) was used with a constant flow (1.2 mL/min) of Helium 5.0 as a carrier gas. The oven was held isothermally for 5 minutes, then ramped to 230ºC at 2.5ºC/minute, to 300ºC at 5ºC/minute and to 330ºC at 15ºC/minute, where it was held isothermally for 15 minutes. Stable carbon isotope ratios were determined relative to a co-injected CO2 standard that was cross-calibrated relative to a reference mixture of n-alkanes. Data are presented in the conventional δ13C notation as permil deviations from the VPDB standard. The reliability of small chromatographic peaks was verified down to an intensity of ca. 30 mV by analyzing increasingly diluted samples of the saturated hydrocarbon fraction of the NSO-1 geochemical standard (Oseberg oil; Norwegian Petroleum Directorate). Results are given in Table S6. 4.2.4. ANU/U. Bremen preparation and analyses of 2/1/002 Sample 2/1/002, which was a pyrobituminous sample occurring in a stylolitic structure, was worked up during a visit to ANU immediately after the drilling campaign. The sample was fragmented into smaller portions by impact of a hammer after being wrapped in combusted aluminum foil. Individual pieces were transferred to a pre-combusted mortar and powdered with a pestle. The sample was extracted twice by ultrasonic agitation in DCM and concentrated to near dryness on a heating block, after which it was resuspended in hexane and further concentrated to fully remove remnant DCM. No removal of elemental sulfur or column chromatography was performed to minimize contamination. The concentrated sample exhibited a faint yellow hue and was analyzed in full scan and MRM mode on a Micromass AutoSpec Premier coupled to an Agilent 6890 GC at ANU using the same parameters described in section 4.1.2. The sample was further concentrated and subjected to GC-irm-MS analysis at Geoscience Australia using the same parameters described in section 4.1.3. The bulk organic δ13C analysis of this sample was measured in the Farquhar lab at ANU where ~2 mg of powdered sample was loaded into tin capsules. These were subsequently combusted in a Carlo-Erba elemental analyser (Carlo-Erba, Milan, Italy), and the evolved CO2 was introduced using a mass spectrometer (Micromass Isochrom; VG, Middlewick, UK). 4.2.5. H and C elemental analysis The elemental ratio of hydrogen and carbon in kerogens were determined on dried kerogen powders after digestion of the mineral matrix. Aliquots of ca. 5 g of sample powder, taken from core exterior portions, were wetted with MeOH and treated twice with aqueous HCl (first 6N, then 12N) under constant stirring. The acid was decanted and samples were rinsed 8–10x with Type-1 ultrapure water, at which point the pH-value of the water (ca. 4.5) remained stable. After drying and gravimetric determination of carbonate loss, samples were powdered with a Teflon rod, again wetted with MeOH and treated twice with aqueous HF (48 %) under constant stirring for >24 hours each. Supernatant acid was decanted and the digestion residues were rinsed with Type-1 water (10x). After drying and powdering, kerogens were analyzed at the MPI-BGC in a Vario EL II cube CNHS elemental analyzer (Elementar Analysensysteme) by TCD detection after oxidation of the kerogen to CO2 and H2O at 1150ºC. Sample powders were additionally dried at 110ºC over night and subsequently weighed with a WO3 catalyst, first into silver cups (to react with any remnant fluoride) and then into secondary tin cups (given the exothermal reaction of Sn). Helium was used as a carrier gas, spiked with an O2 pulse for flash combustion. Oxygen was eliminated from the gas stream by passing through active copper at 850ºC. Remnant halogens were trapped on silver wool and any persistently remnant fluoride was trapped on magnesium oxide. Results are reported in Table S5. 4.2.6. Bulk Organic δ13C analyses The stable carbon isotope ratios of macromolecular organic matter were determined on unextracted rock powder after removal of carbonates using 6N and 12N hydrochloric acid. The neutralized, dried and
9
homogenized residues were weighed into tin cups and analyzed after online combustion to CO2 in an in-house refurbished and modified Finnigan MAT Delta C prototype isotope ratio monitoring (irm) MS, coupled to a Carlo Erba EA-1100 via a ConFlo III interface. The stable carbon isotopic values are reported in the permil notation relative to VPDB, after calibration by the NBS-22 reference standard. Results are reported in Table S5. 4.3 Macquarie University
Prior to sample preparation of the AIDP half core samples, laboratory hydrocarbon contribution was assessed using an outcrop sample that was collected from a basalt lava flow of the Maddina Formation. The outcrop samples were combusted in the laboratory at 400°C for three hours before being used for laboratory system blanks. The blank was processed by the same procedures described below for the AIDP samples. After the blanks were assessed, five biomarker target samples from AIDP-2 and AIDP-3 were examined for preserved hydrocarbons, and one dolerite sample from AIDP-1 was processed as a negative control sample (Table S4). AIDP half core samples were received frozen from the ANU/MIT team and remained frozen until they were sawed. The samples were manipulated through aluminum foil and never contacted other materials except for a clean saw blade (BUEHLER, BUE11-4267; 178 mm diameter; 0.6 mm thickness) and Milli-Q water that was used for cooling and lubrication. Aluminum foil and glassware were combusted at 400ºC for at least three hours before use. The saw blade was combusted twice at 300ºC for three hours and sonicated with MeOH (Macron) and DCM (Honeywell-Burdick & Jackson) several times to eliminate surface contamination before samples were processed. Between each sample, the saw blade was sonicated with Milli-Q water (1x), MeOH (600 mL; 1x) and DCM (600 mL; 2x), and 200 mL of the last DCM solvent rinse was analyzed by GC-MS to measure the organic residues. During sawing, the Milli-Q water was not recycled but went directly to the waste after a single use. Although clear signs of weathering were not observed, vibration during cutting cracked some samples, indicating the presence of micro-fractures. A few millimeters of drill core exterior was sawed off to evaluate surficial contaminants. The interior and exterior pieces were rinsed separately with Milli-Q water (1x), MeOH (~100 mL; 1x), and DCM (~100 mL; 2x). The interior and exteriors were powdered to < 200 mesh grain size in a ring-mill (Rocklab). After each sample, the ring mill was scrubbed with a metal brush and rinsed with tap water (1x), MeOH (30-40 mL; 2x), and DCM (30-40 mL; 3x). The ring mill was further rinsed with DCM (30-40 mL; at least 3x) mechanically using a milling head. The last solvent rinse was analyzed by GC-MS to measure the organic residues. The solvent rinses that were analyzed by GC-MS to measure the organic residues provided a qualitative sense of contamination, rather than a quantitative measure of contamination, because solvent volumes were not measured and constant. Hydrocarbons were extracted by sonication with 9:1 (v:v) DCM:MeOH. Column fractionation was not performed because of low abundances and potential introduction of contamination. The extracted organic matter was spiked with three compounds as internal standards by adding 1 mL of a DCM solution containing about 50 ng of each: anthracene-d10 (98 atom %D, Isotec), p-terphenyl-d14 (98 atom %D, Isotec), and tetraeicosane-d50 (98 atom %D, Isotec). The volume of solvent containing the extracted organic matter was further reduced on a hot plate at 60–70°C under a gentle nitrogen flow, until approximately 50 µL remained. Desulfurisation was not carried out except for sample 2/1/007 (291.28 m), which had a large amount of sulfur. In that case, 5 g of activated copper particles (metal turnings, TG, Chem-Supply) were added to the extracted organic matter from sample 2/1/007, and stirred for a few minutes. This simple procedure was enough to remove most sulfur so that reflux of the solution was not performed. The extracted organic matter was analyzed by GC-MS. 4.3.1.Macquarie GC/MS analytical conditions GC-MS analysis was carried out on an Agilent GC (6890N) coupled to an Agilent Mass Selective Detector (5975B). An aliquot of 1 µL of the 50 µL solution was injected into a PTV inlet operating in splitless mode with a J&W DB-5MS column (length 60 m, inner diameter 0.25 mm, film thickness 0.25 µm). The inlet was ramped from 35°C (3 min. isothermal) to 310°C (0.5 min. isothermal) at a rate of 700°C/min. Helium was used as the carrier gas (1.5 mL/min.), and the temperature of the GC oven was ramped from 30°C (2 min. isothermal) to 310°C (30 min. isothermal) at a rate of 4°C/min. The MS data
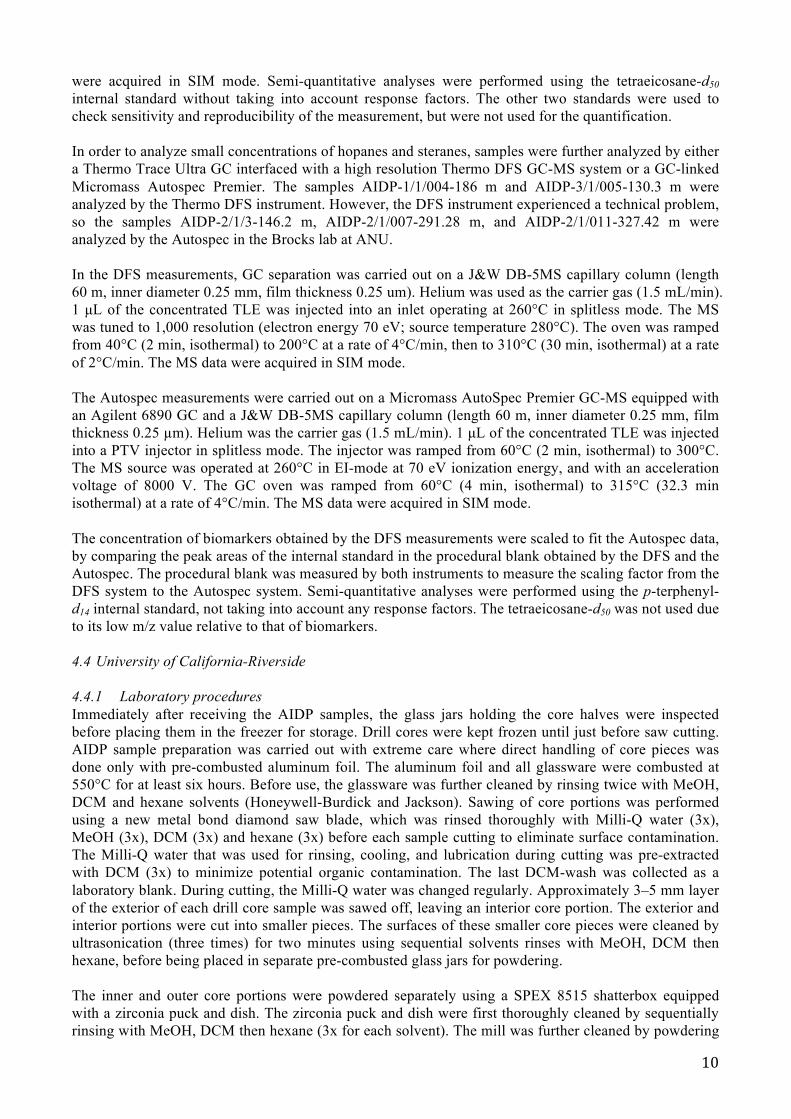
10
were acquired in SIM mode. Semi-quantitative analyses were performed using the tetraeicosane-d50 internal standard without taking into account response factors. The other two standards were used to check sensitivity and reproducibility of the measurement, but were not used for the quantification. In order to analyze small concentrations of hopanes and steranes, samples were further analyzed by either a Thermo Trace Ultra GC interfaced with a high resolution Thermo DFS GC-MS system or a GC-linked Micromass Autospec Premier. The samples AIDP-1/1/004-186 m and AIDP-3/1/005-130.3 m were analyzed by the Thermo DFS instrument. However, the DFS instrument experienced a technical problem, so the samples AIDP-2/1/3-146.2 m, AIDP-2/1/007-291.28 m, and AIDP-2/1/011-327.42 m were analyzed by the Autospec in the Brocks lab at ANU. In the DFS measurements, GC separation was carried out on a J&W DB-5MS capillary column (length 60 m, inner diameter 0.25 mm, film thickness 0.25 um). Helium was used as the carrier gas (1.5 mL/min). 1 µL of the concentrated TLE was injected into an inlet operating at 260°C in splitless mode. The MS was tuned to 1,000 resolution (electron energy 70 eV; source temperature 280°C). The oven was ramped from 40°C (2 min, isothermal) to 200°C at a rate of 4°C/min, then to 310°C (30 min, isothermal) at a rate of 2°C/min. The MS data were acquired in SIM mode. The Autospec measurements were carried out on a Micromass AutoSpec Premier GC-MS equipped with an Agilent 6890 GC and a J&W DB-5MS capillary column (length 60 m, inner diameter 0.25 mm, film thickness 0.25 µm). Helium was the carrier gas (1.5 mL/min). 1 µL of the concentrated TLE was injected into a PTV injector in splitless mode. The injector was ramped from 60°C (2 min, isothermal) to 300°C. The MS source was operated at 260°C in EI-mode at 70 eV ionization energy, and with an acceleration voltage of 8000 V. The GC oven was ramped from 60°C (4 min, isothermal) to 315°C (32.3 min isothermal) at a rate of 4°C/min. The MS data were acquired in SIM mode. The concentration of biomarkers obtained by the DFS measurements were scaled to fit the Autospec data, by comparing the peak areas of the internal standard in the procedural blank obtained by the DFS and the Autospec. The procedural blank was measured by both instruments to measure the scaling factor from the DFS system to the Autospec system. Semi-quantitative analyses were performed using the p-terphenyl-d14 internal standard, not taking into account any response factors. The tetraeicosane-d50 was not used due to its low m/z value relative to that of biomarkers. 4.4 University of California-Riverside
4.4.1 Laboratory procedures Immediately after receiving the AIDP samples, the glass jars holding the core halves were inspected before placing them in the freezer for storage. Drill cores were kept frozen until just before saw cutting. AIDP sample preparation was carried out with extreme care where direct handling of core pieces was done only with pre-combusted aluminum foil. The aluminum foil and all glassware were combusted at 550°C for at least six hours. Before use, the glassware was further cleaned by rinsing twice with MeOH, DCM and hexane solvents (Honeywell-Burdick and Jackson). Sawing of core portions was performed using a new metal bond diamond saw blade, which was rinsed thoroughly with Milli-Q water (3x), MeOH (3x), DCM (3x) and hexane (3x) before each sample cutting to eliminate surface contamination. The Milli-Q water that was used for rinsing, cooling, and lubrication during cutting was pre-extracted with DCM (3x) to minimize potential organic contamination. The last DCM-wash was collected as a laboratory blank. During cutting, the Milli-Q water was changed regularly. Approximately 3–5 mm layer of the exterior of each drill core sample was sawed off, leaving an interior core portion. The exterior and interior portions were cut into smaller pieces. The surfaces of these smaller core pieces were cleaned by ultrasonication (three times) for two minutes using sequential solvents rinses with MeOH, DCM then hexane, before being placed in separate pre-combusted glass jars for powdering.
The inner and outer core portions were powdered separately using a SPEX 8515 shatterbox equipped with a zirconia puck and dish. The zirconia puck and dish were first thoroughly cleaned by sequentially rinsing with MeOH, DCM then hexane (3x for each solvent). The mill was further cleaned by powdering
11
at least four aliquots of pre-combusted (450°C) quartz sand. The last aliquot of powdered sand was collected as a sand blank, which was processed through all of the same subsequent laboratory steps as for the AIDP rock powders. The inner sample portion was powdered first followed by the exterior part of that same sample.
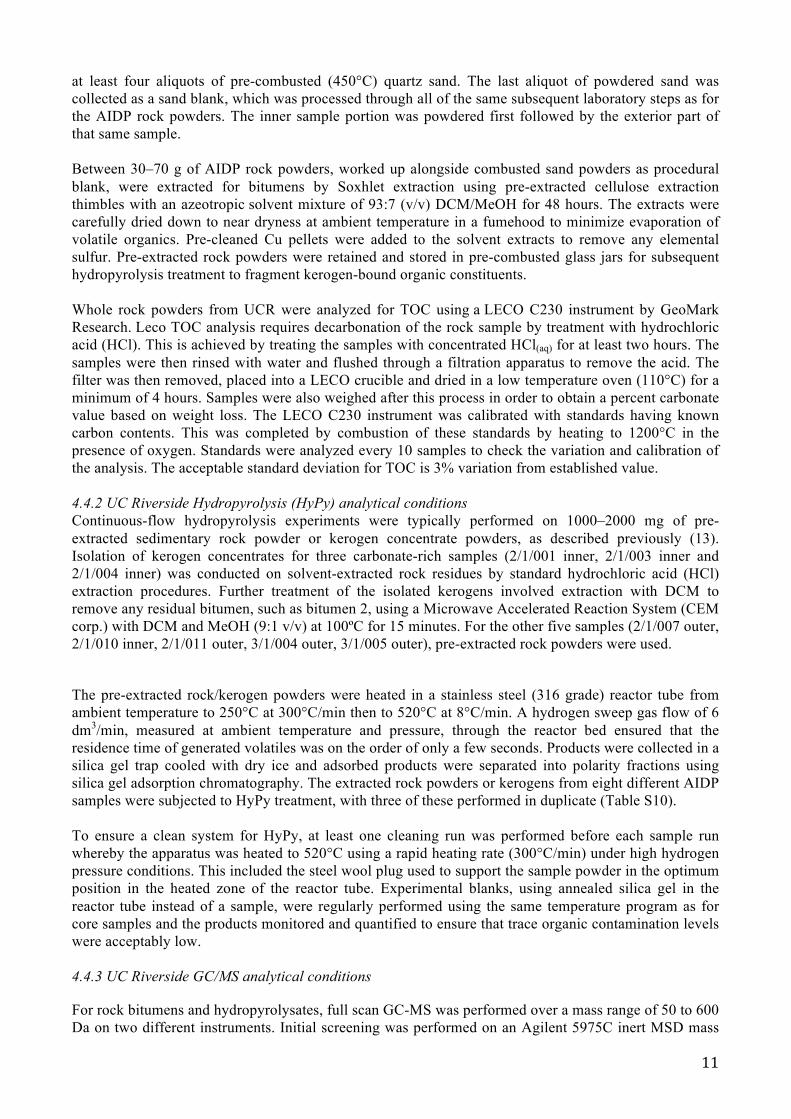
Between 30–70 g of AIDP rock powders, worked up alongside combusted sand powders as procedural blank, were extracted for bitumens by Soxhlet extraction using pre-extracted cellulose extraction thimbles with an azeotropic solvent mixture of 93:7 (v/v) DCM/MeOH for 48 hours. The extracts were carefully dried down to near dryness at ambient temperature in a fumehood to minimize evaporation of volatile organics. Pre-cleaned Cu pellets were added to the solvent extracts to remove any elemental sulfur. Pre-extracted rock powders were retained and stored in pre-combusted glass jars for subsequent hydropyrolysis treatment to fragment kerogen-bound organic constituents. Whole rock powders from UCR were analyzed for TOC using a LECO C230 instrument by GeoMark Research. Leco TOC analysis requires decarbonation of the rock sample by treatment with hydrochloric acid (HCl). This is achieved by treating the samples with concentrated HCl(aq) for at least two hours. The samples were then rinsed with water and flushed through a filtration apparatus to remove the acid. The filter was then removed, placed into a LECO crucible and dried in a low temperature oven (110°C) for a minimum of 4 hours. Samples were also weighed after this process in order to obtain a percent carbonate value based on weight loss. The LECO C230 instrument was calibrated with standards having known carbon contents. This was completed by combustion of these standards by heating to 1200°C in the presence of oxygen. Standards were analyzed every 10 samples to check the variation and calibration of the analysis. The acceptable standard deviation for TOC is 3% variation from established value. 4.4.2 UC Riverside Hydropyrolysis (HyPy) analytical conditions Continuous-flow hydropyrolysis experiments were typically performed on 1000–2000 mg of pre-extracted sedimentary rock powder or kerogen concentrate powders, as described previously (13). Isolation of kerogen concentrates for three carbonate-rich samples (2/1/001 inner, 2/1/003 inner and 2/1/004 inner) was conducted on solvent-extracted rock residues by standard hydrochloric acid (HCl) extraction procedures. Further treatment of the isolated kerogens involved extraction with DCM to remove any residual bitumen, such as bitumen 2, using a Microwave Accelerated Reaction System (CEM corp.) with DCM and MeOH (9:1 v/v) at 100ºC for 15 minutes. For the other five samples (2/1/007 outer, 2/1/010 inner, 2/1/011 outer, 3/1/004 outer, 3/1/005 outer), pre-extracted rock powders were used.
The pre-extracted rock/kerogen powders were heated in a stainless steel (316 grade) reactor tube from ambient temperature to 250°C at 300°C/min then to 520°C at 8°C/min. A hydrogen sweep gas flow of 6 dm3/min, measured at ambient temperature and pressure, through the reactor bed ensured that the residence time of generated volatiles was on the order of only a few seconds. Products were collected in a silica gel trap cooled with dry ice and adsorbed products were separated into polarity fractions using silica gel adsorption chromatography. The extracted rock powders or kerogens from eight different AIDP samples were subjected to HyPy treatment, with three of these performed in duplicate (Table S10). To ensure a clean system for HyPy, at least one cleaning run was performed before each sample run whereby the apparatus was heated to 520°C using a rapid heating rate (300°C/min) under high hydrogen pressure conditions. This included the steel wool plug used to support the sample powder in the optimum position in the heated zone of the reactor tube. Experimental blanks, using annealed silica gel in the reactor tube instead of a sample, were regularly performed using the same temperature program as for core samples and the products monitored and quantified to ensure that trace organic contamination levels were acceptably low. 4.4.3 UC Riverside GC/MS analytical conditions
For rock bitumens and hydropyrolysates, full scan GC-MS was performed over a mass range of 50 to 600 Da on two different instruments. Initial screening was performed on an Agilent 5975C inert MSD mass

12
spectrometer interfaced to an Agilent 7890A GC, equipped with a J&W DB-1MS capillary column (60 m x 0.32 mm, 0.25 µm film). The temperature program for GC-MS full scan was 60ºC (2 min), ramped to 150ºC at 20ºC/min, then to 325ºC at 2ºC/min, and held at 325ºC for 20 min. Quantification of individual PAH and n-alkanes was performed with a d14-p-terphenyl internal standard on the more sensitive Waters AutoSpec Premier mass spectrometer equipped with an Agilent 7890A gas chromatograph and using a J&W DB-1MS coated capillary column (60 m x 0.25 mm, 0.25µm film). Samples were injected in splitless mode at 320oC with He as carrier gas. The oven was programmed from 60ºC (held for 2 min) to 150ºC at 6ºC/min then to 320ºC @ 4ºC/min and held isothermally at the final temperature for 30 minutes. The source was operated in electron ionization (EI) mode at 70 eV ionization energy at 300ºC. The AutoSpec full-scan rate was 0.80 s/decade over a mass range of 50 to 600 Da and a delay of 0.20 s/decade. Metastable Reaction Monitoring-Gas Chromatography-Mass Spectrometry (MRM-GC-MS) was conducted with a Waters AutoSpec Premier mass spectrometer equipped with an Agilent 7890A gas chromatograph and DB-1MS coated capillary column (60 m x 0.25 mm, 0.25 µm film) using splitless injection and He for carrier gas to detect polycyclic hydrocarbon biomarkers, particularly tricyclic terpanes, steranes, methylsteranes, hopanes and methylhopanes. The MRM GC temperature program used for compound separation consisted of an initial hold at 60ºC for 2 min, heating to 150ºC at 10ºC/min followed by heating to 320ºC at 3ºC/min, and a final hold at 320ºC for 22 min. Biomarker compounds were identified based on retention time and published mass spectra and quantified in MRM GC-MS by comparison with a deuterated C29 sterane internal standard (d4-ααα-24-ethylcholestane (20R), Chiron Laboratories, AS), assuming equal response factors between sample compounds and the internal standard. Individual yields of the main hopane and sterane diastereoisomers found in HyPy laboratory procedural blanks were typically <20 pg of total sterane and hopanes per gram of combusted silica pyrolysed, with immature C27 αααR and/or C29 αααR steranes being the dominant procedural blank polycyclic compounds and the hopane series usually found below detection limits. For most of the series of hopane and sterane compounds, the ‘blank’ reflects the detection limit of the mass spectrometer (baseline noise above which a peak must rise) rather than the identified presence of a compound in the procedural sand blank. 4.4.4 Compound-specific stable carbon isotope analyses at MIT of HyPy products Compound specific carbon isotopic measurements of HyPy products were made by gas chromatography/combustion/ isotope ratio mass spectrometry (GC-C-IRMS) using a Thermo Finnigan Delta plus XP coupled to a Thermo Finnigan Trace GC at MIT. The initial oven temperature was programmed to 60°C (held for 2 min), ramped to 150°C at 6°C/min, and then to 320°C at 4°C/min (held for 20.50 min). All samples were bracketed by pulses of in house calibrated reference CO2 gas and Oztech calibrated reference CO2 gas. A standard mix of n-alkanes (Mix A; Arndt Schimmelmann, Indiana University) was analyzed at the beginning and end of the sample sequence and after every sixth sample analysis in order to monitor the instrument condition. The root mean square (RMS) was used to compare the isotopic composition of the 15 n-alkanes in the standard mix to their known carbon isotopic values. The RMS ranged from 0.3 to 0.1‰ for the six analyses of the n-alkane standard mix that were performed through the sample sequence. The mean value and standard deviation of the triplicate analyses are reported here in permil (‰) relative to Vienna Pee Dee belemnite (VPDB). 5. Results Most of the results are presented and discussed in the main article, but some supporting details are discussed in the following sections. 5.1 Extractable hydrocarbon results The spikes that were used in the drilling fluid and were applied to the Teflon bags were not detected in the TLEs that were analyzed in any of the laboratories. It is possible that the spike concentrations in the sump water were too low to be detected on sample surfaces. However, another possible explanation for the inability to detect the spikes in the rock extracts is that the water that was added to the sample bag outcompeted the spike compounds for active sites on the sample surfaces, thereby preventing their

13
detection and significant surficial hydrocarbon contamination in general. Uni Bremen found that the total sterane concentration and total hopane concentrations were up to 54.1 pg/g rock and 14.9 pg/g rock, respectively, in the combusted brick blank. These concentrations are comparable to the total hopane (< 32.9 pg/g rock) and sterane concentrations (< 37.9) that ANU/MIT found in their cumulative procedural blanks (Table 1). Macquarie measured a concentration of 3.5 pg/g rock for total hopane in the procedural blank that they analyzed, which could be an underestimation of laboratory contamination due to linearity and response problems related to the standard compound class and comparatively high standard concentration. ANU/MIT and Uni Bremen quantifications were based on deuterated internal standards, d4-C29-ααα-ethylcholestane and d4-C27-ααR-cholestane, which are structurally similar and had comparable concentrations to the hopane and sterane analytes of interest in the AIDP samples and blanks. In contrast, Macquarie quantified the hopanes and steranes in the AIDP samples and blanks using a deuterated PAH, p-terphenyl-d14, with a total mass that was 2 orders of magnitude greater than the total used by ANU/MIT and U. Bremen (50 ng compared to 0.5 ng). Regardless of analysis and quantification method, every laboratory found that hopanes and steranes were often at or below detection in the AIDP samples, but if they were detectable they were comparable to the blank concentrations measured by that laboratory (see Table 1). The Macquarie team detected aliphatic hydrocarbons (n-C14–35 alkanes, monomethylalkanes, i-C13-20 regular isoprenoids, and alkylcyclohexanes) in their samples, but the concentrations were comparable to experimental blanks for all five shale samples (0.01–1.00 ng/g sample). Furthermore, these compounds were not detected by the ANU/MIT or Uni Bremen teams, so they likely represent laboratory-specific contaminants. All laboratories detected a suite of extractable PAHs and diamondoids. Extractable PAH and diamondoid ratios and calculated vitrinite reflectances (Rc) are given in Tables S8 and S9, respectively. All laboratories found that PAHs exceeded laboratory blanks (where they were typically below detection) and had ng/g rock concentrations, where low molecular weight non-alkylated PAHs were the most abundant detected compounds in the rock extracts (Figs. S4 and S5). In general, the calculated vitrinite reflectances (Rc) estimated from the MAI and MDI diamondoid ratios were lower than those estimated according to the MPI-1 PAH ratio (19, 20) (Table S9). The PAH and diamondoid ratios and Rc values for the Jeerinah Formation sample are more variable between laboratories and between interior and exterior samples compared to those calculated for the Carawine Dolomite (Tables S8 and S9) because the low PAH concentrations and small peak size in the Jeerinah Formation samples affected the accuracy of peak integrations. 5.2 HyPy results Individual PAHs, such as phenenthrene and pyrene, were detected in HyPy blanks at concentrations below 1 ng/g combusted sand, and n-alkanes (in the C14-20 range) had concentrations typically below <10 ng/g sand in the sand blank. These blank concentrations are 1–2 orders of magnitude lower than the major analytes reported from Archean rock hydropyrolysates (Table S10). The 2/1/001 and 2/1/004 Carawine Dolomite samples generated higher yields of pyrolysate and yielded less mature and more diverse product profiles, including a series of aliphatic hydrocarbons (Fig. S6) with a mature distribution of C12-20 n-alkanes, methylalkanes, alkylcyclohexanes, diamondoids and other compound classes. The product distributions from 2/1/001 and 2/1/004 were fairly similar to those reported from HyPy of 3.4 Ga Strelley Pool chert kerogens (14) (Table S10). The PAH profiles from the pre-extracted 2.7 Ga Jeerinah Formation black shales, dominated by pyrene, phenanthrene and other unsubstitited (parent) PAH, were similar to those generated previously for Archean black shale kerogens from the 2.5 Ga Hamersley Group of the Pilbara Craton (15). One exception was the 2/1/003 Carawine Dolomite kerogen that produced high yields of pyrolysate but a more mature distribution of PAH than the other two carbonates found stratigraphically above and below this sample. However, this observation is consistent with the 2/1/003 sample containing organic matter with the lowest atomic H/C ratio of the Carawine Dolomite samples that were pyrolysed (Table S5). The more mature PAH distribution for sample 2/1/003 was likely due to the effects of different mineral compositions and differential heating on the extent of aromatization, thermal cracking of alkyl chains and other maturation reactions because mineral matter composition, particularly the abundance and speciation of clays, exerts a strong influence on organic matter maturation for overmature samples. Evidently, rocks containing low clay abundances preserve less
14
metamorphosed and less recalcitrant sedimentary organic matter where lithofacies with significant carbonate or chert content attenuate the catalytic effect of acidic clay minerals in shales (14). 6. Ratio Definitions
Diamondoid Ratios:
MAI=1-Methyl Adamantane/(1-Methyl Adamantane +2-Methyl Adamantane) MDI=4-Methyl Diamantane/(1-Methyl Diamantane+3-Methyl Diamantane+4-Methyl
Diamantane)
PAH Ratios: MNR=2-Methyl Naphthalene/1-Methyl Naphthalene MPI-1=1.5*(2-MeP+3-MeP)/(P+1-MeP+9-MeP) MDF=(3-MeP+2-MeP)/(3-MeP+2-MeP+1-MeP+9-MeP)
where P=Phenanthrene and MeP=Methyl Phenanthrene SI References
1. Buick R et al. (1995) Record of emergent continental crust ~3.5 billion years ago in the Pilbara
craton of Australia. Nature 375(6532):574–577.
2. Eigenbrode JL (2004) Late Archean Microbial Ecology: An Integration of Molecular, Isotopic, and Lithological Studies. PhD Thesis. The Pennsylvania State University, State College, PA. https://etda.libraries.psu.edu/paper/6259/.
3. Richards MN (1985) CRA Exploration Pty. Ltd. Final report on exploration licenses Ripon Hills North 45/63. Ripon Hills South 45/64 and Gingarrigan Creek 45/65, Nullagine, S F 51-5, Western Australia. Western Australia Geological Survey, Report number 13140, WAMEX Item Number 2655, A15932.
4. Nelson DR (1998) in Compilation of geochronology data, June update. Western Australia Geologic Survey Records.
5. Nelson DR (2005) in Compilation of geochronology data, June update. Western Australia Geologic Survey Records.
6. Woodhead JD, Hergt JM, Simonson BM (1998) Isotopic dating of an Archean bolide impact horizon, Hamersley basin, Western Australia. Geology 26(1):47–50.
7. Nelson DR, Trendall AF, Altermann W (1999) Chronological correlations between the Pilbara and Kaapvaal cratons. Precambrian Res 97(3):165–189.
8. Arndt NT, Nelson DR, Compston W, Trendall AF, Thorne AM (1991) The age of the Fortescue Group, Hamersley Basin, Western Australia, from ion microprobe zircon U‐Pb results. Aust J Earth Sci 38(3):261–281.
9. Blake TS, Buick R, Brown SJA, Barley ME (2004) Geochronology of a Late Archaean flood basalt province in the Pilbara Craton, Australia: constraints on basin evolution, volcanic and sedimentary accumulation, and continental drift rates. Precambrian Res 133(3):143–173.
10. Trendall AF, Nelson DR, De Laeter JR, Hassler SW (1998) Precise zircon U-Pb ages from the Marra Mamba Iron Formation and Wittenoon Formation, Hamersley Group, Western Australia. Aust J Earth Sci 45(1):137–142.

15
11. Flügel E (2010) Microfacies of carbonate rocks (Springer Science & Business Media, Berlin-Heidelberg). 2nd Ed. pp. 316-319.
12. Brocks JJ, Hope JM (2014) Tailing of Chromatographic Peaks in GC–MS Caused by Interaction of Halogenated Solvents with the Ion Source. J Chromatogr Sci 52(6):471–475.
13. Love GD, Snape CE, Carr AD, Houghton RC (1995) Release of covalently-bound alkane biomarkers in high yields from kerogen via catalytic hydropyrolysis. Org Geochem 23(1):981–986.
14. Marshall CP et al. (2007) Structural characterization of kerogen in 3.4 Ga Archaean cherts from the Pilbara Craton, Western Australia. Precambrian Res 155(1):1–23.
15. Brocks JJ et al. (2003) Release of bound aromatic hydrocarbons from late Archean and Mesoproterozoic kerogens via hydropyrolysis. Geochim Cosmochim Acta 67(8):1521–1530.
16. Brocks JJ, Logan G, Buick R, Summons RE (1999) Archean molecular fossils and the early rise of eukaryotes. Science 285(5430):1033–1036.
17. Brocks JJ, Buick R, Logan G, Summons RE (2003) Composition and syngeneity of molecular fossils from the 2.78 to 2.45 billion-year-old Mount Bruce Supergroup, Pilbara Craton, Western Australia. Geochim Cosmochim Acta 67(22):4289–4319.
18. Eigenbrode JL, Freeman K, Summons RE (2008) Methylhopane biomarker hydrocarbons in Hamersley Province sediments provide evidence for Neoarchean aerobiosis. Earth Planet Sci Lett 273(3):323–331.
19. Boreham CJ, Crick IH, Powell TG (1988) Alternative calibration of the Methylphenanthrene Index against vitrinite reflectance: Application to maturity measurements on oils and sediments. Org Geochem 12(3):289–294.
20. Chen J, Fu J, Sheng G, Liu D, Zhang J (1996) Diamondoid hydrocarbon ratios: novel maturity indices for highly mature crude oils. Org Geochem 25(3/4):179–190.

French et al. SI Appendix
16
Supplementary Figures and Tables
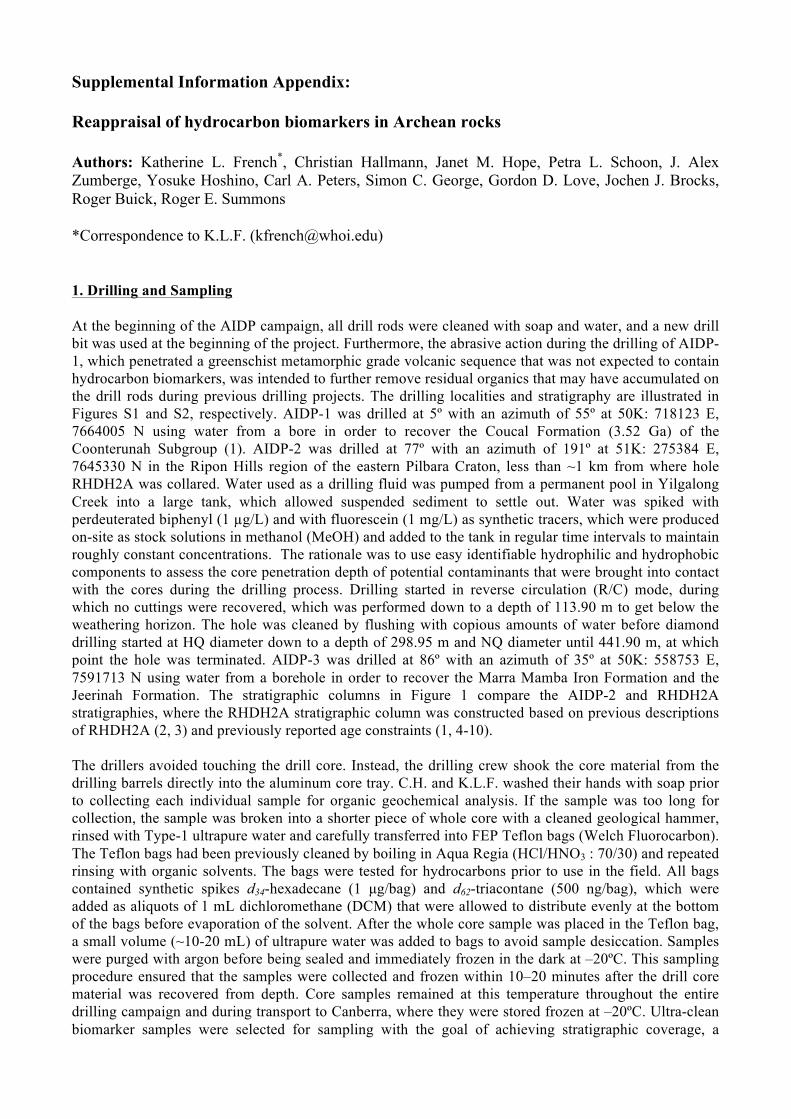
Figure S1. Geologic map of Pilbara Craton, Western Australia and AIDP drilling localities. Key regions and towns are marked for reference in addition to locations of drill holes used in previous Archean biomarker studies. These previously drilled cores include WRL1 (2, 16-18), SV1 (2, 17, 18), FVG1 (17), and RHDH2A (2, 18). A drill hole is labeled in red if sample material from that site was analyzed in this study.
AIDP-1
AIDP-3
drill hole used in earlier studiestown
drill holes used in this study
WRL1
Point Samson
Wedgefield
Fortescue RiverRoadhouse
Roebourne
FVG1
++ +
+ +
+++
++
+
SV1
AIDP-2
& RHDH2aMarble Bar
Ripon Hills
French et al. SI Appendix
17
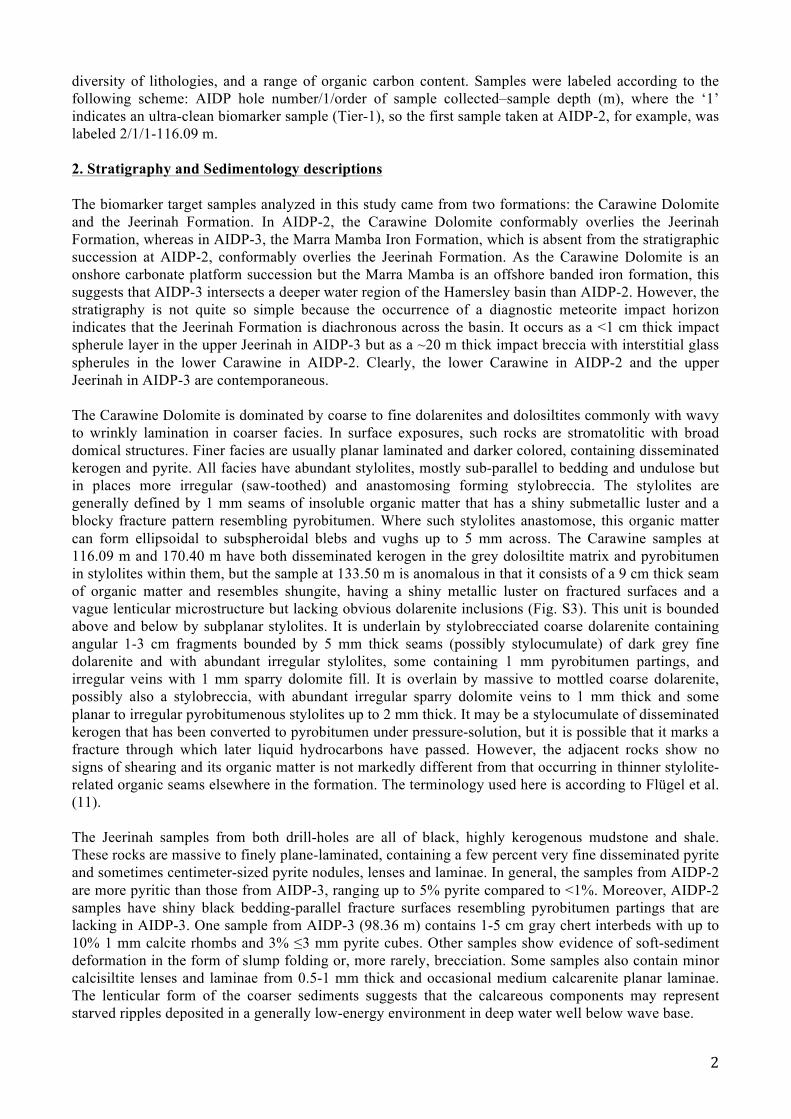
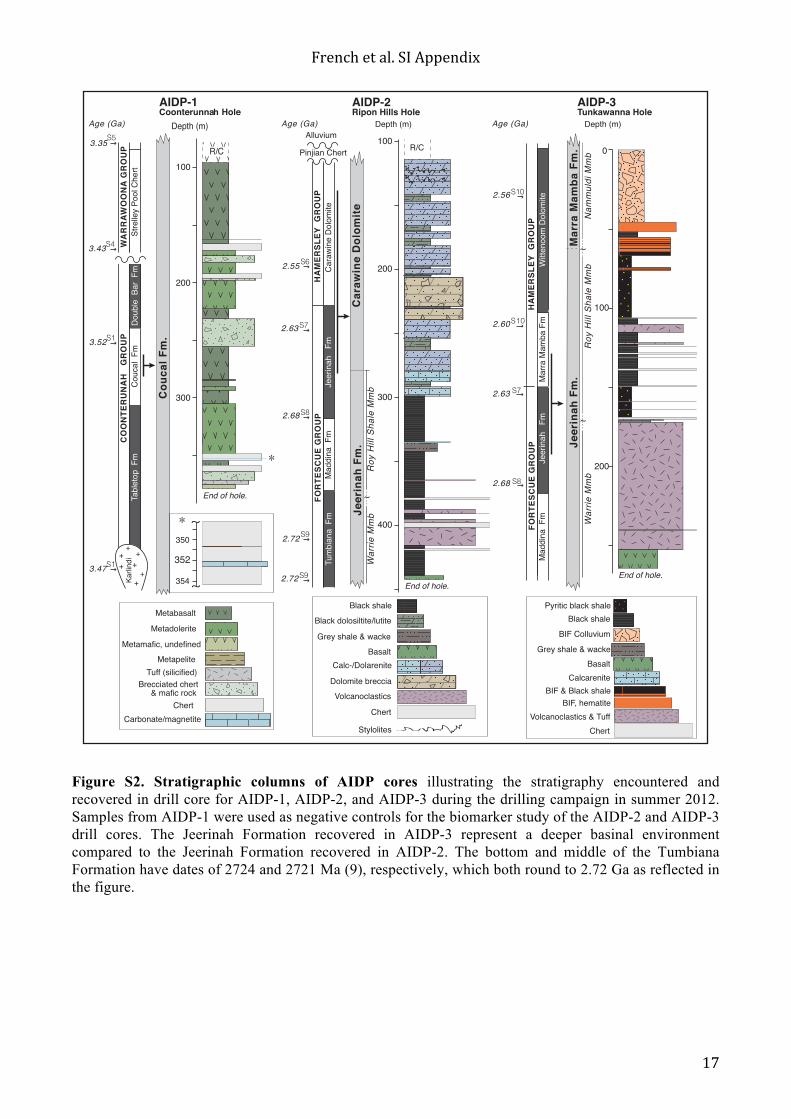
Figure S2. Stratigraphic columns of AIDP cores illustrating the stratigraphy encountered and recovered in drill core for AIDP-1, AIDP-2, and AIDP-3 during the drilling campaign in summer 2012. Samples from AIDP-1 were used as negative controls for the biomarker study of the AIDP-2 and AIDP-3 drill cores. The Jeerinah Formation recovered in AIDP-3 represent a deeper basinal environment compared to the Jeerinah Formation recovered in AIDP-2. The bottom and middle of the Tumbiana Formation have dates of 2724 and 2721 Ma (9), respectively, which both round to 2.72 Ga as reflected in the figure.
AIDP-3Tunkawanna Hole
0
100
200
Jeer
inah
Fm
.
BIF, hematite
FORT
ESCU
E GR
OUP
HAM
ERSL
EY G
ROUP
Witte
noom
Dolo
mite
Mar
ra M
amba
Fm
Jeer
inah
Fm
Mad
dina
Fm
Nam
mul
di M
mb
Mar
ra M
amba
Fm
.
2.60 S10
2.56 S10
2.68 S8
2.63 S7
Roy
Hill
Shal
e M
mb
Black shale
AIDP-1Coonterunna Holeh
Age (Ga)
Couc
al F
m.
+
Karlin
di
+ ++ +
++
COON
TERU
NAH
GRO
UPDo
uble
Bar
Fm
Couc
al F
mTa
bleto
p F
mW
ARRA
WOO
NA G
ROUP
Stre
lley P
ool C
hert
3.43 S4
3.52 S1
3.47 S1
100
200
300
~350
~
352
354
End of hole.
MetabasaltMetadolerite
Chert
Tuff (silicified)Brecciated chert
& mafic rock
Metapelite
Carbonate/magnetite
Metamafic, undefined
Depth (m)
R/C
AIDP-2Ripon Hills Hole
100
200
300
400
Cara
wine
Dol
omite
Jeer
inah
Fm
.Ro
y Hi
ll Sh
ale
Mm
bW
arrie
Mm
b
FORT
ESCU
E GR
OUP
HAM
ERSL
EY G
ROUP
Pinjian Chert
Cara
wine
Dolo
mite
Je
erina
h F
mM
addin
a F
m2.63 S7
Alluvium
Tum
biana
Fm
~
End of hole.
Calc-/Dolarenite
Grey shale & wacke
Chert
Black shale
Dolomite breccia
Stylolites
Black dolosiltite/lutite
Basalt
Volcanoclastics
2.68 S8
2.72 S9
2.72 S9
2.55 S6
Age (Ga) Age (Ga)
BIF Colluvium
Pyritic black shale
ChertVolcanoclastics & Tuff
Basalt
BIF & Black shaleCalcarenite
Grey shale & wacke
End of hole.W
arrie
Mm
b
~
~
3.35 S5
Depth (m) Depth (m)
R/C
End of hole.

French et al. SI Appendix
18
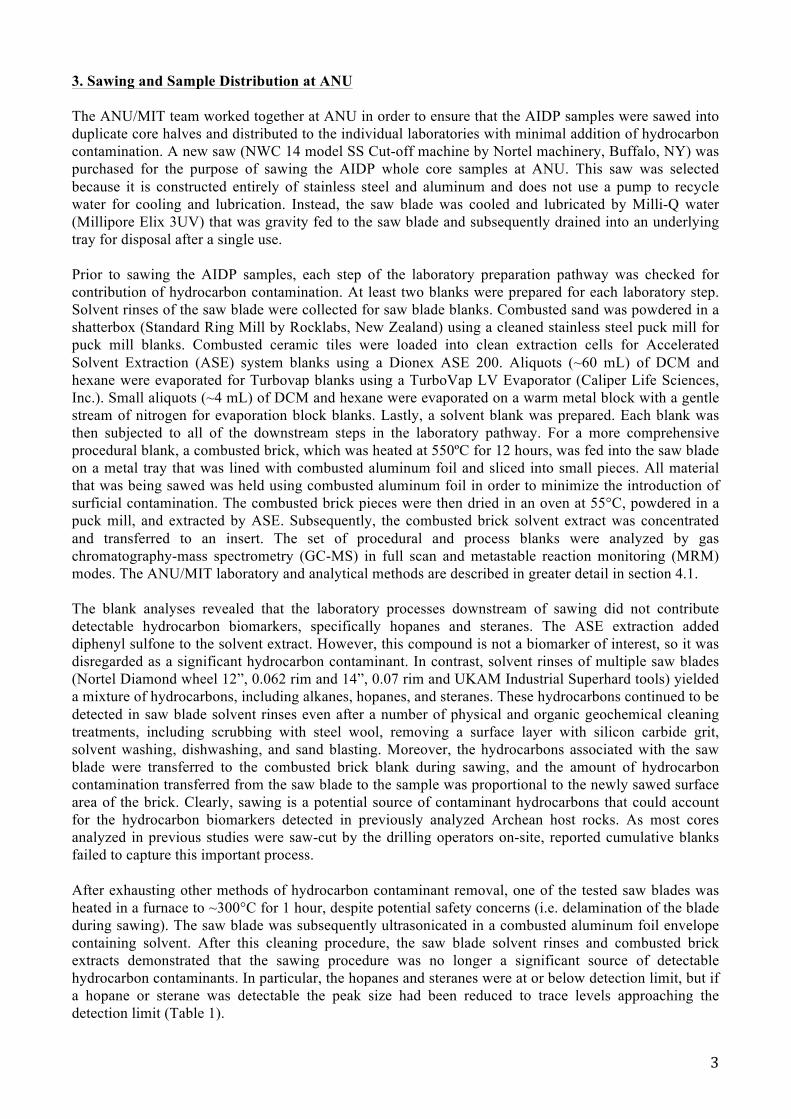
Figure S3. Photograph of Stylocumulates in the upper Carawine Dolomite of AIDP 2. The samples photographed in the core tray are from 130.75-133.67 m. Red bars to the right of the core mark examples of the dark, cm-scale stylocumulates within the surrounding dolarenite. Photograph courtesy of Moutusi Roy (ASU).
French et al. SI Appendix
19
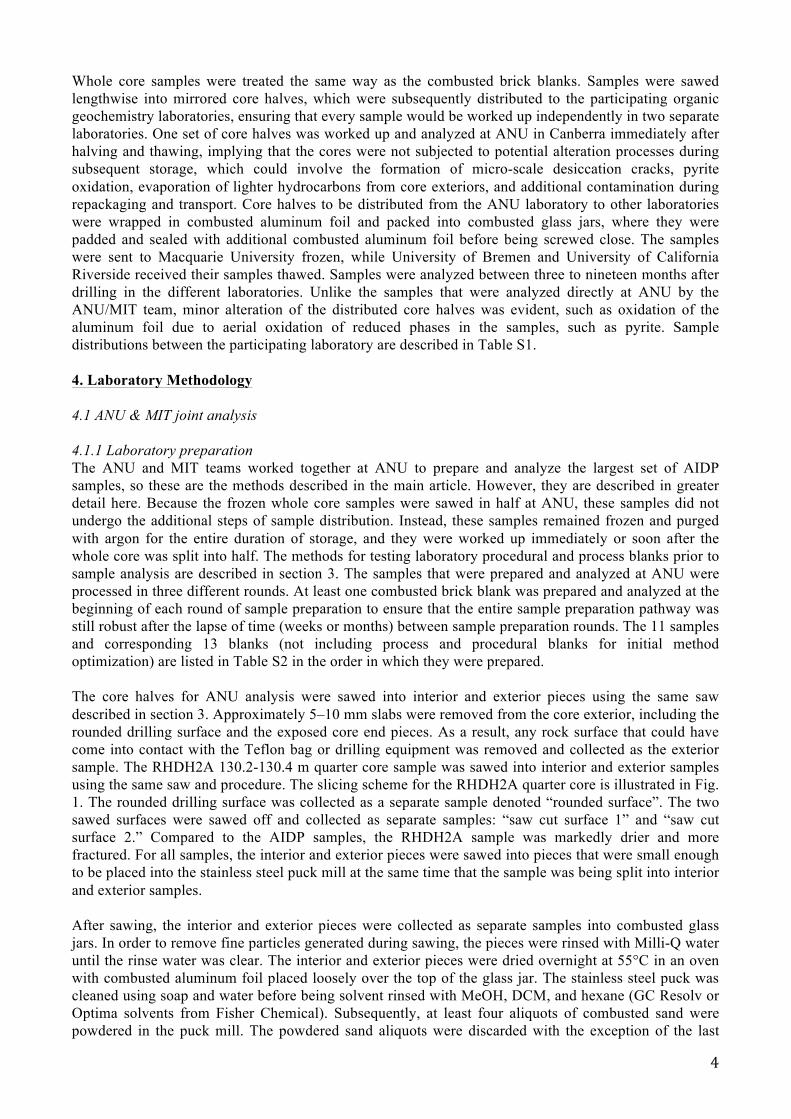
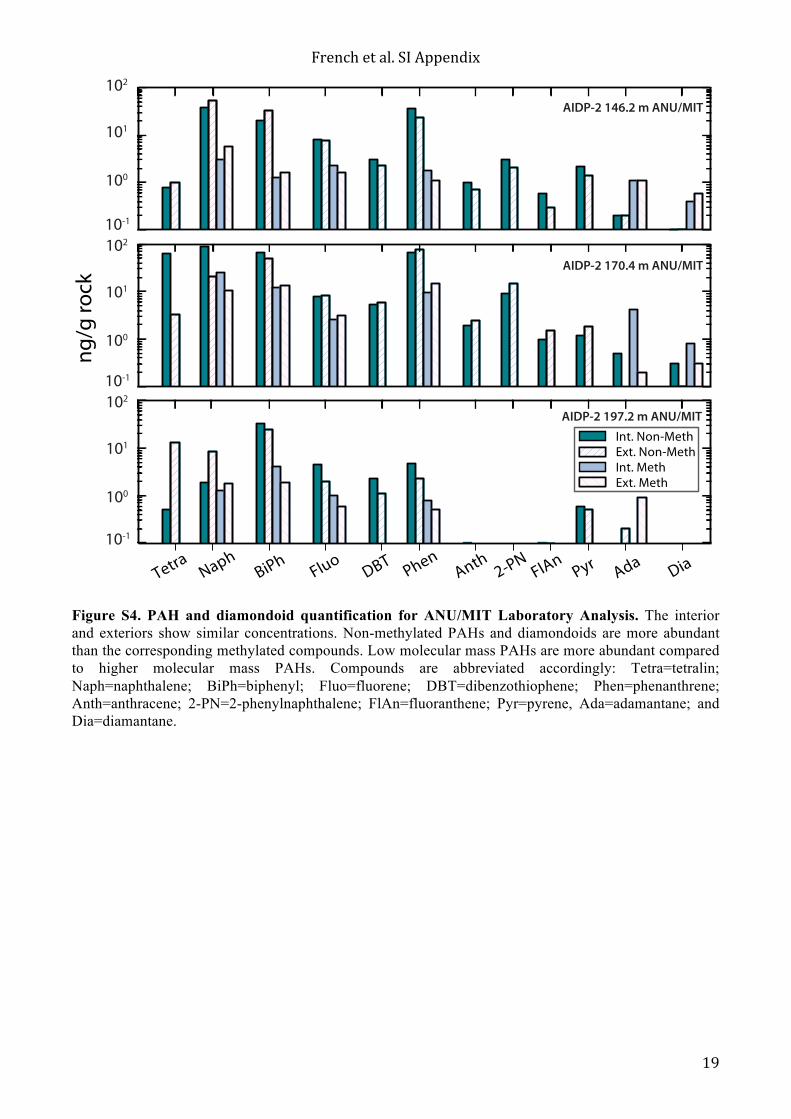
Figure S4. PAH and diamondoid quantification for ANU/MIT Laboratory Analysis. The interior and exteriors show similar concentrations. Non-methylated PAHs and diamondoids are more abundant than the corresponding methylated compounds. Low molecular mass PAHs are more abundant compared to higher molecular mass PAHs. Compounds are abbreviated accordingly: Tetra=tetralin; Naph=naphthalene; BiPh=biphenyl; Fluo=fluorene; DBT=dibenzothiophene; Phen=phenanthrene; Anth=anthracene; 2-PN=2-phenylnaphthalene; FlAn=fluoranthene; Pyr=pyrene, Ada=adamantane; and Dia=diamantane.
102
101
100
10-1
102
101
100
10-1
102
101
100
10-1
Tetra NaphBiPh
FluoDBT Phen
Anth 2-PNFlAn
Pyr Ada Dia
AIDP-2 146.2 m ANU/MIT
AIDP-2 170.4 m ANU/MIT
AIDP-2 197.2 m ANU/MITInt. Non-MethExt. Non-MethInt. MethExt. Meth
ng/g
rock
French et al. SI Appendix
20
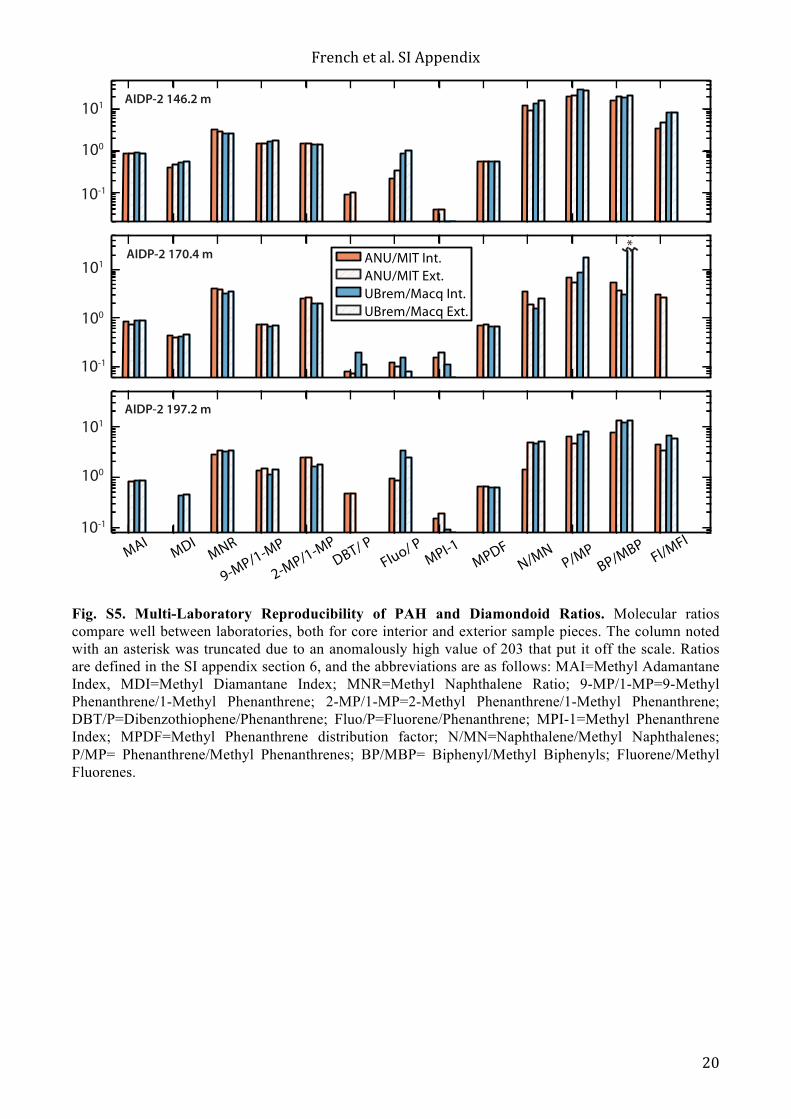
Fig. S5. Multi-Laboratory Reproducibility of PAH and Diamondoid Ratios. Molecular ratios compare well between laboratories, both for core interior and exterior sample pieces. The column noted with an asterisk was truncated due to an anomalously high value of 203 that put it off the scale. Ratios are defined in the SI appendix section 6, and the abbreviations are as follows: MAI=Methyl Adamantane Index, MDI=Methyl Diamantane Index; MNR=Methyl Naphthalene Ratio; 9-MP/1-MP=9-Methyl Phenanthrene/1-Methyl Phenanthrene; 2-MP/1-MP=2-Methyl Phenanthrene/1-Methyl Phenanthrene; DBT/P=Dibenzothiophene/Phenanthrene; Fluo/P=Fluorene/Phenanthrene; MPI-1=Methyl Phenanthrene Index; MPDF=Methyl Phenanthrene distribution factor; N/MN=Naphthalene/Methyl Naphthalenes; P/MP= Phenanthrene/Methyl Phenanthrenes; BP/MBP= Biphenyl/Methyl Biphenyls; Fluorene/Methyl Fluorenes.
MAIMDI
MNR
9-MP/1-MP
2-MP/1-MPDBT/ P
Fluo/ PMPI-1
MPDFN/MN
P/MPBP/MBP
Fl/MFl
ANU/MIT Int.ANU/MIT Ext.UBrem/Macq Int.UBrem/Macq Ext.
101
100
10-1
101
100
10-1
101
100
10-1
*
AIDP-2 146.2 m
AIDP-2 170.4 m
AIDP-2 197.2 m
French et al. SI Appendix
21
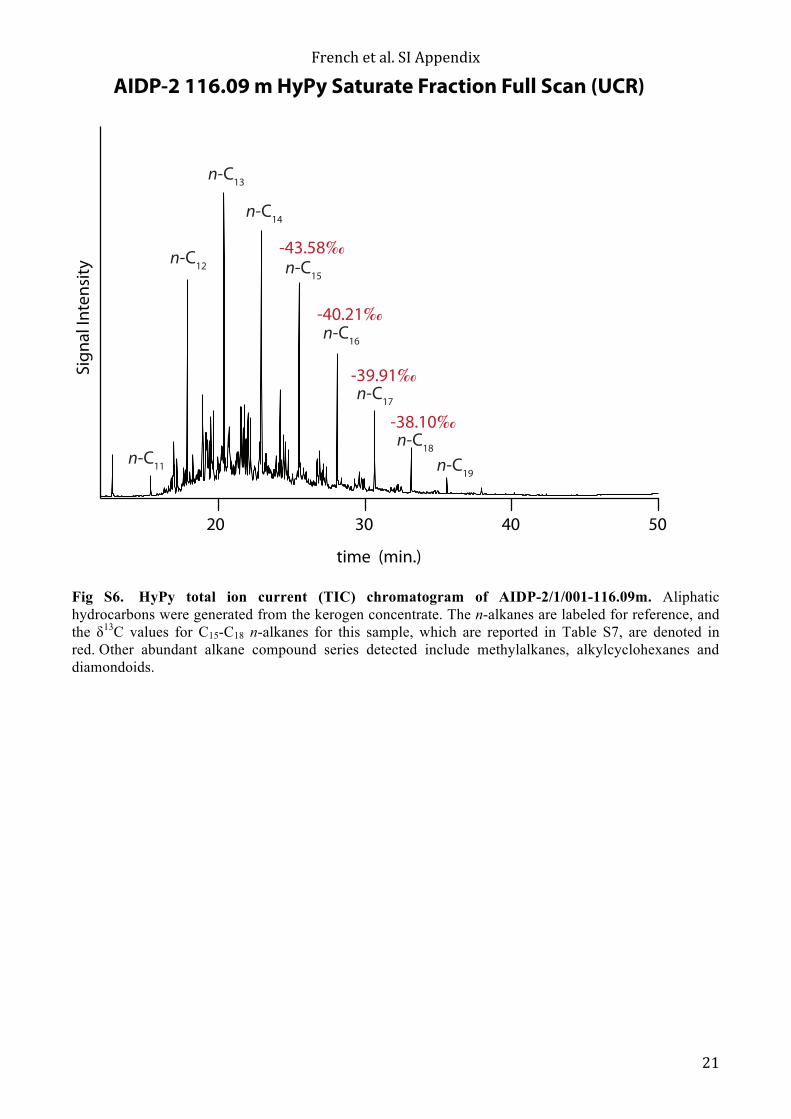
Fig S6. HyPy total ion current (TIC) chromatogram of AIDP-2/1/001-116.09m. Aliphatic hydrocarbons were generated from the kerogen concentrate. The n-alkanes are labeled for reference, and the δ13C values for C15-C18 n-alkanes for this sample, which are reported in Table S7, are denoted in red. Other abundant alkane compound series detected include methylalkanes, alkylcyclohexanes and diamondoids.
20 30 40 50
AIDP-2 116.09 m HyPy Saturate Fraction Full Scan (UCR)
time (min.)
Sign
al In
tens
ity
n-C13
n-C15
n-C17
n-C19
n-C12
n-C14
n-C16
n-C18n-C11
-43.58‰
-40.21‰
-39.91‰
-38.10‰

French et al. SI Appendix
22
Table S1. Sample descriptions and laboratory distribution
Sample ID Depth Hole Formation Lithology Extractable Biomarker Laboratory
Extractable Biomarker Laboratory
UCR HyPy
1/1/004 186.00 AIDP-1 Coucal Fm. Massive chlorite-plagioclase-actinolite metadolerite (negative control)
Macq. Uni
2/1/001 116.09 AIDP-2 Carawine Dolomite Fm.
Wavey-laminated grey-black fine-grained dolarenite with pyrobituminous stylolites
U. Bremen Yes
2/1/002 133.55 AIDP-2 Carawine Dolomite Fm.
Pyrobituminous stylocumulate ANU/U. Bremen
2/1/003 146.20 AIDP-2 Carawine Dolomite Fm.
Interlayered fine-grained dolarenite and black kerogenous dolosiltite
ANU/MIT Macq. Uni Yes
2/1/004 170.40 AIDP-2 Carawine Dolomite Fm.
Interlayered coarse- and fine-grained dolarenite ANU/MIT U. Bremen Yes
2/1/005 197.20 AIDP-2 Carawine Dolomite Fm.
Interlayered fine-grained dolarenite and black kerogenous dolosiltite
ANU/MIT Macq. Uni
2/1/007 291.28 AIDP-2 Jeerinah Fm. Plane-laminated black kerogenous marly mudstone with 1% disseminated pyrite
ANU/MIT Macq. Uni, U. Bremen
Yes
2/1/008 301.40 AIDP-2 Jeerinah Fm. Massive black kerogenous shale with 1% disseminated pyrite
ANU/MIT U. Bremen
2/1/010 322.82 AIDP-2 Jeerinah Fm. Massive black kerogenous shale with 5% pyrite nodules
U. Bremen Yes
2/1/011 327.42 AIDP-2 Jeerinah Fm. Massive black kerogenous shale with 5% pyrite nodules
ANU/MIT Macq. Uni Yes
2/1/012 325.48 AIDP-2 Jeerinah Fm. Massive black kerogenous shale with 5% pyrite nodules
ANU/MIT
2/1/014 349.00 AIDP-2 Jeerinah Fm. chert (negative control) U. Bremen 2/1/016 441.00 AIDP-2 Jeerinah Fm. Massive basalt with 1% amygdales (negative
control) ANU/MIT
3/1/004 98.36 AIDP-3 Jeerinah Fm. Massive black kerogenous mudstone and grey chert
ANU/MIT Yes
3/1/005 130.30 AIDP-3 Jeerinah Fm. Massive black kerogenous mudstone with 1% pyrite nodules
ANU/MIT Macq. Uni Yes
French et al. SI Appendix
23
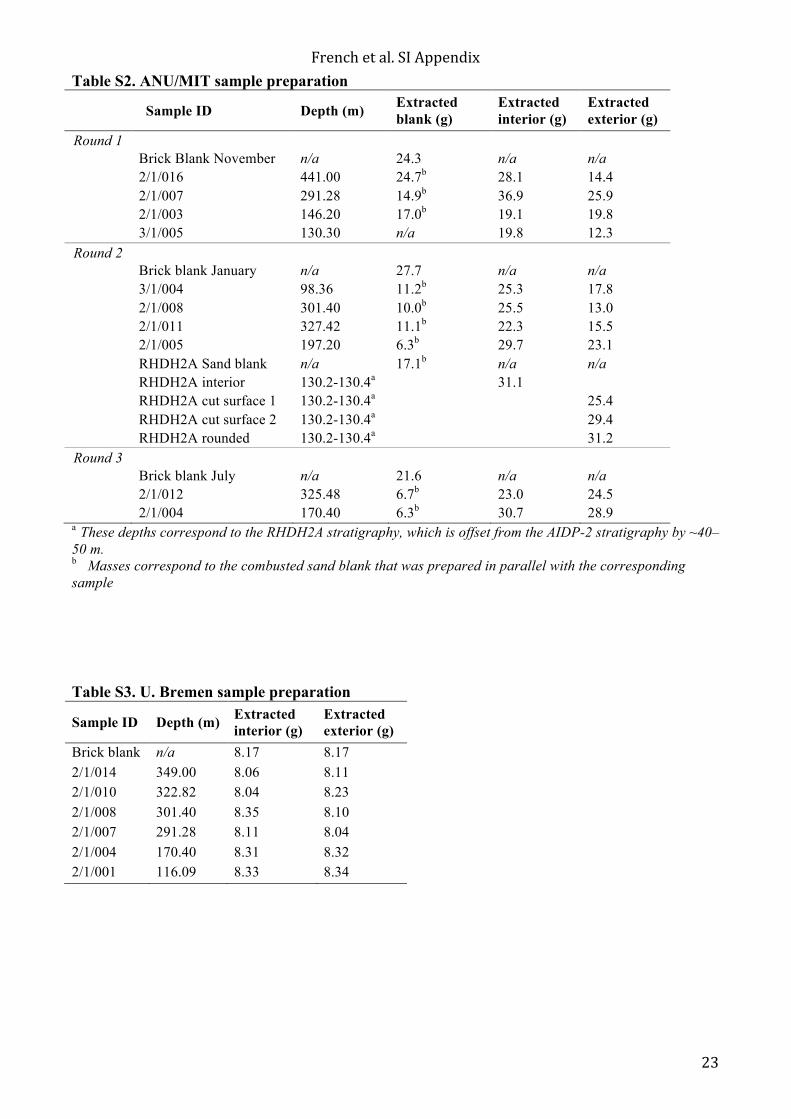
Table S2. ANU/MIT sample preparation
Sample ID Depth (m) Extracted blank (g)
Extracted interior (g)
Extracted exterior (g)
Round 1 Brick Blank November n/a 24.3 n/a n/a 2/1/016 441.00 24.7b 28.1 14.4 2/1/007 291.28 14.9b 36.9 25.9 2/1/003 146.20 17.0b 19.1 19.8 3/1/005 130.30 n/a 19.8 12.3
Round 2 Brick blank January n/a 27.7 n/a n/a 3/1/004 98.36 11.2b 25.3 17.8 2/1/008 301.40 10.0b 25.5 13.0 2/1/011 327.42 11.1b 22.3 15.5 2/1/005 197.20 6.3b 29.7 23.1 RHDH2A Sand blank n/a 17.1b n/a n/a RHDH2A interior 130.2-130.4a 31.1 RHDH2A cut surface 1 130.2-130.4a 25.4 RHDH2A cut surface 2 130.2-130.4a 29.4 RHDH2A rounded 130.2-130.4a 31.2 Round 3 Brick blank July n/a 21.6 n/a n/a 2/1/012 325.48 6.7b 23.0 24.5 2/1/004 170.40 6.3b 30.7 28.9 a These depths correspond to the RHDH2A stratigraphy, which is offset from the AIDP-2 stratigraphy by ~40–50 m. b Masses correspond to the combusted sand blank that was prepared in parallel with the corresponding sample Table S3. U. Bremen sample preparation
Sample ID Depth (m) Extracted interior (g)
Extracted exterior (g)
Brick blank n/a 8.17 8.17 2/1/014 349.00 8.06 8.11 2/1/010 322.82 8.04 8.23 2/1/008 301.40 8.35 8.10 2/1/007 291.28 8.11 8.04 2/1/004 170.40 8.31 8.32 2/1/001 116.09 8.33 8.34
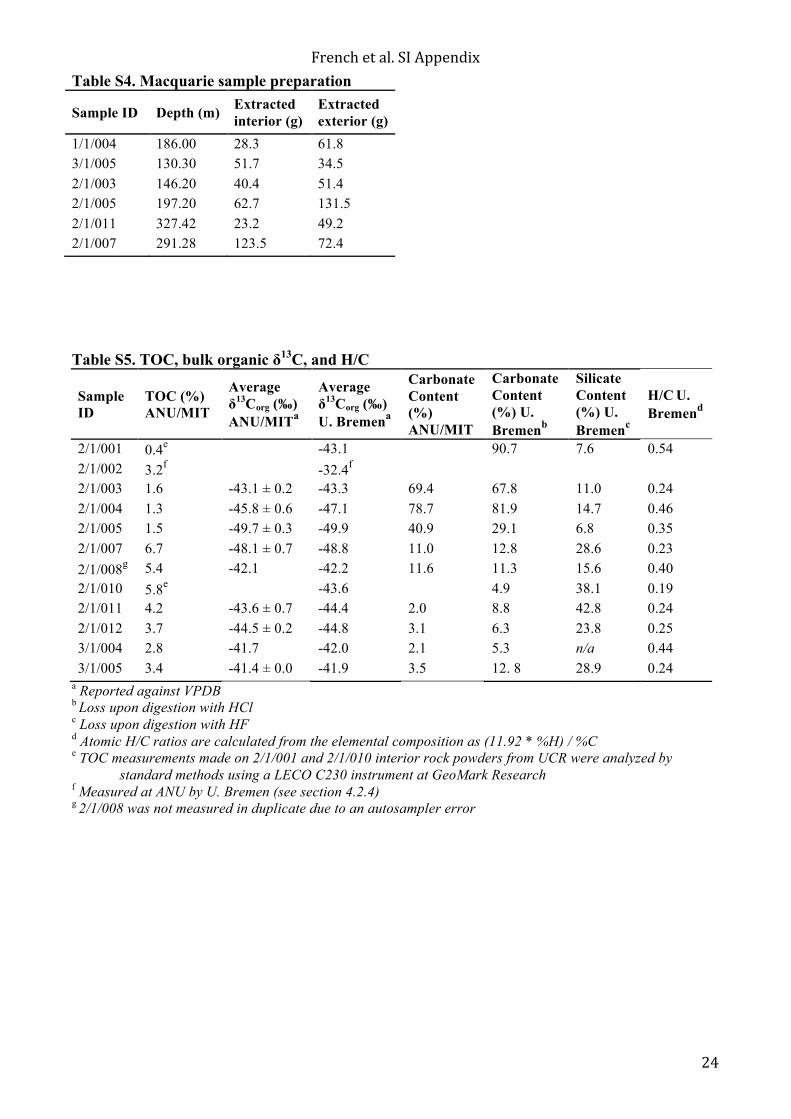
French et al. SI Appendix
24
Table S4. Macquarie sample preparation
Sample ID Depth (m) Extracted interior (g)
Extracted exterior (g)
1/1/004 186.00 28.3 61.8 3/1/005 130.30 51.7 34.5 2/1/003 146.20 40.4 51.4 2/1/005 197.20 62.7 131.5 2/1/011 327.42 23.2 49.2 2/1/007 291.28 123.5 72.4
Table S5. TOC, bulk organic δ13C, and H/C
Sample ID
TOC (%) ANU/MIT
Average δ13Corg (‰) ANU/MITa
Average δ13Corg (‰) U. Bremena
Carbonate Content (%) ANU/MIT
Carbonate Content (%) U. Bremenb
Silicate Content (%) U. Bremenc
H/C U. Bremend
2/1/001 0.4e -43.1 90.7 7.6 0.54 2/1/002 3.2f -32.4f 2/1/003 1.6 -43.1 ± 0.2 -43.3 69.4 67.8 11.0 0.24 2/1/004 1.3 -45.8 ± 0.6 -47.1 78.7 81.9 14.7 0.46 2/1/005 1.5 -49.7 ± 0.3 -49.9 40.9 29.1 6.8 0.35 2/1/007 6.7 -48.1 ± 0.7 -48.8 11.0 12.8 28.6 0.23 2/1/008g 5.4 -42.1 -42.2 11.6 11.3 15.6 0.40 2/1/010 5.8e -43.6 4.9 38.1 0.19 2/1/011 4.2 -43.6 ± 0.7 -44.4 2.0 8.8 42.8 0.24 2/1/012 3.7 -44.5 ± 0.2 -44.8 3.1 6.3 23.8 0.25 3/1/004 2.8 -41.7 -42.0 2.1 5.3 n/a 0.44 3/1/005 3.4 -41.4 ± 0.0 -41.9 3.5 12. 8 28.9 0.24
a Reported against VPDB b Loss upon digestion with HCl c Loss upon digestion with HF d Atomic H/C ratios are calculated from the elemental composition as (11.92 * %H) / %C e TOC measurements made on 2/1/001 and 2/1/010 interior rock powders from UCR were analyzed by
standard methods using a LECO C230 instrument at GeoMark Research f Measured at ANU by U. Bremen (see section 4.2.4) g 2/1/008 was not measured in duplicate due to an autosampler error
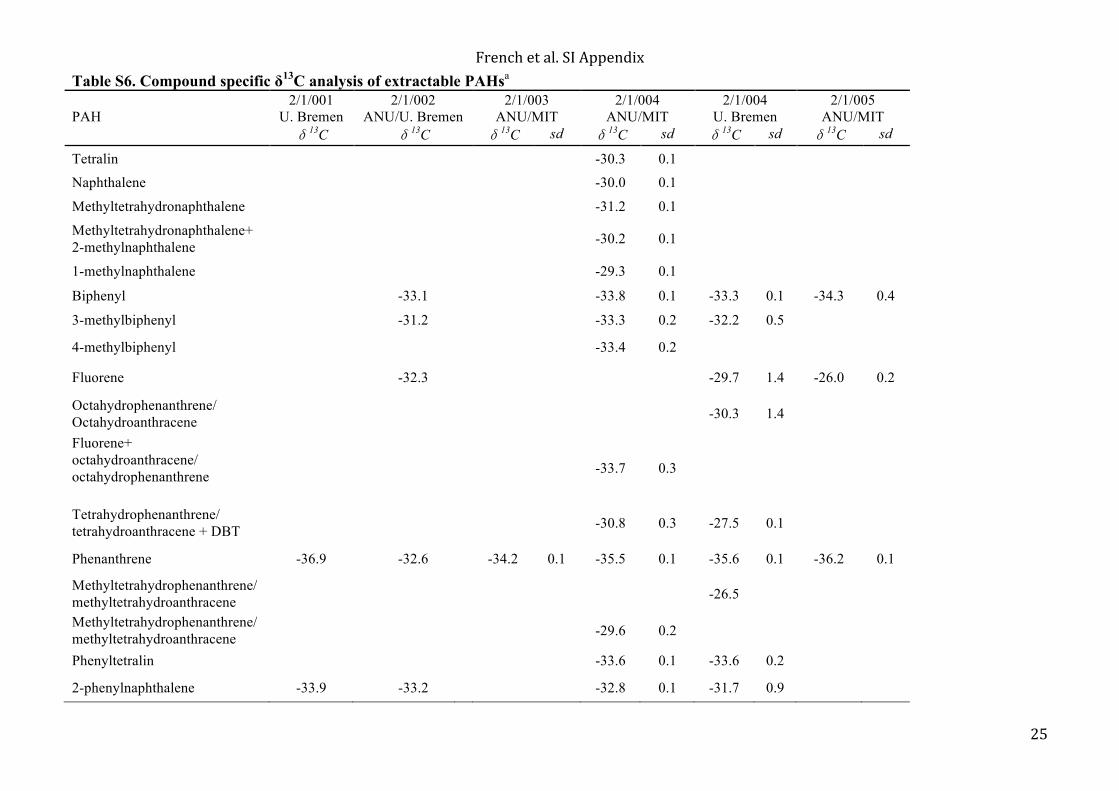
French et al. SI Appendix
25
Table S6. Compound specific δ13C analysis of extractable PAHsa
PAH
2/1/001 U. Bremen
2/1/002 ANU/U. Bremen
2/1/003 ANU/MIT
2/1/004 ANU/MIT
2/1/004 U. Bremen
2/1/005 ANU/MIT
δ13C δ13C δ13C sd δ13C sd δ13C sd δ13C sd
Tetralin -30.3 0.1
Naphthalene -30.0 0.1
Methyltetrahydronaphthalene -31.2 0.1
Methyltetrahydronaphthalene+ 2-methylnaphthalene -30.2 0.1
1-methylnaphthalene -29.3 0.1
Biphenyl -33.1 -33.8 0.1 -33.3 0.1 -34.3 0.4
3-methylbiphenyl -31.2 -33.3 0.2 -32.2 0.5
4-methylbiphenyl -33.4 0.2
Fluorene -32.3 -29.7 1.4 -26.0 0.2
Octahydrophenanthrene/ Octahydroanthracene -30.3 1.4
Fluorene+ octahydroanthracene/ octahydrophenanthrene
-33.7 0.3
Tetrahydrophenanthrene/ tetrahydroanthracene + DBT -30.8 0.3 -27.5 0.1
Phenanthrene -36.9 -32.6 -34.2 0.1 -35.5 0.1 -35.6 0.1 -36.2 0.1
Methyltetrahydrophenanthrene/methyltetrahydroanthracene -26.5
Methyltetrahydrophenanthrene/methyltetrahydroanthracene -29.6 0.2
Phenyltetralin -33.6 0.1 -33.6 0.2
2-phenylnaphthalene -33.9 -33.2 -32.8 0.1 -31.7 0.9
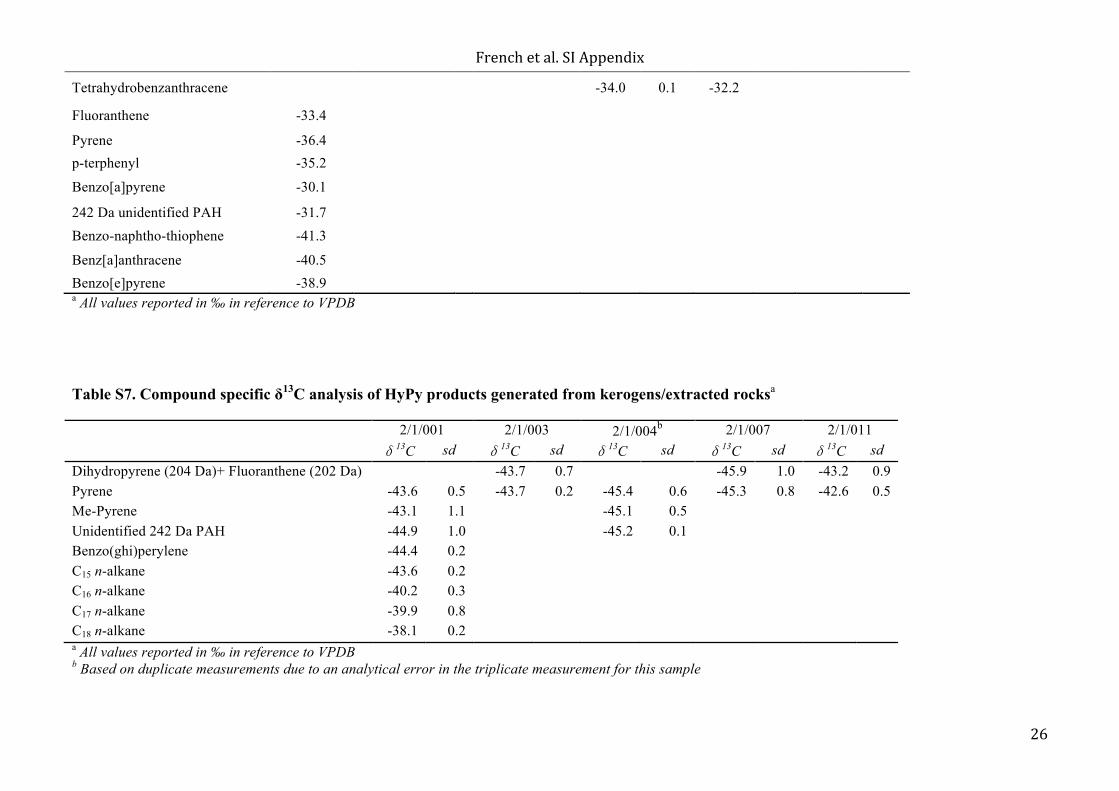
French et al. SI Appendix
26
Tetrahydrobenzanthracene -34.0 0.1 -32.2
Fluoranthene -33.4
Pyrene -36.4 p-terphenyl -35.2
Benzo[a]pyrene -30.1
242 Da unidentified PAH -31.7 Benzo-naphtho-thiophene -41.3
Benz[a]anthracene -40.5 Benzo[e]pyrene -38.9 a All values reported in ‰ in reference to VPDB Table S7. Compound specific δ13C analysis of HyPy products generated from kerogens/extracted rocksa
2/1/001 2/1/003 2/1/004b 2/1/007 2/1/011 δ13C sd δ13C sd δ13C sd δ13C sd δ13C sd Dihydropyrene (204 Da)+ Fluoranthene (202 Da) -43.7 0.7 -45.9 1.0 -43.2 0.9 Pyrene -43.6 0.5 -43.7 0.2 -45.4 0.6 -45.3 0.8 -42.6 0.5 Me-Pyrene -43.1 1.1 -45.1 0.5 Unidentified 242 Da PAH -44.9 1.0 -45.2 0.1 Benzo(ghi)perylene -44.4 0.2 C15 n-alkane -43.6 0.2 C16 n-alkane -40.2 0.3 C17 n-alkane -39.9 0.8 C18 n-alkane -38.1 0.2 a All values reported in ‰ in reference to VPDB b Based on duplicate measurements due to an analytical error in the triplicate measurement for this sample
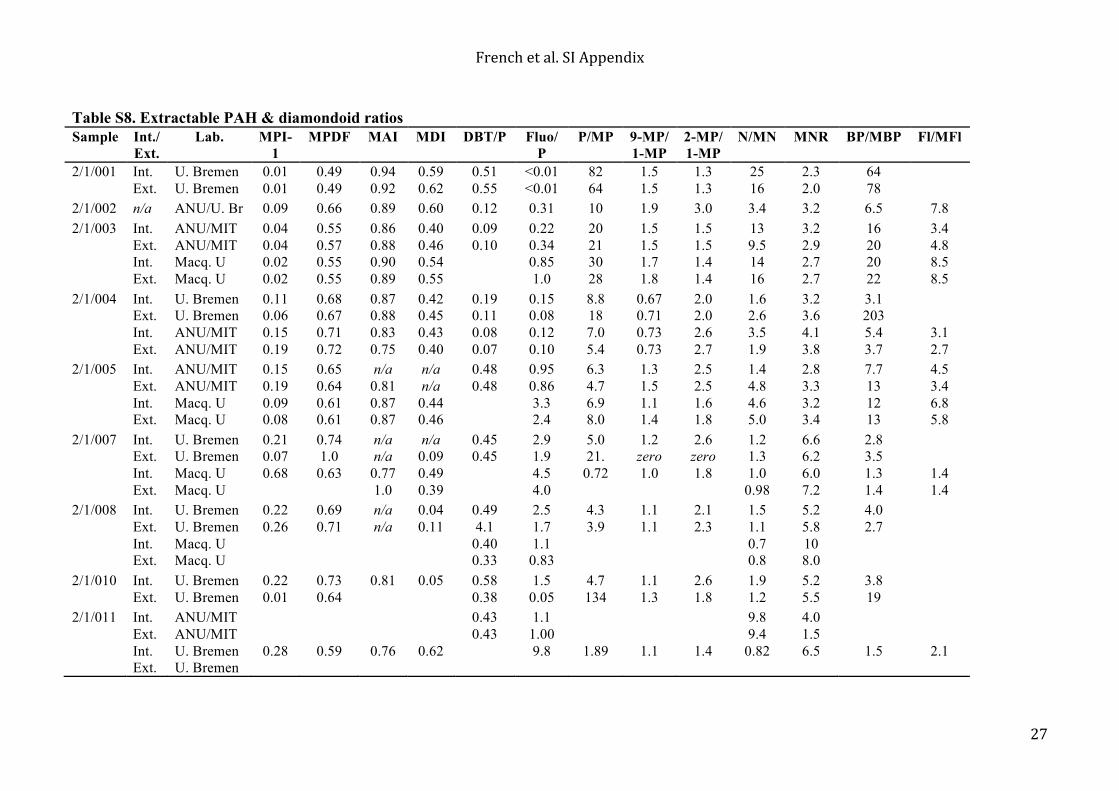
French et al. SI Appendix
27
Table S8. Extractable PAH & diamondoid ratios Sample Int./
Ext. Lab. MPI-
1 MPDF MAI MDI DBT/P Fluo/
P P/MP 9-MP/
1-MP 2-MP/ 1-MP
N/MN MNR BP/MBP Fl/MFl
2/1/001 Int. U. Bremen 0.01 0.49 0.94 0.59 0.51 <0.01 82 1.5 1.3 25 2.3 64 Ext. U. Bremen 0.01 0.49 0.92 0.62 0.55 <0.01 64 1.5 1.3 16 2.0 78 2/1/002 n/a ANU/U. Br 0.09 0.66 0.89 0.60 0.12 0.31 10 1.9 3.0 3.4 3.2 6.5 7.8 2/1/003 Int. ANU/MIT 0.04 0.55 0.86 0.40 0.09 0.22 20 1.5 1.5 13 3.2 16 3.4 Ext. ANU/MIT 0.04 0.57 0.88 0.46 0.10 0.34 21 1.5 1.5 9.5 2.9 20 4.8 Int. Macq. U 0.02 0.55 0.90 0.54 0.85 30 1.7 1.4 14 2.7 20 8.5 Ext. Macq. U 0.02 0.55 0.89 0.55 1.0 28 1.8 1.4 16 2.7 22 8.5 2/1/004 Int. U. Bremen 0.11 0.68 0.87 0.42 0.19 0.15 8.8 0.67 2.0 1.6 3.2 3.1 Ext. U. Bremen 0.06 0.67 0.88 0.45 0.11 0.08 18 0.71 2.0 2.6 3.6 203 Int. ANU/MIT 0.15 0.71 0.83 0.43 0.08 0.12 7.0 0.73 2.6 3.5 4.1 5.4 3.1 Ext. ANU/MIT 0.19 0.72 0.75 0.40 0.07 0.10 5.4 0.73 2.7 1.9 3.8 3.7 2.7 2/1/005 Int. ANU/MIT 0.15 0.65 n/a n/a 0.48 0.95 6.3 1.3 2.5 1.4 2.8 7.7 4.5 Ext. ANU/MIT 0.19 0.64 0.81 n/a 0.48 0.86 4.7 1.5 2.5 4.8 3.3 13 3.4 Int. Macq. U 0.09 0.61 0.87 0.44 3.3 6.9 1.1 1.6 4.6 3.2 12 6.8 Ext. Macq. U 0.08 0.61 0.87 0.46 2.4 8.0 1.4 1.8 5.0 3.4 13 5.8 2/1/007 Int. U. Bremen 0.21 0.74 n/a n/a 0.45 2.9 5.0 1.2 2.6 1.2 6.6 2.8 Ext. U. Bremen 0.07 1.0 n/a 0.09 0.45 1.9 21. zero zero 1.3 6.2 3.5 Int. Macq. U 0.68 0.63 0.77 0.49 4.5 0.72 1.0 1.8 1.0 6.0 1.3 1.4 Ext. Macq. U 1.0 0.39 4.0 0.98 7.2 1.4 1.4 2/1/008 Int. U. Bremen 0.22 0.69 n/a 0.04 0.49 2.5 4.3 1.1 2.1 1.5 5.2 4.0 Ext. U. Bremen 0.26 0.71 n/a 0.11 4.1 1.7 3.9 1.1 2.3 1.1 5.8 2.7 Int. Macq. U 0.40 1.1 0.7 10 Ext. Macq. U 0.33 0.83 0.8 8.0 2/1/010 Int. U. Bremen 0.22 0.73 0.81 0.05 0.58 1.5 4.7 1.1 2.6 1.9 5.2 3.8 Ext. U. Bremen 0.01 0.64 0.38 0.05 134 1.3 1.8 1.2 5.5 19 2/1/011 Int. ANU/MIT 0.43 1.1 9.8 4.0 Ext. ANU/MIT 0.43 1.00 9.4 1.5 Int. U. Bremen 0.28 0.59 0.76 0.62 9.8 1.89 1.1 1.4 0.82 6.5 1.5 2.1 Ext. U. Bremen
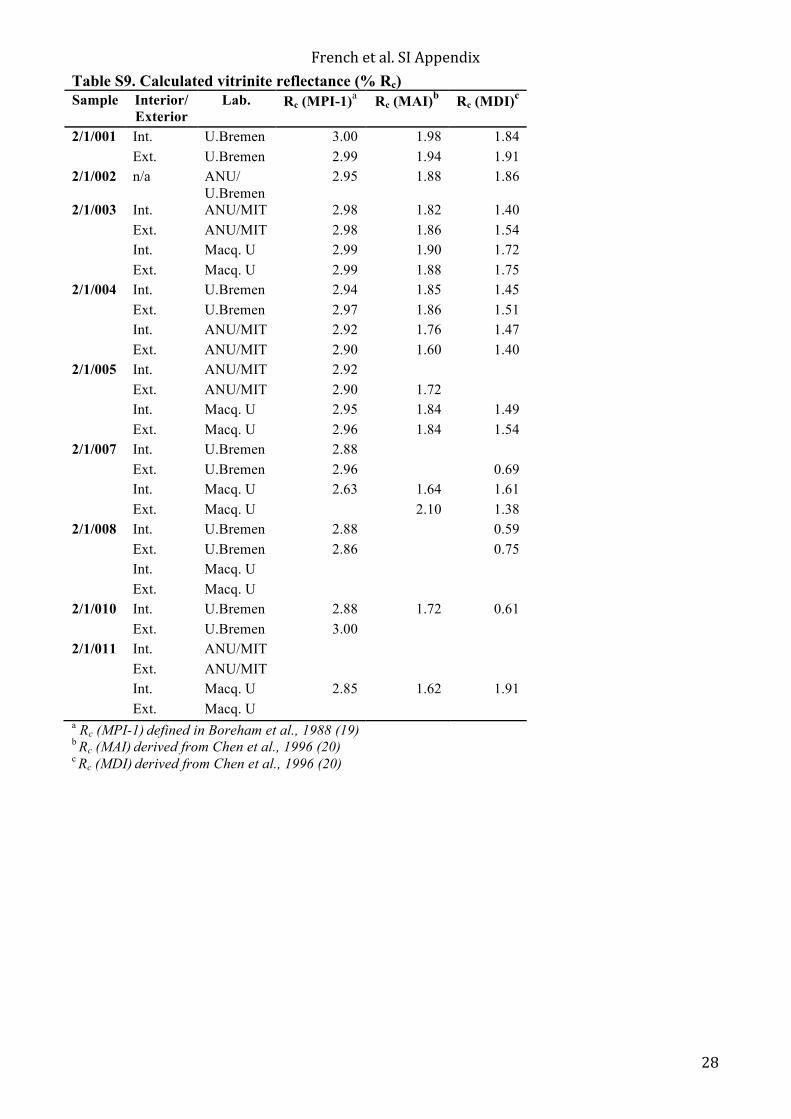
French et al. SI Appendix
28
Table S9. Calculated vitrinite reflectance (% Rc) Sample Interior/
Exterior Lab. Rc (MPI-1)a Rc (MAI)b Rc (MDI)c
2/1/001 Int. U.Bremen 3.00 1.98 1.84 Ext. U.Bremen 2.99 1.94 1.91 2/1/002 n/a ANU/
U.Bremen 2.95 1.88 1.86
2/1/003 Int. ANU/MIT 2.98 1.82 1.40 Ext. ANU/MIT 2.98 1.86 1.54 Int. Macq. U 2.99 1.90 1.72 Ext. Macq. U 2.99 1.88 1.75 2/1/004 Int. U.Bremen 2.94 1.85 1.45 Ext. U.Bremen 2.97 1.86 1.51 Int. ANU/MIT 2.92 1.76 1.47 Ext. ANU/MIT 2.90 1.60 1.40 2/1/005 Int. ANU/MIT 2.92 Ext. ANU/MIT 2.90 1.72 Int. Macq. U 2.95 1.84 1.49 Ext. Macq. U 2.96 1.84 1.54 2/1/007 Int. U.Bremen 2.88 Ext. U.Bremen 2.96 0.69 Int. Macq. U 2.63 1.64 1.61 Ext. Macq. U 2.10 1.38 2/1/008 Int. U.Bremen 2.88 0.59 Ext. U.Bremen 2.86 0.75 Int. Macq. U Ext. Macq. U 2/1/010 Int. U.Bremen 2.88 1.72 0.61 Ext. U.Bremen 3.00 2/1/011 Int. ANU/MIT Ext. ANU/MIT Int. Macq. U 2.85 1.62 1.91 Ext. Macq. U a Rc (MPI-1) defined in Boreham et al., 1988 (19) b Rc (MAI) derived from Chen et al., 1996 (20) c Rc (MDI) derived from Chen et al., 1996 (20)
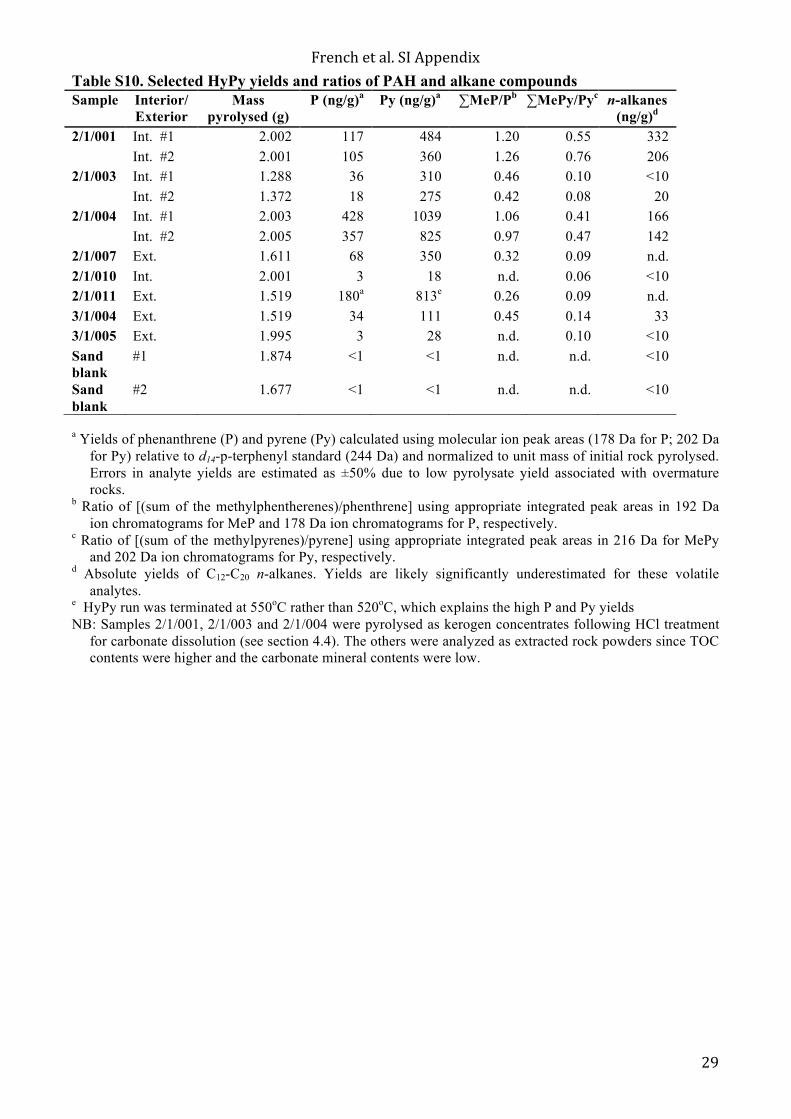
French et al. SI Appendix
29
Table S10. Selected HyPy yields and ratios of PAH and alkane compounds Sample Interior/
Exterior Mass
pyrolysed (g) P (ng/g)a Py (ng/g)a ∑MeP/Pb ∑MePy/Pyc n-alkanes
(ng/g)d
2/1/001 Int. #1 2.002 117 484 1.20 0.55 332 Int. #2 2.001 105 360 1.26 0.76 206 2/1/003 Int. #1 1.288 36 310 0.46 0.10 <10 Int. #2 1.372 18 275 0.42 0.08 20 2/1/004 Int. #1 2.003 428 1039 1.06 0.41 166 Int. #2 2.005 357 825 0.97 0.47 142 2/1/007 Ext. 1.611 68 350 0.32 0.09 n.d. 2/1/010 Int. 2.001 3 18 n.d. 0.06 <10 2/1/011 Ext. 1.519 180a 813e 0.26 0.09 n.d. 3/1/004 Ext. 1.519 34 111 0.45 0.14 33 3/1/005 Ext. 1.995 3 28 n.d. 0.10 <10 Sand blank
#1 1.874 <1 <1 n.d. n.d. <10
Sand blank
#2 1.677 <1 <1 n.d. n.d. <10
a Yields of phenanthrene (P) and pyrene (Py) calculated using molecular ion peak areas (178 Da for P; 202 Da
for Py) relative to d14-p-terphenyl standard (244 Da) and normalized to unit mass of initial rock pyrolysed. Errors in analyte yields are estimated as ±50% due to low pyrolysate yield associated with overmature rocks.
b Ratio of [(sum of the methylphentherenes)/phenthrene] using appropriate integrated peak areas in 192 Da ion chromatograms for MeP and 178 Da ion chromatograms for P, respectively.
c Ratio of [(sum of the methylpyrenes)/pyrene] using appropriate integrated peak areas in 216 Da for MePy and 202 Da ion chromatograms for Py, respectively.
d Absolute yields of C12-C20 n-alkanes. Yields are likely significantly underestimated for these volatile analytes.
e HyPy run was terminated at 550oC rather than 520oC, which explains the high P and Py yields NB: Samples 2/1/001, 2/1/003 and 2/1/004 were pyrolysed as kerogen concentrates following HCl treatment
for carbonate dissolution (see section 4.4). The others were analyzed as extracted rock powders since TOC contents were higher and the carbonate mineral contents were low.