Does managerial stock option compensation increase ... managerial stock option compensation increase...
47
Does managerial stock option compensation increase shareholder value in weak investor protection countries? Evidence from state-controlled Chinese firms listed in Hong Kong Zhihong Chen Department of Accountancy City University of Hong Kong Yuyan Guan Department of Accountancy City University of Hong Kong Bin Ke * Smeal College of Business Pennsylvania State University Abstract We test the effect of managerial stock option compensation on shareholder value for a sample of state-controlled Chinese firms that are incorporated outside China and traded on the Hong Kong Stock Exchange (referred to as state-controlled Red Chip firms) over 1991-2005. We find that like in the U.S., stock option compensation is widely used among state-controlled Red Chip firms, but the grant and exercise of stock options differ significantly between state-controlled Red Chip firms and U.S. firms. We examine whether state-controlled Red Chip firms’ adoption of stock option compensation can be explained by economic factors that are consistent with shareholder value maximization, is received positively by stock market investors, and results in improvement in future earnings performance. Our results suggest no evidence that state- controlled Red Chip firms’ stock option compensation increases shareholder value. Our results suggest caution in adopting stock option compensation in countries with weak investor protection. Key words: Stock option compensation; Hong Kong; China; state-controlled Red Chip firms JEL: D21, G32, J33, M40, N25 March 23, 2010 We wish to thank Kevin Chen, Gerry Lobo, T.J. Wong, and workshop participants at the City University of Hong Kong, Penn State University, Singapore Management University, Chinese University of Hong Kong, University of Hong Kong, and Hong Kong University of Science and Technology for helpful comments. We thank Mabel Wong at the Hong Kong Stock Exchange’s research library for assistance in data collection and JL Souza and Sixian Yang for able research assistance. Part of the research is supported by a grant from the Hong Kong Government’s Research Grant Council. * Send correspondence to Bin Ke, 316 Business Building, University Park, PA 16802, USA. Phone: 814-865-0572. Fax: 814-863-8393. Email: [email protected] .
Transcript of Does managerial stock option compensation increase ... managerial stock option compensation increase...

Does managerial stock option compensation increase shareholder value in weak investor protection countries? Evidence from state-controlled Chinese firms listed in Hong Kong
Zhihong Chen
Department of Accountancy City University of Hong Kong
Yuyan Guan
Department of Accountancy City University of Hong Kong
Bin Ke*
Smeal College of Business Pennsylvania State University
Abstract
We test the effect of managerial stock option compensation on shareholder value for a sample of state-controlled Chinese firms that are incorporated outside China and traded on the Hong Kong Stock Exchange (referred to as state-controlled Red Chip firms) over 1991-2005. We find that like in the U.S., stock option compensation is widely used among state-controlled Red Chip firms, but the grant and exercise of stock options differ significantly between state-controlled Red Chip firms and U.S. firms. We examine whether state-controlled Red Chip firms’ adoption of stock option compensation can be explained by economic factors that are consistent with shareholder value maximization, is received positively by stock market investors, and results in improvement in future earnings performance. Our results suggest no evidence that state-controlled Red Chip firms’ stock option compensation increases shareholder value. Our results suggest caution in adopting stock option compensation in countries with weak investor protection. Key words: Stock option compensation; Hong Kong; China; state-controlled Red Chip firms JEL: D21, G32, J33, M40, N25
March 23, 2010
We wish to thank Kevin Chen, Gerry Lobo, T.J. Wong, and workshop participants at the City University of Hong Kong, Penn State University, Singapore Management University, Chinese University of Hong Kong, University of Hong Kong, and Hong Kong University of Science and Technology for helpful comments. We thank Mabel Wong at the Hong Kong Stock Exchange’s research library for assistance in data collection and JL Souza and Sixian Yang for able research assistance. Part of the research is supported by a grant from the Hong Kong Government’s Research Grant Council. * Send correspondence to Bin Ke, 316 Business Building, University Park, PA 16802, USA. Phone: 814-865-0572. Fax: 814-863-8393. Email: [email protected].

1
1. Introduction
Equity-based compensation, especially stock option, is widely adopted in publicly traded
firms in the U.S. The use of equity-based compensation has also been on the rise in many other
countries. While there is a large literature that examines the causes and consequences of equity-
based compensation in U.S. firms,1 our knowledge on equity-based compensation in non-U.S.
countries is limited. The few studies that examine equity-based compensation outside the U.S.
primarily focus on developed countries with relatively strong investor protection, such as Canada
(Klassen et al., 2000; Southam and Sapp, 2009), Germany (Langmann, 2007), Finland (Ikaheimo
et al., 2004), Australia (Coulton and Taylor, 2002), United Kingdom (Conyon et al., 1995), and
Japan (Kato et al., 2005). There is little in-depth analysis of equity-based compensation in
countries with weak investor protection. One important reason for this lack of empirical research
is that detailed compensation data are generally not available in weak investor protection
countries (Hallock and Murphy, 1999).
The objective of this study is to fill in this gap in the literature by examining the effect of
managerial stock option compensation on shareholder value over 1991-2005 for a sample of
state-controlled Chinese firms that are incorporated outside China and listed on the Hong Kong
Stock Exchange (hereafter referred to as state-controlled Red Chip firms). We focus on state-
controlled Red Chip firms for several reasons. First, there are detailed disclosures on employee
stock option compensation mandated by Hong Kong securities regulators.
Second, state-controlled Red Chip firms are typically the backbones of their respective
industries in China. As of the end of 2005, the total market value of all the Red Chip firms (the
super majority of which are state-controlled) is 221.6 billion U.S. dollars, representing 52% of
the total market capitalization of mainland China’s domestic stock market and 37% of the market 1 See Murphy (1999) and Core et al. (2003) for reviews of this literature.

2
capitalization of Hong Kong’s Hang Seng stock index. Hence, understanding the efficacy of Red
Chip firms’ equity-based compensation is important not only to China but also to many other
countries that have a vested interest in China’s economic growth and stability.
Third, China is a representative of countries with weak investor protection (see Allen et
al., 2005) and therefore evidence on the effect of state-controlled Red Chip firms’ stock option
compensation on shareholder value should be of interest to many other countries with similar
investor protection problems.
Fourth, evidence on the efficacy of equity-based compensation in state-controlled Red
Chip firms is also relevant to the ongoing debate on the optimal approach to reforming state
owned enterprises (SOEs) in both China and other emerging economies. One major problem of
SOEs is low productivity resulting from the lack of managerial incentives to increase shareholder
value. One popular but radical solution to this agency problem is the complete privatization of
SOEs. However, the existing evidence on the effect of SOE privatization on firm performance
and economic efficiency in weak investor protection countries is mixed, suggesting that
privatization carries both benefits and costs.2 To the extent that equity-based compensation can
effectively align the interests between management and minority shareholders, the adoption of
equity-based compensation in state-controlled firms could be an effective alternative approach to
addressing the observed inefficiencies of SOEs while avoiding the costs associated with the full
privatization of SOEs.
There are two competing views on executive stock option compensation in the extant
literature. One dominant view (see, e.g., Core et al., 2003) is that stock option compensation
represents an effective mechanism to help align the interests between managers and shareholders
2 See Megginson and Netter (2001) and Estrin et al. (2009) for comprehensive reviews of the SOE privatization literature.

3
by increasing the sensitivity of managerial compensation to firm performance (referred to as the
efficient contracting view).3 Another competing view (see, e.g., Bebchuk and Fried, 2004) argues
that stock option compensation does not benefit minority shareholders because the design, grant
and exercise of stock options can be easily manipulated by opportunistic managers at the expense
of shareholder interests (referred to as the rent extraction view). The efficient contracting view
predicts a positive effect of managerial stock option compensation on shareholder value while
the rent extraction view predicts a zero or negative effect. While existing empirical studies on
U.S. firms’ stock option compensation generally support the efficient contracting view, the use
of equity-based compensation is still hotly debated even in the U.S. due to its alleged role in
many high profile accounting scandals (Bartov and Mohanam, 2004; Efendi et al., 2007; The
Economist, 2009) and the recent subprime financial crisis. To our knowledge, there is little
research on the effect of equity-based compensation on shareholder value in weak investor
protection countries.
We argue that the effect of stock option compensation on shareholder value in state-
controlled Red Chip firms is an empirical question. Because executives in state-controlled
Chinese firms are historically subject to little pay-for-performance sensitivity, appropriately
designed and executed stock option compensation should increase shareholder value by helping
align the interests between managers and minority shareholders. However, there are also reasons
to believe that stock option compensation has no or even a negative effect on shareholder value
in state-controlled Red Chip firms.
3 Consistent with the efficient contracting view, stock option compensation may also benefit shareholders in other ways, such as obtaining favorable financial reporting treatment (Matsunaga, 1995; Aboody, 1996; Aboody et al., 2004), helping reduce the combined income taxes of the company and its employees (Matsunaga, 1995; Yermack, 1995), helping sort and retain valuable employees (Oyer and Schaefer, 2005), and relaxing a firm’s financial constraints (Dechow et al., 1996; Core and Guay, 1999). We do not attempt to distinguish these alternative benefits from the incentive alignment benefit in this paper.

4
First, the controlling shareholder of state-controlled Red Chip firms (either the central
government or a provincial government) typically has non-shareholder value maximizing
objectives, such as maintaining the level of employment and social harmony (see, e.g., Yam,
2006; Cheng, 2007). High-powered managerial incentive compensation contracts such as stock
options would naturally encourage managers to take actions to improve the firm’s operating
efficiency (e.g., by laying off excess employees) and lead to greater pay variation among
company employees, increasing the risk of social unrest and undermining the power of the
Chinese Government. Hence, state-controlled Red Chip firms have an incentive to adopt low-
powered incentive compensation contracts. Even if they are pressured by stock market investors
to adopt high-powered incentive compensation contracts such as stock options, due to mainland
China’s weak investor protection (see Allen et al, 2005), state-controlled Red Chip firms can
always find alternative ways to water down the incentive effect of the high-powered incentive
compensation contracts. For example, there is anecdotal evidence suggesting that the actual take-
home pay by the top executives of many Hong Kong listed state-controlled Chinese firms is
much smaller than the pay disclosed in the annual reports (see Caijing online, June 27, 2008).
Mr. Chengyu Fu, the Chairman of CNOOC Limited, one prominent state-controlled Red Chip
firm, publicly admitted that his RMB12.047 million annual compensation (45% of which is stock
option compensation granted in the year) disclosed in the 2008 annual report was much higher
than his actual take-home pay (Asia Times online, April 28, 2009).4
Second, it is well recognized that corporate governance is weak and managers are
entrenched in most state-controlled Chinese firms. Therefore, managers could easily influence
4 According to an official from the State-owned Assets Supervision and Administration Commission (SASAC) of the State Council, which is in charge of determining the executive compensation of central government controlled Red Chip firms, an executive’s annual take-home pay in central government controlled firms has never exceeded RMB1.5 million yuan (Caijing, April 27, 2009).

5
the design of stock option compensation to their own advantage at the expense of minority
shareholder interests. Entrenched managers may also manipulate their firms’ investment,
financing, and reporting decisions in order to increase their personal gains from the stock option
compensation. Furthermore, because stock options are often regarded as a form of incentive
compensation, using stock option compensation as an expropriation device may attract less
unwanted attention than outright stealing of corporate resources. However, one countervailing
force that may help curb such managerial agency problems is that Red Chip firms are listed in
Hong Kong, which is rated one of the best financial markets in investor protection (La Porta et
al., 1998), and therefore perverse managerial behaviors could be significantly constrained by
Hong Kong regulators and market forces (e.g., institutional investors).
Third, state-controlled Red Chip firms typically operate in protected industries where
government policies matter more than managerial talent and efforts in determining firm
performance. Hence, stock option compensation, while costly to shareholders, may result in little
positive impact on firm performance. Worse, it may even induce perverse managerial behaviors
that reduce shareholder value.
We find that like in the U.S., stock option compensation is widely used among state-
controlled Red Chip firms. As of the end of 2005 (our last sample year), all of the state-
controlled Red Chip firms have adopted employee stock option schemes. However, there are
significant differences in the stock option grant practices between state-controlled Red Chip
firms and U.S. firms. Stock options were typically granted in the money prior to the 2001 Hong
Kong Stock Exchange’s (HKSE) regulatory change that banned in-the-money stock options. The
median option grant’s term is approximately 6 years versus 10 years in the U.S. The median
stock option vesting period is only half a year versus 2.5 years in the U.S. While the value of the
6
annual stock option grant to a Red Chip firm director is economically meaningful relative to her
annual cash pay, it is still much smaller than the value of annual stock option grant to a typical
U.S. firm executive.
Directors in state-controlled Red Chip firms rarely exercise their vested in-the-money
stock options and this effect is much stronger for directors from mainland China than for
directors from overseas. This result is in sharp contrast to the common early exercise of vested
in-the-money stock options by U.S. executives (see Aboody, 1996; Hemmer et al., 1996;
Huddart and Lang, 1996), suggesting that there are invisible institutional forces that constrain
mainland directors from freely exercising their vested in-the-money stock options.
We find no evidence that stock option compensation in state-controlled Red Chip firms
increases shareholder value. First, none of the common economic determinants of stock option
scheme adoption identified in prior research (e.g., growth, leverage, liquidity constraint,
managerial stock ownership and ownership concentration) can explain the cross-sectional
variation in the timing of state-controlled Red Chip firms’ stock option scheme adoption. This
finding raises questions whether state-controlled Red Chip firms’ stock option schemes are
motivated by shareholder value maximization. Second, stock market reactions to initial
announcements of state-controlled Red Chip firms’ stock option scheme proposals are never
significantly positive. Third, there is no evidence of improvement in state-controlled Red Chip
firms’ accounting return on assets (ROA) after the grant of stock options to directors.
Our findings should be of interest to investors, boards of directors, corporate governance
activists and regulators who wish to understand the effect of equity-based compensation on
shareholder value in countries with weak investor protection. Our results are surprising in light
of the dominance of the efficient contracting view of equity-based compensation in the extant

7
academic literature and investment community.5 Our results suggest caution in adopting equity-
based compensation in weak investor protection countries.
Knowledge of Red Chip firms’ equity-based compensation should be also of interest to A
share firms and H share firms that have been permitted by Chinese regulators to adopt equity-
based compensation since 2006. A share firms refer to Chinese firms that are incorporated in
mainland China and traded on the domestic stock exchanges while H share firms refer to Chinese
firms that are incorporated in mainland China but traded on the Hong Kong Stock Exchange.
Except for the differences in place of incorporation and stock listing, A shares, H shares, and
Red Chip firms are comparable Chinese firms. Thus, our results on Red Chip firms’ equity-based
compensation should be informative to A share firms and H share firms that wish to adopt stock
option compensation.6
The rest of the paper is organized as follows. Section 2 provides an overview of the
relevant institutional background on stock option compensation in Hong Kong listed firms.
Section 3 describes the state-controlled Red Chip firm sample and analyzes the characteristics of
the annual stock option grants. Section 4 examines Red Chip firm directors’ stock option
exercise behavior. Section 5 studies the determinants of Red Chip firms’ stock option scheme
adoption decision. Section 6 shows the results on the stock market reaction to the stock option
scheme proposal announcement. Section 7 examines the changes in firm accounting performance
after the annual stock option grants to directors. Section 8 concludes.
5 For example, among the 51 minimally acceptable corporate governance standards issued by the largest provider of governance data to institutional investors, Institutional Shareholder Services (ISS), 8 are directly related to managerial equity compensation and equity ownership (see Brown and Caylor, 2006). 6 Several recent studies have examined managerial equity compensation in publicly traded Chinese firms. Conyon and He (2008) study the determinants of managerial cash pay and stock ownership in domestically listed A share firms. Ke et al. (2009) consider the effect of a Hong Kong stock listing on the sensitivity of managerial pay (cash, equity, and turnover) to firm performance in H share firms and Red Chip firms. Magnan and Li (2008) examine whether the ability to offer equity-based compensation affects Chinese firms’ decision to cross list shares on the Hong Kong Stock Exchange.

8
2. Institutional background
2.1. The Hong Kong Stock Exchange’s regulatory requirements on stock option compensation
The granting of stock options is regulated by the Hong Kong Stock Exchange (HKSE).
The detailed regulatory rules on stock option compensation can be found in Chapter 17 (Equity
Securities-Share Schemes) of the Exchange’s Listing Rules.7 Reflecting the fact that stock option
compensation is a relatively recent phenomenon in Hong Kong, Chapter 17 first appeared in the
Listing Rules in December 1989. Prior to a major revision of Chapter 17 that became effective
on September 1, 2001, the regulatory rules on stock option compensation were pretty lax. For
example, the 1989 version of Chapter 17 contains only two and a half pages. Appendix A
provides a summary of the seven key provisions. Provisions (5) and (7) are noteworthy because
they are different from the common practice in the U.S. Provision (5) disallows any particular
individual from receiving a disproportionate share of the stocks in a share option scheme while
provision (7) explicitly permits listed firms to issue in-the-money stock options.
Chapter 17 did not experience any significant changes until a major overhaul of the
Listing Rules in 2001. The 2001 version of Chapter 17 includes 13 pages that significantly
expanded the scope and detailed requirements of share option schemes. Appendix B contains a
summary of the major changes contained in the 2001 version of Chapter 17. The 2001 version
allowed listed firms increased flexibility in using share option plans. For example, listed firms
can now issue stock options to non-employees (provisions (1)) or can seek shareholder approval
for stock option grants in excess of the normal 10% limit of the relevant class of securities in
issue (provision (2)). However, the 2001 version also significantly tightened certain provisions of
stock option schemes. The most noteworthy is the banning of in-the-money stock option grants 7 The most recent version of Chapter 17 can be found at http://www.hkex.com.hk/rule/index/rulesandguidelines.htm.

9
(provision (4)), the requirement of independent non-executive directors’ approval of stock
options granted to directors, Chief Executive and substantial shareholders (provision (5)), and the
banning of granting stock options prior to the disclosure of price sensitive events (provision (6)).
As noted in the Introduction, Hong Kong listed firms are required to disclose detailed
information on stock option compensation in periodic financial reports. 8 There are several
important features of the Hong Kong annual disclosure requirements that are not available in
many other countries. First, Hong Kong listed firms are required to disclose information on
outstanding stock options for each company director separately and all non-director employees
as a group. Second, for each individual director or the non-director employees as a group, Hong
Kong listed firms are required to disclose the beginning and ending balances of the outstanding
stock options and the exercise price for each outstanding stock option grant separately. Third, for
each individual director or the non-director employees as a group, Hong Kong listed firms are
required to disclose the number of stock options exercised during the year for each outstanding
stock option grant separately. To our knowledge, Hong Kong listed firms’ stock option
compensation disclosures are the most disaggregated.9
As Red Chip firms are incorporated and listed outside mainland China, they are not
directly subject to mainland China’s Company Law and Securities Law or any other related
securities regulations. However, the majority of Red Chip firms are controlled by the Chinese
government and thus their stock option compensation practices could be still indirectly
influenced by mainland Chinese regulators. During our sample period 1991-2005 there were no
8 The detailed stock option grant and exercise disclosure requirements can be found in Appendix 7 (Part A) of the Hong Kong Stock Exchange’s Listing Rules for the period prior to September 1, 2001 and Chapter 17 (Equity Securities-Share Schemes) for the period after September 1, 2001. The Companies Ordinance (129D(3)(j)) has also related disclosure requirements on stock option grants. 9 Effective for fiscal years ending on or after December 15, 2006 (see SEC Release No. 33-8732A, Executive compensation and related person disclosure), all publicly listed U.S. firms are required to annually disclose the ending balances of outstanding stock options granted to each of the top 5 executives at the individual grant level.
10
official Chinese securities regulations on stock option compensation because the old Company
Law prohibited firms incorporated in mainland China from issuing employee stock options.
Subsequent to the approval of China’s new Company Law in 2005, the China Securities
Regulatory Commission (CSRC) issued the first official regulation on stock option compensation
on December 31, 2005 that applies to only firms listed on the two domestic stock exchanges. In
early 2006 China’s State-owned Assets Supervision and Administration Commission (SASAC)
issued two additional stock option compensation regulations that apply to state-controlled
Chinese firms listed domestically and abroad respectively. In May 2008 the CSRC issued two
memoranda that impose further restrictions on employee stock option compensation. None of
these recent Chinese regulations went into effect during our sample period and thus they should
not affect Red Chip firms’ stock option compensation practices during our sample period.
2.2. Financial and tax accounting rules for stock option compensation
Hong Kong’s financial accounting for stock option compensation closely follows the
International Financial Reporting Standards (IFRSs). Prior to January 1, 2005, stock option
compensation was not recognized as an expense. Effective January 1, 2005, Hong Kong
Financial Reporting Standards (“HKFRSs”) were fully converged with IFRSs. Thus, the current
financial accounting for stock option compensation follows IFRS 2, which requires listed firms
to recognize an expense for the stock option grant using the fair value method.
Hong Kong has one of the world’s simplest tax systems. Its business and individual
income tax rate schedules are essentially a flat tax rate that is capped at around 15-17% during
our sample period. Thus, it is not too surprising that Hong Kong’s tax accounting rules for stock
option compensation are much simpler than those in the U.S. (see Scholes et al. 2002 for a

11
discussion of the U.S. income tax treatment for stock option compensation). Unlike in the U.S.,
stock option compensation in Hong Kong does not enjoy any special tax advantage relative to
cash compensation. The initial grant of stock options is not a taxable event for either the
company or the recipient, regardless of whether the granted options are in the money or out of
the money on the grant date. According to Section 9 of the Inland Revenue Ordinance (IRO), any
gain from the exercise of stock options is taxable to the option recipient at the regular income tax
rates. However, the company that issues the stock options cannot claim a tax deduction for the
cost of the options (Section 16 of IRO), regardless of the financial accounting treatment of stock
options. Hence, we believe that taxes are not likely a driver of employee stock options for Hong
Kong-listed firms.
3. Sample, data sources and descriptive statistics
3.1. Sample and data sources
We obtained the list of Red Chip firms from the Hong Kong Stock Exchange web site
(www.hkex.com.hk) and hand collected all the stock option compensation data from annual
reports. There is a total of 84 Red Chip firms over the period 1991-2005. After excluding 8 non-
state controlled Red Chip firms, we have a final sample of 76 state-controlled Red Chip firms. A
Red Chip firm is defined to be state-controlled if its immediate largest shareholder is the Chinese
Government (central or local) directly or a state-owned-enterprise (SOE).
Table 1 reports the distribution of the state-controlled Red Chip firms over calendar years
1991-2005. Column (1) shows the total number of Red Chip firms as of each calendar year.
Although the first state-controlled Red Chip firm listing in Hong Kong occurred in 1972, most of
the Red Chip firms were listed in Hong Kong after 1990.

12
Column (2) of Table 1 shows the cumulative number of state-controlled Red Chip firms
that have adopted stock option schemes as of each calendar year while column (3) of Table 1
shows the cumulative number of state-controlled Red Chip firms that have actually initiated
stock option grant as of each calendar year. Although state-controlled Red Chip firms are free to
choose any type of equity-based compensation, the most common form of equity-based
compensation is stock option. Only four state-controlled Red Chip firms used other forms of
equity-based incentives in addition to stock option grants. For this reason, we limit our empirical
analyses to stock option compensation. As evident from columns (2) and (3), stock option
compensation increases in popularity over time. The percentage of state-controlled Red Chip
firms that have initiated stock option grant is only 14% (1/7) in before 1991, but grew to 45%
(15/33) by 1995, and 82% (50/61) by 2000. By the end of 2005, all state-controlled red chip
firms had adopted option schemes even though only 88% (67/76) of the firms had initiated stock
option grant.
Red Chip firms’ compensation data used in this study are hand collected from annual
reports. Unless stated otherwise, all Red Chip firms’ accounting and stock price data come from
the Datastream. To the extent possible, we also manually collect from annual reports the
accounting variables missing in Datastream.
3.2. Characteristics of annual stock option grants
Table 2 shows the descriptive statistics on the common characteristics of annual stock
option grants to the CEO/Chairman for the 67 state-controlled Red Chip firms that have initiated
stock option grant as of 2005: premium, term, vesting period, and the amount of annual stock
option grant per person expressed either as a percentage of the total common shares outstanding

13
(grant percentage) or in the Black-Scholes value on the grant date (BS value). See the notes of
Table 2 for the definitions of these terms. We do not show the results for the other directors or
non-director employees because except for grant percentage and BS value, the grant
characteristics are similar across company employees.10 Because the U.S. is a leader in using
stock option compensation, one would naturally expect Hong Kong listed firms’ design of stock
option compensation to be influenced by the common U.S. practice. Thus, to the extent possible,
we also show the descriptive statistics on the same grant characteristics for the U.S. firms in
Execucomp as a comparison. However, it is not the purpose of this study to account for the
differences in stock option compensation characteristics between Red Chip firms and U.S. firms.
Because Execucomp starts in 1992, the sample period for Table 2 is limited to 1992-2005.
The unit of observation in Table 2 is a firm year that issues at least one stock option
grant. For the premium, term, and vesting period, if a firm year contains multiple stock option
grants, whether to the same person or to different persons, we first calculate the value weighted
mean by the number of stock options in each grant before computing the mean and median
across the firm years. For the grant percentage and BS value, we compute the equally weighted
average per person for the CEO/Chairman who receive stock option grants in a firm year before
computing the mean and median across the firm years.
Although Table 2 reports both the mean and median, we focus on the median in the
following discussion because it is less susceptible to the influence of outliers. There are several
interesting findings in Table 2. First, the premium, term, and vesting period are all significantly
different between Red Chip firms and U.S. firms. The median premium is a negative 10.71%
(i.e., in the money) for Red Chip firms but zero for U.S. firms. The median premium is an even
10 We examine the CEO and Chairman of the board as a group because both are typically involved in the daily company management in Chinese firms.
14
larger negative 21.76% for the period 1992-2001 when in-the-money option grants were
permitted. Red Chip firms’ grant of in-the-money stock options is interesting because stock
options are typically granted at the money in the U.S. (see Table 2 and Murphy, 1999) or even
out of the money in Japan (see Kato et al., 2005). Red Chip firms’ median option term is 6.01
years, which is much shorter than U.S. firms’ median term of 9.76 years but is comparable to the
average term in Germany (Langmann, 2007), Japan (Kato et al., 2005), and Finland (Ikaheimo et
al., 2004). Red Chip firms’ median vesting period is only half a year, much shorter than the
commonly reported 2.5 years for U.S. firms (Murphy, 1999), 2.6 years in Germany (Langmann,
2007), and 1.8 years in Japan (Kato et al., 2005).
Second, the median annual stock option grant per person to the CEO/Chairman is also
significantly different for Red Chip firms and U.S. firms. While the grant percentage is larger for
Red Chip firms (0.26% vs. 0.18%), the BS value is much bigger for U.S. firms (HK$1.58m vs.
HK$8.22m). One major reason for this difference between the grant percentage and BS value is
that the market value of Red Chip firms on average is only one-tenth of the market value of U.S.
firms in Execucomp.
Though not shown in Table 2, we also compute the distribution of the annual stock option
grant between directors and non-director employees over the same period 1992-2005. The
median annual stock option grant to all recipients is 2.11% of the common shares outstanding, a
meaningful amount given that state-controlled Red Chip firms are generally conglomerates. The
median annual stock option grant to non-director recipients is only 0.91% of the common shares
outstanding. The median annual stock option grant to non-director employees as a percentage of
the total annual stock option grant to all recipients (in number of shares or Black-Scholes value)

15
is approximately 28%, suggesting that the majority of the annual option grants are issued to top
executives.
Is the annual stock option grant economically meaningful relative to the annual cash
compensation for the CEO/Chairman of a typical Red Chip firm? Table 3 provides the answer to
this question. Because 2005 is the first year when Red Chip firms disclosed annual cash
compensation at the individual director level, Table 3 is limited to 2005 only. The sample sizes
in Table 3 vary because of missing observations. The median total cash pay to the
CEO/Chairman is HK$1.4545 million. For the firms that issued new stock option grants to the
CEO/Chairman in 2005 (N=16), the median dollar value of the annual option grant represents
34.42% of the CEO/Chairman’s annual total cash compensation while the mean is a much larger
81.62%. As a comparison, the comparable mean (median) percentage in 2005 for the CEOs of
U.S. firms in ExecuComp is 179.15% (85.95%). However, less than 30% (16/60) of the Red
Chip firms granted new stock options to the CEO/Chairman in 2005. By comparison,
approximately 67% of the U.S. firms in Execucomp issued new stock options to their CEOs in
2005. 11 These results suggest that relative to a Red Chip firm CEO/Chairman’s own cash
compensation, the annual stock option grant is economically significant. However, relative to a
typical U.S. firm executive, the economic significance of the annual stock option grant to a
typical Red Chip firm’s CEO/Chairman is still small.12
4. Directors’ stock option exercise behavior
11 However, one possible reason for the more frequent granting of options to U.S. executives is that U.S. executives tend to more frequently exercise vested in-the-money stock options than Red Chip firm executives (see Section 4 for some supporting evidence). 12 Though untabulated, the inference is qualitatively similar for Red Chip firms’ other executive directors.

16
This section analyzes state-controlled Red Chip firm directors’ exercise behavior of
vested in-the-money stock options. Prior research on U.S. firms (see, e.g., Aboody, 1996;
Hemmer et al., 1996; Huddart and Lang, 1996) finds that stock option recipients often exercise
in-the-money stock options immediately after the vesting, presumably due to the risk aversion of
option recipients (Huddart, 1994). We examine whether Red Chip firms’ directors behave
similarly by exercising their vested in-the-money stock options early.
As we alluded to in the Introduction, there is anecdotal evidence suggesting that the grant
and exercise of Red Chip firms’ stock option compensation are heavily controlled by the Chinese
Government, which is the controlling shareholder of the state-controlled Red Chip firms. To
avoid the public outcry over the outsized compensation payout resulting from directors’ stock
option exercises, we conjecture that the Chinese Government has an incentive to significantly
constrain Red Chip firm directors’ ability to exercise their vested stock options. However, we
expect the Government’s influence to be greater over directors from mainland China than over
directors recruited from overseas (defined as directors who are either foreign country citizens or
overseas Chinese from HK, Taiwan, Macau or any other foreign country). This is because the
future political and professional careers of mainland directors in state-controlled Chinese firms
are more heavily dependent on their loyalty to the Government. Therefore, we expect mainland
directors to be less likely than overseas directors to exercise vested in-the-money stock options.
Data on the nationality of the directors are hand collected from annual reports.
For all the directors during our sample period 1991-2005, we first show in Table 4 the
univariate statistics on the cumulative exercised stock options over the directors’ tenure

17
(expressed as a percentage of total vested stock options at the beginning of exercise year zero).13
Exercise year zero is defined as the latter of the stock option vesting year or a director’s
appointment year. The unit of observation is a firm-director. If there are multiple stock option
grants for a firm-director, we compute the weighted average cumulative exercise percentage for
the director where the weight is each grant’s total number of vested stock options at the
beginning of exercise year zero. Because a director’s tenure could be truncated for the directors
whose last year is 2005, we compute the descriptive statistics both including and excluding the
directors whose last year is 2005. Note that Table 4 does not differentiate in-the-money vs. out-
of-the-money stock options because the cumulative exercised stock options are computed over
multiple years and thus it is difficult to separate in-the-money stock options from out-of-the-
money stock options.
As shown in Table 4, the median cumulative stock option exercise percentages are
always zero for both mainland directors and overseas directors. However, the mean is higher for
overseas directors. In addition, both the mean and median are significantly different for mainland
directors and overseas directors at the two-tailed 5% level.
To formally test whether mainland directors are less likely than overseas directors to
exercise vested in-the-money stock options while controlling for alternative determinants of
directors’ stock option exercise behavior, we follow Huddart and Lang (1996) by estimating the
following multiple Tobit regression of the annual stock option exercise at the firm-director-year
level:14
13 Table 4 does not include the directors’ stock option exercise behavior after their retirement from the board because when a director leaves the board, her annual stock option disclosure is merged with the disclosure of non-director employees. 14 We use the Tobit model because the dependent variable is both left and right censored. The results are similar if we use the OLS regression.

18
RETURNVOLATILITYFREQMONEYTHEIN
STRIKETOMARKETLEFTLIFEAGEVEST
AVAILABLEFRACTONMAINLANDEXERCISEDFRACTION
876
543
21
___
____
__
(1)
See the notes of Table 5 for all the variable definitions. The sample for the above regression is
limited to the directors who have a positive beginning balance of vested in-the-money stock
options in exercise year t. This restriction results in a loss of approximately 25% of the initial
sample (firm-director-years), suggesting that the majority of the outstanding stock options are
vested and in the money. An option is defined to be vested in year t if the vesting date is earlier
than the fiscal year end of year t. An option is deemed to be in the money in year t if the exercise
price is lower than the maximum stock price during the period beginning at the later of the fiscal
year t’s beginning date or the vesting date (t1), and ending at the end of fiscal year t (t2). Results
are similar if we replace the maximum price with the median stock price or the third quartile
stock price during the period between t1 and t2.
MAINLAND is our primary variable of interest and is expected to be negative. Following
Huddart and Lang (1996), we expect directors’ stock option exercise in a year to increase with
FRACTION_AVAILABLE, VEST_AGE, MARKET_TO_STRIKE, IN_THE_MONEY_FREQ,
RETURN and decrease with LIFE_LEFT. The coefficient on VOLATILITY is hard to predict
because of two offsetting effects. On one hand, increased volatility would induce risk averse
directors to exercise the stock options early. On the other hand, increased volatility also implies a
higher stock option value and thus directors should find it optimal to hold on to the options.
Panel A of Table 5 shows the descriptive statistics of the regression variables included in
the Tobin regression. We do not separately tabulate the descriptive statistics for mainland
directors and overseas directors for brevity. Of the 1,995 firm-director-exercise years 71.5%
belong to mainland directors. The mean FRACTION_EXERCISED is 0.102 but the median is
19
zero, suggesting significant skewness of the dependent variable. The median vested in-the-
money option as a percentage of the original stock option grant (FRACTION_AVAILABLE) is
100%. The median options have been vested for 15.6 months (VEST_AGE) and there are 54
months remaining before the option’s expiration (LIFE_LEFT). The median
MARKET_TO_STRIKE is 1.378 while the median IN_THE_MONEY_FREQ is 89.2%,
suggesting that the directors should have plenty of opportunities to exercise their stock options at
a profit during the exercise year t.
Panel B of Table 5 shows the Tobin’s regression results of FRACTION_EXERCISED.
Because the unit of observation is a firm-director-year, we compute the standard errors of the
regression coefficients based on the method of Rogers (1993), which allows heteroskedasticity
and any type of correlation for observations of the same firms but assumes independence for
observations of different firms. The first column shows the regression result for all directors
while the second column shows the result for the CEO/Chairman only. The coefficient on
MAINLAND is significantly negative in both columns, suggesting that mainland directors are
less likely to exercise vested in-the-money stock options than overseas directors after controlling
for the common determinants of stock option exercise. In addition, it appears that the coefficient
on MAINLAND is much larger in the second column than in the first column, suggesting that
mainland CEOs face greater institutional restrictions than other mainland directors in the stock
option exercise.
Could the differential exercise behaviors between mainland directors and overseas
directors be explained by the difference in their risk aversion? Huddart (1994) provides a careful
theoretical analysis on the effect of risk aversion on an employee’s stock option exercise
behavior. He shows that risk aversion induces the early exercise of stock options. However, he

20
also finds that the employee should be more likely to hold on to vested in-the-money stock
options as the wealth of the employee (excluding the stock options she owns) grows larger or as
the fraction of the total wealth of the employee represented by the stock options becomes smaller.
There is no evidence suggesting that mainland directors are less risk averse than overseas
directors. In addition, it is reasonable to argue that the wealth of overseas directors (excluding
the stock options granted by Red Chip firms) is much bigger than the wealth of mainland
directors on average. Thus, if there is any bias, we should expect overseas directors to be less
likely to exercise vested in-the-money stock options before maturity. Since our results are in the
opposite direction, we do not believe the difference in risk aversion between the two types of
directors can explain the negative coefficient on MAINLAND.
Consistent with Huddart and Lang (1996), directors’ stock option exercise in a year
increases with the fraction of the vested in-the-money stock options available at the beginning of
the year (FRACTION_AVAILABLE), the length of time since vesting (VEST_AGE),
MARKET_TO_STRIKE, IN_THE_MONEY_FREQ, and the recent run-up in stock prices.
There is no evidence that stock return volatility affects Red Chip firm directors’ exercise
behavior.
5. The determinants of the stock option scheme adoption decision
We next examine whether the common economic determinants of stock option scheme
adoption identified in prior research can explain Red Chip firms’ stock options scheme adoption
decision. We follow Kato et al. (2005) by estimating the following hazard regression model:
effectsfixedyearROALNTAOWNPARENTOWNDIRECTOR
DIVIDENDCFONONPOSLEVERAGELNQADOPTION
8765
4321
__
_ (2)
21
See the notes of Table 6 for variable definitions. The sample for the above regression includes all
the years from the IPO year to 2005 (the last year of our sample) for the firms that have not
adopted a stock option scheme as of 2005 and all the years up to the first stock option adoption
year for the firms that have adopted a stock option scheme as of 2005.
We expect the coefficient on LNQ to be positive because prior research (Myers, 1977)
suggests that high growth firms face a greater information asymmetry between corporate insiders
and outside investors and therefore shareholders can benefit more from adopting stock option
compensation. The coefficient on LEVERAGE is predicted to be negative because John and
John (1993) argue that higher leverage firms face larger agency costs of debt due to the risk of
wealth expropriation from debt holders to stock holders and therefore should find it optimal to
adopt a low-powered managerial compensation contract. Adopting a high-powered compensation
contract (e.g., stock option compensation) will hurt shareholder value because debt holders will
price protect by demanding a higher cost of debt capital. Because cash-constrained firms should
find it beneficial to use stock option compensation, which does not require the payout of cash,
we expect the coefficient on NONPOS_CFO (DIVIDEND) to be negative (positive). We predict
the coefficient on DIRECTOR_OWN to be negative because the incremental benefit of stock
option compensation should be lower for firms whose directors have already had higher equity
stakes in their companies (Yermack, 1995). Likewise, we expect the coefficient on
PARENT_OWN to be negative because prior research (e.g., Shleifer and Vishny, 1986; Ke et al.,
1999) argues that large block owners can serve as effective monitors of management and
therefore there is less need for high-powered incentive compensation such as stock options.
Following Kato et al. (2005), we also include LNTA, ROA, and year fixed effects as control
variables.
22
Table 6 shows the logit regression results of the hazard model. The independent variables
in column (1)’s regression are measured in the same year as the dependent variable while the
independent variables in column (2)’s regression are lagged by one year. Although column (2)’s
regression is preferred, its sample size is much smaller because a significant number of our
sample firms adopted stock option schemes in the IPO year and thus lagged values of some
variables (e.g., stock prices or accounting data) are not available for the IPO year. However,
despite the difference in sample size, the inferences from both columns are qualitatively similar.
That is, none of the economic determinants of stock option compensation adoption identified in
prior research can explain state-controlled Red Chip firms’ stock option scheme adoption. The
only exception is that the coefficient on DIVIDEND is marginally significantly positive as
predicted (one-tailed p=0.071). Overall, these regression results suggest that state-controlled Red
Chip firms’ stock option schemes are not motivated by shareholder value maximization.
6. The stock market reaction to the stock option scheme proposal announcement
In this section we examine the stock market reactions to the announcements of Red Chip
firms’ stock option scheme proposals. The efficient contracting view predicts a positive market
reaction while the rent extraction view predicts a zero or negative market reaction to the
announcements of stock option scheme proposals.
6.1. Identification of event dates
The key events of a stock option scheme in Hong Kong-listed firms are as follows. First,
the board of directors meets to propose a new stock option scheme. Second, a circular that
contains a summary of the proposed option scheme has to be mailed to shareholders. Generally

23
the circular document merely repeats the regulatory requirements on share option schemes under
Chapter 17 of the Listing Rules and does not offer any specifics of the proposed stock option
scheme. Third, shareholders vote on the proposed option scheme in a general meeting. The
median time gap between the circular mailing date and the shareholder voting date is one
calendar month in our sample. As all state-controlled Red Chip firms are controlled by Chinese
Government, there is virtually no uncertainty about the shareholder approval of any proposed
stock option scheme.
Our research indicates that the earliest public announcement date of a new stock option
scheme is generally the circular mailing date. Although the existing Listing Rules require listed
firms to inform the Exchange immediately after board meetings the approval of several types of
decisions (i.e., dividends, preliminary announcement of profits or losses for any year, proposed
changes in the capital structure, any decision to change the general character or nature of the
business of the issuer or group), the date and content of the board meeting that proposes a stock
option scheme are not required to be announced prior to the mailing date of the stock option
scheme circular.15 Prior to the 2001 overhaul of the Hong Kong Stock Exchange’s Listing Rules,
the Listing Rules required a summary of the share option scheme to be circulated to
shareholders. In addition, according to Practice Note 1 of the Listing Rules, Hong Kong-listed
companies were mandated to forward to the Hong Kong Stock Exchange 500 copies of all
circulars sent to holders of its securities, fourteen copies of which must be delivered to the
Listing Division and the balance of the documents must be delivered to the trading floor of the
Exchange at the same time as they are dispatched to shareholders with registered addresses in
15 We randomly picked 6 stock option scheme proposals and verified that there were indeed no announcements of the board meetings that proposed the option schemes.
24
Hong Kong.16 Significant changes were made to the Listing Rules in August 2001. The 2001
Version of the Listing Rules requires a stock option scheme circular to be mailed to shareholders
or to be made available for inspection at a place in Hong Kong for a period of not less than 14
days before the date of the general shareholder meeting. Moreover, Chapter 2 of the Listing
Rules requires the submission by Main Board issuers of a soft copy of any company
announcement to the Exchange for publication on the Exchange’s website. Normally, the
circulars on share option schemes are published on the HKSE’s website within one business day
following the circular mailing date. Therefore, we determine that the earliest date that stock
market investors become aware of stock option scheme proposals is the circular mailing date.
However, we also observe that listed companies occasionally mentioned new share
option scheme proposals in the notice of shareholders’ general meeting announced in the
newspaper or published on the HKSE’s website prior to the circular mailing date. For such cases,
we consider the earlier date as the event date. 11 out of the 70 stock option scheme proposals
included in our final sample were announced prior to the circular mailing date.
We hand collected from the HKSE’s research library all the relevant information on Red
Chip firms’ stock option scheme proposals, including the circular mailing date. We identified a
total of 122 stock option scheme proposals over our sample period 1991-2005. We eliminated 39
stock option schemes adopted before the IPO date because we cannot compute the stock market
reactions to the announcements of these option schemes. We also deleted 6 stock option scheme
proposals adopted in the first 6 months of the IPO date to avoid potential IPO-related
confounding effects. Finally, we excluded 7 stock option schemes for which we could not find
16 We observe a few cases where companies would publish the circular document in the newspaper on the day following the circular mailing date.

25
the proposal mailing date. Our final sample contains 70 stock option scheme proposals
(representing 57 unique firms).
6.2. Results on stock market reactions to stock option scheme proposal announcements
Table 7 shows the stock market reactions (CAR) to announcements of state-controlled
Red Chip firms’ stock option scheme proposals. CAR is the cumulative Hang Seng stock index
return-adjusted abnormal return (dividend inclusive) over [-1, +1] trading days around the stock
option scheme proposal announcement date.17 Results are qualitatively similar if the return
measurement window is [-2, +2] or [-1, +5]. Column (1) shows the results before and column (2)
the results after deleting firm-specific confounding events over the trading days [-2, +5]. All the
confounding events happen to be earnings announcements manually identified from the HKSE’s
research library.
The inference is qualitatively similar in both columns. Both the mean and median CAR
are negative and even marginally significant in column (1) using the Wilcoxon ranksum test
(two-tailed p=0.137). This evidence suggests that stock market investors do not expect state-
controlled Red Chip firms’ stock option schemes to be value increasing.
7. The effect of annual stock option grant on firm performance
We now examine whether the annual granting of stock options to state-controlled Red
Chip firms’ directors results in a significant improvement in the firms’ earnings performance.
We use ROA (defined as annual net income divided by the average total assets at the beginning
and end of the year) as our primary accounting performance measure but also conduct a
17 Inferences are similar if the market returns are measured using the equal or value weighted stock returns of all H-share and Red Chip share firms.

26
sensitivity check using OROA (defined as annual operating income divided by the average total
assets at the beginning and end of the year). We prefer ROA because the sample size for OROA
is much smaller.
Following Kato et al. (2005), we examine the changes in the Red Chip firms’ ROA from
year t-1 to year t+1 around the annual stock option grant year t relative to the changes of ROA
for a sample of control firms matched (with replacement) on two-digit industry and ROA in year
t-1. Barber and Lyon (1996) show that this matching approach yields well specified and
powerful tests of abnormal accounting performance. The pool of control firms includes all the
state-controlled H share firms and the state-controlled Red Chip firms that have not initiated
stock option schemes as of year t. As noted before, state-controlled H firms and state-controlled
Red Chip firms are comparable state-controlled Chinese firms except that H shares are
incorporated on mainland China while Red Chip firms are incorporated outside China. In
particular, both H firms and Red Chip firms face similar labor market and product market
conditions and therefore their accounting performance should be affected by similar
macroeconomic forces. However, during our sample period H share firms are barred from using
stock option compensation by mainland China’s Company Law. Therefore, H share firms should
be a good benchmark for the Red Chip firms.
We identified 242 firm years during which new stock options were granted to at least one
director in the year. We eliminated 6 firm years due to missing ROA in year t-1. We could not
find matching firms for 18 firm years. Our final sample contains 218 firm years with stock
option grants to directors.
Panel A of Table 8 shows the changes in ROA for our option granting firms relative to
the control firms over the years t-1 to t+1. Note the sample size for year t+1 is smaller than 218

27
because ROA in year t+1 is missing for a few control firms. Although we report the p values
from both t-tests and Wilcoxon tests, we focus on the Wilcoxon tests in the following discussion
because Barber and Lyon (1996) conclude that the nonparametric Wilcoxon test statistics are
uniformly more powerful than parametric t-statistics due to the presence of outliers in accounting
performance measures. We first note that ROA in year t-1 is not significantly different for the
granting firms and control firms, suggesting that our matching on ROA in year t-1 is successful.
More importantly, the changes in ROA from year t-1 to year t or from year t-1 to year t+1
between the granting firms and control firms are never significantly different from zero,
suggesting that Red Chip firms’ stock option grants have little significant effect on the firms’
ROA, consistent with the rent extraction view. These results are consistent with the stock market
reaction results in Table 7.
The results in Panel A are robust to several sensitivity checks. First, we examine whether
the effect of stock option grant on firm performance is stronger if the options are granted to the
CEO/Chairman. As shown in Panel B of Table 8, the changes in ROA from year t-1 to year t or
from year t-1 to year t+1 between the granting firms and control firms are not significantly
different from zero.
Second, we examine whether the effect of stock option grant on firm performance is
stronger for material annual stock option grants to directors. For our full sample the mean
(median) Black-Scholes value of the annual stock option grants to all directors is HK$17.37m
(5.16m). We redo the results in Panel A by eliminating the observations whose Black-Scholes
value of the annual stock option grants to all directors is less than HK$5.16m, the median. As
shown in Panel C of Table 8, the changes in ROA from year t-1 to year t or from year t-1 to year
t+1 between the granting firms and control firms are still not significantly different from zero.

28
Finally, we redo Panel A’s results by using OROA as an alternative performance measure.
As shown in Panel D of Table 8, the sample of granting firms is much smaller (83 vs. 218 in
Panel A) because operating income is missing for many observations and the match between
granting firms and control firms is more difficult to find using OROA. However, despite the
difference in sample size, the changes in ROA from year t-1 to year t between the granting firms
and control firms are not significantly different from zero. In addition, the changes in ROA from
year t-1 to year t+1 between the granting firms and control firms are now significantly negative.
8. Summary and conclusion
Much has been learned on the causes and consequences of equity-based compensation in
publicly traded U.S. firms. The use of equity-based pay (especially stock options) has been on
the rise in many other countries. However, relative to the existing knowledge of equity-based
compensation in the U.S. we know little of the causes and consequences of equity-based
compensation in other countries, especially those with weak investor protection. The objective of
this study is to test the effect of stock option compensation on shareholder value for a sample of
state-controlled Chinese firms that are incorporated outside China and traded on the Hong Kong
Stock Exchange (referred to as state-controlled Red Chip firms) over 1991-2005.
Like in the U.S., we find that stock option compensation is the dominant form of equity-
based pay and is widely used among state-controlled Red Chip firms. However, state-controlled
Red Chip firms’ grant and exercise of stock options differ from those of U.S. firms in several
important respects. Red Chip firms’ stock options were typically granted in the money prior to
the 2001 Hong Kong Stock Exchange’s regulatory change that banned in-the-money stock option
grants. The median option grant’s term and vesting period are much shorter than those of U.S.

29
firms. Although the value of the annual stock option grant to a typical Red Chip firm director is
economically meaningful relative to her annual cash pay, it is much smaller than the value of the
annual stock option grant to a typical U.S. executive. In contrast to the commonly documented
early exercise of vested in-the-money stock options by U.S. executives, we find that state-
controlled Red Chip firms’ directors rarely exercise their vested in-the-money stock options.
This effect is stronger for mainland directors than for overseas directors.
We find no evidence that stock option compensation in state-controlled Red Chip firms
increases shareholder value. First, none of the common economic determinants of stock option
scheme adoption identified in prior research can explain state-controlled Red Chip firms’ stock
option scheme adoption decision. Second, stock market reactions to initial announcements of
state-controlled Red Chip firms’ stock option scheme proposals are never significantly positive.
Third, there is no evidence of improvement in state-controlled Red Chip firms’ accounting return
on assets (ROA) after the grant of stock options to directors.
Our findings suggest caution in the adoption of employee stock options in countries with
weak investor protection. Our results are particularly relevant to state-controlled Chinese firms
listed in the domestic exchanges that are in the process of proposing equity-based compensation.
30
References
Aboody, D. 1996. Market valuation of employee stock options. Journal of Accounting
and Economics 22: 357-391.
Aboody, D., Barth, M.E., Kasznik, R., 2004. SFAS 123 stock-based compensation
expense and equity market values. Accounting Review 79, 251–275.
Allen, F., J. Qian and M. Qian, 2005, Law, finance, and economic growth in China,
Journal of Financial Economics, Volume 77, Issue 1, 57-116.
Barber, B.M., Lyon, J.D.1996. Detecting abnormal operating performance: the empirical
power and specification of test statistics. Journal of Financial Economics 41, 359–
400.
Bartov, E., and P. Mohanram. 2004. Private information, earnings manipulations, and
executive stock-option exercises. The Accounting Review 79 (4): 889-920.
Bebchuk, L. and J. Fried, 2004, Pay without Performance: The Unfulfilled Promise of
Executive Compensation (Harvard University Press).
Brown, L. D., M. L. Caylor. 2006. Corporate governance and firm valuation. Journal of
Accounting and Public Policy, 25 (4), 409-434.
Cheng, A., 2007. Beijing probes hefty pay rises at state firms. The South China Morning
Post online edition, 5/16/2007.
Conyon, M., P. Gregg, and S. Machin. 1995. Taking care of business: executive
compensation in the United Kingdom. The Economic Journal 105, 704-714.
Conyon, M. J., and L. He. 2008. Executive Compensation and CEO Equity Incentives in
China’s Listed Firms. ESSEC Business School & the Wharton School working
paper.
Core, J., and W. Guay. 1999. The use of equity grants to manage optimal equity incentive
levels. Journal of Accounting and Economics 28 (2): 151-184.
Core, John E., Wayne R. Guay, and David F. Larcker. 2003. Executive Equity
Compensation and Incentives: A Survey. FRBNY Economic Policy Review
(April), 27-50.
Coulton, J. and S. Taylor. 2002. Option awards for Australian CEOs: The who, what and
why. Australian Accounting Review, 12 (1), 25-35.
Dechow, P., A. Hutton, and R. Sloan. 1996. Economic Consequences of Accounting for
Stock-Based Compensation. Journal of Accounting Research 34: 1-20.
The Economist. 2009. Attacking the corporate gravy train. May 28, 2009.

31
Efendi J., Srivastava A., Swanson E.P. 2007. Why do corporate managers misstate
financial statements? The role of option compensation and other factors. Journal of
Financial Economics, 85 (3), 667-708.
Estrin, S., J. Hanousek, E. Kočenda, and J. Svejnar. 2009. Effects of Privatization and
Ownership in Transition Economies. Policy Research Working Paper No. 4811,
The World Bank.
Hallock, K. and K. J. Murphy. 1999. Introduction. The Economics of Executive
Compensation, volume 1. Edward Elgar Publishing Limited.
Hemmer, T., S. Matsunaga, and T. Shevlin. 1996. The influence of risk diversification on
the early exercise of employee stock options by executive officers. Journal of
Accounting and Economics 21: 45-68.
Huddart, S., 1994, Employee stock options, Journal of Accounting and Economics 18,
207-231.
Huddart, S., Lang, M., 1996. Employee stock option exercises: an empirical analysis.
Journal of Accounting and Economics 21, 5–43.
Ikaheimo, S., A. Kjellman, J. Holmberg, and S. Jussila. 2004., Employee stock option
plans and stock market reaction: evidence from Finland, The European Journal of
Finance 10, 105-122.
John, T. A., K. John. 1993. Top-Management Compensation and Capital Structure.
Journal of Finance 48, 949-974.
Kato, H. K., M. Lemmon, M. Luo, and J. Schallheim. 2005. An empirical examination of
the costs and benefits of executive stock options: evidence from Japan. Journal of
Financial Economics 78, 435-461.
Ke, B., K. Petroni, and A. Saffieddine. 1999. Ownership concentration and sensitivity of
executive pay to accounting performance measures: Evidence from publicly and
privately-held insurance companies. Journal of Accounting and Economics 28
(December): 185-209.
Ke, B., O. Rui, and W. Yu. 2009. Hong Kong stock listing and the sensitivity of
managerial compensation to firm performance in state-controlled Chinese firms.
Working paper. Pennsylvania State University.
Klassen, K. J., and A. Mawani. 2000. The impact of financial and tax reporting incentives
on option grants to Canadian CEOs. Contemporary Accounting Research, 17 (2),
227-262.
La Porta, R., F. Lopez-De-Silanes, A. Shleifer, and R. W. Vishny, 1998. Law and
finance, Journal of Political Economy 106, 1113–55.
32
Langmann, C. 2007. Stock Market Reaction and Stock Option Plans: Evidence from
Germany. Schmalenbach Business Review, January, 85-106.
Magnan, M. and A. T. Li. 2008. Equity-based compensation: an important determinant
for Chinese cross listed firms. Concordia University working paper.
Matsunaga, S. 1995. The Effects of Financial Reporting Costs on the Use of Employee
Stock Options. Accounting Review 70: 1-26.
Megginson, W. L., and J. Netter. 2001. From State to Market: A Survey of Empirical
Studies on Privatization. Journal of Economic Literature, 39(2): 321-389.
Murphy, K. 1999. Executive Compensation. In O. Ashenfelter and D. Card, eds.,
Handbook of Labor Economics, Vol. 3. Amsterdam: North-Holland.
Myers, S. 1977. Determinants of Corporate Borrowing. Journal of Financial Economics
5, 147-175.
Oyer, P. and S. Schaefer. 2005. Why do some firms give stock options to all employees?
An empirical examination of alternative theories. Journal of Financial Economics
76, 99–133.
Rogers, W.H., 1993. sg17: Regression standard errors in clustered samples, Stata
Technical Bulletin 13, 19-23.
Shleifer, A., Vishny, R., 1986. Large shareholders and corporate control. Journal of
Political Economy 94. 461–488
Scholes, M., M. Wolfson, M. Erickson, E. Maydew and T. Shevlin. 2002. Taxes and
Business Strategy: A Planning Approach, Second edition, Prentice Hall, Upper
Saddle River, NJ.
Southam, C. and Sapp, S. 2009. Compensation across executive labor markets: what can
we learn from cross-listed Firms? Journal of International Business Studies, 1-18.
Yam, S., 2006. Social harmony clouds plans for bonus rewards at state-run firms. The
South China Morning Post online edition, December 23.
Yermack, D. 1995. Do Corporations Award CEO Stock Options Effectively? Journal of
Financial Economics 39: 237-69.

33
Appendix A. The key provisions of the 1989 version of Hong Kong Stock
Exchange’s Listing Rules-Chapter 17 (Equity Securities-Share Schemes)
(1) Chapter 17 applies to only share option schemes to executives and/or employees of
Hong Kong listed firms and their subsidiaries.
(2) Share option schemes must be approved by shareholders in a general meeting.
(3) The maximum life of a scheme must not be more than 10 years.
(4) The total amount of securities subject to a scheme, when aggregated with any
securities subject to any other schemes, must be limited to 10% of the relevant class
of securities in issue.
(5) The maximum amount that any one participant can receive from the scheme must not
exceed 25% of the aggregate of all securities subject to the scheme.
(6) The period within which the securities must be taken up must not be more than 10
years from the grant date.
(7) The exercise price must not normally be more than 20% below the average closing
price of the securities for the 5 business days immediately preceding the grant date.

34
Appendix B. The significant changes in the 2001 version of Hong Kong Stock
Exchange’s Listing Rules-Chapter 17 (Equity Securities-Share Schemes)
(1) Participants of a share option scheme may include employees and non-employees.
(2) Although the total number of securities subject to a scheme is still limited to 10% of
the relevant class of securities in issue, a listed firm may seek shareholder approval
for refreshing the 10% limit under the scheme. In addition, a listed firm may seek
separate shareholder approval for granting options beyond the 10% limit provided
that the options in excess of the limit are granted only to participants specifically
identified by the listed firm before such approval is sought. However, the limit on the
number of securities which may be issued upon exercise of all outstanding options
granted and yet to be exercised under the scheme and any other schemes must not
exceed 30% of the relevant class of securities of the listed firm in issue.
(3) Unless separately approved by shareholders, the total number of securities issued or to
be issued upon exercise of the options granted to each participant in any 12-month
period must not exceed 1% of the relevant class of securities of the listed firm in
issue.
(4) The exercise price must be at least the higher of (i) the closing price of the securities
on the date of the grant and (ii) the average closing price of the securities for the five
business days immediately preceding the date of grant.
(5) Each grant of options to a director, chief executive or substantial shareholder of a
listed firm must be approved by independent non-executive directors (excluding
independent non-executive director who is the grantee of the options). In addition,
shareholder approval is required if any grant of options to a substantial shareholder or
an independent non-executive director would result in the securities underlying all the
options already granted and to be granted to such person in the 12-month period up to
and including the date of such grant representing in aggregate over 0.1% of the
relevant class of securities in issue and having an aggregate value, based on the
closing price of the securities at the date of each grant, in excess of HK$5 million.
(6) A grant of options may not be made prior to the public disclosure of any price
sensitive event. In particular, no option may be granted during the period
commencing one month immediately preceding the earlier of (i) the date of the board
meeting for the approval of the listed firm’s interim or annual results and (ii) the date
of the interim or annual results announcement, and ending on the date of the results
announcement.
35
(7) A share option scheme’s proxy statement must be circulated to shareholders or be
made available for inspection at a place in Hong Kong for a period of not less than 14
days before the date of the general shareholder meeting. The proxy statement must
contains all the provisions of the share option scheme, including the purpose of the
scheme, participants, the total number of shares covered under the scheme, the
maximum entitlement of each participant under the scheme, the maximum exercise
period, the minimum vesting period, the performance targets (if any) associated with
the option vesting, the exercise price, etc. Listed firms are encouraged to disclose the
value of all stock options that can be granted under the scheme as if they had been
granted at the latest practicable date prior to the shareholder approval of the scheme.
Where the listed firm considers that the disclosure of the value of options is not
appropriate, it must state the reason for such non-disclosure in the proxy statement.

36
Table 1. The sample of state-controlled Red Chip firms as of 12/31/2005
Calendar Year
Number of firms Number of firms that have adopted stock option
schemes
Number of firms that have granted stock options
Before 1991 7 1 1 1991 7 2 2 1992 13 7 2 1993 25 18 6 1994 32 24 13 1995 33 28 15 1996 38 32 22 1997 50 46 34 1998 52 49 43 1999 56 53 43 2000 61 59 50 2001 64 63 55 2002 66 66 58 2003 67 67 60 2004 72 71 63 2005 76 76 67

37
Table 2. Common characteristics of annual stock option grants to the CEO over 1992-2005: state-controlled Red Chip firms versus U.S. firmsa
State-controlled Red Chip firms
All U.S. firms in
Execucomp two-tailed p-value of
N mean median N mean median t-test
rank-sum test
Premium (%) 201 -11.66 -10.71 15,382 0.19 0.00 0.00 0.00
Term (years) 207 6.94 6.01 15,352 9.46 9.76 0.00 0.00
Vesting period (years) 207 0.81 0.50 n/a b n/a n/a n/a n/a
Grant percentage (%) 207 0.47 0.23 15,518 0.37 0.18 0.00 0.00
BS value (HK$ mil) 203 5.42 1.63 15,351 23.51 8.22 0.00 0.00
a The unit of observation is a firm year. Premium is defined as the exercise price minus the closing price on the option grant date (or the closing price on the trading day immediately preceding the grant date if the grant date is not a business day) scaled by the closing price. Term is defined as the difference between the option grant date and the option expiration date (expressed in number of years). Vesting period is defined as the difference between the option grant date and the date when the granted options are exercisable (expressed in number of years). Grant percentage (%) is the annual stock option grant per person as a percentage of common shares outstanding. BS value is the Black-Scholes value of newly granted stock options per person, evaluated on the grant date for Red Chip firms and in the middle of the grant year for U.S. firms because the latter’s stock option grant date is unavailable in Execucomp. For premium, term, and vesting period, if a firm year contains multiple stock option grants, whether to the same person or to different persons, we first calculate the value weighted mean by the number of stock options in each grant before computing the mean and median across the firm years. For the option grant percentage and BS value, if a firm year contains multiple stock option grants, we first compute the equally weighted average per person for all the CEOs who receive stock option grants in a firm year before computing the mean and median across the firm years. The sample size varies across variables due to missing values.
b The variable “vesting period” is not reported for U.S. firms because Execucomp does not disclose the information required to compute this variable.

38
Table 3. The Black-Scholes value of state-controlled Red Chip firms’ annual stock option grant to the CEO/Chairman relative to her cash compensation in 2005a
N Mean Median S.D. Salary and allowance (in thousands of HK dollars) 59 1341.18 1191.33 1078.96 Bonus (in thousands of HK dollars) 63 811.25 105.00 3026.17 Pension (in thousands of HK dollars) 64 58.12 24.50 80.27 Total cash pay (in thousands of HK dollars) 60 2236.94 1454.50 3559.49 The Black-Scholes value of the annual stock option grant as a percentage of total cash compensation (including individuals who received no option grant in the year) 56 23.32 0.00 63.91 The Black-Scholes value of the annual stock option grant as a percentage of total cash compensation (excluding individuals who received no option grant in the year) 16 81.62 34.42 99.51 a The unit of observation is a firm. If a firm has multiple CEOs/Chairmen in 2005, we first calculate a variable’s equally weighted mean per person before computing the descriptive statistics across firms.

39
Table 4. The cumulative exercised stock options over state-controlled Red Chip firm directors’ tenure as a percentage of total vested
stock options at the beginning of the vesting year: mainland directors vs. overseas directorsa Mainland directors Overseas directors Two-tailed p-value of
N mean median N mean median t-test Wilcoxon
test
Include year 2005 565 14.344 0.000 187 21.950 0.000 0.0033 0.0106
Exclude year 2005 312 17.269 0.000 84 25.496 0.000 0.0442 0.0483
a Overseas directors are defined as directors who are either foreign country citizens or overseas Chinese from HK, Taiwan, Macau or any other foreign country. The remaining directors are classified as mainland directors. The sample contains all the vested stock options over 1991-2005. The unit of observation is a firm-director. Exercise year zero is defined as the latter of the stock option vesting year or a director’s appointment year. The descriptive statistics are computed as follows. First, for each outstanding stock option grant, we compute the total number of vested stock options (split adjusted) that a director holds at the beginning of exercise year zero. Second, for each outstanding stock option grant, we compute the cumulative percentage of vested stock options that have been exercised from the vesting year to a director’s last year during our sample period 1991-2005. Third, for each firm-director, we compute the value weighted mean cumulative percentage of exercised stock options, where the weight is each grant’s total number of vested stock options at the beginning of exercise year zero. Finally, we compute the descriptive statistics in the table based on the firm-director-exercise years in step three. Because a director’s tenure could be truncated for the directors whose last year is 2005, we compute the descriptive statistics both including and excluding the directors whose last year is 2005.
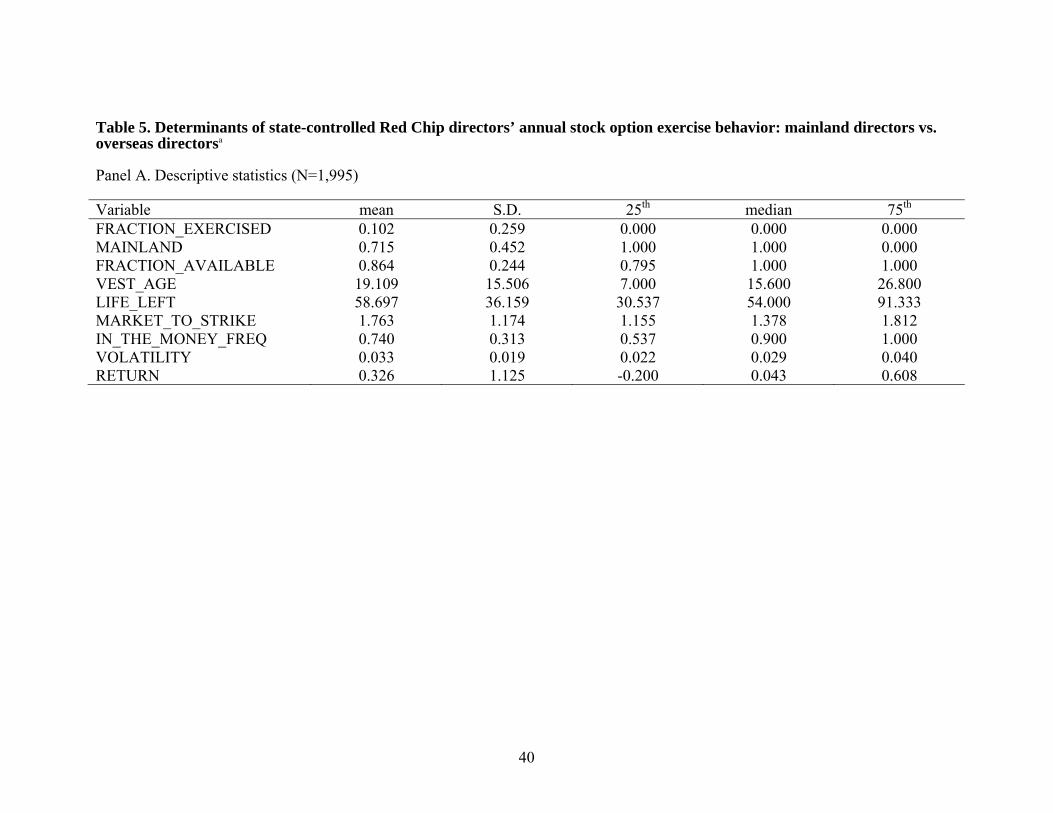
40
Table 5. Determinants of state-controlled Red Chip directors’ annual stock option exercise behavior: mainland directors vs. overseas directorsa Panel A. Descriptive statistics (N=1,995) Variable mean S.D. 25th median 75th FRACTION_EXERCISED 0.102 0.259 0.000 0.000 0.000 MAINLAND 0.715 0.452 1.000 1.000 0.000 FRACTION_AVAILABLE 0.864 0.244 0.795 1.000 1.000 VEST_AGE 19.109 15.506 7.000 15.600 26.800 LIFE_LEFT 58.697 36.159 30.537 54.000 91.333 MARKET_TO_STRIKE 1.763 1.174 1.155 1.378 1.812 IN_THE_MONEY_FREQ 0.740 0.313 0.537 0.900 1.000 VOLATILITY 0.033 0.019 0.022 0.029 0.040 RETURN 0.326 1.125 -0.200 0.043 0.608
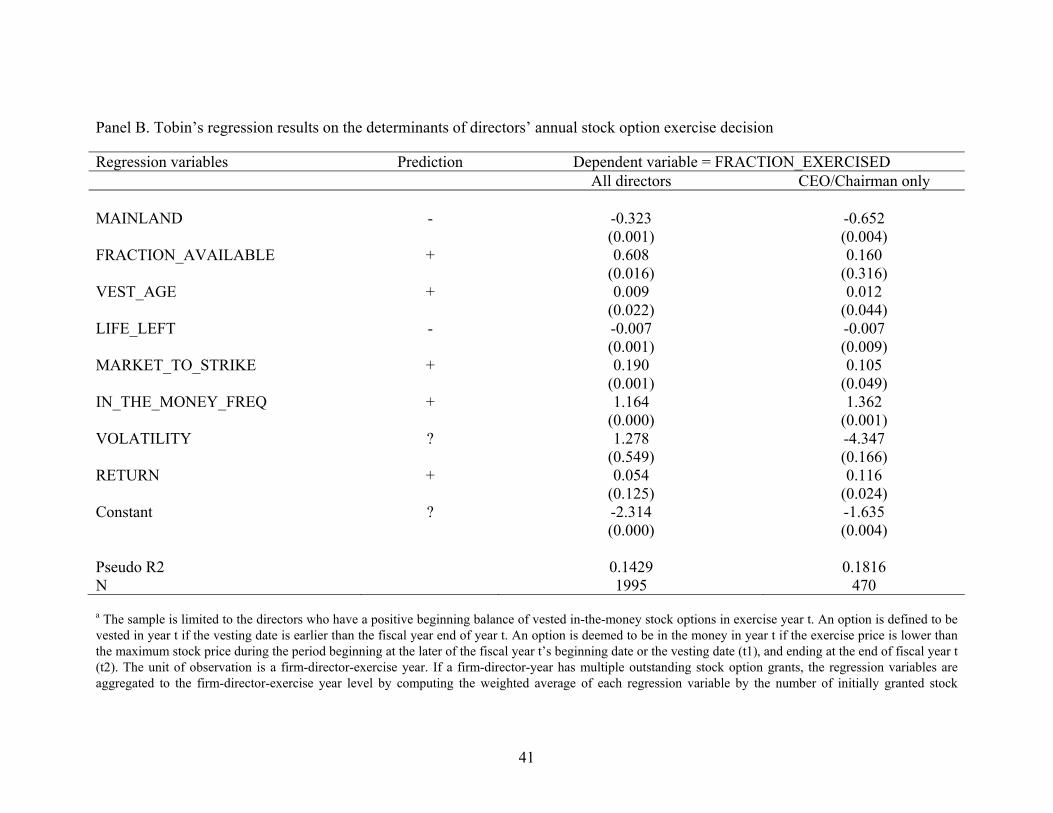
41
Panel B. Tobin’s regression results on the determinants of directors’ annual stock option exercise decision Regression variables Prediction Dependent variable = FRACTION_EXERCISED
All directors CEO/Chairman only
MAINLAND - -0.323 -0.652 (0.001) (0.004) FRACTION_AVAILABLE + 0.608 0.160 (0.016) (0.316) VEST_AGE + 0.009 0.012 (0.022) (0.044) LIFE_LEFT - -0.007 -0.007 (0.001) (0.009) MARKET_TO_STRIKE + 0.190 0.105 (0.001) (0.049) IN_THE_MONEY_FREQ + 1.164 1.362 (0.000) (0.001) VOLATILITY ? 1.278 -4.347 (0.549) (0.166) RETURN + 0.054 0.116 (0.125) (0.024) Constant ? -2.314 -1.635
(0.000) (0.004)
Pseudo R2 0.1429 0.1816 N 1995 470 a The sample is limited to the directors who have a positive beginning balance of vested in-the-money stock options in exercise year t. An option is defined to be vested in year t if the vesting date is earlier than the fiscal year end of year t. An option is deemed to be in the money in year t if the exercise price is lower than the maximum stock price during the period beginning at the later of the fiscal year t’s beginning date or the vesting date (t1), and ending at the end of fiscal year t (t2). The unit of observation is a firm-director-exercise year. If a firm-director-year has multiple outstanding stock option grants, the regression variables are aggregated to the firm-director-exercise year level by computing the weighted average of each regression variable by the number of initially granted stock
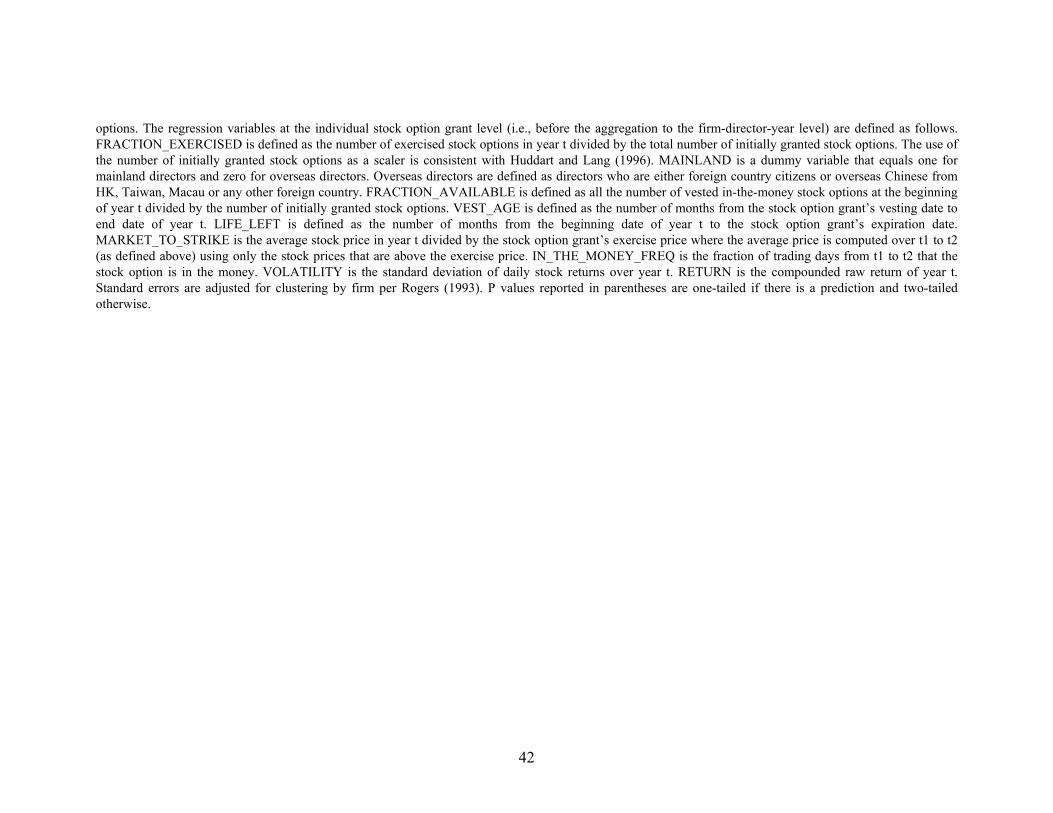
42
options. The regression variables at the individual stock option grant level (i.e., before the aggregation to the firm-director-year level) are defined as follows. FRACTION_EXERCISED is defined as the number of exercised stock options in year t divided by the total number of initially granted stock options. The use of the number of initially granted stock options as a scaler is consistent with Huddart and Lang (1996). MAINLAND is a dummy variable that equals one for mainland directors and zero for overseas directors. Overseas directors are defined as directors who are either foreign country citizens or overseas Chinese from HK, Taiwan, Macau or any other foreign country. FRACTION_AVAILABLE is defined as all the number of vested in-the-money stock options at the beginning of year t divided by the number of initially granted stock options. VEST_AGE is defined as the number of months from the stock option grant’s vesting date to end date of year t. LIFE_LEFT is defined as the number of months from the beginning date of year t to the stock option grant’s expiration date. MARKET_TO_STRIKE is the average stock price in year t divided by the stock option grant’s exercise price where the average price is computed over t1 to t2 (as defined above) using only the stock prices that are above the exercise price. IN_THE_MONEY_FREQ is the fraction of trading days from t1 to t2 that the stock option is in the money. VOLATILITY is the standard deviation of daily stock returns over year t. RETURN is the compounded raw return of year t. Standard errors are adjusted for clustering by firm per Rogers (1993). P values reported in parentheses are one-tailed if there is a prediction and two-tailed otherwise.

43
Table 6. The determinants of state-controlled Red Chip firms’ stock option scheme adoption decisiona
Prediction Dependent variable =ADOPTION
Regression variables
Both the dependent and independent variables are measured in the
same year
The independent variables lag the
dependent variable by one year
LNQ + 0.135 0.265 (0.342) (0.264) LEVERAGE - 0.423 1.148 (0.692) (0.875) NONPOS_CFO - 0.126 -0.298 (0.626) (0.275) DIVIDEND + 0.652 -0.589 (0.071) (0.856) DIRECTOR_OWN - -1.025 -1.203 (0.194) (0.120) PARENT_OWN - 0.385 -0.918 (0.611) (0.283) LNTA ? 0.080 0.055 (0.586) (0.782) ROA ? 1.283 2.353 (0.274) (0.085)
Year fixed effects yes yes
P value of the logit model R2
0.109 0.137
N 240 166 a The sample includes all the years from the IPO year to 2005 (the last year of our sample) for the firms that have not adopted a stock option scheme as of 2005 and all the years up to the first stock option adoption year for the firms that have adopted a stock option scheme as of 2005. LNQ is natural logarithm of Tobin’s Q. Q is defined as (TA-BV+MV)/TA, where TA, BV, and MV are book value of total assets, book value of common equity, and market value of common shares outstanding, respectively, all measured at the fiscal year-end. LEVERAGE is defined as total debt divided by TA. NONPOS_CFO is a dummy variable that equals one if the cash flows from operation (CFO) is non-positive, and zero otherwise. DIVIDEND is a dummy variable that equals one if the firm paid cash dividends in the year and zero otherwise. DIRECTOR_OWN is percentage of common shares held by all directors, measured at fiscal year end. PARENT_OWN is ownership by the immediate largest shareholder. LNTA is natural logarithm of TA. ROA is net income divided by the average TA. ROA is winsorized between 1% and 99%. Standard errors are adjusted for clustering by firm per Rogers (1993). P values reported in parentheses are one-tailed if there is a prediction and two-tailed otherwise.

44
Table 7. Stock market reactions to announcements of stock option scheme proposalsa Sample before excluding
confounding events Sample after excluding
confounding events N 70 57 Mean CAR -0.005 -0.003 Median CAR -0.006 -0.003 Two-tailed p-value of t-test 0.582 0.729 Two-tailed p-value of Wilcoxon test 0.133 0.181
a CAR is the cumulative market adjusted abnormal return (dividend inclusive) over [-1, +1] trading days around the stock option scheme proposal announcement date. Confounding news are all earnings related announcements identified from the HKSE’s research library.

45
Table 8. Changes in state-controlled Red Chip firms’ accounting performance around the year of stock option grantsa Panel A. Granting firm years that issued new stock options to at least one director
Mean (median) ROA Mean (median) change in ROA Year t-1 Year t Year t+1 Year t-1 to t Year t-1 to t+1 Granting firms 0.042 (0.041) 0.039 (0.043) 0.034 (0.044) -0.003 (0.002) -0.010 (0.002) Control firms 0.043 (0.040) 0.044 (0.035) 0.035 (0.032) 0.000 (-0.001) -0.010 (-0.003) Differences -0.001 (0.000) -0.004 (0.005) -0.001 (0.008) -0.003 (0.001) 0.000 (0.006) N 436 436 418 436 418 Two tailed p-value of t-test 0.782 0.459 0.921 0.565 0.987 Wilcoxon test 0.888 0.401 0.090 0.964 0.362
Panel B. Granting firm years that issued new stock options to at least one CEO/Chairman
Mean (median) ROA Mean (median) change in ROA Year t-1 Year t Year t+1 Year t-1 to t Year t-1 to t+1 Granting firms 0.042 (0.041) 0.045 (0.043) 0.041 (0.043) 0.003 (0.003) -0.003 (0.003) Control firms 0.043 (0.042) 0.044 (0.035) 0.038 (0.033) 0.001 (0.000) -0.006 (-0.002) Differences -0.001 (0.000) 0.001 (0.005) 0.002 (0.007) 0.002 (0.001) 0.004 (0.005) N 372 372 356 372 356 Two tailed p-value of t-test 0.751 0.901 0.758 0.724 0.657 Wilcoxon test 0.839 0.252 0.141 0.846 0.443

46
Panel C. Granting firm years whose Black-Scholes values of the annual stock option grants to all directors are greater than the median
Mean (median) ROA Mean (median) change in ROA Year t-1 Year t Year t+1 Year t-1 to t Year t-1 to t+1 Granting firms 0.050 (0.050) 0.056 (0.050) 0.039 (0.048) 0.006 (0.000) -0.013 (0.003) Control firms 0.049 (0.047) 0.051 (0.045) 0.040 (0.036) 0.002 (-0.001) -0.011 (-0.004) Differences 0.001 (0.000) 0.005 (0.008) -0.001 (0.012) 0.004 (-0.002) -0.002 (0.006) N 202 202 192 202 192 Two tailed p-value of t-test 0.840 0.461 0.958 0.596 0.888 Wilcoxon test 0.601 0.318 0.152 0.985 0.530 Panel D. Granting firm years that issued new stock options to at least one director: use OROA as the performance measure
Mean (median) OROA Mean (median) change in OROA Year t-1 Year t Year t+1 Year t-1 to t Year t-1 to t+1 Granting firms 0.033 (0.038) 0.033 (0.034) 0.017 (0.027) 0.000 (0.001) -0.013 (-0.007) Control firms 0.033 (0.038) 0.034 (0.034) 0.033 (0.030) 0.001 (0.001) 0.003 (-0.003) Differences 0.000 (0.000) -0.001 (0.002) -0.016 (-0.011) -0.001 (0.001) -0.016 (-0.014) N 166 166 142 166 142 Two tailed p-value of t-test 0.592 0.853 0.026 0.890 0.025 Wilcoxon test 0.871 0.761 0.046 0.826 0.041 a ROA is defined as the annual net income divided by the average total assets at the beginning and end of the year. OROA is defined as the annual operating income divided by the average total assets at the beginning and end of the year. Both ROA and OROA are winsorized at the 1% and 99%. Granting firms refer to the state-controlled Red Chip firm years (i.e., year t) that have granted new stock options to at least one director (or CEO/Chairman in Panel B). Control firms refer to state-controlled H/Red Chip firms that have not initiated stock option grants as of year t and are matched (with replacement) with the granting firms based on two-digit industry and ROA (OROA in Panel D) in year t-1.