Effect of Principal Managerial Leadership and Compensation ... · Published by Canadian Center of...
12
International Education Studies; Vol. 10, No. 1; 2017 ISSN 1913-9020 E-ISSN 1913-9039 Published by Canadian Center of Science and Education 233 Effect of Principal Managerial Leadership and Compensation towards Physics Teacher Performance in Senior High School in Baguala District-Ambon Izaak Hendrik Wenno 1 1 Physics Education Orogram, Faculty of Teaching and Education, Pattimura University, Ambon-Maluku, Indonesia Correspondence: Izaak Hendrik Wenno, Physics Education Orogram, Faculty of Teaching and Education, Pattimura University, Ambon-Maluku, Indonesia. E-mail: [email protected] Received: May 30, 2016 Accepted: July 1, 2016 Online Published: December 26, 2016 doi:10.5539/ies.v10n1p233 URL: http://dx.doi.org/10.5539/ies.v10n1p233 Abstract The performance of teachers is an important factor that must be considered in efforts to improve the quality of education. Teacher’s performance is affected by many factors. Factors that affect the performance of teachers are principals’ managerial leadership and compensation. The purpose of this study was to determine the effect of principals’ managerial leadership and compensation to the performance of physical science teachers in senior high schools in the district Baguala Ambon city. This type of research is quantitative design. The instrument was used questionnaire. The variables studied were the principal managerial leadership (X 1 ), compensation (X 2 ) as independent variables and performance of science physics teachers (Y) as dependent variable. Prior to use in the true research, the validity and reliability of these instrument was done. To reveal relationships between variables, correlation analysis was performed, while to know the effect of independent variables on the dependent variable regression analysis also performed. Analysis of the validity, reliability, correlation and regression analysis was performed using SPSS program version of 18.0 for windows. The results showed that between principal managerial leadership and teacher performance there is a very high correlation. Between compensation with the performance have high correlation and the combination of principals’ managerial leadership and compensation with the performance there is a very high correlation. Regression analysis showed that the independent variables principals managerial leadership and compensation, or a combination of both contribute to or affect the performance of physical science teacher at senior high school in the district Baguala. Keywords: physics education, teacher performance, leadership, Baguala 1. Introduction Nowadays, many obstacles have faced by the government in improving the quality of learning and education. One of the obstacles to improve the quality of learning is inequity in the quality of teachers in schools. As well known, teachers are the main factor that determines the success of the learning process. The quality of teachers, both academic and non-academic, influences the quality of learning and education in general (Arifin, 2013). In Maluku context, until now the quality of education has not shown significant improvement. Some reports of competency test placed Maluku in the lowest position. Teacher competency test results during the last five years have always put Maluku in the final rankings. The results of initial competency tests of teacher for certification in 2015 also showed that Maluku was placed in the final ranking of five provinces with a lower score (34.5) than the highest value of national score (50.1). The low quality of teachers is basically an accumulation of many factors that affect the competence of teachers. Teacher performance is basically a part of teachers’ competencies related to professional competence, pedagogical competence, social competence and personal competence. If these competences of teachers are low, teacher’s performance will also be low (Arifin, 2015a). Teacher performance was affected by many factors. According to Tambunan (2014) and Yani et al. (2015) factors that affected teachers performance consist of school leadership, teachers’ interests, attitudes of teachers, teacher motivation, teacher’s creativity, school culture, facility or infrastructure, job satisfaction, achievement motivation, and compensation.
Transcript of Effect of Principal Managerial Leadership and Compensation ... · Published by Canadian Center of...

International Education Studies; Vol. 10, No. 1; 2017 ISSN 1913-9020 E-ISSN 1913-9039
Published by Canadian Center of Science and Education
233
Effect of Principal Managerial Leadership and Compensation towards Physics Teacher Performance in Senior High School in Baguala
District-Ambon
Izaak Hendrik Wenno1 1 Physics Education Orogram, Faculty of Teaching and Education, Pattimura University, Ambon-Maluku, Indonesia
Correspondence: Izaak Hendrik Wenno, Physics Education Orogram, Faculty of Teaching and Education, Pattimura University, Ambon-Maluku, Indonesia. E-mail: [email protected]
Received: May 30, 2016 Accepted: July 1, 2016 Online Published: December 26, 2016
doi:10.5539/ies.v10n1p233 URL: http://dx.doi.org/10.5539/ies.v10n1p233
Abstract The performance of teachers is an important factor that must be considered in efforts to improve the quality of education. Teacher’s performance is affected by many factors. Factors that affect the performance of teachers are principals’ managerial leadership and compensation. The purpose of this study was to determine the effect of principals’ managerial leadership and compensation to the performance of physical science teachers in senior high schools in the district Baguala Ambon city. This type of research is quantitative design. The instrument was used questionnaire. The variables studied were the principal managerial leadership (X1), compensation (X2) as independent variables and performance of science physics teachers (Y) as dependent variable. Prior to use in the true research, the validity and reliability of these instrument was done. To reveal relationships between variables, correlation analysis was performed, while to know the effect of independent variables on the dependent variable regression analysis also performed. Analysis of the validity, reliability, correlation and regression analysis was performed using SPSS program version of 18.0 for windows. The results showed that between principal managerial leadership and teacher performance there is a very high correlation. Between compensation with the performance have high correlation and the combination of principals’ managerial leadership and compensation with the performance there is a very high correlation. Regression analysis showed that the independent variables principals managerial leadership and compensation, or a combination of both contribute to or affect the performance of physical science teacher at senior high school in the district Baguala.
Keywords: physics education, teacher performance, leadership, Baguala
1. Introduction Nowadays, many obstacles have faced by the government in improving the quality of learning and education. One of the obstacles to improve the quality of learning is inequity in the quality of teachers in schools. As well known, teachers are the main factor that determines the success of the learning process. The quality of teachers, both academic and non-academic, influences the quality of learning and education in general (Arifin, 2013). In Maluku context, until now the quality of education has not shown significant improvement. Some reports of competency test placed Maluku in the lowest position. Teacher competency test results during the last five years have always put Maluku in the final rankings. The results of initial competency tests of teacher for certification in 2015 also showed that Maluku was placed in the final ranking of five provinces with a lower score (34.5) than the highest value of national score (50.1).
The low quality of teachers is basically an accumulation of many factors that affect the competence of teachers. Teacher performance is basically a part of teachers’ competencies related to professional competence, pedagogical competence, social competence and personal competence. If these competences of teachers are low, teacher’s performance will also be low (Arifin, 2015a).
Teacher performance was affected by many factors. According to Tambunan (2014) and Yani et al. (2015) factors that affected teachers performance consist of school leadership, teachers’ interests, attitudes of teachers, teacher motivation, teacher’s creativity, school culture, facility or infrastructure, job satisfaction, achievement motivation, and compensation.

ies.ccsenet.org International Education Studies Vol. 10, No. 1; 2017
234
School leadership affects teacher performance. This can be very understandable, because the principal is a central figure in the school’s management especially in quality improvement of the school. The school principal is the highest office of a school organization, and has a vital role in developing school as an institution (Fitriati et al., 2014). As stated by Abdullah et al. (2008) a very important role in school is the managerial ability of a principal.
Managerial leadership of a school principal is important and necessary to manage education in schools effectively and efficiently to achieve quality education expected by all parties. The school principal is the actual organization manager who did the strategies that have been decided to achieve educational goals. As a manager, the principal must have the ability to perform managerial functions concerning management activities such as planning, organizing, and controlling actuating (Tobin, 2014).
The principal managerial functions have been widely studied in the literature. In Indonesia, the function of school leadership as a manager was stipulated in the regulations of the Minister of National Education the Republic of Indonesia Number 13 in 2007. Under these laws, it is explained that managerial functions of the principal is school ranging from planning, development, utilization and empowerment of all elements in the school, including teachers, administration, students and infrastructure that exist in the schools to be used as possible to improve the quality of schools, teacher quality, and the quality of student. Principals managerial leadership will greatly affect the performance of teachers when supported with a great attention to the welfare of teachers. According to Sedarmayanti (2011), the theory of motivation implemented in pay incentive plans work is that the task given is always relates to the payment, and this affects the increase in employee productivity. According to Jensen (2010) the level of performance is closely related to the workers’ compensation system applied by the institution or organization they work. The compensation of improper influence increases one’s performance. Inaccuracy of the compensation due to the provision of compensation was less attractive, nor is the award less precise does not make workers feel attracted to it. As a result, workers have no desire to improve their performance to get the compensation.
To improve the quality of the performance, it is necessary to adequately welfare level of compensation in the form of an essential right and a commitment to supported by the loyalty and the willingness of high employment and conducive of work climate as an school organization. One strategy used to improve the performance of teachers in school is the compensation program. With the award of compensation it is expected to improve the performance of teachers in teaching in schools. With compensation, school climate and commitment will improve performance or of peak performance (Saani, 2013). As stated by Sofo et al. (2012) the gap between attention of policy makers in the region and between schools leading a loss of management efficiency. This situation could affect the compensation is not right on time, so it can affect the performance of teachers.
It still reminds that teachers whose prosper economically tend to support their teaching job. Teachers do not bother thinking about family and financial needs. If all needs are met, teachers will focus on their duties, they will do anything to support and enrich their knowledge. With financially well-off, teachers also have the opportunity to continue their education to a higher level so that teachers will be more competent.
Physics is a subject that requires teachers with high competence and high performance. This is caused by learning physics requires deep exploration and purposed to make deep understanding in students. Common reality encountered that when teachers teach physics, they do not teach in earnest. Sometimes physics teachers teach physics just to meet the modest achievement of the curriculum, regardless of whether students have understood the lesson they have taught.
Results of preliminary observations at the secondary school in the Baguala district have found that physics teachers as much as twenty five teachers have already obtained certification allowance. However, this allowance are not always right on time and other incentives are also irregular, and sometimes this condition affect the performance of teachers.
The compensation is not solely always associated with money, but with regard to the award or reward of achievement in the slightest form. But this is rarely obtained by the teacher and it is allegedly that this situation deals with school leadership. Therefore, the researchers want to conduct to reveal the impact of school leadership and compensation to the performance of physical science teachers in secondary schools in the district Baguala Ambon city. The purpose of this study was to determine the effect of managerial leadership principals on physics
teacher’s performance, to determine the effect of compensation to the physics teacher’s performance, and to determine the effect of managerial leadership principals and compensation collectively to the performance of physics teacher at the senior high schools in district Baguala Ambon City.

ies.ccsenet.
2. Method2.1 Site an
This resea2015-2016
2.2 Popula
The populteachers. 2.3 Resear
The variaband compe
2.4 Resear
The instrusecondary (X2). Each(4), suffici
2.5 Resear
This studyto use in thphysics teaIf the protesting fol70 %, thevalidity anfive scienc
2.6 Data A
Data obtaquantitativvariable (ttogether wperformedwas condumultiple co
org
dology nd Time
arch was cond6 academic yea
ation and Samp
lation in this s
rch Variable
bles in this stuensation (X2),
rch Instrument
ument used in school in dist
h statement wiient (3), unsati
rch Procedure
y began with prhe real researcacher as responduct-moment lowing the Cr
en the instrumnd reliability wce physics teac
Analysis
ained from thvely. To determteacher performwas done withd using bivariatucted by usingorrelations as s
ducted in five ar. ple
study is all Ph
udy consisted oand the depend
Fi
ts
this study is atrict Baguala Aill be answeredisfy (2), and ve
reparation of ich, the instrumndents in five correlation co
ronbach alpha ment is reliablewas conducted,cher.
he results of mine the relatmance) and X2
h correlation ate correlation ag multiple corshown in Tabl
Internation
secondary sc
hysics teacher
of the independent variable,
igure 1. Frame
a questionnaireAmbon City (Yd by the respoery unsatisfy (1
instrument for ment was tested
schools. Test ooefficient > 0.coefficient for
e (Hilton & B the valid and
questionnairetionship betwe
2 (Compensatioanalysis. The analysis or simrrelation analye 1 below:
nal Education Stu
235
chools in Dist
in 5 secondar
ndent variable,
including phys
e work of resea
e used to measY), principals’ ondents with fi1).
two independd for its validityof the validity.25 the item irmula. If the v
Brownlow, 200reliable instru
e by 25 physeen X1 variabon) with Y varcorrelation be
mple, whereas ysis. Test crite
udies
trict Baguala A
ry schools in
including Prinsics teacher pe
arch design
sure the performanagerial le
ive answer cho
ent variables ay and reliabilit
y was based onis valid (Margvalue of Cronb04; Lounsburyument then use
sics teacher wbles (Principalriable (the teacetween the vathe correlationeria were use
Ambon during
districts Bagu
ncipal managererformance (Y
rmance of phyeadership (X1),oices i,e: very
and one dependty. The trial wa
n the product mguiriete et al.,bach alpha coey et al., 2006)e for really rese
was analyzed l managerial lcher performanariables X1 ann between X1, d both bivaria
Vol. 10, No. 1;
g first semest
uala as much a
rial leadership) (Figure 1).
ysics teacher i, and compens
y satisfy (5), sa
dent variable. as conducted o
moment correla 2006). Reliabefficients > 0.7). After the teearch for all tw
using descrileadership) wince) either alond X2 with YX2 and Y toge
ate correlation
2017
er of
as 25
(X1)
n the ation atisfy
Prior on 20 ation. bility 70 or est of wenty
ptive ith Y ne or
Y was ether, n and

ies.ccsenet.
Table 1. C
Creswell (
Before co(number oX2-Y togeto Y usingsignificanc0.05 the coX2 to Y, acorrelation
3. Results3.1 Analys
Questionnvariable. TrespondenThe recapithe 35 item
Data in Fiteachers (Y
3.2 The Re
Validity teinstrumentthe validityFormerly,
org
riteria for corr
Product-M
(2005).
rrelation test of sample less tther linearly o
g t test, wherece value > 0.05orrelation is linand X1, X2 togn and regressio
and Discussisis of Question
naire data is thThe average s
nts fall into the itulation of the
m for Y variabl
F
gure 2 shows Y) are in the sa
esults of Validi
est is done to t means that thy of an instrumDiem (2002)
relation result i
Moment Coefficien
0.00-0.199
0.20-0.399
0.40-0.599
0.60-0.799
0.80-1.00
was conductethan 30). To de
or not, the signas among the 5 the correlationear, or both Xgether to Y thon was done w
on nnaire Data
he result of thscore of respocategory of ve
e average respoles are valid an
Figure 2. Avera
that the variabatisfy category
ity and Reliabi
determine the he statement cment shows th
was argued t
Internation
interpretation
nt correlation
ed, the normaetermine whet
nificance of thvariables X1,
on is not lineaX1 and X2 varihe regression awith the assistan
e calculation ondents was uery satisfy (5),onse of 25 respnd used in the
age score of re
ble of principay, while the var
ility Test of Ins
validity of itecould representhe ability of thethat in order t
nal Education Stu
236
ality of data wther the correlae correlation cX2-Y together
ar, or there is niables affect Yanalysis was pnce of comput
of average resused in order, satisfy (4), supondents for threally research
espondents for
al managerial lriable compens
strument
em. Invalid itet the topic whe instruments to obtain a va
udies
Cri
Very
Lo
Med
Hi
Very
was tested usiation between coefficient alsor, used F test.
no influence ofY. To know the performed. Aner program SP
spondents for ar to determineufficient (3), uhe 35 item of vh as shown in F
r X1, X2 and Y
leadership (X1
sation in the su
em is not usedhich was studieto measure prealid instrumen
teria
y low
ow
dium
igh
y high
ing Shapiro Wthe variables Xo conducted. B
Test criteria wf variables X1 contribution o
nalysis of the vPSS version 21
all items of ine whether the
unsatisfy (2) orvariables X1 , 2Figure 2.
variables
) and the qualufficient categ
d in this studyed. According ecisely what it
nt in accordan
Vol. 10, No. 1;
Wilk normalityX1-Y, X2-Y anBetween X1 anwas required ior X2 to Y. If
of variable X1
validity, reliab.0 for Window
nstruments on e average scorr very unsatisfy29 item for X2
lity of teachingory.
y. In contrast, to Weyner (2
t will be measnce with what
2017
y test d X1,
nd X2 if the sig < to Y,
bility, ws.
each re of y (1). 2, and
g and
valid 007), ured. it is
ies.ccsenet.org International Education Studies Vol. 10, No. 1; 2017
237
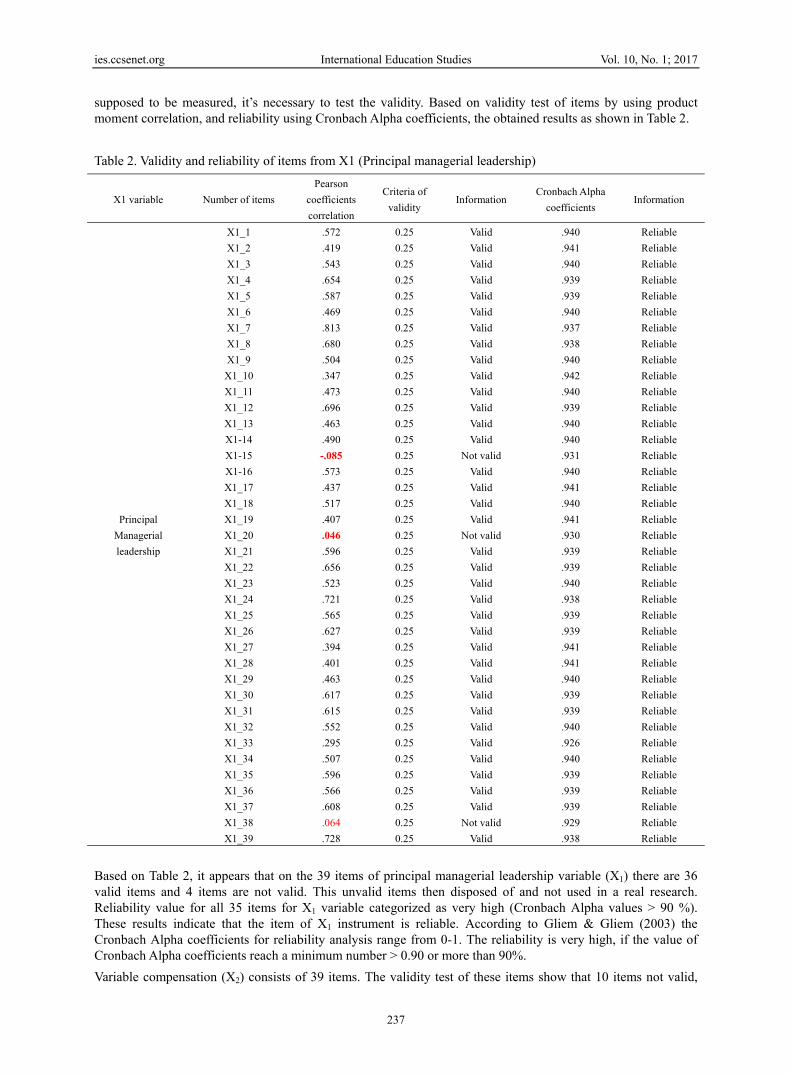
supposed to be measured, it’s necessary to test the validity. Based on validity test of items by using product moment correlation, and reliability using Cronbach Alpha coefficients, the obtained results as shown in Table 2.
Table 2. Validity and reliability of items from X1 (Principal managerial leadership)
X1 variable Number of items
Pearson
coefficients
correlation
Criteria of
validity Information
Cronbach Alpha
coefficients Information
Principal
Managerial
leadership
X1_1 .572 0.25 Valid .940 Reliable
X1_2 .419 0.25 Valid .941 Reliable
X1_3 .543 0.25 Valid .940 Reliable
X1_4 .654 0.25 Valid .939 Reliable
X1_5 .587 0.25 Valid .939 Reliable
X1_6 .469 0.25 Valid .940 Reliable
X1_7 .813 0.25 Valid .937 Reliable
X1_8 .680 0.25 Valid .938 Reliable
X1_9 .504 0.25 Valid .940 Reliable
X1_10 .347 0.25 Valid .942 Reliable
X1_11 .473 0.25 Valid .940 Reliable
X1_12 .696 0.25 Valid .939 Reliable
X1_13 .463 0.25 Valid .940 Reliable
X1-14 .490 0.25 Valid .940 Reliable
X1-15 -.085 0.25 Not valid .931 Reliable
X1-16 .573 0.25 Valid .940 Reliable
X1_17 .437 0.25 Valid .941 Reliable
X1_18 .517 0.25 Valid .940 Reliable
X1_19 .407 0.25 Valid .941 Reliable
X1_20 .046 0.25 Not valid .930 Reliable
X1_21 .596 0.25 Valid .939 Reliable
X1_22 .656 0.25 Valid .939 Reliable
X1_23 .523 0.25 Valid .940 Reliable
X1_24 .721 0.25 Valid .938 Reliable
X1_25 .565 0.25 Valid .939 Reliable
X1_26 .627 0.25 Valid .939 Reliable
X1_27 .394 0.25 Valid .941 Reliable
X1_28 .401 0.25 Valid .941 Reliable
X1_29 .463 0.25 Valid .940 Reliable
X1_30 .617 0.25 Valid .939 Reliable
X1_31 .615 0.25 Valid .939 Reliable
X1_32 .552 0.25 Valid .940 Reliable
X1_33 .295 0.25 Valid .926 Reliable
X1_34 .507 0.25 Valid .940 Reliable
X1_35 .596 0.25 Valid .939 Reliable
X1_36 .566 0.25 Valid .939 Reliable
X1_37 .608 0.25 Valid .939 Reliable
X1_38 .064 0.25 Not valid .929 Reliable
X1_39 .728 0.25 Valid .938 Reliable
Based on Table 2, it appears that on the 39 items of principal managerial leadership variable (X1) there are 36 valid items and 4 items are not valid. This unvalid items then disposed of and not used in a real research. Reliability value for all 35 items for X1 variable categorized as very high (Cronbach Alpha values > 90 %). These results indicate that the item of X1 instrument is reliable. According to Gliem & Gliem (2003) the Cronbach Alpha coefficients for reliability analysis range from 0-1. The reliability is very high, if the value of Cronbach Alpha coefficients reach a minimum number > 0.90 or more than 90%.
Variable compensation (X2) consists of 39 items. The validity test of these items show that 10 items not valid,

ies.ccsenet.org International Education Studies Vol. 10, No. 1; 2017
238
and still remains 29 valid items and can be used for further research. As same as the X1 variable. The criteria for validity that used if the value of the Product-Moment correlation coefficient > 0.25, while the reliability of items is categorized as very high (Cronbach’s Alpha coefficient values > 90 %) (Table 3).
Table 3. Validity and reliability of X2 (Compensation)
X2 Variable Number of
instrument
Pearson
correlation
coefficient
Criteria for
validity Information
Alpha Cronbach
coefficient Reliability
Compensation
X2_1 .547 0.25 Valid .928 Reliable
X2_2 .352 0.25 Valid .930 Reliable
X2_3 .571 0.25 Valid .927 Reliable
X2_4 .671 0.25 Valid .926 Reliable
X2_5 .631 0.25 Valid .926 Reliable
X2_6 .544 0.25 Valid .927 Reliable
X2_7 .559 0.25 Valid .927 Reliable
X2_8 .666 0.25 Valid .926 Reliable
X2_9 .673 0.25 Valid .925 Reliable
X2_10 .473 0.25 Valid .928 Reliable
X2_11 .353 0.25 Valid .930 Reliable
X2_12 .739 0.25 Valid .926 Reliable
X2_13 .664 0.25 Valid .926 Reliable
X2_14 .594 0.25 Valid .927 Reliable
X2_15 .297 0.25 Valid .932 Reliable
X2_16 .520 0.25 Valid .928 Reliable
X2_17 .554 0.25 Valid .927 Reliable
X2_18 .606 0.25 Valid .926 Reliable
X2_19 .423 0.25 Valid .929 Reliable
X2_20 .518 0.25 0,25 .928 Reliable
X2_21 .571 0.25 0,25 .927 Reliable
X2_22 .564 0.25 0,25 .927 Reliable
X2_23 .688 0.25 0,25 .925 Reliable
X2_24 .755 0.25 0,25 .924 Reliable
X2_25 .507 0.25 0,25 .928 Reliable
X2_26 .548 0.25 0,25 .927 Reliable
X2_27 .561 0.25 0,25 .928 Reliable
X2_28 .461 0.25 0,25 .928 Reliable
X2_29 .305 0.25 0,25 .930 Reliable
X2_30 .021 0.25 Not valid .895 Reliable
X2_31 -.036 0.25 Not valid .893 Reliable
X2_32 .161 0.25 Not valid .892 Reliable
X2_33 .189 0.25 Not valid .893 Reliable
X2_34 .114 0.25 Not valid .894 Reliable
X2_35 -.037 0.25 Not valid .897 Reliable
X2_36 -.031 0.25 Not valid .897 Reliable
X2_37 -.188 0.25 Not valid .898 Reliable
X2_38 .224 0.25 Not valid .892 Reliable
X2_39 .152 0.25 Not valid .893 Reliable
Teacher performance variable (Y) consists of 35 items. The validiy test result shows that all of 35 such items is valid and has high reliability (Cronbach’s alpha coefficient values > 90 %) (Table 4).

ies.ccsenet.org International Education Studies Vol. 10, No. 1; 2017
239
Table 4. Validity and reliability result of Y variable (physics teacher’s performance)
Y Variable Number of
items
Pearson correlation
coefficient Criteria Information
Cronbach Alpha
coefficients Reliability
Physics Teacher’s
Performance
Y_1 .795 0.25 Valid .969 Reliable
Y_2 .696 0.25 Valid .970 Reliable
Y_3 .853 0.25 Valid .969 Reliable
Y_4 .806 0.25 Valid .969 Reliable
Y_5 .852 0.25 Valid .969 Reliable
Y_6 .905 0.25 Valid .969 Reliable
Y_7 .812 0.25 Valid .969 Reliable
Y_8 .827 0.25 Valid .969 Reliable
Y_9 .831 0.25 Valid .969 Reliable
Y_10 .770 0.25 Valid .969 Reliable
Y_11 .862 0.25 Valid .969 Reliable
Y_12 .916 0.25 Valid .969 Reliable
Y_13 .923 0.25 Valid .969 Reliable
Y_14 .827 0.25 Valid .969 Reliable
Y_15 .870 0.25 Valid .969 Reliable
Y_16 .887 0.25 Valid .969 Reliable
Y_17 .935 0.25 Valid .969 Reliable
Y_18 .933 0.25 Valid .969 Reliable
Y_19 .702 0.25 Valid .970 Reliable
Y_20 .792 0.25 Valid .969 Reliable
Y_21 .768 0.25 Valid .969 Reliable
Y_22 .838 0.25 Valid .969 Reliable
Y_23 .669 0.25 Valid .970 Reliable
Y_24 .667 0.25 Valid .970 Reliable
Y_25 .510 0.25 Valid .971 Reliable
Y_26 .265 0.25 Valid .973 Reliable
Y_27 .307 0.25 Valid .972 Reliable
Y_28 .495 0.25 Valid .971 Reliable
Y_29 .537 0.25 Valid .971 Reliable
Y_30 .278 0.25 Valid .972 Reliable
Y_31 .450 0.25 Valid .971 Reliable
Y_32 .395 0.25 Valid .971 Reliable
Y_33 .570 0.25 Valid .970 Reliable
Y_34 .643 0.25 Valid .970 Reliable
Y_35 .595 0.25 Valid .970 Reliable
3.3 Results of Normality Test
Prior to correlation analysis the X1, X2, and Y variables were tested for its normality. The criteria for normality based on the significant value of Saphiro-Wilk at α 0.05. If the significance value is more than 0.05, the data is normal. Conversely, if the significance value < 0.05, the data are not normally distributed. Results of data normality test showed that the data of the three variables X1, X2, and Y is normal (Table 5).
Tabel 5. Result of normality data of X1, X2, and Y variables
Variables Significance of Saphiro-Wilk Information
X1 0.218 Normal
X2 0.637 Normal
Y 0.218 Normal
3.4 Results of Correlation Analysis
To determine the relationship between variables X1 (principals managerial leadership) and X2 (Compensation)

ies.ccsenet.org International Education Studies Vol. 10, No. 1; 2017
240
with a variable Y (the performance of physics teacher) partially or together, the correlation analysis was performed. The correlation between X1 with Y and X2 with Y variables performed using bivariate correlation analysis or simple correlation, whereas the correlation between X1, X2 and Y together, was conducted using multiple correlation analysis with the criteria as shown in Table 1, and the results was shown in Table 6 below:
Table 6. Correlation result of variables
Correlation Pearson coefficients correlation (R) Category
X1-Y 0.812 Very high
X2-Y 0.680 High
X1,X2-Y 0.848 Very high
3.5 The Results of Significance Test of Correlation Coefficient
To determine whether the correlation between the variables X1-Y, X2-Y and X1, X2-Y together linearly or not, the significance of the correlation coefficient were tested. Among the variables X1 and X2-Y the significance of the correlation coefficient test using the t test, whereas among the variables X1, X2-Y together used F test. Test criteria was required if the significance value > 0.05 the correlation formed is not linear, or there is no influence of variables X1 or X2 to Y. If p < 0.05 the correlation is linear, or in other words, both X1 and X2 variables affect the Y variable. The results of significance test of the correlation coefficient between X1 with Y, X2 with Y, and X1-X2 with Y together (Table 7). Table 7. Result of correlation coefficient significance test
Level of significance (α 0.05) Information
X1-Y 0.000 Sig/linier
X2-Y 0.000 Sig/linier
X1, X2-Y 0.000 Sig/linier
As seen in Table 7 the coefficient correlation between X1 with Y, X2 with Y, and X1-X2 with Y are linear or significant correlation, because the significance value < 0.005. 3.6 Regression Analysis
Regression analysis was conducted in order to determine the contribution of independent variables on the dependent variable. In this case, the variable X1 to Y, X2 to Y, and for both X1, X2 to Y variable (Table 8).
Table 8. Result of regression analysis
Variables Regression models Correlation
coefficient (R)
Determination
coefficient (R2)
Level of
significance α 0.05
Information
X1-Y Y = 0.821+0.611X1 0.812 0.660 (66 %) 0.000 sig/linier
X2-Y Y = 1.456+0.342X2 0.680 0.462 (46.2 %) 0.000 sig/linier
X1, X2-Y Y= 0.828+0.152X1+0.475X2 0.848 0.719 (71.9 %) 0.000 sig/linier
Contributions of independent variables (X1 and X2 ) to Y, can be seen through the coefficient of determination (R2). The data in Table 7 shows that the contribution of principals managerial leadership (X1) variable to the variable physics teacher performance (Y) is approximately 66%, while the contribution of variable compensation (X2) to the physics teacher performance (Y) is about 46.2 %. Combined these two variables jointly contribute to variable Y as much as 71.9 %. These results indicate that both principals managerial leadership variable and compensation gave a major contribution to the performance of physics teachers performance in secondary schools districts in Baguala Ambon city. 3.7 Discussion
3.7.1 Correlation between Principal Managerial Leadership with Physics Teacher Performance
The results showed that the relationship between principals managerial leadership and physics teacher performance is very high (r = 0.812) and the correlations are significant and linear. Results of regression analysis

ies.ccsenet.org International Education Studies Vol. 10, No. 1; 2017
241
also showed that managerial leadership principals affect teacher performance with a contribution of 66%. This result is associated with Figure 1 which shows that the principal managerial leadership is satisfy.
Principal or headmaster is the highest or top leader in a school organization. He has very important role in developing school-led institution. Managerial leadership is one of the seven core functions of the principal. The principal’s role as manager was stipulated by the regulation of the Minister of National Education of the Republic of Indonesia Number 13 in 2007. This laws set out the duties and managerial roles principals which consists of planning the school organization and development according to the needs. In order to optimally empowering schools, management change and development of the school should be implemented to create effective learning, empowering optimally relationship between school and community in order to find fresh ideas, learning resources, and school funding, and the placement and capacity development of learners.
Managerial functions of headmasters as defined in these regulations is to manage the development of curriculum and learning activities in accordance with the direction and objectives of national education, financial management of the school in accordance with the accountable principle of management, transparent, and efficient, manage school administration in supporting the achievement of the objectives of the school, managing special service unit of school in supporting learning and activities of students in school, manage the information systems of school in support programs and decision-making, utilizing advances in information technology to improve learning and school management, monitoring, evaluation and reporting the implementation of school program, as well as follow-up plans.
The regulation stated that managerial skills of principals including: planning, organizing, mobilization and supervision. The ability to manage a process to determine and achieve the goals that have been set through the utilization of human resources and other sources. In other words, management is the process of managing an organization to be able to achieve its intended purpose. Thus, as a manager, the principal demanded to make the planning, organizing, directing and monitoring. With good managerial abilities expected every school principal is able to be advocates and enforcers of discipline for teachers so that they are able to show good performance productivity.
The performance of teachers in secondary schools in Baguala district is in satisfiy category. This shows that the principal already perform managerial functions properly. Perhaps, the principal has been able to do planning and good management of the potential possessed by the school such as planning for the improvement of the quality and competence of teachers in these schools. In addition, principals also been able to create a culture and climate of the school conducive and innovative to form a high motivation of the teachers which in turn have an impact on improving teacher performance. Arifin (2015b) stated that the school culture affects the performance of teachers. The quality teacher performance also influenced by school leadership, and capability of implementing
the managerial function properly. School principals already have the ability to manage, striving for improvement and optimizing the procurement and utilization of school facilities and infrastructure to support the implementation of the learning process. Upon ability-with managerial skills possessed by the principal, is able to give a positive effect on teachers as an integral part of the school leadership, and this leading the positive performance shown through the quality of teaching and teacher satisfactory.
3.7.2 Relationship between Compensation with Physics Teacher Performance
The results showed that the compensation variable is linked to teacher performance variable, high categorized, and the quality of these relationships is significant and linear. Regression analysis showed that the contribution of compensation on teacher performance amounted to 46.2%. This is associated with the data in Figure 1, and can be seen that compensation is sufficient categories, while the performance of teachers is satisfy. These results show that the compensation given to the physics teacher in the district Baguala are adequate, or in other words, the compensation awarded has fulfilled what is desired by the teacher, may also be compensated in accordance with what the teacher wants, so that the alleged provision of such compensation affect both the performance of teachers, and motivate teachers to improve their quality of teaching.
Sedarmayanti (2001) stated that compensation is a gift in form of fringe benefits both directly or indirectly like money, or things to employees as a reward due to their work. Dessler (2003) also stated that the compensation can be like a rewards not just in the form of money or non-financial (nonfinancial rewards) and can’t be quantified with numbers, but more qualitative as praise, motivation, reward, attention, more challenging work, working hours flexible and more prestigious office. If the compensation in the form of salary or wages, benefits or incentives, the amount must be increased, accuracy in time of administration should also be considered.
It is recognized that teachers are the people who directly interact with students, and become critical factors in developing the school organization’s goals. Therefore, the teacher performance should be improved, one of

ies.ccsenet.org International Education Studies Vol. 10, No. 1; 2017
242
which is through the provision of compensation. Saani (2013) stated that when carrying out their duties, they always need attention, appreciated, and motivation to improve the quality and competence of themselves as well as get paid accordingly, and given facility adequate support and support activities of teaching, the teacher would have excited the work included in the learning process. Awarding monetary compensation for teachers in Indonesia is done through the provision of allowance teacher certification. Kanto et al. (2014) stated that there is a significant influence allowance teacher certification on work motivation of teacher and teacher job satisfaction. It is undeniable that the provision of compensation in the form of salary or wages, benefits, and incentives, will increase the motivation of teachers, and teachers will be eager to work and teach. Usman (2010) stated that a person’s motivation is influenced by the intensity of his motives (in this case is money). In performing his duties as a teacher, of course earn money as their wage suite also is the desire of every teacher. If the wages earned appropriate, it will improve the welfare of teachers. Teachers prosperous will focus to continue to work, their performance will increase, and in turn will improve their quality and competence for the overall improvement of the learning quality. 3.7.3 Correlation between Principals Managerial Leadership and Compensation with Physics Teacher Performance
Correlation between managerial leadership of principals and compensation and science teacher performance is very high (r = 0.848) and the contributions of both on teacher performance amounted to 71.9%. These results indicate that both managerial leadership of principal and compensation collectively affect science physics teacher performance. A teacher performance results achieved by teachers in carrying out the tasks assigned to him based on skill and determination as well as the use of time. The performance of teacher will be good if teacher can implement the required elements as a strong commitment to their task of teaching, master and develop learning materials, teaching discipline and creativity in implementing the teaching and other purposes. Commitment of the teachers in carrying out his duties as a teacher, needs to be balanced with the provision of adequate compensation. According to Jensen et al. (2010) the compensation is very important for teachers, because the amount of compensation is the acceptance or measure the value of a teacher’s job itself. The size of the compensation can affect the performance of teachers. If the compensation that given was appropriately and correctly, teachers will gain satisfaction in their work, and can encourage them to show a good performance so that the purpose of education in a school can be met.
The achievement of educational goals in schools is also determined by the success of the principals in managing the teaching staff was available at the school. The school principal is one of the components that influence the improvement of teacher performance (Hallinger & Hack, 2010). The school principal is responsible for the provision of education, school administration, coaching other education personnel and the efficient utilization and maintenance of facilities and infrastructure (Yasin, 2013). As the highest leader in the school, a school principal must have managerial capability and high commitment and flexibility in performing their duties. School leadership must be able to work on improving the performance of teachers through capacity-building program of education personnel (Leithwood et al., 2008)
If a leader do not ever pay attention to the needs of members for whom he leads, in this case just like observing the right time in salaries, job promotion, proposal reception allowances or incentives, never pay attention, rewards, and appreciate greatly work of teachers, this condition can leads teachers to feel neglected, ignored and unappreciated. This change will provide a not conducive work situation. Teachers will be refuse to work, lazy and. This will affect the performance of teachers. Conversely, if the managerial leadership principals were able to pay attention to the needs of teachers, this is allegedly can improve the quality and competence of teachers, provide supporting facilities, support and funding teachers to work, giving awards to teachers with great work, and strive to increase the allowances or incentives to teachers in both quantity and timeliness of administration, regard the teacher as a partner in charge, establish effective communication with the teacher, always listen and receive input from teachers and build democratic attitude, this will leading teacher to will feel appreciated. Teachers will feel that the task and the work were not wasted. Teachers will also be proud of themself, enthusiastic, and motivated to perform well and this can be addressed through good performance. Marks and Printy (2003) stated that in order to improve the quality of education in schools, there must be understanding and coordination between teachers and principals in the various aspects related to the creation of quality schooling.
Apparently, the principal in high school in Baguala District was able to apply managerial leadership satisfy category, and followed by giving adequate compensation to the performance of teachers in secondary schools in the Baguala district is satisfy category. This condition is good, and should be improved. Baguala district is one of the districts in the administrative area of Ambon city. This area is very close to the center of both provincial and city governments, so that the various changes that occur in connection with improving the quality of education

ies.ccsenet.org International Education Studies Vol. 10, No. 1; 2017
243
can be quickly adopted and adapted to the school environment. Attention central and local governments through the allowance teacher certification and Ambon city administration to administration incentives to teachers, although not examined in this study, but it is thought to be one of the factors that influence the performance of teachers in the city of Ambon included in District Baguala. 4. Conclusion Principals’ managerial leadership and compensation positive correlate and significantly affected physics teacher performance in secondary school in Baguala Distric-Ambon City. Correlation between principals managerial leadership with physics teacher performance is very high, as well as principal managerial leadership and compensation, while between compensation and teacher performance, the correlation is high categorized. For both dependent variables i,e principals managerial leadership and compensation significantly affect the performance of physics teacher performance at the senior high school in Baguala District of Ambon
References Abdullah, A. G., Huq, K. E., & Ismail, A. (2008). Headmaster’ Managerial Roles Under School-Based
Management and School Improvement: A Study in Urban Secondary Schools of Bangladesh. Educationist II, 2, 63-73.
Arifin, H. M. (2013). The Influence of Competence and External Motivation Factors toward Teacher Working Performance in Jayapura-Papua Indonesia. IOSR Journal of Business and Management, 7(5), 1-7. https://doi.org/10.9790/487X-0750107
Arifin, H. M. (2015a). Effect of Competence and Motivation on Teacher Performance and Primary and Secondary Education Quality at Yapis Education in Jayapura-Indonesia. Australian Journal of Basic and Applied Sciences, 9(3), 630-637.
Arifin, H. M. (2015b). The Influence of Competence, Motivation, and Organisational Culture to High School Teacher Job Satisfaction and Performance. International Education Studies, 8(1), 38-45
Creswell, J. W. (2005). Educational Research: Planning,. Conducting, and Evaluating Quantitative and Qualitative. Research. Upper Saddle River, NJ.
Dessler, G. (2005). Human Resources Management (10th ed., p. 390). Prentice Hall.
Diem, K. G. (2002). A Step-by-Step Guide to Developing Effective Questionnaires and Survey Procedures for Program Evaluation & Research. 2004 by Rutgers Cooperative Research & Extension, NJAES, Rutgers, The State University of New Jersey.
Fitriyati, R., Romdana, R., & Rosyidi, U. (2014). The Practice of the School Principal’s Leadership in Sekolah Indonesia Kuala Lumpur (SIKL): The Study of Leadership Styles and Techniques with Cognitive Mapping Aproach. Procedia Social and Behavioral Sciences, 115, 258-268. https://doi.org/10.1016/j.sbspro.2014.02.434
Gliem, J. A., & Gliem, R. R. (2003). Calculating, Interpreting, and Reporting Cronbach’s Alpha Reliability Coefficient for Likert-Type Scales. Midwest Research to Practice Conference in Adult, Continuing, and Community Education, 82-88.
Hallinger, P., & Heck, R. (2010). Leadership for Learning: Does Collaborative Leadership Make a Difference in School Improvement? Educational Management Administration and Leadership, 38(6), 654-678.
Hilton, P. R., & Brownlow, C. (2004). SPSS Explained. East Sussex: Routledge.
Jensen, U., Yamashiro, G., & Tibberts, K. (2010). What do we know about teacher pay for performance. Kamehameha School Research and Evaluation (pp. 2-20). Honolulu.
Kanto, Kulasse, Ahmad, M. A., Talib, S. B., & Tiro, M. A. (2014). The Influence of Certification toward Work Motivation, Job Satisfaction, and Performance of State High Schools Guidance and Counseling Teacher in South Sulawesi. International Journal of Scientific and Technology Research, 3(8), 386-394.
Leithwood, K., Harris, A., & Hopkins, D. (2008). Seven Strong Claims About Successful School Leadership. School Leadership and Management, 28(1), 27-42. https://doi.org/10.1080/13632430701800060
Lounsbury, J. W., Gibson, L. W., Richard, A., & Saudargas, R. A. (2006). Scale Development. In F. T. L. Leong, & J. T. Austin (Eds., p. 144), The Psychology Research Handbook: A Guide for Graduate Students and Research Assistants. Thousand Oaks: Sage Publications, Inc..
Marguerite, G. L., Spaulding, D. T., & Voegtle, K. H. (2006). Methods in Educational Research: From Theory to

ies.ccsenet.org International Education Studies Vol. 10, No. 1; 2017
244
Practice. San Fransisco: John Wiley & Sons, Inc.
Marks, H., & Printy, S. (2003). Principal Leadership and School Performance: An Integration of Transformational and Instructional Leadership. Education Administration Quarterly, 39(3), 370-397. https://doi.org/10.1177/0013161X03253412
Saani, A. J. (2013). Influence of Compensation and Supervision on Private Basic School Teachers Work Performance in Ashaiman Municipality. International Journal of Business and Social Science, 4(17), 64-69.
Sedarmayanti. (2001). Sumber Daya Manusia dan Produktivitas Kerja. Mandar Maju, Bandung.
Sofo, F., Fitzgerald, R., & Jawas, U. (2012). Instructional Leadership in Indonesian School Reform: Overcoming the Problems to move forward. School Leadership & Management, 35(5), 503-522. https://doi.org/10.1080/13632434.2012.723616
Tobin, J. (2014). Management and Leadership Issues for School Building Leaders. NCPEA Inernational Journal of Educational Leadership Preparation, 99(1), 1-14.
Weyner, J. (2007). Measurement: Reliability and Validity Measures. Johns Hopkins University
Yani, A., Rianita, L., & Utami, R. (2015). Teachers; Professionalism and Its Affecting Factors: a Review on EFL Teachers; Perceptions in Indonesia. International Journal of Languange Learning and Applied Linguistics World, 8(40), 1-14.
Yasin, M., Mustamin., & Tahir, L. M. (2013). Principal Leadership and the Achievement of National Education Standard in Indonesia. International Journal of Humanities and Social Science Invention, 2(8), 31-36.
Copyrights Copyright for this article is retained by the author(s), with first publication rights granted to the journal.
This is an open-access article distributed under the terms and conditions of the Creative Commons Attribution license (http://creativecommons.org/licenses/by/4.0/).