
Does a Local Bias Exist in Equity Crowdfunding?
89
8154 2020 March 2020 Does a Local Bias Exist in Equity Crowdfunding? Lars Hornuf, Matthias Schmitt, Eliza Stenzhorn
Transcript of Does a Local Bias Exist in Equity Crowdfunding?

8154 2020
March 2020
Does a Local Bias Exist in Equity Crowdfunding? Lars Hornuf, Matthias Schmitt, Eliza Stenzhorn

Impressum:
CESifo Working Papers ISSN 2364-1428 (electronic version) Publisher and distributor: Munich Society for the Promotion of Economic Research - CESifo GmbH The international platform of Ludwigs-Maximilians University’s Center for Economic Studies and the ifo Institute Poschingerstr. 5, 81679 Munich, Germany Telephone +49 (0)89 2180-2740, Telefax +49 (0)89 2180-17845, email [email protected] Editor: Clemens Fuest https://www.cesifo.org/en/wp An electronic version of the paper may be downloaded · from the SSRN website: www.SSRN.com · from the RePEc website: www.RePEc.org · from the CESifo website: https://www.cesifo.org/en/wp

CESifo Working Paper No. 8154
Does a Local Bias Exist in Equity Crowdfunding
Abstract We use hand-collected data of 20,460 investment decisions and two distinct portals to analyze whether investors in equity crowdfunding direct their investments to local firms. In line with agency theory, the results suggest that investors exhibit a local bias, even when we control for family and friends. In addition to the regular crowd, our sample includes angel-like investors, who invest considerable amounts and exhibit a larger local bias. Well-diversified investors are less likely to suffer from this behavioral anomaly. The data further show that portal design is important for attracting investors more prone to having a local bias. Overall, we find that investors who direct their investments to local firms more often pick start-ups that run into insolvency or are dissolved, which indicates that local investments in equity crowdfunding constitute a behavioral anomaly rather and a rational preference. Here again, however, portal design plays a crucial role.
JEL-Codes: G110, G240, K220, M130.
Keywords: equity crowdfunding, crowdinvesting, local bias, individual investor behavior, entrepreneurial finance.
Lars Hornuf Faculty of Business Studies and Economics
University of Bremen Max-von-Laue-Straße 1
Germany – 28359 Bremen [email protected]
Matthias Schmitt
Max Planck Institute for Innovation and Competition Marstallplatz 1
Germany – 80539 Munich [email protected]
Eliza Stenzhorn
Faculty of Business Studies and Economics University of Bremen
Max-von-Laue-Straße 1 Germany – 28359 Bremen [email protected]

This version: March 2, 2020 This article evolved as part of the research project “Crowdinvesting in Germany, England and the USA: Regulatory Perspectives and Welfare Implications of a New Financing Scheme” which was supported by the German Research Foundation (Deutsche Forschungsgemeinschaft) under the grant number HO 5296/1-1. The authors thank Ajay Agrawal, Thomas Åstebro, Jörn Block, Christian Catalini, Douglas Cumming, Gregor Dorfleitner, Florencio Lopez-de-Silanes, Niclas Rüffer, Armin Schwienbacher, Oscar Stolper, Michael Zaggl, and the participants of the MACIE Research Seminar (Marburg University), the 7th Economic Workshop (Trier University), the Crowdfunding Konferenz (IfM Bonn), the Workshop Economics of Entrepreneurship and Innovation (Trier University), the 19th G-Forum (University of Kassel), the 3rd Crowdinvesting Symposium (University of Munich), the 3rd International ZEW Conference on the Dynamics of Entrepreneurship (Mannheim), the Finance Seminar (Schulich School of Business, York University), the Annual Conference of the Royal Economic Society (University of Bristol), the Annual Meeting of the American Law and Economics Association (Yale University), the Druid Conference (NYU Stern School of Business), Darden & Cambridge Judge Entrepreneurship and Innovation Research Conference (University of Cambridge), the Workshop on Innovation, Finance, and Growth (Skema Business School), 5th Workshop Household Finance and Consumption (Banque Centrale du Luxembourg), and the World Finance Conference (Cagliari University) for their helpful comments and suggestions. Marc Lieser and Magdalena Streicher provided valuable research support.

2
1. Introduction
In this study, we analyze whether investments brokered by equity crowdfunding platforms
exhibit a local bias and whether specific investor groups can explain this bias. Equity
crowdfunding refers to a source of finance that occurs on the Internet and, in the last decade,
has emerged in many European countries (Hornuf & Schwienbacher, 2018a), mostly because
existing securities regulation has been benevolent toward issuers of small offerings or suffered
from loopholes in its prospectus requirements (Hornuf & Schwienbacher, 2017). As the
financial instruments used by equity crowdfunding issuers vary from one jurisdiction to
another, equity crowdfunding1 can also be referred to as investment-based crowdfunding,2
securities-based crowdfunding,3 or crowdinvesting.4 In this paper, we refer to the new asset
class as equity crowdfunding, as this is the term most frequently appearing in the literature.
Equity crowdfunding by non-accredited investors was prohibited in the United States for a long
time. This situation was due to delays caused by the Securities and Exchange Commission in
implementing Title III of the Jumpstart Our Business Startups (JOBS) Act. The delayed
implementation of the equity crowdfunding rules partly stemmed from the lack of a full
understanding of the new activity. However, equity crowdfunding activities in various
European countries constitute natural experiments, which might inform national securities
regulators around the world about how equity crowdfunding takes place in reality. Moreover,
the European Commission has announced the launch of a Capital Markets Union Action Plan
on a supranational level, which among other things aims to diversify the funding sources of
firms and make the securities prospectus more affordable for small and medium-sized firms.5
As legislators are still struggling to balance the need to close the funding gaps of these firms
with effective investor protection, a better understanding of how equity crowdfunding actually
works is urgently required.
Most research investigating Internet-based finance has examined the determinants of funding
success in donation- or reward-based crowdfunding as well as peer-to-peer lending. The
1 See, for example, the JOBS Act, including the term “crowdfunding,” which refers to transactions involving the
sale of a security. Ahlers, Cumming, Guenther, and Schweizer (2015, p. 958) define “equity crowdfunding” as
an investment model in which investors receive “some form of equity or equity-like arrangements.”
2 See the FCA Consultation Paper CP13/13 titled “The FCA’s regulatory approach to crowdfunding (and similar
activities)” as well as the European Securities and Markets Authority “Opinion investment-based
crowdfunding.”
3 See Knight, Leo, and Ohmer (2012) and the U.S. Securities and Exchange Commission, 17 CFR Parts 200,
227, 232 et al. Crowdfunding; Proposed Rule.
4 This term is probably the most useful, as it encompasses all financial instruments found in practice, regardless
of whether they are classified as securities or investments or lack a legal definition altogether.
5 Introductory remarks by Commissioner Jonathan Hill at the launch of the Capital Markets Union Action Plan,
Brussels, 30 September 2015.

3
behavior of individuals engaging in these activities is, however, likely to differ from equity
crowdfunding. In regular crowdfunding, individuals make consumption or philanthropic
decisions and are concerned with the enactment of a charitable campaign or the delivery of a
consumer product, while in equity crowdfunding, investors care about the future cash flows of
a firm. In peer-to-peer lending, the future cash flows of an individual or firm are predefined by
the loan agreement. Moreover, in case of insolvency, lenders are generally preferred to equity
or subordinated debt holders and therefore take less risk. Finally, in contrast with equity
crowdfunding, peer-to-peer lenders do not participate in changes in the valuation of the firm,
as they do not hold an equity or equity-like stake replicating the upside potential of the firm.
A well-known phenomenon in financial markets is the tendency to invest in securities that are
geographically close (local bias). As investors who exhibit a tendency to invest local do not
build optimally diversified portfolios (Markowitz, 1952), their behavior could lead to economic
inefficiencies, and therefore this phenomenon has received considerable attention in the finance
literature. Conversely, agency theory (Aghion & Bolton, 1992) stipulates that investors could
also rationally invest in more local firms that fail less often if geographic proximity allows them
to obtain private information about the firm or puts them in a better position to exercise their
control rights.
Previous research suggests that U.S. investment managers prefer firms with local headquarters
(Coval & Moskowitz, 1999), suggesting that information asymmetries between local and
nonlocal investors explain the regional proximity in investments. Ivković and Weisbenner
(2005) confirm this hypothesis for individual investors and provide evidence that these
investors exploit local knowledge to earn excess returns. Using data from German individual
investors, Baltzer, Stolper, and Walter (2013) show that the local bias extends beyond national
borders, with investors living closer to a foreign country investing more in firms located in a
regionally close foreign country. Baik, Kang, and Kim (2010) find that local investment
advisers, high local ownership institutions, and high local turnover institutions forecast returns
better than nonlocal institutional investors and that the local advantage is even stronger for firms
exhibiting greater information asymmetries.
In the realm of venture capital, Mäkelä and Maula (2008) examine the role of local and cross-
border venture capital investments and find that local venture capitalists invest first while
foreign venture capitalists typically invest in later rounds. The effect is mitigated if the start-up
team is highly experienced or has no interest in the domestic market. Lutz, Bender, Achleitner,
and Kaserer (2013) analyze the relevance of spatial proximity of investments between start-ups
and venture capitalists in Germany. They provide evidence that spatial proximity has an impact

4
on the likelihood of an investment for (1) very small and very large investments and (2) less
experienced venture capitalists. Cumming and Dai (2010) find that venture capital funds exhibit
a significant local bias, with half the investments located within a 233-mile radius. The local
bias was smaller for reputable venture capital funds having a larger syndication network, which
alleviates information asymmetries.
In their article, Agrawal, Catalini, and Goldfarb (2015) investigate the role of geographic
proximity in a prepurchase crowdfunding platform. They find that investment patterns over
time are related to geographic distance, with local investors engaging much earlier. However,
this pattern disappeared when the researchers controlled for family and friend investors.
Günther, Johan, and Schweizer (2018) present first evidence on how sensitive different investor
types are to geographic distance in an equity crowdfunding context. However, they do not
calculate a local bias, and their analysis relies on data from the Australian Small Scale Offerings
Board, in which average investments are rather large and contributors are few. Lin and
Viswanathan (2015) provide evidence of a home bias in peer-to-peer lending and suggest that
this finding is partly due to behavioral reasons. In peer-to-peer lending, borrowers are often
anonymous to lenders, and information gathering is restricted to the information provided on
the platform. This differs in equity crowdfunding in which investors know who the target firms
are and thus can collect further information at their discretion. The additional effort of collecting
information might then allow investors to learn about the quality of the firms seeking funding.
In their recent study, Niemand, Angerer, Thies, Kraus, and Hebenstreit (2018) run a choice-
based conjoint experiment analyzing factors contributing to a home bias in equity
crowdfunding. They find that investors in central Europe avoid foreign currencies and decide
against national legislation in favor for EU legislation. Using a mixed-methods approach and
data from Crowdcube, Kleinert and Volkmann (2019) find that crowd investors are concerned
about information asymmetries and agency risks. They also provide evidence that dialogues on
discussion boards on equity crowdfunding platforms generally drive investments. Nitani,
Riding, and He (2019) evidence that to reduce risk, investors in equity crowdfunding often
chose larger firms, which are managed by more experienced and educated managers.
Wallmeroth (2019) uses a large sample of more than 42,200 investments from Germany’s
largest equity crowdfunding portals and finds that investment amounts differ significantly and
that the crowd is not a homogeneous community. Finally, Nguyen, Cox, and Rich (2019) show
that investors in equity crowdfunding delay their investments to gain more information.
In this study, we investigate whether a local bias exists in a new and fast-growing asset class,
examine what its determinants are, and clarify whether a local bias has positive or negative

5
consequences for investors. Because regulators have consistently regulated investors in equity
crowdfunding depending on their net worth and income, we analyze whether specific investor
groups are more or less prone to engage in geographically close investments. Less wealthy
investors have legally been restricted in the amount they can invest in equity crowdfunding
campaigns (Bradford, 2012; Hornuf & Schwienbacher, 2017), so we are particularly interested
in the local bias of different investor groups. If investors who provide only small amounts, for
example, exhibit a different local bias and fail with their investments systematically more often,
this might inform regulators about the effectiveness of regulations such as the JOBS Act that
limit the amount that can be sold to a single investor. In line with previous literature and the
actual observations in our data, we consider three groups of investors: (1) family and friends,
(2) angel-like investors, and (3) more experienced investors.
Our results reveal that a local bias exists for individual investments and investment portfolios.
We further show that both family and friend and angel-like investors exhibit a larger local bias.
Investors who have a better-diversified equity crowdfunding portfolio show a smaller local bias.
This finding is in line with agency theory and the conjecture that both family and friend and
angel-like investors are in a relatively better position to use their local knowledge to resolve
information asymmetries, while diversified investors apparently spread their portfolio without
considering the geographic location of the investments. We also provide evidence that
investments over the weekend by presumably less professional investors exhibit a smaller local
bias. The data further show that portal design is important for attracting investors more prone
to having a local bias.
Moreover, we find that firms with a higher valuation exhibit a larger local bias, which indicates
that investors might benefit from screening firms locally that request a higher price per share.
Furthermore, investments in industries such as manufacturing, trading, IT, technical activities,
and other service activities exhibit a significant, negative local bias, indicating that these
activities can be easily understood from farther away through manuals and technical
descriptions. Finally, we find that investors who direct their investments to local firms more
often pick start-ups that run into insolvency or are later dissolved. However, more professional
investors on platforms with large minimum investments tend to invest in local firms that are
more successful.
The remainder of the paper proceeds as follows: in section 2, we describe the German equity
crowdfunding market and define the investor types we examine herein. Then, we describe the
relevant theory and testable hypotheses in section 3. Section 4 presents the data and

6
methodology. Section 5 outlines the empirical results and presents robustness checks. Section
6 concludes.
2. Equity Crowdfunding
2.1. Defining Equity Crowdfunding
Crowdfunding was initially developed for philanthropic projects, which are often referred to as
the donation model of crowdfunding. In this model, backers donate money to support a project
without expecting compensation, potentially leading to the transformation of social capital into
economic capital (Lehner, 2014). This differs from the reward-based model of crowdfunding
in which backers are promised perks, such as supporter T-shirts or having their name posted on
the campaign website. At times, the reward-based crowdfunding model may resemble a
prepurchase, such as when backers finance a product or service they wish to consume and which
is still to be developed by the entrepreneur. Popular examples are video games such as Star
Citizen or the Pebble smartwatch. Another form of Internet finance is peer-to-peer lending, in
which funders receive a predetermined periodic interest payment and—if the individual or firm
does not go bankrupt—obtain their original principal investment back by the end of the
investment period.
Equity crowdfunding is a subcategory of crowdfunding in which backers expect financial
compensation in the form of a profit-share arrangement. To encourage the crowd to participate
in the future profits of the firm, fundraisers in some jurisdictions offer equity shares in a private
limited liability company (LLC). In the United Kingdom, for example, this is the case on the
portals Crowdcube and Seedrs. In Germany, start-ups do not offer common shares in an LLC,
as transferring them to another investor would require the involvement of a costly notary
(Braun, Eidenmüller, Engert, & Hornuf, 2013). Typically, German start-ups running an equity
crowdfunding campaign use mezzanine financial instruments, such as nonsecuritized
participation rights, silent partnerships, and subordinated profit participating loans.
Before an equity crowdfunding campaign goes online, the start-up and the portal must agree on
a valuation of the firm, and the founders must decide how much capital they want to raise.
Consistent with the valuation and capital needs of the firm, the portal provides a standardized
financial contract, which replicates an equity share in the firm, so that the crowd can participate
in the future cash flows of the start-up. These financial instruments are senior to ordinary shares
and shareholder loans but rank after all ordinary liabilities. Moreover, they cannot be sold on a
secondary market and often have a lifespan of three to seven years. In most cases, investors

7
hold the right to receive a pro-rata payment of the firm’s profits but without any of the rights
attached to an equity share, such as control and voting rights. Although investors do not
participate in the losses of the firm beyond their investments, there is a high risk that the start-
up will fail and backers will not receive any financial return from the securities bought.
Moreover, in many cases backers might even lose their original principal investment.
2.2. Equity Crowdfunding Portals in Germany
By April 1, 2018, 56 equity crowdfunding portals were established on the German market, 24
of which were still running an active business (Hainz, Hornuf, Nagel, Reiter, & Stenzhorn,
2019). During the observation period of our study, the two portals we consider here made up
26% of the entire German equity crowdfunding market in terms of capital raised and 40% when
considering the number of start-ups that received funding. Equity crowdfunding portals in
Germany largely follow the business model outlined in section 2.1. While the web design and
investment process of the two portals we consider are rather similar, some features of the portals
exhibit some peculiarities. These differences may affect the type of investors attracted and
consequently the local bias of the crowd.
First, after the portal Seedmatch appeared on the stage, Innovestment was the second portal
entering the German equity crowdfunding market in late 2011. Companisto began operating a
year later but quickly established a larger user base than Innovestment (Dorfleitner, Hornuf,
Schmitt, & Weber, 2017). Until the end of our observation period, Companisto successfully
funded all 30 campaigns, while Innovestment enabled only 28 firms to obtain funding. Another
16 campaigns on Innovestment were not successfully funded. The slightly larger number of
start-ups available over a shorter period allowed investors to diversify their portfolios better on
Companisto. This tendency even accelerated because the minimum investment on Companisto
ranged from only 4 to 5 EUR versus from 500 to 25,000 EUR in the case of Innovestment. The
larger the minimum investment, the more difficult it becomes for investors to diversify their
portfolio with a given amount of capital, and presumably the more important it is to obtain
information about the prospects of the firm.
Second, most often investors make a direct investment in the start-up in which they want to
participate. This holds true for the financial contracts of Innovestment and all other German
equity crowdfunding portals, but not for Companisto. Companisto initially set up a special
purpose vehicle (SPV) to pool the investments made in all campaigns that were successfully
funded on the portal. The SPV, in turn, invested the capital raised from the crowd in the start-
up in which the investors wanted to participate. Today, Companisto no longer pools investments

8
through an SPV but offers a separate pooling contract for each campaign. After crowdfunding
has taken place, the pooled investments help venture capital firms negotiate with a single
counter-party and make buying out the crowd easier.
Third, under the all-or-nothing model, founders set a funding goal and keep nothing unless this
goal is achieved (Cumming, Leboeuf, & Schwienbacher, 2019b). All German equity
crowdfunding portals run under this all-or-nothing model. Moreover, they all allow the crowd
to oversubscribe the issue up to a maximum funding limit. In the past, the funding goal was
frequently set at 50,000 EUR. If the 50,000 EUR cannot be raised within a prespecified period,
the capital pledged is given back to the investors. Moreover, most German equity crowdfunding
portals operating an all-or-nothing model, including Companisto, allocate shares on a first-
come, first-served basis. Under this model, founders set an overall funding limit and stop selling
investment tickets to the crowd when the limit is reached. In the early years, the funding limit
was often set at 100,000 EUR. After this threshold was reached, the funding process stopped
before the prespecified funding period came to an end and shares were no longer sold to the
crowd.
Innovestment—which became insolvent in 2017—deviated from this model by implementing
a multiunit second-price auction in which individual bids were sealed. The auction had three
stages and was similar to a Vickrey (1961) auction, except that the portal revealed the applicable
second price to everyone. After the start of the auction, investors could make pledges by
specifying the number of tickets they wanted to buy and the price they were willing to pay for
each ticket. In line with the other platforms, the portal and the start-up determined a lower
threshold for the price of a single ticket. During the first phase of the auction, everyone who
pledged money was allotted the desired number of tickets, and the lowest posted price applied
to everyone. Thus, there was no reason per se for investors to outbid the lower threshold in this
phase, unless they wanted to avoid the transaction cost of bidding again later.6 In the second
phase, the number of tickets was kept constant, and investors could outbid each other by posting
even higher prices. Importantly, the second phase was not restricted to investors from the first
phase; everyone who was registered on the portal could still join the bidding process. The
second phase continued until the maximum funding limit was reached. For most campaigns on
Innovestment, the maximum funding limit was 100,000 EUR. In the third and last phase,
investors could still outbid each other. At this point, however, it was no longer possible to
increase the overall sum of funds. Still, higher bids therefore resulted in the overall number of
6 The chief executive officer of Innovestment made this argument when she was asked why investors overbid
the lower price threshold in the first phase of the auction.

9
tickets being reduced, thus lowering the number of investment tickets a start-up must have sold
for a given amount of capital (for a detailed description and analysis of the Innovestment
auction mechanism, see Hornuf & Neuenkirch, 2017). In line with Campbell (2006), we
presume that less sophisticated investors know their limitations and avoid complex equity
crowdfunding portals for which they feel unqualified. The Innovestment auction might thus
have implications for the local bias, in the sense that only a financially more sophisticated crowd
might have engaged in a second-price auction.
2.3. Investor Types
To derive policy implications, we differentiate among three investor groups that engage in
equity crowdfunding next to the regular crowd: (1) family and friends, (2) angel-like investors,
and (3) more experienced investors. These groups were defined by previous literature and the
actual observations in our sample. We investigate them separately because they differ in their
capability of evaluating firms’ future potential, which could ultimately result in a different local
bias.
First, according to the entrepreneurial finance literature (e.g., Agrawal et al., 2015), family and
friends are an important source of capital for early-stage ventures. According to Parker (2009),
31% of the funds for start-ups that were founded less than three years ago came from family
and friends. Informal investments based on a close relationship with a founder are often referred
to as love money (Macintosh, 1994; Mason, 2006). Family and friend investors have been
traditional sources of love money. Equity capital for small- and medium-sized companies is
often thought to entail a significant proportion of love money (Berger & Udell, 1998; Harrison,
Mason, & Girling, 2004; Riding, 2008). Love money investors investing in close family
businesses often do not have ownership experience (so-called classic love money; see Szerb,
Terjesen, & Rappai, 2007). However, family and friend investors may identify the worthiness
of an investment more easily because of their close social ties and the resulting information
advantages when evaluating the quality of a founder (Cumming & Johan, 2009). In line with
this conjecture, Agrawal et al. (2015) find that family and friend investors are less responsive
to the information posted by founders, because they directly know the entrepreneur. Following
their approach, we define investors as family and friends if (1) they invest in the focal start-up
before investing in any other start-up (the investor likely joined the portal for the focal start-
up), (2) their investment in the focal start-up is their largest investment, and (3) they invest in
no more than three other start-ups (the focal start-up remains the key reason for being on the
portal). Family and friends could drive a potential local bias in equity crowdfunding because

10
they often have an offline social relationship with the founder (Agrawal et al., 2015) and social
networks are largely local in nature (Hampton & Wellman, 2002).
Second, we observe another group of investors in our data set, referred to as angel-like
investors, that invests higher amounts and for which the gathering of additional information
might be worthwhile (Aghion & Bolton, 1992). Although we cannot confirm whether these
investors actively engage in the start-up, investing higher amounts at least provides them with
stronger incentives to do so. Wang, Mahmood, Sismeiro, and Vulkan (2019) find that in an
equity crowdfunding context, angel investors invest first and crowd investors fill funding gaps
when ventures are large. Goldfarb, Hoberg, Kirsch, and Triantis (2013) find that 60% of U.S.
business angels are located within three hours’ driving time from the firms they invested in, and
18% are located within the same zip code region. Harrison, Mason, and Robson (2010) examine
the distance of business angel investments in the United Kingdom and find that local
investments take place in technology-oriented start-ups and that distance of investments
increases with higher investment amounts. Business angels often conduct due diligence and
monitor the progress of the firm, which can provide an important signal and encourage regular
crowd investors to invest as well (Hornuf & Schwienbacher, 2018b). Agrawal, Catalini, and
Goldfarb (2014) find that syndicated business angels are the main drivers of successful deals
on Angel List, one of the leading U.S. equity crowdfunding portals for accredited investors. In
their data set, business angels invest a median amount of 2,500 USD. We consider business
angels in Germany somewhat more sophisticated7 and label investors as angel-like investors if
they invest at least 5,000 EUR.
Third, we account for the investment experience of crowd investors. We consider investors to
be more experienced in the domain of equity crowdfunding if they have made more pledges on
a particular portal, which indicates that at least their equity crowdfunding portfolio is more
diversified. Investors who hold a diversified equity crowdfunding portfolio are more likely to
invest in various firms at varying distances, because actively monitoring portfolio firms in a
more diversified portfolio involves high transaction costs, which makes it practically
impossible to engage in on-site monitoring of the firms. This reasoning is in line with the
findings of Goetzmann and Kumar (2008) who evidence that, in general, equity portfolio
diversification correlates with a lower local bias. Moreover, Abreu and Mendes (2010) show
that a diversified portfolio is a good proxy for investor education, which again leads to a lower
local bias (Kimball & Shumway, 2010).
7 Fryges, Gottschalk, Licht, and Müller (2007) report that German business angels that engage in high-tech
start-ups typically invest 30,000 EUR.

11
3. The German Venture Capital Market, Theory, and Hypotheses
3.1. Venture Capital in Germany
Before we derive our hypotheses, we provide a brief overview of the German venture capital
landscape to contextualize the equity crowdfunding market. As in many other countries,
significant funding for German start-ups comes from venture capital investments. The
entrepreneurial finance literature suggests that venture capital investments emerge because of
similarities between the investor and the founder with regard to networks, educational and
professional background, and social traits, but also result from the geographic proximity
between the investor and the start-up (Rider, 2012; Shane & Stuart, 2002; Sorenson, Assenova,
Li, Boada, & Fleming, 2016; Zacharakis & Meyer, 1998). To investigate similarities and
differences between the geographic location of German venture capital and equity
crowdfunding investments, we begin our analysis by investigating from where venture capital
in Germany generally originates.
We analyze a sample of 1,221 venture capital investments, 538 German target firms, and 235
national and international venture capital funds that we retrieved from the Thomson Reuters
Private Equity database. We then compare the location of venture capital investments with
equity crowdfunding investments in Germany. The venture capital sample contains only the
venture capital investments that match the industries and funding period of the equity
crowdfunding start-ups. Table 1 shows the most relevant cities where venture capital funds,
equity crowdfunding investors, and target firms are located. We find that the majority of venture
capital investments in Germany take place in Berlin and Munich, followed by Hamburg and
Cologne. Venture capital funds are often located in Berlin and Munich as well, but also have
their offices based in Bonn, Frankfurt, Paris, and London. For the remaining regions, we map
the location of venture capital funds (green areas) and firms in which venture capitalists have
invested (green dots) in Figure W1 of the Web Appendix.
– Table 1 around here –
Similar to venture capital, equity crowdfunding also predominantly takes place in Berlin, most
likely because the leading platform—Companisto—is located there. Next to Berlin, target firms
are mostly located in Hamburg, Düsseldorf, Munich, and much smaller cities (e.g.,
Neuenhagen, Velten, St. Augustin). This pattern is in line with the findings of Sorenson et al.
(2016), who compare crowdfunding investments from the portal Kickstarter with venture
capital investments in the United States and find that crowdfunding accelerates venture capital
in regions that have previously been excluded from entrepreneurial finance. At the top of the

12
list, equity crowdfunding investors are located in the same cities as venture capitalists: Berlin
and Munich. However, the cities further down the list are different. Furthermore, Figures W2
and W3 of the Web Appendix show that equity crowdfunding attracts foreign investors from
cities such as Vienna as well.
3.2. Theoretical Considerations and Hypotheses
The theoretical literature is not clear per se on whether a local bias constitutes a behavioral
anomaly or whether investing locally is a rational preference in line with, for example,
transaction cost theory (Coase, 1960; Zey, 2001) and agency theory (Aghion & Bolton, 1992;
Grossman & Hart, 1983). According to Markowitz (1952), investors maximize their expected
returns by maintaining a well-diversified portfolio. One important aspect of diversification is
the regional dispersion of investments. The irrational overweighting of local securities can
expose investors to clustered risks, which in turn can decrease expected returns. As in any other
market, the gains from more dispersed equity crowdfunding investments depend on the
correlation of returns in different regional markets. If the equity crowdfunding markets in
different regions are not perfectly correlated, a risk reduction is available from dispersed
holdings. For the traditional stock market, French and Poterba (1991) show that in some cases,
British investors must expect annual returns from their local investments of more than 500 basis
points above those in the U.S. market to rationally explain the extent of their local equity
holdings.
By contrast, information on equity markets is vital but distributed unequally between the parties
of a contract. The founders who search for capital and manage a firm usually have better
information about the venture than those who provide the funding (Jensen & Meckling, 1976).
As a result, investors must incur significant costs to learn about the prospects of an investment.
These costs involve finding a suitable investment target and assessing its prospects (search
costs), contracting the terms of the investment (transaction costs), and, finally, monitoring the
outcome of the funded project (control costs). Agency theory (Aghion & Bolton, 1992;
Grossman & Hart, 1983) suggests that active investors who can exercise control over a firm
have a positive impact on the entrepreneur's incentives, which leads to preferable corporate
outcomes. Searching high-quality ventures, transacting with them, and monitoring them are
easier and cheaper if the costs of these activities to investors are low. To reduce these costs,
venture capitalists tend to invest in local firms (Cumming & Dai, 2010) because screening,
contracting, and controlling a local firm is usually easier and cheaper. Given that equity
crowdfunding, versus venture capital financing, takes place on the Internet, the question arises

13
whether equity crowdfunding lowers search, transaction, and control costs for everyone,
making physically close investments practically unnecessary. We therefore need to investigate
whether the institutional setting of equity crowdfunding as a new asset class can sufficiently
solve the agency problem between investors and founders raising funds.
First, the availability of information on Internet portals reduces the search costs of investors
significantly. While traditionally venture capitalists relied on investor networks, such as Silicon
Valley or Route 128, today crowd investors can almost costlessly identify new investment
opportunities via the Internet. Equity crowdfunding portals provide information on the founder
team, business model, and financials. Moreover, interested investors can directly communicate
with the founder team through the equity crowdfunding portal. However, the information
provided by the founders might be cheap talk (Cumming, Hornuf, Karami, & Schweizer,
2019a), and information asymmetries, as defined by Jensen and Meckling (1976), most likely
remain.
Assuming that equity crowdfunding portals are repeat players that serve a two-sided market of
firms seeking capital and investors looking for a return, we would expect these platforms to
maximize their profits by raising the overall deal flow (Rochet & Tirole, 2003). Portals can
only achieve this goal by attracting not only solvent investors but also profitable firms. In the
equity crowdfunding market, portals are still nascent and might not be able to demonstrate that
they will act as repeat players that will serve the market in the long run. Yet firms themselves
might be able to credibly signal their quality (Spence, 1973). However, most firms that
participate in equity crowdfunding campaigns are start-ups with little validated information
such as audited financial statements and therefore have limited capacity to signal their quality.
Moreover, a large and diversified crowd might easily be in a position to screen the venture,
because the likelihood that one crowd investor coincidentally lives close to the firm is greater
than that of a single professional investor being located in one particular region. Nevertheless,
when making an investment of as little as 5 EUR, it is hardly worthwhile for an individual
investor to engage locally in complex information validation and make the effort to
communicate lemon market firms (Akerlof, 1970) to the larger crowd. Furthermore, the
collection and publication of information in equity crowdfunding markets constitutes a public
good, which makes investors prone to free ride on its provision. Therefore, it is not likely that
equity crowdfunding can reduce the search costs related to an investment.
Second, a standardized investment process lowers transaction costs. Equity crowdfunding
portals allow firms and investors to use a ready-made platform and a standardized legal process.
They also save the contracting parties time and money by providing boilerplate financial

14
contracts. This standardized investment process allows distant investors to invest under similar
conditions to local investors, mostly by eliminating the costly process of on-site negotiations
with the founder. As a result, distant investors using equity crowdfunding portals should have
a cost advantage over venture capital firms that need to engage in a local bargaining process.
The downside of eliminating tailor-made contracts, however, is that crowd investors cannot
specify particular covenants or stage their investments. As a result, equity crowd investors
remain largely passive (Hornuf, Schilling, & Schwienbacher, 2019).
Third, monitoring is difficult in equity crowdfunding because investors rarely interact directly
with the founder team and must rely on information provided by the firm. Information delivered
by e-mail or investor relation channels on an equity crowdfunding portal is less reliable than
audited financial statements or getting firsthand information from an insider who serves on the
board of directors of the firm. Research on reward-based crowdfunding has shown that creators
use fake social information by purchasing Facebook likes or personal friends to attract more
backers (Wessel, Thies, & Benlian, 2015). Cumming et al. (2019a) show that in some cases,
founders might also engage in outright fraud, by promising backers a product but spending the
money on personal expenses.
Moreover, venture capitalists traditionally write tailor-made contracts that include different
types of covenants, which serve as an early warning system and control mechanism (Bergloff,
1994; Black & Gilson, 1998; Gompers & Lerner, 1996; Lerner, 1995). Because venture
capitalists are in close contact with the firm (often they are represented on the board [Camp,
2002]), they can readily monitor compliance with covenants and punish breaches by the
founder. A related mechanism is staged finance, which ensures that venture capital funds stop
financing a firm if certain performance targets are not reached (Tian, 2011). In equity
crowdfunding, all these mechanisms are largely absent, due to the boilerplate nature of the
contracts, making it more expensive for crowd investors to resolve the agency and control
problem with the firm. In summary, by enabling start-up finance via the Internet, equity
crowdfunding does not solve the agency problem between investors and the entrepreneur. Local
investments by more sophisticated investors might therefore be a means to lower the transaction
costs of screening and monitoring a venture.
Per its definition, in crowdfunding, the regular crowd often holds only a small stake in a firm
and might rationally rather write off an investment than engage in costly monitoring activities.
In comparison with the regular crowd, angel-like investors tend to invest higher amounts and
therefore are more likely to bear the transaction costs of conducting, for example, due diligence.
Living close to the firm reduces the transaction costs of screening and monitoring a business

15
(Chen, Gompers, Kovner, & Lerner, 2010; Cumming & Dai, 2010). We therefore hypothesize
the following:
Hypothesis 1: In equity crowdfunding, angel-like investors, who make high
investments, exhibit a larger local bias.
Furthermore, in equity crowdfunding, the size of the local bias could be explained by an offline
social relationship between the founder and the investors. In particular, family and friend
investors may solve agency problems more easily and exhibit distinct investment patterns,
because they (1) have direct information about the founder and (2) are more likely to live closer
to the respective firm. Moreover, love money can display informational advantages regarding
the quality of the entrepreneurs (Cumming & Johan, 2009). Analyzing crowdfunding
campaigns by artists on the portal Sellaband, Agrawal et al. (2015) provide evidence that family
and friends largely explain the existing local bias. In line with their results, we hypothesize the
following:
Hypothesis 2: In equity crowdfunding, the local bias is larger for investors with
personal ties to the entrepreneur (i.e., family and friends).
As noted previously, passive investors maximize their expected returns by maintaining a well-
diversified portfolio (Markowitz, 1952). Passive investors would per definition not try solving
the agency problem by monitoring and exercising control over the firms in their portfolio.
Regional dispersion then becomes an important aspect for portfolio diversification (French &
Poterba, 1991). The overweighting of local securities can expose investors to clustered risks,
which in turn might decrease expected returns. Crowd-lending portals such as Lending Club,
Prosper, and Funding Circle offer automated tools that allow the investor to pledge predefined
amounts in each campaign independent of the geographic location of the respective target.8 We
hypothesize that investors who maintain a well-diversified portfolio on the equity crowdfunding
portal and are more experienced in this domain will also geographically diversify their equity
crowdfunding investments more thoroughly, to maximize their expected returns (Abreu &
Mendes, 2010; Goetzmann & Kumar, 2008).
Hypothesis 3: In equity crowdfunding, the local bias is smaller for more experienced
investors.
8 See also LendingRobot (https://www.lendingrobot.com/), which automatically invests in Lending Club,
Prosper, and Funding Circle.

16
If the local bias constitutes a behavioral anomaly detrimental to investors, it should be less
pronounced if investors are led by emotions and feelings unrelated to geographic location. On
most European equity crowdfunding portals, investors can see previous investments by other
investors, the amount their peers have pledged, and sometimes where other investors are
located. Such a portal design allows for information cascades and can trigger herding behavior
among the crowd, where investment decisions are based solely on the behavior of others
(Hornuf & Schwienbacher, 2018b; Vismara, 2018). Thus, investors might no longer care about
the location of the investment, as they are under the influence of other behavioral factors.
Moreover, they should no longer engage in a careful screening process or consider the potential
advantage of local investments in terms of agency theory when engaging in herding behavior.
Thus, herding should make the geographic distance of an investment less relevant.
Moreover, the time of day has important implications for investors’ biases (Coval & Shumway,
2005). Timing also matters in crowdfunding campaigns, with most investments in reward-based
crowdfunding taking place on weekends (Mollick, 2014). We expect the investors who invest
on the weekend to be less professional, as they probably consider these investments a free-time
activity. Less professional investors are also less likely to solve the agency problem and use
local knowledge or engage in extensive on-site screening. To this end, we would anticipate
weekend investments to show no local bias. We can also transfer this conjecture to the timing
of investments during the day. We expect that professional investors are active during the
workday, while less sophisticated investors invest as a free-time activity during the evening or
at night.
Hypothesis 4: In equity crowdfunding, herding behavior, weekend, and late-night
investments reduce the local bias.
Finally, local investment must not be irrational per se or constitute a behavioral anomaly if
investors who engage in a local firm are able to resolve the agency problem and verify the
quality of the ventures better. While this is most likely true for professional investors, the
regular crowd is less likely to engage in such screening and monitoring activities, given that
they hold only a small share in the firm. By contrast, local investments can be considered a
behavioral anomaly if they have a tendency to be written off more frequently. In this case, local
investors would not be able to identify high-quality ventures better because of their local
proximity and knowledge. In a final step, we therefore investigate whether equity crowdfunding
investors who direct their investments to local firms are more or less likely to invest in firms
that ultimately fail.

17
Hypothesis 5: In equity crowdfunding, local investments of the regular crowd
constitute a bias and are more likely to fail. Professional crowd investors are more
likely to resolve agency problems through local investments.
4. Data and Method
4.1. Data
For the period from November 6, 2011, to August 28, 2014, we collected data on 21,416
individual investment decisions from two German equity crowdfunding portals, Companisto
and Innovestment. We were able to obtain data on all the 74 campaigns run on the two portals
during the observation period. For Companisto, we hand-collected data on 30 campaigns, while
Innovestment provided data on 44 campaigns. Information on the location of the firms running
the equity crowdfunding campaigns came from the German company register (Bundesanzeiger
Verlag). To identify the investor location, Innovestment provided zip codes of investors’ place
of residence. Companisto allows investors to post their current location when making an
investment; because providing the location is not compulsory, investors had no incentive to
misrepresent their place of living. We needed to exclude 956 individual investments from the
analysis because no location was provided or the location could not be uniquely identified,
which left us with 20,460 investment decisions. On Companisto, 65.6% of the investments
disclosed a city name, and 34.4% revealed either the country or federal state (Bundesland). We
assigned investors who only indicated the state to the city with the largest population in the
respective state (Tables W1–W4 in the Web Appendix report the results restricting the sample
to investors providing their exact location [Companisto] and those from the portal that directly
provided the location of the investors to us [Innovestment]).9
Panel A of Table 2 provides and overview of the data we use in our empirical analyses, and
Panel B shows the mean investment amounts by different distance categories for each of the
two portals. Variables reported are defined in Appendix A. The table reveals that investors
living within a range of less than 100 km from the firms invest higher amounts on average than
investors living within a range of 100 km to 300 km from the firms (Innovestment: p = 0.057;
Companisto: p = 0.065). However, while regionally close investors invest the overall highest
amounts on Innovestment, the largest amounts come from distant investors living more than
700 km away for Companisto campaigns. In the context of U.S. venture capital investments
(Cumming & Dai, 2010), the mean distance between the venture capitalist’s headquarters and
9 We assigned foreign investors who only indicated the country to the city with the largest population in the
respective country.

18
the headquarters of new ventures is 783 miles (around 1,260 kilometers). In our sample, the
average distance is 371 kilometers. Panel C of Table 2 reports the descriptive statistics for the
dependent and explanatory variables, and Panel D shows the descriptive statistics separately
for Companisto and Innovestment campaigns. To learn more about the investment experience
of the investor, we also obtained survey data from Innovestment about the past experience of
the investor in various investment segments outside the equity crowdfunding market.
– Table 2 around here –
4.2. Method
4.2.1. Individual investments. To measure the local bias, we first derive the distance between
investors and firms following Vincenty (1975), who calculates the distance between two points
on the surface of a spheroid. The location points of investors and firms are specified by
longitude and latitude. We then measure the local bias following Coval and Moskowitz (1999).
To analyze the effect of firm and campaign-specific characteristics, we calculate the local bias
for individual investment decisions rather than investment portfolios.
To determine whether a crowd investor skews investments toward more local or more distant
firms, we must define the distance of a relative benchmark portfolio available on the respective
portal. Because portals inform investors about their upcoming campaigns on the portal websites
or in investor newsletters, we consider not only investment opportunities at the time of the
investment decision for this benchmark portfolio but also campaigns that are upcoming in a
couple of days or weeks. Moreover, because of these early campaign announcements, investors
could have decided to invest in the focal firm even before the respective firm accepts
investments, and the geographic proximity of previous investment opportunities might also
have influenced the investment decision. Assuming that engagements in start-up firms are
usually not made in an ad hoc manner and only a few equity crowdfunding campaigns are run
in parallel on a given day, we consider for our benchmark portfolio a time frame of four weeks
before and after the actual investment decision is made.
Suppose investors i can invest in N different firms on an equity crowdfunding portal. Under the
assumption that the investor could potentially have invested in all available firms on a given
equity crowdfunding platform during the stated time frame, we define the investment weight
for each available firm as 1
𝑁. Let 𝑑𝑖𝑗 denote the distance between investor i and firms j; then, we

19
can define the mean distance of the equally weighted benchmark portfolio on the respective
platform for investment i as
(1) 𝑑𝑖𝑀 =1
𝑁∑ 𝑑𝑖𝑗𝑁𝑗=1 .
The local bias of investor i investing in firm j is
(2) 𝐿𝑜𝑐𝑎𝑙𝐵𝑖𝑎𝑠𝑖𝑗 =𝑑𝑖𝑀−𝑑𝑖
𝑑𝑖𝑀.
The local bias therefore runs from minus infinity to plus one. A local bias of zero indicates that
the investor invested in a firm that is of a comparable distance to the neutral benchmark
portfolio. We interpret a positive local bias as a tendency to invest in local firms; a negative
local bias indicates that investors prefer firms that are farther away.
4.2.2. Investor portfolios. In a second step, we analyze the local bias for the portfolio of each
investor on a given equity crowdfunding portal. This enables us to evaluate the aggregate
investment decisions of crowd investors. For Innovestment, we identify investors from a unique
user ID the portal provided to us. For Companisto, we assume that the name and location
combination as indicated by the investor provides a good proxy to identify a unique investor.
However, because we cannot entirely rule out that there are two users investing on the portal
with a popular name such as “Michael,” who both live in a large city such as Munich, we report
all results excluding investments by users with the 20 most popular German names10 in
Tables W5–W8 in the Web Appendix. Moreover, because we do not expect two investors from
one region using the same name to systematically exhibit opposing local biases that cancel each
other out, nothing is lost by combining these two investors into a single portfolio.
Following Seasholes and Zhu (2010), we adjust the distance of the investor portfolio for the
amount invested in each portfolio firm. Eqs. (3) and (4) therefore consider the number of
successful portfolio investments T by investor i adjusted for the amount 𝐼𝑛𝑣𝑖𝑗 invested in firms
𝑗. The denominator 𝑃𝐹𝑖 is the total amount of investor 𝑖’s portfolio on August 25, 2014. The
weighted distances in the overall portfolio is therefore
10 Source: Institute for Employment Research (IAB). Male and female names from 1990 to 2011 from German
employees.
20
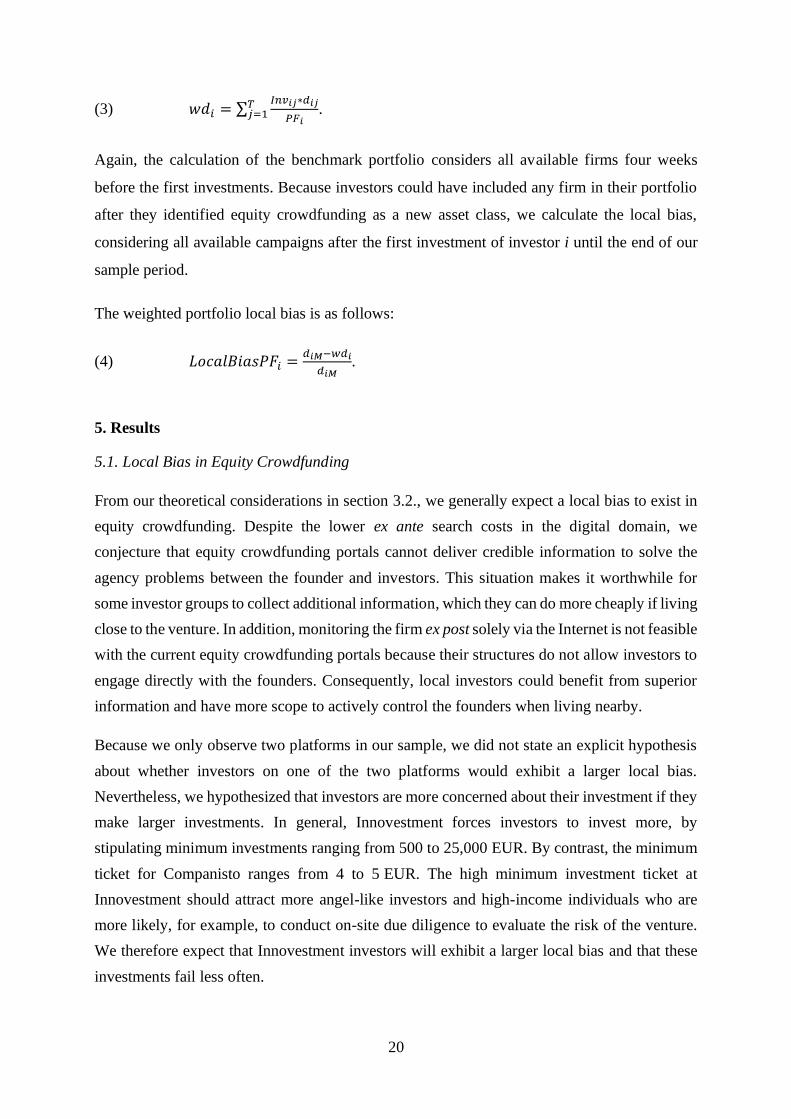
(3) 𝑤𝑑𝑖 = ∑𝐼𝑛𝑣𝑖𝑗∗𝑑𝑖𝑗
𝑃𝐹𝑖
𝑇𝑗=1 .
Again, the calculation of the benchmark portfolio considers all available firms four weeks
before the first investments. Because investors could have included any firm in their portfolio
after they identified equity crowdfunding as a new asset class, we calculate the local bias,
considering all available campaigns after the first investment of investor i until the end of our
sample period.
The weighted portfolio local bias is as follows:
(4) 𝐿𝑜𝑐𝑎𝑙𝐵𝑖𝑎𝑠𝑃𝐹𝑖 =𝑑𝑖𝑀−𝑤𝑑𝑖
𝑑𝑖𝑀.
5. Results
5.1. Local Bias in Equity Crowdfunding
From our theoretical considerations in section 3.2., we generally expect a local bias to exist in
equity crowdfunding. Despite the lower ex ante search costs in the digital domain, we
conjecture that equity crowdfunding portals cannot deliver credible information to solve the
agency problems between the founder and investors. This situation makes it worthwhile for
some investor groups to collect additional information, which they can do more cheaply if living
close to the venture. In addition, monitoring the firm ex post solely via the Internet is not feasible
with the current equity crowdfunding portals because their structures do not allow investors to
engage directly with the founders. Consequently, local investors could benefit from superior
information and have more scope to actively control the founders when living nearby.
Because we only observe two platforms in our sample, we did not state an explicit hypothesis
about whether investors on one of the two platforms would exhibit a larger local bias.
Nevertheless, we hypothesized that investors are more concerned about their investment if they
make larger investments. In general, Innovestment forces investors to invest more, by
stipulating minimum investments ranging from 500 to 25,000 EUR. By contrast, the minimum
ticket for Companisto ranges from 4 to 5 EUR. The high minimum investment ticket at
Innovestment should attract more angel-like investors and high-income individuals who are
more likely, for example, to conduct on-site due diligence to evaluate the risk of the venture.
We therefore expect that Innovestment investors will exhibit a larger local bias and that these
investments fail less often.

21
Panel A of Table 3 shows that investments in equity crowdfunding in general exhibit a local
bias. The average distance of crowd investments in our sample is 1.2% closer than the average
distance of the benchmark portfolio, and this difference is statistically different from zero at the
5% level. However, this finding is mainly driven by investments on Innovestment, on which
the average distance of actual investments is 10.6% closer than the benchmark portfolio; on
Companisto, investments are only 0.4% closer than the respective benchmark portfolio, which
is not significantly different from zero. The difference in the local bias between Innovestment
and Companisto investments is statistically significant (difference of means t-test, p < 0.001).
Moreover, the local bias on Innovestment exists only for investments from investors located in
Germany. In contrast with the findings of Baltzer et al. (2013), foreign equity crowdfunding
investors do not skew their investments toward more local firms. After we exclude family and
friends from our analysis, which represent 23% of the investments, the local bias becomes
smaller for investments on both portals, which indicates that this investor group explains the
local bias, at least partly. However, for Innovestment the average distance of actual investments
is still 8.1% closer than the distance of the respective benchmark investments, after we exclude
family and friends from the analysis. This result remains statistically significant at the 1% level.
Panel B of Table 3 shows the results for investor portfolios. When considering portfolios instead
of individual investments, we find an overall stronger local bias, with the average distance of
actual portfolios being 10.1% closer than that for the respective benchmark portfolios.
Moreover, the local bias of investment portfolios now holds for both portals, with Innovestment
again showing a larger local bias (18.1%) than Companisto (9.5%). The local bias for both
portals is statistically different from zero. Moreover, the difference in the local bias between
the two portals is statistically significant (difference of means t-test, p < 0.001). Furthermore,
we find that German investors on both portals show a significant local bias. On Companisto,
the average distance of equity crowdfunding portfolios of foreign crowd investors is 1.4%
farther away than the respective benchmark portfolios. This result is significant at the 1% level.
Excluding family and friends from our analysis again reduces the local bias for equity
crowdfunding portfolios. The local bias, however, remains positive and significant at the 1%
level for both portals.
In summary, we find strong evidence of a local bias in equity crowdfunding. The differences
between the two portals Companisto and Innovestment indicate that portal design affects the
local bias of crowd investors. We therefore cannot reject our conjecture that investments on
Innovestment exhibit a larger local bias, presumably because of the higher minimum
investments. By requiring a higher minimum investment and running a second-price auction

22
mechanism, Innovestment potentially also attracts more professional investors who have
greater incentives to control and monitor the founder and therefore tend to invest in more local
firms. By contrast, investors on the portal Companisto, which requires a much lower minimum
investment and runs a simple first-come, first-served auction mechanism to allocate shares,
exhibit a much smaller local bias, presumably because solving the agency problem with the
founder is not feasible when transaction costs relative to the small investment amounts are too
high.
– Table 3 around here –
5.2. Contributing Factors to the Local Bias in Equity Crowdfunding
In this section, we test our hypotheses as outlined in section 3.2. Our dependent variable is the
local bias of individual investments as outlined in section 4.2.1, which allows us to identify the
effect of campaign-specific factors on the geographic biasedness of investment decisions.
In the baseline specification in Table 4 (Panel A, columns (1) and (2)), we include basic
campaign characteristics next to firm dummies to control for the specific effects of each
campaign. We include the baseline specification in each subsequent regression (Table 4, Panels
B–D) but do not report it again as the results remain similar in terms of magnitude and statistical
significance. First, our findings suggest that relative to the benchmark portfolio, investors on
Innovestment are located closer to target firms than investors on Companisto. Second, the local
bias occurs mostly in short campaigns. Third, a higher firm valuation is associated with the
campaign attracting investments with a larger local bias. This effect might result from a higher
price per share, making it necessary for investors to examine more closely the activities of the
start-up firm. Fourth, a higher population density is negatively associated with a lower local
bias. The specific industry of the firm also affects the local bias. The base category industry is
transportation, which exhibits a larger local bias than all other industries except for financial
and insurance activities (Industry_finance) and the art, entertainment, and recreation sector
(Industry_entertainment).
While firm fixed effects capture the unobserved variation among campaigns, in a next step we
also consider venture quality more explicitly in Table 4 (Panel A, columns (3) and (4)). We find
that investors reveal a larger local bias if the total amount of capital raised during a previous
equity crowdfunding campaign is larger, the business plan of the venture is shorter and more
readable, and the business plan includes more pictures. A firm that incorporates under a legal
form with a minimum capital requirement of more than 1 EUR, which indicates that the venture
possesses more assets that could be controlled, also positively affects the local bias. In a similar

23
vein, the local bias of individual investors is also larger if the start-up owns more patents. The
tendency to invest local relative to a benchmark portfolio increases by 38.4% if the start-up
firms owns one more patent. This is in contrast with findings for the U.S. venture capital market,
in which Cumming and Dai (2010) find that the number of patents is negatively correlated with
the local bias.
Panel B of Table 4 shows that angel-like investors who invest at least 5,000 EUR in an equity
crowdfunding campaign (Investment_5k) exhibit a local bias that is 5.1 percentage points larger
(columns (2) and (6)) than the local bias of the remaining crowd, which is in line with agency
theory and hypothesis 1. This effect, however, vanishes when we control for family and friend
investors (columns (4) and (8)). While early investments during the first three days of the
campaign (Investment_first3days) do not affect the local bias, the combination of early
investments and angel-like investors significantly and positively affects the local bias
(Investment_5k x Investment_first3days), even when we control for family and friend investors
(columns (4) and (8)). Investments by an angel-like investor who invests during the first three
days of the campaign increase the local bias by 13.5 to 14.2 percentage points, which is
statistically significant at the 1% level. We therefore find support for hypothesis 1, which states
that angel-like investors who make larger investments exhibit a larger local bias.
In line with the descriptive statistics and hypothesis 2, the regression results in Table 4 (Panel
B) reveal that family and friend investors (Investor_familyfriends) have a significantly larger
local bias than the regular crowd. Investments by family and friends on average have a local
bias that is 6.3 percentage points larger than the local bias of other investors. This result
provides support for hypothesis 2, which states that the local bias is larger for investors with
personal ties to the entrepreneur. It is also in line with Agrawal et al.’s (2015) finding that this
investor group matters most with regard to local proximity in reward-based crowdfunding.
Panel C of Table 4 accounts for the experience of investors. As we state in hypotheses 3, more
experienced investors should show a smaller local bias. We consider the size of the equity
crowdfunding portfolio, as measured by the number of investments (Investor_#investments),
and the total portfolio amount (Investor_portfolioamount) as proxies of experience in equity
crowdfunding. In line with the conjecture that more experienced investors exhibit fewer
behavioral anomalies, we find that the total portfolio amount reduces the local bias, which is
statistically significant at the 1% level. If the total portfolio amount of an investor increases by
1,000 EUR, the local bias decreases by 0.3 percentage point. The number of investments and
the average investment size have no significant impact on the local bias. Arguably, as indicators
of socioeconomic status, regional characteristics might also be proxy variables for investment

24
experience. We find that an increase in the average gross domestic product per person in the
region where the investor lives by 1,000 EUR decreases the local bias by 0.1 percentage point.
Likewise, investors who live in large cities exhibit a 3.4 percentage points smaller local bias.
As investment experience in equity crowdfunding and regional characteristics might be a weak
proxy variable for investment experience overall, we use survey data on past investor
experience as a more direct measure of investment experience, which is available for
Innovestment investors only. The results in Table 4 (Panel C, columns 2 and 5) show that past
investment experience has no effect on the local bias, except for investors who invested in real
estate projects exhibiting a 6.8 percentage points larger local bias. However, this finding is only
weakly significant at the 10% level. Past investment experience in fixed-term deposits, other
fixed-income products, stocks, commodities, funds, certificates, and other corporate
investments did not affect the local bias of crowd investors.
Furthermore, we found no effect of control variables such as the gender of the investor or
whether he or she misspelled the location of origin, the latter of which might have been a good
proxy for how diligently the investment decision was made. Overall, the evidence for
hypothesis 3 is mixed. While our measures on investment experience on traditional capital
markets show no significant effect, the proxy variable of portfolio diversification in equity
crowdfunding negatively affects the local bias, which is in line with the notion that more
experienced investors adhere to biases to a lesser extent than more active investors and cannot
solve the agency problem. Responses to the survey on past investment experience, however,
indicate stated experience on capital markets, while the crowdfunding portfolio diversification
provides a revealed measure of investment experience. Consequently, we are somewhat
confident that investment experience negatively affects the local bias.
Finally, we investigate hypothesis 4 to determine the effect of herding and timing on the
tendency for a local bias. Panel D of Table 4 shows that investors who invest during the
weekend (Investment_weekend) have a relatively lower local bias, which is in line with the
notion that weekend investors are less professional and do not exercise control. On average,
investing on the weekend decreases the local bias by 2.2 to 2.8 percentage points as compared
with weekday investments, which is in line with hypothesis 4. We further control for
investments pledged on weekends during the first three days of the campaign, to account for
the timing of campaign starts, and find no significant impact for this interaction term on the
local bias.11 Even when we consider additional control variables, the results remain robust, and
11 We further checked whether investors received updates before the start of the campaign or whether some
investors had early investment opportunities. We did not find any cases in which this applied.

25
the effect sizes are the same. Our herding variable (Investment_#earlier) consists of the number
of investments pledged earlier that day (see Hornuf and Neuenkirch [2017], who use the same
measure). Panel D also shows no significant effect for this variable. Furthermore, the number
of angel-like investors who invested 5,000 EUR or more in the focal campaign
(Investment_#earlier5k) does not affect the local bias of other investors. Furthermore, investing
on evenings (Investment_evening) or at night (Investment_night) does not affect the local bias
either.
– Table 4 around here –
5.3. Local Bias and Firm Failure
In total, we consider 74 campaigns of 68 unique firms in our sample. The variable of interest—
firm failure—was constructed as of November 1, 2019, when we collected data for the last time
on insolvencies and liquidations. Given that our observation period ends on August 28, 2014,
we consider a sufficient failure period of more than five years. During that time, 31 of the firms
in our sample went into insolvency, were liquidated, or were dissolved. None of them
experienced an exit event in the form of a buy-out through a venture capital fund. In what
follows, we investigate firm failure and do not report returns on investment, because recovery
rates are unknown to us and thus we could only speculate on the realized returns of investors in
the form of a cash payout. However, little is lost by reporting firm failure rates because we
expect recovery rates to be close to 0%, given that start-ups often have no significant assets and
the financial instruments used in equity crowdfunding are subordinate to ordinary debt.
Table 5 shows that investors who directed their investments to local firms lost their investments
significantly more often than other investors (37.7% vs. 34.9%), which indicates that, in
general, investing locally constitutes a behavioral anomaly rather than a rational preference.
While one of the major differences between local investments in peer-to-peer lending (Lin &
Viswanathan, 2015) and equity crowdfunding is that investors can make additional efforts to
gather information about the quality of the firm raising funds, there is no evidence that this
benefit pays off for local investors, who should more easily be able to screen and monitor a
venture. In line with hypothesis 5, we find that regular investors directing their investments to
more local firms more often pick start-ups that run into insolvency, are liquidated, or are
dissolved. This result is driven by investors who choose to invest on Companisto. For
Companisto, we find that local investments are clearly more likely to fail (38.0%) than more
distant investments (34.4%). For Innovestment, we find that local investments, which might be

26
associated with more screening or monitoring activities, lead to a clearly lower failure rate for
local investment (34.8%) than more distant firms (41.4%). This finding is in line with agency
theory and the notion that more sophisticated investors can screen and monitor firms better if
they live close.
– Table 5 around here –
In Table 6, we test hypothesis 5 in a multivariate setting. In columns (1) and (3), we include a
dummy variable that equals 1 if the local bias is positive (Localbias), which represents our
variable of interest. In columns (2) and (4), we consider the local bias of individual investment
decisions (Lb_investment) as a continuous variable of interest as defined in section 2.4.1.
As a starting point, we estimate a probit model that identifies factors affecting the probability
of whether an investment ultimately failed or not. Columns (1) and (2) of Table 6 show the
results from the probit regression and report average marginal effects. Thereafter, we examine
when the investment fails by performing a Cox proportional hazards model. Columns (3) and
(4) show the results from the proportional hazards model and report hazard ratios. When using
the somewhat crude measure of a dummy variable that captures whether the local bias is
positive or not, we find no significant effect of local investments on firm failure. Simply being
located closer than the benchmark portfolio does not improve any of the screening or
monitoring activities. However, when measuring the local bias as a continuous variable in the
multivariate setting, we find a significant, negative effect on the probability that an investment
fails.
If the local bias of individual investment increases by 100 percentage points, the probability of
firm failure decreases by 4.1%, when we hold all other variables constant. In the survival
analysis, we find that an increase of the local bias by 100 percentage points is associated with
a 29.2% lower hazard that an investment fails, holding all other variables constant. This finding
is in line with hypothesis 5.
– Table 6 around here –
5.4. Robustness Checks

27
We perform robustness tests on our analysis. First, we restrict our investor sample to investors
who provided their exact location. Second, we restrict our sample to German investors only and
run a robustness test by excluding investors with the most popular German names.
First, as discussed in section 4.1., we restrict the Companisto sample to investors who provided
their exact location. Web Appendix Table W1 (Panel A) reveals that actual crowd investments
show an even stronger local bias of 2.3%, which is an increase of 1.1 percentage points,
compared with the full sample in which we needed to approximate the exact location for 32%
of the investors. Furthermore, the average distance of actual investments on Companisto is now
1.2% closer than the average distance of the benchmark portfolio, and this difference is now
statistically different from zero. Again, this finding is driven by German and not foreign
investors. When considering portfolios instead of individual investments, we find an overall
stronger local bias, with the average distance of actual portfolios being 13.5% closer than that
for the respective benchmark portfolio (Web Appendix Table 1, Panel B).
For the regressions results in Web Appendix Table W2 (Panel A), we observe qualitatively and
significantly similar results, except for some of the variables. Campaigns that were successfully
funded (Campaign_success) are now significant with regard to our baseline regression not
including other campaign controls. Furthermore, for the restricted sample we find an increase
in the local bias of 9.4 percentage points for family and friend investors (vs. 6.3%; Web
Appendix Table 2, Panel B). The effect of angel-like investors who invest more than 5,000
EUR during the first three days of a campaign is only weakly significant at the 10% level, which
could be due to the reduction in statistical power of the smaller sample. With regard to investor
characteristics, the negative effect of investors living in a city with at least one million
inhabitants on the local bias is more pronounced (12.7 vs. 3.4 percentage points). With regard
to herding and timing (Web Appendix Table 2, Panel D), we find only a statistically weak effect
for investments during the weekend, which could again be due to the reduction in statistical
power. The results of some control variables now yield mixed results. For example, the ratio of
the total funding amount reached to the funding goal at the time of the investment decision
predicts an increase in the local bias, but not if data are winsorized.
With regard to firm failure (Web Appendix Table W3), investors who directed their investments
to local firms lost their investments generally less often (39.3% vs. 43.9%). This result is driven
by investors who choose to invest on both Companisto and Innovestment. The crude measure

28
of the local bias dummy variable now also yields a significant result, indicating that a positive
local bias decreases the probability of firm failure by 3.6%, when we hold all other variables
constant (Web Appendix Table 4). The remaining results remain unchanged.
Second, when excluding investments by users with the 20 most popular German names (Web
Appendix Table W5) we observe slightly stronger effects than before. One exception is that
angel-like investors investing during the first three days of the campaign now exhibit a
somewhat smaller local bias (11.5% vs. 13.5%; see Web Appendix Table 6, Panel B). With
regard to firm failure, we obtain similar results. Furthermore, in unreported regressions, we
excluded the 20 most popular names in our sample. The results remain almost identical and are
available on request. Finally, when we exclude international investors from our analyses, the
results again reveal somewhat stronger effects than before and remain largely identical in terms
of statistical significance (Web Appendix Tables 9–12).
6. Discussion and Conclusion
This paper contributes to the nascent and scarce literature on investor behavior in equity
crowdfunding (Block, Hornuf, & Moritz, 2018; Vismara, 2018; Vulkan, Åstebro, & Sierra,
2016). Early literature has examined determinants of funding success and investment dynamics
as well as the crowd’s willingness to pay for cash flow rights. More recently, scholars have
begun investigating the determinants of individual investment decisions. Although Günther et
al. (2018) find that geographic distance is negatively correlated with investment probability,
they do not consider benchmark portfolios or behavioral anomalies. Our perspective is different
in that we investigate what determines the local bias of individual investments and investor
portfolios.
We began with the question whether a local bias occurs in equity crowdfunding. Our results
reveal that a local bias exists for individual investments and investment portfolios. We show
that the average distance of actual crowd investments is 1.2% closer for individual investments
and 10.1% for investor portfolios than the average distance of the respective benchmark
portfolios. However, we find that the effect varies significantly for portals, with investors on
Innovestment showing a significantly larger local bias. This finding is most likely due to
Innovestment’s higher minimum investment tickets and its second-price auction mechanism,
which presumably attracts more sophisticated investors. Although, in general, family and
friends show a larger local bias, we find that the remaining investors still exhibit a local bias,
even when controlling for this specific investor group. Angle-like investors also have a larger

29
local bias, which might stem from their engaging in more on-site screening and monitoring. In
line with the notion that investors who have a better diversified and larger equity crowdfunding
portfolio do not have the capacity to screen and monitor each and every portfolio firm, we find
that this group exhibits a smaller local bias.
Research on reward-based crowdfunding shows that backers who identify themselves with
projects in social networks have a higher pledge-to-backer ratio (Kromidha & Robson, 2016).
We therefore investigated whether the firms in our sample develop products or services that
have an obvious local appeal. However, not a single craft brewery or community-related service
firm appeared in our sample, which would have indicated such a local product focus. The firms
in our sample, for example, have developed a laser-based process to produce nanoparticle or
offer a nationwide subscription service for toys and games. Nevertheless, our study has clear
limitations, which offer fruitful avenues for further research.
First, while a local bias might constitute a decision-making anomaly that deviates from an
optimally diversified portfolio (Markowitz, 1952), investing in more local firms might well be
profitable for investors if they can extract important information through on-site screening and
monitoring. Our analysis provides first evidence that portal design plays a crucial role in
attracting a more sophisticated crowd. On Companisto—which requires a lower minimum
investment and runs a simple first-come, first-served auction—local investors more often chose
firms that later went into insolvency or were dissolved. By contrast, local investors on
Innovestment—on which the minimum investment is relatively higher and tickets are allocated
through a second-price auction—less often chose firms that went into insolvency or were
dissolved. However, although Innovestment apparently attracted a more sophisticated crowd,
the portal itself became insolvent in 2017. This provides important avenues for future research,
most notably in the field of industrial relations and platform competition. If high-quality equity
crowdfunding portals attract more sophisticated investors, but these portals systematically fail
more frequently, the equity crowdfunding industry might head toward a lemons market. Future
research should investigate different types of portals and analyze which portal characteristics
attract a more sophisticated crowd. Furthermore, whether portfolios directed to more local firms
outperform the benchmark portfolio in terms of returns is a matter that should be investigated
empirically when data are available on the performance of these investments. Second, our
research shows that portal design matters. However, although the features we have identified
are clearly dominant on the portals we investigate, we can only speculate that they drive the
differences. Additional research might therefore collect data on more portals to unpack the exact
features of portal designs that determine the local bias.

30
References
Abreu, M., & Mendes, V. (2010). Financial literacy and portfolio diversification. Quantitative
Finance, 10(5), 515-528.
Aghion, P., & Bolton, P. (1992). An incomplete contracts approach to financial contracting.
Review of Economic Studies, 59, 473-494.
Agrawal, A., Catalini, C., & Goldfarb, A. (2014). Some simple economics of crowdfunding.
Innovation Policy and the Economy, 14, 63-97.
Agrawal, A., Catalini, C., & Goldfarb, A. (2015). Crowdfunding: Geography, social
networks, and the timing of investment decisions. Journal of Economics & Management
Strategy, 24(2), 253-274.
Ahlers, G. K. C., Cumming, D. J., Guenther, C., & Schweizer, D. (2015). Signaling in equity
crowdfunding. Entrepreneurship Theory and Practice, 39(4), 955-980.
Akerlof, G. A. (1970). The market for lemons: Quality uncertainty and the market
mechanism. Quarterly Journal of Economics, 84, 488-500.
Baik, B., Kang, J., & Kim, J. (2010). Local Institutional investors, information asymmetries,
and equity returns. Journal of Financial Economics, 97(1), 81-106.
Baltzer, M., Stolper, O., & Walter, A. (2013). Is local bias a cross-border phenomenon?
Evidence from individual investors’ international asset allocation. Journal of Banking &
Finance, 37(8), 2823-2835.
Berger, A., & Udell, G. (1998). The economics of small business finance: The role of private
equity and debt markets in the financial growth cycle. Journal of Banking and Finance,
22(6), 613-673.
Bergloff, E. (1994). A control theory of venture capital finance. Journal of Law, Economics
and Organization, 10, 247-267.
Black, B., & Gilson, R. (1998). Venture capital and the structure of capital markets: Banks
versus stock markets. Journal of Financial Economics, 47(3), 243-277.
Block, J., Hornuf, L., & Moritz, A. (2018). Which updates during an equity crowdfunding
campaign increase crowd participation? Business Economics, 50(1), 3-27.
Bradford, S. (2012). Crowdfunding and the federal securities laws. Columbia Business Law
Review, 2012(1), 1-150.
Braun, R., Eidenmüller, H., Engert, A., & Hornuf, L. (2013). Does charter competition foster
entrepreneurship? A difference‐in‐difference approach to European company law reforms.
JCMS: Journal of Common Market Studies, 51(3), 399-415.
Camp, J. J. (2002). Venture capital due diligence: A guide to making smart investment
choices and increasing your portfolio returns. New York: Wiley.
Campbell, J. Y. (2006). Household finance. Journal of Finance, 61(4), 1553-1604.
Chen, H., Gompers, P., Kovner, A., & Lerner, J. (2010). Buy local? The geography and of
venture capital. Journal of Urban Economics, 67(1), 90-102.
Coase, R. (1960). The problem of social cost. Journal of Law and Economics, 3, 1-44.
Coval, J. D., & Moskowitz, T. J. (1999). Home bias at home: Local equity preference in
domestic portfolios. Journal of Finance, 54(6), 2045-2073.
Coval, J. D., & Shumway, T. (2005). Do behavioral biases affect prices? Journal of Finance,
60(1), 1-34.

31
Cumming, D. J., & Dai, N. (2010). Local bias in venture capital investments. Journal of
Empirical Finance, 17(3), 362-380.
Cumming, D. J., Hornuf, L., Karami, M., & Schweizer, D. (2019a). Disentangling
crowdfunding from fraudfunding. Max Planck Institute for Innovation & Competition
Research Paper No. 16-09.
Cumming, D. J., & Johan, S. A. (2009). Venture capital and private equity contracting: An
international perspective. Amsterdam: Elsevier.
Cumming, D. J., Leboeuf, G., & Schwienbacher, A. (2019b). Crowdfunding models: Keep-it-
all vs. all-or-nothing. Financial Management, forthcoming.
Dorfleitner, G., Hornuf, L., Schmitt, M., & Weber, M. 2017. The German FinTech market.
Heidelberg: Springer.
French, K. R., & Poterba, J. M. (1991). Investor Diversification and International Equity
Markets. American Economic Review, 81(2), 222-226.
Fryges, H., Gottschalk, S., Licht, G., & Müller, K. (2007). Hightech-Grundungen und
Business Angels. Final Report for the Federal Ministry of Economic Affairs and
Technology. Retrieved from http://ftp.zew.de/pub/zew-docs/gutachten/businessangel-
endbericht.pdf.
Goetzmann, W. N., & Kumar, A. (2008). Equity portfolio diversification. Review of Finance,
12(3), 433-463.
Goldfarb, B., Hoberg, G., Kirsch, D., & Triantis, A. (2013). Are angels different? An analysis
of early venture financing. Robert H. Smith School Research Paper No. RHS 06-072.
Retrieved from http://ssrn.com/abstract=1024186.
Gompers, P., & Lerner, J. (1996). Use of covenants: An empirical analysis of venture
partnership agreements. Journal of Law and Economics, 39(2), 463-498.
Grossman, S. J., & Hart, O. (1983). An analysis of the principal agent problem.
Econometrica, 51(1), 7-46.
Günther, C., Johan, S., & Schweizer, D. (2018). Is the crowd sensitive to distance? How
investment decisions differ by investor type. Business Economics, 50, 289-305.
Hainz, C., Hornuf, L., Nagel, L., Reiter, S., & Stenzhorn, E. (2019): Exemption provisions of
the German Small Investor Protection Act: A follow-up study. CESifo DICE Report, 17(2),
41-51.
Hampton, K., & Wellman, B. (2002). Neighboring in Netville: How the Internet supports
community and social capital in a wired suburb. City and Community, 2(4), 277-311.
Harrison, R. T., Mason, C. M., & Girling, P. (2004). Financial bootstrapping and venture
development in the software industry. Entrepreneurship and Regional Development, 16(4),
307-346.
Harrison, R., Mason, C., & Robson, P. (2010). Determinants of long-distance investing by
business angels in the UK. Entrepreneurship and Regional Development, 22(2), 113-137.
Hornuf, L., & Neuenkirch, M. (2017). Pricing shares in equity crowdfunding. Small Business
Economics, 48(4), 795-811.
Hornuf, L., & Schwienbacher, A. (2017). Should securities regulation promote equity
crowdfunding? Small Business Economics, 49(3), 579-593.
Hornuf, L., & Schwienbacher, A. (2018a). Internet-based entrepreneurial finance: Lessons
from Germany. California Management Review, 60(2), 150-175.

32
Hornuf, L., & Schwienbacher, A. (2018b). Market mechanisms and funding dynamics in
equity crowdfunding. Journal of Corporate Finance, 50, 556-574.
Hornuf, L., Schilling, T., & Schwienbacher, A. (2019). Are equity crowdfunding investors
active investors? CESifo Working Paper Series No. 7884. Retrieved from
https://ssrn.com/abstract=3474190.
Ivković, Z., & Weisbenner, S. (2005). Local does as local is: Information content of the
geography of individual investors' common stock investments. Journal of Finance, 60(1),
267-306.
Jensen, M. C., & Meckling, W. H. (1976). Theory of the firm: Managerial behavior, agency
costs and ownership structure. Journal of Financial Economics, 3(4), 305-360.
Kimball, M. S., & Shumway, T. (2010). Investor sophistication and the home bias,
diversification, and employer stock puzzles. Working paper, Department of Economics,
University of Michigan.
Kleinert, S., & Volkmann, C. (2019). Equity crowdfunding and the role of investor discussion
boards. Venture Capital, 21(4), 327-352.
Knight, T. B., Leo, H., & Ohmer, A. A. (2012). Very quiet revolution: A primer on securities
crowdfunding and Title III of the Jobs Act. Michigan Journal of Private Equity & Venture
Capital Law, 2, 135-154.
Kromidha, E., & Robson, P. (2016). Social identity and signaling success factors in online
crowdfunding. Entrepreneurship & Regional Development, 28(9/10), 605-629.
Lehner, O. M. (2014). The formation and interplay of social capital in crowdfunded social
ventures. Entrepreneurship & Regional Development, 26(5/6), 478-499.
Lerner, J. (1995). Venture capitalists and the oversight of private firms. Journal of Finance,
50(1), 301-318.
Lin, M., & Viswanathan, S. (2015). Home bias in online investments: An empirical study of
an online crowdfunding market. Management Science, 62(5), 1393-1414.
Lutz, E., Bender, M., Achleitner, A.-K., & Kaserer, C. (2013). Importance of spatial
proximity between venture capital investors and investees in Germany. Journal of Business
Research, 66(11), 2346-2354.
Macintosh, J. (1994). Legal and institutional barriers to financing innovative enterprise in
Canada. Toronto: University of Toronto Press.
Mäkelä, M. M., & Maula, M. V. (2008). Attracting cross-border venture capital: The role of a
local investor. Entrepreneurship and Regional Development, 20(3), 237-257.
Markowitz, H. (1952). Portfolio selection. Journal of Finance, 7(1), 77-91.
Mason, C. M. (2006). Informal sources of venture finance. In Parker, S. (Ed.). The life cycle
of entrepreneurial ventures: Volume 3. International handbook on entrepreneurship. New
York: Springer-Kluwer.
Mollick, E. R. (2014). The dynamics of crowdfunding: An exploratory study. Journal of
Business Venturing, 29(1), 1-16.
Nguyen, T., Cox, J., & Rich, J. (2019). Invest or regret? An empirical investigation into
funding dynamics during the final days of equity crowdfunding campaigns. Journal of
Corporate Finance, 58, 784-803
Niemand, T., Angerer, M., Thies, F., Kraus, S., & Hebenstreit, R. (2018). Equity
crowdfunding across borders: A conjoint experiment. International Journal of
Entrepreneurial Behavior & Research, 24(4), 911-932.

33
Nitani, M., Riding, A., & He, B. (2019). On equity crowdfunding: investor rationality and
success factors. Venture Capital, 21(2/3), 243-272.
Parker, S.C. (2009). The Economics of Entrepreneurship. Cambridge: Cambridge University
Press.
Rider, C. I. (2012). How employees’ prior affiliations constrain organizational network
change: A study of U.S. venture capital and private equity. Administrative Science
Quarterly, 57(3), 453-483.
Riding, A. L. (2008). Business angels and love money investors: segments of the informal
market for risk capital. Venture Capital, 10(4), 355-369.
Rochet, J., & Tirole, J. (2003). Platform competition in two‐sided markets. Journal of the
European Economic Association, 1(4), 990-1029.
Seasholes, M. S., & Zhu, N. (2010). Individual investors and local bias. Journal of Finance,
65(5), 1987-2010.
Shane, S., & Stuart, T. (2002). Organizational endowments and the performance of university
start-ups. Management Science, 48(1), 154-170.
Sorenson, O., Assenova, V., Li, G. C., Boada, J. & Fleming, L. (2016). Expand innovation
finance via crowdfunding: Crowdfunding attracts venture capital to new regions. Science,
354(6319), 1526-1528.
Spence, M. (1973). Job market signaling. Quarterly Journal of Economics, 87, 355-374.
Szerb, L., Terjesen, S., & Rappai, G. (2007). Seeding new ventures – Green thumbs and
fertile fields: Individual and environmental drivers of informal investment. Venture
Capital, 9(4), 257-284.
Tian, X. (2011). The causes and consequences of venture capital stage financing. Journal of
Financial Economics, 101(1), 132-159
Vickrey, W. (1961). Counterspeculation, auctions, and competitive sealed tenders. Journal of
Finance, 16(1), 8-37.
Vincenty, T. (1975). Direct and inverse solutions of geodesics on the ellipsoid with
application of nested equations. Survey Review, 23(176), 88-93.
Vismara, S. (2018). Information cascades among investors in equity crowdfunding.
Entrepreneurship Theory and Practice, 42(3), 467-497.
Vulkan, N., Åstebro, T., & Sierra, M. F. (2016). Equity crowdfunding: A new phenomena.
Journal of Business Venturing Insights, 5, 37-49.
Wallmeroth, J. (2019). Investor behavior in equity crowdfunding. Venture Capital, 21(2/3),
273-300.
Wang, W., Mahmood, A., Sismeiro, C., & Vulkan, N. (2019). The evolution of equity
crowdfunding: Insights from co-investments of angels and the crowd. Research Policy,
48(8), 103727.
Wessel, M., Thies, F., & Benlian, A. (2015). A lie never lives to be old: The effects of fake
social information on consumer decision-making in crowdfunding. ECIS 2015 Working
Paper. Retrieved from
https://pdfs.semanticscholar.org/0dc4/9a35295f4e59dbc0149ab0b5473c4dc70e76.pdf.
Zacharakis, A. L., & Meyer, G. D. (1998). A lack of insight: Do venture capitalists really
understand their own decision process? Journal of Business Venturing, 13, 57-76.
Zey, M. (2001). Rational choice and organization theory. In N. J. Smelser & P. B. Baltees
(Eds.), International encyclopedia of the social & behavioral sciences. Orlando: Elsevier.

34
Table 1. Location of Venture Capital and Equity Crowdfunding Investments.
The table shows the 10 most relevant cities where venture capital funds, equity crowdfunding
investors, and target firms are located. We calculate the frequencies for target firm and
investor location separately in percentages for venture capital and equity crowdfunding
investments.
Venture capital sample Equity crowdfunding sample
Target firms % Investors % Target firms % Investors %
1 Berlin 39.8 Berlin 16.2 Berlin 67.5 Berlin 16.2
2 Munich 11.9 Munich 17.7 Hamburg 13.1 Munich 10.8
3 Hamburg 5.7 Bonn 14.5 Düsseldorf 6.4 Düsseldorf 7.6
4 Cologne 4,0 Frankfurt 4.8 Munich 3.3 Stuttgart 6.4
5 Potsdam 1.7 Paris 3.3 Neuenhagen 2.4 Hamburg 5.5
6 Stuttgart 1.6 London 3.1 Mannheim 2.1 Hannover 3.5
7 Aachen 1.5 Landshut 3.0 Hannover 0.9 Wiesbaden 3.3
8 Dresden 1.3 Hamburg 2.6 Velten 0.7 Dresden 1.9
9 Düsseldorf 1.3 Cologne 2.5 St. Augustin 0.4 Kiel 1.8
10 Hannover 1.3 Moscow 2.0 Herzogenrath 0.4 Cologne 1.6

35
Table 2. Summary Statistics.
Panel A provides summary statistics of sampled portals, firms, investors, and investments.
The sample consists of 74 equity crowdfunding campaigns by firms headquartered in
Germany that received 20,460 investments by 6,599 investors between November 6, 2011,
and August 25, 2014. Panel B provides summary statistics of mean investments in EUR for
different distance categories. Panel C presents summary statistics and presents the number
of observations, means, standard deviations, minimum values, and maximum values for all
variables. Column “Yes” indicates that a dummy variable takes the value of 1. Column
“Corr” shows bivariate correlations with the local bias for individual investments. Panel D
provides the summary statistics separately for Companisto and Innovestment. The last
column reports the difference in means between investments on Companisto and
Innovestment. We test the significance of the differences in means using a two-tailed t-test.
***, **, and + indicate significance at the 1%, 5%, and 10% level. Variables reported are
defined in Appendix A.
PANEL A: Data sample
Portal Location Total
Companisto Innovestment Germany Foreign
Equity Crowdfunding
Investments
Firms 30 44 74 - 74
Investors 6,167 432 5,948 651 6,599
Investments (#) 18,837 1,623 18,898 1,562 20,460
Investments (EUR) 6,250,590 4,512,152 9,755,644 1,007,098 10,762,742
Venture Capital
Investments
Venture capitalists - - 950 271 1,221
Entrepreneurs - - 1,221 - 1,221
PANEL B: Investments by distance categories
Investments (EUR)
Companisto Innovestment Total
N Mean SD N Mean SD N Mean SD
<100 km 3,430 320 944 286 3,434 6,378 3,716 560 2,152
100 km – 300 km 3,912 281 864 436 2,733 3,451 4,348 527 1,551
300 km – 500 km 6,331 314 1,013 608 2,643 3,637 6,939 518 1,590
500 km – 700 km 4,811 387 1,131 259 2,586 2,705 5,070 500 1,350
>700 km 353 570 1,661 34 1,818 1,087 387 680 1,656
Total 18,837 332 1,021 1,623 2,780 4,073 20,460 526 1,647
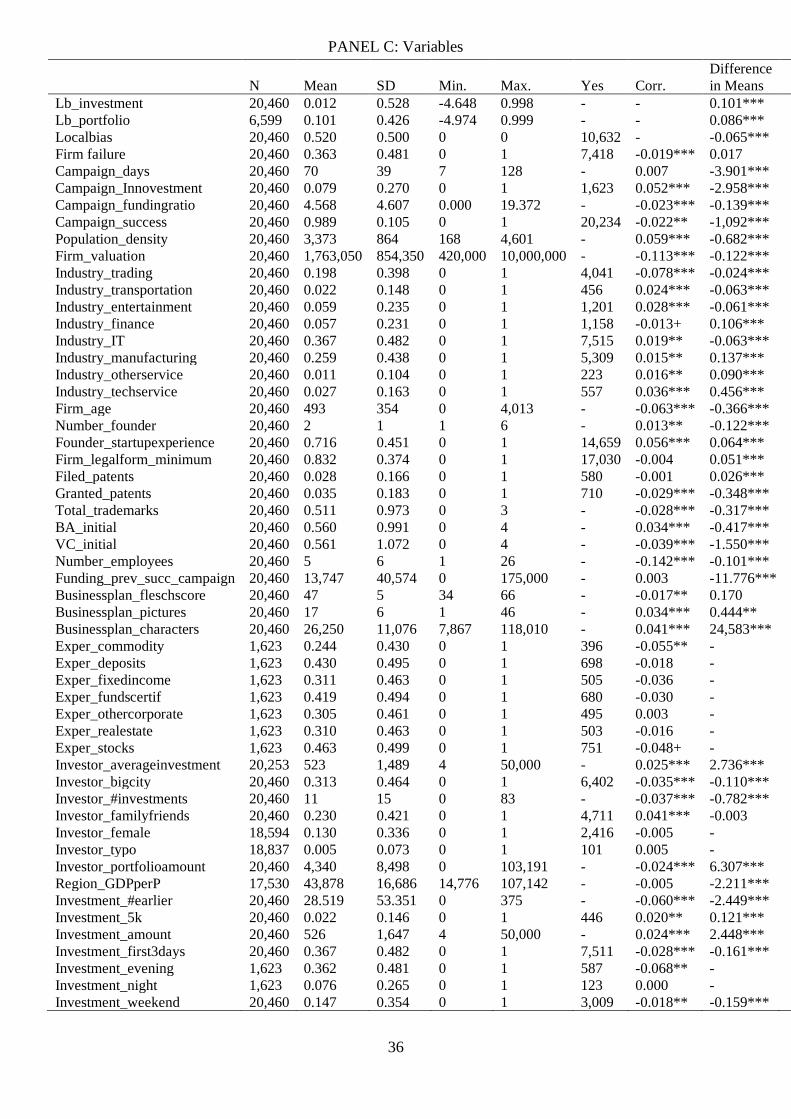
36
PANEL C: Variables
N Mean SD Min. Max. Yes Corr.
Difference
in Means
Lb_investment 20,460 0.012 0.528 -4.648 0.998 - - 0.101***
Lb_portfolio 6,599 0.101 0.426 -4.974 0.999 - - 0.086***
Localbias 20,460 0.520 0.500 0 0 10,632 - -0.065***
Firm failure 20,460 0.363 0.481 0 1 7,418 -0.019*** 0.017
Campaign_days 20,460 70 39 7 128 - 0.007 -3.901***
Campaign_Innovestment 20,460 0.079 0.270 0 1 1,623 0.052*** -2.958***
Campaign_fundingratio 20,460 4.568 4.607 0.000 19.372 - -0.023*** -0.139***
Campaign_success 20,460 0.989 0.105 0 1 20,234 -0.022** -1,092***
Population_density 20,460 3,373 864 168 4,601 - 0.059*** -0.682***
Firm_valuation 20,460 1,763,050 854,350 420,000 10,000,000 - -0.113*** -0.122***
Industry_trading 20,460 0.198 0.398 0 1 4,041 -0.078*** -0.024***
Industry_transportation 20,460 0.022 0.148 0 1 456 0.024*** -0.063***
Industry_entertainment 20,460 0.059 0.235 0 1 1,201 0.028*** -0.061***
Industry_finance 20,460 0.057 0.231 0 1 1,158 -0.013+ 0.106***
Industry_IT 20,460 0.367 0.482 0 1 7,515 0.019** -0.063***
Industry_manufacturing 20,460 0.259 0.438 0 1 5,309 0.015** 0.137***
Industry_otherservice 20,460 0.011 0.104 0 1 223 0.016** 0.090***
Industry_techservice 20,460 0.027 0.163 0 1 557 0.036*** 0.456***
Firm_age 20,460 493 354 0 4,013 - -0.063*** -0.366***
Number_founder 20,460 2 1 1 6 - 0.013** -0.122***
Founder_startupexperience 20,460 0.716 0.451 0 1 14,659 0.056*** 0.064***
Firm_legalform_minimum 20,460 0.832 0.374 0 1 17,030 -0.004 0.051***
Filed_patents 20,460 0.028 0.166 0 1 580 -0.001 0.026***
Granted_patents 20,460 0.035 0.183 0 1 710 -0.029*** -0.348***
Total_trademarks 20,460 0.511 0.973 0 3 - -0.028*** -0.317***
BA_initial 20,460 0.560 0.991 0 4 - 0.034*** -0.417***
VC_initial 20,460 0.561 1.072 0 4 - -0.039*** -1.550***
Number_employees 20,460 5 6 1 26 - -0.142*** -0.101***
Funding_prev_succ_campaign 20,460 13,747 40,574 0 175,000 - 0.003 -11.776***
Businessplan_fleschscore 20,460 47 5 34 66 - -0.017** 0.170
Businessplan_pictures 20,460 17 6 1 46 - 0.034*** 0.444**
Businessplan_characters 20,460 26,250 11,076 7,867 118,010 - 0.041*** 24,583***
Exper_commodity 1,623 0.244 0.430 0 1 396 -0.055** -
Exper_deposits 1,623 0.430 0.495 0 1 698 -0.018 -
Exper_fixedincome 1,623 0.311 0.463 0 1 505 -0.036 -
Exper_fundscertif 1,623 0.419 0.494 0 1 680 -0.030 -
Exper_othercorporate 1,623 0.305 0.461 0 1 495 0.003 -
Exper_realestate 1,623 0.310 0.463 0 1 503 -0.016 -
Exper_stocks 1,623 0.463 0.499 0 1 751 -0.048+ -
Investor_averageinvestment 20,253 523 1,489 4 50,000 - 0.025*** 2.736***
Investor_bigcity 20,460 0.313 0.464 0 1 6,402 -0.035*** -0.110***
Investor_#investments 20,460 11 15 0 83 - -0.037*** -0.782***
Investor_familyfriends 20,460 0.230 0.421 0 1 4,711 0.041*** -0.003
Investor_female 18,594 0.130 0.336 0 1 2,416 -0.005 -
Investor_typo 18,837 0.005 0.073 0 1 101 0.005 -
Investor_portfolioamount 20,460 4,340 8,498 0 103,191 - -0.024*** 6.307***
Region_GDPperP 17,530 43,878 16,686 14,776 107,142 - -0.005 -2.211***
Investment_#earlier 20,460 28.519 53.351 0 375 - -0.060*** -2.449***
Investment_5k 20,460 0.022 0.146 0 1 446 0.020** 0.121***
Investment_amount 20,460 526 1,647 4 50,000 - 0.024*** 2.448***
Investment_first3days 20,460 0.367 0.482 0 1 7,511 -0.028*** -0.161***
Investment_evening 1,623 0.362 0.481 0 1 587 -0.068** -
Investment_night 1,623 0.076 0.265 0 1 123 0.000 -
Investment_weekend 20,460 0.147 0.354 0 1 3,009 -0.018** -0.159***

37
PANEL D: Summary statistics for Companisto and Innovestment Companisto Innovestment Difference in Means
N Mean SD Min. Max. Yes Corr. N Mean SD Min. Max. Yes Corr.
Lb_investment 18,837 0.004 0.533 -4.648 0.997 - - 1,623 0.106 0.453 -2.838 0.998 - - 0.101*** Lb_portfolio 6,167 0.095 0.420 -4.974 0.997 - - 432 0.181 0.489 -1.136 0.999 - - 0.086***
Localbias 18,837 0.525 0.499 0 1 9,885 - 1,623 0.460 0.499 0 1 747 - -0.065***
Firm failure 18,837 0.361 0,480 0 1 6,804 -0.025*** 1,623 0.378 0.485 0 1 614 0.060** 0.017
Campaign_days 18,837 73 39 7 128 - 0.022** 1,623 34 8 20 78 - 0.054** -3.901***
Campaign_fundingratio 18,837 4.803 4.685 0 19 - -0.01+ 1,623 1.844 2.196 0.013 10.671 - -0.047+ -2.958*** Campaign_success 18,837 1 0 1 1 18,837 - 1,623 0.861 0.346 0 1 1,397 -0.017 -0.139***
Population_density 18,837 3,460 765 866 4,601 - 0.104*** 1,623 2,367 1,229 168 4,601 - -0.084*** -1,092***
Firm_valuation 18,837 1,817,164 841,834 700,000 4,500,000 - -0.10*** 1,623 1,134,979 740,377 420,000 10,000,000 - -0.062** -0.682***
Industry_trading 18,837 0.207 0.405 0 1 3,903 -0.08*** 1,623 0.085 0.279 0 1 138 0.170*** -0.122***
Industry_transportation 18,837 0.024 0.154 0 1 456 0.028*** - - - - - - - -0.024*** Industry_entertainment 18,837 0.064 0.244 0 1 1,201 0.033*** - - - - - - - -0.063***
Industry_finance 18,837 0.061 0.240 0 1 1,158 -0.00 - - - - - - - -0.061***
Industry_IT 18,837 0.359 0.480 0 1 6,759 0.030*** 1,623 0.466 0.499 0 1 756 -0.176*** 0.106***
Industry_manufacturing 18,837 0.265 0.441 0 1 4,983 0.013+ 1,623 0.201 0.401 0 1 326 0.075** -0.063***
Industry_otherservice - - - - - - - 1,623 0.137 0.344 0 1 223 -0.009 0.137*** Industry_techservice 18,837 0.020 0.140 0 1 377 0.029*** 1,623 0.111 0.314 0 1 180 0.043+ 0.090***
Firm_age 18,837 489 345 0 1,383 - -0.07*** 1,623 535 443 0 4,013 - 0.034 0.456***
Number_founder 18,837 2 1 1 5 - 0.019** 1,623 2 1 1 6 - 0.015 -0.366***
Founder_startupexperience 18,837 0,796 0,403 0 1 14,989 0.079*** 1,623 0.673 0.469 0 1 1,093 -0.044+ -0.122***
Firm_legalform_minimum 18,837 0.827 0.378 0 1 15,582 -0.00 1,623 0.892 0.310 0 1 1,448 -0.007 0.064*** Filed_patents 18,837 0.024 0.154 0 1 457 0.001 1,623 0.076 0.265 0 1 123 -0.065** 0.051***
Granted_patents 18,837 0.033 0.178 0 1 614 -0.02*** 1,623 0.059 0.236 0 1 96 -0.056** 0.026***
Total_trademarks 18,837 0.539 1.000 0 3 1,743 -0.02*** 1,623 0.190 0.444 0 2 - 0.161*** -0.348***
BA_initial 18,837 0.585 1.015 0 4 - 0.046*** 1,623 0.267 0.564 0 2 - -0.143*** -0.317***
VC_initial 18,837 0.594 1.102 0 4 - -0.03*** 1,623 0.176 0.500 0 2 - -0.166*** -0.417*** Number_employees 18,837 5 6 1 22 - -0.14*** 1,623 4 4 1 26 - -0.113*** -1.550***
Number_prev_succ_campaign 18,837 0.132 0.338 0 1 - 0.021** 1,623 0.031 0.173 0 1 - -0.051** -0.101***
Funding_prev_succ_campaign 18,837 14,681 41,881 0 175,000 - 0.009 1,623 2,905 16,362 0 97,000 - -0.054** -11.776***
Businessplan_fleschscore 18,837 47 5 34 56 - -0.02*** 1,623 47 7 37 66 - 0.063** 0.170 Businessplan_pictures 18,837 17 5 4 32 - 0.034*** 1,623 17 10 1 46 - 0.035 0.444**
Businessplan_characters 18,837 24,299 5,029 9,324 33,212 - 0.016** 1,623 48,883 26,400 7,867 118,010 - 0.021 24,583***
Exper_commodity - - - - - - - 1,623 0.244 0.430 0 1 396 -0.055** -
Exper_deposits - - - - - - - 1,623 0.430 0.495 0 1 698 -0.018 -
Exper_fixedincome - - - - - - - 1,623 0.311 0.463 0 1 505 -0.036 - Exper_fundscertif - - - - - - - 1,623 0.419 0.494 0 1 680 -0.030 -
Exper_othercorporate - - - - - - - 1,623 0.305 0.461 0 1 495 0.003 -
Exper_realestate - - - - - - - 1,623 0.310 0.463 0 1 503 -0.016 -
Exper_stocks - - - - - - - 1,623 0.463 0.499 0 1 751 -0.048+ -
Investor_averageinvestment 18,837 332 751 4 25,000 - -0.00 1,416 3,068 4,153 500 50,000 - 0.026 2.736*** Investor_bigcity 18,837 0.322 0.467 0 1 6,059 -0.03*** 1,623 0.211 0.408 0 1 343 0.027 -0.110***
Investor_#investments 18,837 12 15 1 83 - -0.02*** 1,623 4.042 5.730 0 30 - -0.065** -0.782***
Investor_familyfriends 18,837 0.231 0.421 0 1 4,342 0.037*** 1,623 0.227 0.419 0 1 369 0.101*** -0.003
Investor_female 18,594 0.130 0.336 0 1 2,416 -0.00 - - - - - - - -
Investor_typo 18,837 0.005 0.073 0 1 101 0.005 - - - - - - - - Investor_portfolioamount 18,837 3,840 7,483 4 59,490 - -0.02*** 1,623 10,147 14,966 0 103,191 - -0.102*** 6.307***
Region_GDPperP 16,139 44,053 16,582 14,776 107,142 - -0.00 1,391 41,842 17,736 15,840 107,142 - -0.044+ -2.211***
Investment_#earlier 18,837 30.462 55.015 0 375 - -0.05*** 1,623 5.970 14.212 0 98 - -0.110*** -2.449***
Investment_5k 18,837 0.012 0.110 0 1 229 0.010 1,623 0.134 0.340 0 1 217 0.008 0.121***
Investment_amount 18,837 332 1,021 4 25,000 - 0.006 1,623 2,780 4,073 500 50,000 - -0.001 2.448***

38
Investment_first3days 18,837 0.380 0.485 0 1 7,156 -0.02*** 1,623 0.219 0.414 0 1 355 0.040 -0.161***
Investment_evening - - - - - - - 1,623 0.362 0.481 0 1 587 -0.068** - Investment_night - - - - - - - 1,623 0.076 0.265 0 1 123 0.000 -
Investment_weekend 18,837 0.160 0.366 0 1 3,009 -0.01+ 1,623 0 0 0 0 0 - -0.159***

39
Table 3. Local Bias.
Local bias for individual investments (Panel A) and investor portfolios (Panel B) in
percentages. The table categorizes the local bias according to portals and the location of the
investor. Furthermore, we calculate local biases by excluding family and friend investors. In
line with Agrawal et al. (2015), we define investors as family and friends if (1) they invest
in the focal start-up before investing in any other start-up, (2) their investment in the focal
start-up is their largest investment, and (3) the investor invests in no more than three other
start-ups. We report a one-sample, two-tailed t-test for the null hypothesis that local biases
are zero. ***, **, and + indicate statistical significance at the 1%, 5%, and 10% level.
Variables reported are defined in Appendix A.
PANEL A: Local bias individual investments
N Mean SD Min. 25th Median 75th Max.
By portal Companisto 18,837 0.4 53.3 -464.8 -13.1 -0.2 8.2 99.7
German investors 17,431 0.5 55.2 -464.8 -13.1 -0.2 9.2 99.7
Foreign investors 1,406 -0.6 18.4 -46.5 -12.5 -0.1 3.2 80.9
Innovestment 1,623 10.6*** 45.3 -283.8 -8.8 1.0 33.9 99.8
German investors 1,467 11.6*** 47.0 -283.8 -8.8 1.1 39.1 99.8
Foreign investors 156 1.0 22.0 -59.9 -8.4 -0.2 11.6 67.2
By country German investors 18,898 1.3*** 54.7 -464.8 -12.7 -0.1 10.8 99.8
Foreign investors 1,562 -0.5 18.8 -59.9 -12.4 -0.1 4.0 80.9
Without family and friends 15,749 0.0 54.8 -464.8 -13.4 -0.2 9.2 99.7
Companisto 14,495 -0.7 55.7 -464.8 -13.5 -0.2 7.4 99.7
Innovestment 1,254 8.1*** 42.1 -149.3 -8.3 0.7 27.9 99.7
Total 20,460 1.2** 52.8 -464.8 -12.6 -0.1 9.6 99.8
PANEL B: Local bias investor portfolio
N Mean SD Min. 25th Median 75th Max.
By portal Companisto 6,167 9.5*** 42.0 -497.4 -8.5 -2.5 18.4 99.7
German investors 5,559 10.7*** 43.8 -497.4 -8.4 -2.4 21.6 99.7
Foreign investors 608 -1.4** 15.8 -38.3 -9.5 -2.5 4.3 68.5
Innovestment 432 18.1*** 48.9 -113.6 -24.4 11.1 50.5 99.9
German investors 389 19.5*** 50.6 -113.6 -25.3 15.6 62.3 99.9
Foreign investors 43 4.8 25.8 -32.4 -14.3 0.3 29.8 78.8
By country German investors 5,948 11.3*** 44.3 -497.4 -8.6 -2.2 24.9 99.9
Foreign investors 651 -1.0 16.7 -38.3 -9.9 -2.3 5.5 78.8
Without family and friends 2,126 5.2*** 36.6 -497.4 -7.8 -1.5 11.9 99.3
Companisto 1,938 4.6*** 36.3 -497.4 -7.5 -1.8 10.6 99.3
Innovestment 188 10.8*** 39.3 -87.3 -21.3 6.2 31.0 99.3
Total 6,599 10.1*** 42.6 -497.4 -8.7 -2.2 21.1 99.9

40
Table 4. Regression Results.
The table shows the results of regressions on individual investment decisions. The dependent
variable is the individual investment local bias as defined in section 4.2.1. Panel A displays
the results of our baseline regressions for the sample of 20,460 investments. Columns (1) and
(2) show the results for the ordinary least squares regressions without adding additional firm-
specific control variables to the model. Columns (3) and (4) display the results of the ordinary
least squares regressions with additional firm-specific control variables. Columns (2) and (4)
present the results for the sample in which we winsorize the data at the bottom 10%. All
regressions include dummy variables to control for firm fixed effects at the campaign level.
Next to the variables reported in Panels B–D, every regression also includes all variables
from Panel A column (1). Additional controls indicate that the firm-specific control variables
from Panel A column (3) are included. Panel B reports the effect of different investor types.
Panel C considers the experience of the investors. In Panel D, we test whether herding and
timing have an effect on the local bias. Standard errors are clustered by investor and are
reported in parentheses. ***, **, and + indicate statistical significance at the 1%, 5%, and
10% level. Variables reported are defined in Appendix A.
Panel A: Baseline regressions
(1) (2) (3) (4)
Winsorized Winsorized
Campaign_Innovestment 0.490*** 0.392*** 0.598*** 0.538***
(0.087) (0.078) (0.085) (0.081)
Campaign_fundingratio 0.000 -0.005*** 0.000 -0.005***
(0.001) (0.001) (0.001) (0.001)
Campaign_success 0.232 0.207 -0.224 -0.225
(0.178) (0.166) (0.212) (0.202)
Campaign_days -0.064*** -0.052*** -0.058*** -0.045***
(0.014) (0.013) (0.009) (0.008)
Firm_valuation 0.093*** 0.092*** 0.081*** 0.079***
(0.013) (0.013) (0.012) (0.011)
Population_density -0.258*** -0.232*** -0.231*** -0.202***
(0.045) (0.042) (0.039) (0.037)
Industry_manufacturing -0.678*** -0.532*** 0.001 -0.619***
(0.048) (0.043) (0.224) (0.059)
Industry_trading -0.378*** -0.250+ 0.390+ -0.339+
(0.145) (0.134) (0.217) (0.186)
Industry_IT -0.329*** -0.255** 0.649*** -0.097+
(0.114) (0.106) (0.220) (0.055)
Industry_finance -0.074 -0.041 0.948*** 0.166**
(0.071) (0.062) (0.248) (0.082)
Industry_techservice -1.186*** -0.806*** -1.056*** -1.428***
(0.116) (0.093) (0.109) (0.214)
Industry_otherservice -0.297** -0.241+ -0.765***
(0.144) (0.134) (0.228)
Industry_entertainment 0.540*** 0.452*** 0.744*** -0.019
(0.152) (0.135) (0.224) (0.035)

41
Funding_prev_succ_campaign 0.005*** 0.004***
(0.001) (0.001)
Businessplan_fleschscore 0.021*** 0.015**
(0.006) (0.006)
Businessplan_pictures 0.007** 0.006+
(0.003) (0.003)
Businessplan_characters -0.007*** -0.006***
(0.001) (0.001)
Number_founder 0.057 0.058
(0.041) (0.040)
Founder_startupexperience -0.080 -0.088
(0.075) (0.069)
Number_employees 0.006 0.003
(0.005) (0.004)
Filed_patents -0.047 -0.162***
(0.055) (0.050)
Granted_patents 0.384*** 0.386***
(0.066) (0.055)
Total_trademarks -0.035 0.007
(0.041) (0.038)
Firm_legalform_minimum 0.610*** 0.520***
(0.097) (0.085)
BA_initial -0.001 0.009
(0.014) (0.014)
VC_initial 0.010 0.008
(0.022) (0.019)
Intercept 0.851*** 0.769*** -1.123*** -0.099
(0.146) (0.131) (0.317) (0.402)
Firm dummies Yes Yes Yes Yes
Adjusted R2 0.061 0.077 0.061 0.077
Observations 20,460 20,460 20,460 20,460

42
PANEL B: Family, friends, and angel-like investors
(1) (2) (3) (4) (5) (6) (7) (8)
Investor_familyfriends 0.063*** 0.063*** 0.063*** 0.063***
(0.008) (0.008) (0.008) (0.008)
Investment_first3days -0.006 -0.006 -0.006 -0.006
(0.009) (0.010) (0.010) (0.010)
Investment_5k 0.051** 0.009 0.051** 0.009
(0.026) (0.027) (0.026) (0.027)
Investment_5k x _first3days 0.142*** 0.135*** 0.142*** 0.135***
(0.045) (0.048) (0.045) (0.048)
Firm dummies Yes Yes Yes Yes Yes Yes Yes Yes
Additional controls No No No No Yes Yes Yes Yes
Adjusted R2 0.063 0.061 0.061 0.064 0.063 0.061 0.061 0.064
Observations 20,460 20,460 20,460 20,460 20,460 20,460 20,460 20,460

43
PANEL C: Investor characteristics
(1) (2) (3) (4) (5) (6)
Innovestment Companisto Innovestment Companisto
Investor_#investments -0.001 -0.001
(0.005) (0.005)
Investor_portfolioamount -0.003*** -0.003***
(0.001) (0.001)
Investor_averageinvestment 0.010+ 0.010+
(0.006) (0.006)
Investment_amount 0.002 0.002
(0.006) (0.006)
Region_GDPperP -0.001*** -0.001***
(0.000) (0.000)
Investor_bigcity -0.034*** -0.034***
(0.011) (0.011)
Exper_deposits 0.066 0.066
(0.062) (0.062)
Exper_stocks -0.102 -0.102
(0.069) (0.069)
Exper_fundscertif -0.006 -0.006
(0.072) (0.072)
Exper_fixedincome -0.034 -0.034
(0.051) (0.051)
Exper_commodity -0.044 -0.044
(0.044) (0.044)
Exper_realestate 0.068+ 0.068+
(0.041) (0.041)
Exper_othercorporate 0.043 0.043
(0.034) (0.034)
Investor_female 0.000 0.000
(0.013) (0.013)
Investor_typo 0.043 0.042
(0.038) (0.038)
Firm dummies Yes Yes Yes Yes Yes Yes
Additional controls No No No Yes Yes Yes
Adjusted R2 0.068 0.219 0.050 0.068 0.219 0.050
Observations 17,362 1,623 18,594 17,362 1,623 18,594

44
PANEL D: Herding and timing
(1) (2) (3) (4) (5) (6) (7) (8) (9) (10)
Innovestment
Investment_#earlier -0.002 -0.002
(0.001) (0.001)
Investment_#earlier5k 0.008 0.004
(0.034) (0.034)
Investment_weekend -0.022** -0.024** -0.022** -0.028**
(0.010) (0.010) (0.010) (0.011)
Investment_first3days -0.006 -0.013
(0.009) (0.010)
Investment_weekend x _first3days 0.036
(0.023)
Investment_evening -0.020 -0.021
(0.022) (0.023)
Investment_night 0.001 -0.007
(0.034) (0.035)
Firm dummies Yes Yes Yes Yes Yes Yes Yes Yes Yes Yes
Additional controls No No No No No No No No No No
Adjusted R2 0.061 0.061 0.061 0.061 0.061 0.061 0.061 0.214 0.214 0.214
Observations 20,460 20,460 20,460 20,460 20,460 20,460 20,460 1,623 1,623 1,623

45
PANEL D: continued
(11) (12) (13) (14) (15) (16) (17) (18) (19) (20)
Innovestment
Investment_#earlier -0.002 -0.002
(0.001) (0.001)
Investment_#earlier5k 0.008 0.004
(0.034) (0.034)
Investment_weekend -0.022** -0.024** -0.022** -0.028**
(0.010) (0.010) (0.010) (0.011)
Investment_first3days -0.006 -0.012
(0.010) (0.010)
Investment_weekend x _first3days 0.036
(0.023)
Investment_evening -0.020 -0.021
(0.022) (0.023)
Investment_night 0.001 -0.007
(0.034) (0.035)
Firm dummies Yes Yes Yes Yes Yes Yes Yes Yes Yes Yes
Additional controls Yes Yes Yes Yes Yes Yes Yes Yes Yes Yes
Adjusted R2 0.061 0.061 0.061 0.061 0.061 0.061 0.061 0.214 0.214 0.214
Observations 20,460 20,460 20,460 20,460 20,460 20,460 20,460 1,623 1,623 1,623

46
Table 5. Local Bias and Firm Failure.
The table shows the percentage of failed firms according to the local bias for individual
investments. The local bias for individual investments is defined in section 4.2.1. Positive
indicates that the investment was regionally closer than the respective benchmark portfolio;
negative indicates that it was farther away than the respective benchmark portfolio. We report
a two-sample t-test for testing the equality of the means. ***, **, and + indicate statistical
significance at the 1%, 5%, and 10% level.
Individual investment
N Mean SD t-Stat.
By local bias
Positive (>0) 9,828 37.7 48.5 4.157*** Negative (≤0) 10,632 34.9 47.7
By portal
Companisto
By local bias
Positive (>0) 8,952 38.0 48.5 5.091*** Negative (≤0) 9,885 34.4 47.5
Innovestment
By local bias
Positive (>0) 876 34.8 47.7 -2.716** Negative (≤0) 747 41.4 49.3

47
Table 6. Firm Failure Regression Results.
The table shows the results of regressions on firm failure. Variable definitions are reported
in Appendix A. The dependent variable in columns (1) and (2) is a dummy variable for
whether a firm failure occurred or not and in columns (3) and (4) the duration until firm
failure. Columns (1) and (2) report the results of a probit model. Coefficients reported are
average marginal effects. Columns (3) and (4) report the results of a Cox proportional hazard
model. Coefficients reported are hazard ratios. The variables Industry_finance,
Industry_techservice, Industry_otherservice, Industry_entertainment, filed_patents, and
granted_patents are not included because they predict firm failure perfectly. Standard errors
are clustered by investor and are reported in parentheses. ***, **, and + indicate statistical
significance at the 1%, 5%, and 10% level.
(1) (2) (3) (4)
Probit Cox
Localbias 0.001 0.989
(0.006) (0.027)
Lb_investment -0.041*** 0.708***
(0.007) (0.027)
Campaign_Innovestment -0.077*** -0.074*** 0.493*** 0.520***
(0.023) (0.022) (0.074) (0.074)
Campaign_fundingratio -0.033*** -0.033*** 0.845*** 0.844***
(0.001) (0.001) (0.003) (0.003)
Campaign_success -0.021 -0.024 0.739 0.694
(0.044) (0.044) (0.228) (0.207)
Campaign_days -0.028*** -0.028*** 0.924*** 0.923***
(0.001) (0.001) (0.005) (0.005)
Firm_valuation 0.066*** 0.064*** 1.370*** 1.382***
(0.006) (0.006) (0.050) (0.049)
Population_density -0.005 -0.003 1.133** 1.157***
(0.005) (0.005) (0.067) (0.064)
Industry_trading 0.270*** 0.269*** 6.677*** 6.995***
(0.013) (0.013) (0.468) (0.479)
Funding_prev_succ_campaign 0.000 0.000 0.989*** 0.988***
(0.000) (0.000) (0.000) (0.000)
Businessplan_fleschscore -0.007*** -0.007*** 0.991+ 0.988***
(0.001) (0.001) (0.005) (0.005)
Businessplan_pictures 0.019*** 0.019*** 1.098*** 1.103***
(0.001) (0.001) (0.008) (0.008)
Businessplan_characters 0.002*** 0.002*** 1.014*** 1.015***
(0.000) (0.000) (0.003) (0.003)
Number_founder -0.007** -0.006** 1.042** 1.053***
(0.003) (0.003) (0.018) (0.018)
Founder_startupexperience 0.302*** 0.302*** 5.512*** 5.779***
(0.011) (0.011) (0.454) (0.473)

48
Number_employees -0.043*** -0.043*** 0.866*** 0.856***
(0.001) (0.001) (0.005) (0.005)
Total_trademarks 0.056*** 0.055*** 1.129*** 1.114**
(0.005) (0.005) (0.050) (0.047)
Firm_legalform_minimum -0.038*** -0.035*** 0.880*** 0.927+
(0.009) (0.009) (0.040) (0.042)
BA_initial -0.089*** -0.088*** 0.840*** 0.846***
(0.005) (0.005) (0.021) (0.021)
VC_initial 0.107*** 0.106*** 1.139*** 1.122***
(0.004) (0.004) (0.022) (0.022)
Days at risk - - 53,803,660 53,803,660
Number of failures - - 7,418 7,418
Pseudo-R2 0.355 0.357 0.065 0.066
Log-likelihood - - -65250.808 -65169.510
P(Y=1) 36.3% 36.3% 36.3% 36.3%
Observations 20,460 20,460 20,460 20,460

49
Appendix A. List of Variables.
Variable Description Source
Local bias
Lb_investment The local bias calculated for the individual
investment decision.
Calculation by the
authors
Lb_portfolio The local bias calculated for the investor
portfolio.
Calculation by the
authors
Localbias Dummy variable equal to 1 if the local
bias for the individual investment decision
is positive and 0 otherwise.
Calculation by the
authors
Portal and campaign characteristics
Campaign_days Number of days the firm accepted
investments on the respective portal in
#/10.
Companisto and
Innovestment
Campaign_Innovestment Dummy variable equal to 1 if the
campaign was run on Innovestment and 0
otherwise.
Companisto and
Innovestment
Campaign_fundingratio The ratio of the total funding amount
reached to the funding goal. In the case of
individual investments, the current ratio at
the time of investment.
Companisto,
Innovestment, and
calculation by the
authors
Campaign_success Dummy variable equal to 1 if the issuer
reached or exceeded the funding goal by
the end of the funding period and 0
otherwise.
Companisto and
Innovestment
Funding_prev_succ_campaign Total amount of capital raised during the
previous equity crowdfunding campaign in
1,000 EUR.
Companisto and
Innovestment
Filed_patents Number of filed patents by the start-up. BvD Orbis, PATSTAT
Granted_patents Number of granted patents owned by the
start-up.
BvD Orbis, PATSTAT
Total_trademarks Number of total trademarks owned by the
start-up.
BvD Orbis
Number_founder Total number of founders. Companisto and
Innovestment Founder_startupexperience Dummy variable equal to 1 if at least one
of the founders had entrepreneurial
experience before founding this start-up
and 0 otherwise.
Companisto and
Innovestment, start-up
website, LinkedIn, Xing
Number_employees Number of employees at the time of the
equity crowdfunding campaign.
Companisto and
Innovestment
Businessplan_fleschscore The text readability of the business plan;
calculated with the Flesch Readability
Index; 0–30 "very difficult language," 31–50 "difficult," 51–60 "fairly difficult," 51–
70 "standard," 71–80 "fairly easy," 81–90
"easy," and 91–100 "very easy language."
Companisto and
Innovestment;
calculation by the authors

50
Variable Description Source
Businessplan_pictures Total number of pictures that appeared in
the business plan.
Companisto and
Innovestment;
calculation by the
authors
Businessplan_characters Total number of characters that appeared
in the business plan in #/1000.
Companisto and
Innovestment;
calculation by the
authors
Firm_legalform_minimum Dummy variable equal to 1 if the start-up
uses a legal form that requires legal capital
higher than 1 EUR (GmbH and AG) and 0
otherwise.
Contracts on
Companisto and
Innovestment,
www.unternehmens-
register.de
BA_initial Total number of business angel investors
at the time of investment.
BvD Orbis, Zephyr,
Thomson Reuters
Eikon, Crunchbase,
Companisto, Innovestment, start-up
websites, venture
capital websites, press
releases
VC_initial Total number of venture capital investors
at the time of investment.
BvD Orbis, Zephyr,
Thomson Reuters
Eikon, Crunchbase,
Companisto,
Innovestment, start-up
websites, venture
capital websites, press
releases
Firm characteristics
Firm_valuation The pre-money valuation of the firm in
1,000,000 EUR.
Companisto and
Innovestment
Industry_trading Dummy variable equal to 1 if the industry
of the firm equals trading according to
NACE Rev. 2 and 0 otherwise.
Classification by the
authors
Industry_transportation Dummy variable equal to 1 if the industry
of the firm equals transportation and
storage according to NACE Rev. 2 and 0
otherwise.
Classification by the
authors
Industry_entertainment Dummy variable equal to 1 if the industry
of the firm equals art, entertainment, or
recreation according to NACE Rev. 2 and
0 otherwise.
Classification by the
authors
Industry_finance Dummy variable equal to 1 if the industry
of the firm equals financial and insurance
activities according to NACE Rev. 2 and 0
otherwise.
Classification by the
authors

51
Variable Description Source
Industry_IT Dummy variable equal to 1 if the industry
of the firm equals information technology according to NACE Rev. 2 and 0
otherwise.
Classification by the
authors
Industry_finance Dummy variable equal to 1 if the industry
of the firm equals financial and insurance activities according to NACE Rev. 2 and 0
otherwise.
Classification by the
authors
Industry_IT Dummy variable equal to 1 if the industry
of the firm equals information technology
according to NACE Rev. 2 and 0
otherwise.
Classification by the
authors
Industry_manufacturing Dummy variable equal to 1 if the industry
of the firm equals manufacturing
according to NACE Rev. 2 and 0
otherwise.
Classification by the
authors
Industry_otherservice Dummy variable equal to 1 if the industry
of the firm equals other services according
to NACE Rev. 2 and 0 otherwise.
Classification by the
authors
Industry_techservice Dummy variable equal to 1 if the industry
of the firm equals technical services
according to NACE Rev. 2 and 0
otherwise.
Classification by the
authors
Firm failure Dummy variable equal to 1 if the start-up
went into insolvency, was liquidated, or
was dissolved and 0 otherwise.
BvD Orbis,
Unternehmensregister
Investor characteristics
Exper_commodity Dummy variable equal to 1 if the investor
indicated having investment experience in
commodities and 0 otherwise.
Innovestment
Exper_deposits Dummy variable equal to 1 if the investor
indicated having investment experience in
deposits and/or overnight loans and 0
otherwise.
Innovestment
Exper_fixedincome Dummy variable equal to 1 if the investor
indicated having investment experience in
fixed income products and 0 otherwise.
Innovestment
Exper_fundscertif Dummy variable equal to 1 if the investor
indicated having investment experience in
funds and/or certificates and 0 otherwise.
Innovestment
Exper_othercorporate Dummy variable equal to 1 if the investor
indicated having experience with other
asset classes that enable investment in a
firm and 0 otherwise.
Innovestment
Exper_realestate Dummy variable equal to 1 if the investor
indicated having investment experience in
real estate and 0 otherwise.
Innovestment

52
Variable Description Source
Exper_stocks Dummy variable equal to 1 if the investor
indicated having investment experience in
corporate stocks and 0 otherwise.
Innovestment
Investor_averageinvestment Average investment of the investor in 1,000
EUR.
Companisto,
Innovestment, and
calculation by the
authors
Investor_bigcity Dummy variable equal to 1 if the investor
reported living in city with more than one
million inhabitants and 0 otherwise.
Companisto,
Innovestment, and
classification by the
authors
Investor_#investments Number of investments made by the investor
from the start of his or her crowdinvesting
activities.
Companisto,
Innovestment, and
calculation by the
authors
Investor_familyfriends Dummy variable equal to 1 if the investor
holds the three criteria according to Agrawal
et al. (2015) and 0 otherwise.
Classification by the
authors
Investor_female Dummy variable equal to 1 if the stated
name of the investor indicates a female
investor and 0 otherwise.
Companisto and
classification by the
authors
Investor_typo Dummy variable equal to 1 if the investor
misspelled his or her location of origin and 0
otherwise.
Companisto and
classification by the
authors
Investor_portfolioamount The sum of the successful portfolio
investments an investor has undertaken since
its first investment in the portal in 1,000
EUR.
Companisto,
Innovestment, and
calculation by the
authors
Region_GDPperP Is the gross domestic product per person in
the county the investor reportedly lives or the
firm is located in measured in 1,000 EUR.
Statistical offices of the
federal and state
governments
Population_density Measures the population per unit area where
the start-up firm is located in #/1000.
Federal Statistical
Office of Germany
Investment characteristics
Investment_#earlier Number of investments earlier in the day at
the same campaign in #/10.
Calculation by the
authors
Investment_#earlier5k Number of investments, with investment
amount of 5,000 EUR or higher, earlier in
the day at the same campaign in #/10.
Calculation by the
authors
Investment_5k Dummy variable equal to 1 if the investment
amount was 5,000 EUR or higher and 0
otherwise.
Companisto,
Innovestment, and
classification by the
authors
Investment_amount Is the amount of an individual investment in
1,000 EUR.
Companisto and
Innovestment
Investment_first3days Dummy variable equal to 1 if the investment
took place in the first three days of the
campaign.
Calculation by the
authors

53
Variable Description Source
Investment_evening Dummy variable equal to 1 if the investment
took place between 5 P.M. and 9:59 P.M. and
0 otherwise.
Innovestment and
classification by the
authors
Investment_night Dummy variable equal to 1 if the investment
took place between 10 P.M. and 6:59 A.M.
and 0 otherwise.
Innovestment and
classification by the
authors
Investment_weekend Dummy variable equal to 1 if the investment
took place on a Saturday or Sunday (Central
European Time) and 0 otherwise.
Companisto,
Innovestment, and
classification by the
authors

54
Web Appendix
Figure W1. Number of Venture Capital Investments.
Heat map of Germany and neighbor countries showing the location of venture capital
investors (green areas). The venture capital sample covers 1,221 investments between
November 6, 2011, and August 28, 2014. The green dots indicate locations of firms into
which venture capitalists invested.

55
Figure W2. Number of Equity Crowdfunding Investments.
Heat map of Germany and neighbor countries showing the number of equity crowdfunding
investments (blue areas). The sample covers 20,640 investment decisions between
November 6, 2011, and August 28, 2014. Figure A shows the total number of investments
decisions. Figure B shows the investment decisions that took place on the portal Companisto
(N=18,837), and Figure C presents the location of investors that invested on Innovestment
(N=1,623). The red dots indicate firm locations.
Figure A: Total number of investments
Figure B: Number of investments on Companisto
Figure C: Number of investments on Innovestment

56
Figure W3. Investment Amounts in Equity Crowdfunding.
Heat map of Germany and neighbor countries showing investment amounts (blue areas). The
sample covers 20,640 investment amounts between November 6, 2011, and August 28, 2014.
Figure A presents the total number of investments amounts (N=10,762,742 EUR). Figure B
shows the investment amounts on Companisto (N=6,250,590 EUR), and Figure C presents
the location of investment amounts for Innovestment (N=4,512,152 EUR). The red dots
indicate firm locations.
Figure A: Total investment amounts
Figure B: Investment amounts on Companisto
Figure C: Investment amounts on Innovestment

57
Table W1. Local Bias for Investor Sample Providing Exact Location.
Local bias for individual investments (Panel A) and investor portfolios (Panel B) in percentages. We
exclude investors who did not provide their exact location. The table categorizes the local bias
according to portals and the location of the investor. Furthermore, we calculate local biases by
excluding family and friend investors. In line with Agrawal et al. (2015), we define investors as family
and friends if (1) they invest in the focal start-up before investing in any other start-up, (2) their
investment in the focal start-up is their largest investment, and (3) the investor invests in no more
than three other start-ups. We report a one-sample, two-tailed t-test for the null hypothesis that local
biases are zero. ***, **, and + indicate statistical significance at the 1%, 5%, and 10% level. Variables
reported are defined in Appendix A.
PANEL A: Local bias individual investments
N Mean SD Min. 25th Median 75th Max.
By portal Companisto 12,202 1.2** 62.7 -464.8 -7.0 0.1 12.3 99.7
German investors 11,544 1.3** 64.4 -464.8 -7.2 0.1 15.6 99.7
Foreign investors 658 -0.6 15.1 -40.1 -3.4 -0.1 2.6 80.9
Innovestment 1,623 10.6*** 45.3 -283.8 -8.8 1.0 33.9 99.8
German investors 1,467 11.6*** 47.0 -283.8 -8.8 1.1 39.1 99.8
Foreign investors 156 1.0 22.0 -59.9 -8.4 -0.2 11.6 67.2
By country German investors 13,011 2.4*** 62.7 -464.8 -7.5 0.2 19.0 99.8
Foreign investors 814 -0.3 16.6 -59.9 -3.5 -0.1 4.4 80.9
Without family and friends 10,107 0.7 64.8 -464.8 -8.4 0.1 16.5 99.7
Companisto 8,853 -0.4 67.4 -464.8 -8.4 0.1 13.6 99.7
Innovestment 1,254 8.1*** 42.1 -149.3 -8.3 0.7 27.9 99.7
Total 13,825 2.3*** 61.0 -464.8 -7.3 0.1 17.1 99.8
PANEL B: Local bias investor portfolio
N Mean SD Min. 25th Median 75th Max.
By portal
Companisto 4,513 13.0*** 46.5 -497.4 -7.6 -1.8 26.9 99.7
German investors 4,193 14.1*** 47.9 -497.4 -7.6 -1.7 32.8 99.7
Foreign investors 320 -1.1 15.7 -37.7 -8.0 -3.1 5.6 68.5
Innovestment 432 18.1*** 48.9 -113.6 -24.4 11.1 50.5 99.9
German investors 389 19.5*** 50.6 -113.6 -25.3 15.6 62.3 99.9
Foreign investors 43 4.8 25.8 -32.4 -14.3 0.3 29.8 78.8
By country
German investors 4,582 14.6*** 48.1 -497.4 -7.8 -1.4 36.0 99.9
Foreign investors 363 -0.4 17.3 -37.7 -8.5 -2.7 6.1 78.8
Without family and friends 1,436 8.0*** 42.5 -497.4 -7.0 -0.9 18.4 99.3
Companisto 1,248 7.6*** 43.0 -497.4 -6.8 -1.2 15.2 99.3
Innovestment 188 10.8*** 39.3 -87.3 -21.3 6.2 31.0 99.3
Total 4,945 13.5*** 46.7 -497.4 -7.8 -1.5 30.5 99.9

58
Table W2. Regression Results for Investor Sample Providing Exact Location.
The table shows the results of regressions on individual investment decisions. The dependent
variable is the individual investment local bias as defined in section 4.2.1. Panel A displays
the results of our baseline regressions for the sample of 13,825 investments. Columns (1) and
(2) show the results for the ordinary least squares regressions without adding additional firm-
specific control variables to the model. Columns (3) and (4) display the results of the ordinary
least squares regressions with additional firm-specific control variables. Columns (2) and (4)
present the results for the sample in which we winsorize the data at the bottom 10%. All
regressions include dummy variables to control for firm fixed effects at the campaign level.
Next to the variables reported in Panels B–D, every regression also includes all variables
from Panel A column (1). Additional controls indicate that the firm-specific control variables
from Panel A columns (3) and (4) are included. Panel B reports the effect of different investor
types. Panel C considers the experience of the investors. In Panel D, we test whether herding
and timing have an effect on the local bias. Standard errors are clustered by investor and are
reported in parentheses. ***, **, and + indicate statistical significance at the 1%, 5%, and
10% level. Variables reported are defined in Appendix A.
Panel A: Baseline regressions
(1) (2) (3) (4)
Winsorized Winsorized
Campaign_Innovestment -0.428*** 1.171*** -0.131 -0.147+
(0.086) (0.343) (0.093) (0.087)
Campaign_fundingratio 0.008** -0.009*** 0.008** -0.009***
(0.004) (0.002) (0.004) (0.002)
Campaign_success 0.565*** 0.567*** 0.308+ 0.093
(0.168) (0.168) (0.183) (0.179)
Campaign_days -0.014*** -0.009*** 0.044*** 0.051***
(0.002) (0.002) (0.006) (0.005)
Firm_valuation 0.068*** 0.068*** 0.001 0.024+
(0.007) (0.007) (0.014) (0.013)
Population_density -0.115** -0.115** -0.203*** -0.207***
(0.058) (0.058) (0.038) (0.035)
Industry_manufacturing 1.128*** -0.504*** 0.432*** 0.375***
(0.352) (0.035) (0.076) (0.075)
Industry_trading 0.770*** -0.860** 1.612*** 1.328***
(0.185) (0.341) (0.230) (0.216)
Industry_IT 0.693*** -0.938*** 0.795*** 0.684***
(0.062) (0.354) (0.088) (0.083)
Industry_finance 0.075*** 0.050*** -0.520*** -0.411***
(0.017) (0.016) (0.090) (0.087)
Industry_techservice 0.178 -1.235*** -1.226*** 0.916***
(0.180) (0.340) (0.196) (0.132)
Industry_otherservice 0.908*** -0.713** 0.421** 0.157
(0.174) (0.321) (0.194) (0.191)
Industry_entertainment 0.028+ 0.027+ 0.363*** 0.319***
(0.016) (0.016) (0.052) (0.050)

59
Funding_prev_succ_campaign -0.003*** -0.003***
(0.001) (0.001)
Businessplan_fleschscore 0.025*** 0.018***
(0.006) (0.005)
Businessplan_pictures -0.033*** -0.028***
(0.005) (0.005)
Businessplan_characters -0.006*** -0.006***
(0.001) (0.001)
Number_founder -0.321*** -0.244***
(0.044) (0.043)
Founder_startupexperience 0.037 -0.066
(0.075) (0.073)
Number_employees -0.026*** -0.025***
(0.005) (0.005)
Filed_patents 0.402*** 0.073
(0.064) (0.059)
Granted_patents -0.633*** -0.179***
(0.077) (0.065)
Total_trademarks -0.334*** -0.241***
(0.031) (0.029)
Firm_legalform_minimum 0.809*** 0.705***
(0.121) (0.108)
BA_initial -0.009 0.009
(0.016) (0.015)
VC_initial 0.010 0.022
(0.027) (0.027)
Intercept -0.086 -0.072 -0.408 0.039
(0.215) (0.216) (0.409) (0.391)
Firm dummies Yes Yes Yes Yes
Adjusted R2 0.154 0.204 0.154 0.204
Observations 13,825 13,825 13,825 13,825

60
PANEL B: Family, friends, and angel-like investors
(1) (2) (3) (4) (5) (6) (7) (8)
Investor_familyfriends 0.094*** 0.093*** 0.094*** 0.093***
(0.012) (0.012) (0.012) (0.012)
Investment_first3days 0.018 0.018 0.019 0.019
(0.013) (0.013) (0.013) (0.013)
Investment_5k 0.071** 0.031 0.071** 0.031
(0.031) (0.034) (0.031) (0.034)
Investment_5k x _first3days 0.143*** 0.103+ 0.143*** 0.103+
(0.046) (0.053) (0.046) (0.053)
Firm dummies Yes Yes Yes Yes Yes Yes Yes Yes
Additional controls No No No No Yes Yes Yes Yes
Adjusted R2 0.158 0.154 0.154 0.159 0.158 0.154 0.154 0.159
Observations 13,825 13,825 13,825 13,825 13,825 13,825 13,825 13,825

61
PANEL C: Investor characteristics
(1) (2) (3) (4) (5) (6)
Innovestment Companisto Innovestment Companisto
Investor_#investments -0.003 -0.003
(0.005) (0.005)
Investor_portfolioamount -0.003*** -0.003***
(0.001) (0.001)
Investor_averageinvestment 0.009 0.009
(0.007) (0.007)
Investment_amount 0.002 0.002
(0.009) (0.009)
Region_GDPperP 0.002*** 0.002***
(0.000) (0.000)
Investor_bigcity -0.127*** -0.127***
(0.016) (0.016)
Exper_deposits 0.066 0.066
(0.062) (0.062)
Exper_stocks -0.102 -0.102
(0.069) (0.069)
Exper_fundscertif -0.006 -0.006
(0.072) (0.072)
Exper_fixedincome -0.034 -0.034
(0.051) (0.051)
Exper_commodity -0.044 -0.044
(0.044) (0.044)
Exper_realestate 0.068+ 0.068+
(0.041) (0.041)
Exper_othercorporate 0.043 0.043
(0.034) (0.034)
Investor_female -0.014 -0.014
(0.018) (0.018)
Investor_typo 0.056 0.056
(0.048) (0.048)
Firm dummies Yes Yes Yes Yes Yes Yes
Additional controls No No No Yes Yes Yes
Adjusted R2 0.177 0.219 0.149 0.177 0.219 0.149
Observations 12,204 1,623 12,030 12,204 1,623 12,030

62
PANEL D: Herding and timing
(1) (2) (3) (4) (5) (6) (7) (8) (9) (10)
Innovestment
Investment_#earlier -0.002 -0.003
(0.003) (0.003)
Investment_#earlier5k 0.008 0.005
(0.051) (0.050)
Investment_weekend -0.022 -0.025+ -0.022 -0.028+
(0.014) (0.014) (0.014) (0.016)
Investment_first3days 0.018 0.010
(0.013) (0.013)
Investment_weekend x _first3days 0.053+
(0.029)
Investment_evening -0.020 -0.021
(0.022) (0.023)
Investment_night 0.001 -0.007
(0.034) (0.035)
Firm dummies Yes Yes Yes Yes Yes Yes Yes Yes Yes Yes
Additional controls No No No No No No No No No No
Adjusted R2 0.154 0.154 0.154 0.154 0.154 0.154 0.154 0.214 0.214 0.214
Observations 13,825 13,825 13,825 13,825 13,825 13,825 13,825 1,623 1,623 1,623

63
Panel D: continued
(11) (12) (13) (14) (15) (16) (17) (18) (19) (20)
Innovestment
Investment_#earlier -0.002 -0.003
(0.003) (0.003)
Investment_#earlier5k 0.008 0.005
(0.051) (0.050)
Investment_weekend -0.023+ -0.025+ -0.023+ -0.029+
(0.014) (0.014) (0.014) (0.016)
Investment_first3days 0.019 0.011
(0.013) (0.014)
Investment_weekend x _first3days 0.053+
(0.029)
Investment_evening -0.020 -0.021
(0.022) (0.023)
Investment_night 0.001 -0.007
(0.034) (0.035)
Firm dummies Yes Yes Yes Yes Yes Yes Yes Yes Yes Yes
Additional controls Yes Yes Yes Yes Yes Yes Yes Yes Yes Yes
Adjusted R2 0.154 0.154 0.154 0.154 0.154 0.154 0.154 0.214 0.214 0.214
Observations 13,825 13,825 13,825 13,825 13,825 13,825 13,825 1,623 1,623 1,623

64
Table W3. Local Bias and Firm Failure for Investor Sample Providing Exact Location.
The table shows the percentage of failed firms according to the local bias for individual
investments. The local bias for individual investments is defined in section 4.2.1. Positive
indicates that the investment was regionally closer than the respective benchmark portfolio;
negative indicates that it was farther away than the respective benchmark portfolio. We report
a two-sample t-test for testing the equality of the means. ***, **, and + indicate statistical
significance at the 1%, 5%, and 10% level.
Individual investment
N Mean SD t-Stat.
By local bias
Positive (>0) 7,121 39.3 48.8 -551.5*** Negative (≤0) 6,704 43.9 49.6
By portal
Companisto
By local bias
Positive (>0) 6,245 39.9 49.0 -482.8*** Negative (≤0) 5,957 44.2 49.7
Innovestment
By local bias
Positive (>0) 876 34.8 47.7 -271.6*** Negative (≤0) 747 41.4 49.3

65
Table W4. Firm Failure Regression Results for Investor Sample Providing Exact Location.
The table shows the results of regressions on firm failure. Variable definitions are reported
in Appendix A. The dependent variable in columns (1) and (2) is a dummy variable for
whether a firm failure occurred or not and in columns (3) and (4) the duration until firm
failure. Columns (1) and (2) report the results of a probit model. Coefficients reported are
average marginal effects. Columns (3) and (4) report the results of a Cox proportional hazard
model. Coefficients reported are hazard ratios. The variables Industry_finance,
Industry_techservice, Industry_otherservice, Industry_entertainment, filed_patents, and
granted_patents are not included because they predict firm failure perfectly. Standard errors
are clustered by investor and are reported in parentheses. ***, **, and + indicate statistical
significance at the 1%, 5%, and 10% level.
(1) (2) (3) (4)
Probit Cox
Localbias -0.036*** 0.956
(0.008) (0.032)
Lb_investment -0.101*** 0.621***
(0.008) (0.021)
Campaign_Innovestment -0.138*** -0.130*** 0.098*** 0.113***
(0.026) (0.026) (0.030) (0.032)
Campaign_fundingratio -0.038*** -0.038*** 0.830*** 0.830***
(0.001) (0.001) (0.005) (0.005)
Campaign_success 0.017 0.015 0.757 0.671
(0.046) (0.045) (0.269) (0.228)
Campaign_days -0.034*** -0.034*** 0.820*** 0.828***
(0.002) (0.002) (0.012) (0.012)
Firm_valuation 0.095*** 0.089*** 1.579*** 1.591***
(0.009) (0.008) (0.074) (0.072)
Population_density -0.049*** -0.045*** 0.495*** 0.540***
(0.006) (0.006) (0.045) (0.046)
Industry_trading 0.170*** 0.159*** 2.422*** 2.495***
(0.015) (0.016) (0.272) (0.275)
Funding_prev_succ_campaign 0.001*** 0.001*** 0.987*** 0.986***
(0.000) (0.000) (0.001) (0.001)
Businessplan_fleschscore 0.002 0.003+ 1.104*** 1.100***
(0.001) (0.001) (0.014) (0.014)
Businessplan_pictures 0.009*** 0.009*** 1.019** 1.022**
(0.001) (0.001) (0.010) (0.010)
Businessplan_characters 0.002*** 0.003*** 1.019*** 1.021***
(0.000) (0.000) (0.004) (0.004)
Number_founder -0.004 -0.002 1.170*** 1.186***
(0.004) (0.004) (0.025) (0.024)
Founder_startupexperience 0.356*** 0.361*** 14.099*** 14.385***
(0.014) (0.014) (1.876) (1.888)

66
Number_employees -0.043*** -0.045*** 0.848*** 0.837***
(0.001) (0.001) (0.005) (0.005)
Total_trademarks -0.052*** -0.063*** 0.390*** 0.380***
(0.008) (0.008) (0.036) (0.033)
Firm_legalform_minimum -0.060*** -0.048*** 0.840*** 0.884**
(0.010) (0.010) (0.046) (0.048)
BA_initial -0.041*** -0.035*** 1.083*** 1.101***
(0.005) (0.005) (0.032) (0.033)
VC_initial 0.103*** 0.098*** 1.703*** 1.656***
(0.005) (0.005) (0.082) (0.080)
Days at risk - - 37,294,246 37,294,246
N_fail - - 5,736 5,736
Pseudo-R2 0.330 0.342 0.076 0.079
Log-likelihood - - -47770.341 -47627.898
P(Y=1) 41.5% 41.5% 41.5% 41.5%
Observations 13,825 13,825 13,825 13,825

67
Table W5. Local Bias Excluding Investors with Most Popular German Names.
Local bias for individual investments (Panel A) and investor portfolios (Panel B) in percentages.
We exclude investments of investors with the 20 most popular German names. The table
categorizes the local bias according to portals and the location of the investor. Furthermore, we
calculate local biases by excluding family and friend investors. In line with Agrawal et al. (2015),
we define investors as family and friends if (1) they invest in the focal start-up before investing in
any other start-up, (2) their investment in the focal start-up is their largest investment, and (3) the
investor invests in no more than three other start-ups. We report a one-sample, two-tailed t-test for
the null hypothesis that local biases are zero. ***, **, and + indicate statistical significance at the
1%, 5%, and 10% level. Variables reported are defined in Appendix A.
Panel A: Local bias individual investments
N Mean SD Min. 25th Median 75th Max.
By portal
Companisto 14,468 0.5 54.5 -464.8 -12.9 -0.1 9.2 99.7
German Investors 13,388 0.6 56.4 -464.8 -12.9 -0.1 9.7 99.7
Foreign Investors 1,080 -0.7 18.3 -46.5 -12.5 -0.1 3.2 80.9
Innovestment 1,623 10.6*** 45.3 -283.8 -8.8 1.0 33.9 99.8
German Investors 1,467 11.6*** 47.0 -283.8 -8.8 1.1 39.1 99.8
Foreign Investors 156 1.0 22.0 -59.9 -8.4 -0.2 11.6 67.2
By country
German Investors 14,855 1.7*** 55.7 -464.8 -12.3 -0.1 11.6 99.8
Foreign Investors 1,236 -0.5 18.8 -59.9 -12.4 -0.1 3.9 80.9
Without family and friends 11,876 0.2 56.1 -464.8 -13.1 -0.2 9.9 99.7
Companisto 10,622 -0.7 57.4 -464.8 -13.4 -0.2 8.6 99.7
Innovestment 1,254 8.1*** 42.1 -149.3 -8.3 0.7 27.9 99.7
Total 16,091 1.5*** 53.8 -464.8 -12.3 -0.1 11.0 99.8
Panel B: Local bias investor portfolio
N Mean SD Min. 25th Median 75th Max.
By portal
Companisto 5,320 10.0*** 43.3 -497.4 -8.6 -2.4 20.0 99.7
German investors 4,809 11.2*** 45.0 -497.4 -8.5 -2.3 23.7 99.7
Foreign investors 511 -1.4+ 16.4 -38.3 -10.2 -2.9 4.2 68.5
Innovestment 432 18.1*** 48.9 -113.6 -24.4 11.1 50.5 99.9
German investors 389 19.5*** 50.6 -113.6 -25.3 15.6 62.3 99.9
Foreign investors 43 4.8 25.8 -32.4 -14.3 0.3 29.8 78.8
By country
German investors 5,198 11.8*** 45.5 -497.4 -8.8 -2.0 27.3 99.9
Foreign investors 554 -0.9 17.4 -38.3 -10.3 -2.5 5.5 78.8
Without family and friends 1,759 5.2*** 38.7 -497.4 -8.0 -1.5 13.4 99.3
Companisto 1,571 4.6*** 38.5 -497.4 -7.8 -1.9 11.0 99.3
Innovestment 188 10.8*** 39.3 -87.3 -21.3 6.2 31.0 99.3
Total 5,752 10.6*** 43.8 -497.4 -8.9 -2.1 22.8 99.9

68
Table W6. Regression Results Excluding Investors with Most Popular German Names.
The table shows the results of regressions on individual investment decisions. We exclude
investors with the 20 most popular German names. The dependent variable is the individual
investment local bias as defined in section 4.2.1. Panel A displays the results of our baseline
regressions for the sample of 16,091 investments. Columns (1) and (2) show the results for the
ordinary least squares regressions without adding additional firm-specific control variables to
the model. Columns (3) and (4) display the results of the ordinary least squares regressions
with additional firm-specific control variables. Columns (2) and (4) present the results for the
sample in which we winsorize the data at the bottom 10%. All regressions include dummy
variables to control for firm fixed effects at the campaign level. Next to the variables reported
in Panels B–D, every regression also includes all variables from Panel A column (1).
Additional controls indicate that the firm-specific control variables from Panel A columns (3)
and (4) are included. Panel B reports the effect of different investor types. Panel C considers
the experience of the investors. In Panel D, we test whether herding and timing have an effect
on the local bias. Standard errors are clustered by investor and are reported in parentheses.
***, **, and + indicate statistical significance at the 1%, 5%, and 10% level. Variables
reported are defined in Appendix A.
Panel A: Baseline regressions
(1) (2)
Winsorized
(3) (4)
Winsorized
Campaign_Innovestment 0.505*** 0.404*** 0.097 0.124
(0.087) (0.080) (0.088) (0.080)
Campaign_fundingratio 0.000 -0.006*** 0.000 -0.006***
(0.002) (0.001) (0.002) (0.001)
Campaign_success 0.231 0.214 0.014 -0.022
(0.178) (0.168) (0.181) (0.176)
Campaign_days -0.063*** -0.053*** 0.026*** 0.024***
(0.014) (0.013) (0.005) (0.004)
Firm_valuation 0.093*** 0.092*** 0.045*** 0.049***
(0.013) (0.013) (0.013) (0.012)
Population_density -0.258*** -0.236*** -0.268*** -0.237***
(0.045) (0.043) (0.037) (0.033)
Industry_manufacturing -0.702*** -0.559*** 0.156 0.031
(0.048) (0.044) (0.221) (0.069)
Industry_trading -0.402*** -0.277** 0.766*** 0.496***
(0.145) (0.136) (0.230) (0.190)
Industry_IT -0.351*** -0.271** 0.599*** 0.386***
(0.114) (0.107) (0.197) (0.078)
Industry_finance 0.377*** 0.320*** -0.034 -0.122
(0.092) (0.083) (0.262) (0.084)
Industry_techservice -1.209*** -0.851*** -1.404*** -1.224***
(0.116) (0.094) (0.125) (0.182)
Industry_entertainment -0.320** -0.251+ . -0.236
(0.144) (0.135) (0.190)

69
Funding_prev_succ_campaign -0.002*** -0.002**
(0.001) (0.001)
Businessplan_fleschscore 0.016*** 0.010**
(0.006) (0.005)
Businessplan_pictures -0.016*** -0.013***
(0.005) (0.004)
Businessplan_characters -0.007*** -0.006***
(0.001) (0.001)
Number_founder -0.120*** -0.090**
(0.043) (0.040)
Founder_startupexperience -0.113 -0.115+
(0.071) (0.067)
Number_employees -0.016*** -0.015***
(0.005) (0.004)
Filed_patents -0.070 -0.176***
(0.060) (0.056)
Granted_patents 0.139** 0.185***
(0.069) (0.059)
Total_trademarks -0.168*** -0.106***
(0.031) (0.028)
Firm_legalform_minimum 0.648*** 0.559***
(0.121) (0.105)
BA_initial -0.005 0.004
(0.017) (0.016)
VC_initial 0.026 0.023
(0.025) (0.022)
Intercept 0.859*** 0.787*** 0.089 0.377
(0.147) (0.133) (0.283) (0.384)
Firm dummies Yes Yes Yes Yes
Adjusted R2 0.065 0.079 0.065 0.079
Observations 16,091 16,091 16,091 16,091

70
Panel B: Family, friends, and angel-like investors
(1) (2) (3) (4) (5) (6) (7) (8)
Investor_familyfriends 0.062*** 0.062*** 0.062*** 0.062***
(0.009) (0.009) (0.009) (0.009)
Investment_first3days -0.008 -0.008 -0.007 -0.008
(0.011) (0.011) (0.011) (0.011)
Investment_5k 0.045 0.009 0.045 0.009
(0.029) (0.030) (0.029) (0.030)
Investment_5k x first3days 0.122** 0.115** 0.122** 0.115**
(0.050) (0.053) (0.050) (0.053)
Firm dummies Yes Yes Yes Yes Yes Yes Yes Yes
Additional controls No No No No Yes Yes Yes Yes
Adjusted R2 0.068 0.065 0.065 0.068 0.067 0.065 0.065 0.068
Observations 16,091 16,091 16,091 16,091 16,091 16,091 16,091 16,091

71
Panel C: Investor characteristics
(1) (2) (3) (4) (5) (6)
Innovestment Companisto Innovestment Companisto
Investor_#investments -0.001 -0.001
(0.006) (0.006)
Investor_portfolioamount -0.002*** -0.002***
(0.001) (0.001)
Investor_averageinvestment 0.013+ 0.013+
(0.007) (0.007)
Investment_amount -0.002 -0.002
(0.007) (0.007)
Region_GDPperP -0.001*** -0.001***
(0.000) (0.000)
Investor_bigcity -0.040*** -0.040***
(0.012) (0.012)
Exper_deposits 0.066 0.066
(0.062) (0.062)
Exper_stocks -0.102 -0.102
(0.069) (0.069)
Exper_fundscertif -0.006 -0.006
(0.072) (0.072)
Exper_fixedincome -0.034 -0.034
(0.051) (0.051)
Exper_commodity -0.044 -0.044
(0.044) (0.044)
Exper_realestate 0.068+ 0.068+
(0.041) (0.041)
Exper_othercorporate 0.043 0.043
(0.034) (0.034)
Investor_female -0.005 -0.005
(0.013) (0.013)
Investor_typo 0.031 0.030
(0.041) (0.041)
Firm dummies Yes Yes Yes Yes Yes Yes
Additional controls No No No Yes Yes Yes Adjusted R2 0.072 0.219 0.052 0.072 0.219 0.052
Observations 13,555 1,623 14,225 13,555 1,623 14,225

72
Panel D: Herding and timing with fixed effects
(1) (2) (3) (4) (5) (6) (7) (8) (9) (10)
Innovestment
Investment_#earlier -0.002 -0.002
(0.002) (0.002)
Investment_#earlier5k 0.006 0.002
(0.039) (0.039)
Investment_weekend -0.023+ -0.025** -0.023+ -0.030**
(0.012) (0.012) (0.012) (0.014)
Investment_first3days -0.008 -0.015
(0.011) (0.011)
Investment_weekend x _first3days 0.040
(0.026)
Investment_evening -0.020 -0.021
(0.022) (0.023)
Investment_night 0.001 -0.007
(0.034) (0.035)
Firm dummies Yes Yes Yes Yes Yes Yes Yes Yes Yes Yes
Additional controls No No No No No No No No No No
Adjusted R2 0.065 0.065 0.065 0.065 0.065 0.065 0.065 0.214 0.214 0.214
Observations 16,091 16,091 16,091 16,091 16,091 16,091 16,091 1,623 1,623 1,623

73
PANEL D: continued
(11) (12) (13) (14) (15) (16) (17) (18) (19) (20)
Innovestment
Investment_#earlier -0.002 -0.002
(0.002) (0.002)
Investment_#earlier5k 0.006 0.003
(0.039) (0.039)
Investment_weekend -0.023+ -0.025** -0.023+ -0.031**
(0.012) (0.012) (0.012) (0.014)
Investment_first3days -0.007 -0.014
(0.011) (0.012)
Investment_weekend x _first3days 0.040
(0.027)
Investment_evening -0.020 -0.021
(0.022) (0.023)
Investment_night 0.001 -0.007
(0.034) (0.035)
Firm dummies Yes Yes Yes Yes Yes Yes Yes Yes Yes Yes
Additional controls Yes Yes Yes Yes Yes Yes Yes Yes Yes Yes
Adjusted R2 0.065 0.065 0.065 0.065 0.065 0.065 0.065 0.214 0.214 0.214
Observations 16,091 16,091 16,091 16,091 16,091 16,091 16,091 1,623 1,623 1,623

74
Table W7. Local Bias and Firm Failure Excluding Investors with Most Popular German
Names.
The table shows the percentage of failed firms according to the local bias for individual
investments. The local bias for individual investments is defined in section 4.2.1. Positive
indicates that the investment was regionally closer than the respective benchmark portfolio;
negative indicates that it was farther away than the respective benchmark portfolio. We report
a two-sample t-test for testing the equality of the means. ***, **, and + indicate statistical
significance at the 1%, 5%, and 10% level.
Individual investment
N Mean SD t-Stat.
By local bias
Positive (>0) 7,775 37.3 48.4 236.0**
Negative (≤0) 8,316 35.5 47.9
By portal
Companisto
By local bias
Positive (>0) 6,899 37.6 48.5 335.7***
Negative (≤0) 7,569 35.0 47.7
Innovestment
By local bias
Positive (>0) 876 34.8 47.7 -271.6***
Negative (≤0) 747 41.4 49.3

75
Table W8. Firm Failure Regression Results for Investor Sample Excluding Popular Names.
The table shows the results of regressions on firm failure. Variable definitions are reported
in Appendix A. The dependent variable in columns (1) and (2) is a dummy variable for
whether a firm failure occurred or not and in columns (3) and (4) the duration until firm
failure. Columns (1) and (2) report the results of a probit model. Coefficients reported are
average marginal effects. Columns (3) and (4) report the results of a Cox proportional hazard
model. Coefficients reported are hazard ratios. The variables Industry_finance,
Industry_techservice, Industry_otherservice, Industry_entertainment, filed_patents, and
granted_patents are not included because they predict firm failure perfectly. Standard errors
are clustered by investor and are reported in parentheses. ***, **, and + indicate statistical
significance at the 1%, 5%, and 10% level.
(1) (2) (1) (2)
Probit Cox
Localbias -0.004 0.970
(0.007) (0.029)
Lb_investment -0.042*** 0.706***
(0.008) (0.029)
Campaign_Innovestment -0.062*** -0.058** 0.585*** 0.608***
(0.023) (0.023) (0.083) (0.083)
Campaign_fundingratio -0.044*** -0.044*** 0.802*** 0.801***
(0.001) (0.001) (0.005) (0.005)
Campaign_success -0.004 -0.006 0.906 0.845
(0.045) (0.045) (0.266) (0.243)
Campaign_days -0.026*** -0.026*** 0.929*** 0.928***
(0.001) (0.001) (0.006) (0.006)
Firm_valuation 0.056*** 0.054*** 1.314*** 1.325***
(0.007) (0.007) (0.050) (0.049)
Population_density -0.001 0.001 1.144** 1.164***
(0.005) (0.005) (0.067) (0.064)
Industry_trading 0.254*** 0.255*** 5.891*** 6.177***
(0.014) (0.014) (0.422) (0.440)
Funding_prev_succ_campaign 0.000 0.000 0.990*** 0.989***
(0.000) (0.000) (0.001) (0.001)
Businessplan_fleschscore -0.005*** -0.005*** 0.999 0.996
(0.001) (0.001) (0.005) (0.005)
Businessplan_pictures 0.016*** 0.016*** 1.081*** 1.086***
(0.001) (0.001) (0.007) (0.007)
Businessplan_characters 0.002*** 0.002*** 1.016*** 1.017***
(0.000) (0.000) (0.003) (0.003)
Number_founder -0.013*** -0.013*** 1.031 1.042**
(0.003) (0.003) (0.020) (0.020)
Founder_startupexperience 0.298*** 0.299*** 5.138*** 5.390***
(0.012) (0.012) (0.430) (0.455)

76
Number_employees -0.042*** -0.043*** 0.868*** 0.857***
(0.001) (0.001) (0.005) (0.005)
Total_trademarks 0.057*** 0.056*** 1.108** 1.088+
(0.005) (0.005) (0.052) (0.050)
Firm_legalform_minimum -0.041*** -0.038*** 0.900** 0.945
(0.010) (0.010) (0.044) (0.046)
BA_initial -0.086*** -0.085*** 0.854*** 0.860***
(0.005) (0.005) (0.023) (0.023)
VC_initial 0.108*** 0.107*** 1.174*** 1.159***
(0.004) (0.004) (0.024) (0.024)
Days at risk - - 42,444,306 42,444,306
Number of failures - - 5,857 5,857
Pseudo-R2 0.342 0.344 0.064 0.065
Log-likelihood - - -50237.947 -50169.621
P(Y=1) 36.4% 36.4% 36.4% 36.4%
Observations 16,091 16,091 16,091 16,091

77
Table W9. Local Bias for Only German Investor Sample.
Local bias for individual investments (Panel A) and investor portfolios (Panel B) in
percentages. We exclude investments of international investors. The table categorizes the
local bias according to portals and the location of the investor. Furthermore, we calculate
local biases by excluding family and friend investors. In line with Agrawal et al. (2015), we
define investors as family and friends if (1) they invest in the focal start-up before investing
in any other start-up, (2) their investment in the focal start-up is their largest investment, and
(3) the investor invests in no more than three other start-ups. We report a one-sample, two-
tailed t-test for the null hypothesis that local biases are zero. ***, **, and + indicate statistical
significance at the 1%, 5%, and 10% level. Variables reported are defined in Appendix A.
Panel A: Local bias individual investments
N Mean SD Min. 25th Median 75th Max.
By portal
Companisto 17,431 0.5 55.2 -464.8 -13.1 -0.2 9.2 99.7
Innovestment 1,467 11.6*** 47.0 -283.8 -8.8 1.1 39.1 99.8
Without family and friends 14,682 0.0 56.5 -464.8 -13.4 -0.2 9.5 99.7
Companisto 13,545 -0.7 57.4 -464.8 -13.5 -0.2 8.2 99.7
Innovestment 1,137 9.0*** 43.6 -149.3 -8.3 0.8 30.0 99.7
Total 18,898 1.3*** 54.7 -464.8 -12.7 -0.1 10.8 99.8
PANEL B: Local bias investor portfolio
N Mean SD Min. 25th Median 75th Max.
By portal
Companisto 5,559 10.7*** 43.8 -497.4 -8.4 -2.4 21.6 99.7
Innovestment 389 19.5*** 50.6 -113.6 -25.3 15.6 62.3 99.9
Without family and friends 1,942 5.9*** 38.0 -497.4 -7.8 -1.4 13.9 99.3
Companisto 1,770 5.3*** 37.7 -497.4 -7.5 -1.7 11.5 99.3
Innovestment 172 12.0*** 40.5 -87.3 -21.3 7.7 33.6 99.3
Total 5,948 11.3*** 44.3 -497.4 -8.6 -2.2 24.9 99.9

78
Table W10. Regression Results for Only German Investor Sample.
The table shows the results of regressions on individual investment decisions. We exclude
international investors. The dependent variable is the individual investment local bias as
defined in section 4.2.1. Panel A displays the results of our baseline regressions for the
sample of 18,898 investments. Columns (1) and (2) show the results for the ordinary least
squares regressions without adding additional firm-specific control variables to the model.
Columns (3) and (4) display the results of the ordinary least squares regressions with
additional firm-specific control variables. Columns (2) and (4) present the results for the
sample in which we winsorize the data at the bottom 10%. All regressions include dummy
variables to control for firm fixed effects at the campaign level. Next to the variables reported
in Panels B–D, every regression also includes all variables from Panel A column (1).
Additional controls indicate that the firm-specific control variables from Panel A columns
(3) and (4) are included. Panel B reports the effect of different investor types. Panel C
considers the experience of the investors. In Panel D, we test whether herding and timing
have an effect on the local bias. Standard errors are clustered by investor and are reported in
parentheses. ***, **, and + indicate statistical significance at the 1%, 5%, and 10% level.
Variables reported are defined in Appendix A.
Panel A: Baseline regressions
(1) (2) (3) (4)
Winsorized Winsorized
Campaign_Innovestment 0.490*** 0.384*** 0.616*** 0.563***
(0.089) (0.083) (0.090) (0.086)
Campaign_fundingratio 0.001 -0.006*** 0.001 -0.006***
(0.002) (0.001) (0.002) (0.001)
Campaign_success 0.237 0.222 -0.187 -0.190
(0.196) (0.187) (0.222) (0.214)
Campaign_days -0.062*** -0.053*** -0.060*** -0.049***
(0.016) (0.015) (0.010) (0.009)
Firm_valuation 0.100*** 0.102*** 0.078*** 0.077***
(0.010) (0.010) (0.013) (0.012)
Population_density -0.274*** -0.258*** -0.232*** -0.211***
(0.042) (0.040) (0.046) (0.043)
Industry_manufacturing -0.419** -0.590*** -0.022 0.118
(0.209) (0.032) (0.241) (0.238)
Industry_trading -0.075 -0.257+ 0.419+ 0.441+
(0.293) (0.146) (0.251) (0.241)
Industry_IT -0.102 -0.334*** 0.639** 0.664***
(0.231) (0.097) (0.253) (0.249)
Industry_finance 0.670*** 0.322*** 1.098*** 1.078***
(0.187) (0.095) (0.350) (0.349)
Industry_techservice -0.377 -0.551*** 0.789*** 0.744***
(0.275) (0.111) (0.242) (0.239)
Industry_otherservice -0.226
(0.202)

79
Industry_entertainment 0.281 -0.009 0.728*** 0.740***
(0.212) (0.017) (0.273) (0.272)
Funding_prev_succ_campaign 0.005*** 0.005***
(0.001) (0.001)
Businessplan_fleschscore 0.022*** 0.015**
(0.007) (0.006)
Businessplan_pictures 0.006+ 0.005+
(0.003) (0.003)
Businessplan_characters -0.007*** -0.006***
(0.001) (0.001)
Number_founder 0.048 0.052
(0.043) (0.042)
Founder_startupexperience -0.075 -0.087
(0.081) (0.078)
Number_employees 0.006 0.002
(0.005) (0.004)
Filed_patents -0.017 -0.139**
(0.058) (0.054)
Granted_patents 0.343*** 0.371***
(0.077) (0.067)
Total_trademarks -0.038 0.005
(0.047) (0.045)
Firm_legalform_minimum 0.632*** 0.555***
(0.107) (0.100)
BA_initial -0.002 0.009
(0.015) (0.014)
VC_initial 0.011 0.011
(0.024) (0.021)
Intercept 0.600*** 0.847*** -1.155*** -0.900***
(0.228) (0.121) (0.336) (0.312)
Firm dummies Yes Yes Yes Yes
Adjusted R2 0.065 0.078 0.065 0.078
Observations 18,898 18,898 18,898 18,898
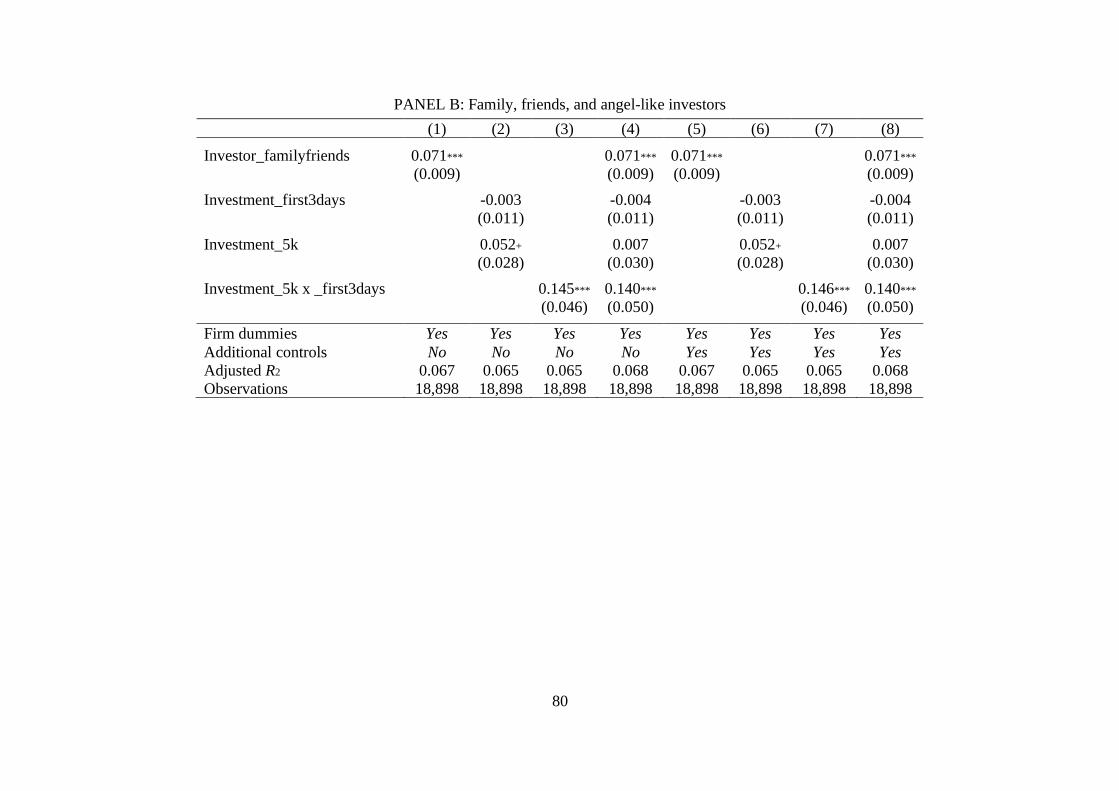
80
PANEL B: Family, friends, and angel-like investors
(1) (2) (3) (4) (5) (6) (7) (8)
Investor_familyfriends 0.071*** 0.071*** 0.071*** 0.071***
(0.009) (0.009) (0.009) (0.009)
Investment_first3days -0.003 -0.004 -0.003 -0.004
(0.011) (0.011) (0.011) (0.011)
Investment_5k 0.052+ 0.007 0.052+ 0.007
(0.028) (0.030) (0.028) (0.030)
Investment_5k x _first3days 0.145*** 0.140*** 0.146*** 0.140***
(0.046) (0.050) (0.046) (0.050)
Firm dummies Yes Yes Yes Yes Yes Yes Yes Yes
Additional controls No No No No Yes Yes Yes Yes
Adjusted R2 0.067 0.065 0.065 0.068 0.067 0.065 0.065 0.068
Observations 18,898 18,898 18,898 18,898 18,898 18,898 18,898 18,898

81
PANEL C: Investor characteristics
(1) (2) (3) (4) (5) (6)
Innovestment Companisto Innovestment Companisto
Investor_#investments -0.001 -0.001
(0.005) (0.005)
Investor_portfolioamount -0.003*** -0.003***
(0.001) (0.001)
Investor_averageinvestment 0.010+ 0.010+
(0.006) (0.006)
Investment_amount 0.002 0.002
(0.006) (0.006)
Region_GDPperP -0.001*** -0.001***
(0.000) (0.000)
Investor_bigcity -0.034*** -0.034***
(0.011) (0.011)
Exper_deposits 0.081 0.081
(0.071) (0.071)
Exper_stocks -0.111 -0.111
(0.074) (0.074)
Exper_fundscertif -0.012 -0.012
(0.077) (0.077)
Exper_fixedincome -0.030 -0.030
(0.054) (0.054)
Exper_commodity -0.041 -0.041
(0.048) (0.048)
Exper_realestate 0.068 0.068
(0.046) (0.046)
Exper_othercorporate 0.031 0.031
(0.038) (0.038)
Investor_female 0.001 0.001
(0.014) (0.014)
Investor_typo 0.058 0.058
(0.050) (0.050)
Firm dummies Yes Yes Yes Yes Yes Yes
Additional controls No No No Yes Yes Yes Adjusted R2 0.068 0.213 0.054 0.068 0.213 0.054
Observations 17,362 1,467 17,213 17,362 1,467 17,213

82
PANEL D: Herding and timing
(1) (2) (3) (4) (5) (6) (7) (8) (9) (10)
Innovestment
Investment_#earlier -0.002 -0.002
(0.002) (0.002)
Investment_#earlier5k 0.007 0.002
(0.038) (0.038)
Investment_weekend -0.025** -0.027** -0.025** -0.030**
(0.011) (0.011) (0.011) (0.012)
Investment_first3days -0.003 -0.010
(0.011) (0.011)
Investment_weekend x _first3days 0.030
(0.024)
Investment_evening -0.018 -0.019
(0.024) (0.025)
Investment_night 0.000 -0.007
(0.037) (0.038)
Firm dummies Yes Yes Yes Yes Yes Yes Yes Yes Yes Yes
Additional controls No No No No No No No No No No
Adjusted R2 0.065 0.065 0.065 0.065 0.065 0.065 0.065 0.209 0.209 0.208
Observations 18,898 18,898 18,898 18,898 18,898 18,898 18,898 1,467 1,467 1,467

83
Panel D continued: Herding and timing
(11) (12) (13) (14) (15) (16) (17) (18) (19) (20)
Innovestment
Investment_#earlier -0.002 -0.002
(0.002) (0.002)
Investment_#earlier5k 0.007 0.003
(0.038) (0.038)
Investment_weekend -0.025** -0.027** -0.025** -0.030**
(0.011) (0.011) (0.011) (0.012)
Investment_first3days -0.003 -0.010
(0.011) (0.011)
Investment_weekend x _first3days 0.030
(0.024)
Investment_evening -0.018 -0.019
(0.024) (0.025)
Investment_night 0.000 -0.007
(0.037) (0.038)
Firm dummies Yes Yes Yes Yes Yes Yes Yes Yes Yes Yes
Additional controls Yes Yes Yes Yes Yes Yes Yes Yes Yes Yes
Adjusted R2 0.065 0.065 0.065 0.065 0.065 0.065 0.065 0.209 0.209 0.208
Observations 18,898 18,898 18,898 18,898 18,898 18,898 18,898 1,467 1,467 1,467

84
Table W11. Local Bias and Firm Failure for Only German Investor Sample.
The table shows the percentage of failed firms according to the local bias for individual
investments. The local bias for individual investments is defined in section 4.2.1. Positive
indicates that the investment was regionally closer than the respective benchmark portfolio;
negative indicates that it was farther away than the respective benchmark portfolio. We report
a two-sample t-test for testing the equality of the means. ***, **, and + indicate statistical
significance at the 1%, 5%, and 10% level.
Individual investment Investor base
N Mean SD t-Stat. N Mean SD t-Stat.
By local bias
Positive (>0) 9,081 37.5 48.4 248.4** 39 38.5 49.3 -62.4
Negative (≤0) 9,817 35.8 47.9 35 45.7 50.5
By portal
Companisto
By local bias
Positive (>0) 8,278 37.7 48.5 353.8*** 10 40.0 51.6 -25.2
Negative (≤0) 9,153 35.2 47.7 20 45.0 51.0
Innovestment
By local bias
Positive (>0) 803 35.0 47.7 -352.2*** 29 37.9 49.4 -54.8
Negative (≤0) 664 44.0 49.7 15 46.7 51.6

85
Table W12. Firm Failure Regression Results for Only German Investor Sample.
The table shows the results of regressions on firm failure. Variable definitions are reported
in Appendix A. The dependent variable in columns (1) and (2) is a dummy variable for
whether a firm failure occurred or not and in columns (3) and (4) the duration until firm
failure. Columns (1) and (2) report the results of a probit model. Coefficients reported are
average marginal effects. Columns (3) and (4) report the results of a Cox proportional hazard
model. Coefficients reported are hazard ratios. The variables Industry_finance,
Industry_techservice, Industry_otherservice, Industry_entertainment, filed_patents, and
granted_patents are not included because they predict firm failure perfectly. Standard errors
are clustered by investor and are reported in parentheses. ***, **, and + indicate statistical
significance at the 1%, 5%, and 10% level.
(1) (2) (1) (2)
Probit Cox
Localbias -0.007 0.961
(0.007) (0.028)
Lb_investment -0.048*** 0.685***
(0.007) (0.027)
Campaign_Innovestment -0.075*** -0.071*** 0.464*** 0.492***
(0.024) (0.024) (0.076) (0.076)
Campaign_fundingratio -0.037*** -0.037*** 0.829*** 0.828***
(0.001) (0.001) (0.004) (0.004)
Campaign_success -0.051 -0.054 0.692 0.650
(0.046) (0.045) (0.227) (0.205)
Campaign_days -0.029*** -0.029*** 0.914*** 0.913***
(0.001) (0.001) (0.006) (0.006)
Firm_valuation 0.070*** 0.067*** 1.380*** 1.392***
(0.007) (0.007) (0.052) (0.051)
Population_density -0.008 -0.006 1.049 1.008
(0.005) (0.005) (0.066) (0.063)
Industry_trading 0.259*** 0.258*** 6.137*** 6.453***
(0.014) (0.014) (0.444) (0.462)
Funding_prev_succ_campaign 0.000 0.000 0.989*** 0.989***
(0.000) (0.000) (0.001) (0.001)
Businessplan_fleschscore -0.007*** -0.007*** 0.996 0.992
(0.001) (0.001) (0.005) (0.005)
Businessplan_pictures 0.019*** 0.019*** 1.097*** 1.102***
(0.001) (0.001) (0.008) (0.008)
Businessplan_characters 0.019*** 0.019*** 1.012*** 1.013***
(0.001) (0.001) (0.004) (0.003)
Number_founder -0.005 -0.005 1.049*** 1.064***
(0.003) (0.003) (0.018) (0.018)
Founder_startupexperience 0.307*** 0.308*** 5.964*** 6.268***
(0.012) (0.011) (0.533) (0.551)

86
Number_employees -0.044*** -0.044*** 0.867*** 0.854***
(0.001) (0.001) (0.005) (0.006)
Total_trademarks 0.049*** 0.047*** 1.062 1.043
(0.005) (0.005) (0.053) (0.050)
Firm_legalform_minimum -0.040*** -0.036*** 0.892** 0.945
(0.010) (0.010) (0.041) (0.043)
BA_initial -0.085*** -0.084*** 0.856*** 0.863***
(0.005) (0.005) (0.023) (0.023)
VC_initial 0.109*** 0.107*** 1.147*** 1.129***
(0.004) (0.004) (0.024) (0.023)
Days at risk - - 49,730,609 49,730,609
Number of failures - - 6,915 6,915
Pseudo R2 0.353 0.356 0.065 0.067
Log-likelihood - - -60304.374 -60209.596
P(Y=1) 36.6% 36.6% 36.6% 36.6%
Observations 18,898 18,898 18,898 18,898