Do political connections affect a firm performance? · i Abstract Previous studies have indicated...
136
Do political connections affect a firm’s performance? Amiruddin This thesis is presented for the degree of Doctor of Business Administration of The University of Western Australia UWA Business School Accounting and Finance 2016
Transcript of Do political connections affect a firm performance? · i Abstract Previous studies have indicated...

Do political connections affect a firm’s performance?
Amiruddin
This thesis is presented for the degree of
Doctor of Business Administration of
The University of Western Australia
UWA Business School
Accounting and Finance
2016


i
Abstract
Previous studies have indicated that political connection can be a source of value to a
firm, and may affect firm performance.
This study has examined the links between political connection and firm performance in
Indonesia after the Soeharto era, when politically connected firms enjoyed favourable
benefits such as exclusive import licences, bail-outs and favourable financings.
The study used a mixed method approach: interviews with 34 bankers, analysts, fund
managers, academics, lawyers and business owners on their perception regarding the
need for political connection for business to be competitive in Indonesia, and a
regression analysis on panel data of listed non-financial companies in the Indonesia
Stock Exchange (IDX).
To define politically connected firms, this study used a measure whether a firm has any
member of the board of directors or the board of commissioners a politically exposed
person (PEP) or not. As measures of firm performance, return on assets (ROA) was
used for accounting-based firm performance and Tobin’s Q and market-adjusted returns
were used for market-based firm performance.
The findings from the interviews indicated that political connections were still needed
in the post-Soeharto era for ‘political protection’, as well as for access to information
and to regulators. The findings from examining the financial performance of the listed
companies in the IDX have corroborated the findings from the interviews. More than
one-third (36%) of Indonesian listed companies had political connectedness: 91%. The
concentration of politically connected firms was in the agricultural, mining,
property/real estate and miscellaneous industries (e.g., auto and auto parts). Not only
were they prevalent, the politically connected firms were some of the largest in the
country, where the mean and median value were higher in terms of market
capitalisation, total assets, total revenue and net profits.
The degree of political connection depended on the industry, the scale of the business
and the stage of the business. The dispersion of power structures necessitated businesses
to obtain wider political connections, especially in more regulated industries such as

ii
mining, oil and gas, plantations and property/real estate. However, the perception of the
interviewees was that political connection was just one of the factors required for
success; the key factor for a company’s success is its management. The results of the
regression showed that political connection had significant effects on market-based firm
performance, but not accounting-based firm performance. The effects on Tobin’s Q
were significant and positive, while the effects on returns were significant and negative.
Various robustness tests were conducted, such as including the top 40 business groups
in the definition of PEP, the addition of industry dummies, and matched pair tests on the
means of ROA and the change in ROA. Robustness tests confirmed Tobin’s Q
maintained significant and positive effects, with no difference in the means of ROA or
the change in ROA using a matched pair tests. The consumer industry had a positive
significant effect on Tobin’s Q. The number of the PEP board members did not have
any effect on ROA or market-adjusted returns, except on Tobin’s Q; however, the
number of PEP board members had significant and positive effects on the ROA within
the sample of PEP companies that experienced changes in their boards.
The findings of a relationship between political connection and market-based firm
performance have corroborated previous findings. This study has contributed to the
research on political connection, firm performance, institutions and how business is
conducted in emerging markets.
iii
Contents
Abstract ........................................................................................................................ i
Contents .................................................................................................................... iii
List of Figures ............................................................................................................ vi
List of Tables ............................................................................................................ vii
List of Abbreviations ............................................................................................. viii
Declaration of Originality.......................................................................................... x
Acknowledgements .................................................................................................... xi
Chapter 1: Research Rationale ................................................................................. 1 1.1 Introduction ........................................................................................................ 1 1.2 Research Background ......................................................................................... 1 1.3 Research Purpose and Key Questions ................................................................ 3 1.4 Research Significance ........................................................................................ 3 1.5 Research Scope .................................................................................................. 4 1.6 Thesis Structure .................................................................................................. 4
Chapter 2: Background & Literature Review ........................................................ 5 2.1 Introduction ........................................................................................................ 5 2.2 Overview of the Indonesian Economy ............................................................... 6
2.2.1 Recent Developments ................................................................................. 6 2.2.2 Capital Market Development ...................................................................... 7 2.2.3 Business Landscape .................................................................................... 8
2.3 Overview of Indonesia’s Political System ....................................................... 12 2.3.1 Recent Developments ............................................................................... 12 2.3.2 Brief History of the Political System ........................................................ 14
2.3.2.1 The Soekarno Era ............................................................................... 14 2.3.2.2 The Soeharto Era ............................................................................... 15 2.3.2.3 The Reformation Era .......................................................................... 18
2.4 Politics and Business in Indonesia ................................................................... 20 2.4.1 Introduction ............................................................................................... 20 2.4.2 The State and Rent-Seeking ...................................................................... 21 2.4.3 Oligarchy ................................................................................................... 22 2.4.4 Culture ....................................................................................................... 23 2.4.5 Government Intervention .......................................................................... 26 2.4.6 Case Study: The Salim Group ................................................................... 30
2.5 The Theoretical Foundations of Earlier Research ............................................ 32 2.5.1 Determinants of Firm Performance ........................................................... 32 2.5.2 Institutional Voids ..................................................................................... 33 2.5.3 The Effects of Having Political Connections on Firm Performance......... 35
Chapter 3: Perceptions of Business and Politics in Indonesia ............................. 40 3.1 Introduction ...................................................................................................... 40 3.2 Research Design ............................................................................................... 41
3.2.1 Rationale for Interview Method ................................................................ 41 3.2.2 Selection of Interview Participants ........................................................... 41 3.2.3 Data Analysis ............................................................................................ 42

iv
3.3 Findings ............................................................................................................ 42 3.3.1 Interviewee Characteristics ....................................................................... 42 3.3.2 Data Analysis—Manual Coding ............................................................... 45
3.3.2.1 What Factors are Important to Compete Effectively in Indonesia? .. 45 3.3.2.2 Why the Need for Political Connection? ............................................ 51 3.3.2.3 Need for Political Connection During and After the Suharto Era .... 53 3.3.2.4 Variation in Political Connection by Sectors of Industry .................. 55 3.3.2.5 Mechanism of Political Connection ................................................... 58
3.3.3 Data Analysis Using Leximancer ............................................................. 62 3.4 Summary .......................................................................................................... 65
3.4.1 Interviewees’ Characteristics .................................................................... 65 3.4.2 Does Political Connection Matter? ........................................................... 66 3.4.3 Why the Need for Political Connection? .................................................. 67 3.4.4 Conditions During and After the Soeharto Era ......................................... 67 3.4.5 Variation of Political Connection by Sectors of Industry ......................... 67 3.4.6 Mechanisms of Political Connection ........................................................ 68 3.4.7 Summary Data Analysis Using Leximancer ............................................. 68
3.5 Discussion and Implications ............................................................................ 69
Chapter 4: Political Connection and Firm Performance in Indonesia ............... 72 4.1 Introduction ...................................................................................................... 72 4.2 Background and Hypotheses ............................................................................ 72
4.2.1 Research Background ............................................................................... 72 4.2.2 Research Hypotheses ................................................................................ 73
4.3 Research Design ............................................................................................... 75 4.3.1 Sample and Time Period ........................................................................... 75 4.3.2 Research Data ........................................................................................... 75
4.3.2.1 Data Collection Method ..................................................................... 75 4.3.2.2 Independent Variables ....................................................................... 76
4.3.3 Research Models ....................................................................................... 77 4.3.3.1 Dependent Variables .......................................................................... 77 4.3.3.2 Control Variables ............................................................................... 78 4.3.3.3 Ordinary Least Squares ..................................................................... 78 4.3.3.4 Research Model.................................................................................. 79
4.4 Results .............................................................................................................. 80 4.4.1 Overview of Sample.................................................................................. 80 4.4.2 Descriptive Statistics and Correlation ....................................................... 81 4.4.3 Comparison of PEP and Non-PEP Companies ......................................... 82 4.4.4 Regression Model Results ......................................................................... 88
4.5 Robustness Tests .............................................................................................. 92 4.5.1 Robustness Test 1 ..................................................................................... 92 4.5.2 Robustness Test 2 ..................................................................................... 95 4.5.3 Robustness Test 3 ..................................................................................... 97
4.6 Discussion ........................................................................................................ 97
Chapter 5: Conclusions ......................................................................................... 100 5.1 Introduction .................................................................................................... 100 5.2 Theoretical and Empirical Findings and Contributions ................................. 100 Research Limitations ........................................................................................... 104 5.3 104 5.4 Implication of Findings .................................................................................. 106

v
References ............................................................................................................... 107
Appendix A ............................................................................................................. 120
Appendix B ............................................................................................................. 123
Appendix C ............................................................................................................. 125

vi
List of Figures
Figure 3.1: Key Success Factors Viewed as Necessary for Competitiveness ........... 49
Figure 3.2: Perceptions of Variation in Political Connectedness by Industry Sector 58
Figure 3.3: Concept Map of Political Connectedness ................................................ 64

vii
List of Tables
Table 2.1: Top 80 Business Groups in Indonesia ........................................................ 9
Table 3.1: Characteristics of Interviewees Based on Their Professions .................... 43
Table 3.2: Characteristics of Interviewees Based on Their Positions ........................ 43
Table 3.3: The Cross-Tabulation of Interviewees’ Jobs and Education .................... 44
Table 3.4: Interviewees’ Perceptions of the Necessity of Political Connections ....... 46
Table 3.5: Reasons for Answering ‘Depends On’ ..................................................... 46
Table 3.6: Main Themes and Concepts ...................................................................... 65
Table 4.1: Number of Companies with PEP and the Number of PEPs ..................... 81
Table 4.2: Descriptive Statistics of Variables ............................................................ 81
Table 4.3: Correlation between Variables .................................................................. 82
Table 4.4: Politically Connected Firms and Sectors of the Industry.......................... 83
Table 4.5: Ranking of Companies with a PEP in the Industry................................... 84
Table 4.6: Mean Value of Variables for PEP Companies and Non-PEP Companies 85
Table 4.7: Regression Results .................................................................................... 88
Table 4.8: Regression Results for NUM as Dependent Variables ............................. 90
Table 4.9: Regression Results for Changing NUM ................................................... 91
Table 4.10: Regression Results with Top 40 Business Groups ................................. 93
Table 4.11: T-test of ROA between All Companies and Top 40 Business Group .... 94
Table 4.12: Regression Results with Industry Dummies ........................................... 95
Table 4.13: T-test Result for ROA of Matched Pair Companies ............................... 97

viii
List of Abbreviations
AFC Asian Financial Crisis
AMDAL Analisa Mengenai Dampak Lingkungan
APINDO Asosiasi Pengusaha Indonesia
ASEAN Association of South East Asian Nations
BAPPENAS Badan Perencanaan Nasional
BCA Bank of Central Asia
BI Bank Indonesia
BODCOM Board Composition
BPOM Badan Pengawas Obat & Makanan
BUMN Badan Usaha Milik Negara
CONTR Concentrated Ownership
EPS Earnings Per Share
FDI Foreign Direct Investment
Golkar Golongan Karya
GFC Global Financial Crisis
IBRA Indonesian Banking Restructuring Agency
ICBP Indofood Consumer Brand Products
IDR Indonesian Rupiah
IMF International Monetary Fund
JCRA Japan Credit Rating Agency
KADIN Kamar Dagang & Industri Indonesia
KIP Kartu Indonesia Pintar
KIS Kartu Indonesia Sehat
KKP Kartu Keluarga Sejahtera
KPK Komisi Pemberantasan Korupsi
KPU Komisi Pemilihan Umum
KSO Kerja Sama Operasi
MAC Middle Class and Affluent Consumers
MNC Media Nusantara Citra
MOF Ministry of Finance
MP Member of Parliament
MPR Majelis Permusyawaratan Rakyat
NPL Non-Performing Loans
NUM Number of PEPs
OJK Otoritas Jasa Keuangan
OLS Ordinary Least Squares

ix
PAN Partai Amanat Nasional
PDIP Partai Demokrasi Indonesia Perjuangan
PEP Politically Exposed Person/s
PERDA Peraturan Daerah
PKI Partai Komunis Indonesia
PSC Production sharing contract
R&D Research & Development
ROA Return on Assets
ROE Returns of Equity
ROS Return on Sales
RUP Rencana Urgensi Perekonomian
SBY Susilo Bambang Yudhoyono
SOE State-Owned Enterprise
TI Transparency International
UBO Ultimate Beneficiary Owners
US United States of America
USD US Dollar

x
Declaration of Originality
I certify that this thesis does not incorporate without acknowledgement any material
previously submitted for a degree or diploma in any university; and that to the best of
my knowledge and belief it does not contain any material previously published or
written by another person except where due reference is made in the text.
Signed: On: 4 July 2016

xi
Acknowledgements
When I started out on the journey of the DBA programme, I was warned that the
journey of a Doctorate programme would be a long and lonely journey. It was indeed
so. However, the journey was very rewarding. Without the help and support of
countless individuals whom I cannot mention each and everyone of them, I would not
be able to complete this journey.
First and foremost, I would like to thank my mother - Khatijah and my late father -
Husin Ibrahim. Though my mother cannot even read and write and my father never
finished primary school, they instilled in me the importance of education in life and a
passion for a lifelong learning.
I would like to thank my wife - Rosalin Devi and my sons - Alif, Bing and Faridz. They
have been my constant supporters, inspirations, critics and encouragement even when I
had to take some time off my career to complete this journey.
I would like to thank Winthrop Professor Raymond da Silva Rosa and Associate
Professor Marvin Wee, my co-supervisors. Without their advice, guidance, and
patience, I would have been lost in the journey. Also my sincere thanks to Winthrop
Professor Geoffrey Soutar, DBA Programme Director and all staff at the UWA
Business School Research Office.
My thanks and sincere gratitude to the 34 interviewees who took time and efforts to
share their views despite their busy schedules. And to all friends, family, colleagues that
have supported me in this process, I am forever indebted for the exchanges of ideas,
words of encouragement, and any help extended to me.
Last, I would also like to thank and acknowledge the editing works by Elite Editing
(Australia). All editorial works were restricted to Standards D and E of the Australian
Standards for Editing Practice.


1
Chapter 1: Research Rationale
1.1 Introduction
The background to this research provides the rationale for and description of why I am
interested in examining the relationship between business, politics and firm (or
company)1 performance. Further, I will describe the research purpose and key questions.
I will then explain the thesis structure and contents.
1.2 Research Background
I worked in Indonesia for over 20 years. During the first four years, I worked in the
corporate world; for the last 16 of those years I worked as a senior banker. I observed
the phenomenon of a close relationship between business and politics both during and
after the post-Soeharto era. This prompted my idea to study the correlation between
business, politics and company performance in Indonesia.
In an emerging market such as that of Indonesia, the lack of institutional settings—a
situation called ‘institutional voids’—has been nominated as a reason for the emergence
of business groups concentrated in the hands of a few families (Khanna & Yafeh 2007;
Sato 2004). The majority of big family firms in Indonesia are owned by the descendants
of Chinese business people. They did not have the option of a political career, or joining
the bureaucracy or military during Soeharto’s time; hence, some perceive this is why the
Indonesian business world has been dominated by the Chinese (Muhaimin 1991;
Yoshihara 1988). However, as discussed in the literature review, the Chinese have
participated in business since the Dutch colonial period. Chinese cultural traits have
been perceived as the reason for this phenomenon (Yoshihara 1988). The Chinese have
been ‘subjugated’ and ‘co-opted’ by the political powers in a neo-patrimonialist regime
during Soeharto’s time (Chua 2008).
In the post-Soeharto era, Chinese dominance in business has not abated, although some
business groups have suffered major losses or have even disappeared completely in the
aftermath of the 1988 Asian financial crisis (AFC) (Chua 2008). Chua (2008) has
1 The terms company and firm are used interchangeably throughout this thesis.

2
argued that they are now more assertive and have better leverage due to their
indispensable capital. Since regional autonomy was established in 2001, power has been
dispersed regionally. In a democratic Indonesia, elections at the regional and central
levels require a huge amount of funding. Business people have become the source of
capital (Chua 2008).
Has the existence of politically connected firms translated into better firm performance
for these companies in Indonesia recently? This thesis will attempt to provide answers
through empirical evidence regarding the potential correlation between politics and
businesses in recent times (2009–2013); specifically, whether ‘politically connected’
firms perform better or not than other firms.
For this study, politically connected firms are defined as firms that have a Politically
Exposed Person (PEP) in the board of directors or commissioners. A more detailed
description of politically connected firms and PEP is available on page 78 (section
4.3.2.2 Chapter 4).
First, interviews with senior professionals, business owners, lawyers and academics
were conducted to obtain perceptions of business and politics in Indonesia’s post-
Soeharto era. These interviews will provide the background and further insight into the
quantitative analysis. Quantitative analysis will apply ordinary least square (OLS)
regression to the panel data of listed companies’ performance and their political
connectedness in subsequent chapters.
Business focuses on profit maximisation and firms tend to use all means to seize
opportunities and mitigate risk, including using political connections. This phenomenon
has been observed in Indonesia in previous studies such as those described in Chapter 2
(‘Literature Review’). Politics and business have been intimately intertwined to the
point that some of the largest business groups in Indonesia were born and flourished
under ‘political protection’ during Soeharto’s regime.
Since 1998, democracy has replaced Soeharto’s authoritarian regime. Have conditions
changed post-Soeharto? This thesis will explore the need for political connections to
compete in business in the post-Soeharto era, and whether political connections have
added value to Indonesian listed companies in recent times.
3
1.3 Research Purpose and Key Questions
This research examines the existence of political connections when conducting business
in Indonesia. An attempt was made to investigate the necessity of political connections
in doing business: how a different political era could result in different political
connection mechanisms and whether different company characteristics would affect
performance. To develop this research, the following questions were analysed and
discussed:
1. Are political connections necessary to be competitive in Indonesia? If so, why?
2. Has the situation become better or worse post-Soeharto?
3. Do political connections vary across industry sectors? How?
4. What mechanisms for political connections are used by firms?
5. Do political connections affect a firm’s performance in Indonesia?
6. Does the number of politically exposed persons (PEPs) on a board affect a
firm’s performance in Indonesia?
This research has used a mixed methods approach to answer the key research questions.
A qualitative method was used for interviews with 34 senior executives, business
owners, lawyers and academics in Indonesia regarding their perceptions of key research
questions 1 to 4; a quantitative method using OLS regression analysis on the
performance of listed companies that are politically connected or not in Indonesia was
conducted for research questions 5 and 6.
1.4 Research Significance
Previous studies have examined the correlation between politics and business in
Indonesia from the perspective of sociology, history or political economics and have
largely focused on the Soeharto era. This study has also examined the correlation
between politics and business in Indonesia, but has focused on business and
management perspectives in the post-Soeharto era. In addition, this study has examined
the correlation between political connection and a firm’s performance using the OLS
regression method on panel data. Moreover, using both qualitative and quantitative
approaches will provide enriched findings.

4
1.5 Research Scope
This research has used financial data from the audited financial statements of listed
companies in the Indonesian Stock Exchange (IDX) from 2009 to 2013. The
measurement of political connections has been based on previous studies (Faccio 2006)
that have examined whether board members, directors or commissioners are or have
been senior officials in the government, military and judiciary. Moreover, in-depth
interviews were conducted with 34 senior executives, business owners, lawyers and
academics. This will provide some important data to support the whole range of
arguments presented in this research.
1.6 Thesis Structure
The thesis will begin by discussing the institutional settings and providing a literature
review in Chapter 2. This chapter will review Indonesia’s recent economy and its
political system.
Chapter 3 describes the perceptions of respondents regarding politics and business in
Indonesia. It begins with a brief outline of the previous studies, followed by a main
section analysing the interview data using manual coding. To enrich this manual coding,
the analysis has used Leximancer software to code the interview results. Leximancer
coding produces a concept map. This map will indicate the closeness of the various
themes emerging from the Leximancer coding. These sections are constructed based on
the key research questions. A short summary is followed by discussion and
implications.
Chapter 4 describes the analysis of the key research questions using a quantitative
approach. Panel data regression was employed to answer whether politically connected
firms have better accounting performance using the measure return of assets (ROA),
and market-based performance using Tobin’s Q and market-adjusted returns. The
results and their implications are described at the close of Chapter 4.
Chapter 5 consists of a conclusion and some directions for future research. This chapter
will finish with a discussion on the implications of the findings for managers and policy
makers.
5
Chapter 2: Background & Literature Review
2.1 Introduction
Since its independence in 1945, Indonesia has experienced different political regimes.
Different regimes have resulted in different governmental dynamics, including policies,
priorities and expenditure, depending on the respective needs and allocations of the
regime’s period (Permana & Wika 2014).
During the Soeharto era, business and politics were intertwined intensely (Borsuk &
Chng 2014). Power was concentrated in one person—President Soeharto. In post-
Soeharto authoritarian regimes, reformation resulted in a democracy with more
transparency, better supervisory systems and an open trade regime (Basri 2013).
However, the intertwining of business and politics has not subsided in the post-Soeharto
era (Chua 2008).
Indonesia has the fourth largest population in the world, with a growing middle class
and increasing numbers of middle class and affluent consumers (MAC). Rastogi et al.
(2013) from Boston Consulting Group have predicted that Indonesia’s MAC population
could double in size, reaching 141 million people by 2020. Oberman et al. (2012) from
McKinsey have estimated that Indonesia could become the seventh largest economy in
the world in 2030; in terms of gross domestic product (GDP), Indonesia was ranked
sixteenth in the world in 2012.
I will start the literature review by reviewing institutional settings. In Section 2.2, I will
review the Indonesian economy, focusing on the business landscape concentrated in the
hands of a few families. In Section 2.3, I will review Indonesia’s political systems
during the different regimes: the Soekarno, Soeharto and post-Soeharto eras. The links
between politics and business in Indonesia are outlined in Section 2.4. I will focus on
oligarchy, the state and rent-seeking, and culture and government intervention as
possible explanations for this intertwining of politics and business. I will discuss a brief
case study of the Salim Group. Finally, I will review the earlier research on
‘institutional voids’, political connectedness and firm performance, and the potential
mechanisms to explain why political connectedness can add value or be detrimental to a
firm’s performance, in Section 2.5.
6
2.2 Overview of the Indonesian Economy
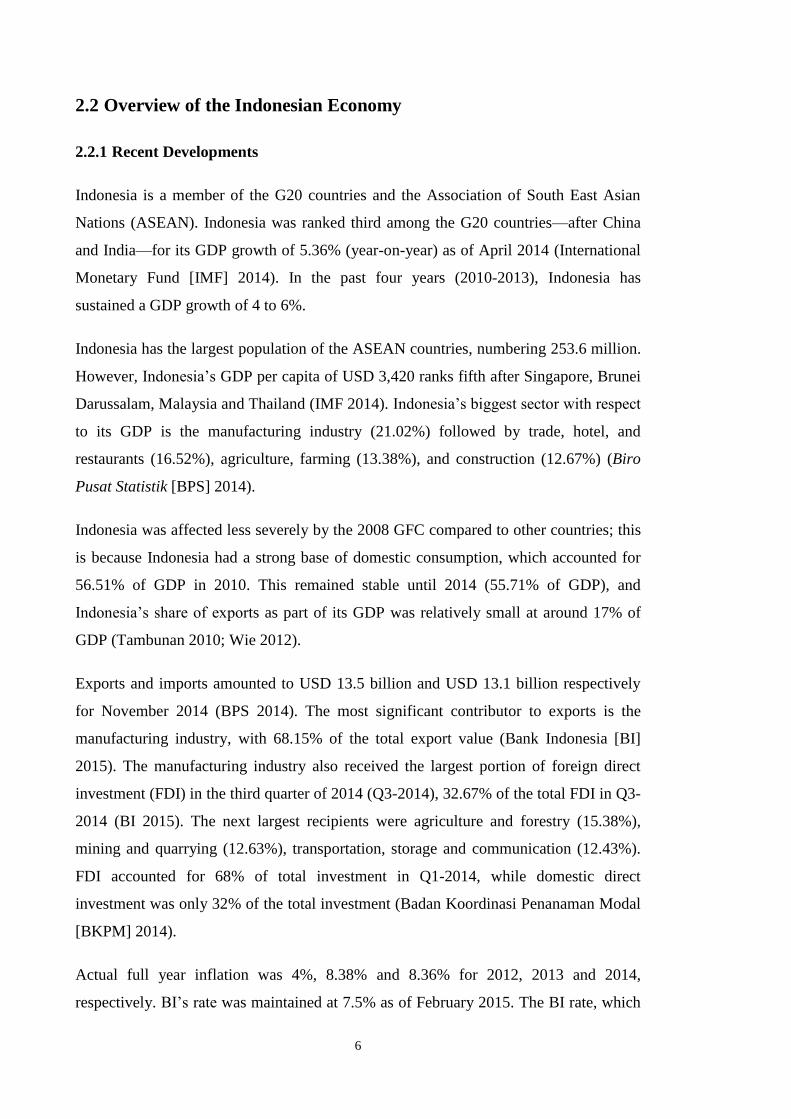
2.2.1 Recent Developments
Indonesia is a member of the G20 countries and the Association of South East Asian
Nations (ASEAN). Indonesia was ranked third among the G20 countries—after China
and India—for its GDP growth of 5.36% (year-on-year) as of April 2014 (International
Monetary Fund [IMF] 2014). In the past four years (2010-2013), Indonesia has
sustained a GDP growth of 4 to 6%.
Indonesia has the largest population of the ASEAN countries, numbering 253.6 million.
However, Indonesia’s GDP per capita of USD 3,420 ranks fifth after Singapore, Brunei
Darussalam, Malaysia and Thailand (IMF 2014). Indonesia’s biggest sector with respect
to its GDP is the manufacturing industry (21.02%) followed by trade, hotel, and
restaurants (16.52%), agriculture, farming (13.38%), and construction (12.67%) (Biro
Pusat Statistik [BPS] 2014).
Indonesia was affected less severely by the 2008 GFC compared to other countries; this
is because Indonesia had a strong base of domestic consumption, which accounted for
56.51% of GDP in 2010. This remained stable until 2014 (55.71% of GDP), and
Indonesia’s share of exports as part of its GDP was relatively small at around 17% of
GDP (Tambunan 2010; Wie 2012).
Exports and imports amounted to USD 13.5 billion and USD 13.1 billion respectively
for November 2014 (BPS 2014). The most significant contributor to exports is the
manufacturing industry, with 68.15% of the total export value (Bank Indonesia [BI]
2015). The manufacturing industry also received the largest portion of foreign direct
investment (FDI) in the third quarter of 2014 (Q3-2014), 32.67% of the total FDI in Q3-
2014 (BI 2015). The next largest recipients were agriculture and forestry (15.38%),
mining and quarrying (12.63%), transportation, storage and communication (12.43%).
FDI accounted for 68% of total investment in Q1-2014, while domestic direct
investment was only 32% of the total investment (Badan Koordinasi Penanaman Modal
[BKPM] 2014).
Actual full year inflation was 4%, 8.38% and 8.36% for 2012, 2013 and 2014,
respectively. BI’s rate was maintained at 7.5% as of February 2015. The BI rate, which

7
is a policy rate, has been maintained in the range of 7.50 to 7.75% since December
2013. This reflects BI’s stance to maintain a loose monetary policy.
Regarding the exchange rate policy, Indonesia has adopted a flexible exchange rate. The
exchange rate’s assumption for the 2014 government budget was around IDR
(Indonesian rupiah) 12,000/USD; however, as of 24 August 2015, the rupiah had
surpassed IDR 13,800/USD.
Indonesia has an increasing absolute value of debt from year to year amounting to IDR
2,576 trillion for 2014, of which the higher portion comes from the private sector
(Ministry of Finance [MOF] 2015). For the government debt, there is an upper limit of
3% of budget deficit as per Act No. 17/2003 on Public Finance. The reserve as of
September 2014 was relatively high (historically) at USD 111.16 billion. However, it
was the lowest compared to Japan, China, India, Malaysia, Thailand and Singapore; that
is only 2.86% from China’s reserves (BI (2015). As for the Indonesian rating, in 2011,
Standard & Poors (S&P) – a rating agency - increased Indonesia’s rating from BB to
BB+2. Other rating agencies, such as Japan Credit Rating Agency (JCRA), Fitch and
Moody’s have classified Indonesia into an investment grade rating category (i.e., BBB
[MOF 2015]).
Eradicating corruption has been one of the main agendas of President Susilo Bambang
Yudhoyono (SBY) and President Joko Widodo (Jokowi) (Dodd 2014). However,
perceptions of a high level of corruption still exist; for example in the Transparency
International (TI) index, Indonesia ranked 107 out of 175 countries in 2014 on the TI
Corruption Perception Index (TI 2014). Nevertheless, this is an improvement from the
ranking of 133 out of 145 countries in 2004, and being classified as the world’s third
most corrupt country in 2001.
2.2.2 Capital Market Development
Indonesia’s stock exchange was established in Jakarta in 1912 by the Dutch East Indies
government (Jakarta was then known as Batavia). It was closed several times during
both World War One (WWI) and Two (WWII). In 1977, President Soeharto re-activated
2 S&P use a rating scale from the highest to the lowest as follows: AAA, AA, A, BBB, BB, B,
CCC, CC, C and D for default. The ratings maybe noted with ‘+’ or “-‘ to show relative
standing within the categories.
8
the stock exchange. It was supervised by the Capital Market Supervisory Agency
(Badan Pengawas Pasar Modal). In 1989, the Surabaya Stock Exchange began to
operate, merging with the Jakarta Stock Exchange in 2007 to become the IDX. As of
February 2015, there were 506 companies listed in the market; the value of Jakarta
Composite Index was 5,223.29 on 7 April 2015 which was a historic high (Otoritas
Jasa Keuangan [OJK] 2015).
In the first week of 2015, Indonesian market capitalisation accounted for USD 414.26
billion, with a transaction volume of 42.70 billion shares (OJK 2015). The highest
market capitalisation was from the financial sector (19.54%), followed by the consumer
goods sector (19.54%), the infrastructure sector (14.10%) and the trade sector (11.91%).
The lowest value of market capitalisation occurred in the agricultural sector, with
3.10%.
The value of bonds outstanding was IDR 1,436.48 trillion, of which 84.23% of the total
value consisted of government bonds. For mutual funds, the net asset under
management was IDR 242.25 trillion in January 2015 (or approximately 5% of the total
assets of the banking sector). The highest valued mutual fund was the shares type, with
a value of IDR 103.31 trillion. This was followed by protected mutual funds (IDR 43.01
trillion), fixed income mutual funds (IDR 36.05 trillion), with lowest being syariah-
index mutual funds (IDR 0.14 trillion).
2.2.3 Business Landscape
In Indonesia, concentrated ownership of the largest companies in the hands of a few
families has been observed by Claessens, Djankov, & Klingebiel (1999). Claessens,
Djankov & Klingebiel (1999) note that the top 15 families in Indonesia owned 67.3% of
corporations prior to the 1997 AFC—a much higher figure compared to Thailand and
Malaysia (between 30–40%) and Korea (between 15–25%). This figure would be 82.5%
if state ownership were included. Djiwandono (2005) attributes this concentration to the
high use of non-performing loans (NPL) and the violation of legal lending limits during
the AFC. He further states that the situation is linked to corruption resulting from
institutional weaknesses such as ineffective corporate governance, legal and judiciary
systems.

9
This finding has been corroborated by Khanna and Yafeh (2007) and Sato (2004).
Khanna and Yafeh (2007) state that Indonesia has the largest fraction of firms classified
as a business group (two-thirds) among the various emerging countries for which data
were available for the period 1993 to 1995.3 Sato (2004) corroborates Khanna and
Yafeh (2007) and states that in 1996, of the top 100 listed companies, 58 were group-
affiliated, accounting for 70% of aggregate sales and 73% of aggregate assets. By 2000,
the number of group-affiliated companies in the top 100 listed companies had decreased
to 44, their shares had fallen to 56% and their shares in assets had fallen to 36% (Sato
2004). However, they have remained relatively significant up to the present date, as
indicated in the following table.
Table 2.1: Top 80 Business Groups in Indonesia
Rank Groups
Rev
($b) Rank Groups
Rev
($b)
1. Salim Group 13.2 41. Berca Group 0.85
2. Sinarmas Group 8.9 42.
Kompas Gramedia
Group 0.85
3. Djarum Group 8.5 43. Harita Group 0.83
4. Lippo Group 6 44. Sungai Budi Group 0.82
5. Gudang Garam Group 5 45. Sugar Group 0.78
6. Royal Golden Eagle 4.2 46. ABM Investama Group 0.75
7. Bakrie Group 3.5 47. Medco Energi 0.75
8. Adaro Energy 3.2 48. Musim Mas 0.7
9. Alfamart Group 3.1 49. Tempo Scan 0.67
10. CT Corpora 3.1 50. Harum Energi 0.65
11. Tiphone Mobile 3 51. Ramayana Lestari 0.65
12. Wings Group 2.4 52. Rekso Group 0.6
13 Triputra Group 2.3 53. Mayapada Group 0.6
14. Barito Pacific 2.3 54. Mulia Group 0.6
15. Charoen Phokpand 2.2 55. Sritex Group 0.59
16. AKR Corporindo 2.1 56. First Resources Group 0.57
17. Gadjah Tunggal Group 1.9 57. Modern Group 0.57
3 Business groups are defined as a set of legally-separate firms with stable relationship in multiple
strategically-unrelated activities and under common ownership and control by Cuervo-Cazurra (2006).

10
Rank Groups
Rev
($b) Rank Groups
Rev
($b)
18. Japfa Comfeed 1.9 58. Hadji Kalla Group 0.56
19. Kalbe Farma 1.84 59. Bank Bukopin 0.55
20. Gobel Group 1.8 60. Garuda Food 0.52
21. Panin Group 1.53 61. Rodamas group 0.52
22. Indorama Synthetics 1.52 62. Emtek Group 0.5
23. Argo Manunggal 1.5 63. Santini Group 0.5
24. Mayora Indah 1.2 64. Supreme Cable 0.49
25. ABC Group 1.2 65. Toba Bara Group 0.48
26. Wilmar Group 1.1 66. Samudera Indonesia 0.48
27. Indika Energy Group 1.1 67. Fajar Paper 0.45
28. Bosowa Group 1 68. Lautan Luas 0.42
29. TNT Group 1 69. Agung Podomoro 0.41
30. MNC Group 1 70. Summarecon 0.41
31. Tunas Ridean 0.99 71. Sriwijaya Air 0.42
32. Lion Air Group 0.99 72. Maspion Group 0.36
33. Arsari Group 0.99 73. Kawan Lama (ACE) 0.35
34. Persada Capital Group 0.98 74. Pan Brothers 0.34
35. Trikomsel Group 0.93 75. Fast Food Indonesia 0.32
36. FKS Multi Agro 0.9 76. OSO Group 0.3
37. Gunung Sewu Group 0.89 77. Rajawali Group 0.28
38. Sintesa Group 0.88 78. Artha Graha Group 0.28
39 Darmex Agro Group 0.86 79. Sumi Indo Kabel 0.27
40. Ciputra Group 0.86 80. Total Bangun Persada 0.16
The table above is modified from the 100 top groups published by the Globe Asia
magazine August 2015 edition, using revenue in USD billion for 2015. I have excluded
foreign-owned business groups such as Astra/Jardine, Sampoerna/Philip Morris,
Danamon/Temasek, CIMB Niaga/Khazanah and Indosat/Qatar Telecom, as the focus of
this study is on locally owned business groups.
The largest business group in Indonesia prior to the AFC was the Salim Group. The
Salim Group remains one of the largest groups today. According to Globe Asia, it
ranked second after Astra in the top 100 groups, with a combined revenue of USD13.2
billion as of August 2015. It is still ranked number one. The Astra Group has been
11
excluded, as it is owned by the Jardine C&C Group of Hong Kong (as seen in the above
table). This ranking may change over time as some of the business groups’ fortunes are
linked to the commodities cycle; nevertheless, these business groups represent some of
the largest and most prominent business groups in Indonesia.
The AFC formed a watershed period that brought the IMF to Indonesia, where it
implemented various measures of austerity that affected business groups. Through
IBRA (Indonesian Banking Restructuring Agency), many business groups de-
concentrated and focused on their core competencies (Basri & van der Eng 2005). Salim
Group chose to maintain their core businesses (i.e., food and beverage businesses
[Indofood and Bogasari]). They devolved their ownership of virtually every other
business to IBRA, including stakes in leading automotive, cement and coal companies
and the Bank of Central Asia (BCA). Sinarmas Group remained relatively intact during
the AFC, as did Lippo group. However, Sinarmas Group had to declare the largest
private sector debt default in 2001. Bakrie Group had owned businesses ranging from
steel pipe, plantation, real estate and financial services such as banks, securities and
insurance. They lost almost all their financial services companies. The other companies
remain part of the Bakrie Group, but are now much smaller relative to their thermal-coal
businesses acquired from BHP Billiton after the AFC. Some business groups did not
survive the AFC at all, such as the Dharmala and Nusamba/Bob Hasan groups.
Yuri Sato has studied various business groups in Indonesia, along with their origins and
strategies. Sato (1993) has examined Salim Group’s expansion and transformation
processes. This group is one of the largest business groups in Indonesia. Sato (1996) has
also examined the Astra Group, emphasising how they have developed their
management system, and are now considered the pioneer of management modernisation
in Indonesia. Sato (2004) has found that business group affiliation and borrowing
behaviour resulted in performance differences among companies. Group-affiliated
companies had higher leverage before the AFC and suffered heavily during this crisis.
Firms affiliated with established groups had higher indebtedness, but also higher returns
of equities (ROE) before the crisis and were likely to survive the crisis. In contrast,
firms affiliated with rapid-growth groups had the lowest profitability and suffered most
from the AFC.

12
Lukviawarman (2004) has studied the relationship between ownership structures,
monitoring and firm performance in Indonesia using the agency theory of contractual
relationship among various parties. He found that the existence of controlling
shareholders in the hands of a family was a source of corporate governance problems.
Using the same agency theory, Prabowo (2010) studied the composition of boards of
directors on firm performance in Indonesia. Independent leadership was found to have a
positive relationship with firm performance. Prabowo (2010) also found that
shareholding by controlling owners had negative associations with firm performance.
Corporate diversification has many causes. Claessens et al. (1999) have argued that
firms diversify to create internal factor markets that are most cost-effective in allocating
resources when compared to external markets. One stream of research views business
groups as responses to market failures and associated transaction costs (Leff 1978). This
has been supported by Khanna (1999, 2000). These researchers have argued that
business groups can serve as functional substitutes to fill the ‘institutional voids’ in
emerging economies. Khanna and Yafeh (2007) have argued that as groups arise for
different reasons and in different environments, their effect on social welfare is
unambiguous; groups may sometimes play a positive role by making up for
underdeveloped economic institutions (Khanna 1999, 2000). However, they can also be
detrimental for social welfare due to rent-seeking or monopoly power (Fisman 2001;
Mobarak & Purbasari 2005).
2.3 Overview of Indonesia’s Political System
2.3.1 Recent Developments
After President Soeharto stepped down in 1998, there was a significant improvement in
Indonesia’s democratic system including free elections and freedom of expressions in
the media.
In 2004, SBY and Jusuf Kalla were elected as president and vice president through
direct election. This was Indonesia’s first direct election of a president. In addition, the
military’s power was diminished: they no longer had seats in parliament and separation
between the police and military forces was established.

13
President SBY was again elected in the next presidential general election in 2009, with
Budiono as vice president. According to Marcus Mitzer (of the Lowy Institute in
Sydney, Australia), President SBY’s popularity resulted from several factors. These
include the distribution of massive cash programs for the poor and a strong perception
by Indonesian society that the national economic condition had improved compared to
the preceding year.
Notwithstanding SBY’s popularity, public support for him decreased during his second
term in office. This lack of support was indicated by his reduced approval rating: from
85% after his election to 66% by October 2010. This posed little problem for SBY, as
the constitution barred the president from entering a third round of elections. This
decline in popularity was due to the controversial Bank Century bail out, which ended
with the departure of the Minister of Finance, Sri Mulyani Indrawati. Some have argued
that Indrawati’s departure was beneficial for Aburizal Bakrie from Golkar (a key
coalition party of SBY’s Democratic Party), since this might have strengthened Bakrie’s
position for the 2014 presidential election (Vaughn 2011). However, as we will see
below, Bakrie did not make the final round of the 2014 presidential elections.
In 2014, Indonesia held a general election to elect legislative members, the president
and vice president. The legislative election was first held on April 2014; for this, the
party with largest number of supporters would propose the presidential and vice
presidential candidates for the election in July 2014. The result from the legislative
election was as follows: Partai Demokrasi Indonesia Perjuangan (PDIP) party was the
first winner with 23, 681, 471 supporters, Golkar party held second place with 18, 432,
312 supporters and Gerindra party had 14, 760, 371 supporters (Komisi Pemilihan
Umum [KPU] 2014).
The last presidential election in 2014 saw the popular former governor of Jakarta—Joko
Widodo (Jokowi)—and Jusuf Kalla (both proposed by PDIP Party’s coalition) winning
the election by 53.15% against Gerindra’s chairperson Prabowo Subianto and his
running mate from Partai Amanat Nasional (PAN) Hatta Rajasa, who obtained 46.85%
of the votes (KPU 2014).
There are 34 ministers under President Jokowi’s cabinet, the so-called ‘working cabinet’
(Parlina & Widiarto 2014). During his 100 days in government, Jokowi was criticised
14
for some of his policies, such as those that increased fuel prices. This was accompanied
by the distribution of the Kartu Indonesia Sehat (KIS or Indonesia Health Cards), Kartu
Keluarga Sejahtera (KKS or Prosperous Family Cards) and Kartu Indonesia Pintar (KIP
(KIP or Indonesia Smart Cards) as compensation to low-income people. More recently,
there have also been critiques about the president’s ability and commitment to
combating corruption in Indonesia in relation to the conflict between the police and the
Corruption Eradication Commission (Sidjabat 2015).
2.3.2 Brief History of the Political System
2.3.2.1 The Soekarno Era
The influences of Hinduism, Buddhism, Islam, Dutch colonial rule and powerful
nationalistic independence movements—along with other cultural and external
influences—have shaped Indonesia’s political system. Indonesia was occupied by the
Dutch for three-and-a-half centuries. Dutch colonial rule shaped the current
geographical make-up of contemporary Indonesia. The Dutch colonial period ended
when the Japanese arrived in 1942. During WWII, making the most of the momentum
of Japanese surrender in 1945, Indonesia proclaimed her independence on 17 August
1945. Two central figures in this proclamation were Soekarno and Mohammad Hatta,
who became Indonesia’s first president and vice president (respectively). In its early
period of independence, as stipulated in Indonesia’s 1945 Constitution, the country
practiced a presidential system of government. This system was characterised by a clear
separation between the executive and legislative functions. In addition, this system
provided checks and balances to safeguard the government. At the same time, the
legislative body possessed the right to dismiss the president. According to Noor (2008),
Indonesia practiced a pure presidential system of government characterised by: (1) the
president as head of government; (2) the president having a fixed tenure of five years;
(3) the president not being accountable to the legislative body; and (4) the president
having no mandate to dismiss the legislative body. Further, Noor (2008) has asserted
that Indonesia implemented a hybrid system of government in that period, which
incorporated both a presidential and a parliamentary system. The evidence supporting
this argument is that the president was accountable to Majelis Permusyawaratan Rakyat
(MPR or People’s Consultative Assembly) as legislative body in which MPR had the
authority to enact laws.
15
Indonesia experienced a parliamentary system by enacting legislations on 14 November
1945 and a federal system by enacting legislations on 27 December 1949. A substantial
instability existed in the government and political system during this period, which was
characterised by the rise and fall of cabinets in the parliament within short periods;
hence, the parliamentary system was not successful in contributing to Indonesia’s
political stability. President Soekarno then embarked upon Guided Democracy from
1959; this lasted until 1965, with a coalition of mutually hostile nationalists,
communists and religious groups. This period was marked by high levels of government
intervention in the economy, excessive debt, high inflation and low growth. Political
groups competed fiercely and the threat of disintegration was always present (Cassing
2000).
2.3.2.2 The Soeharto Era
President Soekarno was forced to step down when Indonesia was threatened by the
military rebellions of Partai Komunis Indonesia (PKI or the Communist Party of
Indonesia. These rebellions forced President Soekarno to be eased out of power and
gave Soeharto the opportunity to consolidate his own position as Indonesia’s ruler over
the next 32 years. As the ruler, Soeharto had exceptional power and authority over
almost every aspect of life, including politics, the economy and the military. The Golkar
party was the consistent winner of general elections. Cassing (2000) has maintained that
Soeharto gained full support from the military and the broad backing of society. Further,
Cassing (2000) explains that Soeharto’s strategy was to compete with the executive
office for a power that created limitations on political discourse and isolation for the
political opposition. Soeharto did not believe in political competition and openness. The
function of cabinet ministers was to execute the policies of the president with no
political power of their own. As Cassing (2000, p.160) argues:
[S]oeharto eliminated political competition and that this in particular allowed for the
creation of a mercantilistic economic environment akin to 16th century England and
France.
Seda (2005) has asserted that pervasive patrimonalism was an embedded characteristic
of Soeharto’s regime, in which Soeharto gained his exceptionally strong political power
through his efforts to ensure the loyalty of key sections of the political elite. This was

16
done by satisfying the political elite’s interests, mainly material interests. The finances
for servicing this aspiration and interest were derived from the country’s oil boom
revenue in 1973, which gave the country abundant prosperity. This abundant prosperity
had allowed Soeharto to patronise his supporters and simultaneously threaten his
opponents. This gave him the opportunity to maintain his power and transform the
bureaucracy into an instrument of presidential power. As a consequence, there was a
high concentration of power in Soeharto’s hands.
As part of a strategy to patronise his supporters, Soeharto also allowed key government
officers to grant licences for certain economic activities. These officers were thus
enabled to extract financial resources from private parties. It was not only the
government officers who gained substantial benefits from Soeharto’s strategy.
Soeharto’s associates, including Chinese businessman Liem Sioe Liong, along with Bob
Hasan and his children, also obtained facility in the form of monopolies over the import
and distribution of major commodities. These associates and their families were given
the facility to become involved in projects: they won several large government projects
financed by state-owned banks with low interest rates. Unfortunately, some of these
loans defaulted, forcing the banks to collect payments (Schwarz 2004). Soeharto’s
pervasive patrimonialist strategy resulted in the elimination of political competition and
increased the concentration of power to a small group of people; in addition, it resulted
in a set of rent-seeking incentives,4
which ultimately shaped regulation in the
Indonesian economy (Cassing 2000).
In terms of economic policy, as per Seda (2005), Soeharto’s strategy was influenced
considerably by two groups: technocrats (market-oriented), most of whom were in the
Badan Perencanaan Nasional (BAPPENAS or Central Planning Bureau) and MOF, and
the nationalists (government planning-oriented), most of whom were in the Ministry of
Trade and Industry and the State Ministry of Research and Technology. The
technocrats, led by Prof. Widjojo Nitisastro emphasised market mechanisms when
overseeing the national economy. Policies included market deregulation and
privatisation of state assets to foster economic growth. In contrast, the nationalists
emphasised the role of government in conducting the national economy. Their policies
4 Rent-seeking is defined as ‘the activities whereby individuals seek return from state-sanctioned
monopoly rights’ (Ekelund & Tollison 1981).

17
encouraged the maximisation of state resources to build and strengthen domestic
markets. The nationalist group argued that the government should implement import
substitution policies and allocate more resources to high-tech state enterprises.
Generally, the direction of development strategies in Soeharto’s era was dependent on
the state of the economy. In periods of economic boom, the nationalists’ strategies were
implemented, while in times of economic stagnation, the technocrats’ strategies were
preferred.
In terms of natural resources management, Soeharto attracted foreign companies to
participate in extracting Indonesia’s natural resources, ascribing this approach to
Indonesia’s insufficient technology and capital (Seda 2005). To facilitate foreign
companies’ participation in the extraction of Indonesia’s natural resources, Soeharto
initiated important laws pertaining to foreign investment. These laws include: (1) Law
1/1967 on foreign investment, which stipulates clear procedures for foreign operations
in Indonesia; (2) Law 5/1967 on forestry, which stipulates that all forests fall under the
control of the state, and (3) Law 11/1967 on mining, stating that all lands within the
Republic of Indonesia could be used for mining. As a result of enacting the laws, a large
number of multinational companies have participated in natural resources extraction in
Indonesia (Seda 2005).
During the 1970s, oil became Indonesia’s main export and the primary source of
government revenue. However, this changed with the collapse of oil prices in the 1980s,
leading to budget deficits for Indonesia. The international oil price decreased from USD
38 per barrel to USD 12. This decline reduced the portion of oil and gas exports from
USD 18.4 billion (82% of total exports in 1982) to USD 8.3 billion (56% of total
exports in 1986). On the fiscal side, the decrease in oil prices resulted in decreased
government revenue from the oil and gas sectors: from IDR 8.6 trillion to IDR 6.3
trillion, or from 70% to 39% of total revenue (Robison & Rosser 1998).
This budget deficit required corrective action. One proposed action was trade
liberalisation to allow for a more diversified, manufacturing-based economy. However,
this proposal raised new problems for Soeharto, as trade liberalisation would have
required the relaxation of some trade barriers; in turn, this would have reduced the
monopoly power of Soeharto’s associates through import substitution. This dilemma
resulted in some misguided and crucial policies such as policies of granting monopolies
18
of car imports and toll roads to the family member of Soeharto (Cassing 2000).
However, economic structural adjustment appeared to be the only choice. To reduce the
Indonesian budgetary reliance on oil and gas and to encourage labour intensiveness, the
government deregulated trade, finance and investment. This corrective action was
effective, shown in the increase of non-oil and gas exports exceeding oil and gas
exports. Indonesia’s national economy had started to recover by the beginning of the
1990s.
Another economic shock came in the late 1990s, as a result of insufficient regulation
and prudence and the control mechanisms necessary to conduct liberalisation policies.
Although most macroeconomic variables signalled a healthy economy, corruption and
favouritism in the industrial and financial sectors meant that the economy was not as
strong and stable as it seemed. For instance, banking deregulation made it much easier
to establish new banks by lowering capital requirements substantially and opened up
new licenses and branches. This relaxation stimulated banks to expand their credit,
increasing the money supply by up to two-and-a-half times in three years. This
condition worsened when banks began lending large sums of public money to the
banks’ owners or to their associates for unfeasible projects (Cassing 2000). This
banking sector deregulation has been considered a fundamental policy mistake. In
addition, the decision to implement the nationalists’ idea to give government support for
large state enterprises was inefficient as only few of these state enterprises performed
well. In the absence of strong economic performance, the Indonesian economy
collapsed when the AFC struck in 1997, when Soeharto was forced to step down.
2.3.2.3 The Reformation Era
Soeharto’s fall was followed by a major transformation in all aspects of Indonesia’s
politics and economy. This period of reform (known as reformasi) involved the
economy, political sphere, bureaucracy and government regulations. Confidence
improved regarding the opportunities to foster democracy in Indonesia. Soeharto was
succeeded by President BJ Habibie (1998–1999), Abdurrahman Wahid (1999–2001),
Megawati Soekarno Putri (2001–2004), SBY (2004–2014), and Joko Widodo (2014-
2019).

19
A number of key reforms have been designed to enhance good government practices
and to increase the quality of Indonesia’s democracy. For example, in the political
system, the power divided between the president (as the executive body) and the
parliament (as the legislative body) has been balanced through the acknowledgement of
new political parties and their right to participate in general elections, prescribed by
Law 2/1999 and 31/2002. With regard to fiscal policy, the enactment of Law 22/1999
on local government and Law 25/1999 has allowed a more balanced budget allocation
between the central and regional governments (Resosudarmo 2005). Based on these
laws, the central government is mandated to transfer increased authority to provincial
and district level governments (Vaughn 2011). Along with the expectation that this
transformation will enable Indonesia to achieve long term development, this radical
change also raises negative effects such as political uncertainty, inconsistent laws and
regulations, weak law enforcement and a weak governmental system (Vaughn 2011).
The Abdulrahman Wahid presidency, which was followed by that of Megawati, did not
produce many reforms; the main party that supported Wahid held a minority in the
parliament. In fact, all governments post-Soeharto, including SBY’s (2004–2014)
government, have been based on the so-called ‘rainbow coalition’: SBY’s Democrat
Party also did not win a majority of seats. SBY’s government post-2009 consisted of six
out of the nine parties in parliament. This created a dominant among perception within
Indonesia’s mainstream literature regarding ‘cartelisation’ tendencies, borrowing from
the work of Katz and Mair (1995), and as elaborated here by Mietzner (2013, p.3):
[c]ontemporary political parties no longer compete with each other but form collusive
alliances to jointly exploit state resources.
Despite this, Mietzner (2013) argues there is little evidence that cartelisation was indeed
the main feature of post-Soeharto era politics.
Resosudarmo (2005) has noted the immediate effects of reformasi and the
implementation of the decentralisation policy. First, there was an increase in conflict
between central and local governments due to a lack of harmony among various levels
of government. There was a sense of competition regarding the dominance of both
central and regional governments. Second, a number of local conflicts involved both
disputes between local communities and the state, along with disputes among local

20
communities themselves. These types of conflicts had increased in particular due to
competition over obtaining the rights to exploit natural resources. Third, a change in the
nature of corruption existed, in which a centralised corruption was replaced by a more
fragmented and widespread bribe-collection system. Fourth, there was tendency of the
regional governments to raise revenue through nuisance taxes such as regional taxes
levied on the consumers payable to the local government on top of central government
taxes and resource licences.
2.4 Politics and Business in Indonesia
2.4.1 Introduction
The Indonesian business landscape has been characterised as ‘ersatz capitalism’
(Yoshihara 1988), ‘crony capitalism’ or ‘patron-client’ (Muhaimin 1991). Yoshihara
(1988) has defined Indonesia’s economy as ‘ersatz’ since the Indonesian economy has
been dominated by foreign capital, Chinese capitalists, rent-seekers, crony capitalists
and bureaucratic capitalists. The patron-client concept resulted from ‘neo-
patrimonialism’, a concept that originated in Max Weber’s patrimonialism (Muhaimin
1991). Muhaimin (1991) used this patron-client framework in his thesis on politics and
business in Indonesia.
Soeharto, Indonesia’s second and longest serving president (1968–1998) did not begin
the patron-client system. During Sukarno’s regime (1945–1968), business people also
enjoyed special favours. However, during Soeharto’s regime, politics and business
became much more closely intertwined (Borsuk & Chng 2014). Such links between
politics and business—especially during Soeharto’s regime—were well documented by
the ground-breaking works of Muhaimin (1991), Shin (1989), Yoshihara (1988),
Robison (1986) and a biography on Liem Sioe Liong’s Salim Group by Borsuk and
Chng (2014).
After the Soeharto era, exclusive import licences and monopolies for certain companies
or business groups were dismantled by the IMF. An era of democracy had begun. The
regime adopted civilian rule under Habibie (1998–1999), Abdurrahman Wahid (1999–
2002), Megawati (2002–2004) and SBY (2004–2014). Having political connections no
longer had the same effect. The excess and easy profits from exclusive import licences
21
and monopolies that had resulted from political connections in the past were no longer
the modus operandi. The manifestations of these relationships were less blatant.
Nonetheless, the links between business and politics in Indonesia post-Soeharto
continue and even flourish, despite democratisation, decentralisation and deregulation
(Chua 2008).
Previous studies examining the links between politics and business in Indonesia can be
categorised in general as examinations from the perspective of political economists,
such as works by Shin (1989) and Robison (1986) or socio-historical-cultural works,
such as those by Borsuk and Chng (2014), Backman (2001), Muhaimin (1991) and
Yoshihara (1988). In the following sections, I will first examine the mechanisms of how
the state apparatus can take advantage of its position for rent-seeking. I will then discuss
the possible causes of this intertwining of politics and business in Indonesia: oligarchy,
culture and government intervention.
2.4.2 The State and Rent-Seeking
Despite a decline in its power, the presidency remains the most contested position in
Indonesia, due its central role in the budgeting, law-making and economic planning
(Mietzner 2013). Accordingly:
[t]ycoons have continued to seek the president’s favour by offering financial
inducement (Mietzner 2013, p.75).
The second most coveted position is that of a minister. Besides a ministerial budget and
the managerial autonomy that comes with it, a ministry has the power to implement
policies such as determining quotas for imports of certain commodity. This has
provided ample opportunity for patronage from the Soekarno era to the present day
(Mietzner 2013).
Being a member of parliament (MP), especially in the post-Soeharto era, is a lucrative
position that is contested heavily. The ability to draft laws and influence any proposed
legislation can encourage MPs to use their institutional powers to advantage (Mietzner
2013). For example, the parliament has to approve government-proposed budgets.
‘Budget scalping’—the insertion and or approval of certain projects in exchange for
kickbacks from businesspeople—has been observed and identified as a very serious
22
phenomenon (Mietzner 2013). MPs have also been accused of accepting kickbacks to
block or approve certain points in proposed legislation (Mietzner 2013). For example,
Mietzner (2013) mentions a certain paragraph that was disadvantageous to the tobacco
industry that suddenly disappeared from proposed legislation on the tobacco industry.
Yoshihara (1988, p.87), as far back as the late 1980s, has argued that:
[d]emocracy has not necessarily done better than dictatorship; it too has created many
rent-seekers, although the use of government connections for business is not as
blatant as under dictatorship.
One major problem with democracy is that politicians need funds to run for office and
they turn to business people as their main source of capital.
2.4.3 Oligarchy
Winters (2014) mentions that Indonesia has followed a typical capitalist development,
whereby ‘a small number of ultra-wealthy citizens at the top are rapidly pulling away
from the rest’ (Winters 2014, p.11). He further notes that extreme inequality in wealth
brings with it extreme inequality in politics. Oligarchy theory captures this relationship
best, as wealth is the most potent of power resources. Oligarchs are ‘actors empowered
by wealth’ (Winters 2014, p.14). Winters’ theory was derived from power resources
theory, and wealth as one of the powers.
Winters (2011) further typifies four ideal oligarchies according to whether oligarchs are
armed or disarmed: warring, ruling, sultanistic or civil. Indonesia has been classified ‘as
a classic example of ‘sultanistic oligarchy’ under Soeharto’ (Winters 2014, p.15). The
emergence of a wealthy stratum in Indonesia began mostly during Soeharto’s time in
office. To maintain one’s wealth, one had to be in the proximity of and aligned with
Soeharto. Since 1998, Indonesia had been ruled by an electorally chosen oligarch. In
concluding his analysis, Winters (2014) was not optimistic regarding the potential of the
law to constrain oligarchs in Indonesia as they will not impose punitive legal constraints
on themselves. The core of oligarchy is the politics of defending wealth. Post-Soeharto,
Indonesian oligarchs have used their ‘material power for wealth and property defence in
a political economy overflowing with threats and uncertainties’ (Winters 2011, p.192).
Another seminal work on oligarchy in Indonesia is a study by Robison and Hadiz
23
(2004). Robison and Hadiz approached the oligarchs as a class and examined the
collective nature of their behaviour in pursuit of authority; hence, this is more of a neo-
Marxist approach. However, both works note that democratisation has changed
Indonesian politics but has not eliminating oligarchic rule (Ford & Pepinsky 2014).
Hadiz and Robison (2014) argue that up to the current era, over a decade after Soeharto
resigned, a close proximity to public officials is still how the private sector accumulates
its wealth. Social and economic power has been reorganised but largely remains the
same. The same names continue to dominate politics and business in contemporary
Indonesia.
2.4.4 Culture
Some scholars try to identify culture as a reason for the intertwining of politics and
business in Indonesia. Indonesian culture, dominated by Javanese culture, inhibits risk
taking; hence the indigenous population aspires to become civil servants, bureaucrats or
to join the military. In contrast, Chinese Indonesians have little choice but to go into
business. During Soeharto’s era, no Chinese Indonesians became ministers (except for
Bob Hasan; Soeharto’s ‘crony’ was appointed to a ministerial role for a brief period at
the end of his reign), top bureaucrats or top military officers. This fact aligns well with
the culture and nature of the Chinese who are perceived as hardworking, and who have
business networks within and beyond Indonesia for sources of capital (Yoshihara 1988).
A mutual relationship has evolved to a point where patron-client relations (as per
Weber’s concept) have developed and where Chinese businesspeople ‘were co-opted
and subjugated during Soeharto era’ (Chua 2008).
Indonesia’s economic performance has been attributed to Chinese minorities (Yoshihara
1988). Yoshihara (1995) attributes the success of the rent-seeking Chinese ‘ersatz
capitalists’ to culture of a lack of strong work ethics. By a lack of strong work ethics
Yoshihara means that the value orientation of the indigenous population emphasised
leisure and adaptation to nature. Moreover, he claims that indigenous Indonesians have
a built-in bias against plain money-making and towards the non-materialistic aspects of
life (Yoshihara 1995).
‘Chineseness’ has been compared with Protestantism and European capitalism, in that
they hold similar values regarding materialism, an emphasis on education, obedience,
24
handwork and thrift (Mackie 1998). Mackie (1999) claims that the Chinese have the
capabilities as well as incentives for commercial success due to their values and culture
cause the Chinese. Mackie (1989, p.99) cites their ‘strong motivation to succeed’, or
even ‘the widespread Chinese propensity towards gambling’ as the traits that enabled
them to flourish in business.
Culturally based premises, such as trust (xin yong) and connection (guanxi) have been
cited to explain the widespread influence of Chinese businesspeople in South East Asia
(see Backman 2001; Menkhoff & Gerke 2002; Tan 2000; Wu 2000); however, typically
they take guanxi (connections) as just another characteristic trait of ethnic Chinese
(Backman 2001; Wu 2000).
Soon after Soeharto came into power, Chinese capital was welcomed and was treated
more and more as domestic capital. As a result, the Chinese expanded into various
fields the new economic policy had opened up (Yoshihara 1988). During Soeharto’s
New Order regime, the interests of the rulers and Chinese capitalists were aligned; links
to state officials as patrons were critical for the emergence of business groups and
crucial for further capital accumulation (Chua 2008).
During the Soeharto era, Soeharto had virtual power, maintaining that power through
authoritarianism, centralism and collusion (Chua 2008). Chua (2008) has claimed that
the Soeharto regime’s key component was the subjugation of capitalists, who were
mostly of Chinese descent. They were ‘outcast’ from politics, and ‘thus [became]
appropriate partners to be raised and co-opted as compliant partners’ (Chua 2008).
Muhaimin (1991) argues that the intense involvement of Indonesian officials (inside and
outside the government and parliament) in business during Soeharto’s era was derived
from patrimonial relations in the Indonesian political system and the attitude of the
bureaucratic political elite who upheld traditional values. Traditionally, the ‘surplus’
from important economic sectors was distributed to civilian and military officials. This
tradition forced business people to take patronage from the elite.
The other factor in the involvement of Indonesian officials in business was the pattern
of personal relationships. This aspect was deeply rooted in Javanese culture. In
Indonesian society, the patron-client relationship (paternalism) was very dominant, with
needs and dependence always present. As noted in Muhaimin (1991), Indonesian
25
cultural values (unlike those of the Chinese) inhibit economic behaviour that is crucial
in the private sector, such as risk taking. Indonesians prefer to work as bureaucrats or
civil servants: as the patrons. Muhaimin (1991) has even concluded that the patron-
client structure will probably still be characteristic of Indonesian business in the future.
However, some scholars have rebutted this cultural interpretation of Chinese business
success and have instead offered a structuralist interpretation. These scholars include
political scientists such as Shin (1989), Macintyre (1990), Winters (1996) and Rosser
(2002). According to these scholars, analysing the structure of Indonesia’s political
economy will give insights into state-capital power relations. They focus on state-
business relations, patron-client relationships, political partnerships and the composition
of certain conglomerates and business groups.
Robison (1986) has offered a class analysis based on the assumption that modern
societies are characterised by class divisions, with capitalism as their main driving
force. Chinese business people form just such a capitalist class. In the same vein, Shin
(1989) has attempted to identify and characterise the new capitalists who are largely of
Chinese descent, with some being pribumi (indigenous Indonesian), emerging from
Soeharto’s era. However, Shin (1989) maintains that these capitalists have failed to
form a capitalist class due to factional politics and bureaucratic interests. He proposes
that they will mature to form a new capitalist class, as they have been subjugated and
subordinated to state managers thus far.
Chua (2008) has described Soeharto’s New Order as bureaucratic capitalism, in which
the state elite has managed to preserve both its autonomous appropriation of the state
apparatus and its hegemony over the capitalist class. Chua (2008) goes on to argue that
the post-Soeharto Indonesian state is moving towards a plutocratic capitalist regime,
where capital finally has the best opportunity to exercise structural and even
instrumental control over the state.
In the past, politicians have treated Chinese business people ‘like minor wives—
enjoyed but not recognized’ (Wanandi 2013, p.127)). However, after Soeharto era, Chua
(2008) has argued that Chinese tycoons have benefitted most from the democratisation,
decentralisation and deregulation efforts. The new regime could not do without Chinese
capitalists as they are economically indispensable to an Indonesian economy that is

26
emerging from a deep crisis. The major business groups have survived, and have even
helped determine the course of post-Soeharto Indonesia; perhaps they will rise to a more
overtly dominant position within the ruling alliance (Chua 2008). The capitalists in
post-Soeharto Indonesia have become more assertive (Chua 2008). Some of them have
even set up their own political parties. The link between politics and business does not
appear to have weakened in the post-Soeharto era. As Eklof (2001, p.243) states:
[t]he relationship is symbiotic, as business has much to gain from influencing the
political process and politicians often desperately need funds for their political
activities.
2.4.5 Government Intervention
In East Asian Miracle (Page 1993), the success of East Asian countries (including
Indonesia) was attributed to accumulation of physical and human capital and a free
market economy with selective intervention policies. However, The World Bank has
acknowledged that such interventionist policies have created rent-seekers (Page 1994).
Government intervention has resulted in some inefficiency and rent-seekers, particularly
as in Indonesia the intervention was low quality (Yoshihara 1988). A nationalistic pro-
pribumi policy has created many rent-seekers among the pribumi, while the Chinese
have had to seek protective patrons among political power holders (Yoshihara 1988).
Jomo (2001) has said that in Indonesia, government intervention seems to have been
influenced by rent-seeking considerations, and this has undermined industrial policy
initiatives. Some examples of this include:
high-tech investment in developing an aircraft industry in the 1990s,
spearheaded by Habibie, then Minister of Research
a so called “national car policy” that was awarded to Soeharto’s son so that he
could import cars and their components at very favourable import taxes
a monopoly in the trading and importation of cloves to Soeharto’s son.
Besides the close family and supporters of Soeharto, various family business groups
linked to Chinese businessmen have enjoyed various interventions. The most notable of
these is the Salim Group. These interventions included a ‘bail out’ of the Salim Group’s
27
cement company—Indocement—when it faced financial difficulties (Borsuk & Chng
2014).
Various governments under Sukarno paid considerable attention to assisting indigenous
business people, to reduce the perceived dominance of the Chinese in business,
introducing policies that discriminated against the Chinese (Borsuk & Chng 2014).
Indonesia’s economic structure was dominated by foreign companies and Chinese
traders at the outset of the country’s 1945 independence, following 344 years of Dutch
colonial rule (Muhaimin 1991). Western capital first moved into South East Asia mainly
to produce primary commodities. The first major export of the period was sugar
(Yoshihara 1988).
Government intervention had begun as early as one year after the Dutch officially
sanctioned Indonesia as an independent country. A nationalistic policy called the
Rencana Urgensi Perekonomian (RUP or Economics Urgency Plan) was established to
change the colonial economic structure (Muhaimin 1991).
RUP was followed by the Benteng program in 1955. This program was clearly aimed at
protecting and fostering middle class pribumi business people from the perceived
dominance of foreign and Chinese capital in the economy. It did this by reserving
import licences for their (that is, the non-Chinese) exclusive use, along with giving them
loans and facilities. The government provided import licences for certain easily
distributable items, such as cloves for kretek cigarettes, loincloth for batik, the
allocation of foreign exchange; the government also gave aid in the form of credit that
was only for pribumi business people (Muhaimin 1991).
The Benteng program granted licences to pribumi business people who enjoyed close
ties with power holders and the military, but were unable to benefit from this due to a
lack of capital and expertise. Indonesian economic historian Wie (2012, p.8) has
commented that:
[t]hus Indonesia’s experience with its first affirmative programme to promote a strong
and self-reliant indigenous business class proved to a failure.
Further discrimination against Chinese business people came with the adoption of
government regulation PP10 1959 (Peraturan Pemerintah No. 10 of 1959). This
28
regulation banned ‘alien Chinese’ from retail trade in rural areas. This resulted in an
estimated movement of 120,000 Chinese people back to China (Borsuk & Chng 2014).
The RUP and the Benteng program have been accused of abuses. As Muhaimin (1991,
p.85) has said:
[a]ll cabinets which started from 1950 until March 1955 were accused had given
favoritism basic import licenses’ (p.82). So, ‘in this context, an official became
valuable patronage source that could be used to gather political support’.
The patron-client phenomenon has been observable in Indonesia’s contemporary
politics and business dealings since this time.
Soekarno’s Guided Economic Period (1957–1965) welcomed neither foreign capital nor
traditional Chinese small traders in rural areas (Muhaimin 1991). During this time, more
focus was placed on developing state-owned enterprises (SOEs) in an Indonesian
version of socialism. The government prioritised state enterprises over private ones.
Another consequence of this Guided Democracy was the emergence of business people
who enjoyed patronage (Muhaimin 1991). The nationalisation of Dutch companies
following confrontations with the Dutch in West Papua (Irian Jaya) formed the basis of
future SOEs in Indonesia. During this period, capital, contracts, concessions and credit
from the state, were first given directly to SOEs; and certain national private
businessmen could also claim them (Muhaimin 1991).
Foreign capital was encouraged after the Guided Democracy system. The patron-client
phenomena was exacerbated during Soeharto’s New Order government when it
established the Foreign Investment Act 1967 and the Domestic Investment Act 1968
(Muhaimin 1991). These gave the state and its bureaucrats a powerful authority over
allocating capital, credits, concessions and licences for their clients.
The discretion of economic protection in Indonesia, at least until 1974, was largely
limited to the import sector (Muhaimin 1991). Towards 1970 however, political
pressures forced the government to give special aid and protection once again to
pribumi business people (Muhaimin 1991). However, inefficiencies in its
implementation created a repeat of the situation in the 1950s. A proliferation of so-
called ‘Ali-Baba arrangements’ created a situation in which the pribumi with political

29
connections provided fronts to obtain licences which they then sold or used in
cooperation with the Chinese, who provided capital and expertise (Muhaimin 1991).
The discretion to give protection had produced a patron-client system that benefitted the
pribumi. However, Muhaimin (1991) concluded that the system was not able to develop
strong pribumi entrepreneurs, as they lacked entrepreneurial skills, capital and
organisation.
The patron-client system is very sensitive to changes in the power structure. During the
early years following independence (1945–1959), the key to success for entrepreneurs
lay in their ability to be close to a political party and cabinet figures (Muhaimin 1991).
In the Guided Democracy period (1959–1965), the power to control the bureaucracy
shifted to the Presidential Palace.
In the New Order, the key to understanding decision-making in relation to Indonesia’s
economy was to recognise President Soeharto’s position as the most senior decision
maker (Muhaimin 1991). The outcome of changes in regime was the rise of other
business people who had relationships with the New Order elite. In 1968, a company
belonging to Probosutedjo (a family related to Soeharto) obtained a lucrative monopoly
over clove importation—cloves being essential for the kretek cigarette industry—from
the Minister of Trade, Dr Soemitro Djojohadikusumo (Muhaimin 1991). Probosutedjo
denied he had received the licence because of his link to Soeharto (Muhaimin 1991).
As mentioned by Emil Salim, in the introduction of a book edited by Resosudarmo
(2005), Indonesia in the 1980s and 1990s (under Soeharto’s rule) followed the
‘Washington consensus’: that countries should adopt a market paradigm and that the
private sector should dominate the market. The government undertook privatisations
and de-regulated various sectors, including the financial sector. The turning point
happened after the 1997 AFC, when it became apparent that the development policies
were flawed. In 1988, the ‘Santiago consensus’ recognised these market failures and the
need for government to correct the market.
Many current business people and their business groups emerged during the Soeharto
era, including as many as 17 of the 30 largest business groups in existence in 2008, with
all of the 30 largest business groups but one owned by the Chinese (Chua 2008). It
would have been reasonable to suppose that the 1988 AFC would have obliterated most

30
of these business groups. However, many have survived and have been included in the
top 80 business groups (as mentioned previously) and have grown even bigger.
2.4.6 Case Study: The Salim Group
The most widely cited case study on the links between political patronage and business
in Indonesia is that of the Salim Group. Soeharto and the Salim Group’s founder Liem
Sioe Liong (Liem) had a classic patron-client relationship. The president ‘protected’
Liem and ensured that his formative ventures succeeded by allowing him to hold
monopolies and giving him preferential treatment (Borsuk & Chng 2014).
After migrating to Indonesia from China in the 1930s, Liem was able to build a simple
trading business into a conglomerate in Indonesia. In the early stages, the Salim Group
was able to capitalise on government ‘[p]olicies designed to protect and nurture
domestic capitalists, particularly in import substitution, because of its capacity to secure
monopolies and access to the financial and organisational resources of international
capital’ (Robison 1986, p.297). Sato (1993, p.437) has also stated that ‘[p]ursuing
monopolistic and oligopolistic market positions became a cornerstone of the group’s
corporate behavior’.
The Salim Group was on a growth fast track, benefitting from this positioning. Liem—
and Suharto’s half-brother—obtained exclusive rights for many years to import cloves
from Zanzibar and Madagascar (Borsuk & Chng 2014). For many people, the Salim
Group has become so large due to its monopolies; these are the sources of cash flow
that allow the group to invest in many other businesses (Borsuk & Chng 2014).
Liem understood there was a price to pay for being so close to Soeharto. As noted by
Borsuk and Chng (2014), he offered shares readily to the president’s family members;
for example, a 30% stake in his bank, then the Bank BCA. He was also called upon to
rescue the troubled Bank Duta, which was owned by foundations linked to Soeharto
(Borsuk & Chng 2014).
Once Anthony Salim – Liem’s youngest son and heir apparent – returned from
England in 1971, the Salim Group consciously pursued geographic expansion beyond
Indonesia as a way of diversifying (Borsuk & Chng 2014). After Suharto fell in 1998,
31
Salim’s investments outside Indonesia proved very useful to settle his debts and
maintain his control of Indofood, a food and beverage business (Borsuk & Chng 2014).
Borsuk and Chng (2014) have attributed Salim’s success to his close ties to the late
President Soeharto, both before and during Soeharto’s 32-year rule, which ended in
1998 (after the AFC in the same year). The two had become friends when General
Soeharto was Commander of Central Java. When General Soeharto took control of the
country in the 1960s and was looking for ways to develop the economy, he often turned
to Liem, who effectively gave him control of key profitable businesses in clove imports,
flourmills and cement. He was viewed as Indonesia’s first industrialist, taking the lead
in building some of the first flourmills and cement plants in the country (Borsuk &
Chng 2014).
The group has struggled with huge debts and was forced to sell some of its prime assets
following the AFC, including its flagship BCA. Anthony Salim (the third son) has been
running the company since the 1990s. The Salim Group has bounced back, despite
Soeharto losing power in 1998, due to its strong market share, internationalisation and
professionalism, combined with Anthony’s business acumen (Borsuk & Chng 2014;
Dieleman 2007). The group’s managers have been able to clean up their debt and focus
on expanding their core enterprises, including food and agricultural businesses. Liem
left Indonesia for Singapore after the AFC, where he died in June 2012 at the age of 95.
Today, the Salim Group is still one of the most prominent family business groups in
Indonesia, as shown in the previous table of top business groups in Indonesia. Borsuk
and Chng (2014, p.517) quote Anthony who said:
[S]alim had moved far from its origins, from “connections to non-connections”.
Salim Group currently operates in many areas of business, much like the Astra Group.
However, unlike the Astra Group they do not have one listed holding company. Salim
Group is best known for its presence in the consumer sector, with products such as
instant noodles (Indomie) through Indofood and Indofood Consumer Brand Products
(ICBP). They have also businesses involved in flour milling (Bogasari), palm-oil
plantations (Salim Ivomas, Lonsum Plantation, Indoagri), an automotive distributorship
(Indomobil). They have continued to expand outside Indonesia through First Pacific,
which is listed in Hong Kong.

32
As far back as 1986, Robison (1986, p.297) had observed that:
[T]he Liem group can no longer be regarded as a client or comprador group
hanging onto the coat-tails of Indonesian generals and foreign bankers; it is a major
regional and international financial and industrial group with a substantial capital
base’.
One of the most comprehensive academic studies on the Salim Group is that by
Dieleman (2007). She conducted an in-depth, longitudinal study focused on unravelling
the Salim Group’s business strategy. She found that indeed Salim’s strategy oscillated
over time from a relationship-based strategy to a more market-based one.
2.5 The Theoretical Foundations of Earlier Research
This section will examine the theoretical foundations of earlier research on political
connection and firm performance. It consists of three parts: the determinants of firm
performance, an explanation of ‘institutional void’ as a theoretical foundation to analyse
the phenomenon of business groups in emerging markets, and an analysis of previous
empirical research on the effects of political connections on a firm’s performance.
2.5.1 Determinants of Firm Performance
Firms exist to achieve profit maximisation. In the process of maximising profits, firms
interact with agents and markets in a constant cycle of interactions. Strategic choices
made by firms can affect outputs, outputs can affect market prices, market prices can
affect agents’ budget sets and utilities, utilities can affect incentives within firms,
ultimately returning to affect the strategic choices within firms (Zame 2007).
Previous studies have reached few conclusions on the determinants of firm
performance. Previous studies are divided into two streams: those focusing on external
factors as the major influences and those looking at internal factors believed to have
major effects. Many researchers have argued that external factors, such as industry
forces, have played a major role in influencing firm performance (Hawawini,
Subramanian & Verdin 2003). The external factors for a firm’s performance are well-
explained theoretically by industrial organisation economics. The major determinants
include characteristics of the industry, the companies’ position relative to their
competitors, and the quality and quantity of the firm’s resources (Hansen & Wirnerfelt
33
1989). Conversely, some researchers have argued that internal factors are the major
determinants of firm performance, determining competitive advantages and successes or
failures during economic downturns (Opler & Titman 1994). The empirical evidence for
both streams of thoughts is inconclusive (Hatem 2014).
Company performance can be measured by profit margins or increased turnover
(Elizabeth & Baines 1998). This includes ROA, ROE and return on sales (ROS) (Hatem
2014). Firm performance can also be measured using market measures like earnings per
share (EPS) (Hatem 2014), Tobin’s Q (Morck, Shleifer & Vishny 1988; Niessen &
Ruenzi 2009) or market-adjusted returns (Braun & Sharma 2007). One method of
calculating Tobin’s Q has been suggested by Schlingemann, Stulz and Walkling (2002)
as the ratio of the book value of assets minus the book value of equity plus the market
value of equity to the book value of assets. Market-adjusted returns can be calculated by
subtracting the share price return of the particular stock with the relevant composite
index.
Firms tend to optimise all means to achieve better performance, even by rent-seeking.
‘Rent-seeking’ is a term coined by Anne Krueger (1974). She has said that rent-seeking
occurs when a firm uses its resources for economic gain without having to deliver any
benefits back to society through the creation of wealth (Krueger 1974). One example of
rent-seeking is when a firm tries to persuade government to provide lower tariffs,
subsidies and grants to the firm. These regulations would not provide any benefits for
society; instead, they would just circulate the wealth from taxpayers to the special
interest group. As such, the theory of rent-seeking leads to the argument that those firms
with political connections to the government tend to reap economic benefits, leading to
better performance for those firms.
2.5.2 Institutional Voids
Emerging markets lack transparency, and ambiguity as well as uncertainty of regulation
(Dhanaraj & Khanna 2011). Indonesia is considered an emerging market. Hence, doing
business in Indonesia requires consideration of such conditions. This complexity is
studied by examining the fundamental arrangements that support market functions. The
absence of such arrangements or institutions is coined as an ‘institutional void’ by
Khanna and Palepu (2010).
34
North (1991) has described institutions as constraints established by humans when
structuring interaction between politics, economics and social factors. Institutions
consist of formal and informal institutions. Formal institutions include formal rules such
as constitutions, laws and property rights. Conversely, informal institutions include
sanctions, customs, taboos, traditions and codes of conduct. Institutions are created to
reduce uncertainty as they provide direction for people undertaking activities.
Neoclassical economics assumes that information in markets flows perfectly; however,
this is difficult to implement, even in developed countries. Further, violation of
neoclassical assumptions is more pronounced in emerging markets.
Five institutional dimensions can be examined for their relationships with political
needs (Khanna & Palepu 2010). These five dimensions are: (1) capital markets, (2)
labour markets, (3) product markets, (4) government regulations and (5) contract
enforcement.
Regarding capital markets, investors feel safe investing in developed countries as these
countries have clear regulations for the capital market. However, investors are reluctant
to invest their money in companies, especially new enterprises, in emerging markets. As
a result, well-established business groups or conglomerates have the advantage in
obtaining capital from investors.
In terms of labour markets, emerging markets lack well-trained and qualified
employees. Again, well-established business groups have advantages regarding the
labour market. This is because these groups could have internal management
development programs and training established to develop their employees’ skills.
Another way they manage their human resources is to transfer employees from a
company facing a downturn to another, more stable company, as a government in an
emerging market may not provide unemployment benefits.
Government in emerging markets often intervenes extensively in business. In addition,
it is difficult for companies to predict what regulations will be established in the future.
Again, business groups or conglomerates have certain advantages as they can act as
intermediaries, providing a ‘bridge’ for investors or their partners to communicate with
the government. The costs of acting as an intermediary could be spread among the
several companies within a group. Further, is also important to maintain relations with

35
government bureaucrats. For example, major Malaysian political parties have
affiliations with business groups, and large companies in Indonesia have access to
government officials. Another way to establish a relationship with government is by
educating regulators on how business and projects are conducted.
Finally, if there are any disputes between parties, contract enforcement is clear in
developed markets. However, it is less clear in emerging markets. Business groups have
the advantage here, as they could have had some track records in solving contract
enforcement issues in the past. If there is no history of misconduct, then companies in
the group will be able to gain credibility from the investors or other business parties.
In summary, conglomerates or business groups might be advantaged in emerging
markets as they may be able to leverage their assets and capital to obtain trust from
investors and other business parties. Moreover in emerging markets, where formal
institutions are absent, informal institutions become important in conducting business.
2.5.3 The Effects of Having Political Connections on Firm Performance
Much empirical research has examined the effects of having political connections on a
firm’s performance. This section begins with a discussion on how and why companies
may link themselves with politics, and whether such links offer positive or negative
effects on the firm’s performance. It will also examine some other aspects concerning
the company policies regarding political connections.
There are many ways for companies to be politically connected. In the United States of
America (US), firms can appoint directors with a political background to accommodate
their business with bureaucrats (Agrawal & Knoeber 2001). Moreover, having
politicians or government officials on the board of directors, would result in higher
performance compared to a close relationship or knowing certain politicians (Boubakri,
Cosset & Saffar 2009). Stronger connections, such as owners having close relationships
rather than directors, and having close relationships with ministers rather than MPs, lead
to a greater difference in the performance of connected and non-connected firms (Faccio
2010).
A country’s legal environment also influences whether political connections can be
established. Countries with a higher level of corruption tend to have greater differences

36
in performance between politically connected and non-connected firms. A symbiotic
relationship exists between politicians and capital in which capital groups distribute
their wealth to politicians in exchange for receiving monopolies, concessions, licences,
quotas, construction projects and permits (Pathmanand 2006). However, if capital
groups form their own political party, then this wealth distribution decreases.
The existence of political connections could result in companies having better
performance compared to non-connected companies. In Germany, firms with political
connections to the Nazi party outperformed the market (Ferguson & Voth 2008).
Brazilian firms that provided contributions to federal elections experienced higher stock
returns around the time of the 1998 and 2002 elections (Claessens, Lang & Fan 2006).
Using the measure of geographical connections in Pakistan and Zimbabwe, political
connections are, on average, worth over 10% of a firm’s value, though unexpected
losses would lead to a 1.7% decline in a firm’s value for those politically connected
firms (Faccio & Parsley 2009). Using a data set on the political connections of board
members of S&P 500 companies, Goldman, Rocholl and So (2009) have determined
that companies experienced positive abnormal stock returns following the appointment
(and the announcement of this) of politically connected people as board members of
those companies. Moreover, companies supporting the US Republican Party increased
in value after the 2000 election; companies connected to the Democratic Party
decreased in value (Goldman, Rocholl and So 2009). Examining the post-merger
performance of companies, Brockman, Rui and Zou (2013) have found that well-
connected firms outperformed others by more than 20% in terms of abnormal stock
returns; however, this only happens in countries with weak legal systems or high levels
of corruption. For well-connected firms in countries with strong legal systems, they
underperform their counterparts in terms of abnormal stock returns. The difference is
higher for domestic mergers compared to cross-border mergers as politicians have a
greater incentive to influence the merger.
In Thailand, large companies’ values increase when the owners enter politics;
politicians will create policies that are favourable for their companies, resulting in a
higher market share (Bunkanwanicha & Wiwattanakantang 2008). Connected firms
have lower tax rate payments and higher market power (Faccio 2007, 2010). In
Germany, firms with political connections have higher valued assets and better sales,
37
market capitalisation, accounting performance and stock returns (Niessen & Ruenzi
2009). However, they also have less risk, market valuation and growth opportunities.
This could indicate that MPs in Germany prefer to work with large and stable firms to
maintain their reputations, as new transparency laws enacted in 2007 stated that any
additional income of parliament members should be publicly available information
(Niessen & Ruenzi 2009).
The mechanisms through which political connections could add value to companies
varies. In Indonesia, the relatives of President Soeharto were easily granted licences to
import, while others were given a restricted licence, resulting in a higher industry
concentration for political connected firms (Mobarak & Purbasari 2005). In Malaysia,
firms that have close relationship with the former Prime Minister Mahathir lost
subsidies in the first phase of the AFC; however, they were more likely to get subsidies
after capital controls were imposed (Johnson & Mitton 2003).
In addition to these mechanisms, politically linked companies have a higher probability
of being bailed out when facing financial distress; the probability is even higher when
the IMF or World Bank provides financial assistance (Faccio 2006). Moreover, Faccio
(2006) found that in some countries, political connections influence the allocation of
capital through financial assistance. Duchin and Sosyura (2012) found that connections
to US congressmen on finance committees and representation at the Federal Reserve via
board members increased a bank’s likelihood of receiving funds from the Troubled
Asset Relief Program (TARF). Companies that had politicians on their board of
directors could receive long-term debt from state-owned banks, with lower interest rates
and less collateral (Charumilind, Kali & Wiwattanakantang 2006; Claessens, Lang &
Fan 2006; Cull & Xu 2005; Faccio 2007, 2010; Khwaja & Mian 2005; Sapienza 2004).
This has also been supported by Boubakri, Cosset and Saffar (2009), using the data of
234 firms from 23 countries to determine that firms with political connections had
higher debt to total assets and current liabilities as they had more ability to obtain debt.
Conversely, political connections could be detrimental for companies. In Canada, heir-
controlled Canadian firms had lower industry-adjusted financial performance, labour
capital ratios, research and development (R&D) spending and a decreased share price
after the US-Canada free trade agreement was announced (Morck, Strangeland &
Yeung 1998). In Indonesia, news about President Soeharto’s health in 1995 to 1997

38
resulted in lower market prices that were even more pronounced for politically
connected firms (Fisman 2001). Having political connections without good managerial
skills could harm a firm’s performance (Fan, Wong & Zhang 2007). This is supported
by Boubakri, Cosset and Saffar (2009), who found that firms with political connections
had lower ROA; this was potentially due to the lower managerial skills connected to the
ease of business that resulted from having better connections. In France, firms with
politically connected CEOs tend to have lower profits as they have to pay higher wage
bills (Bertrand, Schoar & Thesmar 2007). In addition, firms with political connections
can have higher leverage and market shares, but a lower accounting performance
compared to their competitors. Differences between connected and non-connected firms
become particularly pronounced when political links are stronger, and when connected
firms operate in countries with higher levels of corruption (Faccio 2007). Examining
corporate donations to political candidates for federal offices in the US from 1991 to
2004, Agrawal, Meschke and Wang (2012) found that firms who donated had free cash
problems, lower returns and lower corporate governance.
The existence of political connections does not result in only having a higher or lower
performance, but can also affect companies in relation to business policies, such as
dividend payments and financing options. Investors in loosely affiliated companies
tended to be less concerned about dividend rates; dividends could be used to allay
concerns for investors in tightly affiliated companies, which results in higher dividend
rates for the latter type of companies (Faccio 2010). However, multiple large
shareholders in Europe help protect minority shareholders from controlling
shareholders; in Asia, they tend to collude. Well-connected firms are less likely to trade
foreign securities compared to non-connected firms as they have greater access to state-
owned banks, making foreign securities less attractive. Foreign securities require greater
transparency; less transparency could mean they could extract economics benefits (Leuz
& Oberholzer Gee 2006).
This section shows that the results of various empirical evidences on the effects of
political connection on firm performance are mixed. However, the majority of the
findings tend to support the notion of the positive effects of having political connection
to firm performance especially in countries where “institutional voids” exist and weak
legal environment prevail. This fits the description of Indonesia. Therefore, this forms

39
the basis of the hypotheses of potential link between politically connection firms and
firm performance in Indonesia.

40
Chapter 3: Perceptions of Business and Politics in Indonesia
3.1 Introduction
This chapter will present the results from the interviews of a convenient sample of 34
professionals in Indonesia regarding their perceptions of the need for political
connections to compete in business in Indonesia. Prior research has shown that firms
with political connections could have some advantages in conducting their business.
Khwaja and Mian (2005) found that firms with politicians on their board of directors
could have easier access to long-term debt from state-owned banks with lower interest
rates. However, Fan, Wong and Zhang (2007) have explained that political connections
without good managerial skills could harm a firm’s performance. For a better
understanding of the need for political connection in running a business in Indonesia,
this study will document, via a series of interviews, the perceptions of Indonesian
professionals with extensive business experience.
The key hypothesis is that political connections are necessary to be competitive in
Indonesia. Sub-hypotheses are threefold: the situation has become worse post- Soeharto,
political connections vary across industry and politically connected board member is
used to gain political connections.
The interviewees hail from a variety of professions, such as the banking and finance
industries, business sectors and academia. They have worked and dealt with Indonesian
businesses for a considerable amount of time. They have, on average, more than 16
years of professional experience in Indonesia.
The interviews sought evidence to answer the following first four key research
questions as mentioned in Chapter 1 page 3:
1. Are political connections necessary to be competitive in Indonesia? If so, why?
2. Has the situation become better or worse post-Soeharto?
3. Do political connections vary across industry sectors? How?
4. What mechanisms for political connections are used by firms?
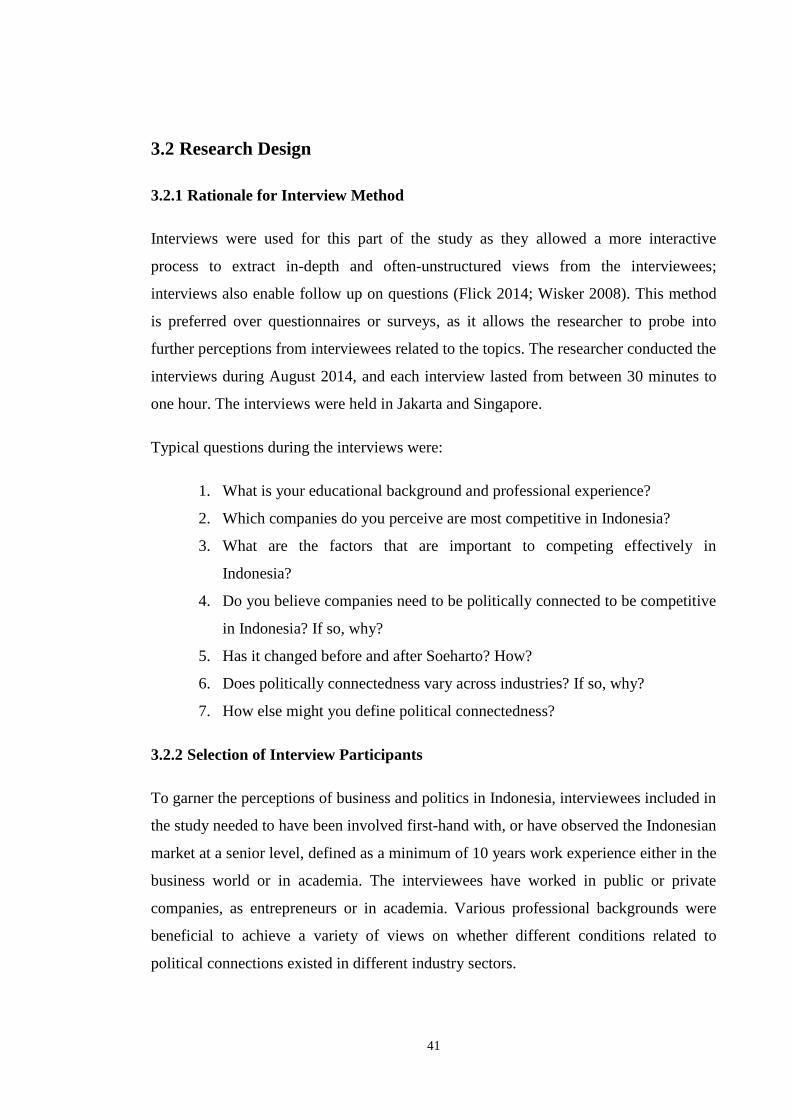
41
3.2 Research Design
3.2.1 Rationale for Interview Method
Interviews were used for this part of the study as they allowed a more interactive
process to extract in-depth and often-unstructured views from the interviewees;
interviews also enable follow up on questions (Flick 2014; Wisker 2008). This method
is preferred over questionnaires or surveys, as it allows the researcher to probe into
further perceptions from interviewees related to the topics. The researcher conducted the
interviews during August 2014, and each interview lasted from between 30 minutes to
one hour. The interviews were held in Jakarta and Singapore.
Typical questions during the interviews were:
1. What is your educational background and professional experience?
2. Which companies do you perceive are most competitive in Indonesia?
3. What are the factors that are important to competing effectively in
Indonesia?
4. Do you believe companies need to be politically connected to be competitive
in Indonesia? If so, why?
5. Has it changed before and after Soeharto? How?
6. Does politically connectedness vary across industries? If so, why?
7. How else might you define political connectedness?
3.2.2 Selection of Interview Participants
To garner the perceptions of business and politics in Indonesia, interviewees included in
the study needed to have been involved first-hand with, or have observed the Indonesian
market at a senior level, defined as a minimum of 10 years work experience either in the
business world or in academia. The interviewees have worked in public or private
companies, as entrepreneurs or in academia. Various professional backgrounds were
beneficial to achieve a variety of views on whether different conditions related to
political connections existed in different industry sectors.

42
An invite list of interviewees was developed based on the list of contacts that the
researcher had access to in his role as a senior banker in Indonesia. Of the 50 invitations
extended, 34 responded and participated in the interviews5
. Of the 16 potential
interviewees who did not participate at the end, there were mainly two reasons: they did
not respond at all or they declined as they viewed the topic was too sensitive.
3.2.3 Data Analysis
The data analysis was conducted using a manual coding process, where the interview
transcripts were analysed and categorised. This provided insights into the common
themes that emerged from the interviews to shed light on the key research questions.
Relevant quotations from the interviewees have been provided to strengthen the
particular themes.
To examine the robustness of the manual coding, the interview transcripts were also
analysed using Leximancer software. This software is particularly useful for the
unstructured or in-depth interview method used in this study. The key feature of the
software is that it does not require the researcher to pre-define any concepts or themes.
The software uses algorithms that are statistically based, employing linear dynamics and
machine learning (Smith & Humphreys 2006). Hence, the software allows an unbiased
method of analysing textual data that improves the reliability and decreases the
researcher’s possible subjectivity in data analysis (Kivunja 2013; Penn-Edwards 2010).
The software produces a concept map, which reveals the links between themes and
concepts.
3.3 Findings
3.3.1 Interviewee Characteristics
The sample included 34 participants in senior level positions. Tables 3.1, 3.2 and 3.3
provide a breakdown of the participants’ characteristics based on their current
profession, job position and educational background, respectively.
5 A sample of Invitation Letter and Consent Form for the interviews are in the Appendix.

43
Table 3.1: Characteristics of Interviewees Based on Their Professions
Jobs Number Percentage
Academics 5 14.7
Bankers 12 35.3
Business Executives 5 14.7
Fund Managers 4 11.8
Lawyers 4 11.8
Research Analysts 4 11.8
Total 34 100.0
Source: interviews, August 2014
Table 3.1 shows that the sample comprised of bankers (35.5%), academics and business
executives (14.7% each), fund managers, research analysts and lawyers (11.8%
respectively). Based on their professional experience, all interviewees had more than 10
years working experience.
Table 3.2: Characteristics of Interviewees Based on Their Positions
Position Percentage
CEO 5.9%
COO 2.9%
Director 17.6%
Commissioner 5.9%
Chairman 5.9%
Business Owner 8.8%
Managing Director 11.8%
Managing Partner 5.9%
Partner 5.9%
Senior Research Analyst 2.9%
Head of Research 8.8%
Fund Manager 5.9%
Professor/Assistant Professors 11.8%
Source: interviews, August 2014

44
Table 3.2 shows that 38.2% held senior C-level positions (CEO, COO, director,
commissioner & chairman), 8.8% were business owners, 11.8% held the position of
managing director, 11.8% were either managing partner or partner, 5.9% were fund
managers, 11.8% were professors/assistant professors in academia, 11.8% held the
position of head of research or senior research analyst.
With regard to their educational background, Table 3.3 shows that the majority of the
interviewees held a master’s degree (50%), followed by those holding a bachelor degree
(38.2%) and doctorates (11.8%). Moreover, 75.8% of interviewees were college
graduates from abroad, 44.4% interviewees were working or had worked abroad, and
29.4% interviewees had studied and worked or had worked abroad. Educational
background has been used widely in the past as a variable to predict organisational
performance, the degree of innovation and the acceptability of new ideas (Bourantas &
Papadakis 1998) in a company. Thus, a higher educational background could suggest
that people had a high capacity to process information and were also open to change in
the business environment. In this study, the educational background could augment the
years of experience to explain the level of expertise of interviewees.
Table 3.3: The Cross-Tabulation of Interviewees’ Jobs and Education
Experience
Total
10–15
Years
16–20
Years
21–25
Years
26–30
Years
> 30
Years
Education
level
Bachelor Count 2 5 4 1 1 13
% within
Education 15.4% 38.5% 30.8% 7.7% 7.7% 100.0%
Masters Count 6 6 3 1 0 16
% within
Education 37.5% 37.5% 18.8% 6.3% 0% 100.0%
Doctorates Count 0 3 0 1 0 4
% within
Education 0% 75.0% 0% 25.0% 0% 100.0%
Total Count 8 14 7 3 1 33
% within
Education 24.2% 42.4% 21.2% 9.1% 3.0% 100.0%
Source: interviews, August 2014

45
Based on their educational background and working experience, the majority of
bachelor’s and master’s degree holders had more than 16 years working experience
(84.6% and 62.5%, respectively). Meanwhile, all the doctorate holders had more than
16 years working experience. This indicates that the interviewees had been selected
according to their expertise.
3.3.2 Data Analysis—Manual Coding
3.3.2.1 What Factors are Important to Compete Effectively in Indonesia?
Whether political connection adds value to companies in Indonesia is the key question
for this research. The answers from our interviewees were mixed, although most
interviewees thought it was necessary or that it depended on the industry, company size,
and whether the business was in its early stages or not:
[i]n emerging markets, in my opinion yes, if you want to be honest, political
connection is needed. For companies to grow, besides strong management, they are
supported by good political connectedness (Banker).
Government policies are important to watch out. Take for example if we sell instant
noodle. If in a locality, selling instant noodle is forbidden, suddenly you are out of
business. So, understanding political networking is important (Business Executive).
The distribution of perceptions of necessity for political connection is provided in Table
3.4. Additionally, Table 3.5 shows the detailed reasons for the answer that the need for
political connections depends on certain factors.
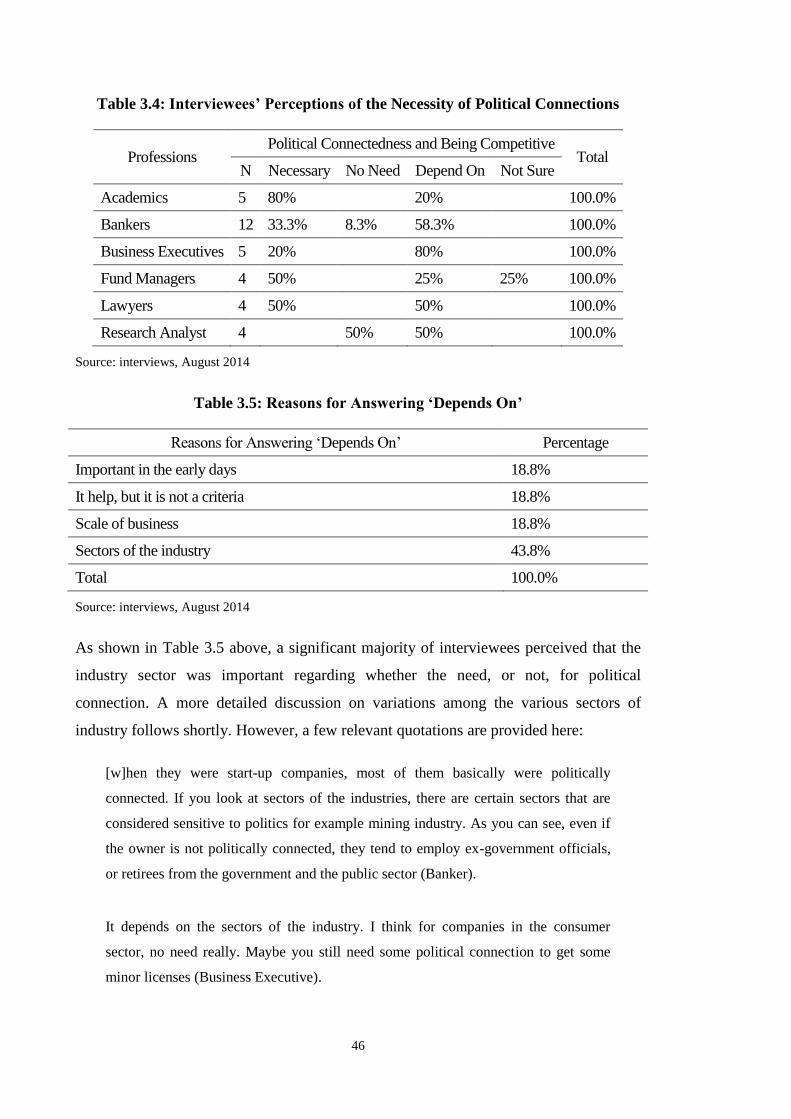
46
Table 3.4: Interviewees’ Perceptions of the Necessity of Political Connections
Professions Political Connectedness and Being Competitive
Total N Necessary No Need Depend On Not Sure
Academics 5 80% 20% 100.0%
Bankers 12 33.3% 8.3% 58.3% 100.0%
Business Executives 5 20% 80% 100.0%
Fund Managers 4 50% 25% 25% 100.0%
Lawyers 4 50% 50% 100.0%
Research Analyst 4 50% 50% 100.0%
Source: interviews, August 2014
Table 3.5: Reasons for Answering ‘Depends On’
Reasons for Answering ‘Depends On’ Percentage
Important in the early days 18.8%
It help, but it is not a criteria 18.8%
Scale of business 18.8%
Sectors of the industry 43.8%
Total 100.0%
Source: interviews, August 2014
As shown in Table 3.5 above, a significant majority of interviewees perceived that the
industry sector was important regarding whether the need, or not, for political
connection. A more detailed discussion on variations among the various sectors of
industry follows shortly. However, a few relevant quotations are provided here:
[w]hen they were start-up companies, most of them basically were politically
connected. If you look at sectors of the industries, there are certain sectors that are
considered sensitive to politics for example mining industry. As you can see, even if
the owner is not politically connected, they tend to employ ex-government officials,
or retirees from the government and the public sector (Banker).
It depends on the sectors of the industry. I think for companies in the consumer
sector, no need really. Maybe you still need some political connection to get some
minor licenses (Business Executive).

47
It depends on the sectors. If you are a SOE, say a SOE building contractor companies
doing government projects-infrastructure such as roads, ports, infrastructure projects,
having political connectedness is very important (Banker).
If your business however is involving the state expenditure then whether you like it or
not, yes you have to have political connection. When we talk about government
routine spending, such as writing utensils, computers etc., if you want that business
then you must have political connectedness in Indonesia (Academic).
Some interviewees’ viewed that the need for political connection was dependent on the
company’s size. While a small company may not need political connections, the need
for political connection arose as a business scaled upwards. This is because competition
increases and political connection can be used as a tool by others to compete against
you. Being politically connected may be necessary to protect the business. Size can be
aligned to the size of revenue or assets, and also by how strategic the sector is. For
example, oil, gas and mining companies are important and strategic to the government,
as the sector is an important source of taxes and royalties. The more government
involvement in the business sector, the more important political connection is:
[i]f you start from zero and you are less than 300 or 200 billion rupiah, in terms of
sales, I think political connectedness is not needed generally, regardless of the
industry (Fund Manager).
But once you are bigger and you need to “move a mountain”, then you need political
connectedness. For example, you need to win businesses in heavily regulated sectors,
then off course you need political connection. Or if you want to change the
competition landscape by stopping foreign competition, you set up new
acts/regulations, you need political connection (Lawyer).
The big business groups have more access than others to politics, government and
power. These big groups have been established a long time and hence have a longer
history (Lawyer).
The interviewees suggested that being politically connected did not necessarily ensure a
company’s competitiveness. By having political connections, a company may obtain
government projects more easily. However, having strong management, capital and

48
distribution networks were also necessary for a company to survive and flourish. The
view from the interviewees suggested that political connection was just one of the many
key success factors:
[w]hat I want so say, political connectedness is important if there are other qualities
within the company to make it useful meaning they have good product, good
management, good planning, and then if they have political connectedness, they can
capitalise on it. If not, they cannot (Academic).
I would say that yes, being politically connected would definitely help in terms of
your day-to-day business activities. But being politically connected alone will not get
you very far. You can look at the previous Soeharto’s family businesses. They were
supremely politically connected. But without good human resources, good
management, those businesses would flounder. They would not do well in the long
run (Banker).
Political connection will give you an advantage in the beginning of your business. But
at the end of the day once the operation is up and running, it is still up to you, up to
operation to actually be able to deliver the results. We have seen it in the past, when
Indonesia tried to have national cars programme with Kia to take the tax advantages
using political connection. Kia didn’t have the ‘right’ products for Indonesia,
therefore they still failed, despite [having] the tax incentives (Banker).
Figure 3.1 presents the key success factors, as discussed during the interviews, for
companies to compete successfully in Indonesia.

49
Source: interviews, August 2014
Figure 3.1: Key Success Factors Viewed as Necessary for Competitiveness
For analytical simplicity, the key success factors in Figure 3.1 above can be divided into
internal and external key success factors. Internal factors are those within the firm’s
control. External factors are those beyond the firm’s realm and control, such as the
wider industry, economics and environment. These distinctions align with the
discussion on the determinants of firm performance in Section 2.5.1.
While political connection is one of the key success factors for competitiveness in
Indonesia, the interviewees noted overwhelmingly that management is the key and most
important factor. Good managers will need to be visionary, shrewd with operating costs,
be able to adapt to changes in the business environment and be willing to invest in R&D
innovation:
[l]ike any business in the world, I think good management is critical. Ultimately it is
what drives the business. I know that it does sound like cliché, the biggest asset of a
company is human resources. It is probably pretty much underlying the successful
businesses in Indonesia. You would not be surprised that most people consider that
Astra is the breeding ground of top management for a lot of Indonesian corporates
(Banker).
The management[’s] capabilities in becoming competitive to know where the
business is going is very important. How they actually maintain the margins. This
relates to the shrewdness of the management (Fund Manager).
Internal key success factors
•Management
•Product and services
•Distribution network
•Good corporate governance
•R&D innovation
External key success factors
•Business sector & market share
• First mover advantage
•Ability to adapt
•Cultural understanding
•Political connection
50
The most important quality of the management capabilities is the ability to adapt to
market situation be they domestic or offshore market[s] (Banker).
One of the key success factors is understanding the cultural background of the
society. When we talk about cultural background, it is not only about ways of doing
business, but also understanding the institutions that exist in the society (Fund
Manager).
Management is very important. Their management must be willing to do research on
new products, and enhance existing products. They have to have management who
are willing to understand that people may change, industry landscape of the business
changes, and they have to be ready to spend R&D to prepare to anticipate changes
that may happen in order for them to sustain growth (Fund Manager).
Good products and services, supported by wide distribution networks, are key success
factors, especially for retail, pharmaceuticals and the banking sector. Of these factors, a
wide distribution network was cited often by the interviewees as vital, as Indonesia has
a poor infrastructure:
[t]hey must have good distribution networks for the sales. Because as we know
infrastructure is an issue in Indonesia, hence distribution can be a big problem.
Therefore those that have good distribution from the beginning or that have built the
distribution channels better than their competitors, they have the advantages. If they
want to sell new products, it could be distributed quickly to the consumers (Fund
Manager).
As we have a huge area, distribution is very important. In normal circumstances,
distribution is important. But with our geography, distribution is even more
important. There are no companies that can grow fast without strong distribution
capabilities (Academic).
Having said that, a business group that has the ability to ride this is the one that would
be able to tap into the various regions in Indonesia. Meaning that those that have the
distribution networks. For example, Astra. They are able to maintain the market
shares. You see every New Year they come out with new products of cars. You see
new players into the car markets rely on technological advancement in their products.

51
But unless you have the distribution network that sells the products across Indonesia,
you will not be able to reach the kind of level where Astra is (Research Analyst).
3.3.2.2 Why the Need for Political Connection?
Political connectedness in Indonesian business is considered necessary for several
reasons: (1) to obtain necessary licencing, (2) to obtain access to information, (3) to
have access to regulators and bureaucracy due to issues of regulation, transparency and
enforcement, and (4) first and foremost as ‘a form of protection’:
[j]ust for an illustration, our second president, Mr Soeharto, whenever there were
good businesses, and if you don’t have any relationship with him and his family, it is
very easy for them to “occupy” your business. They stopped you from every angle in
order for your business not to progress (Fund Manager).
Everything we need has to involve dealing with the government, for example you
require certain licenses, so your competitors may use their link with the government
through their political link to stop you to get the licenses (Lawyer).
Political connection is not to obtain favours, but more for protection against
blackmail. When a company is becoming big, there are always nuisances against
them (Academics).
Apart from ‘political protection’, it was important to access information about the
business environment, competitive landscape and any policies from government that
might affect their business:
[f]rom time to time you do need help from the government in order [to] establish
business with acceptable business scale for the business to survive. It is important to
have the connectivity so you are aware of the market development. There could be
global events or regional events on the economic sides, the government need to take
certain actions. And in order to take the actions, they need to ask private sectors what
the implications would be, and if you don’t know these people, you can be caught on
the wrong side and your opinion will not be heard (Banker).
52
In order for the companies to get more information about their business, and to
expand in line with the government’s program of the government, it is easier to get
such information from (ex) government officials (Banker).
Such political connection helps in terms knowing what next regulations would be in
the business sectors by knowing them ahead of time, be them deregulation or
regulation (Business Executive).
Political connectedness would help as it could expedite the process in the licenses.
And also you may obtain some useful information that is not public (Banker).
It was essential to have access to regulators/bureaucrats so that the right communication
channels could be established if the business encountered any issues with bureaucracy.
Some interviewees viewed such access as crucial for the survival of their business:
[y]ou should be connected to the goals of the Governor or the Regent, as well the
Minister. But supporting these and well-connected does not mean you have to bribe
them or give gratification or give them some facilities (Banker).
Some of the officials after they retire they become member of the board of
commissioners in one of the companies. Although they have retired, they still have
influence in their connected ministries or state government offices. Even though they
don’t have legal positions anymore, per Indonesian culture, an ex-General for
example still has influence in the military, as well as ex-high officials still have
influence in their ministries have (Lawyer).
You have to know the governor in the head office and branches. You have to know
who the minister is, even by knowing means a lot. If you get to know them
personally, you have the relationship and then you can contact them. You understand
where things are going, where regulations are going. When you do positive impact to
the society, politician benefits also from the development (Business Executive).
For example, we need to go to the districts and then to the central government, but it
cannot be decided at the central government only. So political connectedness is
important [at] all the various levels and stages. So we need good relationship at the
local level and central government (Business Executive).

53
The need for political connectedness could be the result of a lack of clarity and
enforcement regarding laws. The more unclear the regulations and the weaker the
enforcement was, the more a company needed to have political connectedness:
[i]t is too clear and too rigid. So people translate them word by words. So the
situation is forms over substance. Actually it should be substance over forms. They
make it too rigid, so it becomes forms over substance (Fund Manager).
3.3.2.3 Need for Political Connection During and After the Suharto Era
Most interviewees felt there were significant differences in the periods during and after
the 32-year rule of President Suharto. Some interviewees said the need for political
connection used to be stronger in the period during Soeharto’s rule, but the need was no
longer present:
[s]o long you understand the regulations and you are doing it right, and thanks to
Indonesia has gotten more democratic, you can actually argue with the government
that you are actually doing the right things along with government regulations. So
that’s why I said the need for political connection used to be but no more thanks to
the democratisation and the impact of 1998 AFC (Research Analyst).
The interviewees perceived that democracy had provided a more transparent
environment since the media and the press were liberalised. The increased transparency
provided some kind of social control:
[i] feel now it is better. For example if it relates to something new and concerns a lot
of people, they tend not to make things difficult as they can become the focus of the
media, publicity, people tend to hold themselves out (Lawyer).
Democracy makes things a lot more transparent and therefore there is now level
playing field in terms of regulatory access. That means the ability or the advantage
that you get from being well connected to the power become diluted (Research
Analyst).
Everybody is watching. However, once they know everyone is watching everyone, at
the end they cooperate with each other. I get something you get something too
(Business Executive).

54
The above quotations reveal that some interviewees perceived that from 1998, the
media had more freedom in circulating news, which made every action more
transparent. However, political connections still existed but were transformed. During
the Soeharto period the situation was clearer, as power was concentrated in one hand:
that of President Soeharto and his family. However, after Indonesia had become a full
democracy, power sharing was established among the various political parties and
subsequent presidents, along with the regional and local governments. As the power
was shared, business people needed to connect with various parties, which could result
in higher costs when conducting their business. An explanation of this phenomenon is
provided in the following participant quotations:
[s]oeharto, during his New Order era, had split the resources basically into two: for
the Chinese, you can easily go the banks, and if you are pribumi (indigenous), you
can go the Pertamina if they want to start up a business. So in the Soeharto era, you
needed to be politically connected to be able to get the money from the system and
started a business with Pertamina (Fund Manager).
When so many political parties were set up in the Reformation era (post-Soeharto
era), this created various power bases in the society. They can decide how the money
circulated among the SOEs, for example projects to be given to those close to them
(Fund Manager).
If we talk about Soeharto era, friends of Soeharto were safe, others not. Today, you
know, there are yellow, red, blue, or green.6 If the Komisi Pemberantasan Korupsi
(KPK or Corruption Eradication Agency) is calling you, at the end even if you are
close to the yellow, red, blue, green, it doesn’t matter. But you need to be close to
everybody anyway for your business-sake (Fund Manager).
In the past it was clear: yes you are politically connected or no, you are not. If you
don’t have the political connection then you could not get big deals. Now however it
is unclear and uncertain. Sometimes they said yes it is possible when you request for
something, then the results at the end turn out to be not possible. Sometime they said
certain permits can be extended for example, then they said no. The Regent wants this
and that, yet it is not clear if the Regent’s requests were fulfilled, the permits will be
6 The colour refers to the various colours of the political party banners. Yellow refers to the Golkar party,
red refers to the PDIP party, blue refers to the Democrat party, and green refers to the islamists parties.

55
issued for example. So it is more chaotic. The power is not concentrated into one
hand (Business Executive).
Post-Soeharto, in 2001, Indonesia enacted a law that gave much more autonomy to the
regions, especially the regencies (Kabupaten). This created a dispersion of power to the
regencies, in particular as the Regent (Bupati) could now issue licences and permits for
certain parts of the mining and minerals extraction sector. Most interviewees felt that
the situation was worse and the need for political connectedness had increased for those
involved in the mining, mineral extraction, oil and gas and property sectors:
[a] lot of Peraturan Daerah (PERDA or local regulations) are not really conducive to
business, but making it more difficult for businesses (Banker).
Indeed, due to regional autonomy, the need for political connectedness in negative
sense is getting worse. The power is now spread out everywhere and these regional
heads are inexperienced people (Academic).
From the nominal value it is going to get more costly because it is decentralised, you
got to entertain various Regents from many areas (Research Analyst).
3.3.2.4 Variation in Political Connection by Sectors of Industry
As discussed in the previous section, most interviewees felt that the need for political
connectedness was dependent on the industry sectors in which the company operated.
Businesses in sectors that were highly regulated usually required more political
connectedness, as they depended on the local and/or central government for licencing,
permits, contracts and the awarding of projects:
[a]t the end of the days, sectors that have high degree of regulations require more
political connectedness (Banker).
Basically whatever the government deemed as strategic, whether it is staple food or
cooking oil. The lower class masses use a lot of cooking oil. If you operate in a sector
deemed as strategic, there would be more need for political connectedness (Banker).
Yes. It would definitely need to vary. And the reason is that for different industry, the
nature of the industry is different. For example, if you deal directly with the
56
consumers, you deal less with the government. But if you deal with something
strategic or deemed to be strategic by the government of the country then there would
be a lot more political relationship that you have to deal with. For example, the oil
and gas, mining or even companies like in the cement-it is still being considered as
strategic, then there has got to be a lot more interrelations with the political issues
compared for example you are selling candies. So different industry will have
different levels of exposure to political interference (Research Analyst).
The sectors that needed strong political connectedness included: (1) oil and gas, (2)
mining and energy, (3) plantations, (4) property, (5) telecommunication and (6)
banking. The oil and gas and mining sectors were viewed as the two sectors that
required the most political connectedness. This was due to the magnitude of the
government’s role in the business processes of these industries being bigger than that of
other sectors. The oil and gas and mining sectors were perceived by interviewees to
have a high necessity of political connection, as these are natural resources owned by
the state. They are considered strategic sectors important for the state budget in relation
to taxes, royalties and duties:
[f]or certain sectors that deal a lot with government such as infrastructure, ports,
airports, and mining, political connection or political connectedness would be more
important (Banker).
I think the sector that is really huge in terms of their growth and income, for example
oil and gas, and mining, you have to be politically connected to operate in these
sectors (Lawyer).
In my opinion, mining and oil and gas need political connection because it involves
licenses and permits, and taxes/royalties. So if those companies have board members
that have strong political connections, it will be beneficial for the processing of
licenses etc., as they may need 30-40 various licenses and permits (Banker).
[t]o operate in the oil and gas sector, you have to be very well connected politically.
For you to be awarded for the Kerja Sama Operasi (KSO or joint operation) or PSC
(production sharing contract), you need to be very politically connected (Lawyer).

57
You need to get the Analisa Mengenai Dampak Lingkungan (AMDAL or
environmental assessment) from the environmental department; you need to get an
approval from the Ministry of Energy etc. And when you start production, you need
to have good relationship with the local government, partly because there are a lot of
employees on site-local people. Hence, you need political connection (Business
Executive).
On the other hand, the interviewees perceived that consumer goods, consumer finance
and retail were sectors that required the least political connectedness. Government did
not dominate the business process and did not regulate a company’s inputs and outputs;
therefore, a company could buy from the market and sell to the market without
government intervention. Moreover, the licencing process in this sector was considered
relatively well-established and transparent:
[c]onsumer goods are not highly regulated. Sometimes they are free competition.
Hence, the need for political connectedness is less compared to highly regulated
industry (Research Analyst).
Consumer sector companies only deal with the government at Badan Pengawas Obat
& Makanan (BPOM or Food and Drugs Administration) for food and health permits
for their products. How about if you have a wrong product number? Then how to
escalate? If you are a small company, you just sort it out quietly with the regulator.
But if you are a big company, and your competitors may know about it, they can
‘blow it up’ and impact your sales. Hence you still need some connectivity to ‘calm it
down’ (Fund Manager).
Retail sector requires less political connectedness. You need location permits
(SIUP/TDP) or be aware of changes in regulations for example now you cannot build
new malls or prohibition of FDI in the sector. This sector is less regulated (Fund
Manager).
I think for the least influence of politics is probably consumer goods companies. Why
is that? The government does not control the input and output. They can buy raw
material from the free market, sell to the market, price to the market, without
intervention from the government that controls the inputs, outputs and price (Business
Executive).

58
Figure 3.2 summarises the degree of political connectedness that correlates with the
degree of government regulation for various sectors, based on the views of the
interviewees regarding the need for political connectedness by industry sector.
Source: interviews, August 2014; figure is not to scale
Figure 3.2: Perceptions of Variation in Political Connectedness by Industry Sector
Figure 3.2 shows that as government regulation increases, the need for political
connection increases. The oil and gas and mining sectors have the highest need for
political connectedness as they are highly regulated. The property, plantation,
telecommunication and banking sectors were viewed as requiring moderate political
connectedness. The consumer and retail sectors had the least need for political
connectedness.
3.3.2.5 Mechanism of Political Connection
Most interviewees felt that political connectedness could be indicated by having a
member of the board of directors, or the board of commissioners in the company who
was connected with the government, parliament, judiciary and military:
[p]olitical connection could be for example if ex-officials sit in the board. They may
be close to the current decision-makers within the Agency or Regulators. In short,
they still have good relationship within the power holders within the government
(Business Executive).
Most interviewees viewed that this connection could also be obtained through the
company owners. However, operating this variable would be problematic as the data for
ultimate beneficiary owners (UBO) were not readily and publicly available.

59
I will discuss further the various mechanisms for political connection in the following
sub-sections.
3.3.2.5.1 Connection Through the Owners
A political connection could be built through the owner’s connections. It could be that
the owner had a close relationship with government officials when those officials were
still in power, or even after they had retired from their positions. The perception was
that such a connection was stronger compared to one obtained through the board of
directors or commissioners:
[if] they consider the need to connect politically, businessmen can use government or
ex-government official that have political connectedness to government in board. So
this could be a form of goodwill. For the owner, probably the ex-official has assisted
throughout the growth period. You see that our Chief of Police-Bimantoro-when he
retired he was recruited by Charoen Phokpand for example as board member. That
may be a reflection of the relationship made or built during the period when
Bimantoro was acting as the Chief of Police with the company or with the owner of
the company (Lawyer).
Yes either the controlling shareholders are connected, or they use people to get this
connectedness (Business Executive).
Sometimes the political connection is conducted through the owners, sometimes
through the management as well. If the management has very good connection with
power, it can also somehow help the company. But the biggest leverage will be if the
owner is a good friend of the power holder himself (Research Analyst).
3.3.2.5.2 Owners Entering Politics
Owners could enter into and become functionaries of political parties or government,
some acting as a presidential advisor, ministers or even making a run as a presidential
candidate. The most recent trend was for business people to establish political parties
themselves, such as Partai Nasional Demokrat (Nasdem), which was set up by Surya
Paloh, the owner of the Metro TV business group and Partai Perindo, which was set up
by Hary Tanoesoedibjo, the owner of MNC business group. The perception of the
60
interviewees on the motives for why these owners entered politics is that it was to
sustain and protect their business interests:
[a]ctually in Indonesia context, one form of politically connection happens when the
business people enter political parties. This is quite unique because they are easily
observable like the Bakrie business group where Aburizal Bakrie became the chief of
Golkar party, and MNC, chairman of MNC became the vice chief of a party (Hanura
Party). The chairman of Nasdem Party is also a businessman. And to some extent,
Gerindra Party as well. Those are political parties, which can be considered driven by
the business, so the business is politically connected (Academic).
You can say for example the owners claimed they are already retired and then they
want to be involved in politics. But most of the times, I see basically they do that in
order to protect whatever the interests of the family business as a form of family
interests protection (Banker).
There are cases like if I were a businessman and then I left my business to become an
MP. I tried to enter a certain Commission in the Parliament, which relates to my
business. There, political connectedness happened (Academic).
3.3.2.5.3 Campaign Donations
One way to be actively connected politically was by contributing to campaign
donations. The perception from the interviewees was that this occurred during the
previous presidential elections in 2014. To hedge their bets, owners typically
contributed to more than one political party or presidential candidate:7
[i]n the beginning, in order to establish political connectedness, companies actively
donate to the political parties. So they don’t have connection through the boards. But
they donate actively (Academic).
To establish the connection, they may become a contributor to the political party.
They don’t really use the company’s money but through individual shareholders or
through vehicles. In our law, there is a limitation on donation amount, so you may
have to split out the amount. For political parties, normally they need to disclose the
details of campaign donations. But for the listed companies themselves, the donations
7 The donations are funded from the company’s budget or, more often, from the owners’ own resources.
Research on the campaign donations is difficult due to the lack of data.
61
may be intermingled with other expenses. Normally in Indonesia it is called informal
discussion, but we know exactly what it is (Lawyer).
It usually starts from donations at the level of shareholders or owners (Banker).
3.3.2.5.4 Industry Associations
Joining and being active in an industry association was perceived as a way to connect
politically. These associations, such as Kamar Dagang & Industri Indonesia (KADIN or
Indonesia Chamber of Commerce) and Asosiasi Pengusaha Indonesia (APINDO or
Indonesia Employers’ Associations), championed the causes of the industry. These
associations were often consulted by the government when issuing new regulations. The
members of the associations often accompanied the President on official visits to
foreign countries to build business ties:
[t]he company becomes part of an association (industry association) such as KADIN,
or APINDO. If you become a member of an association like KADIN, you can ask
your chairman to help your companies (Banker).
In Indonesia, you have the Association of Emiten Indonesia (AEI-Indonesian Issuers
Association), and then you have KADIN, APINDO, that is also the place they can get
good network, business network as well as government network because there are
intensive interaction with the government (Academic).
Say if I were a businessman, and I need to import strategic raw material such as
sugar, then I need to get active in an association. This association is also active in the
parliament. And if the businessman also sits in the parliament, it is easy for him/her to
pressurize the government as the counter-party of the parliament (Academic).
3.3.2.5.5 Advisors/Consultants
Hiring well-connected people as advisors or consultants requires less disclosure.
Interviewees viewed this as another way to become politically connected. These people
are not necessarily on the board of directors or commissioners but are still in the
company’s payroll. They act as the ‘door-opener’, or someone who has the necessary
access and influences:

62
[t]he question is how many PEP in your payrolls? It is difficult to measures but they
exist. They are not formally in the company say as advisors. But they don’t want to
disclose it openly (Fund Manager).
Outside the political circles but they have experienced dealing with the government
for example they were advisors to the World Bank. Maybe we can use that as an
indirect measure (Research Analyst).
If they don’t have strong member of board of commissioners, like in mining sector,
maybe they can use other channels. I think they use management consultants or
advisors. It can be packaged as such (Banker).
I think they use advisors, as now people are becoming smarter not to get involved
directly, through a third party which seems to be independent (Lawyer).
3.3.3 Data Analysis Using Leximancer
Leximancer was used to examine the robustness of results from manual coding.
Leximancer is software that transforms lexical co-occurrence information from natural
language into semantic patterns in an unsupervised manner; hence, it minimises any
bias. Leximancer extracts the main concepts; it illustrates them and the
interrelationships between concepts in a ‘concept map’. This map also shows the themes
within which the concept is grouped and helps with the visualisation.
The map’s coloured circles represent the themes and the concepts deemed similar, are
shown close to each other and are enclosed within the same coloured circle. The
concept map also shows the absolute and relative frequencies of concepts and the co-
occurrences of concepts. The intensity of colour in the concept map represents
frequency, with red being the most intense, and cool colours such as blue as the least
intense. The size of the concept points indicates ‘connectedness’, while similar themes
are surrounded by circles. The strength of association between concepts is represented
by their proximity, and by the brightness of links (Galea & Loosemore 2008).8
The steps to generate the concept map are as follows:
8 For further information on Leximancer, its use and advantages see Smith (2000), Smith (2003), Martin
and Rice (2007) and Kivunja (2013).

63
1. The transcripts of interviews (in Word) are uploaded to Leximancer.
2. Concept seeds are generated. This is a pre-processing step followed by
automatic concepts identification. For the text processing settings, the default
setting for the software is two sentences per block, as a standard recommended
by the software.
3. Thesaurus is generated. This step defines the concept by extracting the data
according to their relational meaning (Kivunja 2013). Words that were
frequently mentioned but that were less relevant, such as ‘able’, ‘called’,
‘certain’, ‘different’ and important’ were removed. In addition, words in singular
and plural forms were merged into one concept.
The following concept map resulted from analysis of the transcribed interviews.

64
Source:
interviews, August 2014—coding using Leximancer
Figure 3.3: Concept Map of Political Connectedness
The theme with the highest frequency in the concept map was ‘political’. This theme is
located in the largest circle and is red. This indicates that ‘political’ was the most
important theme among the interviewees. Within the political theme, considering that
‘political’ had the largest black circle in the red circle, our interviewees perceived a
strong link between the concepts ‘political’, ‘government’, ‘connected’, ‘board’ and
‘commissioner’. The theme with the second highest frequency was ‘companies’, which
has ‘companies’, ‘business’ and ‘listed’ as concepts with strong links between them.
Table 3.6 provides the list of main themes and concepts.
Our interviewees perceived a close proximity between the themes ‘political’ and
‘company’ and the close relationship between these themes was expressed specifically
through the concept of ‘commissioner’, preceded by the concepts of ‘government’ and
‘company’.
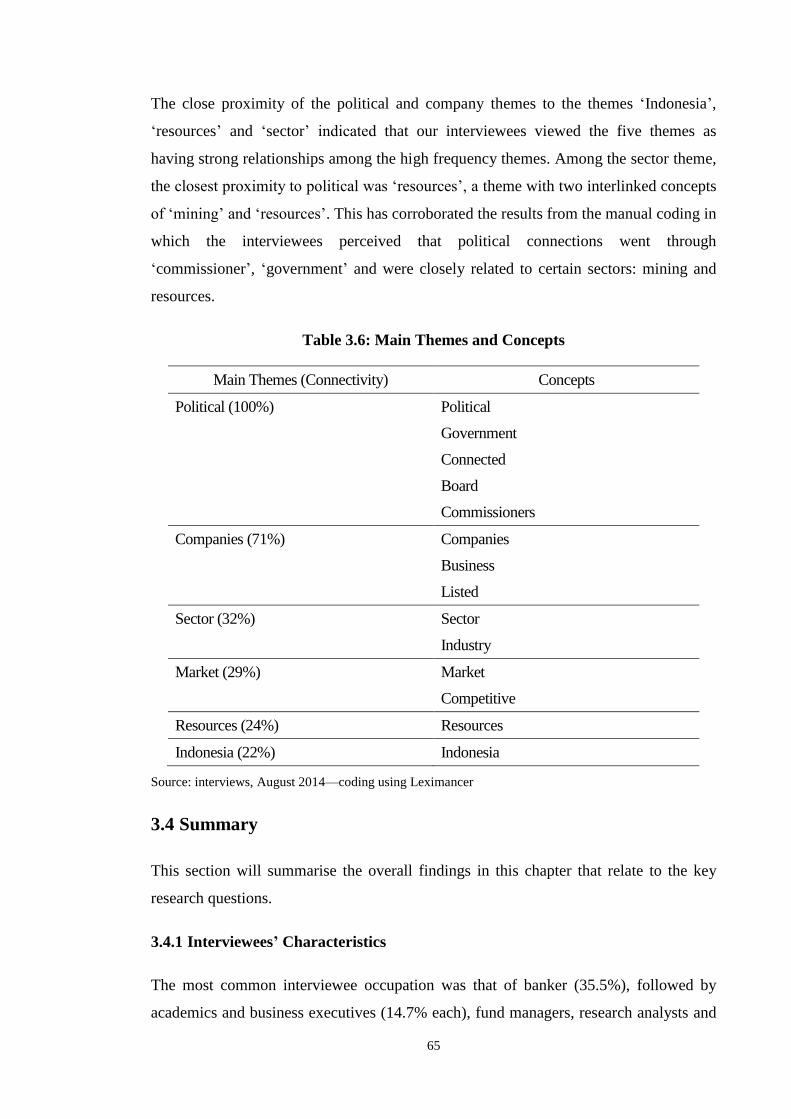
65
The close proximity of the political and company themes to the themes ‘Indonesia’,
‘resources’ and ‘sector’ indicated that our interviewees viewed the five themes as
having strong relationships among the high frequency themes. Among the sector theme,
the closest proximity to political was ‘resources’, a theme with two interlinked concepts
of ‘mining’ and ‘resources’. This has corroborated the results from the manual coding in
which the interviewees perceived that political connections went through
‘commissioner’, ‘government’ and were closely related to certain sectors: mining and
resources.
Table 3.6: Main Themes and Concepts
Main Themes (Connectivity) Concepts
Political (100%) Political
Government
Connected
Board
Commissioners
Companies (71%) Companies
Business
Listed
Sector (32%) Sector
Industry
Market (29%) Market
Competitive
Resources (24%) Resources
Indonesia (22%) Indonesia
Source: interviews, August 2014—coding using Leximancer
3.4 Summary
This section will summarise the overall findings in this chapter that relate to the key
research questions.
3.4.1 Interviewees’ Characteristics
The most common interviewee occupation was that of banker (35.5%), followed by
academics and business executives (14.7% each), fund managers, research analysts and

66
lawyers (11.8% each). They all had working experience of more than 10 years, with an
average of 16 years. Majority of the interviewees had a master’s degree (50.0%),
followed by those with a bachelor degree (38.2%) and doctorates (11.8%). Based on
their education and work experience, the percentage of those who had master’s and
bachelor’s degrees with more than 16 years working experience were 84.6% and 62.5%,
respectively Those with doctorates had more than 16 years of professional experience.
These results indicate that the interviewees are well-experienced professionals in
Indonesia. The sample of interviewees are drawn from the researcher’s network as a
senior banker and come from various background of professions. It is hard to get the
responses and time of these people as evident from the fact some of them declined to
take part partly due to the sensitive nature of the research topic in Indonesia. There is no
reason to believe they should be biased.
3.4.2 Does Political Connection Matter?
The majority of interviewees perceived that political connection was needed to compete
in Indonesian business. The level of political connectedness depended on the sector of
the industry, the size of the company, and whether the company was in its early stage or
not.
The majority of interviewees mentioned that the effect of the relationship depended on
which sector the company operated within. A few qualified the scale of the company
(smaller companies required less political connection), and at which stage was company
in (political connectedness being mostly needed for the early stages), the complexity of
the business and whether there were dependencies with the government (the more
dependent they were, the more political connection was needed)
Political connection was not the most important factor for companies to succeed.
Management was the most important factor according to the perceptions of our
interviewees. Management capabilities also needed to be supported by good products
and services, a wide distribution network, good corporate governance, human resources
and R&D innovation. Regarding the external factors required for companies to succeed,
these included access to capital, the choice and growth of the sector, the ability to adapt
and local knowledge.

67
3.4.3 Why the Need for Political Connection?
The results of the in-depth interviews have shown that almost all the interviewees said
there was a need for political connection, citing the following reasons:
to ensure licences and permits were obtained and extended as needed
to access information about new regulations or changes in regulations
to gain access to regulators and bureaucracy
to act as a form of protection.
The most important reason for political connectedness cited by our interviewees was for
‘political protection’. This was due to the uncertainty of regulations and a competition
landscape that could use political connectedness to attack a competitor.
3.4.4 Conditions During and After the Soeharto Era
It is clear from our interviewees that during the Soeharto era, political connection to
Soeharto was critical. Post-Soeharto, changes to democracy did not negate the need for
political connection in business. In fact, some perceived that the need for these links
was even more pronounced, due to power dispersion to local governments. This was
especially true for the oil and gas and mining sectors, where there were many
interactions relating to permits and licences from local governments.
3.4.5 Variation of Political Connection by Sectors of Industry
Most interviewees said that the need for political connectedness varied according to
which sectors of the industry they were in. The majority of interviewees believed that
the mining industry and the oil and gas industry were the two sectors that required the
most political connectedness, as they needed various licences and permits from the
central government level, and more at the regional level since regional autonomy was
established in 2001. Other sectors that required more political connectedness included
the plantation industry and the property, telecommunication and banking sectors. Most
interviewees mentioned that the consumer goods and retail sectors required the least
political connectedness.

68
3.4.6 Mechanisms of Political Connection
Most interviewees viewed the measure used (i.e., whether the board member and their
family members were or were not senior officials in the government, parliament,
judiciary or military) was an appropriate indication of political connectedness.
Other measures to obtain political connections included: through the controlling owner
or majority owner/s (not necessarily through board members); whether the owners had
entered politics; the amount of campaign contributions; the number of projects won
from the government; activities in the industry association; trade group or industry
lobbying groups; and rendering the services of consultants/advisors. The first two
mechanisms—connection through the owners and owners entering politics—were the
most important.
3.4.7 Summary Data Analysis Using Leximancer
To test the robustness of the manual coding, Leximancer was used. Leximancer is data
analysis software for qualitative research, and is particularly useful for the interview
method used in this research. The software can produce an unbiased machine-driven
analysis of data that is then translated into a concept map.
The highest frequency theme in the concept map was ‘political’; this indicates that
‘political’ was the most important theme among the interviewees. The second highest
frequency theme was ‘companies’. Within the political theme, our interviewees
perceived a strong link between the concepts ‘political’, ‘government’, ‘connected’,
‘board’ and ‘commissioners’. Within ‘companies’, they perceived a strong link between
‘companies’, ‘business’ and ‘listed’.
The close proximity of ‘political’ and ‘companies’ indicates a strong relationship,
according to the interviewees’ perceptions. Besides the close proximity, the line
indicates a close relationship between ‘political’ and ‘company’, specifically through
the concepts of ‘commissioner’ and ‘company’. Additionally, the close proximity of the
political and company themes to three other themes—‘Indonesia’, ‘resources’ and
‘sector’—indicates that our interviewees’ viewed the five themes as having a strong
relationship with the high frequency themes. Regarding the sector theme, the theme
with the closest proximity to ‘political’ was ‘resources’, with the two interlinked
69
concepts of ‘mining’ and ‘resources’. This again indicates a stronger relationship
between the political and resources and mining themes.
3.5 Discussion and Implications
Chua (2008) interviewed 51 people: politicians, journalists, economists, academics,
executives and business people. This significant study has provided an interesting
insight into the perceptions of professionals regarding politics and business in Indonesia
in the post-Soeharto era. Chua (2008) used sociological analysis to examine the
relationship between the state and capital in the post-Soeharto era, focusing on Chinese
‘big businesses’ in Indonesia. My approach is based on business and management
strategy and has used a mixed method approach of interviews, as well as regression
analysis. This research has contributed to the body of literature on political connection,
business and firm performance. Using interviews was not easy as the subject matter is
still sensitive for many Indonesians, let alone professionals and business people.
Ethically we kept the interviewees anonymous throughout the study, to maintain as
much openness and frankness from the interview results as possible.
Chua (2008) found that in the post-Soeharto era, capitalists were even more entrenched
after the unravelling of the New Order (of the Soeharto era), to the point that they were
more independent and dominant and had more direct access to power. From the results
of my interviews, political connectedness was indeed still viewed as necessary to
operate a business in Indonesia. However, the need was more for ‘political protection’.
The overwhelming view was that other factors existed that were more important to the
success and competitiveness of a business in Indonesia. Most important among these
was management capability.
Having political connections without good managerial skills could harm a firm’s
performance (Fan, Wong & Zhang 2007). This is supported by Boubakri, Cosset and
Saffar (2009), who found that companies with political connections had lower ROA,
which might be because lower managerial skills result from having political
connections.
Risk is inherent in any business. Hence, as mentioned by van der Eng (2004, p.5),
‘[f]irms explore[d] and found various ways to minimise risks, including political

70
patronage’. In the past, political patronage was concentrated in the hands of President
Soeharto and his family. In the post-Soeharto era, the dispersion of power and the
uncertainty of the political situation in the early years of reformation made it more
difficult to seek political protection. As Chua (2008) has mentioned, business people
soon found ways to mitigate their risks and operate within the new environment. In fact,
their capital was needed even more by politicians as a source of finance to run for
office.
Exploitation of Indonesia’s natural resources has occurred since the Soeharto era.
Exploitation rights were given to Soeharto’s close friends and were viewed as a way to
strengthen his regime (Gellert 2005; Seda 2005). Despite the natural resources sector
being replaced by manufacturing as the main engine of growth since the 1980s, this
sector remains important. Fairer revenue sharing between central and local governments
from natural resources followed the establishment of regional autonomy (Alisyahbana
2005). However, this also created issues such as unclear land tenure, weak law
enforcement and inconsistent law and regulations (Fox, Adjuri & Pradnja 2005). In
addition, this also changed the corruption and political patronage patterns, whereby a
centralised system now became a diffused system (Seda 2005). This was observed and
clearly voiced by our interviewees when comparing conditions during and after the
Soeharto era.
As mentioned in the literature review, there are various ways for businesses to connect
with politics. In the US, having directors with a political background is a way to
accommodate business with bureaucrats (Agrawal & Knoeber 2001). Stronger
connections, for example with owners having close relationships, rather than directors,
and having close relationships with ministers rather than members of parliament, seem
to be beneficial to firm performance (Faccio 2007, 2010). In Thailand, when owners
enter politics this will typically increase their firm’s value (Bunkanwanicha &
Wiwattanakantang 2008). Whether political connections add value to a firm’s
performance in Indonesia will be the key research question in Chapter 4.
Similarly, our interviewees viewed that connections through owners or through the
owners entering politics were other mechanisms to connect business and politics,
perhaps in even more effective and pervasive ways.

71

72
Chapter 4: Political Connection and Firm Performance in
Indonesia
4.1 Introduction
In this chapter, the correlation between political connection and firm performance has
been analysed to determine whether political connection could enhance a firm’s
performance. The analysis has focused on two of the last six research questions on page
3 of Chapter 1:
1. Do political connections affect a firm’s performance in Indonesia?
2. Does the number of politically exposed persons (PEPs) on a board affect a
firm’s performance in Indonesia?
4.2 Background and Hypotheses
4.2.1 Research Background
During the Soeharto regime, politically well-connected firms were provided with
substantial economic benefits in the form of exclusive import licences, bail-outs and
favourable financing (Borsuk & Chng 2014; Muhaimin 1991; Shin 1989; Yoshihara
1988). One of the many advantages of being politically connected in business is easier
access to the debt market (Khwaja & Mian, 2005). Backman (2001) has noted that
Tommy Soeharto (President Soeharto’s son) was able to obtain easy debt financing for
his corporations, by virtue of his father’s intervention.
Fisman (2001) has studied the movement of company stock prices for those connected
to President Soeharto with news about the President’s health to estimate the value of
political connection in Indonesia. Johnson and Mitton (2003) have examined the effects
of political connectedness in Malaysia by analysing changes in the market value of
connected firms in the wake of the AFC. Faccio (2007) has studied whether political
connections affected firm performance across the Asia Pacific. Overall, these studies
support the notion that political connections affect a firm’s market value.

73
Bunkanwanicha and Wiwattanakantang (2008) have approached the matter of politics
and business differently. They investigated the effect of business owners seeking the top
office in Thailand. They found that the market valuation of firms increased significantly
when the business owners were connected with the Prime Minister of Thailand. There
was no significant effect of political power on financing; rather, the person with the
power used policy regulations as a mechanism to grant state favours to politically
connected firms. Such policies hindered domestic and foreign competitors. As a result,
these politically connected firms were able to capture a greater market share.
Other researchers have found that political connection without good management could
be potentially harmful to a firm’s performance (Fan, Wong & Zhang 2007). Their
results have suggested that firms with political connection had lower ROA. Fan, Wong
and Zhang’s (2007) paper has suggested that other factors were more dominant in
affecting a firm’s value, notably managerial skills.
Costs are incurred through having political connections; for example, the distribution of
the company’s wealth to politicians in exchange for (1) the rights to establish
monopolies, (2) the granting of concessions, licences, quotas and permits, and (3)
preferential treatment in the tendering of construction projects (Pathmanand 2006).
Hence, empirical quantitative analysis is needed to check if political connections have
any value to a firm’s performance.
4.2.2 Research Hypotheses
North (1991) has explained that formal and informal institutions must exist in a country
for that country’s economy and market to function. Formal institutions consist of formal
rules and regulations, laws and statutes, property rights, policies and procedures, and
govern the socio-economic and political aspects of society. Informal institutions can
include sanctions, customs, traditions and unwritten codes of conduct.
Neoclassical economics assumes that information flow between buyers and sellers is
perfect, transactions are frictionless, and that an unconstrained market access exists for
both buyers and sellers (Coase 1937). However, it is well known that these assumptions
are not realised, even in developed markets, and the violation of these ‘rules’ is even
more pronounced in emerging markets (Khanna & Palepu 2010). Thus, Khanna and

74
Palepu (2010) have argued that for emerging markets, the institutional approach helps to
build a more realistic model than does the approach of neoclassical economics.
The existence of transactional costs and the asymmetry of information cause market
imperfection. This results in the non-existence or lack of market intermediaries in
emerging markets, known as ‘institutional voids’ (Khanna & Palepu 2010). Khanna and
Palepu (2010) have expanded the research from previous studies on institutional
economics by Coase (1937), Williamson (1985) and North (1991).
Informal institutions are more pertinent in emerging market economies where the
contract implementation is more fragile due to deficient legal frameworks (Khanna &
Palepu 2010). As such, informal institutions are important to minimise uncertainty and
enhance reliability (Khanna & Palepu 1997; Peng & Jiang 2002). Relational ties,
networks and government contacts have been prevalent and are assigned an enabler and
extra role in business functioning. Peng and Jiang (2002) have argued that two reasons
exist to explain why informal institutions are important: formal institutions are not able
to provide a credible legal framework, and the volatility of political setups could affect
the function of government and market operations.
Informal institutions and personal ties in Asian markets are vital to accomplish
corporate targets and govern corporate and business issues (Peng & Jiang 2002;
Studwell 2008). This is because emerging Asian economies have weak corporate
governance (La Porta, Lopez-de-Silanes & Shleifer 1999). The types of informal
structures relied upon by Asian family firms are networks that are based on trust and
loyalty with family, close friends and governmental officials (Peng & Jiang 2002).
Being politically connected can therefore be considered as a way of using those
informal institutions to maintain competitiveness.
Having political connections could result in better firm performance. This is because
firms can obtain some benefits, such as easier access to debt financing (Khwaja & Mian
2005); in addition, more favourable regulations for politically connected companies can
be achieved (Bunkanwanicha & Wiwattanakantang 2008).
Therefore, the hypotheses of this study can be stated as follows:
hypothesis 1: politically connected firms have better firm performance

75
hypothesis 2: firm performance is associated with the number of board members
who are politically connected.
The analysis focuses on the last two research questions on page 3 of Chapter 1 and has
been re-iterated on section 4.1 Chapter 4.
4.3 Research Design
4.3.1 Sample and Time Period
The research sample consists of companies listed on the IDX. Annual data have been
used in the analysis; the financial year-end date is 31 December in Indonesia. For
comparability, listed companies in the financial sector have been excluded. This was
done as the financial and market ratios calculated for companies in the financial sector
are different to those for companies in the non-financial sector.
The sample period ran from 2009 to 2013. The sample period began in 2009 to avoid
any confounding effects of the GFC that began in 2008.9 The choice of a five-year
observation was to obtain enough data for running the regression. The number of
observations totalled 2,196. This decreased to 1,989 observations due to the exclusion
of ROA missing data.
4.3.2 Research Data
4.3.2.1 Data Collection Method
The secondary data of all companies listed on the IDX were collected from a number of
sources, as described below:
1. Financial statements: the balance sheets, income statements, cash flows,
financial and operating ratios, as well as market data (market capitalisation,
enterprise values, dividends and share prices) of all listed Indonesian companies
(i.e., 485 companies) were sourced from Bloomberg and IDX for five years.
2. Announcements about changes to the boards of commissioners or boards of
directors made by the listed companies. These announcements are required by
9 The majority of the Indonesian companies were not significantly affected by the GFC (Tambunan, 2010;
Wie 2012).

76
IDX regulation and were released to the general public and published in
newspapers.
3. Lists of directors and commissioners of all listed companies in Indonesia. These
were collected from annual reports, company websites and IDX website.
To compile a dataset of politically connected listed companies, each director or
commissioner had to have their PEP status verified. This involved manual checking of
their resumes from annual reports and company websites.
4.3.2.2 Independent Variables
This study has adapted Faccio’s (2006, 2010) definition of politically connected firms.
Faccio has defined a company as being politically connected if one of its top directors
(CEO, president, vice president or secretary) is a MP, or a minister, or has been closely
related to a top politician or party.10
In contrast, I classify a company as being politically
connected if any members of the board of directors or commissioners are:
1. Presidents, former presidents, families and aides to presidents.
2. Ministers, former ministers or in a position at a similar level to ministers (e.g.,
police chief, army chief, attorney general chief judge).
3. Director-generals or secretary-generals or deputy ministers (a position one level
below a minister) and directors (two positions below the ministerial level) and
former officials of the above.
4. Public officials or former public officials in a regulator body such as the
Financial Services Authority (OJK), the Central Bank (BI) or the MOF.
5. An immediate family member of individuals mentioned in numbers 1–5, such as
spouse, parents, siblings, children and spouse’s parents or siblings.
6. Any individuals publicly known (or actually known) to be a close personal or
professional associate.
Firm performance has been measured by ROA, Tobin’s Q and market-adjusted returns.
Calculation of ROA uses data from financial statements and the calculation of Tobin Q
uses data from financial statements and market data from IDX. The calculation of
10
However, unlike Faccio (2006, 2010), I do not define a company as being politically connected if at
least one of its large shareholders (i.e., a shareholder controlling at least 10% of voting shares) due to the
lack of readily and publicly available data on the UBOs of the listed companies in Indonesia.
77
market-adjusted return uses the data of companies’ share prices and the price of the
Index Harga Saham Gabungan (IHSG or Jakarta Composite Index) as the market price.
The data of a company’s establishment, which will be used as measurement of the age
variable, have been compiled from annual reports and company websites. The exchange
rates of IDR to USD have been obtained from Bloomberg.
4.3.3 Research Models
4.3.3.1 Dependent Variables
I have followed Faccio (2006, 2010), using ROA as a measure of accounting operating
firm performance. I have also followed Morck, Shleifer and Vishny (1988) and have
used Tobin’s Q as a proxy for a firm’s market valuation. To compute Tobin’s Q, I used
the method suggested by Schlingemann, Stulz & Walkling (2002). Tobin’s Q is defined
as the ratio of the book value of assets minus the book value of equity plus the market
value of equity to the book value of assets. Further, following Braun and Sharma
(2007), market-adjusted return has been applied as another measure of market-based
firm performance. The market-adjusted return has been calculated by subtracting the
share price return with market return; in this case, I used the IDX composite price index
(IHSG).
Differences exist between accounting operating firm performance and market-based
firm performance. Demsetz and Villalonga (2001) have noted that while accounting
firm performance is backward looking, Tobin’s Q and market-adjusted returns are more
forward looking. Accounting firm performance measures what management has
achieved. The achievement is measured by accountants following a set of accounting
standards. In contrast, Tobin’s Q reflects the value assigned by investors on a firm’s
intangible assets, based on predicted future revenue streams. Hence, it could be seen as
assigning a value on what the management may achieve. Tobin’s Q is therefore
determined by investors’ perceptions (i.e., optimism, pessimism) (Demsetz &
Villalonga 2001). Similar to Tobin’s Q, market-adjusted returns reflect the perceptions
of investors regarding the value of companies relative to the overall market (Braun &
Sharma 2007).
78
4.3.3.2 Control Variables
I have used the following control variables:
Size = log normal of total asset for each company.
Leverage = proportion of total debt to total assets for each company.
Age = length of company’s establishment.
deltaExchange Rate = percentage change of IDR to USD exchange rates from
the previous year.
Majumdar (1997) and Braun and Sharma (2007) have examined size and age, and their
effect on firm performance. Size has also been used by Helwina and Lukviawarman
(2007), as total assets are the resources within firms used to run the business and
generate returns.
Dogan (2013) has examined the effect of leverage on ROA using firms in Turkey.
Braun and Sharma (2007) have also used leverage as a control variable as it could
provide a mechanism to check agency cost. In addition, Bartov and Bodnar (1994) have
applied change in currency as control variable for examining a firm’s performance as
companies with transactions in foreign exchanges would be exposed to exchange rate
movements. Companies with net short economic positions would suffer if depreciation
occurred, but they could benefit from appreciation. Conversely, companies with a net
long economic position could benefit from appreciation depreciation.
4.3.3.3 Ordinary Least Squares
This study aims to examine the effects of board members with political affiliations and
connections on firm performance, using control variables such as size, age, leverage and
changes in exchange rates as a macroeconomic indicator. Firm performances are
measured by their ROA, Tobin Q and market-adjusted returns. Political connection may
not be the only variable determining firm performance.
This research has used data from many companies over many years. Thus, panel data is
appropriate for this study. If the companies had the same number of time series data,
this was known as balanced panel data. However, the number of observations within

79
companies had different numbers of time series data, so the data used were unbalanced
panel data.
4.3.3.4 Research Model
The research model has been adapted from a similar study by Helwina and
Lukviawarman (2007) in corporate governance. The difference in the model is that this
study has applied PEP and the number of PEP (NUM) instead of board composition
(BODCOM) and concentrated ownership (CONTR),11
whereas size and leverage have
remained as control variables.
This research model has also followed an empirical study by Faccio (2007), who used
accounting performances such as ROA and market-to-book ratios as the dependent
variables and political connection as the independent variable.
Thus, the research model used in this study is as follows:
yi,t = α + β1PEPi,t + β2NUMi,t + β3SIZEi,t + β4LEVi,t + β5AGEi,t + β6deltaExchRatei,t +
Ei,t (1)
yi,t = ROA, Tobin’s Q, and market-adjusted return for every i company in year t
ROAi,t = net incomei,t/total assetsi,t
Tobin’s Q = (total assetsi,t - total equityi,t + market capi,t)/total assetsi,t
Market-adjusted return = (pricei,t – pricei,t-1) – (pricem,t – pricem,t-1)
PEPii,t = Dummy variable of politically connected firms for every i company in
year t, which takes the value of 0 for company that does not have political
connection and a value of 1 otherwise
NUMi,t = Number of politically connected people for company i in year t
SIZEi,t = ln (log normal) of total assets for company i in year t
LEVi,t = proportion of total debt to total assets for company i in year t
AGEi,t = length of company i establishment until year t
deltaExchRatet = percentage change of IDR/USD for year t
Ei,t = error term for company i in year t
a = constant
11
BODCOM is defined as the proportion of Independent Commissioners to total number of
commissioners and CONTR is defined as individual or institutional owning 50% or more shares.

80
b = coefficient of variables.
A panel regression with fixed effect was used, as the sample of observations did not
show any significant change throughout the years. The sample has remained relatively
stable. Fixed effects are an alternative to random effects and the pooled least square
method. The fixed effect approach provides an intercept for each individual (company)
and/or time.
4.4 Results
4.4.1 Overview of Sample
Table 4.1 shows the number of companies with PEPs increased during the sample
period 2009 to 2013. This number was around 23 to 27% of the total companies listed in
IDX and 29 to 34% of the total non-financial companies in the IDX. Moreover, the
highest number of PEP in one company was seven. Most companies had one or two
PEPs on their boards.

81
Table 4.1: Number of Companies with PEP and the Number of PEPs
Number of PEPs Number of Companies
2009 2010 2011 2012 2013
Total Companies Listed on IDX 497 520 546 571 603
Total Non-Financial Companies 394 415 439 462 486
Total PEP Companies 115 137 148 156 158
Number of PEPs in Companies
1 66 81 86 91 91
2 31 33 34 34 30
3 9 13 17 16 21
4 5 4 3 5 6
5 2 4 5 5 4
6 1 1 1 3 3
7 1 1 2 2 3
Total PEP Companies 115 137 148 156 158
Source: regression results
4.4.2 Descriptive Statistics and Correlation
Before examining the regression results, the descriptive statistics of the data are given in
the following table.
Table 4.2: Descriptive Statistics of Variables
Variable Observations Mean Std Dev Minimum Maximum
PEP 1,989 0.3589 0.4798 0 1
NUM 1,989 0.6415 1.1351 0 7
ROA 1,989 6.1629 30.771 -135.8 890.2
Tobin’s Q 1,989 0.9252 1.5458 0 20.1991
Return 1,940 -1.4489 5.0385 -52.9087 18.685
Age 1,989 25.182 15.9574 -4 108
DeltaExchangeRate 1,989 0.0139 0.0844 -0.0990 0.1009
TD/TE 1,989 0.6668 4.2499
-
110.5789 65.2232
Source: regression results
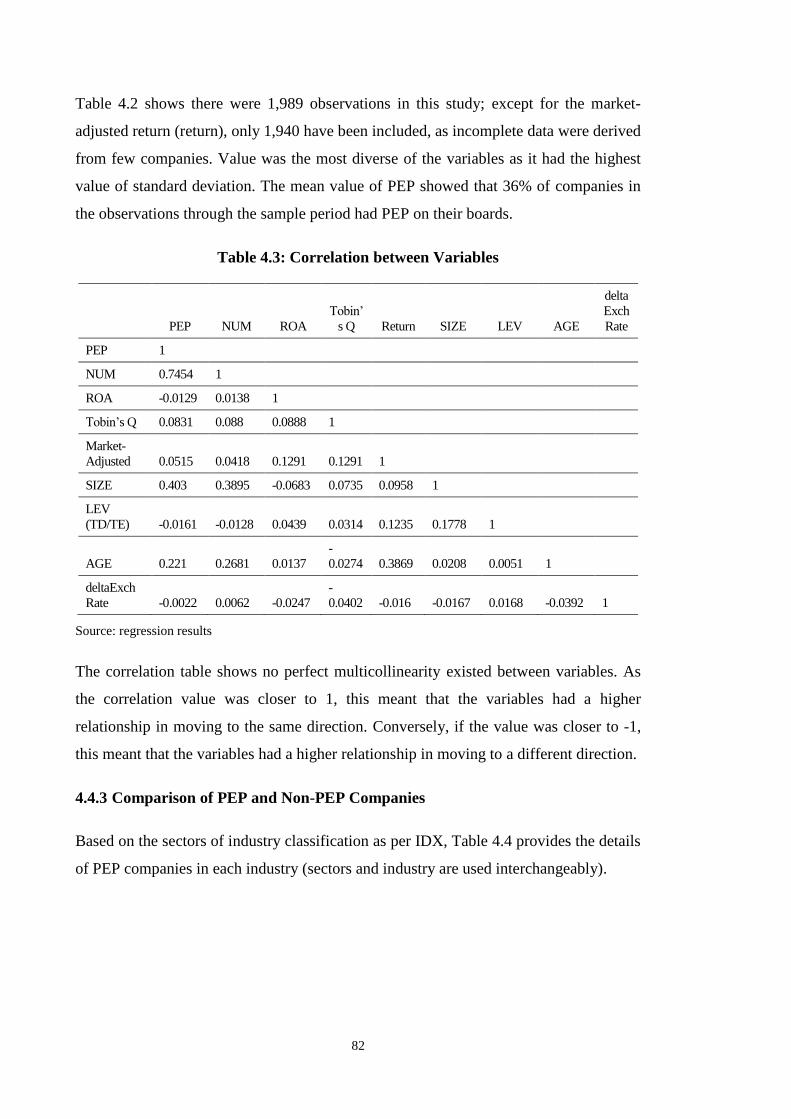
82
Table 4.2 shows there were 1,989 observations in this study; except for the market-
adjusted return (return), only 1,940 have been included, as incomplete data were derived
from few companies. Value was the most diverse of the variables as it had the highest
value of standard deviation. The mean value of PEP showed that 36% of companies in
the observations through the sample period had PEP on their boards.
Table 4.3: Correlation between Variables
PEP NUM ROA
Tobin’
s Q Return SIZE LEV AGE
delta
Exch
Rate
PEP 1
NUM 0.7454 1
ROA -0.0129 0.0138 1
Tobin’s Q 0.0831 0.088 0.0888 1
Market-
Adjusted 0.0515 0.0418 0.1291 0.1291 1
SIZE 0.403 0.3895 -0.0683 0.0735 0.0958 1
LEV
(TD/TE) -0.0161 -0.0128 0.0439 0.0314 0.1235 0.1778 1
AGE 0.221 0.2681 0.0137
-
0.0274 0.3869 0.0208 0.0051 1
deltaExch
Rate -0.0022 0.0062 -0.0247
-
0.0402 -0.016 -0.0167 0.0168 -0.0392 1
Source: regression results
The correlation table shows no perfect multicollinearity existed between variables. As
the correlation value was closer to 1, this meant that the variables had a higher
relationship in moving to the same direction. Conversely, if the value was closer to -1,
this meant that the variables had a higher relationship in moving to a different direction.
4.4.3 Comparison of PEP and Non-PEP Companies
Based on the sectors of industry classification as per IDX, Table 4.4 provides the details
of PEP companies in each industry (sectors and industry are used interchangeably).
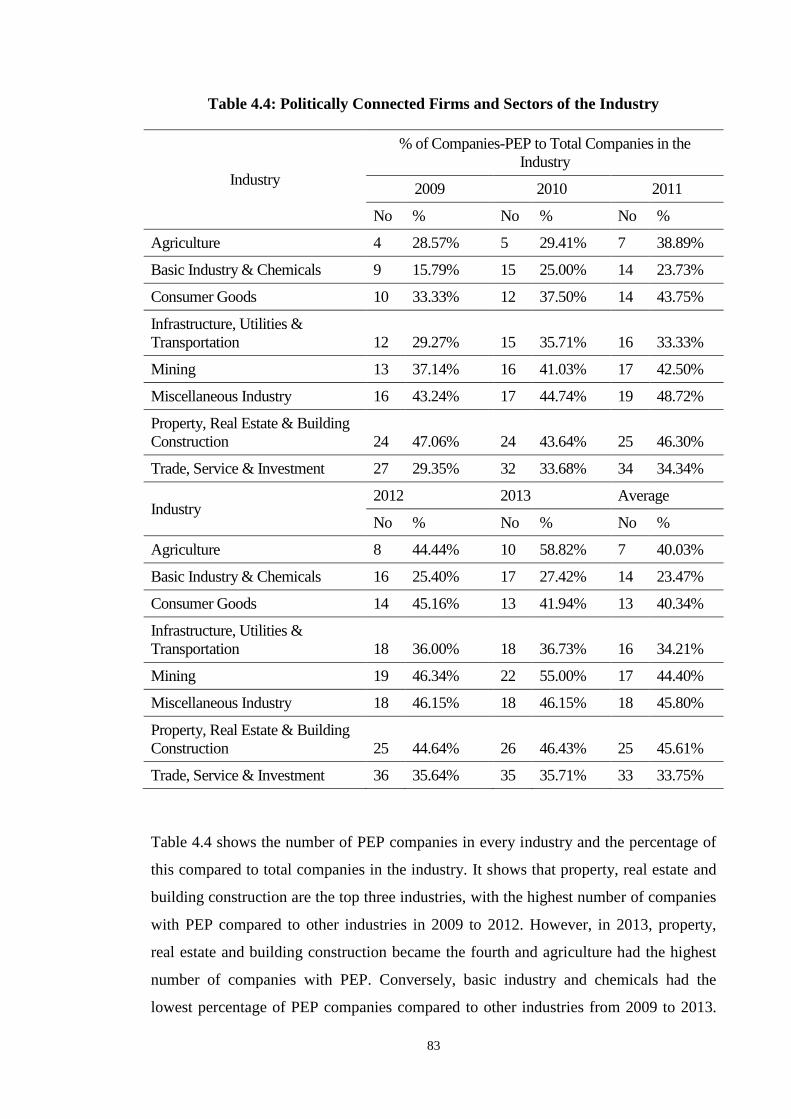
83
Table 4.4: Politically Connected Firms and Sectors of the Industry
Industry
% of Companies-PEP to Total Companies in the
Industry
2009 2010 2011
No % No % No %
Agriculture 4 28.57% 5 29.41% 7 38.89%
Basic Industry & Chemicals 9 15.79% 15 25.00% 14 23.73%
Consumer Goods 10 33.33% 12 37.50% 14 43.75%
Infrastructure, Utilities &
Transportation 12 29.27% 15 35.71% 16 33.33%
Mining 13 37.14% 16 41.03% 17 42.50%
Miscellaneous Industry 16 43.24% 17 44.74% 19 48.72%
Property, Real Estate & Building
Construction 24 47.06% 24 43.64% 25 46.30%
Trade, Service & Investment 27 29.35% 32 33.68% 34 34.34%
Industry 2012 2013 Average
No % No % No %
Agriculture 8 44.44% 10 58.82% 7 40.03%
Basic Industry & Chemicals 16 25.40% 17 27.42% 14 23.47%
Consumer Goods 14 45.16% 13 41.94% 13 40.34%
Infrastructure, Utilities &
Transportation 18 36.00% 18 36.73% 16 34.21%
Mining 19 46.34% 22 55.00% 17 44.40%
Miscellaneous Industry 18 46.15% 18 46.15% 18 45.80%
Property, Real Estate & Building
Construction 25 44.64% 26 46.43% 25 45.61%
Trade, Service & Investment 36 35.64% 35 35.71% 33 33.75%
Table 4.4 shows the number of PEP companies in every industry and the percentage of
this compared to total companies in the industry. It shows that property, real estate and
building construction are the top three industries, with the highest number of companies
with PEP compared to other industries in 2009 to 2012. However, in 2013, property,
real estate and building construction became the fourth and agriculture had the highest
number of companies with PEP. Conversely, basic industry and chemicals had the
lowest percentage of PEP companies compared to other industries from 2009 to 2013.
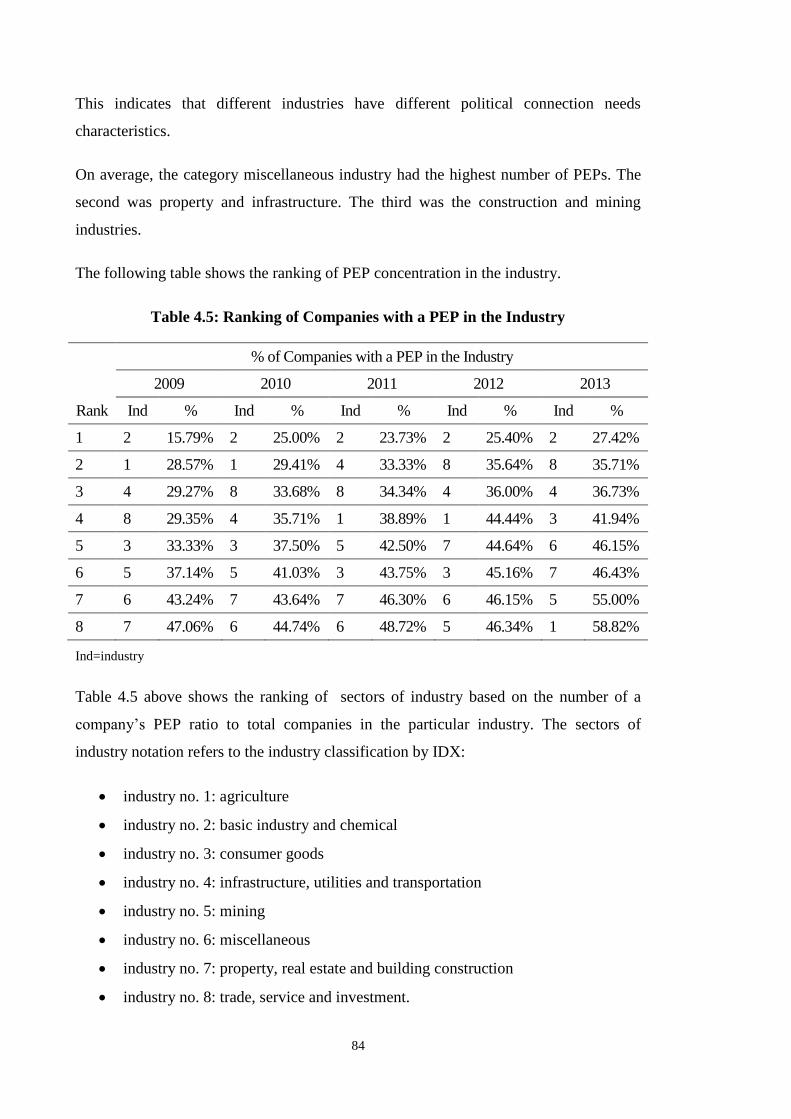
84
This indicates that different industries have different political connection needs
characteristics.
On average, the category miscellaneous industry had the highest number of PEPs. The
second was property and infrastructure. The third was the construction and mining
industries.
The following table shows the ranking of PEP concentration in the industry.
Table 4.5: Ranking of Companies with a PEP in the Industry
Rank
% of Companies with a PEP in the Industry
2009 2010 2011 2012 2013
Ind % Ind % Ind % Ind % Ind %
1 2 15.79% 2 25.00% 2 23.73% 2 25.40% 2 27.42%
2 1 28.57% 1 29.41% 4 33.33% 8 35.64% 8 35.71%
3 4 29.27% 8 33.68% 8 34.34% 4 36.00% 4 36.73%
4 8 29.35% 4 35.71% 1 38.89% 1 44.44% 3 41.94%
5 3 33.33% 3 37.50% 5 42.50% 7 44.64% 6 46.15%
6 5 37.14% 5 41.03% 3 43.75% 3 45.16% 7 46.43%
7 6 43.24% 7 43.64% 7 46.30% 6 46.15% 5 55.00%
8 7 47.06% 6 44.74% 6 48.72% 5 46.34% 1 58.82%
Ind=industry
Table 4.5 above shows the ranking of sectors of industry based on the number of a
company’s PEP ratio to total companies in the particular industry. The sectors of
industry notation refers to the industry classification by IDX:
industry no. 1: agriculture
industry no. 2: basic industry and chemical
industry no. 3: consumer goods
industry no. 4: infrastructure, utilities and transportation
industry no. 5: mining
industry no. 6: miscellaneous
industry no. 7: property, real estate and building construction
industry no. 8: trade, service and investment.
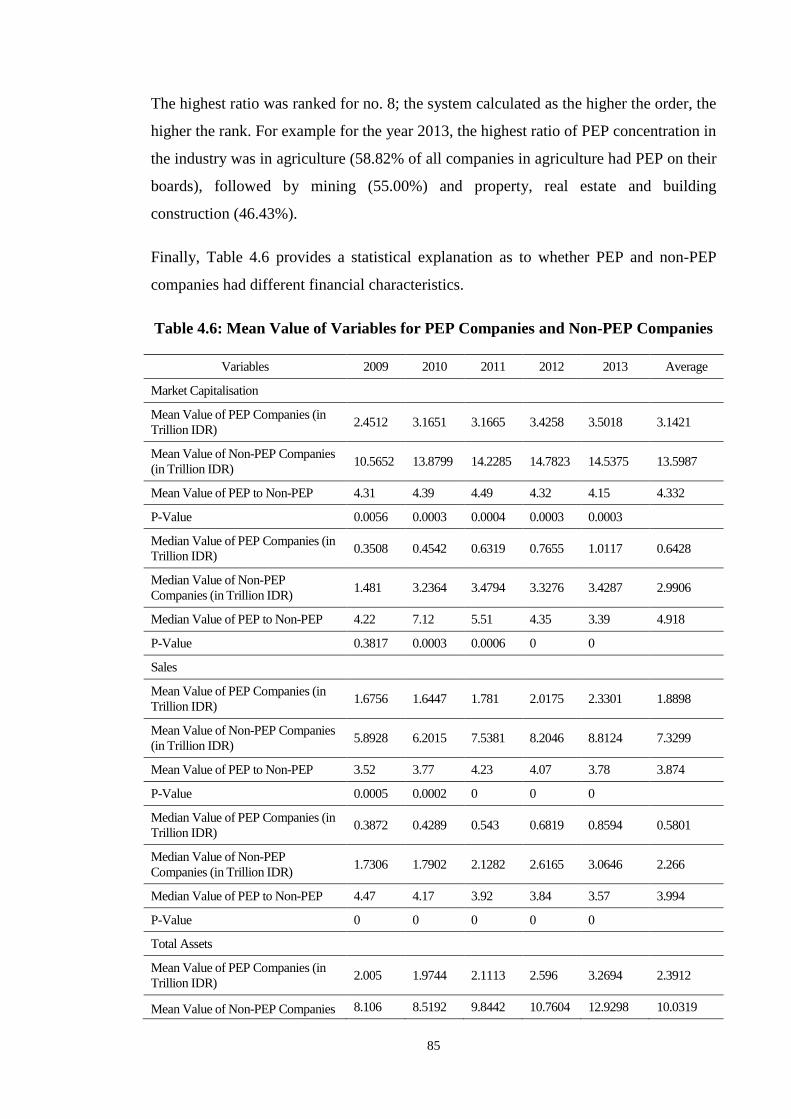
85
The highest ratio was ranked for no. 8; the system calculated as the higher the order, the
higher the rank. For example for the year 2013, the highest ratio of PEP concentration in
the industry was in agriculture (58.82% of all companies in agriculture had PEP on their
boards), followed by mining (55.00%) and property, real estate and building
construction (46.43%).
Finally, Table 4.6 provides a statistical explanation as to whether PEP and non-PEP
companies had different financial characteristics.
Table 4.6: Mean Value of Variables for PEP Companies and Non-PEP Companies
Variables 2009 2010 2011 2012 2013 Average
Market Capitalisation
Mean Value of PEP Companies (in
Trillion IDR) 2.4512 3.1651 3.1665 3.4258 3.5018 3.1421
Mean Value of Non-PEP Companies
(in Trillion IDR) 10.5652 13.8799 14.2285 14.7823 14.5375 13.5987
Mean Value of PEP to Non-PEP 4.31 4.39 4.49 4.32 4.15 4.332
P-Value 0.0056 0.0003 0.0004 0.0003 0.0003
Median Value of PEP Companies (in
Trillion IDR) 0.3508 0.4542 0.6319 0.7655 1.0117 0.6428
Median Value of Non-PEP
Companies (in Trillion IDR) 1.481 3.2364 3.4794 3.3276 3.4287 2.9906
Median Value of PEP to Non-PEP 4.22 7.12 5.51 4.35 3.39 4.918
P-Value 0.3817 0.0003 0.0006 0 0
Sales
Mean Value of PEP Companies (in
Trillion IDR) 1.6756 1.6447 1.781 2.0175 2.3301 1.8898
Mean Value of Non-PEP Companies
(in Trillion IDR) 5.8928 6.2015 7.5381 8.2046 8.8124 7.3299
Mean Value of PEP to Non-PEP 3.52 3.77 4.23 4.07 3.78 3.874
P-Value 0.0005 0.0002 0 0 0
Median Value of PEP Companies (in
Trillion IDR) 0.3872 0.4289 0.543 0.6819 0.8594 0.5801
Median Value of Non-PEP
Companies (in Trillion IDR) 1.7306 1.7902 2.1282 2.6165 3.0646 2.266
Median Value of PEP to Non-PEP 4.47 4.17 3.92 3.84 3.57 3.994
P-Value 0 0 0 0 0
Total Assets
Mean Value of PEP Companies (in
Trillion IDR) 2.005 1.9744 2.1113 2.596 3.2694 2.3912
Mean Value of Non-PEP Companies 8.106 8.5192 9.8442 10.7604 12.9298 10.0319

86
Variables 2009 2010 2011 2012 2013 Average
(in Trillion IDR)
Mean Value of PEP to Non-PEP 4.04 4.31 4.66 4.15 3.95 4.222
P-Value 0 0 0 0 0
Median Value of PEP Companies (in
Trillion IDR) 0.5427 0.6008 0.8414 1.059 1.367 0.8822
Median Value of Non-PEP
Companies (in Trillion IDR) 2.8302 3.5896 4.0038 4.186 5.5536 4.0326
Median Value of PEP to Non-PEP 5.22 5.97 4.76 3.95 4.06 4.792
P-Value 0 0 0 0 0
Profits
Mean Value of PEP Companies
(in Trillion IDR) 55.2691 70.5697 84.9267 72.5038 57.1912 68.0921
Mean Value of Non-PEP Companies
(in Trillion IDR) 15.2987 13.3925 16.9407 13.2619 13.0585 14.3904
Mean Value of PEP to Non-PEP 3.6127 5.2693 5.0132 5.4671 4.3796 4.7484
P-Value 0.0244 0.0031 0.0005 0.0047 0.0588
Median Value of PEP Companies (in
Trillion IDR) 10.9402 19.2589 15.2988 12.8254 10.8141 13.8275
Median Value of Non-PEP
Companies (in Trillion IDR) 1.221 2.1692 3.1416 4.1591 4.2942 2.997
Median Value of PEP to Non-PEP 8.9602 8.8781 4.8698 3.0837 2.5183 5.662
P-Value 0.0001 0.0002 0 0.0144 0.0389
ROA
Mean Value of PEP Companies
(in Trillion IDR) 5.6824 5.5303 4.4524 5.474 5.7418 5.5661
Mean Value of Non-PEP Companies
(in Trillion IDR) 6.8540 7.6789 9.7412 5.2875 4.5244 6.5369
Mean Value of PEP to Non-PEP 1.2062 1.3885 2.1879 0.9659 0.7880 1.1744
P-Value 0.2038 0.2985 0.0904 0.4335 0.1477 0.2056
Median Value of PEP Companies (in
Trillion IDR) 4.2 4.6 4.1 5.25 4.15 4.3
Median Value of Non-PEP
Companies (in Trillion IDR) 4.1 5.1 4.55 4.3 4 4.5
Median Value of PEP to Non-PEP 0.9762 1.1087 1.1098 0.8190 0.9639 1.0465
P-Value 0.6084 0.1705 0.8149 0.3692 0.8115 0.717
TDTE
Mean Value of PEP Companies
(in Trillion IDR) 1.4078 0.0141 0.5259 0.5541 0.8117 0.6425
Mean Value of Non-PEP Companies
(in Trillion IDR) 0.9233 0.8253 0.4077 0.7454 0.518 0.6819
Mean Value of PEP to Non-PEP 0.6558 58.5319 0.7752 1.3452 0.6382 1.0613
P-Value 0.1986 0.1615 0.3831 0.1949 0.0575 0.4287

87
Variables 2009 2010 2011 2012 2013 Average
Median Value of PEP Companies (in
Trillion IDR) 0.4513 0.3661 0.4127 0.3769 0.4166 0.4047
Median Value of Non-PEP
Companies (in Trillion IDR) 0.3692 0.4084 0.3025 0.3654 0.3599 0.3612
Median Value of PEP to Non-PEP 0.8181 1.1155 0.7330 0.9695 0.8638 0.8925
P-Value 0.1619 0.8078 0.8138 0.3659 0.6300 0.6611
Number of Observations
Non-PEP Companies 259 259 260 263 254 259
PEP Companies 111 133 144 152 154 139
*p-value is significant when the value is smaller than 1%
Table 4.6 provides the average value of market capitalisation, sales, total assets, profits,
ROA and leverage (total debt/total equity) for PEP companies and non-PEP companies.
It also illustrates by how many times the value of financial characteristics of PEP
companies outweigh the non-PEP companies. The probability value (p-value) was
included to examine whether a significant difference existed between both groups of
companies.
The results have revealed that PEP companies have a higher average (mean) value of
market capitalisation, sales and total assets. The mean value of market capitalisation for
PEP to non-PEP companies was 4.31 times in 2009; this means that PEP companies in
2009 had 4.31 times the average market capitalisation when compared to non-PEP
companies. Further, the p-values indicate the obvious differences in average values of
the financial characteristics between PEP and non-PEP companies, as the hypothesis is
that there is no difference between these values.
In addition, PEP companies had a higher median value of market capitalisation, sales,
total assets and profits when compared to non-PEP companies. The p-values indicate
the obvious difference in the median value of financial characteristics between PEP and
non-PEP companies, as the hypothesis is that there is no difference between these
values.
The mean and median value of PEP and non-PEP companies did not differ in value.
This means that the ROA and leverage values between PEP and non-PEP companies
were relatively similar, even though non-PEP companies always had a higher value
across time.

88
4.4.4 Regression Model Results
The regression was conducted three times for each dependent variable: ROA, Tobin’s Q
and Return (market-adjusted return) with the same specifications of independent
variables as in Model 1. Table 4.6 shows the regression results.
Table 4.7: Regression Results
Variables Panel
ROA Tobin’s Q Return
Constant 23.0766*** 0.1289 -7.1305***
(5.8726) (0.2946) (0.8923)
PEP 0.1026 0.1773** -0.5711**
(1.5395) (0.0772) (0.2325)
Size -1.3987*** 0.0491** 0.4117***
(0.4293) (0.0215) (0.0651)
TDTE -0.1923 -0.0144* 0.0021
(0.1625) (0.0081) (0.0244)
Age 0.1127** 0.0019 -0.0113*
(0.0444) (0.0022) (0.0067)
deltaExchange 4.9642 -0.3417 22.9969***
(8.1869) (0.4106) (1.2499)
Observations 1984 1984 1935
Prob(F) 0.0041 0.0003 0.0000
Adj R-squared 0.0062 0.0090 0.1653
*,**,*** means significant in 10%, 5% & 1% respectively
Numbers in parentheses are standard errors for each coefficient
Source: regression results
Table 4.7 reveals that all the models are valid as the value of F-statistics was significant:
as shown, the value is less than 1%. The R-squared values are 0.62%, 0.90% and
16.53% respectively. This means the independent variables could explain 0.62%,
0.90% and 16.53% of the dependent variable respectively.
89
The results indicate that PEPs have a significant effect on Tobin’s Q and market-
adjusted returns, but not on ROA. PEPs have positive effects on Tobin’s Q. This implies
that companies with PEPs have higher Tobin’s Q compared to companies without PEPs,
and vice versa for market-adjusted returns.
Size has a significant effect on ROA, Tobin’s Q and market-adjusted returns. The
effects are positive on Tobin’s Q and Return, but negative on ROA. This means that
higher total assets would increase Tobin’s Q and Return, but would decrease ROA.
Moreover, leverage only has an effect on Tobin’s Q, with a negative sign. This implies
that higher leverages would decrease the value of Tobin’s Q. In contrast, changes in
exchange rates only have an effect on market-adjusted returns with positive signs. The
higher the change in exchange rates, the higher the value of market-adjusted returns.
Finally, variable age has significant effects on ROA and market-adjusted returns, with
different signs. The older companies would have a higher value of ROA, but a lower
value of market-adjusted return.
To answer the second hypothesis, an investigation into the effects of the number of
board members was conducted. The regression results of NUM to ROA, Tobin’s Q, and
market-adjusted returns are as follows.
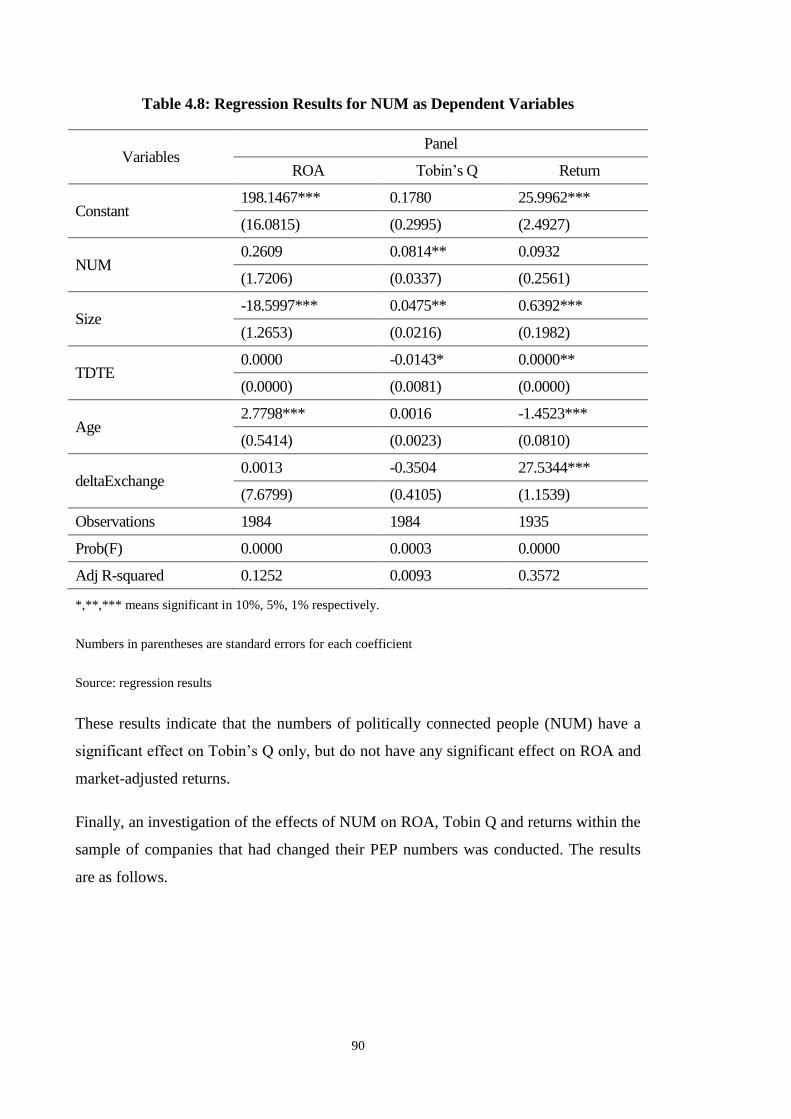
90
Table 4.8: Regression Results for NUM as Dependent Variables
Variables Panel
ROA Tobin’s Q Return
Constant 198.1467*** 0.1780 25.9962***
(16.0815) (0.2995) (2.4927)
NUM 0.2609 0.0814** 0.0932
(1.7206) (0.0337) (0.2561)
Size -18.5997*** 0.0475** 0.6392***
(1.2653) (0.0216) (0.1982)
TDTE 0.0000 -0.0143* 0.0000**
(0.0000) (0.0081) (0.0000)
Age 2.7798*** 0.0016 -1.4523***
(0.5414) (0.0023) (0.0810)
deltaExchange 0.0013 -0.3504 27.5344***
(7.6799) (0.4105) (1.1539)
Observations 1984 1984 1935
Prob(F) 0.0000 0.0003 0.0000
Adj R-squared 0.1252 0.0093 0.3572
*,**,*** means significant in 10%, 5%, 1% respectively.
Numbers in parentheses are standard errors for each coefficient
Source: regression results
These results indicate that the numbers of politically connected people (NUM) have a
significant effect on Tobin’s Q only, but do not have any significant effect on ROA and
market-adjusted returns.
Finally, an investigation of the effects of NUM on ROA, Tobin Q and returns within the
sample of companies that had changed their PEP numbers was conducted. The results
are as follows.

91
Table 4.9: Regression Results for Changing NUM
Variables Panel
ROA Tobin’s Q Return
Constant -12.2521*** -0.7666 -8.5579***
(4.3128) (0.5270) (1.5463)
NUM 0.7407* 0.0136 0.1866
(0.3855) (0.0491) (0.1382)
Size 1.0361*** 0.1122*** 0.4445***
(0.2957) (0.0366) (0.1060)
TDTE -0.0000 -0.0140 0.0000**
(0.000) (0.0108) (0.0000)
Age 0.0355 0.0059* -0.0103
(0.0254) (0.0033) (0.0091)
deltaExchange -18.5487*** -0.9873 20.9548***
(5.7303) (0.7119) (2.0568)
Observations 712 764 711
Prob(F) 0.0000 0.0010 0.0000
Adj R-squared 0.0378 0.0202 0.1572
*,**,*** means significant in 10%, 5%, 1% respectively.
Numbers in parentheses are standard errors for each coefficient
Source: regression results
The results indicate a significant and positive relationship between NUM and ROA,
signifying that a higher number of politically connected persons in a company will
result in a higher value of ROA.
Size had a significant effect on the three dependent variables with positive signs.
Leverage had a significant positive effect on market-adjusted returns, although with a
relatively low value. Age had a significant effect on Tobin’s Q with a positive sign,
implying that older companies would have a higher value of Tobin’s Q. Finally,
changes in exchange rates had a significant effect on ROA and market-adjusted returns
with different signs. Greater changes in exchange rates would decrease the value of
ROA, but would increase the value of market-adjusted returns.
92
4.5 Robustness Tests
Robustness and further explorations have been conducted:
1. the addition of companies within the top 40 business groups to the definition of
PEP
2. the addition of industry dummies to Model 1
3. a matched pair test of the ROA means.
4.5.1 Robustness Test 1
Data from the top 40 non-financial listed companies were added to the definition of PEP
to obtain a deeper analysis. The reason for including these top 40 business groups is that
Indonesian business groups have dominated Indonesia’s business landscape. They have
harnessed political links since Soeharto’s regime, and these links remain prevalent even
in the post-Soeharto era. Their inclusion can be considered a ‘proxy’ of the owners’
links with politics. The cut off for including only the top 40 business groups was
considered sufficient for a convenient sample. These groups represent three times
(triple) the total revenue of the next top 40 business groups, as modified from the
Forbes Indonesia Publication. The regression results from including these top 40
business groups are as follows.

93
Table 4.10: Regression Results with Top 40 Business Groups
Variables Panel
ROA Tobin’s Q Market
Constant 22.6221*** 0.0716 -6.6762***
(5.7676) (0.2893) (0.8785)
PEP+TOP 40 -0.4179 0.1594** -0.1952
(1.4688) (0.0737) (0.2231)
Size -1.3534*** 0.0525** 0.3738***
(0.4223) (0.0212) (0.0642)
TDTE -0.1927 -0.0143* 0.0020
(0.1625) (0.0082) (0.0244)
Age 0.1145** 0.0022 -0.0129*
(0.0442) (0.0022) (0.0067)
deltaExchange 4.8997 -0.3446 23.0673***
(8.1864) (0.4107) (1.2515)
Observations 1984 1984 1935
Prob(F) 0.0040 0.0004 0.0000
Adj R-squared 0.0062 0.0087 0.1630
*,**,*** means significant in 10%, 5%, 1% respectively
Numbers in parentheses are standard errors for each coefficient
Source: regression results
Table 4.10 shows that all the models are valid. The value of F-statistics is significant, as
revealed by the value being less than 1%. The R-squared values are 0.62%, 0.87% and
16.30% respectively. The results show that PEPs have significant and positive effects
on Tobin’s Q, but PEPs have neither any significant effect on ROA nor one on market-
adjusted returns.
The main change from previous results is that PEPs no longer have a significant effect
on market-adjusted returns. The control variables results have remained the same.
Further, t-tests were conducted at first for all companies, including the top 40 business
groups, to check the result’s robustness. Second, all companies compared with SOE,
and the third all companies compared with Badan Usaha Milik Negara (BUMN or
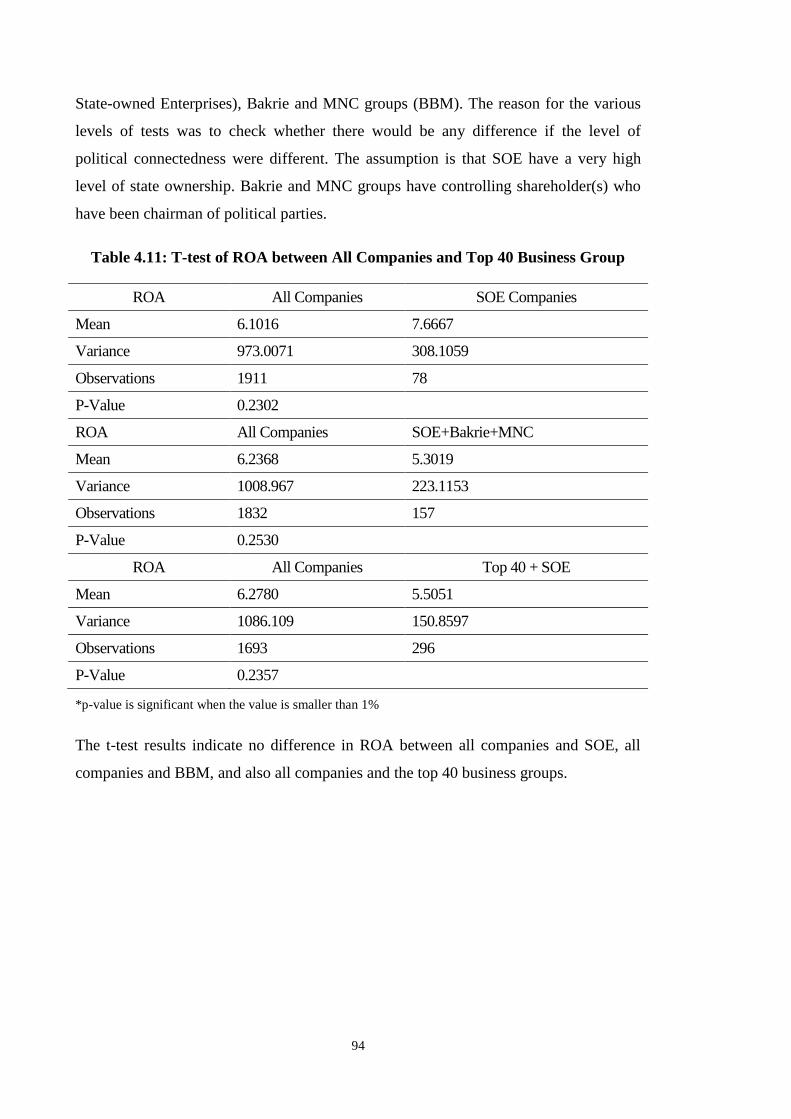
94
State-owned Enterprises), Bakrie and MNC groups (BBM). The reason for the various
levels of tests was to check whether there would be any difference if the level of
political connectedness were different. The assumption is that SOE have a very high
level of state ownership. Bakrie and MNC groups have controlling shareholder(s) who
have been chairman of political parties.
Table 4.11: T-test of ROA between All Companies and Top 40 Business Group
ROA All Companies SOE Companies
Mean 6.1016 7.6667
Variance 973.0071 308.1059
Observations 1911 78
P-Value 0.2302
ROA All Companies SOE+Bakrie+MNC
Mean 6.2368 5.3019
Variance 1008.967 223.1153
Observations 1832 157
P-Value 0.2530
ROA All Companies Top 40 + SOE
Mean 6.2780 5.5051
Variance 1086.109 150.8597
Observations 1693 296
P-Value 0.2357
*p-value is significant when the value is smaller than 1%
The t-test results indicate no difference in ROA between all companies and SOE, all
companies and BBM, and also all companies and the top 40 business groups.

95
4.5.2 Robustness Test 2
Industry dummies were entered to Model 1 to check the robustness. The industry
classification is based on IDX and derived also from the interviews. The rationale for
including industry dummies was to check whether the more regulated industries
required more political connectedness, and the subsequent effect on firm performance.
I add the following industry dummies to Model 1, whereby:
D1 = dummy variable; value 1 for basic industry and chemicals
D2 = dummy variable; value 1 for consumer goods industry
D3 = dummy variable; value 1 for infrastructure, utilities and transportation
industry
D4 = dummy variable; value 1 for mining industry
D5 = dummy variable; value 1 for miscellaneous industry
D6 = dummy variable; value 1 for property, real estate and building construction
industry
D7 = dummy variable; value 1 for trade, service and investment industry.
The regression results are as follows.
Table 4.12: Regression Results with Industry Dummies
Variables Panel
ROA Tobin’s Q Market
Constant 21.1787*** 0.9309*** -7.1119***
(7.0460) (0.3441) (1.0724)
PEP 0.0405 0.2001*** -0.5734**
(1.5591) (0.0761) (0.2354)
Size -1.2868*** 0.0414* 0.4197***
(0.4410) (0.0215) (0.0669)
TDTE -0.1864 -0.0135* 0.0038
(0.1625) (0.0079) (0.0244)
Age 0.1181** 0.0029 -0.0152**
(0.0459) (0.0022) (0.0069)
deltaExchange 4.9856 -0.3032 23.0156***
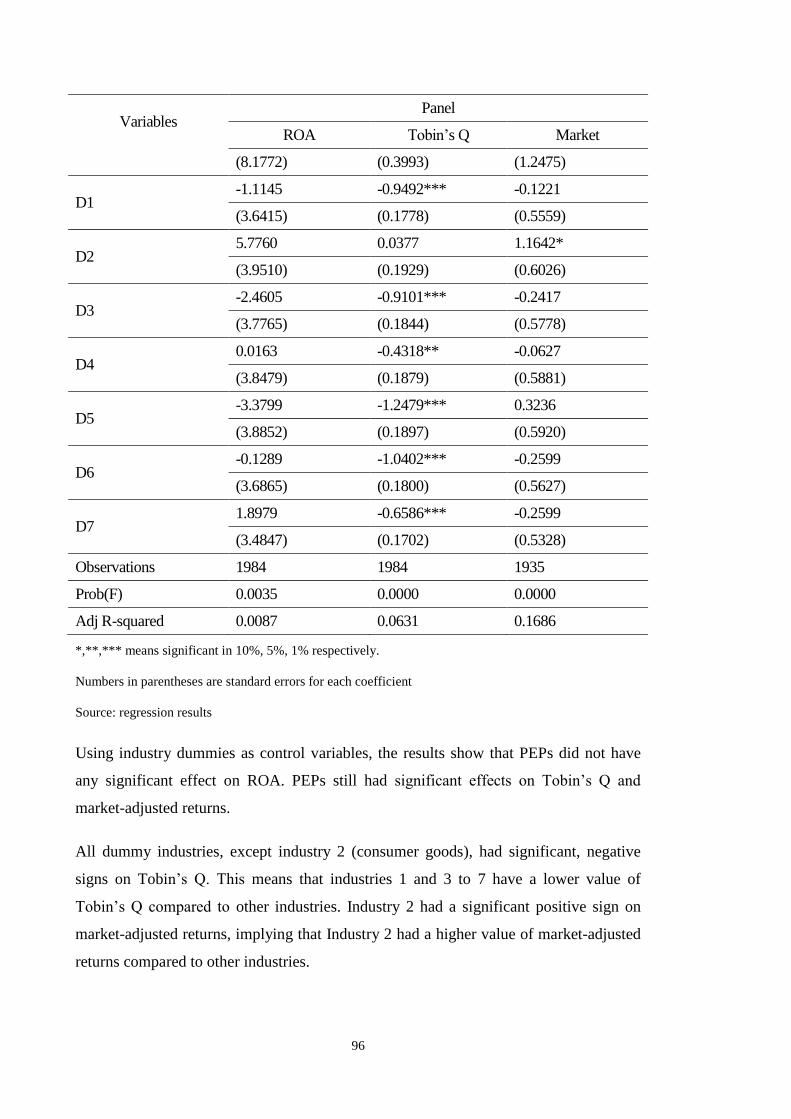
96
Variables Panel
ROA Tobin’s Q Market
(8.1772) (0.3993) (1.2475)
D1 -1.1145 -0.9492*** -0.1221
(3.6415) (0.1778) (0.5559)
D2 5.7760 0.0377 1.1642*
(3.9510) (0.1929) (0.6026)
D3 -2.4605 -0.9101*** -0.2417
(3.7765) (0.1844) (0.5778)
D4 0.0163 -0.4318** -0.0627
(3.8479) (0.1879) (0.5881)
D5 -3.3799 -1.2479*** 0.3236
(3.8852) (0.1897) (0.5920)
D6 -0.1289 -1.0402*** -0.2599
(3.6865) (0.1800) (0.5627)
D7 1.8979 -0.6586*** -0.2599
(3.4847) (0.1702) (0.5328)
Observations 1984 1984 1935
Prob(F) 0.0035 0.0000 0.0000
Adj R-squared 0.0087 0.0631 0.1686
*,**,*** means significant in 10%, 5%, 1% respectively.
Numbers in parentheses are standard errors for each coefficient
Source: regression results
Using industry dummies as control variables, the results show that PEPs did not have
any significant effect on ROA. PEPs still had significant effects on Tobin’s Q and
market-adjusted returns.
All dummy industries, except industry 2 (consumer goods), had significant, negative
signs on Tobin’s Q. This means that industries 1 and 3 to 7 have a lower value of
Tobin’s Q compared to other industries. Industry 2 had a significant positive sign on
market-adjusted returns, implying that Industry 2 had a higher value of market-adjusted
returns compared to other industries.

97
4.5.3 Robustness Test 3
The last robustness was a t-test check on ROA and a change of ROA to a matched pair
sample. Sixty-four companies had changed their number of PEPs. To conduct the
matched pair tests, a list of similar companies needed to be defined by looking into
similar sized companies within the same industry. I used total assets as the measurement
of size and a difference of a maximum 30% cut off between two companies. First,
similar sized companies within the sub-industry (as per IDX categories) were identified.
The list of matched pair companies is provided in the appendix. The t-test results are as
follows.
Table 4.13: T-test Result for ROA of Matched Pair Companies
ROA Changes in PEP Without Changes in PEP
Mean 1.2616 0.3957
Variance 228.3466 38.1352
Observations 64 64
P-Value 0.3429
*p-value is significant when the value is smaller than 1%
Table 4.13 reveals that no significance difference exists in the means of ROA, as well as
in the change of ROA for both PEP companies and non-PEP companies. T-tests were
also conducted for the ROE, gross margins, operating margins, net income margins,
operating profits/total assets and gross profits/total assets. The results remained the
same; that is, no significance difference existed in the means of the two groups.
4.6 Discussion
The combined method of interviews and regressions were used to analyse the
correlation between political connection, business and a firm’s performance in
Indonesia after the Suharto era. This combined method has not been conducted
previously. Thus, my research contribution has given new insights into this area.
A relatively high prevalence of PEP exists in Indonesia. This situation supports the
argument of ‘institutional voids’ in emerging markets as propagated by Khanna and
Palepu (2010). Firms use their political connections to mitigate the risks of operating in

98
emerging markets like Indonesia, due to the asymmetry of information, a weak legal
enforcement environment, and a weak institutional framework in Indonesia generally.
Developing or emerging Asian economies have weak corporate governance (La Porta,
Lopez-de-Silanes & Shleifer 1999). As a result, personalised and relational aspects
govern corporate governance in Asian business (Carney & Gedajlovic 2001). In my
view, besides personalised and relational aspects, the needs of political connection have
become important for doing business in Indonesia due to this weak corporate
governance.
Political connections are vital to gain access to information, new government
regulations and ‘political protection’. Political connectedness is still needed to operate
businesses in Indonesia. Apparently, political connection access seems to be more
widespread in the current era (22% during Soeharto’s era as per Faccio [2006], with this
research finding 36%). Ninety-one per cent (or a vast majority) of PEP sit on the boards
of commissioners. They may be asked to solve particular issues as necessary. This
might be useful for gaining political access and ‘political protection’.
The regression results indicate that PEPs have significant effects on Tobin’s Q and
market-adjusted returns. However, PEPs have no effects on ROA. This indicates that
PEPs add value to market-based firm performance but not to accounting firm
performance. The number of PEPs on boards does not have any effect on ROA, Tobin’s
Q or market-adjusted returns. However, when the sample was limited to companies that
had experienced changes in their PEP, the number of the board members had a positive
and significant effect on ROA.
Political connections have significant and positive effects on market firm performance
as measured by market-adjusted returns; these results are in line with previous studies
by Bunkanwanicha and Wiwattanakantang (2008), Niessen and Ruenzi (2009),
Ferguson and Voth (2008), Claessens, Lang and Fan (2006), Faccio and Parsley (2009),
Goldman, Rocholl and So (2009), Fisman (2001) and Brockman, Rui and Zou (2013).
Claessens, Lang and Fan (2006) found that politically connected firms had higher stock
returns, as the market has expectations regarding firm-specific political favours. This
implies that the market itself values political favours more than being non-politically
connected. Moreover, Niessen and Ruenzi (2009) found that firms with political

99
connections had higher stock prices as politically connected people preferred to work
with large and stable firms to maintain their reputation. In other words, politically
connected people would join companies with a good reputation. People would have in
mind that the good companies that were able to hire politically connected people could
generate political benefits in the future, as found by Goldman, Rocholl and So (2009).
According to Claessens, Lang, & Fan (2006), Niessen and Ruenzi (2009) and Goldman,
Rocholl and So (2009), it could be said that investors expected firms with political
connection to have higher stock returns as the investors might perceive that having
politically connected PEP on their boards might give those firms certain competitive
advantages. In accordance with institutional voids, Brockman, Rui and Zou (2013) have
found that politically well-connected firms outperformed others by more than 20% in
countries with weak legal systems. As Indonesia is an emerging market, it is still
considered to have a weak legal system, as shown by the high level of corruption;
Indonesia raked 107 out of 175 countries on the TI Corruption Perception Index 2014.
The effects of PEPs on ROA, even after t-tests, indicate no significant relationship
between the two. This may imply that being politically connected did not necessarily
mean better or worse outcomes in accounting-based firm performance.
Other factors may exist that are far more important to enhance operating firm
performance, such as managerial skills (Boubakri, Cosset & Saffar 2009; Faccio 2007;
Fan et al. 2007). These results also align with our results on the perceptions about
political connection and business. Professionals thought that a myriad of factors were
important for a business to be competitive. One of these could be political connections,
but the most important factor was management capability. However, it is interesting to
note that having more than one PEP on the board may improve the Tobin’s Q and ROA.

100
Chapter 5: Conclusions
5.1 Introduction
This chapter will summarise the findings and discussions of this study regarding the
study’s hypotheses. These will be discussed further in Section 5.2 below. Following this
is the section on research limitations. I will conclude this chapter with the implications
of the results for managers and policy makers.
5.2 Theoretical and Empirical Findings and Contributions
This research has used two methods to determine comprehensive answers to the six key
research questions: a qualitative method using in-depth interviews to answer the first
four research questions and a quantitative method using regressions to answer the last
two research questions.
To reiterate, the six key research questions are:
1. Are political connections necessary to be competitive in Indonesia? If so, why?
2. Has the situation become better or worse post-Soeharto?
3. Do political connections vary across industry sectors? How?
4. What mechanisms for political connections are used by firms?
5. Do political connections affect a firm’s performance in Indonesia?
6. Does the number of politically exposed persons (PEPs) on a board affect a
firm’s performance in Indonesia?
From the interviews analysis, political connections were viewed as necessary to
compete in Indonesian business. This relates to the key hypotheses in Chapter 3 and the
first research question above.
The findings regarding the characteristics of the PEP vs. non-PEP companies in Chapter
4 have shown that more than one-third (36%) of non-financial listed companies in
Indonesia had political connectedness through their board members. Of this connection,
91% were connected through their board of commissioners. This high prevalence of
political connectedness after the Soeharto era indicates that political connections are
still viewed as necessary; this was also indicated by the findings of the interviews.
101
Again, this answers the key hypothesis regarding whether political connections were
still needed or not.
As to the follow up research question to why the need for such political connections, the
need for such political connectedness may depend on a few factors: the industry, the
stage of the business, and the scale of the business. The foremost reason why political
connection is needed to do business in Indonesia is that it operates as ‘political
protection’. This is followed by the ability to access information and
regulators/bureaucrats to ensure the necessary licences/permits can be obtained; this
may be due to the opaqueness of regulations and law enforcement in Indonesia. This is
clearly indicated by the interviewees in Chapter 3. However, the salient point noted by
the interviewees was that political connections were just one of the key success factors
among many for doing business in Indonesia: political connection alone cannot make a
company successful. The main key success factor was having a strong management,
followed by good products and services, good corporate governance, a wide distribution
network, the ability to adapt and change and R&D innovation, as discussed in Chapter
3.
With regards to the second research question whether political connections vary across
the sectors of the industry, the interviews’ results in Chapter 3 indicate political
connections do indeed vary across the sectors of the industry. The more regulated the
industry is such as oil & gas, mining, property for example, the more political
connectedness is needed.
The review of PEPs and the industry that each company operated in Chapter 4 has
revealed that the largest number of politically connected companies operated in the
property (12.5%), coal mining (8.33%) and transportation (5.95) sectors. This again
corroborates the findings from the interviews in Chapter 3 that the more regulated
industries, such as mining and property, required more political connectedness.
With regards to the third research question whether the situation has worsened post
Soeharto, this study found that conditions have changed since the Soeharto era, as
power is now shared by the regions and among various political parties. The fact that
there is no concentration of power in the hands of one person like Soeharto may have
contributed to the view that the current situation is worse; now business people may

102
need to have wider political connections with various parties at the central level or
regional level. The presidency remains the key position that politicians seek, followed
by ministerial appointments and MPs.
With regards to the fourth research question on mechanism of political connections,
board member who are PEPs can be considered as a mechanism to have connection to
politics as indicated in Chapter 3. However, political connections may not necessarily
be made through board members only. Often, owners connect directly to politics and in
some cases, owners enter active politics to gain political connections to protect or
enhance their business interests.
Regarding the quantitative method in Chapter 4, an OLS regression method with panel
data was applied. The regression results have shown that political connections did have
significant effects on Tobin’s Q and market-adjusted returns, but not on ROA. In other
words, political connections affected market-based firm performance but not accounting
operating performance. These answer the fifth research question whether political
connections affect a firm performance in Indonesia. However, for Tobin’s Q and
returns, the model only explained 0.90 and 16.53% respectively between the
independent variables and the dependent variable.
When robustness tests were conducted by including the top 40 business groups in the
definition of PEP, or the addition of industry factors, the findings remained the same.
There was no relationship between PEP and ROA. The matched pair tests also
confirmed no difference existed in the means of ROA or the means of the change in
ROA. The results of the link between PEP and Tobin’s Q remained through the
robustness tests.
The findings regarding NUM also confirmed no relationship existed between NUM and
ROA. However, NUM had a positive and significant relationship with Tobin’s Q, but
no relationship with market-adjusted returns. A further investigation into the
relationship between NUM and firm performance measures within the sample of 64
companies that experienced changes in their PEP showed that NUM had a positive and
significant relationship with ROA. These answer the last research question whether the
number of board member (NUM) affect a firm’s performance.

103
The lack of any association between political connections and accounting performance
is contrary to earlier findings by Faccio (2007, 2010) and Niessen & Ruenzi (2009).
This could reflect either the weak power of the tests used in this research to pick up any
associated performance, or a weakening of relationship between political connections
and accounting performance. Political connections may be needed in a highly regulated
industry such as oil and gas, mining and property, but even in those industries, having
political connections may just level the playing field, as most companies have political
connection to a degree. Another possibility therefore performance isn’t a function of
political connection but rather competence. Hence it may indicate that political
connection may be necessary but not sufficient.
Based on the perception of the interviewees in Chapter 3, a company’s performance
depended more on the management, the products and services suites, the ability to adapt
and change, while political connection is but one of a myriad of factors but not the
paramount factor. As revealed in the findings of Fan et al. (2007), Faccio (2007, 2010),
Boubakri, Cosset and Saffar (2009), managerial skills are crucial, not merely political
connection. This has again been emphasised strongly by the findings from our
interviewees that revealed management was paramount to a firm’s success.
Investors in the capital market do seem to attribute value to a firm’s political
connectedness, as indicated by the significant relationships with Tobin’s Q and market-
adjusted returns. The negative relationship between political connectedness and returns
corroborates the findings from Fisman (2001).
The reason for business to have political connectedness, as mentioned by our
respondents, was mainly for ‘political protection’. By that they mean that political
protection is more for ‘defensive’ than ‘offensive’ reasons. Costs are associated with
such connections. Political connection can be viewed as risk mitigation. In emerging
markets like Indonesia, the uncertainty of laws and patchy law enforcement track
records (which have been highlighted by our respondents) and the lack of institutional
settings ensure that firms must acquire political connectedness to sustain business in a
fiercely competitive market. Rival companies may use all available means to compete,
including using their political connections to edge out other companies. Hence, political
connection can be a source of value to a firm.

104
One of the motivations for conducting this research is examine whether the trend
towards a more participatory democracy in the political system from a dictatorial system
would be accompanied by equal trend towards democratisation and participation in the
economic system. The answer from this research seems to indicate ”yes but
imperfectly”.
While the more participatory democratisation in Indonesia post Soeharto-era brought
the opening of the market and a more level playing field, which resulted in increased
competitive forces, it was hard for new entrants to break into business and gain market
shares. The results of the research indicated the reasons for that. In other words,
political connections still matter to an extent, but to a larger extent because the
incumbents which largely consist of Chinese dominated business groups posses most of
the competencies, resources, and skills to succeed in a more competitive environment.
Opening up of the economy as a result of democratisation seems to benefits most the
group of businessmen that were doing well and got their start under the old system of
political patronage during Soeharto-era. However, it might be too early to see their
dominance decrease.
5.3 Research Limitations
I believe the sample of 34 bankers, fund managers, academics, lawyers and business
owners are representative enough. They chose to participate voluntarily despite their
busy schedule due to their seniority and the sensitivity of the research topic. This is a
result of a professional network out of my 20 years working experience in Indonesia.
After all, having such sample is indeed better than having none at all. Furthermore, I did
not rely merely on the interviews data, but I also used accounting data, shares price data,
and also prior research.
The dataset used included listed companies in the IDX. Non-listed private companies
were excluded not because they were insignificant, but because their data were not
readily and publicly available.
The empirical testing relied on the financial ratios derived from the audited financial
statements of Indonesian listed companies that had obtained a clean record from the

105
auditors. The base assumption here was that they were accurate and truly reflected the
operating performances of companies in the dataset.
The Tobin’s Q and market-adjusted returns rely on the end of year stock price. The
stock price is assumed to truly reflect the market valuation of companies in the dataset.
We did not consider the company’s liquidity, amount of shares floated to the public and
stock volatility.
To operate the variable political connectedness, we used the measure of whether board
members were politically connected or not. There was some feedback from our
respondents concerning whether owners who connected to politics directly or owners
who entered into active politics provided better measures of political connectedness.
This measurement was still problematic at this stage, due to a lack of readily and
publicly available data. Additionally, it is yet to be proven that when owners enter
active politics this will benefit their businesses groups. However, this could be an area
of further research into politics, business and firm performance.
Two levels of board members exist in the Indonesian corporate system: a board of
commissioners that acts more as a supervisory board and a board of directors that acts
as day-to-day management. Ninety-one per cent of PEPs sit on the board of
commissioners, with the rest on the board of directors. However, when we split the
PEPs into the two boards, the findings of the OLS regression did not indicate any
significant changes to the ROAs.
The time period chosen was also limited to 2009 to 2013. The availability of data
prevented us from using a longer time horizon. Further research with a longer time
horizon and higher frequency than annual data may provide further insights into the
research questions.
As the findings have indicated a relationship with Tobin’s Q and market-adjusted
returns, further extension of this research may include interviewing a wider range of
fund managers about their perceptions regarding the value of political connections in
Indonesia. This research has not focused on the causality and direction of the
relationship; that is, whether firms with political connections become competitive or
whether politicians who observe competitive companies then choose to sit on the boards
of such companies.
106
5.4 Implication of Findings
The findings of this study could be important for people in the business sector. First,
political connections are not the only factor in determining a company’s success.
Political connections might help, but ultimately other factors such as management and
other competitive advantages could determine the firm performance. Using PEPs seem
to be motivated more by risk mitigation, to gain ‘political protection’. The prevalence of
such politically connected companies in Indonesia has affirmed the view that the
benefits may outweigh the costs.
As for the government and regulators, they may establish a policy regarding the criteria
of people who can sit on the boards of listed companies, or at least on the transparency
of information regarding whether someone is PEP or not. According to the findings of
this study, some industries required political connections to operate. In some cases, in
the view of our respondents, the appointment of certain PEPs to a board can be a return
for favours done previously when they had been active as regulators. The appointment
of a direct supervisor or regulator to a board (as soon as they have retired) may create a
conflict of interest. Perhaps a certain ‘cooling off’ period can be considered before such
appointments to mitigate the perception of such conflicts of interest.
Further transparency requirements, such as to disclose the UBO of listed companies
may be necessary to enhance the transparency of who really controls the said listed
companies. Additionally, a requirement to detail any campaign contribution, such as
those that have been implemented in other countries like Brazil (Claessens, Feijen &
Laeven 2008) might help increase transparency. When and if such data become
available in the future, further research may be able to examine the relationship between
politics and business at an even deeper level.
107
References
Agrawal, A & Knoeber, C 2001, ‘Do some outside directors play a political role?’ The
Journal of Law and Economics, vol. 44, no. 1, pp. 179–198.
Agrawal, R, Meschke F & Wang, TY 2012, ‘Corporate political donations: investment
or agency?’ Business and Politics, vol. 14, no. 1, pp. 1–40.
Alisyahbana, AS 2005, ‘Does Indonesia have the balance right in natural resource
revenue-sharing?’ in BP Resosudarmo (ed), The politics and economics of
Indonesia’s natural resources, ISEAS Publishing, Singapore.
Backman, M 2001, Asian eclipse: exposing the dark side of business in Asia, Wiley,
Singapore.
Badan Koordinasi Penanaman Modal (BKPM) 2014, Domestic & foreign direct
investment realization. Quarter I 2014, BKPM, Jakarta.
Bartov, E & Bodnar, GM 1994, ‘Firm valuation, earnings expectation and the exchange
rate exposures effect’, Journal of Finance, vol. 49, no. 5, pp. 1755–1785.
Basri, MC 2013, ‘A tale of two crises: Indonesia’s political economy’, working paper
57, JICA Research Institute.
Basri, MC & van der Eng, P 2005, Business in Indonesia: new challenges, old problems,
ISEAS Publishing, Singapore.
Bertrand, M, Schoar, A, Kramarz, F & Thesmar, D 2007, ‘Politicians, firms and the
business cycle: evidence from France’, unpublished working paper, University
of Chicago.
Bank Indonesia (BI) 2015, Indonesian Financial Statistics, BI, Jakarta.
Borsuk, R & Chng, N 2014, Liem Sioe Liong’s Salim Group: the business pillar of
Soeharto’s Indonesia, ISEAS Publishing, Singapore.
Boubakri, N, Cosset, JC & Saffar, W 2009, ‘Politically connected firms: an
international event study’, unpublished working paper, HEC Montreal
Bourantas, D & Papadakis, V 1998, ‘The CEO as corporate champion of technological
innovation: an empirical investigation’, Technology Analysis & Strategic
Management, vol. 10, no. 1, pp. 89–109.
Biro Pusat Statistik (BPS) 2014, Statistik ekonomi Indonesia, BPS, Jakarta.
108
Braun, M & Sharma, A 2007, ‘Should the CEO also be chair of the board? An empirical
examination of family controlled firms’, Family Business Review, vol.20,
pp.111-126.
Brockman, P, Rui, O & Zou, H 2013, ‘Institutiions & the performance of politically
connected M&As’, Journal of International Business Studies, vol. 44, pp. 833–
852.
Bunkanwanicha, P & Wiwattanakantang, Y 2008, ‘Big business owners in politics’,
CEI working paper series, Hitotsubashi University.
Carney, M & Gedajlovic, E 2001, ‘Corporate governance & firm capabilities: a
comparison of managerial, alliance & personal capitalism’, Asia Pacific Journal
of Management, vol.18, pp.335-354.
Cassing, JH 2000, ‘Economic policy and political culture in Indonesia’, European
Journal of Political Economy, vol. 16, pp. 159–171.
Charumilind, C, Kali, R & Wiwattanakantang, Y 2006, ‘Connected lending: Thailand
before the financial crisis’, Journal of Business, vol. 79, no. 1, pp. 181–218.
Chua, C 2008, Chinese big business in Indonesia: the state of capital, Routledge,
London.
Claessens, S, Lang, LHP & Fan, JPH 2006, ‘The benefits and costs of group affiliation:
evidence from East Asia’, Emerging Markets Review, vol. 7, pp. 1–26.
Claessens, S, Djankov, S, Fan, JPH & Lang, LHP 1999, ‘Corporate diversification in
East Asia: the role of ultimate ownership structure group affilication’, policy
research working paper 2089, World Bank.
Claessens, S, Djankov, S & Klingebiel, D 1999, ‘Financial restructuring in East Asia:
halfway there?’, financial sector discussion paper 3, World Bank.
Claessens, S, Feijen, E & Laeven L 2008, ‘Political connections and preferential access
to finance: the role of campaign contributions’, Journal of Financial Economics,
vol. 88, no. 3, pp. 554–580.
Coase, RH 1937, ‘The nature of firms’, Economica New Series, vol. 4, no. 16, pp. 386–
405
Cuervo-Cazurra, A 2006, ‘Business groups and their types’, Asia Pacific Journal of
Management, vol. 23, pp. 419–437.
Cull, R & Xu, L 2005, ‘Institutions, ownership, and finance: the determinants of profit
reinvestment among Chinese firms’, Journal of Financial Economics, vol. 77,
no. 1, pp. 117–146.

109
Demsetz, H & Villalonga, B 2001, ‘Ownership structure & corporate performance’,
Journal of Corporate Finance, vol.7, pp.209-233
Dhanaraj, C & Khanna, T 2011, ‘Transforming mental models on emerging markets’,
Academy of Management Learning and Education, vol. 10, no. 4, pp. 684–701.
Dieleman, M 2007, ‘How Chinese are the entrepreneurial strategies of ethnic Chinese
business groups in Southeast Asia? A multifaceted analysis of the Salim Group
of Indonesia’, PhD thesis, Leiden University, Leiden.
Djiwandono, S 2005, Bank Indonesia and the crisis: an insider’s view, ISEAS
Publishing, Singapore.
Dodd, C 2014, ‘Jokowi means business with corruption battle’, Finance Asia, Hong
Kong.
Dogan, M 2013, ‘Does firm size affect firm’s profitability? Evidence from Turkey’,
Research Journal of Finance and Accounting, vol. 4, no. 4, pp. 53–59.
Duchin, R & Sosyura, D 2012 ‘The politics of government investment’, Journal of
Financial Economics, vol. 106, no. 1, pp. 24–48.
Ekelund, RB & Tollison, RD 1981, Mercantilism as rent seeking society, A&M
University Press, College Station, Texas.
Eklof, S 2001, ‘Politics, business, and democratization in Indonesia’, in ET Gomez (ed),
Political business in East Asia, Routledge, London, pp.216-247.
Elizabeth, C & Baines, S 1998, ‘Does gender affect business “performance”? A study of
micro businesses in business services in the UK’, Entrepreneurship & Regional
Development, vol. 10, no. 2, pp. 117–135
Faccio, M 2006, ‘Politically connected firms’, American Economic Review, vol. 96, pp.
369–386.
Faccio, M 2007, ‘The characteristics of politically connected firms’, purdue CIBER
working paper.
Faccio, M 2010, ‘Differences between politically connected and non-connected firms: a
cross-country analysis’, Financial Management, vol. 39, no. 3, pp. 905–927.
Faccio, M & Parsley, D 2009, ‘Sudden deaths: taking stock of geographic ties’, Journal
of Financial and Quantitative Analysis, vol. 44, no. 3, p. 683–718.
Fan, JPH, Wong, TJ & Zhang, T 2007, ‘Politically connected CEOs, corporate
governance and post-IPO performance of China’s newly partially privatized
firms’, Journal of Financial Economics, vol. 84, pp. 330–357.

110
Ferguson, T & Voth, H 2008, ‘Betting on Hitler—The value of political connections in
Nazi Germany’, Quarterly Journal of Economics, vol. 123, no. 1, pp. 101–137.
Fisman, R 2001, ‘Estimating the value of political connections’, American Economic
Review, vol. 91, no. 4, pp. 1095–1102.
Flick, U 2014, An introduction to qualitative research, Sage, London.
Ford, M & Pepinsky, TB 2014, Beyond oligarchy: wealth, power and contemporary
Indonesian politics, Cornell University Press, New York.
Fox, JJ, Adjuri, DS & Pradnja, IA 2005 ‘Unfinished edifice or Pandora’s Box?
Decentralisation and resource management in Indonesia’, in BP Resosudarmo
(ed), The politics and economics of Indonesia’s natural resources, ISEAS
Publishing, Singapore.
Galea, N & Loosemore, M 2008, ‘Genderlect and conflict in the construction industry’,
Construction Management and Economics, vol.26, no. 2, pp. 125-135
Gellert, PK 2005, Oligarchy in the timber markets of Indonesia: from Apkindo to IBRA
to the future of the forests. The politics and economics of Indonesia’s natural
resources, BP Resosudarmo, ISEAS Publishing, Singapore.
Goldman, E, Rocholl, J & So, J 2009, ‘Do politically connected boards affect firm
value?’ Review of Financial Studies, vol. 22, no. 6, pp. 2331–2360.
Hadiz, VR & Robison, R 2014, ‘The political economy of oligarchy and the power of
reorganization of power in Indonesia’, in M Ford and TB Pepinsky (eds),
Beyond oligarchy: wealth, power and contemporary Indonesian politics, Cornell
University Press, New York, pp.35-56.
Hansen, GS & Wirnerfelt, B 1989, ‘Determinants of firm performance: the relative
importance of economic and organisational factors’, Strategic Management
Journal, vol. 10, no. 5, pp. 399–411.
Hatem, BS 2014, ‘Determinants of firm performance: a comparison of European
countries’, International Journal of Economics and Finance, vol. 6, no. 10, pp.
243–249.
Hawawini, G, Subramanian, J & Verdin, P 2003, ‘Is performance driven by industry or
firm-specific factors? A new look at the evidence’, Strategic Management
Journal, vol. 24, no. 1, pp. 1–16.
Helwina, S & Lukviawarman, N 2007, Internal governance mechanisms and
performance of Indonesian non-financial listed companies in Jakarta Stock

111
Exchange, in Proceeding of the 1st Accounting Conference, University of
Indonesia, Jakarta.
International Monetary Fund (IMF) 2014, World economic outlook, IMF, Washington
DC.
Johnson, S & Mitton, T 2003, ‘Cronyism and capital controls: evidence from Malaysia’,
Journal of Financial Economics, vol. 67, no. 2, pp. 351–382.
Jomo, K 2001, Rethinking of the role of government policy in Southeast Asia.
Rethinking the East Asian miracle, World Bank, Washington DC.
Katz, RS & Mair, P 1995, ‘Changing models of party organization and party
democracy: the emergence of the cartel party’, Party Politics, vol. 1, no. 1, pp.
5–28.
Khanna, TP 1999, ‘Restructuring conglomerates in emerging markets’, Harvard
Business Review, pp. 125–134.
Khanna, TP 2000, ‘Is group affilication profitable in emerging markets? An analysis of
diversified Indian business groups’, Journal of Finance, vol. 55, no. 2, pp. 867–
891.
Khanna, TP 2007, ‘Business groups in emerging markets: paragons or parasites?’
Journal of Economic Literature, vol. 45, pp. 331–372.
Khanna, TP & Jayant, S 2005, ‘Strategies that fit emerging markets’, Harvard Business
Review, pp. 63–76.
Khanna, TP & Palepu, K 1997, ‘Why focused strategies may be wrong for emerging
markets’, Harvard Business Review.
Khanna, TP & Palepu, K 2010, Winning in emerging markets: a roadmap for strategy
and execution, Harvard Business Press, Boston.
Khanna, TP & Yafeh, Y 2007, ‘Business groups in emerging markets: paragons or
parasites?’ Journal of Economic Literature, vol. 45, pp. 331–372.
Khwaja, AI & Mian, A 2005, ‘Do lenders favor politically connected firms? Rent
provision in an emerging financial market’, Quarterly Journal of Economics, vol.
120, pp. 1371–1411.
Kivunja, C 2013, ‘Qualitative data mining and knowledge discovery using Leximancer
digital software’, Lecture Notes on Information Theory, vol.1, no.1.
Komisi Pemilihan Umum (KPU) 2014, Keputusan komisi pemilihan umum
411/Kpts/KPU2014, GE Committee, Jakarta.
112
Krueger, A 1974, ‘The political economy of rent seeking society’, American Economic
Review, vol. 64, no. 3, pp. 291–303.
La Porta, RF, Lopez-de-Silanes, F & Shleifer, A 1999, ‘Corporate ownership around the
world’, Journal of Finance, vol. 54, no. 2, pp. 471–517.
Leff, N 1978, ‘Industrial organisation and entrepreneurship in the developing countries:
the economic groups’, Economic Development and Cultural Change, vol. 78, pp.
661–674.
Leuz, C & Oberholzer Gee, F 2006, ‘Political relationship, global financing and
corporate transparency: evidence from Indonesia’, Journal of Financial
Economics, vol. 81, pp. 411–439.
Lukviawarman, N 2004, ‘Ownership structure and firm performance: the case of
Indonesia’, DBA, Graduate School of Business, Curtin University of
Technology, Perth.
Macintyre, A 1990, Business & politics in Indonesia, Allen & Unwin, Sydney.
Mackie, J 1989, ‘Chinese businessmen and the rise of Southeast Asian capitalism’,
Solidarity no.123, pp.96-107.
Mackie, J 1998, ‘Business success among Southeast Asian Chinese. The role of culture,
values and social structure’, in RW Hefner (ed), Market cultures: society and
morality in the new Asian captialism, Westview Press, Boulder, CO, pp.129-46.
Mackie, J 1999, ‘Tackling the Chinese problem’, in G Forrester (ed), Post-Soeharto
Indonesia: renewal or chaos?, ISEAS Publishing, Singapore, pp. 187–97.
Majumdar, SK 1997, ‘The impact of size and age on firm-level performance: some
evidence from India’, Review of Industrial Organization, vol. 12, pp. 231–241.
Martin, NJ & Rice, JL 2007, ‘Profiling enterprise risks in large computer companies
using the Leximancer software tool’, Risk Management, 9, 188-206.
Menkhoff, T & Gerke, S 2002, Chinese entrepreneurship and Asian business networks,
Routledge, London.
Mietzner, M 2013, Money, power and ideology: political parties in post-authoritarian
Indonesia, ASAA Southeast Asia Publication Series in association of NUS Press,
Singapore.
Mobarak, AA & Purbasari, D 2005, Political trade protection in developing countries:
firm level evidence from Indonesia, University of Colorado, Boulder, CO.
Ministry of Finance (MOF) (Indonesia) 2015, ‘Tahun 2014 Rasio Hutang PDB
Indonesia Kembali Turun’.

113
Morck, R, Shleifer, A & Vishny, RW 1988, ‘Management ownership and market
valuation: an empirical analysis’, Journal of Financial Economics, vol. 20, pp.
293–315.
Morck, RK, Strangeland, D & Yeung, B 1998, ‘Inherited wealth, corporate control and
economic growth’, William Davidson Institute working paper, 209.
Muhaimin, Y 1991, Business & politics: Indonesian economic policy 1950–1980,
LP3ES, Jakarta.
Niessen, A & Ruenzi, S 2009, ‘Political connectedness & firm performance: evidence
from Germany’, CFR working paper 07-15.
Noor, D 2008, Sistem pemerintahan Indonesia: pra and pasca amandement UUD 1945,
Universitas Padjajaran, Bandung.
North, DC 1991, ‘Institutions’, The Journal of Economic Perspectives, vol. 5, no. 1, pp.
355–367.
Oberman, R, Budiman, A, Thompson, F & Rossé, M 2012, ‘The archipelago economy:
unleashing Indonesia’s potential’, McKinsey Global Institute report. Available
from:
<https://mckinsey.com/MGI_unleashing_Indonesia_potential_Full_report>.
[September 2012].
Opler, TC & Titman, S 1994, ‘Financial distress and corporate performance’, Journal of
Finance, vol. 49, no. 3, pp. 1015–1040.
Otoritas Jasa Keuangan (OJK) 2015, Statistik mingguan pasar modal 2015, OJK,
Jakarta.
Page, J 1994, ‘The East Asian miracle: four lesssons for development policy’, in S
Fischer & JJ Rotemberg, JJ (eds), NBER Macroeconomic Manual, vol 9, MIT
Press, pp.219-282.
Parlina, I & Widiarto 2014, ‘Jokowi’s cabinet announced, here is the line up’, The
Jakarta Post, Jakarta.
Pathmanand, U 2006, ‘The Thaksin Shinawatra Group: a study of the relationship
between money and politics in Thailand’, Copenhagen Journal of Asian Studies,
vol. 13, pp. 60–91.
Peng, MW & Jiang, Y 2002, ‘Institutions behind family ownership and control in large
firms’, Journal of Management Studies, vol. 47, no. 2, pp. 253–273.

114
Penn-Edwards, S 2010, ‘Computer aided phenomenography: the role of Leximancer
computer software in phenomenographic investigation’, The Qualitative Report,
vol. 15, no. 2, pp. 252–267.
Permana, JH & Wika, GSMJ 2014, ‘Testing the existence of Wagner’s law &
government expenditure volatility in Indonesia’s post-reformation era’, Journal
of Economics & Sustainable Development, vol. 5, no. 10, pp. 130–139.
Prabowo, MA 2010, ‘The effect of board composition on firm performance in
Indonesia’, School of Economics and Finance, Curtin University of Technology,
Perth, PhD.
Rastogi, V, Tambota, E, Tong, D & Sinburimsit, T 2013, Asia’s next big opportunities:
Indonesia’s rising middle class & affluent consumers, Boston Consulting Group
Perspectives. Available from:
https://bcgperspectives.com/center_consumer_customer_insight. [5 March 2013]
Resosudarmo, BP 2005, The politics and economics of Indonesia’s natural resources,
ISEAS Publishing, Singapore.
Robison, R 1986, Indonesia: the rise of capital, Allen & Unwin, Australia.
Robison, R & Hadiz, VR 2004, Reorganising power in Indonesia: the politics of
oligarchy in an age of markets, Routledge Curzon, New York.
Robison, R & Rosser, A 1998, ‘Contesting reform: Indonesia’s New Order and the
IMF’, World Development, vol. 26, pp. 1593–1609.
Rosser, A 2002, The politics of economic liberalisation in Indonesia: state, market &
power, Curzon, Surrey, UK.
Sapienza, P 2004, ‘The effects of government ownership on bank lending’, Journal of
Financial Economics, vol. 72, no. 2, pp. 357–384.
Sato, Y 1993, ‘The Salim Group in Indonesia: the development and behaviour of the
largest conglomerate in Southeast Asia’, The Developing Economies, vol. 31, no.
4, pp. 408–441.
Sato, Y 1996, ‘The Astra Group: a pioneer of management modernization in Indonesia’,
The Developing Economies, vol. 34, no. 3, pp. 247–280.
Sato, Y 2004, ‘Corporate ownership and management in Indonesia: does it change?’, in
MC Basri & P van der Eng (eds), Business in Indonesia: new challenges, old
problems, ISEAS Publications, Singapore.

115
Schlingemann, FP, Stulz, RM & Walkling, RA 2002, ‘Divestitutes and the liquidity of
the markets for corporate assets’, Journal of Financial Economics, vol. 64, pp.
117–144.
Schwarz, A 2004, A nation in waiting: Indonesia in the 1990s, Westview Press, Boulder,
CO.
Seda, FSSE 2005, ‘Petroleum paradox: the politics of oil & gas’, in BP Resosudarmo
(ed), The politics & economics of Indonesia’s natural resources, ISEAS
Publishing, Singapore.
Shin, YH 1989, ‘Demystifying the capitalist state: political patronage, bureaucratic
interests, and capitalist-in-formation in Soeharto’s Indonesia’, PhD, Yale
University, New Haven, Connecticut.
Sidjabat, RM 2015, ‘Thumbsdown to Jokowi’s 100 days’, The Jakarta Post, Jakarta.
Smith, AE 2000, ‘Machine mapping of document collections: the leximancer system’, in
Proceeding of the Fifth Australasian Document Computing Symposium,
Sunshine Coast, Australia, DSTC.
Smith, AE 2003, ‘Automatic extraction of semantic networks from text using
Leximancer’, in HLT-NAACL 2003 Human Language Technology Conference of
the North American Chapter of the Association for Computational Linguistics:
Companion volume (pp. Demo23-Demo24). Edmonton: ACL.
Smith, AE & Humphreys, MS 2006, ‘Evaluation of unsupervised semantic mapping of
natural language with Leximancer concept mapping’, Behavior Research
Methods, vol. 38, no. 2, pp. 262–279.
Studwell, J 2008, Asian godfathers: money & power in Hong Kong and Southeast Asia,
Profile Books, London.
Tambunan, T 2010, ‘The Indonesian experience with the two big economic crises’,
Modern Economy, vol. 1, no. 3, pp. 156–167.
Tan, EKB 2000, ‘Success amidst prejudice: Guanxi network in Chinese business in
Indonesia and Malaysia’, Journal of Asian Business Studies, vol. 16, no. 1, pp.
65–83.
Transparency International (TI) 2014, Corruption Perception Index, TI. Available from:
<http:// www.transparency.org> . [3 December 2014]
van der Eng, P 2004, ‘Business in Indonesia: old problems and new challenges’, in MC
Basri & P van der Eng (eds), Business in Indonesia: new challenges, old
problems, ISEAS Publishing, Singapore.

116
Vaughn, B 2011, ‘Indonesia: domestic politics, strategic dynamics & US interests’,
CRS report for Congress.
Wanandi, J 2013, Shades of grey: a political memoir of modern Indonesia 1965-1998,
Equinox Publishing, Singapore.
Wie, TK 2006, ‘Policies for private sector development in Indonesia’, ADB Institute
Discussion Paper No.46
Williamson, O 1985, ‘The economic institutions of capitalism’, The Free Press, New
York.
Winters, J 1996, Power in motion: capital mobility and the Indonesian state, Cornell
University Press, Ithaca, NY.
Winters, JA 2011, Oligarchy, Cambridge University Press, New York.
Winters, JA 2014, ‘Oligarchy and democracy in Indonesia’, in M Ford and TB Pepinsky
(eds), Beyond oligarchy: wealth, power and contemporary Indonesian politics,
Cornell University Press, New York.
Wisker, G 2008, The postgraduate research handbook, Palgrave Macmillan, New York.
Wu, W 2000, ‘Transaction cost, cultural values and Chinese business networks: an
integrated approach’, in KB Chan (ed), Chinese business networks: state,
economy and culture, NIAS Publishing, Copenhagen, pp. 35–56.
Yoshihara, K 1988, The rise of ersatz capitalism in Southeast Asia, Oxford University
Press, New York.
Yoshihara, K 1995, ‘The ethnic Chinese and ersatz capitalism in Southeast Asia’, in L
Suryadinata (ed), Southeast Asian Chinese and China. The politico-economic
dimension, Times Academic Press, Singapore, pp. 66–86.
Zame, WR 2007, ‘Incentives, contracts, markets: a general equilibrium theory of firms’,
Econometrica, vol. 75, no. 5, pp. 1453–1500.

117
Appendix A
List of Companies in the Matched-Pair Test
Change in PEP No Change
Code Industry TA Code Industry TA
SSMS 1 3,701,917.49 PALM 1 3,990,894.83
SGRO 1 4,512,655.53 ANJT 1 4,835,837.89
BWPT 1 6,200,427.31 TBLA 1 6,212,359.00
CPRO 1 7,179,387.00 LSIP 1 7,974,876.00
SIMA 2 65,314.18 INCI 2 136,142.06
IGAR 2 314,746.64 APLI 2 303,594.49
KBRI 2 788,749.19 INAI 2 765,881.41
NIKL 2 1,514,191.40 IMPC 2 1,644,814.29
UNIC 2 3,277,014.46 TRST 2 3,260,919.51
MLIA 2 7,189,899.45 FASW 2 5,692,060.41
SMCB 2 14,894,990.00 TPIA 2 23,213,520.46
JPFA 2 14,917,590.00 BRPT 2 28,247,421.90
CPIN 2 15,722,197.00 KRAS 2 28,958,563.68
INTP 2 26,607,241.00 SMGR 2 30,792,884.09
SQBB 3 421,187.98 SQBI 3 421,187.98
CEKA 3 1,069,627.30 DVLA 3 1,190,054.29
AISA 3 5,020,824.00 TSPC 3 5,407,957.92
RMBA 3 9,232,016.00 MYOR 3 9,709,838.25
ICBP 3 21,267,470.00 UNVR 3 13,348,188.00
SAFE 4 14,395.38 ZBRA 4 39,645.20
INDX 4 147,417.71 LRNA 4 239,668.00
MIRA 4 491,868.24 WEHA 4 515,509.83
HITS 4 1,940,272.82 BBRM 4 1,999,157.31
APOL 4 2,577,573.88 TRUB 4 2,710,182.10
TRAM 4 3,885,235.70 MBSS 4 4,293,359.61
FREN 4 15,866,493.43 TOWR 4 15,534,076.00
TBIG 4 18,719,211.00 JSMR 4 28,058,581.78
EXCL 4 40,277,626.00 GIAA 4 35,947,562.87

118
Change in PEP No Change
SMMT 5 626,650.33 MBAP 5 880,197.53
GTBO 5 1,076,575.60 RUIS 5 1,277,942.89
ATPK 5 1,489,339.95 ESSA 5 1,439,439.91
BSSR 5 1,937,956.78 MYOH 5 1,815,818.26
TOBA 5 3,792,755.42 CITA 5 3,773,605.65
DEWA 5 4,451,275.21 ELSA 5 4,370,964.00
HRUM 5 5,849,159.24 PTRO 5 6,197,475.14
TKGA 5 6,046,016.14 TINS 5 7,883,294.00
BIPI 5 16,053,486.27 ITMG 5 16,146,620.52
BRMS 5 22,966,472.67 ANTM 5 21,865,117.39
ENRG 5 28,217,941.71 INCO 5 27,761,218.23
ADRO 5 81,489,723.67 BUMI 5 72,387,177.74
BATA 6 680,685.06 KBLM 6 654,296.26
SRIL 6 5,590,981.80 ADMG 6 6,824,159.96
AUTO 6 12,617,678.00 INDR 6 8,943,987.17
IMAS 6 22,315,022.51 GJTL 6 15,350,754.00
LCGP 7 1,652,514.52 NRCA 7 1,625,318.98
COWL 7 1,944,913.75 GWSA 7 2,045,701.78
TOTL 7 2,226,418.48 DGIK 7 2,100,802.67
PWON 7 9,298,245.41 MDLN 7 9,647,813.08
BKSL 7 10,665,713.36 ADHI 7 9,720,961.76
APLN 7 19,679,908.99 CTRA 7 20,114,871.38
AIMS 8 24,648.96 GMCW 8 20,617.64
CMPP 8 59,996.77 INTD 8 53,413.14
ICON 8 73,912.75 PGLI 8 65,733.45
TRIL 8 185,933.39 WICO 8 169,324.43
HOME 8 260,422.40 FORU 8 263,517.56
GEMA 8 377,603.94 SAME 8 377,654.88
MICE 8 628,738.17 GREN 8 615,900.48
MIDI 8 2,108,897.00 SRAJ 8 2,052,080.88
TGKA 8 2,471,998.08 ACES 8 2,478,918.58
FISH 8 3,190,225.74 CSAP 8 3,107,895.43
JSPT 8 3,428,702.49 JKON 8 3,417,012.22

119
Change in PEP No Change
CNKO 8 5,516,122.34 EPMT 8 5,528,067.70
AMRT 8 10,962,227.00 MPMX 8 11,220,245.00
DSSA 8 14,586,639.26 AKRA 8 14,633,141.38
120
Appendix B
Sample of Invitation Letter
Our ref: Information Letter
1 July 2014
An Investigation of Politically Connectedness and Company Performance in Indonesia
Dear Sir/Madam
We are seeking your participation in a research study on the relationship between political
connectedness and company performance in Indonesia.
There are two phases to the study. The first involves the investigation, through interviews, of market
professionals’ perceptions of political connectedness in Indonesia and its effect on the value of the firm. The second phase involves analysing political connectedness and operating performance using data
from financial statements of listed companies in Indonesia.
Political connectedness of a company can be measured by examining whether members of the board of directors or commissioners are current or former senior officials in the executive, legislative,
administrative and military.
We welcome your participation in the study by taking part in an interview that should take no longer than
60 minutes. Questions in the interview include the following:
1. What%is your educational background and professional experience?
2. Which companies do you perceive are most competitive in Indonesia?
3. What are the factors that are important to competing effectively in Indonesia? 4. Do you believe companies need to be politically connected to be competitive in Indonesia? If so,
why? 5. Does politically connectedness vary across industries? If so, why?
6. How else might you define political connectedness?
By completing the Participant Consent Form attached, you are indicating your consent to participate in
this study. While we would greatly value your input, participation in this study is voluntary. You may withdraw your written consent at any time during the data collection period of this research project. Your participation in this study does not prejudice any right to compensation, which you may have under statute or common law.
All of your responses will be anonymous and confidential, and data will be reported in a way that will ensure that you will not be identified. No reference will be made to the companies you work for. For the
analysis and discussion, comments may be aggregate or discussed with reference to your position or professions, e.g., comments from lawyers or consensus from research analysts. It is our intention to not
store any identifying information, nor to collect identifying information with the interviews.
Business School
M250 35 Stirling Highway
Crawley
WA 6009
Australia
T +618 6488 2974 E [email protected] www.business.uwa.edu.au
CRICOS Provider Code: 00126G
121
The audio of the individual interviews will be recorded and transcribed to ensure that all responses are captured. Recordings and anonymous transcriptions of the discussion will be stored securely in a
database on the computer of the researcher at the UWA Business School until the completion of the research when the audio files will be destroyed.
Should you have further questions regarding this study or would like to receive the summarized results of this study, please do not hesitate to contact Amiruddin ([email protected]).
Yours sincerely,
W/Prof Raymond Da Silva Rosa A/Prof Marvin Wee
UWA Business School UWA Business School
Amiruddin DBA Student, UWA Business School
Approval to conduct this research has been provided by The University of Western Australia, in
accordance with its ethics review and approval procedures. Any person considering participation in this research project, or agreeing to participate, may raise any questions or issues with the researchers at any
time.
In addition, any person not satisfied with the response of researchers may raise ethics issues or
concerns, and may make any complaints about this research project by contacting the Human Research Ethics Office at The University of Western Australia on (08) 6488 3703 or by emailing to hreo-
All research participants are entitled to retain a copy of any Participant Information Letter and/or
Participant Consent Form relating to this research project.
122
Appendix C
Sample of Consent Letter
Our ref: Participant Consent Form (PCF)
1 July 2014
An Investigation of Politically Connectedness and Company Performance in Indonesia
I (the participant) have read the information provided and any questions I have asked have been answered to my
satisfaction. I agree to participate in this activity, realising that I may withdraw at any time without reason and without prejudice.
I understand that all identifiable (attributable) information that I provide is treated as strictly confidential and will not be released by the investigator in any form that may identify me. The only exception to this principle of confidentiality is if documents are required by law.
I have been advised as to what data is being collected, the purpose for collecting the data, and what will be done with the data upon completion of the research.
I agree that research data gathered for the study may be published provided my name or other identifying information is not used.
________________ _______________ Participant Date
(Please note that, as the PCF is not a contract between parties, it is not necessary that the researcher
counter-sign the form. Nor is it necessary to have a witness to the participant's signature. There may be some exceptions to this generalisation in cases where researchers feel that there would be practical,
rather than purely legal, benefit in being able to more clearly verify a participant's consent.)
Approval to conduct this research has been provided by The University of Western Australia, in accordance with its ethics review and approval procedures. Any person considering participation in this research project, or agreeing to participate, may raise any questions or issues with the researchers at
any time.
In addition, any person not satisfied with the response of researchers may raise ethics issues or
concerns, and may make any complaints about this research project by contacting the Human Research Ethics Office at The University of Western Australia on (08) 6488 3703 or by emailing to [email protected]
All research participants are entitled to retain a copy of any Participant Information Letter and/or Participant Consent Form relating to this research project.
UWA Business School
M250 35 Stirling Highway
Crawley
WA 6009
Australia
T +618 6488 2974 E [email protected] www.business.uwa.edu.au
CRICOS Provider Code: 00126G