Does Vertical Integration Affect Firm Performance Evidence From the Airli
26
RAND Journal of Economics Vol. 41, No. 4, Winter 2010 pp. 765–790 Does vertical integration affect firm performance? Evidence from the airline industry Silke J. Forbes ∗ and Mara Lederman ∗∗ We investigate the effects of vertical integration on operational performance. Large U.S. airlines use regional partners to operate some of their flights. Regionals may be owned or governed through contracts. We estimate whether an airline’s use of an owned, rather than independent, regional at an airport affects delays and cancellations on the airline’s own flights out of that airport. We find that integrated airlines perform systematically better than nonintegrated airlines at the same airport on the same day. Furthermore, the performance advantage increases on days with adverse weather and when airports are more congested. These findings suggest that, in this setting, vertical integration may facilitate real-time adaptation decisions. 1. Introduction Do firm boundary decisions affect firm performance? Although theoretical work predicts that one should find performance implications of vertical integration decisions, there is little direct evidence on this question (see, for example, Williamson, 1975, 1985; Grossman and Hart, 1986; Hart and Moore, 1990 for theoretical work). Such empirical evidence has been hard to establish for two reasons. First, it is difficult to obtain data on outcome measures for similar transactions that are organized differently. Second, firm boundary decisions will typically be endogenous ∗ University of California, San Diego; [email protected]. ∗∗ University of Toronto; [email protected]. We are grateful to the editor, Ariel Pakes, and two anonymous referees for comments that greatly improved the article. Itai Ater, Severin Borenstein, Ken Corts, Julie Cullen, Luis Garicano, Bob Gibbons, Scott Masten, Anita McGahan, Michael Salinger, and Steve Tadelis provided valuable input. We also thank seminar participants at the Harvard-MIT Organizational Economics Seminar (2007), Northwestern University, Kellogg School of Management (2009), Loyola Marymount University (2007), the University of California, Berkeley, Haas School of Business (2008), the University of Rochester, Simon School of Business (2007), the University of Southern California, Marshall School of Business (2007), the University of Toronto, Rotman School of Management (2007), the Allied Social Science Association Conference (2008), the International Society for New Institutional Economics Conference (2006), and the NBER Universities Research Conference on the Airline Industry (2009). Graton Gathright provided excellent research assistance. Lederman acknowledges financial support from the Social Science and Humanities Research Council of Canada. All errors are our own. Copyright C 2010, RAND. 765
description
Does Vertical Integration Affect Firm Performance
Transcript of Does Vertical Integration Affect Firm Performance Evidence From the Airli

RAND Journal of EconomicsVol. 41, No. 4, Winter 2010pp. 765–790
Does vertical integration affect firmperformance? Evidence from the airlineindustry
Silke J. Forbes∗and
Mara Lederman∗∗
We investigate the effects of vertical integration on operational performance. Large U.S. airlinesuse regional partners to operate some of their flights. Regionals may be owned or governedthrough contracts. We estimate whether an airline’s use of an owned, rather than independent,regional at an airport affects delays and cancellations on the airline’s own flights out of thatairport. We find that integrated airlines perform systematically better than nonintegrated airlinesat the same airport on the same day. Furthermore, the performance advantage increases on dayswith adverse weather and when airports are more congested. These findings suggest that, in thissetting, vertical integration may facilitate real-time adaptation decisions.
1. Introduction
� Do firm boundary decisions affect firm performance? Although theoretical work predictsthat one should find performance implications of vertical integration decisions, there is little directevidence on this question (see, for example, Williamson, 1975, 1985; Grossman and Hart, 1986;Hart and Moore, 1990 for theoretical work). Such empirical evidence has been hard to establishfor two reasons. First, it is difficult to obtain data on outcome measures for similar transactionsthat are organized differently. Second, firm boundary decisions will typically be endogenous
∗University of California, San Diego; [email protected].∗∗University of Toronto; [email protected] are grateful to the editor, Ariel Pakes, and two anonymous referees for comments that greatly improved the article.Itai Ater, Severin Borenstein, Ken Corts, Julie Cullen, Luis Garicano, Bob Gibbons, Scott Masten, Anita McGahan,Michael Salinger, and Steve Tadelis provided valuable input. We also thank seminar participants at the Harvard-MITOrganizational Economics Seminar (2007), Northwestern University, Kellogg School of Management (2009), LoyolaMarymount University (2007), the University of California, Berkeley, Haas School of Business (2008), the University ofRochester, Simon School of Business (2007), the University of Southern California, Marshall School of Business (2007),the University of Toronto, Rotman School of Management (2007), the Allied Social Science Association Conference(2008), the International Society for New Institutional Economics Conference (2006), and the NBER UniversitiesResearch Conference on the Airline Industry (2009). Graton Gathright provided excellent research assistance. Ledermanacknowledges financial support from the Social Science and Humanities Research Council of Canada. All errors are ourown.
Copyright C© 2010, RAND. 765

766 / THE RAND JOURNAL OF ECONOMICS
(Masten, 1993). In this article, we overcome these difficulties and document the existence andmagnitude of performance differences between integrated and nonintegrated firms carrying outvirtually identical transactions. Our results indicate that, operationally, there is a performanceadvantage to vertical integration.1 Moreover, we find that this performance advantage increaseswhen the need for adaptation decisions is greater. We believe that this article is one of the first toboth measure the performance implications of integration decisions as well as provide empiricalevidence on a possible underlying cause.
Our setting is the U.S. airline industry. All of the large U.S. network carriers, often called“majors,” employ regional airlines to operate a subset of their routes. Regional airlines may beowned by the major for which they operate or they may be independent and contract with oneor more major carriers. To the extent that contracts do not fully align an independent regional’sincentives with those of its major, vertically integrated airlines may systematically performdifferently from vertically separated ones. In particular, if independent regionals are less willingthan owned regionals to carry out noncontractible adaptation decisions, then ownership may affectthe efficiency with which majors can respond to schedule disruptions (which arise frequently inthis industry). Moreover, because a regional’s flights and a major’s own flights compete forpotentially scarce airline and airport resources, this may impact not only the performance of theregional’s flights but the performance of the major’s flights as well.
We estimate whether use of an owned rather than independent regional at a particular airportaffects a major’s performance on the flights that it itself operates out of that airport. We measureperformance using flight-level data on delays and cancellations. Our empirical approach exploitsthree important features of our setting. First, because we observe many airports at which somemajors use owned regionals while others use independent regionals, we are able to include fixedeffects for each origin airport-day combination in our regressions, in addition to a rich set ofcontrol variables. Thus, we identify the effects of integration by comparing the performancemetrics of integrated and nonintegrated majors at the same airport on the same day. Second,because we are estimating the impact of ownership of a regional on the performance of themajor, characteristics that affect the returns to integration on regional routes but which do notdirectly affect performance on the major’s routes can serve as instruments for airlines’ ownershipdecisions. Finally, weather conditions provide an observable and exogenous source of variation inthe likelihood that adaptation decisions will be needed. Because weather changes on a daily basiswhereas ownership decisions are fixed at least in the medium term, we are able to trace out therelationship between integration and performance as the need for adaptation decisions increasesbut organizational forms remain fixed.
Our empirical analysis finds that, in the absence of adverse weather and at average levelsof airport congestion, majors using only integrated regionals at an airport experience averagedeparture delays that are about 2.3 minutes shorter than those experienced by majors using onlyindependent regionals. This performance advantage increases to about 5.6 minutes on days with“heavy” rain. It also increases with airport congestion. These results emerge in both ordinary leastsquares (OLS) and instrumental variables (IV) models and are robust across alternative measuresof on-time performance. When we try to capture adverse weather using measures of snowfall,the results are somewhat weaker. OLS specifications find that the performance advantage ofintegrated majors decreases on days with “heavy” snow.2 IV specifications find a negative pointestimate, indicating an increase in the performance advantage, but in most specifications it isimprecisely estimated. However, when we examine cancellation rates and very long delays, wefind that—for these particular margins—the performance advantage of integrated majors doesincrease on days with snow. Overall, our results indicate that integrated majors have systematically
1 We use the term “operational performance” to distinguish what we measure from measures of overall performancesuch as profits.
2 As we explain below, we expect the OLS estimate to be biased upward due to the endogeneity of integrationdecisions.
C© RAND 2010.

FORBES AND LEDERMAN / 767
better operational performance than nonintegrated majors, and that this performance differencegrows larger on days and at times when real time adaptation decisions are likely to be needed.
In addition to being one of the only articles to provide evidence on the effects of verticalintegration on operational performance, we believe this article is also one of the few empiricalcontributions that focus explicitly on the relationship between integration and adaptation decisionsand the first that does so without relying on survey measures.3 Williamson (1975, 1985) firstdeveloped the hypothesis that integration facilitates adaptation decisions. Bajari and Tadelis(2001) and Tadelis (2002) further develop the idea that the need for ex post adaptation decisionscan be a source of transaction costs and can therefore influence both contract design and integrationdecisions. In our previous work, Forbes and Lederman (2009), we investigate the determinantsof vertical integration between major and regional airlines. Our focus there is also on the needfor ex post adaptation and we show that majors are more likely to use owned regionals on routeson which they expect to have to make more adaptation decisions and on routes on which havingadaptation decisions resolved suboptimally is more costly. This article builds on our earlier workby focusing explicitly on identifying the causal effect of integration on an important performancemetric in this industry and providing evidence that sheds light on the underlying mechanism.
There is an existing set of articles that focuses on the consequences of vertical integration.Lafontaine and Slade (2007) provide a survey of this literature. Within this literature, one candistinguish between those that test market-power-based theories of integration (such as Hortacsuand Syverson, 2007) and those that—like us—test incomplete contracting-based theories. Thelatter category includes articles such as Mullainathan and Scharfstein (2001) and Ciliberto(2006), both of which investigate the effects of organizational form on investment decisionsas well as Baker and Hubbard (2004) and Gil (2009) which, respectively, explore the implicationsof organizational form decisions in the trucking and movie industries. Our article is perhapsmost closely related to Novak and Stern (2008), which also examines the relationship betweenvertical integration and a specific performance measure—in their case, Consumer Reports ratingsof automobile systems. They find that integrated firms have lower initial ratings but greaterimprovements in ratings over time, which can be interpreted as evidence that integration facilitatesadaptation when changes become necessary.4
This article is organized as follows. In Section 2, we explain why ownership of a regionalmay lead to operational efficiencies, particularly when noncontractible schedule adjustments areneeded. Section 3 describes our empirical approach and Section 4 addresses data and measurementissues. We present our results in Section 5. In Section 6, we provide some additional discussion.A final section concludes.
2. Vertical integration in the airline industry
� The role of regional airlines. Regional airline service represents a large and growingfraction of U.S. domestic air travel.5 In our sample period, about one out of every seven domesticpassengers was traveling on a regional carrier. Regionals operate as “subcontractors” for largenetwork carriers on low-density short- and medium-haul routes. These are routes which are mostefficiently served with small aircraft.6 Majors subcontract these routes because regionals have acost advantage in operating small aircraft resulting from the substantially lower compensation that
3 There are studies which test whether complexity or asset specificity affects the likelihood of vertical integration.See Monteverde and Teece (1982), Anderson and Schmittlein (1984), Masten (1984), Masten and Crocker (1985), Joskow(1985), Hubbard (2001), and Levin and Tadelis (2010). See Lafontaine and Slade (2007) for a review.
4 There are also articles which look at the performance consequences of choosing an organizational form that isinconsistent with the transaction environment. This literature on “transactional misalignment” originates with Masten,Meehan, and Snyder (1991) and includes contributions mostly from the strategy field.
5 For a detailed description of the role of regionals in the U.S. airline industry, see Forbes and Lederman (2007).6 Examples of such routes include Boston to Burlington, VT, or New York City to Albany, NY.
C© RAND 2010.

768 / THE RAND JOURNAL OF ECONOMICS
TABLE 1 Majors and Regional Partners in 2000
Major Regional Partner
American Airlines American Eagle AirlinesBusiness Express
Continental Airlines Continental ExpressGulfstream International Airlines
Delta Air Lines Atlantic Coast Airlines/ACJetAtlantic Southeast AirlinesComairSkyWest AirlinesTrans States Airlines
Northwest Airlines Express Airlines, IMesaba Aviation
Trans World Airlines Chautauqua AirlinesTrans States Airlines
United Airlines Air WisconsinAtlantic Coast AirlinesGreat Lakes AviationGulfstream International AirlinesSkyWest Airlines
US Airways Mesa Air Group/Air MidwestAllegheny AirlinesMesa Air Group/CCAirChautauqua AirlinesColgan AirwaysCommutairMesa Air Group/Mesa AirlinesPiedmont AirlinesPSA Airlines
Note: Regional carriers in bold are fully owned by the major.Source: Regional Airline Association (www.raa.org).
regional airline employees receive.7 Majors do not typically operate any small aircraft themselves;thus, the decision whether to use a regional to serve a route is effectively a decision about planesize.
Regionals operating as subcontractors for majors do so under codeshare agreements. Underthese agreements, the regional operates flights on behalf of the major. These flights are operatedunder the major’s flight designator code and are marketed under the major’s brand. For example,the regional Comair operates flights for Delta under the name Delta Connection. Many regionalflights operating under codeshare agreements connect small airports to one of the major’s hubs,and many of the passengers travelling on the regional connect to or from flights operated by themajor. The major is responsible for the scheduling, marketing, and ticketing of the regional’sflights, even those that do not connect to one of its hubs. Thus, regionals are providing an input—specifically, the operation of the aircraft—into a final product that is sold by the major. This isthe sense in which majors and regionals are involved in a vertical relationship.
� Organizational forms. Relationships between majors and regionals are governed by oneof two organizational forms: (i) a regional may be independently owned and contract with one ormore major carriers, or (ii) a regional may be wholly owned by the major with which it partners.8
Table 1 lists the major-regional partnerships that were in place in 2000 for the carriers in our
7 See Forbes and Lederman (2009) for a discussion of the source of lower labor costs among regional airlineemployees. In addition, Hirsch (2007) contains a comparison of pay rates at majors and regionals.
8 In which case, we do not observe that the regional operates flights for competitors of its parent company.
C© RAND 2010.

FORBES AND LEDERMAN / 769
sample. Regional carriers that appear in bold were fully owned by their major partner. The tableshows that there is substantial heterogeneity both across and within majors in the extent to whichregional partners are owned.
In the case of an owned regional, the major carrier owns the assets of the regional but theregional and the major technically maintain separate operations. The main reason they separatetheir operations is so that they can maintain distinct labor contracts (one for the major’s ownemployees and one for each of its regional’s employees) and thereby preserve the cost advantagesthat regionals provide.9 We use the term “vertical integration” to refer to this relationship betweena major and an owned regional.
The relationship between majors and independent regionals is governed by contracts. Ingeneral, these contracts specify which routes the regional will serve for the major, the planesthat the regional will use, and the schedule of flights. Contracts between majors and independentregionals take one of two forms. Historically, most were revenue-sharing agreements under whichthe major and the regional shared the revenue from passengers whose itineraries involved travelon both airlines. Beginning in the late 1990s, majors and regionals have increasingly used what areknown as “capacity purchase agreements.”10 Under these agreements, the major retains all ticketrevenue and pays the regional a fixed amount on a block-hour or flight-hour basis. The paymentis structured to cover the regional’s costs and provide it with a reasonable rate of return. Capacitypurchase agreements insulate a regional from revenue risk but leave it the residual claimant onprofit increases that result from effective management of costs such as crew wages and lodgingexpenses. Relevant to our analysis here is the fact that, under both contract types, independentregionals face financial incentives that are based only on the routes that they serve and not on theremainder of the major’s network.
� Vertical integration and operational performance. We hypothesize that performancebenefits to ownership might arise in this setting because contracts between majors and independentregionals are incomplete on at least one important dimension: real-time schedule adjustments.Schedule disruptions are common in the airline industry, resulting from a variety of factors suchas adverse weather and mechanical problems. When they arise, majors may have to rescheduletheir own flights as well as the flights operated by their regional partners. Inclusion of these typesof schedule adjustments in a contract is unlikely to be feasible because the contract would haveto specify ex ante the full set of changes that would be made under every possible contingencyand the precise manner in which the regional would carry out these changes.11 Moreover, becausethe contracts used in this industry do not tie the regional’s compensation to the performance ofthe major’s network, an independent regional has no financial incentives to comply with schedulechanges that may not be in its own interest.12 Schedule changes that the major requests mayeven impose costs on the regional. For example, schedule changes may require a regional to payovertime to its crew, and independent regionals are responsible for their labor costs. Schedulechanges ordered by the major may also negatively impact the regional’s own performance statistics,which could be important in seeking new business from other major carriers. For these reasons,
9 If two airlines are effectively being operated as a single entity, the unions representing employees at those airlinesmay file an application with the National Mediation Board seeking to have them declared a “single transportation system.”If granted, the unions of the carriers will operate as a single entity.
10 This discussion draws on the American Institute of Certified Public Accountants (2007). See also Forbes andLederman (2010) for a more detailed discussion of the change in contractual form and an analysis of the incentiveproperties of the two contract types.
11 Even if it were feasible to specify these contracts, the fact that such contracts are not written suggests that itwould be prohibitively costly to do so. Carlton (1979) shows theoretically that reducing uncertainty over the availabilityof inputs can be a motivation for vertical integration.
12 Even capacity purchase agreements are unlikely to fully align the regional’s incentives with those of the major. InSection 4, we discuss why majors and regionals are unlikely to be able to write contracts that would address this incentiveproblem.
C© RAND 2010.

770 / THE RAND JOURNAL OF ECONOMICS
independent regionals may have limited incentives to execute the real-time schedule changes thattheir majors request.
Why would this impact the operational performance of the major? At a given airport, anairline’s own flights and its regional flights are integrated into a common network and competefor access to potentially scarce airport and airline resources. Takeoff and landing slots, groundcrew, equipment such as deicing machines, and sometimes gates can be shared across majorsand regionals. When schedule adjustments become necessary, a major trying to optimize itsnetwork may ask its regional to take certain actions that give the major’s flights preferentialaccess to these resources. Whether and how these actions are carried out by the regional canimpact the performance of the major’s flights. Consider the following examples. (i) When anairport is affected by adverse weather, airport activity will be reduced because more time isrequired between takeoffs and landings. Airlines will likely need to delay a large fraction of theirflights. A major may choose to delay its regional flights so that larger, fuller mainline flightscan depart and may ask a regional to move its aircraft from its gates. The willingness and speedwith which the regional does this will impact the major’s ability to avoid further delays on itsown flights. (ii) When a flight lands later than scheduled, the gate and/or ground crew scheduledfor this flight may no longer be available. To avoid a lengthy arrival delay as well as a lengthydeparture delay on the aircraft’s next leg, a major may try to “turn the plane around” more quicklythan usual. The major may ask the regional’s employees to help unload and load baggage fromthe plane. The willingness and speed with which the regional does this will clearly affect delaysexperienced on this flight. More generally, if airport or airline resources are scarce, then any timeflight departures or arrivals deviate from their set schedule, integration may allow a major to moreefficiently respond to the schedule disruption by improving its access to resources that had beenallocated to the regional. It is worth emphasizing that although access to a certain set of sharedresources may give rise to performance implications for the major’s flights, aircraft and crew arenot shared across majors and regionals. Thus, they are not the source of the externalities that weare trying to measure.
Why would employees at owned regionals have better incentives to comply with the major’srequests? Owned regionals are likely to be less concerned with their financial and operationalperformance metrics. Furthermore, owned regionals should be more concerned about the profitsand overall financial health of their major. Because they fly only for the major that owns them,if that major were in financial difficulty and had to divest itself of its regional unit, this couldimpose costs on the regional’s employees who, after divestiture, might have to accept the lowersalaries that prevail at independent regionals. In addition, career paths between owned regionalsand majors are better established.
In Table 2, we investigate whether the raw data show any indication of a performancedifference between majors using owned and majors using independent regionals. For the purposesof this simple table, we divide majors into two groups—those that have fewer than or exactly 50%of their regional flights at an airport operated by an owned regional and those that have more than
TABLE 2 Summary of Delay Distribution, by Organizational Form
Mean p25 p50 p75Delay Delay Delay Delay Cancellations N
<50% of regional flights at airportare by regional that is owned
13.04 −3 0 12 0.05 790,749 (88% equal 0)
>50% of regional flights at airportare by regional that is owned
9.88 −3 0 8 0.03 1,191,058 (71% equal 1)
Note: Data are at the flight level. Table shows differences in delays and cancellations across flights operated by majorswith more than/less than 50% of their regional flights at the departure airport of the flight operated by a regional that isowned.
C© RAND 2010.

FORBES AND LEDERMAN / 771
50% of their regional flights at an airport operated by an owned regional. We compare the meandeparture delay, the 25th, 50th, and 75th percentile departure delay, and the cancellation ratesof these two groups. The table shows that the mean departure delay on majors’ flights departingfrom airports at which they use owned regionals is about 3 minutes shorter than the mean delayon flights operated by majors using independent regionals. Interestingly, there appears to be nodifference in the 25th and 50th percentiles of their delay distributions but a 4 minute differencein the 75th percentile. Cancellation rates also appear to be lower for flights operated by majorsusing owned regionals. Although this is, of course, very preliminary evidence, it does suggestthat there may be systematic performance differences across integrated and nonintegrated firmsin this setting. We now turn to a more formal empirical analysis.
3. Empirical approach
� Ideally, we would like to investigate whether ownership of a regional allows a major tocome closer to its profit-maximizing departure schedule, given the realized values of all relevantvariables (for example, weather and air traffic control problems). Clearly we cannot calculatewhat an airline’s ideal departure schedule would be in every state of the world. We can, however,measure a major’s delays and cancellations on each flight that it operates. Therefore, for ourempirical analysis, we assume that fewer delays on average (relative to the major’s originaldeparture schedule) indicate that a major is coming closer to achieving its optimal departureschedule. We also explore whether there is evidence of differences in very long delays andcancellation rates. Although we would also like to explore the impact of ownership on theregional’s performance, data limitations prevent us from doing so because most regionals are toosmall to meet the reporting requirements of the Bureau of Transportation Statistics. Our resultswith respect to the major’s own flights should therefore be considered only a partial estimate ofthe effects of integration in this setting. However, given the substantially larger size of majorscompared to regionals (majors carried six times as many passengers as regionals in 2000), ourestimates should reflect a large portion of the total effect.
� Empirical specification. Our empirical specification regresses a major’s performance on aparticular flight on its extent of integration with the regional carrier(s) that it uses at the originairport of that flight. We exploit the fact that there are many airports at which some majors useowned regionals whereas others use independent regionals, and include fixed effects for eachorigin airport-day combination in our model. Thus, we are able to test whether at a given airport,on a given day the operational performance of majors using owned regionals differs from that ofmajors using independent regionals.
As described in the previous section, we hypothesize that ownership may mitigate anincentive problem that is particularly likely to arise when majors need to make noncontractiblechanges to a regional’s schedule. To investigate whether the performance effects of ownershipmay result from the fact that ownership of a regional facilitates real-time schedule adjustments,we identify situations in which a major is more likely to have to make unanticipated changesto its set schedule of flights. We do this in two ways. First, we exploit the fact that adverseweather is one of the leading causes of schedule changes and use measures of the daily weatherat an airport as proxies for the likelihood that flights departing from that airport will be affectedby noncontracted schedule adjustments. Second, we construct a measure for airport capacityutilization to identify times of day during which airport congestion may cause an airline to haveto make schedule changes.13 We interact our integration measure with measures of daily weatherand hourly congestion to test whether ownership has a different effect on operational performanceon days with particularly adverse weather conditions or at congested times of day.
13 We thank an anonymous referee for this suggestion. Because expected airport capacity utilization is known exante, one could worry that the decision whether to schedule during a congested time is endogenous. However, the meanvalue of our congestion variable is quite similar across integrated and nonintegrated carriers.
C© RAND 2010.

772 / THE RAND JOURNAL OF ECONOMICS
Specifically, we estimate the following equation:
PERFtfir = αt
o + δ1 OWNEDir + δ2 OWNEDir ∗ ADAPTtfr + X t
firβ + εtifr, (1)
where PERFtfir is a measure of airline i’s operational performance on flight f on route r on day t,
αto is an origin airport-date fixed effect, OWNEDir measures the extent of airline i’s ownership of
its regionals serving the origin airport of route r, ADAPTtfr is a vector of variables that measure
the extent of adverse weather at the origin airport of route r on day t or the level of congestionat the origin airport of route r around flight f ’s scheduled departure, X t
f ir is a vector of controlvariables (including flight, airline, and airport-level variables), and εt
i f r is an error term. If thereare performance benefits to ownership and if these are greater on days with adverse weather orduring more congested times of day, then we would find both δ1 < 0 and δ2 < 0.
� Endogeneity. Because ownership decisions are made by optimizing firms, measuresof integration will typically be endogenous in a performance equation (see Masten, 1993;Gibbons, 2005). A valid instrument must be correlated with the firm’s ownership decision butuncorrelated with the error term in the performance equation. However, because the same variablesdetermining the ownership decision will also appear in the performance equation, instrumentsfor organizational-form decisions are difficult to find. Although this is true in our setting as well,the fact that we are measuring the impact of ownership on a specific performance margin ratherthan the overall performance of the firm gives rise to a potential source of instruments which willbe valid under certain conditions.
Based on Forbes and Lederman (2009), one can think of a major’s decision whether to use anowned regional on a particular route as depending on: (i) the returns to integration on the regionalroute; (ii) the returns to integration on other routes in the major’s network (especially thosethat share an endpoint with the regional route); and (iii) the returns to integration that accruesystemwide (for example, through higher labor costs). Our performance equation measureswhether a major’s ownership of the regional(s) that it uses at a particular airport affects theperformance of its flights that depart from that airport. Variables that influence the returns tointegration elsewhere in the major’s network but do not directly influence the major’s performanceon the flight in question will be valid instruments for the major’s integration decision at the originairport of that flight.
The logic of this instrumental variables approach is best illustrated with an example (seeFigure 1 for a representation of this example). Consider a particular Delta Air Lines flightfrom Boston to Atlanta one day in 2000. This represents a single observation in our data. Forthis observation, our ownership variable measures the extent to which Delta uses an ownedregional to serve its regional routes into and out of the Boston airport, routes such as Boston-Albany, New York or Boston-Burlington, Vermont. Delta’s decision whether to use an owned orindependent regional on, say, the Boston-Burlington route will depend on the returns to ownershipon the Boston-Burlington route, on Delta’s other routes out of Burlington, and on Delta’s otherroutes out of Boston, with the latter being precisely what our performance equation is trying tomeasure. Characteristics of the Burlington airport will affect the returns to integration on theBoston-Burlington route as well as other routes out of Burlington and, as we show in our earlierwork, are strongly correlated with Delta’s ownership decision on this regional route. Assumingcharacteristics of the Burlington airport do not directly affect Delta’s performance on the Boston-Atlanta route, they can serve as valid instruments for the ownership variable. The same is true forthe characteristics of the other regional endpoints that Delta connects to Boston with a regionalpartner. Based on this logic, we instrument for major’s ownership decision at a particular airportwith the characteristics of the endpoint airports that its regional(s) connects to that airport.In particular, we use the characteristics that our earlier work found to predict owned regionaluse. These characteristics are the long-run average precipitation and snowfall at the airport and
C© RAND 2010.

FORBES AND LEDERMAN / 773
FIGURE 1
ILLUSTRATION OF IDENTIFICATION STRATEGY
SFO
ORD
Served by American Airlines SYR
BGR
Served by Delta Air Lines
Served by American’s regional(s)
Served by Delta’s regional(s)
ALB
ATL
BTV
TPA
BOS
whether the airport is a hub for the major.14 Even though the returns to integration might varywith short-run fluctuations in weather, our earlier work and hence our instruments here use thelong-run average weather at an airport because we assume adjustment costs prevent firms fromchanging their integration status in the short run.
Continuing with our example, the validity of our instruments depends on the assumptionthat the long-run weather conditions at Burlington and its hub status are uncorrelated with theerror term in the performance equation for Delta’s Boston-Atlanta flight. In order to assess thereasonableness of this assumption, it is helpful to think through what might be contained in theerror term of our performance equation. Even though our models include a full set of departureairport-date fixed effects and a large number of control variables, we only explain about 16% ofthe variation in departure delays. The remaining variation must be due to airport-specific factorsthat vary within the day (and so are not captured by our airport-date fixed effects), airline-specificspecific factors that are not explicitly controlled for, and idiosyncratic flight-level unobservables.Examples would include the actual timing of bad weather, air traffic control problems that occurat a specific time of day, mechanical or crew problems that affect a specific flight, or problemsthat occur elsewhere in the airline’s network that lead to propagating delays.
Because our instruments measure characteristics of other airports in the major’s network, therisk of propagating delays could result in correlation between our instruments and the error in theperformance equation. For example, one might be concerned that long-run weather conditionsat the Burlington airport could be correlated with realized weather conditions at Burlington andthat realized weather at Burlington on a given day could be correlated with Delta’s delays onflights from Boston that day. For a number of reasons, we believe that long-run average weatherconditions at the regional endpoints are unlikely to be correlated with the error terms in theperformance equation. First, we estimate specifications in which we add explicit controls for
14 The precise construction of the instruments is described in Appendix A. One might believe that it is the varianceof weather conditions, not their mean, which predicts integration. We have explored this and found that the mean and thevariance are highly correlated and we cannot separately identify their effects.
C© RAND 2010.

774 / THE RAND JOURNAL OF ECONOMICS
the realized weather at the regional’s endpoint airports on the same day and find that doing sohas no effect on our two-stage least squared estimates. Second, the correlation between averagehistorical weather and the amount of rain or snow on a given day is very low.15 Third, althoughdelays certainly propagate within the major’s network, delays are much less likely to propagatefrom the regional’s network to the major’s network because aircraft and crew are not shared acrossmajors and regionals (i.e., the primary mechanism through which delays cascade from one flightto another does not operate here). Although passengers may connect between regional and majorflights, airlines typically do not “hold” outgoing flights for late incoming passengers unless it isthe last flight of the day, which is something we can directly control for and find that doing sodoes not change the results.
One might also be concerned about correlation between the hub instrument and the errorterm in the performance equation. Specifically, one could argue that whether or not Burlington isa hub for Delta provides information about the role of Boston in Delta’s network. For example,regionals do not typically fly interhub routes. So, if Burlington were a hub for Delta that wouldindicate that Boston was not. If we could not perfectly control for the relationship between anairport’s role in an airline’s network and its delays, this could lead to correlation between the hubinstrument and the error term in the performance equation. However, as we explain in Section 4,we include a number of airline-airport-level control variables in the model, among them controlsfor whether either endpoint of the route is a hub for the major. As well, we also estimatespecifications with airline-airport fixed effects. These will explicitly capture any relationshipbetween the major’s network configuration and its departure delays. These specifications do notallow us to estimate the direct effect of integration on performance; however, we can still estimatethe interaction terms with weather and congestion, and we find that the results on these terms arehighly robust to including the airline-airport fixed effects.
Finally, to the extent that there is any residual correlation between average characteristics ofthe endpoints served by a regional and the performance of a major on its own flights on a givenday, it should bias our two-stage least squares results toward finding that majors using ownedregionals perform worse because our previous work shows that airlines vertically integrate onroutes that are more likely to experience schedule disruptions.
4. Data and measurement
� Data sources. Our primary source of data is flight-level on-time statistics from the U.S.Bureau of Transportation Statistics. This database contains every flight operated by all majorU.S. carriers.16 We augment these data with information from several other sources. Data fromthe Official Airline Guide (OAG) provide the complete flight schedules of all domestic airlines,regionals as well as majors.17 Data from the Regional Airline Association (RAA) indicate whichregional airlines are owned by a particular major. Together, the OAG and RAA data allow us tocalculate an airline’s extent of vertical integration with its regionals at each airport at which itoperates. Data on the daily weather at each airport are taken from the National Oceanographicand Atmospheric Administration (NOAA).
� Construction of the sample. Our sample includes domestic flights operated by the sevenlargest network carriers (American, Continental, Delta, Northwest, TWA, United, and USAirways) in the year 2000.18,19 We begin with their flights that depart from the largest 100
15 We list these correlations in Appendix A.16 Carriers are required to report these data if they account for at least 1% of domestic passenger revenues in the
prior year.17 Our data provide a representative week for each quarter.18 TWA went through financial difficulties during this period and was acquired by American Airlines in April 2001.
We have checked that our results are robust to excluding TWA.19 All of the traditional network carriers employ regionals to some extent. The so-called low-cost carriers, such as
Southwest Airlines, do not subcontract flights to regional carriers.
C© RAND 2010.

FORBES AND LEDERMAN / 775
U.S. airports and then impose the following restrictions.20 First, we exclude flights that departfrom or arrive at airports in Alaska, Hawaii, Puerto Rico, Guam, or the U.S. Virgin Islandsbecause the nature of routes to these states and territories is quite different from travel within thecontiguous 48 states. Second, because our empirical approach exploits variation across airlines atan airport, we exclude departure airports at which we do not observe at least two majors using aregional. Third, we exclude routes to or from New York’s LaGuardia Airport because LaGuardiachanged its slot control rules during 2000, resulting in a large increase in delays (see Forbes,2008, for details). Fourth, we drop observations with missing daily weather data. Fifth, becausewe are relating a major’s departure delay on a route to its vertical integration with a regional at thedeparture airport, we exclude a major’s flights from airports at which it does not use a regional atall. Finally, we exclude flights on Saturdays and Sundays so that our variation in an airline’s extentof vertical integration is not driven by within-week fluctuations in regional use on the same route.Our final data set includes 1,981,807 flights departing from 72 departure airports and arriving at159 arrival airports on 260 days.
� Variables. Variable names and definitions appear in Table 3. Summary statistics are inTable 4.
� Performance measures. Our main dependent variable is Departure Delay, which measuresthe time between the scheduled departure and the actual departure of an aircraft from the gate.This is our preferred measure of performance because—compared to delays incurred on therunway or in the air—delays incurred at the gate are more likely to be under the airline’s control.Note that the departure delay will be negative if the aircraft pushes back early from the gate. Shortnegative delays of a few minutes are quite common. However, we exclude flights that leave morethan 15 minutes early, as we suspect that they may represent a rescheduled flight. We also excludevery long delays that appear to be flights that have been delayed and rescheduled for departure onthe following day. To do this, we identify flights for which the actual departure time recorded isearlier than the scheduled departure time and the minutes of delay recorded are consistent withthe flight departing at the earlier departure time on the subsequent day.21 We exclude these flightsbecause part of the delay incurred in these cases would be attributable to the fact that airports donot operate overnight, as opposed to the airline’s poor performance.22 As reported in Table 4, theaverage departure delay in our sample is just over 11 minutes.
The empirical analysis also uses several alternative dependent variables. Cancelled is adummy variable that equals one if the flight is cancelled. Arrival Delay measures the differencebetween a flight’s actual arrival time and its scheduled arrival time. Cancelled or Arrival Delay >
30 minutes is a dummy variable that equals one if a flight is more than 30 minutes late on arrivalor cancelled. We construct an analogous variable using a 60 minute arrival delay. The summarystatistics in Table 4 indicate that about 4% of flights in our sample are cancelled, 18% are delayedover 30 minutes or cancelled, and 11% are delayed over 60 minutes or cancelled.
� Ownership measures. To measure the extent of a major’s vertical integration with itsregionals at an airport, we measure the fraction of all regional flights that a major has departingfrom an airport on a day that are operated by a regional that is owned.23 We call this variableFraction Owned. As Table 4 indicates, the mean of Fraction Owned is 0.56. During our sampleperiod, there are no changes in the ownership of any regional carriers. Almost all of the variation inFraction Owned therefore comes from differences across the 282 carrier-airport combinations in
20 Airport rankings are based on year 2000 enplanements, compiled by the Federal Aviation Administration (FAA).21 This drops 495 observations.22 We do not drop flights that depart on the subsequent day if they depart during the few hours after midnight during
which most airports are still open.23 Note that some majors use owned as well as independent regionals at the same airport. Fraction Owned can
therefore take on other values than 0 and 1.
C© RAND 2010.

776 / THE RAND JOURNAL OF ECONOMICS
TABLE 3 Variable Names and Definitions
Variable Definition Source
Dependent VariablesDeparture Delay Difference between scheduled departure and actual departure
of aircraft from the gateBTS on-time data
Arrival Delay Difference between scheduled arrival and actual arrival ofaircraft at the gate
BTS on-time data
Cancelled =1 if flight is cancelled BTS on-time dataArrival Delay>30 Minutes
or Cancelled=1 if arrival delay is more than 30 minutes or flight is
cancelledBTS on-time data
Arrival Delay>60 Minutesor Cancelled
=1 if arrival delay is more than 60 minutes or flight iscancelled
BTS on-time data
Ownership VariablesFraction Owned Regional Fraction of major’s regional flights at the departure airport
that are operated by an owned regional partnerOAG & RAA data
Owned Regional Flights Number of major’s regional flights at the departure airportthat are operated by an owned regional partner, in hundreds
OAG & RAA data
Weather and Congestion VariablesRain Daily precipitation, on days with average temperature > 32
degrees Fahrenheit (inches)NOAA data
Rain>95th Percentile =1 if rain at an airport on a day is greater than the 95thpercentile rain observed at that airport
NOAA data
Snow Daily precipitation, on days with average temperature <= 32degrees Fahrenheit (inches)
NOAA data
Snow>95th Percentile =1 if snow at an airport on a day is greater than the 95thpercentile snow observed at that airport
NOAA data
Congestion Number of flights departing/arriving from/at an airport in anhour divided by maximum number of flights observeddeparting/arriving from/at that airport at any point in oursample
OAG data and authors’construction
Airport Variables (defined for both departure and arrival airports)Total Airport Flights Total number of domestic flights scheduled to depart from
(arrive at) the airport on a day, in hundredsOAG data
Slot =1 if the airport is a slot-controlled airport (ORD, JFK,DCA); LGA is excluded, as described in text
Authors’ construction
Airline-Airport VariablesDeparts from Hub =1 if flight departs from an airport that is the operating
airline’s hubAuthors’ construction
Arrives at Hub =1 if flight arrives at an airport that is the operating airline’shub
Authors’ construction
Regional Flights A carrier’s total number of regional flights at an airport on aday, in hundreds
OAG data
our data.24 The small amount of variation in Fraction Owned within carrier-airport combinationsover time arises from two sources. First, there are some changes in the number of regional flightsby majors that use two regionals of different ownership types at the same airport. Second, thereare four instances in which a carrier switches from using one type of regional at an airport tousing a different type of regional at that airport. These are all cases in which the major had anexisting relationship with the new regional at other airports prior to the switch. Our results arerobust to excluding these carrier-airport combinations from the estimation.
As an alternate measure of integration, we also construct Owned Regional Flights, whichmeasures the number rather than fraction of all regional flights that a major has departing froman airport on a day that are operated by a regional that is owned. Although this measure has
24 An analysis of variance shows that these differences explain 99% of the variation in Fraction Owned.
C© RAND 2010.

FORBES AND LEDERMAN / 777
TABLE 4 Means of Selected Variables
Mean Standard Deviation Minimum Maximum
Dependent VariablesDeparture Delay (min) 11.13 32.20 −15 1076Arrival Delay (min) 11.05 36.43 −1,298 1076Cancelled 0.04 0.19 0 1Arrival Delay>30 Minutes or Cancelled 0.18 0.39 0 1Arrival Delay>60 Minutes or Cancelled 0.11 0.31 0 1
Ownership VariablesFraction Owned Regional 0.56 0.45 0 1Owned Regional Flights (in hundreds) 0.65 0.85 0 2.66
Weather and Congestion Variables (Departure Airports)Rain (inches) 0.11 0.35 0 12.56Rain | Rain95th Percentile = 1 1.29 0.79 0.02 12.56Rain>0 0.27 0.44 0 1Snow (inches) 0.08 0.78 0 28.88Snow | Snow>95th Percentile = 1 3.11 3.82 0.13 28.88Snow>0 0.03 0.18 0 1Congestion 0.66 0.19 0 1
Airline-Airport VariablesDeparts from Hub 0.63 0.48 0 1Arrives at Hub 0.36 0.48 0 1Regional Flights (in hundreds) 1.03 0.79 0.01 2.98
the advantage of capturing the scale of the regional’s operations, a drawback of this measure isthat our instruments are only able to predict the decision to vertically integrate, not the scale ofregional operations. As a result, we only use this variable in OLS specifications. In our sample,the average number of owned regional flights that a major has operating at an airport on a day is65.
� Proxies for the likelihood of adaptation (weather and congestion measures). The NOAAdata contain daily observations from airport weather stations on the minimum, average, andmaximum temperatures, and the total accumulated precipitation (measured in inches). Basedon these data, we construct Rain, which measures precipitation on days on which the averagetemperature is above 32 degrees Fahrenheit, and Snow, which measures precipitation on days onwhich the average temperature is 32 degrees Fahrenheit or less.25 The average daily rainfall in oursample is 0.11 inches and the average daily snowfall is 0.08 inches. Of course, there are manydays on which there is no snow and many airports for which there is never any snow.
Our empirical approach requires us to measure “adverse” weather, that is, weather conditionsthat are likely to necessitate schedule adjustments. To construct our main measure of adverseweather, we first calculate the 95th percentile of the daily rain distribution for each airport in oursample. We then construct the dummy variable Rain>95th Percentile, which equals 1 on dayson which the observed rainfall at the airport exceeds the 95th percentile of that airport’s raindistribution. Thus, roughly speaking, Rain>95th Percentile captures an airport’s 18 rainiest daysof the year. We construct Snow>95th Percentile analogously. The average amount of rain on dayswith Rain>95th Percentile equal to 1 is 1.29 inches and the average amount of snow on dayswith Snow>95th Percentile equal to 1 is 3.11 inches. We construct all of the weather variablesfor both the departure and arrival airport of a flight.
25 We assume an average water equivalent for snow of 8%, that is, we convert 0.01 inch of accumulated precipitationon days with below freezing temperatures into 0.125 inches of accumulated snow.
C© RAND 2010.
778 / THE RAND JOURNAL OF ECONOMICS
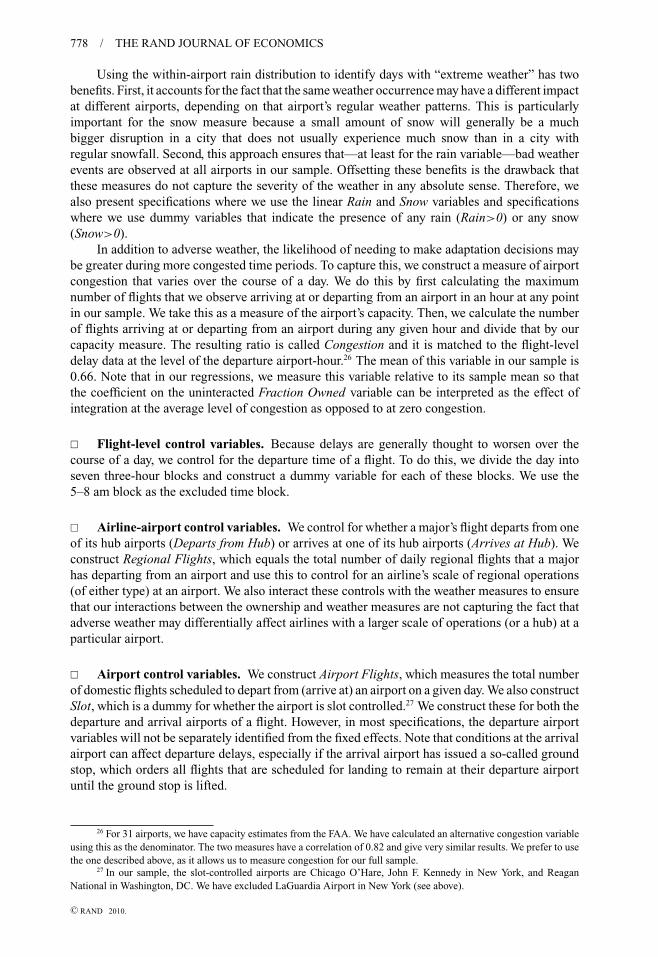
Using the within-airport rain distribution to identify days with “extreme weather” has twobenefits. First, it accounts for the fact that the same weather occurrence may have a different impactat different airports, depending on that airport’s regular weather patterns. This is particularlyimportant for the snow measure because a small amount of snow will generally be a muchbigger disruption in a city that does not usually experience much snow than in a city withregular snowfall. Second, this approach ensures that—at least for the rain variable—bad weatherevents are observed at all airports in our sample. Offsetting these benefits is the drawback thatthese measures do not capture the severity of the weather in any absolute sense. Therefore, wealso present specifications where we use the linear Rain and Snow variables and specificationswhere we use dummy variables that indicate the presence of any rain (Rain>0) or any snow(Snow>0).
In addition to adverse weather, the likelihood of needing to make adaptation decisions maybe greater during more congested time periods. To capture this, we construct a measure of airportcongestion that varies over the course of a day. We do this by first calculating the maximumnumber of flights that we observe arriving at or departing from an airport in an hour at any pointin our sample. We take this as a measure of the airport’s capacity. Then, we calculate the numberof flights arriving at or departing from an airport during any given hour and divide that by ourcapacity measure. The resulting ratio is called Congestion and it is matched to the flight-leveldelay data at the level of the departure airport-hour.26 The mean of this variable in our sample is0.66. Note that in our regressions, we measure this variable relative to its sample mean so thatthe coefficient on the uninteracted Fraction Owned variable can be interpreted as the effect ofintegration at the average level of congestion as opposed to at zero congestion.
� Flight-level control variables. Because delays are generally thought to worsen over thecourse of a day, we control for the departure time of a flight. To do this, we divide the day intoseven three-hour blocks and construct a dummy variable for each of these blocks. We use the5–8 am block as the excluded time block.
� Airline-airport control variables. We control for whether a major’s flight departs from oneof its hub airports (Departs from Hub) or arrives at one of its hub airports (Arrives at Hub). Weconstruct Regional Flights, which equals the total number of daily regional flights that a majorhas departing from an airport and use this to control for an airline’s scale of regional operations(of either type) at an airport. We also interact these controls with the weather measures to ensurethat our interactions between the ownership and weather measures are not capturing the fact thatadverse weather may differentially affect airlines with a larger scale of operations (or a hub) at aparticular airport.
� Airport control variables. We construct Airport Flights, which measures the total numberof domestic flights scheduled to depart from (arrive at) an airport on a given day. We also constructSlot, which is a dummy for whether the airport is slot controlled.27 We construct these for both thedeparture and arrival airports of a flight. However, in most specifications, the departure airportvariables will not be separately identified from the fixed effects. Note that conditions at the arrivalairport can affect departure delays, especially if the arrival airport has issued a so-called groundstop, which orders all flights that are scheduled for landing to remain at their departure airportuntil the ground stop is lifted.
26 For 31 airports, we have capacity estimates from the FAA. We have calculated an alternative congestion variableusing this as the denominator. The two measures have a correlation of 0.82 and give very similar results. We prefer to usethe one described above, as it allows us to measure congestion for our full sample.
27 In our sample, the slot-controlled airports are Chicago O’Hare, John F. Kennedy in New York, and ReaganNational in Washington, DC. We have excluded LaGuardia Airport in New York (see above).
C© RAND 2010.

FORBES AND LEDERMAN / 779
5. Results
� Our presentation of the results proceeds in several stages. We begin by briefly describingthe first-stage regression for Fraction Owned. We then describe a series of OLS regressions thatare presented in Table 5. These regressions present the basic relationships in the data, graduallyincorporating additional fixed effects. After that, we discuss the results of estimating our modelusing the instrumental variables approach described above. We then present several extensionsusing alternate performance metrics and weather measures. We conclude with some back-of-the-envelope calculations.
� First-stage regression. Appendix B presents the results of the first-stage regression ofFraction Owned on the excluded instruments and the exogenous variables. All of the instrumentshave highly significant effects and the signs of the effects are consistent with the findings inForbes and Lederman (2009). Owned regionals are more likely to be used when a greater fractionof the regional’s routes connects to the major’s hubs and when the endpoints served by theregional experience greater annual rain and snowfall. Endpoints with more months with belowfreezing temperatures are less likely to be served by owned regionals.28 Joint significance of theinstruments is confirmed by the F-statistic presented at the bottom of the table. The overall R2 ofthe regression is 0.58. The within R2 is 0.13.
� Ordinary least squares results. Table 5 presents a series of OLS regressions. In the firstcolumn, we regress Departure Delay on Fraction Owned and our control variables. We do notinclude fixed effects in this specification so that we can show the coefficients on all of the controlvariables. Consistent with the raw data in Table 2, we find that vertical integration between amajor and regional is associated with shorter delays on the major’s flights. The point estimateimplies that a major using only integrated regionals at an airport has departure delays that are,on average, 3 minutes shorter than a major using only independent regionals. This compares to amean delay in the sample of about 11 minutes. Thus, this initial finding is both statistically andeconomically significant.
In the second column of the table, we add fixed effects for each airport-date combinationand include these fixed effects in all subsequent specifications. The estimate on Fraction Ownedis virtually unchanged. The third column of the table adds interactions of Fraction Owned withthe variables that proxy for the likelihood of having to make adaptation decisions (Rain>95thPercentile, Snow>95th Percentile, and Congestion). Consistent with the discussion above, theresults indicate that the performance advantage of vertically integrated majors increases on dayswith “heavy” rain and during congested periods of the day. However, we find that the performanceadvantage actually decreases on days with “heavy” snow. The magnitudes of the estimatessuggest that—on days with “good” weather and during times with average levels of congestion—majors using only owned regionals at an airport have departure delays that are about 3 minutesshorter than majors using only independent regionals. On days with rain above the airport’s95th percentile, this advantage increases to about 7 minutes. As airport congestion increases, theperformance advantage also increases, by about 0.4 of a minute for every 10 percentage-pointincrease in congestion. The coefficient on the snow interaction suggests that the performanceadvantage of integrated majors is entirely eliminated on days with snowfall above the airport’s 95thpercentile.
The next two columns of the table add additional fixed effects. In (5-4), we add airlinefixed effects to control for systematic differences in delays across the seven airlines in oursample. Once we include these fixed effects, the coefficient on Fraction Owned becomes harderto identify because only four of our seven airlines use both owned and independent regionals.
28 In the earlier article, we explain that this result is consistent with the observation that those airports have shorterdelays on average.
C© RAND 2010.

780 / THE RAND JOURNAL OF ECONOMICS
TABLE 5 Impact of Ownership on Delays: OLS Estimates
Departure Delay (min)
(5-1) (5-2) (5-3) (5-4) (5-5) (5-6)
Ownership VariablesFraction Owned −3.095∗∗ −3.108∗∗ −2.935∗∗ 0.137
(0.213) (0.153) (0.151) (0.172)Fraction Owned ∗ Rain>95th Percentile −4.239∗∗ −4.091∗∗ −4.128∗∗
(0.879) (0.816) (0.830)Fraction Owned ∗ Snow>95th Percentile 3.207∗∗ 3.204∗∗ 2.543∗
(1.147) (1.219) (1.183)Fraction Owned ∗ Congestion −4.366∗∗ −1.944∗∗ −2.862∗∗
(0.458) (0.437) (0.437)Owned Regional Flights −3.255∗∗
(0.208)Owned Regional Flights ∗ Rain>95th Percentile −5.258∗∗
(1.172)Owned Regional Flights ∗ Snow>95th Percentile 4.835∗∗
(1.488)Owned Regional Flights ∗ Congestion −1.941∗∗
(0.250)
Flight-Level ControlsCongestion 4.295∗∗ 2.516∗∗ 5.085∗∗ 3.566∗∗ 4.034∗∗ 3.799∗∗
(0.416) (0.204) (0.340) (0.328) (0.331) (0.244)Departs 8am–11am 2.714∗∗ 3.289∗∗ 3.324∗∗ 3.260∗∗ 3.228∗∗ 3.339∗∗
(0.118) (0.102) (0.102) (0.102) (0.103) (0.102)Departs 11am–2pm 5.727∗∗ 6.316∗∗ 6.302∗∗ 6.358∗∗ 6.368∗∗ 6.277∗∗
(0.128) (0.129) (0.129) (0.129) (0.130) (0.129)Departs 2pm–5pm 9.880∗∗ 10.760∗∗ 10.798∗∗ 10.818∗∗ 10.802∗∗ 10.798∗∗
(0.163) (0.178) (0.178) (0.179) (0.179) (0.178)Departs 5pm–8pm 13.539∗∗ 14.583∗∗ 14.578∗∗ 14.569∗∗ 14.577∗∗ 14.555∗∗
(0.222) (0.241) (0.241) (0.241) (0.243) (0.241)Departs 8pm–11pm 12.733∗∗ 13.643∗∗ 13.687∗∗ 13.663∗∗ 13.627∗∗ 13.607∗∗
(0.263) (0.284) (0.285) (0.285) (0.286) (0.283)Departs 11pm–2am 9.135∗∗ 8.021∗∗ 7.850∗∗ 8.356∗∗ 8.707∗∗ 7.594∗∗
(0.558) (0.497) (0.489) (0.487) (0.486) (0.470)
Airline-Airport ControlsDeparts from Hub 1.656∗∗ 0.696∗∗ 0.660∗ 0.791∗∗ −0.550∗
(0.387) (0.265) (0.261) (0.263) (0.263)Regional Flights −0.857∗∗ 0.755∗∗ 0.660∗∗ 0.030 3.369∗∗
(0.250) (0.157) (0.154) (0.161) (0.229)Arrives at Hub 0.778∗∗ 0.098 0.004 −0.480∗∗ −0.671∗∗ 0.074
(0.132) (0.093) (0.093) (0.095) (0.093) (0.092)Rain>95th Percentile ∗ Departs from Hub −0.838 −0.830 −0.747 −2.537
(1.759) (1.729) (1.706) (1.770)Snow>95th Percentile ∗ Departs from Hub −1.594 −0.866 −1.055 0.960
(2.944) (2.979) (2.841) (3.180)Rain>95th Percentile ∗ Regional Flights 2.230∗ 2.298∗ 2.227∗ 6.488∗∗
(1.132) (1.118) (1.121) (1.506)Snow>95th Percentile ∗ Regional Flights 2.140 2.396 2.399 −2.397
(1.672) (1.747) (1.672) (2.333)Rain>95th Percentile ∗ Arrives at Hub 2.421∗∗ 2.479∗∗ 2.489∗∗ 2.458∗∗
(0.450) (0.447) (0.443) (0.450)Snow>95th Percentile ∗ Arrives at Hub 0.390 0.790 0.727 0.478
(0.550) (0.552) (0.549) (0.549)
Departure Airport ControlsTotal Airport Flights 0.445∗∗
(0.052)
(Continued)
C© RAND 2010.

FORBES AND LEDERMAN / 781
TABLE 5 Continued
Departure Delay (min)
(5-1) (5-2) (5-3) (5-4) (5-5) (5-6)
Slot Constrained 1.802∗∗
(0.663)Rain>95th Percentile 4.021∗∗
(1.509)Snow>95th Percentile 4.938∗
(2.453)Rain>95th Percentile ∗ Total Airport Flights 0.856∗∗
(0.290)Snow>95th Percentile ∗ Total Airport Flights 0.754
(0.503)
Arrival-Airport ControlsTotal Airport Flights 0.293∗∗ 0.275∗∗ 0.281∗∗ 0.271∗∗ 0.284∗∗ 0.266∗∗
(0.012) (0.010) (0.010) (0.011) (0.011) (0.010)Slot Constrained 0.896∗∗ 0.787∗∗ 0.842∗∗ −0.072 −0.350∗∗ 1.044∗∗
(0.127) (0.123) (0.122) (0.124) (0.126) (0.123)Rain>95th Percentile 1.792∗∗ 0.288 0.352 0.377 0.408+ 0.351
(0.355) (0.243) (0.244) (0.243) (0.242) (0.244)Snow>95th Percentile 3.533∗∗ −0.541 −0.517 −0.439 −0.367 −0.502
(0.778) (0.383) (0.381) (0.380) (0.377) (0.381)Rain>95th Percentile ∗ Total Airport Flights 0.731∗∗ 0.585∗∗ 0.407∗∗ 0.401∗∗ 0.393∗∗ 0.407∗∗
(0.061) (0.047) (0.055) (0.055) (0.055) (0.055)Snow>95th Percentile ∗ Total Airport Flights 0.585∗∗ 0.477∗∗ 0.450∗∗ 0.420∗∗ 0.404∗∗ 0.450∗∗
(0.092) (0.069) (0.078) (0.078) (0.077) (0.078)
Departure airport-date fixed effects X X X X XAirline fixed effects X XAirline-departure airport fixed effects X
Observations 1,904,623 1,904,623 1,904,623 1,904,623 1,904,623 1,904,623R2 0.04 0.16 0.16 0.17 0.17 0.16
Note: Standard errors are clustered on airport-date. + significant at 10%; ∗significant at 5%; ∗∗significant at 1%.
We do not estimate a significant coefficient on Fraction Owned in this specification, but all ofthe interaction terms have the same signs as before and are still significant. In (5-5), we replacethe airline fixed effects with airline-airport fixed effects. These fixed effects completely absorbthe uninteracted ownership measure but still allow the interaction terms to be identified. Theresults on these interaction terms are again consistent with those in the previous columns.
In the final column of Table 5, we reestimate column (5-3) using Owned Regional Flights.Because we already include the number of regional flights of any type as a control, this variablemeasures the impact of increasing the number of flights by an owned regional carrier by one, whileholding the major’s overall number of regional flights constant. This variable has the advantagethat it allows for the scale of integrated regional operations to matter. We find that the OLS resultsare robust to this alternative way of measuring integration. Carriers with a greater number offlights operated by an owned regional have a performance advantage which increases on dayswith heavy rain and at congested times of the day. The interaction with extreme snow is positive,as we find in all previous columns. A comparison of the estimates on Fraction Owned and OwnedRegional Flights in (5-3) and (5-6) shows that the magnitudes of the estimated effects are quitesimilar. The average number of owned regional flights that a major has an airport at which ituses an owned regional at all is about 100. The coefficient on Owned Regional Flights (which ismeasured in hundreds) is −3.55 which indicates that, at the mean, the performance advantage isabout 3.5 minutes. This is very similar to the coefficient of −2.935 estimated on Fraction Ownedin (5-3).
C© RAND 2010.
782 / THE RAND JOURNAL OF ECONOMICS
With respect to the coefficients on the control variables, we find that delays are longer forflights departing during congested times and for flights that depart later in the day. We findthat delays are generally longer for flights that depart from or arrive at the airline’s own huband for flights that depart from or arrive at larger airports or slot-controlled airports. Delaysare also longer on days with rain or snow above the 95th percentile of the airport’s distribution(with weather conditions at both the departure and arrival airport having an effect on a flight’sdeparture delay). We also find that coefficients on the interaction effects of the airport sizevariables and the weather variables are positive, indicating that adverse weather leads to evenlonger delays at busier airports. The effects of most of the control variables are consistent acrossspecifications although, not surprisingly, some decrease in magnitude or even change signsonce we include the airport-date fixed effects or the additional airline or airline-airport fixedeffects.
Our results on the control variables are consistent with previous work on the determinants offlight delays, such as Mayer and Sinai (2003), Mazzeo (2003), Rupp, Owens, and Plumly (2006),Ater (2009), and Rupp (2009). This work has largely focused on two empirical questions: (i) therelationship between hubs and delays, and (ii) the relationship between route-level competitionand delays. In perhaps the most well known empirical piece on delays, Mayer and Sinai find thathub airports have longer delays than nonhub airports and that, at hub airports, the hub carrierhas disproportionately longer delays than nonhub carriers. This latter finding is consistent withour finding of a positive coefficient on the Departs from Hub variable in regressions that includeairport-date fixed effects. Rupp et al. and Rupp also find longer delays for flights to or from hubs,whereas Mazzeo finds that delays for such flights are shorter. With respect to congestion, likeus, Mazzeo and Ater find that delays increase with congestion. Like us, Mazzeo also finds thatdelays increase with the time of day. Finally, with respect to weather, Mazzeo, Rupp et al., andAter include weather controls in their regressions and find, as expected, that delays are longer inworse weather conditions.29
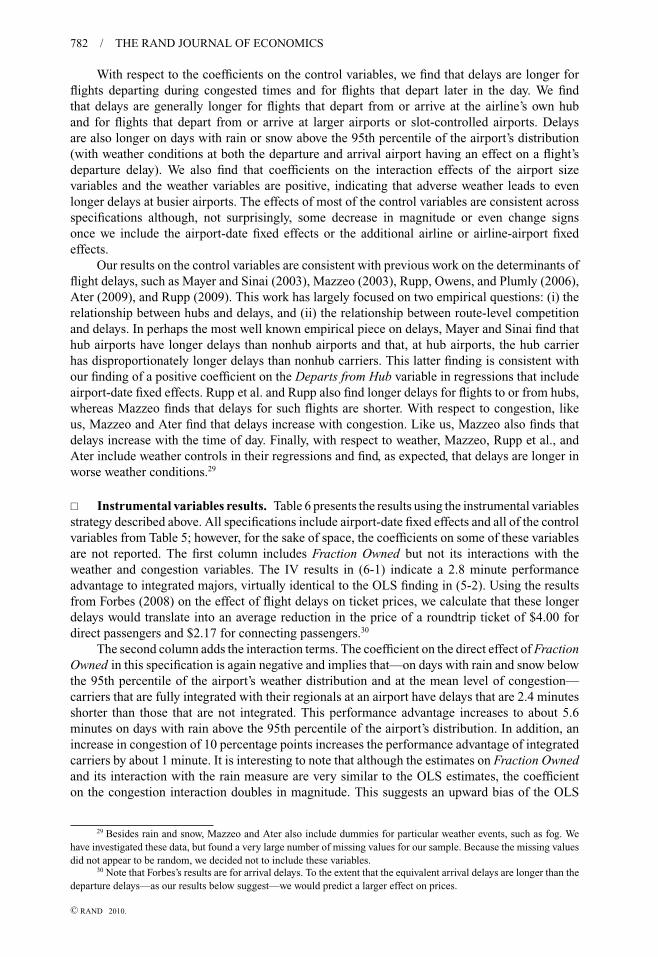
� Instrumental variables results. Table 6 presents the results using the instrumental variablesstrategy described above. All specifications include airport-date fixed effects and all of the controlvariables from Table 5; however, for the sake of space, the coefficients on some of these variablesare not reported. The first column includes Fraction Owned but not its interactions with theweather and congestion variables. The IV results in (6-1) indicate a 2.8 minute performanceadvantage to integrated majors, virtually identical to the OLS finding in (5-2). Using the resultsfrom Forbes (2008) on the effect of flight delays on ticket prices, we calculate that these longerdelays would translate into an average reduction in the price of a roundtrip ticket of $4.00 fordirect passengers and $2.17 for connecting passengers.30
The second column adds the interaction terms. The coefficient on the direct effect of FractionOwned in this specification is again negative and implies that—on days with rain and snow belowthe 95th percentile of the airport’s weather distribution and at the mean level of congestion—carriers that are fully integrated with their regionals at an airport have delays that are 2.4 minutesshorter than those that are not integrated. This performance advantage increases to about 5.6minutes on days with rain above the 95th percentile of the airport’s distribution. In addition, anincrease in congestion of 10 percentage points increases the performance advantage of integratedcarriers by about 1 minute. It is interesting to note that although the estimates on Fraction Ownedand its interaction with the rain measure are very similar to the OLS estimates, the coefficienton the congestion interaction doubles in magnitude. This suggests an upward bias of the OLS
29 Besides rain and snow, Mazzeo and Ater also include dummies for particular weather events, such as fog. Wehave investigated these data, but found a very large number of missing values for our sample. Because the missing valuesdid not appear to be random, we decided not to include these variables.
30 Note that Forbes’s results are for arrival delays. To the extent that the equivalent arrival delays are longer than thedeparture delays—as our results below suggest—we would predict a larger effect on prices.
C© RAND 2010.

FORBES AND LEDERMAN / 783
TABLE 6 Impact of Ownership on Delays: Instrumental Variables Estimates
Departure Delay (min)
(6-1) (6-2) (6-3) (6-4)
Ownership VariablesFraction Owned −2.812∗∗ −2.361∗∗ −2.391∗∗
(0.296) (0.306) (0.309)Fraction Owned ∗ Rain>95th Percentile −3.248∗ −3.202∗ −3.264∗
(1.555) (1.569) (1.454)Fraction Owned ∗ Snow>95th Percentile −0.715 −0.381 −1.655
(2.009) (2.044) (2.018)Fraction Owned ∗ Congestion −10.033∗∗ −10.114∗∗ −9.864∗∗
(0.960) (0.963) (0.986)
Flight-Level ControlsCongestion 2.526∗∗ 8.433∗∗ 8.483∗∗ 8.129∗∗
(0.203) (0.629) (0.630) (0.642)
Airline-Airport ControlsDeparts from Hub 0.724∗∗ 0.592∗ 0.611∗
(0.261) (0.260) (0.260)Regional Flights 0.626∗∗ 0.666∗∗ 0.666∗∗
(0.154) (0.155) (0.155)Arrives at Hub −0.004 0.106 0.155 −0.610∗∗
(0.097) (0.098) (0.098) (0.093)Mean (Rain>95th Percentile) across Major’s 2.616∗∗ 2.163∗
Other Endpoints (0.887) (0.873)Mean (Snow>95th Percentile) across Major’s 3.645∗∗ 3.393∗∗
Other Endpoints (0.580) (0.561)Mean (Rain>95th Percentile) across Regional’s Endpoints −0.119 0.970
(0.837) (0.843)Mean (Snow>95th Percentile) across Regional’s Endpoints −0.577 −0.418
(0.548) (0.524)
Departure airport-date fixed effects X X X XAirline-departure airport fixed effects XObservations 1,904,623 1,904,623 1,902,866 1,902,866
Note: Standard errors are clustered on airport-date. + significant at 10%; ∗significant at 5%; ∗∗significant at 1%. Allspecifications are estimated by two-stage least squares treating Fraction Owned and all of its interactions as endogenous.All specifications include departure time dummy variables. All specifications also include the additional airline-airportcontrol variables that appear in Table 5 as well the arrival-airport control variables that appear in Table 5. The coefficientson these variables are not reported but are available upon request.
estimate, which is consistent with the expectation that vertical integration is (optimally) used togovern more difficult transactions.
In contrast to the OLS results, in the IV specifications, the coefficients on the snowinteractions are never significant and the point estimates are negative though very small inmagnitude. This is again consistent with an upward bias in the OLS. Although it may seemsurprising that we do not estimate an additional performance advantage on snowy days, estimatingthe relationship with snow is difficult for several reasons. First, we have a large number of airportsthat never experience any snow and we have many airports that experience only small amounts ofsnow, so that the 95th percentile of their snow distribution is either zero or a very small number.Second, it may be difficult to detect differences in how well different airlines at an airport dealwith extreme snow conditions because these may simply shut down airports for periods of time.Finally, it may be the case that snow has more of an effect on long delays and/or cancellations.We explore these issues further when we investigate alternate measures of delay and alternateweather measures below.
The remainder of Table 6 explores our IV results further. In column (6-3), we add controlsfor realized weather at other airports in the carrier’s network on the same day. For example, for a
C© RAND 2010.

784 / THE RAND JOURNAL OF ECONOMICS
major’s flight between Boston and Atlanta on a particular day, we calculate the mean of Rain>95thPercentile and Snow>95th Percentile across the other airports that the major serves from Bostonthat day. We do the same thing for the endpoints served by the major’s regional(s) from Bostonthat day. Controlling directly for realized weather at the endpoints that the major’s regionalsserve allows us to address the concern that the historical weather patterns at these airports—which we use as instruments—could be correlated with a source of error in the performanceequation. The results in (6-3) show that the coefficients on the ownership variables are virtuallyunchanged when we add these controls. Furthermore, realized weather at the regional’s endpointshas no effect on the delays experienced on the major’s flights. In contrast, realized weather at themajor’s other endpoints has positive and relatively large effects. Consistent with the discussion inSection 3, this suggests that delays are likely to propagate through the major’s own network butless likely to propagate from the regional’s network to the major’s because the major and regionaldo not share aircraft or crew.
In the final column of the table, we include airline-airport fixed effects. As described above,these additional fixed effects address the concern that there may be some residual correlationbetween our instruments and unobservable airline-airport characteristics. The results are againvery consistent with what we have found earlier. Overall, the results in Table 6 clearly suggest thatuse of an owned—rather than independent—regional at an airport improves a major’s operationalperformance at that airport, and that this performance advantage increases with extreme rain andwith congestion.
� Alternative performance measures. Table 7 investigates the effects of integration on fouralternative measures of operational performance: Cancelled, Arrival Delay, Arrival Delay>30or Cancelled, and Arrival Delay>60 or Cancelled (see Table 3 for definitions). We use theseadditional performance measures for several reasons. First, we want to make sure that our baselineresults are robust to different ways of measuring flight delays. Second, we want to check that theshorter delays that majors using owned regionals experience on average are not coming at thecost of higher cancellation rates or an increase in very long delays. Third, we want to investigatewhether integrated airlines have an advantage in terms of arrival delays, especially long arrivaldelays, which is presumably what consumers care most about.
TABLE 7 Alternate Measure of Operational Performance
Arrival Arrival Delay > 30 Arrival Delay >60Cancelled Delay (min) Minutes or Cancelled Minutes or Cancelled
Dependent Variable (7-1) (7-2) (7-3) (7-4)
Ownership VariablesFraction Owned −0.017∗∗ −5.203∗∗ −0.042∗∗ −0.021∗∗
(0.002) (0.355) (0.003) (0.003)Fraction Owned ∗ Rain> −0.006 −2.676 −0.042∗∗ −0.030∗
95th Percentile (0.008) (1.705) (0.015) (0.013)Fraction Owned ∗ Snow> −0.019+ 1.968 −0.009 −0.030+
95th Percentile (0.012) (2.229) (0.019) (0.017)Fraction Owned ∗ −0.019∗∗ −14.368∗∗ −0.134∗∗ −0.077∗∗
Congestion (0.005) (1.124) (0.011) (0.008)
Departure airport-date X X X Xfixed effects
Observations 1,981,807 1,904,204 1,981,807 1,981,807
Note: Standard errors are clustered on airport-date. + significant at 10%; ∗significant at 5%; ∗∗significant at 1%. Allspecifications are estimated by two-stage least squares treating Fraction Owned and all of its interactions as endogenous.All specifications include departure time dummy variables. All specifications also include the additional airline-airportcontrol variables that appear in Table 5 as well the arrival-airport control variables that appear in Table 5. The coefficientson these variables are not reported but are available upon request. Column (7-2) has fewer observations because the delayvariable is missing for flights that are cancelled.
C© RAND 2010.

FORBES AND LEDERMAN / 785
In all four specifications in Table 7, we find that the direct effect of Fraction Owned isnegative and highly significant and the coefficient estimates imply economically meaningfuleffects. From (7-1), we estimate that, on days without heavy rain or snow and at the mean level ofcongestion, integrated majors experience cancellation rates that are 1.7 percentage points lowerthan those of nonintegrated carriers (the mean cancellation rate in our sample is about 4%).column (7-2) indicates that integrated majors have arrival delays that are about 5 minutes shorterthan nonintegrated ones. columns (7-3) and (7-4) indicate that their likelihood of having a flightcancelled or delayed by more than 30 (60) minutes is 4.2 (2.1) percentage points lower.
The coefficients on the rain interactions are negative throughout the table, but are impreciselyestimated in (7-1) and (7-2). We also find negative coefficients on the snow interactions in allspecifications except (7-2), and they are statistically significant in (7-1) and (7-4). These resultssuggest that the way in which integrated majors can affect their performance on days with extremesnow may be to reduce cancellations and long delays, even though the results in the previoustable and in (7-2) show no statistically significant effects on mean departure and arrival delays.The congestion interactions are negative and highly significant throughout this table, and theireffects are large.
Besides providing a valuable robustness check, specifications (7-3) and (7-4) also allow usto explore whether our results might be driven by majors trying to “hide” delays by shiftingthem to their regionals, most of which are too small to meet government reporting requirements.Although some shifting of delays to regionals is probably optimal (because regionals carry fewerpassengers per departure and/or because they have lower labor costs), if all integration did wasallow majors to shift delays to unobservable margins, it would not reflect a true efficiency. Toinvestigate this, we exploit the fact that the statistic typically reported by the Department ofTransportation and the media is the proportion of a carrier’s flights that are delayed more than 15minutes. Therefore, if integrated majors were better able to shift delays to their regional partners,we expect that they would focus on flights with delays around 15 minutes and try to reduce thesedelays to just less than 15 minutes. We expect they would focus to a much lesser extent on flightswith much longer delays. Our findings in Table 7 that integration also affects long delays andcancellations suggest that the benefits of integration are not merely due to the majors’ efforts tomanipulate on-time statistics.
� Alternative weather measures. Our final table explores alternative ways of measuringadverse weather, especially snowfall. In Table 8, we present one specification that replaces ourprevious weather measures with linear measures Rain and Snow and another one with dummyvariables that equal 1 if the airport experienced any rain or snow on that day.31 Our dependentvariable in this table is Arrival Delay>60 or Cancelled, which is one of the performance measuresthat, in Table 7, revealed a potential performance advantage of integration on days with snow. Wefind again that the negative direct effect of Fraction Owned is very robust. For these specifications,we also find negative effects on all the interactions of Fraction Owned with rain, snow, andcongestion, although the rain effect is insignificant in (8-2). The negative coefficients on the snowinteractions suggest that—at least for some performance metrics—the advantage of integratedregionals may increase on days with snowfall. However, we interpret even these results cautiouslybecause these alternative snow measures still have insignificant effects on most of the otherperformance measures that we have used.
� Back-of-the-envelope calculations. We conclude this section with simple back-of-the-envelope calculations that relate the performance advantage of integration that we find to a roughestimate of the costs of integration. We find that integrated carriers have departure delays thatare on average 2.8 minutes shorter than those of independent carriers and arrival delays that are
31 We have also estimated a robustness check where we redefine Rain>95th Percentile and Snow>95th Percentileto equal zero on days with very small amounts of rain or snow and the results are very similar.
C© RAND 2010.

786 / THE RAND JOURNAL OF ECONOMICS
TABLE 8 Alternate Weather Measures
Arrival Delay > 60 Minutes or Cancelled
(8-1) (8-2)
Ownership VariablesFraction Owned −0.023∗∗ −0.020∗∗
(0.003) (0.003)Fraction Owned ∗ Rain −0.017∗
(0.008)Fraction Owned ∗ Snow −0.008+
(0.005)Fraction Owned ∗ Rain>0 −0.007
(0.006)Fraction Owned ∗ Snow>0 −0.031∗
(0.014)Fraction Owned ∗ Congestion −0.077∗∗ −0.078∗∗
(0.008) (0.008)
Departure airport-date fixed effects X XObservations 1,981,807 1,981,807
Note: Standard errors are clustered on airport-date. + significant at 10%; ∗significant at 5%; ∗∗significant at 1%. Allspecifications are estimated by two-stage least squares treating Fraction Owned and all of its interactions as endogenous.All specifications also include the additional airline-airport control variables that appear in Table 5 as well the arrival-airport control variables that appear in Table 5. The coefficients on these variables are not reported but are available uponrequest.
on average 5.2 minutes shorter. Longer delays impose costs on airlines and reduce demand fortheir flights. Although we do not have an estimate of how delays translate into higher costs, wecan use Forbes’s (2008) results on the relationship between arrival delays and ticket prices, andcombine them with data on direct and connecting passengers on the routes in our sample32 toestimate the demand-side benefit from integration for the average regional in our sample. We findthis benefit to be about $28 million a year. Because Forbes’s results are for passengers travelingto and from LaGuardia Airport in New York City, who may have a higher value of time than theaverage U.S. airline traveler, this number is likely an upper bound. If we instead use the “[value]for aviation passenger travel time” of $0.55 per minute (in 2000 dollars) that the Federal AviationAdministration (1997) recommends based on a survey of travelers nationwide, we find a lowerbenefit of $15 million a year.33
How does this compare to the costs of integration? As Forbes and Lederman (2009) explainin detail, the most important component of these is the higher labor costs that result from verticalintegration. Although we do not have comprehensive data on differences in labor costs acrossregionals, we were able to get aggregate payroll data on five of the regionals in our sample forthe year 2000 from the Bureau of Transportation Statistics. The total annual payroll for theseregionals ranges from $56 million to $326 million, with an average value of $157 million. We canonly speculate on the actual differences in salaries between owned and independent regionals,but given these numbers those differences could certainly be of a similar order of magnitude asthe benefits to integration that we compute.
6. Discussion
� Consistent with our discussion in Section 2, our empirical results indicate that ownership mayallow majors to more efficiently reoptimize their networks when schedule adjustments become
32 These data come from the Department of Transportation’s Databank 1B.33 Morrison and Winston (1989) find that an increase of 1 percentage point in the share of flights delayed more than
15 minutes reduces passengers’ willingness to pay by $0.61, measured in 1983 dollars. Their estimates are not directlycomparable to the delay measures we use here.
C© RAND 2010.

FORBES AND LEDERMAN / 787
necessary and airport or airline resources are scarce. Although it is clear why the contracts usedin this industry could lead to incentive problems between majors and independent regionals, onemight question why either more sophisticated contracts or informal contracts cannot be used tobetter align incentives. We believe that neither formal nor informal contracts are likely to resolvethe incentive problem in this setting. First, consider a contract that compensates the regionalbased on the performance of the major’s entire network. Although this more closely aligns theregional’s incentives with the major, the performance of the major’s overall network depends onthe major’s effort as well as on the regional’s effort and both efforts are likely unobservable tothe other party. As a result, this contract would give rise to moral hazard problems and be unableto achieve the first-best outcome (see Holmstrom, 1982). Furthermore, such a contract wouldexpose the regional carrier to a great deal of risk. Recent changes in the industry—in particular,a greater reliance on the capacity purchase agreements described in Section 2—suggest thatregional carriers should be regarded as risk averse.
Second, consider a contractual arrangement that simply allocates to the major the rights tomake any ex post adjustments to the regional’s schedule. Our understanding is that this is occurs,at least under capacity purchase agreements. However, having the rights to order specific schedulechanges is not equivalent to having the rights to implement those schedule changes.34 At the timethat schedule changes need to be executed, a major cannot simply replace its regional’s labor andexecute these changes itself. Because schedule changes ordered by the major must still be carriedout by the regional, we expect that even with a contractual allocation of decision rights, incentiveproblems will remain.
Finally, consider the role that relational contracts may play. Within its relationship witha particular major, an independent regional may have an incentive to develop a reputation forcooperation if there is value in continuing the relationship with the major. However, cooperatingwith the major may lead to worse performance metrics for the regional. Although the majorit is working for will know whether the poor metrics reflect cooperation or poor performance,other majors that the regional may try to work for will likely not be able to distinguish the two.Cooperation may therefore have the effect of reducing the regional’s ability to attract outsidebusiness which, in turn, will weaken its bargaining position vis-a-vis its current major. Moregenerally, reputations for cooperation in this setting may be difficult to establish because the sameobservable metrics that are consistent with cooperation are also consistent with poor operationalperformance.
Although we attribute the performance differences that we measure to differences in theincentives of owned and independent regionals, one might question whether our results wouldnot also be explained by differences in the skill levels of owned and independent regionals.Given that owned regionals tend to have higher labor costs, could they be employing more skilledemployees—in particular, more skilled pilots? We believe that differences in skills are unlikelyto be responsible for the performance effects that we find. It is hard to imagine how differencesin the skill levels of pilots at owned and independent regionals would lead to differences in theperformance of the majors using those regionals.35 Specifically, even if owned regionals did havemore skilled pilots, this might affect the frequency and/or severity of incidents and accidents atthe regional but this is unlikely to affect departure delays at the major. One might hypothesize thatpilot skill would affect arrival delays at the regional and, in turn, departure delays at the major.However, given that flight speed is determined by the airline (not the pilot) and the precise timingof a flight’s arrival is determined by air traffic control (not the pilot), any possible relationshipwould seem to be quite weak.
34 This is in contrast to the standard Grossman-Hart depiction of control rights, which confer the right to determineprecisely how an asset is used.
35 This is in contrast to willful actions of the pilots that can lead to longer flight delays, as evidenced by Lee andRupp’s (2007) finding that flight delays temporarily increased after airline pay cuts were announced.
C© RAND 2010.

788 / THE RAND JOURNAL OF ECONOMICS
7. Conclusion
� This article has investigated whether at a given airport, on a given day the operationalperformance of majors using owned regionals differs from that of majors using independentregionals. Our results indicate that it does. We find that majors using only owned regionals at anairport experience delays that are about 3 minutes shorter, on average, than the delays experiencedby majors using only independent regionals. This performance advantage increases on days withextreme rain and at congested times of day. We also find that integrated majors experience longdelays and cancellations less frequently. These results are both statistically and economicallysignificant. We find much weaker evidence for an increase in the performance advantage ofintegrated airlines in snowy weather, but the two-staged least squares results on snow are at leastbroadly in line with those on rain and congestion. Overall, our findings are consistent with theview that integration improves a firm’s ability to manage adaptation decisions.
We believe that this article contributes to the existing literature in several ways. First,this article is the first to show that, for similar transactions, the operational performance ofintegrated firms differs from the performance of nonintegrated firms, and to measure the size ofthese performance differences. Second, we do this while attempting to control for the potentialendogeneity of integration decisions both with numerous fixed effects and by instrumenting forthe choice to vertically integrate. Third, our setting allows us to not only estimate performancedifferences but also shed light on their cause. In particular, the fact that airlines’ ownershipdecisions are fixed in the short run whereas the likelihood of adaptation decisions changes ona daily basis provides us with a rich source of identification that is unavailable in many othersettings.
Appendix A
� Construction of instruments. Fraction Owned measures the fraction of an airline’s regional flights departingfrom a given airport that are operated by a regional that is owned. Our instruments for this variable are measures ofthe characteristics of the endpoint airports that are served from that airport by the regional carrier(s). For example, weinstrument for Delta’s value of Fraction Owned at the Boston airport with the characteristics of the endpoint airportsthat Delta’s regionals serve from Boston. Our choice of instruments is motivated by the analysis in Forbes and Lederman(2009).
Specifically, for each flight that a major’s regional operates from a particular airport, we calculate the followingfour characteristics of the arrival airport of that flight:
(i) Hub: A dummy variable that equals one if the airport is a hub to the major.(ii) Precipitation: The average annual precipitation at the airport. This average is taken over 25 years (1971–1995)
of monthly weather data taken from the National Oceanic and Atmospheric Administration (NOAA). Whenprecipitation is frozen (i.e., snow, hail, or freezing rain), this variable measures the water equivalent of theprecipitation. Note that this is different from the depth of snowfall. The density of new snow is typically between5% and 12% of water.
(iii) Snowfall: The average annual snowfall at the airport. This average is taken over 30 years (1971–2000) of annualsnow data and reported by NOAA.
(iv) Number of freezing months: The average number of months per year in which the average daily minimumtemperature at the airport is below 32 degrees Fahrenheit. This average is taken over the 25 years of monthlyweather data from NOAA.
After constructing these four measures for each regional flight from a particular airport, we calculate the average ofthese four variables over all of the flights that a particular major’s regional(s) operates from a given airport during oursample period. For example, we would calculate the average of these four measures over all of the flights that Delta’sregionals operate from Boston in the year 2000. This provides us with four airline-airport-level variables that we use asinstruments for Fraction Owned (which is also an airline-airport-level variable). We call these four variables Fractionof Regional’s Routes Arriving at Hub, Average Annual Precipitation at Endpoints Served by Regional, Average AnnualSnowfall at Endpoints Served by Regional, and Average # of Months with Below Freezing Temperature at Endpoints Servedby Regional. The results of the first-stage regression of Fraction Owned on these variables, as well as the exogenousvariables from the second-stage equation, are presented in Table 3.
In our sample, the correlation between average annual precipitation and daily rain is 0.022. The correlation betweenaverage annual precipitation and daily snow is 0.005. The correlation between average annual snowfall and daily snow is0.004.
C© RAND 2010.

FORBES AND LEDERMAN / 789
Appendix B
� First stage regression
Fraction Owned Regional
Excluded InstrumentsFraction of Regional’s Routes Arriving at Hub 0.391∗∗
(0.005)Average Annual Precipitation at Endpoints Served by Regional 0.007∗∗
(0.000)Average Annual Snowfall at Endpoints Served by Regional 0.014∗∗
(0.000)Average # of Months with Below Freezing Temperature at Endpoints −0.286∗∗
Served by Regional (0.005)Flight-Level Control VariablesCongestion −0.049∗∗
(0.002)Airline ControlsDeparts from Hub 0.214∗∗
(0.013)Regional Flights 0.027∗∗
(0.009)Arrives at Hub −0.115∗∗
(0.002)Departure airport-date fixed effects XObservations 1,904,621F-statistic on excluded instruments 3080.85Prob>F 0.000Total R2 0.5755“Within” R2 0.1324
Note: Standard errors are clustered on airline-airport-date. + significant at 10%; ∗significant at 5%; ∗∗significant at 1%.All specifications include departure time dummy variables. All specifications also include the additional airline controlvariables that appear in Table 5 as well the arrival-airport control variables that appear in Table 4. The coefficients onthese variables are not reported but are available upon request.
References
AMERICAN INSTITUTE OF CERTIFIED PUBLIC ACCOUNTANTS. Proposed AICPA Audit and Accounting Guide, Airlines, 2007.Available at www.aicpa.org/download/exposure/Airline_Guide_ED.pdf (accessed December 17, 2007).
ANDERSON, E. AND SCHMITTLEIN, D. “Integration of the Sales Force: An Empirical Examination.” RAND Journal ofEconomics, Vol. 15 (1984), pp. 385–395.
ATER, I. “Internalizing Congestion at U.S. Hub Airports.” Mimeo, Recanati Graduate School of Business Administration,Tel Aviv University, 2009.
BAJARI, P. AND TADELIS, S. “Incentives versus Transaction Costs: A Theory of Procurement Contracts.” RAND Journal ofEconomics, Vol. 32 (2001), pp. 287–307.
BAKER, G. AND HUBBARD, T. “Contractibility and Asset Ownership: On-Board Computers and Governance in USTrucking.” Quarterly Journal of Economics, Vol. 119 (2004), pp. 1443–1479.
CARLTON, D. “Vertical Integration in Competitive Markets under Uncertainty.” Journal of Industrial Economics, Vol. 27(1979), pp. 189–209.
CILIBERTO, F. “Does Organizational Form Affect Investment Decisions?” Journal of Industrial Economics, Vol. 54 (2006),pp. 63–93.
FEDERAL AVIATION ADMINISTRATION. Treatment of Values of Passenger Time in Air Travel, 1997. Available atapi.hq.faa.gov/economic/742SECT1.pdf (accessed November 15, 2002).
FORBES, S. “The Effect of Air Traffic Delays on Airline Prices.” International Journal of Industrial Organization,Vol. 26 (2008), pp. 1218–1232.
—— AND LEDERMAN, M. “The Role of Regional Airlines in the U.S. Airline Industry.” In D. Lee, ed., Advances in AirlineEconomics, Volume 2: The Economics of Airline Institutions, Operations and Marketing. Amsterdam: Elsevier,2007.
C© RAND 2010.

790 / THE RAND JOURNAL OF ECONOMICS
—— AND —— “Adaptation and Vertical Integration in the Airline Industry.” American Economic Review, Vol. 99 (2009),pp. 1831–1849.
—— AND —— “Contract Form and Technology Adoption in a Network Industry.” Mimeo, Department of Economics,University of California, San Diego and Rotman School of Management, University of Toronto, 2010.
GIBBONS, R. “Four Formal(izable) Theories of the Firm?” Journal of Economic Behavior and Organization, Vol. 58(2005), pp. 200–245.
GIL, R. “Revenue Sharing Distortions and Vertical Integration in the Movie Industry.” Journal of Law, Economics, &Organization, Vol. 25 (2009), pp. 579–610.
GROSSMAN, S. AND HART, O. “The Costs and Benefits of Ownership: A Theory of Vertical and Lateral Ownership.”Journal of Political Economy, Vol. 94 (1986), pp. 691–719.
HART, O. AND MOORE, J. “Property Rights and the Nature of the Firm.” Journal of Political Economy, Vol. 98 (1990),pp. 1119–1158.
HIRSCH, B. “Wage Determination in the U.S. Airline Industry: Union Power under Product Market Constraints.” In D. Lee,ed., Advances in Airline Economics, Volume 2: The Economics of Airline Institutions, Operations and Marketing.Amsterdam: Elsevier, 2007.
HOLMSTROM, B. “Moral Hazard in Teams.” Bell Journal of Economics, Vol. 13 (1982), pp. 324–340.HORTACSU, A. AND SYVERSON, C. “Cementing Relationships: Vertical Integration, Foreclosure, Productivity, and Prices.”
Journal of Political Economy, Vol. 115 (2007), pp. 250–301.HUBBARD, T. “Contractual Form and Market Thickness in Trucking.” RAND Journal of Economics, Vol. 32 (2001),
pp. 369–386.JOSKOW, P. “Vertical Integration and Long-Term Contracts: The Case of Coal-Burning Electric Generation Plants.” Journal
of Law, Economics, & Organization, Vol. 1 (1985), pp. 33–80.LAFONTAINE, F. AND SLADE, M. “Vertical Integration and Firm Boundaries: The Evidence.” Journal of Economic Literature,
Vol. 45 (2007), pp. 629–685.LEE, D. AND RUPP, N. “Retracting a Gift: How Does Employee Effort Respond to Wage Reductions?” Journal of Labor
Economics, Vol. 25 (2007), pp. 725–762.LEVIN, J. AND TADELIS, S. “Contracting for Government Services: Theory and Evidence from U.S. Cities.” Journal of
Industrial Economics, Vol. 58 (2010), pp. 479–718.MASTEN, S. “The Organization of Production: Evidence from the Aerospace Industry.” Journal of Law and Economics,
Vol. 27 (1984), pp. 403–417.——. “Transaction Costs, Mistakes, and Performance: Assessing the Importance of Governance.” Managerial and
Decision Economics, Vol. 14 (1993), pp. 119–129.—— AND CROCKER, K. “Efficient Adaptation in Long-Term Contracts: Take-or-Pay Provisions for Natural Gas.” American
Economic Review, Vol. 75 (1985), pp. 1083–1093.——, MEEHAN, J., JR., AND SNYDER, E. “The Costs of Organization.” Journal of Law, Economics, & Organization,
Vol. 7 (1991), pp. 1–25.MAYER, C. AND SINAI, T. “Network Effects, Congestion Externalities, and Air Traffic Delays: Or Why All Delays Are Not
Evil.” American Economic Review, Vol. 93 (2003), pp. 1194–1215.MAZZEO, M. “Competition and Service Quality in the U.S. Airline Industry.” Review of Industrial Organization, Vol. 22
(2003), pp. 275–296.MONTEVERDE, K. AND TEECE, D. “Supplier Switching Costs and Vertical Integration in the Automobile Industry.” Bell
Journal of Economics, Vol. 13 (1982), pp. 206–212.MORRISON, S. AND WINSTON, C. “Enhancing the Performance of the Deregulated Air Transportation System.” Brookings
Papers on Economic Activity, Microeconomics, Vol. 1989 (1989), pp. 61–123.MULLAINATHAN, S. AND SCHARFSTEIN, D. “Do Firm Boundaries Matter?” American Economic Review Papers and
Proceedings, Vol. 91 (2001), pp. 195–199.NOVAK, S. AND STERN, S. “How Does Outsourcing Affect Performance Dynamics? Evidence from the Automobile
Industry.” Management Science, Vol. 54 (2008), pp. 1963–1979.RUPP, N. “Do Carriers Internalize Congestion Costs? Empirical Evidence on the Internalization Question.” Journal of
Urban Economics, Vol. 65 (2009), pp. 24–37.——, OWENS, D., AND PLUMLY, L. “Does Competition Influence Airline On-Time Performance?” In D. Lee, ed., Advances
in Airline Economics, Volume 1: Competition Policy and Antitrust. Amsterdam: Elsevier, 2006.TADELIS, S. “Complexity, Flexibility, and the Make-or-Buy Decision.” American Economic Review, Vol. 92 (2002),
pp. 433–437.WILLIAMSON, O. Markets and Hierarchies: Analysis and Antitrust Implications. New York: Free Press, 1975.——. The Economic Institutions of Capitalism. New York: Free Press, 1985.
C© RAND 2010.