Does Material Hardship Affect Political Preferences? It...
40
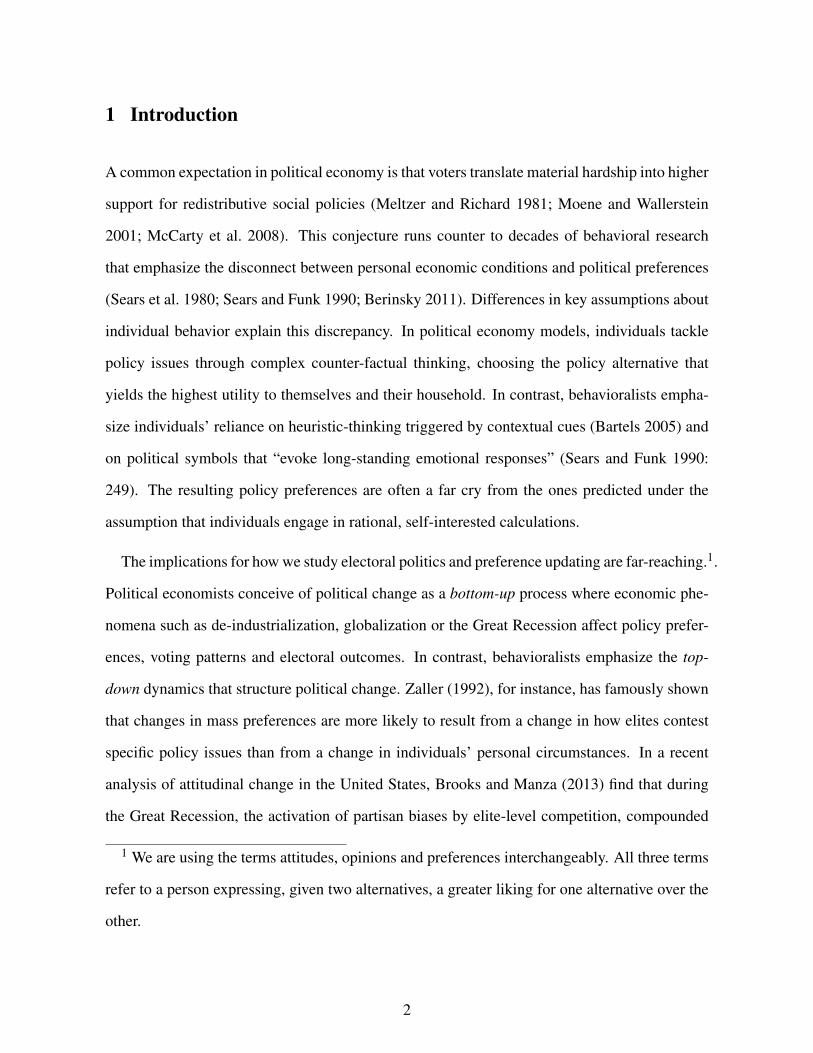
Does Material Hardship Affect Political Preferences? It Depends on the Political Context December 17, 2015 Abstract To what extent does economic self-interest shape policy preferences? We build on Zaller’s “theory of the survey response” to argue that preference updating happens at the intersection of individual push factors, such as material conditions, and con- textual pull factors, such as elite discourse. One key implication is that individuals are more likely to translate personal hardship into higher support for redistributive social policies when political elites actively compete over these issues. We test this argument using British panel data and find evidence that the discursive context mediates the relationship between economic hardship and preferences. Using data from 24 European countries, we then show that income is a better predictor of sup- port for redistribution in countries where parties actively compete over economic and redistributive issues. One consequence of European left-wing parties’ shift to the center on economic issues could be to mollify the effect of economic hardship on policy preferences. Word count: 9,762 1
Transcript of Does Material Hardship Affect Political Preferences? It...

Does Material Hardship Affect PoliticalPreferences? It Depends on the Political Context
December 17, 2015
Abstract
To what extent does economic self-interest shape policy preferences? We build onZaller’s “theory of the survey response” to argue that preference updating happensat the intersection of individual push factors, such as material conditions, and con-textual pull factors, such as elite discourse. One key implication is that individualsare more likely to translate personal hardship into higher support for redistributivesocial policies when political elites actively compete over these issues. We testthis argument using British panel data and find evidence that the discursive contextmediates the relationship between economic hardship and preferences. Using datafrom 24 European countries, we then show that income is a better predictor of sup-port for redistribution in countries where parties actively compete over economicand redistributive issues. One consequence of European left-wing parties’ shift tothe center on economic issues could be to mollify the effect of economic hardshipon policy preferences.
Word count: 9,762
1
1 Introduction
A common expectation in political economy is that voters translate material hardship into higher
support for redistributive social policies (Meltzer and Richard 1981; Moene and Wallerstein
2001; McCarty et al. 2008). This conjecture runs counter to decades of behavioral research
that emphasize the disconnect between personal economic conditions and political preferences
(Sears et al. 1980; Sears and Funk 1990; Berinsky 2011). Differences in key assumptions about
individual behavior explain this discrepancy. In political economy models, individuals tackle
policy issues through complex counter-factual thinking, choosing the policy alternative that
yields the highest utility to themselves and their household. In contrast, behavioralists empha-
size individuals’ reliance on heuristic-thinking triggered by contextual cues (Bartels 2005) and
on political symbols that “evoke long-standing emotional responses” (Sears and Funk 1990:
249). The resulting policy preferences are often a far cry from the ones predicted under the
assumption that individuals engage in rational, self-interested calculations.
The implications for how we study electoral politics and preference updating are far-reaching.1.
Political economists conceive of political change as a bottom-up process where economic phe-
nomena such as de-industrialization, globalization or the Great Recession affect policy prefer-
ences, voting patterns and electoral outcomes. In contrast, behavioralists emphasize the top-
down dynamics that structure political change. Zaller (1992), for instance, has famously shown
that changes in mass preferences are more likely to result from a change in how elites contest
specific policy issues than from a change in individuals’ personal circumstances. In a recent
analysis of attitudinal change in the United States, Brooks and Manza (2013) find that during
the Great Recession, the activation of partisan biases by elite-level competition, compounded
1 We are using the terms attitudes, opinions and preferences interchangeably. All three terms
refer to a person expressing, given two alternatives, a greater liking for one alternative over the
other.
2
by emotional responses to the symbolic threat of “big government,” has generated attitudinal
trends that have little to do with individual economic factors (see also Bartels 2005).
In this paper, we argue that the disconnect between policy preferences and individuals eco-
nomic circumstances should be thought of as a continuum: individual and contextual factors
increase or decrease the likelihood that individuals’ material circumstances affect policy pref-
erences. To identify these factors, we build on Zaller’s model of preference updating. Our
proposed addendum provides a bridge between materialist and behavioralist accounts of attitu-
dinal change.
In line with previous findings by students of public opinion, we argue that the discursive con-
text, as shaped by political elites competing for elected office, is an important contextual factor.
Indeed, attitudinal change is more likely “when partisan elites debate an issue and the news
media cover it” (Dancey and Goren 2010: 686). In addition, citizen’s reasoning is facilitated
when elites’ competing efforts to frame an issue produce alternative policy options (Sniderman
and Theriault 2004). Individual characteristics, such as partisanship and ideological predispo-
sitions, mediate citizens’ response to a change in how elites compete over a given issue. In line
with assumptions in political economy, we hypothesize that individual economic conditions are
also an important factor: given that left-wing economic policies are on the table as a visible
policy option put forward by parties and interest groups, individuals experiencing hardship will
be more likely, relative to individuals experiencing no hardship, to incorporate these policy op-
tions into their own policy preferences. To put it differently, while material interest nudges
individuals to switch (or stick) to preferences more in line with their economic conditions, the
size of this nudging effect will vary with the political discursive context. It will be larger when
economic and redistributive issues are salient and when the major political actors express strong
disagreement over them.
Our first test of this push-and-pull model of preference updating examines within-individual
attitudinal change using high-quality British panel data starting in 1991 and ending in 2007. We
3

find that a negative shock to one’s income expectations has a strong impact on the likelihood
of being economically left-wing, right-wing or neither. However, in a context where elites
are shifting away from pro-redistribution left-wing rhetoric, the effect of a negative income
shock is mainly one of resistance to a general shift away from left-wing economic preferences.
This effect is strongest in 1997, the year the Labour Party, re-branded by Tony Blair as the
economically centrist New Labour Party, wins the general election.
As an additional test of our argument, we investigate the relationship between material hard-
ship and economic preferences in 24 European countries. Using six waves of cross-sectional
survey data collected between 2002 and 2012, we show that income is a better predictor of
support for redistribution in country/years where parties actively compete over economic and
redistributive issues.
Our findings contribute to a burgeoning line of research that argues that the nature and struc-
ture of the options available in one’s political environment impact citizens’ political behavior
(Sniderman and Levendusky 2007; Hopkins 2010; Lupu 2013). Our findings also help un-
derstand how the Great Recession is affecting economic policy preferences differently across
varying political contexts. Only in countries where electoral rules and labor market institutions
favor radical-left parties (Iversen and Soskice 2006; Martin and Thelen 2007) can we expect an
increase in hardship to translate into an increase in support for redistributive social policies, es-
pecially among the worse-off. More generally, in a context where left-wing parties’ have moved
to the center on economic issues, the result could be to mollify the effect of economic hardship
on policy preferences.
2 A Behavioralist Take on Political Economy’s Workhorse Assumption
We rely on behavioral models of attitudinal change to predict the conditions under which in-
dividuals are more or less likely to align their policy preferences with their economic circum-
4
stances. To do so, we modify a famous behavioral model proposed by Zaller (1992) to include
material interest as a motive that shapes preference updating.
2.1 The Receive, Accept and Sample Model of Political Preferences
According to Zaller (1992), “most citizens do not possess preformed attitudes at the level of
specificity demanded in surveys. Rather, they carry around in their heads “a mix of only partially
consistent ideas and considerations.”2 An individual expresses an opinion by reaching into her
own “bucket” of existing considerations about an issue. Which consideration will end up being
sampled is first a function of the heterogeneity of positions available in one’s “bucket.” The
more homogeneous an individual’s set of considerations is, the more predictable her answer
will be. Expressed attitudes are also a function of the types of considerations that are at the top
of the “bucket”, meaning those that are cognitively easier to retrieve.3
Following Zaller, we conceive preference updating as a change in one’s “bucket” of consid-
erations, meaning that new considerations get added and old ones become increasingly harder
to retrieve. How does this change occur? Take issue area Z (e.g. income redistribution) and
2 Strauss (2012), an anthropologist, has reached a somewhat similar conclusion through ex-
tensive interviews and focused groups, pointing to individuals’ tendency to take on publicly
available and shared common discourses about a policy area and using it to justifying their
own position on specific policy issues. In other words, attitudes do not exist outside of pub-
licly shared pool of considerations. This pool varies over time and across social groups and
countries, resulting in turn in variations in expressed opinions.
3 Recall and framing effects play an important role in explaining which consideration will
“come on top.” In addition, framing effects will vary across individuals. They are likely to be
substantial if respondents have an eclectic mix of considerations to sample from (Hill and Kriesi
2001).
5

two claims made about Z, claim ZPR (pro-redistribution) and claim ZAR (anti-redistribution).
To model changes in expressed attitudes, Zaller provides a two-step model of exposure to new
claims, followed by acceptance or resistance to these claims. A change in exposure comes ei-
ther as an increase in the preponderance of ZPR relative to ZAR or vice versa. Without a change
in exposure, attitudinal change is unlikely to be observed.
These changes in exposure have heterogeneous effects across individuals. According to Za-
ller, “(p)eople tend to resist arguments that are inconsistent with their political predispositions.”
Predispositions can be thought of as two kinds of selection mechanisms that shape acceptance
of or resistance to new considerations. One mechanism is the homogeneity of the existing
“bucket” of considerations: the more homogenous it is, the less likely the acceptance of a con-
sideration that runs counter to it. We call this type of predisposition the attitudinal prior. The
second mechanism are the cognitive short-cuts that increase or decrease the probability that a
given consideration will be accepted (or rejected) based on the cues associated with it. The
partisan heuristic, well documented by students of American politics, is one example (Bartels
2005): individuals are more likely to accept claims that they associate with the political party
they identify with. We call this family of predispositions heuristic thinking.4
Elite-level political competition will influence preference updating through two channels: by
impacting the types of considerations available in one’s discursive context (Dancey and Goren
2010) and by activating or undermining politically relevant heuristics (Huckfeldt et al. 2005).
In talking about elites here, we have in mind not only the major parties and their representatives
but also the organizations and media outlets that amplify and repeat the main parties’ messages.
4 Preferences expressed in line with a given heuristic might appear sub-optimal from a
material-self interest perspective. However, they are optimal with regards to the objective –
which can be very low stakes such as answering a survey question – and the constraints (time
or incomplete information) individuals face.
6

We cannot, in this paper, investigate the distortive role played by these discursive relays and do
not consider it in the current analysis. In the analysis, we focus on party platforms and factual
claims available in mainstream newspapers as a proxy for this discursive context.
From this schematic model of attitudinal change, we can draw three general predictions that
run counter to most expectations in political economy. First of all, elites are important as first
movers: partisan elites’ decisions to visibly contest an issue will precede aggregate attitudi-
nal change as measured using survey data (Page and Shapiro 1992; Duch and Stevenson 2011;
Evans and Tilley 2012). Absent dramatic changes in one’s discursive environment, an individ-
ual’s “bucket” of considerations will be mainly stable over the life time.5 Finally, attitudinal
change from one extreme (i.e. homogeneous “bucket” of considerations of type ZPR) to the
other (homogeneous “bucket” of considerations of type ZAR) is very unlikely (Jennings and
Markus 1984).
We now turn to our main addendum to Zaller’s theory: the role of material interest in shaping
how individuals react to changes in elite-level discourse.
2.2 Introducing Material Interest
Zaller’s model conceives of preference updating as the interaction between 1) contextual changes
in one’s discursive context, and 2) the selective effects of attitudinal priors and heuristic think-
ing. We argue that material interest is a key motive in explaining which new consideration
gets accepted, which gets resisted and, in each case, by whom. In other words, individuals
exposed to new considerations will reject or accept them in line with their current economic
circumstances.
5 Individuals with less coherent bundles of considerations will appear unstable over time,
especially if only one measurement item is used (Ansolabehere et al. 2008).
7

In a context where left-wing considerations on economic issues are added to the discursive
environment (increase in the ZPR/ZAR ratio), we expect low income individuals and individuals
experiencing hardship to be more likely to “accept” these new considerations. Another alter-
native is the addition of right-wing policy considerations (decrease in the ZPR/ZAR ratio). We
expect low income individuals to be more likely to “resist” these new considerations.6
This interaction between an individual’s experience and the discursive context has already
been described by Hopkins (2010) in the case of anti-immigration attitudes: only when immi-
gration is being debated at the national level, does a change in the ethnic composition of one’s
neighborhood affect preferences. Similarly, we expect an individual’s economic conditions to
shape preferences mainly in times when partisan elites are visibly contesting the issue and the
media cover this debate. Parties and candidates who actively compete over an issue affect not
only the salience of this issue but also how it is debated. They “reduce the number of alter-
natives open to choice to only a few” and “portray those alternatives as competing courses of
action” (Sniderman and Bullock 2004: 346). In other words, it becomes easier to identify ZPR
and ZAR considerations as exclusive alternatives. Sniderman and Theriault (2004) show that in
such a context, reasoning around basic principles – and we argue self-interested reasoning – is
greatly improved, especially among the least politically sophisticated.
The discursive context might also change as a result of a decrease in either ZPR or ZAR. In
the case, for instance, of a decline in ZPR relative to ZAR, ZPR considerations become harder to
sample from one’s “bucket” of considerations. Such decline is often the result of elites pushing
issue area Z to the periphery of electoral competition, making it harder to distinguish ZAR from
6 In both cases, the effect will be the strongest for those with more heterogeneous consider-
ations, i.e. less constraining priors. This can be more simply described as a ceiling effect: one
cannot express more support or opposition, if one is already committed or opposed to a policy
(Margalit 2013).
8

Table 1: Overview predictions about attitudinal change
Macro Prediction:Timing of change
Aggregate attitudinal change follows changes in economic policy discourseat the elite-level. As a result, attitudes are more likely to change aroundmajor upswing in the discursive context.
Macro Prediction:Direction of change
An increase/decrease in left-wing economic preferences will more likely oc-cur if the relative share of left-wing economic considerations at the elite levelincreases/decreases.
Micro Prediction:Resistance effect
Individuals experiencing hardship will be more likely to resist taking onright-wing economic considerations. In a context of an aggregate shift tothe right, they will be less likely to follow the general shift.
Micro Prediction:Acceptance effect
Individuals experiencing hardship will be more likely to accept left-wingeconomic considerations. In a context of an aggregate shift to the left, theywill be more likely to lead the general shift.
ZPR considerations. However, in line with our push-and-pull model of attitude updating, which
emphasizes both individual and contextual factors, we expect individuals who are experiencing
increased hardship to be comparatively more likely to sample the ”correct” consideration when
expressing economic policy preferences. In other words, self-interest will partly counter the
consequences of contextual primes that are less favorable to ZPR. Table 1 summarizes these
expectations.
Central to our argument is the claim that changes in the discursive context are key to explain-
ing the nature and timing of a change in an individual’s economic policy preferences. In other
words, we assume elite-discourse to be exogenous to the behavior of the individuals whose
preferences we track over time. This is a reasonable assumption when studying individual-level
attitudinal change using panel data. It is less reasonable to assume exogeneity if the estimate of
interest is measured at the group-level (e.g. average preferences such as macro policy mood),
something we come back to in the second part of the analysis.
9

3 Individual-level Dynamics of Attitudinal Change in Great Britain
To test these hypotheses, we need to identify cases that exhibit variations in how elites compete
over economic issues. We also need to locate longitudinal data with the relevant items measured
both before and after the change in the discursive context. We could only identify one country
where the period covered by individual-level panel data is also a period of important changes
in how elites compete over economic issues for control of the government. This country, Great
Britain, has experienced a decline in the salience of redistributive issues and more specifically a
sharp decline in the preponderance of left-wing pro-redistribution statements in elite discourse.
The existence of a high quality panel data for this country allows us to parse out the relationship
between contextual and individual factors.
The transformation of electoral competition in Great Britain is well documented and has at-
tracted much attention from policy commentators and pundits. Figure 1 plots the share of sen-
tences in the Labour and the Conservative parties’ electoral manifestos that allude to left-wing
and right-wing economic and social policies (see Appendix 1.1 for details on the measures). In
the early 1980s, close to a third of the two parties’ manifestos was dedicated to socio-economic
issues. From the mid-1980s onwards, both parties start moderating their positions, especially
the Labour party, which over time has dropped traditional left-wing economic policies as an
explicit policy option. Great Britain can be described as a case of “party convergence by omis-
sion”, driven mainly by the Labour Party abandoning traditional left-wing rhetoric on economic
issues.7 As a result, pro-redistribution considerations have become less prevalent in the discur-
sive context, decreasing the salience of Z and the ZPR/ZAR ratio.
7 Figure 1 in Appendix 1.1 further plots the relative salience of selected policy issue areas
with both parties’ manifestos considered jointly. The figure confirms that moral and cultural
issues and issues related to political authority replaced economic and social policies as the
central political issues.
10
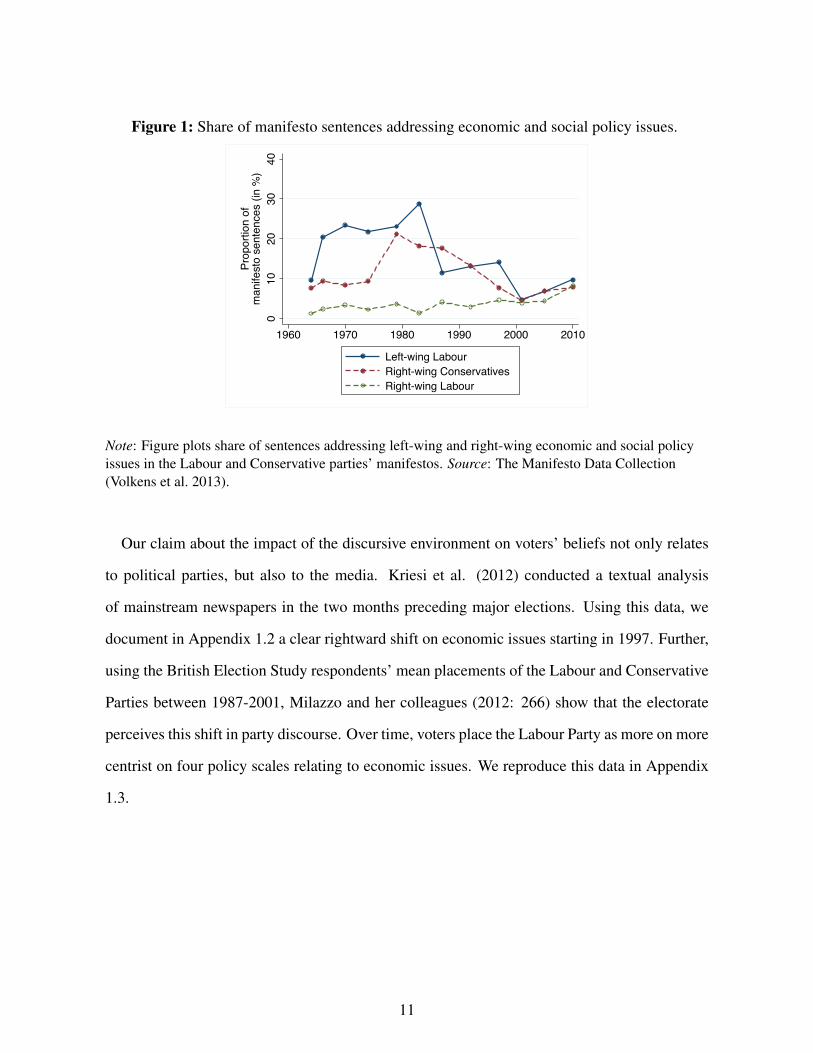
Figure 1: Share of manifesto sentences addressing economic and social policy issues.
010
2030
40
Prop
ortio
n of
man
ifest
o se
nten
ces
(in %
)
1960 1970 1980 1990 2000 2010
Left-wing LabourRight-wing ConservativesRight-wing Labour
Note: Figure plots share of sentences addressing left-wing and right-wing economic and social policyissues in the Labour and Conservative parties’ manifestos. Source: The Manifesto Data Collection(Volkens et al. 2013).
Our claim about the impact of the discursive environment on voters’ beliefs not only relates
to political parties, but also to the media. Kriesi et al. (2012) conducted a textual analysis
of mainstream newspapers in the two months preceding major elections. Using this data, we
document in Appendix 1.2 a clear rightward shift on economic issues starting in 1997. Further,
using the British Election Study respondents’ mean placements of the Labour and Conservative
Parties between 1987-2001, Milazzo and her colleagues (2012: 266) show that the electorate
perceives this shift in party discourse. Over time, voters place the Labour Party as more on more
centrist on four policy scales relating to economic issues. We reproduce this data in Appendix
1.3.
11

3.1 Predictions
We have documented how the British political system has experienced a convergence of the
main political parties on economic issues, decreasing the overall salience of left-wing economic
rhetoric. The model presented in section 2 allows us to examine how changes in elite-level
discourse shape, constrain, and enable changes in individual economic preferences.
Overall, the discursive context in Great Britain is not conducive to an increase in left-wing
economic preferences. As the share of economic policy considerations associated with “old”
Labour policies declines, it becomes cognitively more costly to maintain strong left-wing pref-
erences. However, absent any increase in right-wing policy statements, we do not expect an
increase in the share of individuals expressing right-wing economic preferences. In addition,
we have argued that attitudes are more likely to change around major upswing in the discursive
context. 1997 constitutes such a crucial year in British politics, with the landslide victory of
New Labour in the Parliamentary election.
Prediction 1: Individuals’ economic policy preferences exhibit a conservative shift starting in
1997. This shift is due to a decline in left-wing economic policy preferences, not an increase in
right-wing policy preferences.
In line with the interactions between individual and contextual variables hypothesized in
section 2, we expect material interest to be a good predictor of whom will be more likely to
resist abandoning left-wing preferences.
Prediction 2: Individuals who have experienced a negative economic shock are more likely to
resist the shift away from left-wing economic policy preferences.
12

3.2 Empirical Strategy
The British Household Panel Survey (BHPS) is an annual survey that provides high quality
socio-economic data at the individual and household level. Our sample consists of a nationally
representative sample of about 5,500 households recruited in 1991.8 We restrict our sample
to the working age population9 living in England due to the different party systems in Wales,
Scotland, and Northern Ireland. We further select individuals with valid responses on our mea-
surement items for at least three time periods, yielding a total of 5,745 observations.10
Measurement of economic policy preferences. The BHPS includes a number of attitudinal
questions. Six of these items tap into support or opposition to traditional left-wing economic
and social policy preferences. They were measured on seven occasions between 1991 and 2007.
We have re-coded them such that higher values indicate a more right-wing answer. Respondents
were asked whether they agreed or disagreed with the following statements:
8 For more information about the BHPS, visit https://www.iser.essex.ac.uk/bhps.
The data can be downloaded at https://discover.ukdataservice.ac.uk/series/?sn=
200005.
9 As the focus of our research is on changes in individuals’ material circumstances, we deleted
pensioners and respondents in full-time education from the analysis. Hence only those actively
in the labor market are included in the analysis.
10 We restrict the estimation to respondents with at least three valid responses, as this provides
at least two changes in economic policy preferences per respondent. This is needed to identify
the effect correctly, as otherwise the estimation is based on one change only, which could have
been randomly positive, negative or non-significant. Only with at least two of those changes
is it possible to identify the effect of material interest on economic preferences. For more
information, see also Neundorf et al. (2011).
13
• Ordinary people share nation’s wealth
• There is one law for rich one for poor
• Private enterprise solves economic problems
• Public services ought to be state owned
• Government has an obligation to provide jobs
• Strong trade unions protect employees
Ansolabehere et al. (2008: 215) argue that using “a large number of survey items on the
same broadly defined issue area – for example, government involvement in the economy (...)
eliminates a large amount of measurement error,” revealing true issue preferences. We perform
an exploratory factor analysis on some waves of the survey followed by a confirmatory factor
analysis on other waves and find strong evidence that all items load on the same unique la-
tent preference dimension. Consequently, we use these six items to estimate a unique latent
construct that we call economic preferences.
We estimate a latent class model for each time point for each respondent.11 Our preferred
model assumes three latent classes of respondents. One class is constituted of individuals who
answer the 6 survey items in a consistently left-wing fashion. The second one is constituted
of individuals who answer in a consistently right-wing fashion. Finally, a third category is
constituted of individuals who do not appear to be committed to one policy position against the
11 The latent class approach is similar to factor analysis but makes a different assumption
about the nature of the latent variable, assuming it to be categorical. The latent class structure
of the model defines a segmentation into N classes based on answers at each measurement
occasion. It estimates the probability that an individual provides a specific combination of
answers to the 6 questions at time t, given membership probability in each of the N classes.
This assumes local independence, namely that given membership in a class, answers to the 6
questions can be considered independent.
14

other. We describe this class of individuals as non-ideological centrists.12
While Ansolabehere et al. (2008) recommend to treat latent preferences on this issue area as
continuous, we choose a categorical approach for theoretical and empirical reasons. Theoret-
ically, a categorical approach – separating ideologues (left/right) from others – better matches
Zaller’s distinction between homogeneous and heterogeneous “buckets” of considerations. Em-
pirically, the assumption that latent economic policy preferences are continuous means assum-
ing that individuals with heterogeneous beliefs can still be ordered from left-wing leaning to
right-wing leaning and that the 6 items listed above are informative enough to do so. Our cate-
gorical approach avoids imposing too much structure on these individuals’ beliefs. There is an
additional benefit to using a latent class model. We can assign a score to each individual that
estimates an individual’s probability of being a member of a specific class, thus accounting for
some of the uncertainty inherent in preference measurement.
Table 2 on page 19 shows that, on average over the period, left-wing respondents represent
20 percent of the sample, right-wing respondents 23 percent and the non-ideologue centrists,
57 percent. Thus, a total of 43 percent of the population can be classified as having a consistent
response pattern on economic policy survey items.
12 Appendix 2.1.1 presents the optimum number of latent classes that provides the best fit
to our data. Here we compare the model fit between models with 1 up to 5 classes. Model fit
greatly improves if we hypothesize the existence of 3 different classes. The estimates from the
Latent Class measurement model are shown in Appendix 2.1.2. In Appendix 2.1.3, we show
how each individual, classified by the model as either right-wing, left-wing or non-ideological
score on an additive index, a traditional way to use Likert-items. The latent class model distin-
guishes very well between three types of respondents. The distribution of the additive scores
for individuals classified as left-wing barely overlaps with the distribution of additive scores for
individuals classified as right-wing.
15
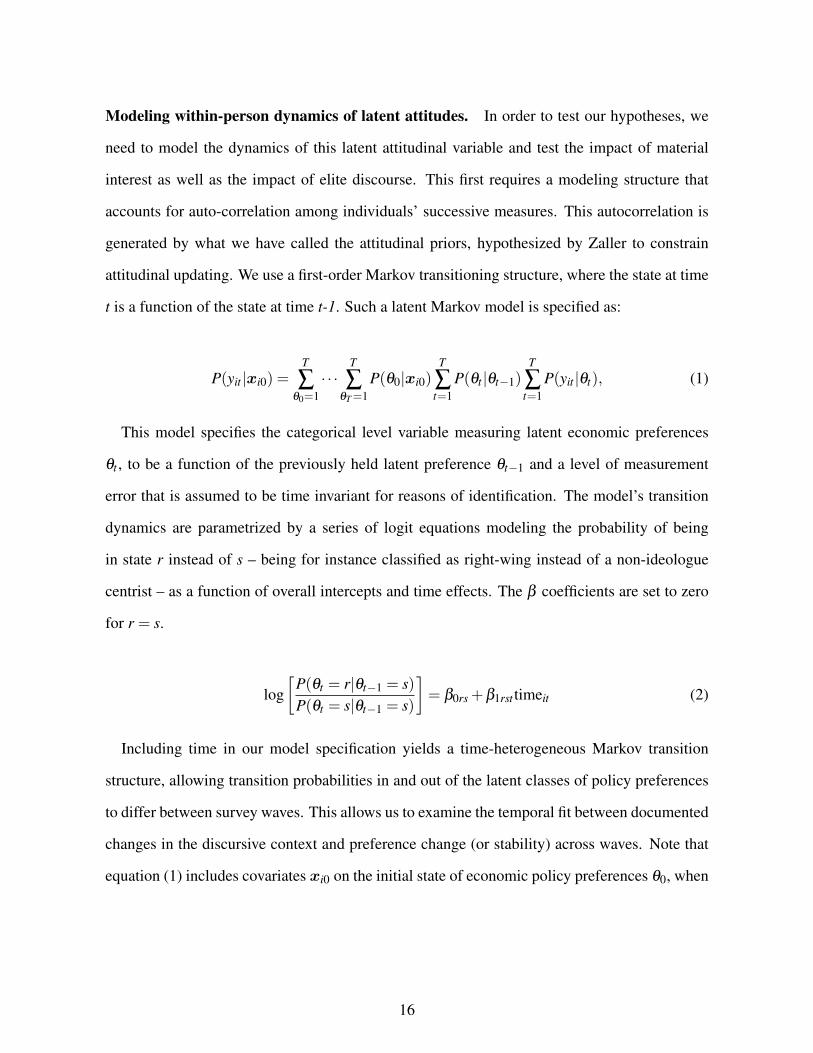
Modeling within-person dynamics of latent attitudes. In order to test our hypotheses, we
need to model the dynamics of this latent attitudinal variable and test the impact of material
interest as well as the impact of elite discourse. This first requires a modeling structure that
accounts for auto-correlation among individuals’ successive measures. This autocorrelation is
generated by what we have called the attitudinal priors, hypothesized by Zaller to constrain
attitudinal updating. We use a first-order Markov transitioning structure, where the state at time
t is a function of the state at time t-1. Such a latent Markov model is specified as:
P(yit |xi0) =T
∑θ0=1· · ·
T
∑θT=1
P(θ0|xi0)T
∑t=1
P(θt |θt−1)T
∑t=1
P(yit |θt), (1)
This model specifies the categorical level variable measuring latent economic preferences
θt , to be a function of the previously held latent preference θt−1 and a level of measurement
error that is assumed to be time invariant for reasons of identification. The model’s transition
dynamics are parametrized by a series of logit equations modeling the probability of being
in state r instead of s – being for instance classified as right-wing instead of a non-ideologue
centrist – as a function of overall intercepts and time effects. The β coefficients are set to zero
for r = s.
log[
P(θt = r|θt−1 = s)P(θt = s|θt−1 = s)
]= β0rs +β1rst timeit (2)
Including time in our model specification yields a time-heterogeneous Markov transition
structure, allowing transition probabilities in and out of the latent classes of policy preferences
to differ between survey waves. This allows us to examine the temporal fit between documented
changes in the discursive context and preference change (or stability) across waves. Note that
equation (1) includes covariates xi0 on the initial state of economic policy preferences θ0, when
16

respondents first entered the panel.13 The coefficients are reported in Appendix 3.2.
Material conditions. Once we have determined the dynamics of individuals’ latent “bucket”
of considerations on economic issues, we can introduce covariates wit that measure changes in
a respondent’s material conditions. We introduce these variables as predictors on the transition
probability of preference updating by extending equation (2) as follow:
log[
P(θt = r|θt−1 = s)P(θt = s|θt−1 = s)
]= β0rs +β1rst timeit +βrswit (3)
We measure change in economic circumstances in two ways. First, we compute categorical
variables that capture two types of “objective” hardship, i.e. a substantial change in income (in-
crease or drop of at least 25 percent of previous income, as used by Margalit 2013) and a change
in employment status (loosing or finding a job).14 Second, we rely on reported job security and
evaluation of one’s financial situation to compute variables that capture a change in “subjective”
well-being. We rely on these subjective measures to compensate for the limitation of objective
13 The variables included in the model, when respondents entered the panel (xi0) are as
follows: Age (15-65 years old), gender (51.7 % female), social class (32% service; 20% inter-
mediate; 10% self-employed; 15% lower sales service; 8% technicians; 15% manual workers),
housing (57% Mortgage; 15% Social; 8% Rented; 20% Owner), education (30% Primary or
still in school; 36% low secondary-vocational; 9% high secondary-vocational; 16% higher vo-
cational; 9% tertiary degree), and logged income.
14 Note that changes between two time-points were calculated based on the years that in-
cluded the economic preference items. This measurement ignores any changes that might have
happened in-between survey-years that are excluded here. This is however not a problem, as
we also look at the changes in latent economic preferences at the two consecutive waves that
included these items. The items were included in 1991, 1993, 1995, 1997, 2000, 2004, 2007.
17

CHANGE in material condi3ons between t-‐1 and t
A9tudes 3me t
Y1t Y2t Y6t
E3t E2t
E1t
…
A9tudes 3me t-‐1
Y1t-‐1 Y2t-‐1 Y6t-‐1
E3t-‐1
E2t-‐1 E1t
-‐1
A9tudes 3me t+1
Y1t+1 Y2t+1 Y6t+1
E3t+1
E2t+1 E1t
+1
… …
Discursive Poli3cal
Context in t
CHANGE in material condi3ons between t and t+1
Discursive Poli3cal
Context in t+1
Figure 2: Dynamic measurement model and economic hardship
measures. Indeed, these measures assume that the same objective income shock is experienced
as hardship by all respondents. However, individuals vary in whether this shock was expected
(and maybe budgeted for) or not. In addition, subjective measures can help account for unob-
served factor (e.g. private wealth) that will shape whether an individual experiences an income
shock as hardship or not. Appendix 3.1 describes how these variables were computed. Figure
2 illustrates the model graphically. The impact of the varying discursive context is captured in
Model 3 by the conditional time effects.
3.3 Results
The dynamics of economic preferences. Leveraging the panel structure of this data, we first
examine how transition rates across latent classes differ. Table 2 shows that less than 1 percent
of respondents, on average switch from left-wing to right-wing economic preferences, or vice
versa. This confirms the overall expectation that a switch across extremes is very rare. When the
sample is taken as a whole, individual attitudes appear very stable. However, if we only consider
left-wing ideologues, the picture changes. This group’s average probability of transitioning out
18

Table 2: Estimated mean transition probabilities
Econ pref[t-1]Econ pref[t] Right-wing Left-wing Centrist
Proportion 0.23 0.20 0.57
Right-wing 0.99 0.00 0.02Left-wing 0.00 0.87 0.03Centrist 0.01 0.12 0.94
(toward the “non-ideologue centrist” class) is 12 percent. This transition rate is averaged over
the 6 transition periods available in the data. This means that by 2007, the share of left-wing
ideologues in the sample has declined by nearly 50 percent compared to 1991 (from 23 to 14
percent).
More importantly, and in line with Prediction 1 there is no evidence of an increase in the
share of individuals in the panel classified as right-wing ideologues (see Appendix 3.3). To test
the claim that most of these transitions away from left-wing patterns of answers are occurring
around 1997, we allow the transition estimates to vary by year (model 2 on page 16). Figure 3
plots the dynamics of attitudinal change as a form of dealignment with individuals moving away
from ideologue latent classes (left or right-wing) to the non-ideologue centrist latent class. Be-
hind an average transition rate of 12 percent, there is a peak in 1997 with transition probabilities
reaching 30 percent and stabilizing around 15 percent the following years.
Overall, the BHPS provides support for the claim that the timing and nature of the change
in elite-level competition, and its impact on the discursive context, shape aggregate attitudinal
trends. In line with Prediction 1, the bulk of the shift occurs in 1997, which mirrors changes
in the elite discursive context. If attitudinal change, as captured in survey data, directly shapes
what elites compete over, then this timing is surprising: we would expect most of the attitudinal
change to precede Tony Blair’s election. Because our panel starts in 1991, we only have two
time periods to assess how key the year 1997 is. We briefly turn to the British Social Attitudes
19

Figure 3: Predicted probabilities of economic preference dealignment over time (incl. 95%C.I.)
010
2030
40Id
eolo
gy d
ealig
nem
nt (O
ther
/cen
trist
in t;
in %
)
1993 1995 1997 2000 2004 2007Survey year
Liberal in t-1 Conservative in t-1 Left-wing in t-1 Right-wing in t-1
Note: The results are based on the estimation of Model 2 on page 16. Source : BHPS, 1991-2007.
Survey (BSA), which provide survey items similar in spirit to the ones provided in the BHPS.
The BSA started in the mid-1980s and adds more time-points to the pre-1997 period. In line
with our argument, there is no evidence in this data that the rightward shift preceded the year
1997. Details of this analysis are provided in Appendix 2.2.
Material conditions and changes in economic preferences: We now examine how individ-
ual material conditions shape economic policy preferences in line with the resist/accept mech-
anism presented in section 2. According to Prediction 2. We expect individuals experiencing
hardship to be more likely to resist transitioning away from the left-wing ideologue latent class.
To account for all the possible combinations of latent class membership in time t − 1 and of
latent class membership at time t, we used effects coding instead of using one of the latent
classes as a reference category.15 Each coefficient reported in Table 3 should be read as the
15 For space reasons, we do not report the time-varying coefficients of the lagged latent
economic preferences. The results are available upon request. See Figure 4 for quantities of
20

average effect of a change in objective or subjective material conditions on the probability of
transitioning into the latent class mentioned at the top of the column, “coming from” either of
the other two latent classes.
Table 3: Predicting transition probabilities: Objective and subjective changes in material con-ditions
LEFT-WING CENTRIST RIGHT-WING
coef. s.e. coef. s.e. coef. s.e.
Objective material conditions
UnemploymentEmployed in t and t-1 -0.775∗∗∗ (0.180) 0.083 (0.163) 0.692∗∗ (0.255)Unemp in t and t-1 0.123 (0.418) 0.256 (0.374) -0.379 (0.548)Became unemp in t 0.117 (0.329) -0.316 (0.288) 0.199 (0.471)Found job in t 0.535∗ (0.338) -0.023 (0.323) -0.512 (0.452)
IncomeNo significant changes -0.209∗ (0.104) 0.006 (0.097) 0.203 (0.160)Drop by at last 25% 0.393∗ (0.176) 0.058 (0.169) -0.452 (0.260)Increase by at last 25% -0.185 (0.146) -0.064 (0.137) 0.249 (0.219)
Subjective material conditions
Job securityUnchanged -0.501∗∗∗ (0.118) 0.299∗∗ (0.107) 0.202 (0.179)Got worse 0.212 (0.198) 0.291 (0.181) -0.503 (0.296)Got better 0.289 (0.197) -0.590∗∗∗ (0.170) 0.301 (0.268)
Financial situationAbout same -0.034 (0.058) 0.102 (0.055) -0.068 (0.086)Worse off 0.366∗∗∗ (0.067) -0.061 (0.066) -0.305∗∗ ( 0.102)Better off -0.333∗∗∗ (0.063) -0.041 (0.056) 0.374∗∗∗ (0.086)
Significance levels: ∗p<.05, ∗∗p<.01 ∗∗∗p<.001. Source: BHPS (1991-2007).Note: Effect coding! All variables are measured as the time difference between two surveys thatincluded the redistribution items. The models were estimated separately for each set of independentvariables. N obs.: 5,745. Only working age population.
Substantively, all estimates fit our expectations. Individuals who experience hardship are
interest.
21
more likely to become left-wing ideologues. Individuals who are experiencing an improvement
in their economic conditions exhibit the opposite pattern. Individuals who went from being
unemployed to finding a job are an exception. Having experienced unemployment in the past
appears to nudge individuals toward being left-wing, despite the improvement in job conditions.
Statistically, the effects are the strongest for the subjective job and financial security mea-
sures. An individual experiencing a change from feeling financially secure to feeling insecure
is more likely to become a left-wing ideologue and less likely to transition toward the right-
wing latent class. Conversely, respondents that evaluate their financial situation better than in
the last wave, transition to right-wing economic preferences and out of the left-wing latent class.
Interestingly, the coefficients of this cross-over effect are similar in size.
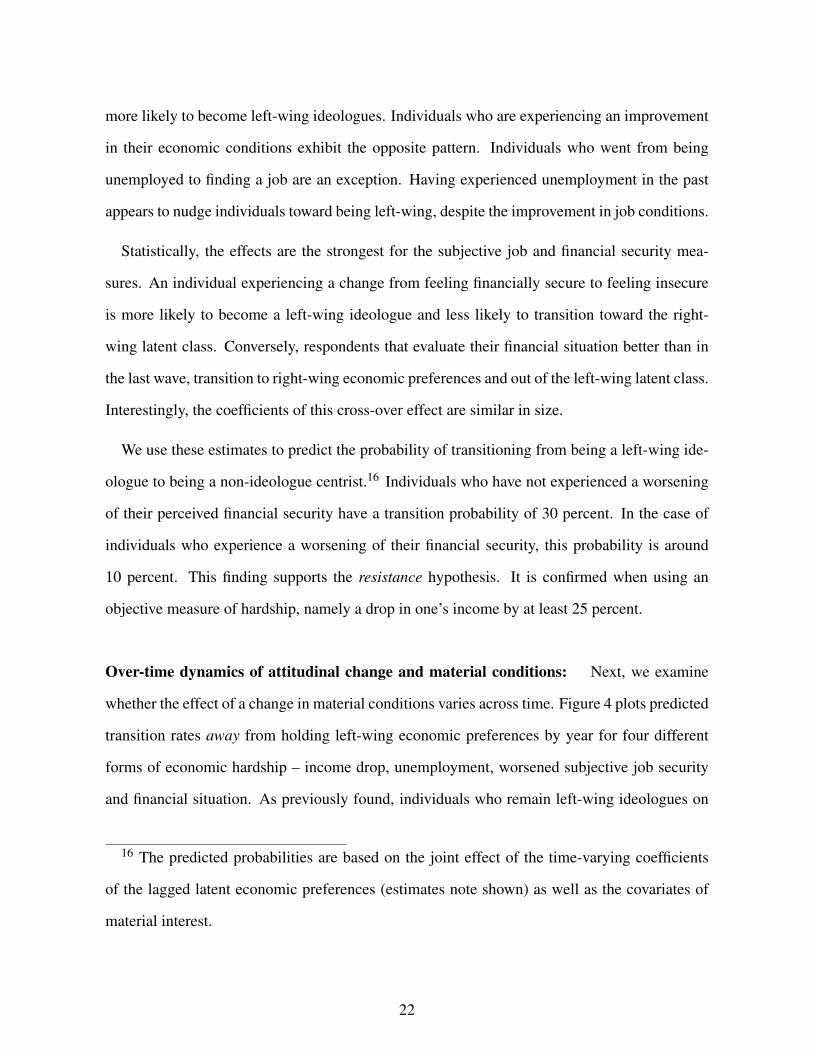
We use these estimates to predict the probability of transitioning from being a left-wing ide-
ologue to being a non-ideologue centrist.16 Individuals who have not experienced a worsening
of their perceived financial security have a transition probability of 30 percent. In the case of
individuals who experience a worsening of their financial security, this probability is around
10 percent. This finding supports the resistance hypothesis. It is confirmed when using an
objective measure of hardship, namely a drop in one’s income by at least 25 percent.
Over-time dynamics of attitudinal change and material conditions: Next, we examine
whether the effect of a change in material conditions varies across time. Figure 4 plots predicted
transition rates away from holding left-wing economic preferences by year for four different
forms of economic hardship – income drop, unemployment, worsened subjective job security
and financial situation. As previously found, individuals who remain left-wing ideologues on
16 The predicted probabilities are based on the joint effect of the time-varying coefficients
of the lagged latent economic preferences (estimates note shown) as well as the covariates of
material interest.
22
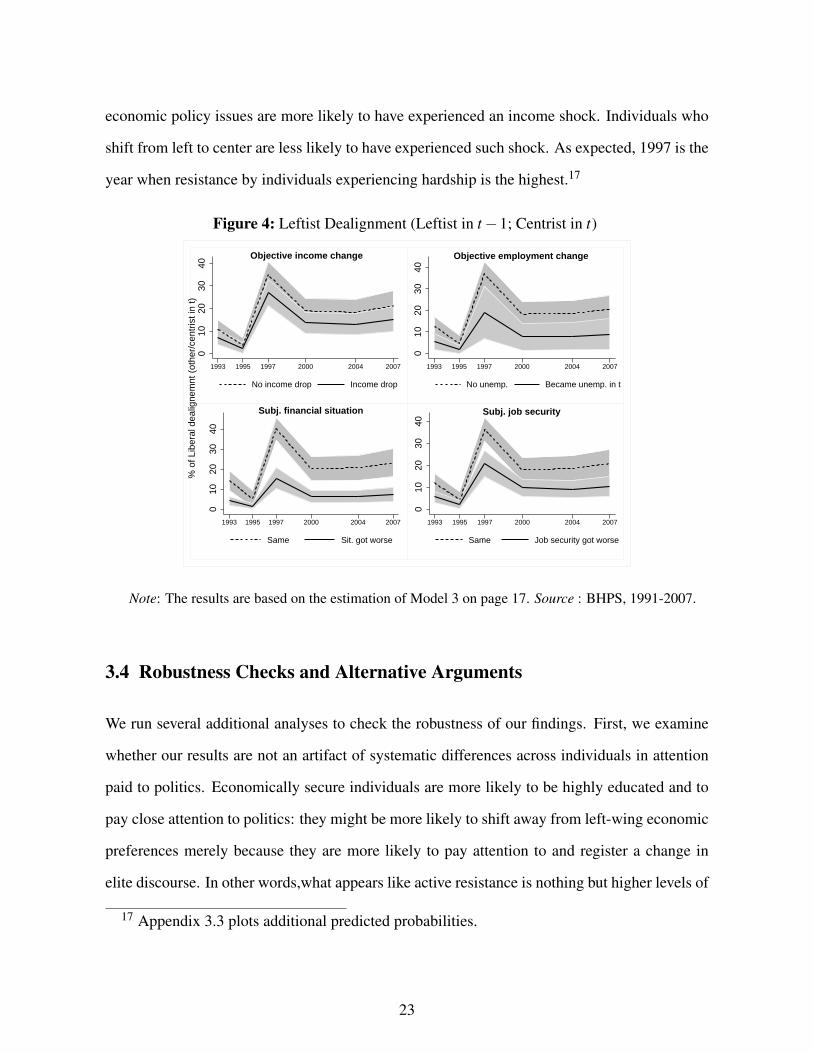
economic policy issues are more likely to have experienced an income shock. Individuals who
shift from left to center are less likely to have experienced such shock. As expected, 1997 is the
year when resistance by individuals experiencing hardship is the highest.17
Figure 4: Leftist Dealignment (Leftist in t−1; Centrist in t)
010
2030
40
1993 1995 1997 2000 2004 2007
No income drop Income drop
Objective income change
010
2030
40
1993 1995 1997 2000 2004 2007
No unemp. Became unemp. in t
Objective employment change
010
2030
40
% o
f Lib
eral
dea
ligne
mnt
(ot
her/
cent
rist i
n t)
1993 1995 1997 2000 2004 2007
Same Sit. got worse
Subj. financial situation0
1020
3040
1993 1995 1997 2000 2004 2007
Same Job security got worse
Subj. job security
Note: The results are based on the estimation of Model 3 on page 17. Source : BHPS, 1991-2007.
3.4 Robustness Checks and Alternative Arguments
We run several additional analyses to check the robustness of our findings. First, we examine
whether our results are not an artifact of systematic differences across individuals in attention
paid to politics. Economically secure individuals are more likely to be highly educated and to
pay close attention to politics: they might be more likely to shift away from left-wing economic
preferences merely because they are more likely to pay attention to and register a change in
elite discourse. In other words,what appears like active resistance is nothing but higher levels of
17 Appendix 3.3 plots additional predicted probabilities.
23

indifference to politics on the part of economically insecure individuals. We examine whether
the impact of a change in subjective insecurity is the same across all levels of interest in politics
(from not interested to very interested). We find no evidence that systematic heterogeneity in
attention paid to politics is driving our results. The results are reported in Appendix 4.1.
Second, we run a model with fixed effects as an alternative estimation process. To capture
the effects of a change in the discursive context, our analysis pays close attention to time het-
erogeneity. As a result, we cannot use individual fixed effects as our main modeling strategy.
However, we can use fixed effects to check whether the relationship between a change in ma-
terial conditions and a change in attitudes is likely to be causal. As expected, the relationship
between hardship and political preferences is robust to the inclusion of individual dummies.
The results are presented in Appendix 4.2.
Finally, to confirm our assumption that 1997 is a key year with regards to elite discourse on
economic issues, we run a placebo test. The BHPS repeatedly asks respondents about their
attitudes on gender issues. While the Labour Party is on average more progressive on gender
issues, these were not politicized in the 1997 election. Consequently we do not expect indi-
viduals’ to react to the New Labour Party’s electoral success by becoming more progressive on
gender issues. As documented in Appendix 4.3, in contrast to the economic preferences items,
there are no real variations in patterns of answers to the gender items over time.
In sum, we find evidence that individual-level experiences with economic hardship mediate
how individuals react to changes in the discursive context triggered by a change in political
elites’ electoral strategies. To put it differently, without paying attention to the discursive con-
text, researchers cannot understand and predict how individual material hardship will affect
mass attitudes (acceptance versus resistance). One limit of this country-specific analysis is that
we cannot include direct measures of the discursive context into the model: seven repeated
observations are not enough to estimate period-effects. In the next section, we leverage both
within and between-country differences in elite competition over economic issues to increase
24

variance in the discursive context.
4 A Comparative Analysis Of The Relationship Between Income andEconomic Preferences
Political economists have long dismissed behavioralist critiques by pointing to the robust cross-
sectional relationship between income and economic policy preferences. However, correlation
is not causation. As our analysis of panel data reveals, the prediction that economic hardship
should result in more left-wing economic preferences comes with important caveats.
In this section, we shed a new light on the cross-sectional correlation between income and
economic preferences. If we are correct that competition between political parties mediates
the relationship between material conditions and preferences, then we should expect this cross-
sectional correlation to vary systematically across country/years. Assuming that income is a
good proxy for hardship, we would expect low-income (high-income) individual to be more
likely to be exposed to left-wing (right-wing) considerations in country/years where elites more
strongly compete and disagree over economic and redistributive policies. In other words, the
more central economic and redistributive issues are to electoral competition, the larger the dif-
ference in economic preferences between high and low income groups.
Prediction 3: The correlation between income and economic preferences is larger in coun-
try/years where elites actively compete over economic and redistributive issues.
In Europe, elite-level competition over economic issues is decreasing. Figure 5 uses party
manifesto data (Volkens et al. 2013) to capture the average position on economic issues of left
and right-wing parties in all Western European democracies since 1945.18 Over time, left-wing
European parties have moved to the center on issues relating to traditional questions of redis-
18 See Appendix 5.1. for details on the measurement of parties’ economic positions based on
Lowe et al. (2011).
25

tribution and state-intervention in the economy. While left-wing parties have clearly changed
their position on economic policy, by becoming more moderate, there is not much movement
among right-wing parties.
Figure 5: Weighted mean economic policy positions of leftist and rightist parties over time
Econ. right
Econ. left
-2-1
01
2E
cono
mic
Pol
icy
posi
tion
1945 1955 1965 1975 1985 1995 2005 2015
Leftist parties Rightist parties
Source: Volkens et al. (2013). Sample is limited to Western European countries. We usethe Lowe et al. (2011) formula of policy positions (see footnote 18). Each dot representsthe mean positions of all left-wing (circles) and all right-wing (diamonds) political partiesin each election. The lines represent lowess functions.
Overall, the discursive context is not favorable to an aggregate increase in support for re-
distribution, even among low-income individuals. However, within this general trend, some
countries show stronger convergence (e.g. the UK, Netherlands, Portugal, Finland, Estonia,
just to name a few), while other countries experience some amount of divergence (e.g. Ger-
many and Poland).19 An ideal test of our argument, would be to examine how an increase in
elite competition over redistributive issues affects preference updating at the individual level.
Unfortunately, we could not locate panel data in Germany or Poland to replicate the analysis
19 We report the development of economic positions of left-wing and right-wing parties by
country between 2002 and 2014 in Appendix 5.1.1.
26

presented above using the BHPS. Prediction 3 presents a second-best alternative for testing our
argument using cross-country differences in elite-level political competition.
4.1 Empirical Strategy
We test Prediction 3 using attitudinal data from the European Social Survey (ESS) that we match
to contextual data from the Comparative Manifesto Project (CMP). Our analysis is based on 24
European countries with data collected between 2002 and 2012, at two-year intervals.20 ESS
respondents are asked how much they agree with the following statement: “Government should
reduce the differences in income levels.” We recoded the five-point Likert scale into a dummy
variable, where respondents were recoded as 1 if they chose a response category that is equal or
above the median response category in the country in a given survey year. In most cases (year,
country combinations), the median category is 2: are coded as 1 individuals who strongly agree
or agree with the above claim.
We draw on both cross-country and within-country differences in party competition on eco-
nomic issues. To measure these differences, we rely on the concept of polarization, used as a
proxy for the plurality and clarity of policy options from which voters can choose from. We
argue that higher polarization over economic issues should make it easier for citizens to bring
their economic policy preferences in line with their economic circumstances. We calculate the
following polarization index (using Ezrow and Xezonakis (2011)):21
20 The countries included here are as follows: Austria, Belgium, Switzerland, Czech Repub-
lic, Germany, Denmark, Estonia, Spain, Finland, France, Great Britain, Greece, Hungary, Ire-
land, Iceland, Italy, Luxembourg, The Netherlands, Norway, Poland, Portugal, Sweden, Slove-
nia, Slovakia.
21 See Appendix 5.1 for moe details on the Manifesta dataset.
27
Weighted Average Economic Polarization =√
∑ j=1V S jkt(Pjkt−V̄kt)2,
where V̄kt is the mean economic position in country k in election t; Pjkt is party j’s position
in country k at election t and V S jkt is party j’s vote share in election t. A polarized party
system means that on a given election year, the average difference on economic issues among
all parties is higher. As we only have measurement of parties’ policy positions in election years,
we linearly interpolated the data for the in-between election years.
We use income as our main measure of material hardship. The ESS provides a categorical
income variable with important differences between waves and countries in the cut-off points
used to define all the income categories. We use country-specific labor force surveys available
through the Luxembourg Income Study database.22 to compute two types of income thresholds
namely the 20th percentile and the 80th percentile of the disposable household income distri-
bution. The thresholds are specific to each country/year. We then identify respondents who
chose an income category that is below the 20th percentile or above the 80th percentile. Conse-
quently, the final income measure distinguishes respondents depending on whether they are in
a household belonging to the bottom quintile or an household belonging to the top quintile of
the income distribution in their country.
We also examine whether unemployed workers express different levels of support for redistri-
bution in countries where elites politicize economic and redistributive issues. We only classify
as unemployed, individuals who indicate that they have been actively searching for a job in the
last 7 days. Finally, we rely on a third proxy of hardship, namely a subjective measure that
captures the respondent’s satisfaction with one’s income. We code respondents that reported to
be financially struggling as 1 and other respondents as 0.
As the respondents are nested within countries (N=24) and years (N=12), we estimated a
22 The data is available at http://www.lisdatacenter.org.
28

cross-classified hierarchical model. We can use income to illustrate the model as follows:23
log(πi jk
1−πi jk) = α0 jk +β1 ∗ Inc+ γ1 ∗Polariz+β2 ∗ Inc x Polariz+
M
∑m=1
βm ∗Xmi (4)
where πi jk is the probability that the ith respondent, within the jth country and kth survey year,
expresses above median support for redistribution. We control for m individual characteristics
(m = 1, ..,M) X such as age, gender, education, and union membership, which are also believed
to affect redistribution preferences.24 The most important coefficient in this model is β2, which
gives us an estimate of the effect of income differences (top versus bottom quintile) on support
for redistribution for varying levels of economic polarization among political parties.
Model 4 further includes a random intercept α0 jk, that specifies that the overall mean of our
dependent variable varies from country to country and from year to year. This can be noted by:
α0 jk = γ0 +L
∑l=2
γl ∗Z jk +u0 j0 +ν00k (5)
where γ0 is the mean effect of all years across all countries. u0 j0 denotes a country specific
error term (u0 j0 ∼ N(0,τu)) and ν00k a time specific error (ν00k ∼ N(0,τν)). To account for
possible confounders that affect both individuals’ economic preferences and political parties’
electoral strategy, we control for the following objective macroeconomic factors (Z), measured
in each year country: GDP (gross domestic product based on purchasing power parity per capita,
23 See Snijders and Bosker (1999: 155-165) for a general introductory discussion of these
cross-classified random models.
24 As this model does not include a random slope-coefficient it is not necessary to center the
individual-level explanatory variables (Snijders and Bosker 1999: 80-81).
29

in current international dollars), unemployment rate (percent of total labor force) and inflation
of the consumer price index (as percentage change). We further control for governmental total
expenditure. The data source for the macroeconomic indicators is the World Economic Outlook
database, compiled by the International Monetary Fund. We further control for the variation in
inequality using the Gini coefficient, taken from the World Data Bank.25
4.2 Results
Table 4 reports the logit coefficients of a cross-classified model, estimated for the three dif-
ferent proxies of material hardship: unemployment, subjective income satisfaction and actual
income. For each, we estimate four models. The first – empty – model reports the results of
the model including only the individual-level covariates. The second – simple – model includes
polarization as a main effect. The third – interaction – model tests our main argument about
the interplay between individuals’ hardship and elite-level electoral competition. The forth,
which is reported in Table 4, additionally controls for macro-economic factors. Model 1 to 3
are available in Appendix 5.2.
The first observation of Table 4 confirms the well-known cross-sectional correlation between
material hardship and support for redistribution. Unemployed respondents or those generally
unsatisfied with their income are more likely to be favor government intervention to reduce
income differences. Further, those with middle or top incomes are less likely to support redis-
tribution than respondents that belong to the bottom-20% of the income scale.
Turning to the main effect of elite polarization, we find a strong positive relationship be-
tween polarization and the country’s average support for redistribution. The more polarized the
25 Some missing values in the early 2000s were imputed using forward interpolation of the
first available value.
30

party system is on economic issue, the more likely individuals are to believe in governments’
responsibility to equalize income differences.
Table 4: Cross-classified, logistic model: elite polarization on economic issuesand individual support for redistribution
ACTUAL INCOME UNEMPLOYMENT SUBJ INCOME STRUGGLEModel 4.1 Model 4.2 Model 4.3
Coef. s.e. Coef. s.e. Coef. s.e.
Economic hardship:Income: (ref: bottom-20%)
Middle -0.357∗∗∗ (0.054)Top-20% -0.689∗∗∗ (0.067)
Unemployed 0.299∗∗∗ (0.091)Income difficult 0.413∗∗∗ (0.049)
Polarization 1.135∗∗∗ (0.166) 1.102∗∗∗ (0.105) 0.979∗∗∗ (0.108)
Interaction: Polarization xIncome: (ref: bottom-20%)
Middle 0.148 (0.142)Top-20% -0.496∗∗ (0.176)
Unemployed 0.427 (0.242)Income difficult 0.390∗∗ (0.132)
Macro-level controls:Gov. Expenditure -0.014∗∗∗ (0.003) -0.011∗∗∗ (0.003) -0.010∗∗ (0.003)GDP per capita 0.000 (0.000) 0.000∗ (0.000) 0.000∗ (0.000)Inflation -0.004 (0.008) -0.011 (0.006) -0.011 (0.007)Unemployment 0.005 (0.004) 0.010∗∗ (0.004) 0.003 (0.004)Gini -0.008 (0.007) -0.008 (0.006) -0.001 (0.006)
Individual-level controls:Age 0.009∗∗∗ (0.000) 0.009∗∗∗ (0.000) 0.008∗∗∗ (0.000)Education (in years) -0.051∗∗∗ (0.002) -0.063∗∗∗ (0.002) -0.056∗∗∗ (0.002)Female 0.287∗∗∗ (0.013) 0.278∗∗∗ (0.011) 0.265∗∗∗ (0.012)Union memb. 0.322∗∗∗ (0.017) 0.316∗∗∗ (0.015) 0.327∗∗∗ (0.016)
Intercept 1.396∗∗ (0.443) 0.908∗ (0.403) 0.701 (0.403)
Variance components:Year (N=11) 0.133∗∗∗ (0.032) 0.138∗∗∗ (0.031) 0.144∗∗∗ (0.033)Countries (N=24) 0.609∗∗ (0.101) 0.588∗∗ (0.096) 0.557∗∗∗ (0.090)
N of obs. 119,387 153,252 149,058LogLik -69,709 -90,780 -87,961
Significance levels: ∗p<.05, ∗∗p<.01 ∗∗∗p<.001. Sources: ESS, 2002-2013,CMP, IMF, WDB.Note: The table reports the logit coefficients and standard errors in parentheses estimated from a cross-classified modelpredicting support for the statement that government should reduce the differences in income levels. Polarization ismeasured using the formula of Lowe et al. (2011). Working-age population only. The full set of models that wasestimated is available in Appendix 5.2.
The last set of coefficients provide a test for prediction 3. The results align with the claim
that elite-level competition on economic issues affects the tightness of the fit between economic
conditions and policy preferences. The more polarized the party system is on economic issues,
the more likely subjective and objective measures of hardship are associated with higher support
31

for redistribution. The impact of unemployment is only significant at the 10% level, which is not
surprising, as only few people are unemployed in our sample. The coefficient is, as expected,
positive.
Figure 6: Predicted support for redistribution by income and polarization
.5
.6
.7
.8
.9
Pre
dict
ed p
roba
bilit
y of
pro
-red
istib
utio
n pr
ef.
1 2 3 4 5Polarization quintiles
Income: bottom-20% Income: top-20%
Note: Based on model 4.1, presented in Table 4 with redistribution preference as thedependent variable, holding all other variables at their mean values Source: ESS andCMP.
To illustrate the interaction between economic polarization of the party system and individ-
uals’ income, Figure 6 plots the predicted support for redistribution for the bottom and top
income quintiles. For illustrative purposes, we also break down polarization into quintiles. Fig-
ure 6 confirms that the interaction is driven by low-income respondents. As elite polarization
on economic issues increases, bottom income quintile respondents are more likely to express
higher levels of support for redistribution. The increase is equal to 8 percentage points and is
significant. On the other hand, the top earners do not appear to be sensitive to changes in the
political discursive. Support remains stable at around 57 per cent. The estimate is significant but
substantively small. This, we believe is partly due to the general absence, over the 2002-2012
period, of sharp divergence on economic issues between the Left and the Right (see Figure 5).
32

4.3 Robustness Checks
Prediction 3 should be understood as an observable macro-level implication of our argument
with regards to the structure of policy preferences in different discursive contexts. While we
expect the causal relation to run from a change in elite-level competition to a change in the struc-
ture of mass preferences, the empirical strategy does not allow us to examine this possibility
directly. Separately, we examine in detail the case of Germany, a country that has experienced
over the period an increase in the salience of economic and redistributive issues. We find that
the difference in support for redistribution between high and low-income individuals increases
as party polarization on redistributive issues increases. In 2002, bottom quintile individuals
are only 1.40 times more likely, relative to top quintile individuals, to support redistribution.
By 2012, they are 3.3 times more likely. Most of the change occurs between 2004 and 2008.
During this period, the German political party system experienced an increase in polarization
following the emergence of Die Linke, a radical left party advocating for economic policies in
favor of the worse-off in Germany. The analysis is presented in extensive details in Appendix
6. While only indicative, this analysis, especially when contrasted with the British evidence,
provides additional support for our argument.
In sum, this section provides evidence that low-income individuals are more likely to express
higher levels of support redistribution in countries and years where elites politicize redistributive
issues. This relationship, we have argued is partly the result of low-income voters being both
more likely to be exposed to pro-redistribution claims and more likely to accept them. In other
words, they are more likely to translate their personal circumstances into policies preferences
that match their economic interest. These results have potential implications for how we inter-
pret the convergence to the center of left-wing parties plotted in Figure 5. Our model suggests
that this evolution has weakened the relationship between economic hardship and economic
preferences.
33
5 Discussion
We have built on John Zaller’s model of survey response to unite within one framework mate-
rialist and behavioralist approaches to preferences updating. Attitudes, we have hypothesized,
are conditioned simultaneously by features of a person’s material situation and by the discursive
context of politics as shaped by competition for elected office. Individuals are more likely to
translate personal economic hardship into higher support for redistributive social policies when
political elites actively compete over these issues. Similarly, changes in the discursive context
– following a change in elite-level electoral competition – will affect individuals differently,
depending on their material circumstances. To test this model, we first leveraged changes in
the discursive context induced by the transformation of the “old” Labour Party into the New
Labour Party. We then turn to between country variation in electoral contexts. In both cases,
we find strong evidence that the discursive context mediates the relationship between economic
hardship and preferences.
The mechanisms of preference updating documented in this paper has several important im-
plications. First, they shed a new light on what we should expect from events such as the 2008
Great Recession. Researchers have wondered why the sharp increase in unemployment did
not translate into an increase in support for redistributive social policies (Bermeo and Bartels
2014; Lindvall 2014). According to our model, to find an “effect” of hardship, researcher need
to distinguish between favorable and unfavorable political contexts. In Great Britain, we have
argued, this context is anything but favorable to the translation of material hardship into policy
preferences. Without an increase in the share of left-wing considerations in one’s environment,
individuals who are experiencing a worsening of their material conditions are unlikely to trans-
late it into higher support for redistributive policies.26
26 The recent election in September 2015 of Jeremy Corbyn, in the midst of austerity policies
implemented by the Cameron government, should result in a re-politicization of the left-right
34
Second, the theory developed and tested in this study addresses an important debate in em-
pirically driven democratic theory. Several researchers have shown that increasing the turnout
of the poor in countries like the United States would not have much impact on policy-making
because the preferences of the poor, as captured in survey data, do not differ from that of the
median voter (Soroka and Wlezien 2008; Ura and Ellis 2008; Gilens 2009). Our model predicts
that this finding might be country and time-specific and can be expected to vary across politi-
cal systems and across time. In a two-party majoritarian system, the incentives to cater to the
(latent) needs of the poor are more limited relative, for instance, to a multi-party system with a
proportional electoral rule. Absent competition over redistributive issues that benefit the poor,
this group is unlikely to exhibit diverging attitudinal trends.
More generally, our findings emphasizes the need to study individual-level behavior in con-
text (Falleti and Lynch 2009). Empirically, failure to consider individual and contextual factors
jointly can return individual estimates that are hard to interpret. For instance, the analysis of
the British panel data indicates that attitudinal stability is not a passive endeavor, especially
in a context of elite-induced attitudinal change. Traditional modeling techniques that match a
change in the explanatory variable to a change in the outcome variable (i.e. individual fixed
effects) can produce very conservative estimates. Theoretically, we contribute to a growing lit-
erature that examines how supply-side politics shape individual political behavior. Sniderman
and Bullock (2004), for instance, argue that the dynamics of electoral competition affect the
extent to which voters hold coherent beliefs across issue areas (see also Sniderman and Leven-
dusky 2007). Lupu (2013) shows that a polarized party system fosters strong party attachments.
In this paper we show how supply-side politics similarly affect the translation of latent mate-
rial need into manifest policy preferences. Future research should focus on understanding how
and when political entrepreneurs perceive these latent needs and why they decide to address or
divide over redistribution and public spending. Once the data is made available, this event will
provide an additional test of our model.
35

overlook them.
36
References
Ansolabehere, Stephen, Jonathan Rodden, and James Snyder. 2008. “The strength of issues: Us-
ing multiple measures to gauge preference stability, ideological constraint, and issue voting.”
American Political Science Review 102(02):215–232.
Bartels, Larry M. 2005. “Homer gets a tax cut: Inequality and public policy in the American
mind.” Perspectives on Politics 3(01):15–31.
Berinsky, Adam J. 2011. New directions in public opinion. New York, NY: Routledge.
Bermeo, Nancy and Larry M. Bartels, eds. 2014. Mass politics in tough times: Opinions, Votes
and Protest in the Great Recession. Oxford: Oxford University Press.
Brooks, Clem and Jeff Manza. 2013. “A Broken Public? Americans Responses to the Great
Recession.” American Sociological Review 78(5):727–748.
Dancey, Logan and Paul Goren. 2010. “Party identification, issue attitudes, and the dynamics
of political debate.” American Journal of Political Science 54(3):686–699.
Duch, Raymond M and Randolph T Stevenson. 2011. “Context and economic expectations:
when do voters get it right?” British Journal of Political Science 41(1):1–31.
Evans, Geoffrey and James Tilley. 2012. “How parties shape class politics: Explaining the
decline of the class basis of party support.” British Journal of Political Science 42(1):137–
161.
Ezrow, Lawrence and Georgios Xezonakis. 2011. “Citizen satisfaction with democracy and
parties policy offerings.” Comparative Political Studies 44(9):1152–1178.
Falleti, Tulia G and Julia F Lynch. 2009. “Context and causal mechanisms in political analysis.”
Comparative Political Studies 42(9):1143–1166.
Gilens, Martin. 2009. “Preference gaps and inequality in representation.” PS: Political Science
& Politics 42(02):335–341.
Hill, Jennifer L and Hanspeter Kriesi. 2001. “Classification by opinion-changing behavior: A
37

mixture model approach.” Political Analysis 9(4):301–324.
Hopkins, Daniel J. 2010. “Politicized places: Explaining where and when immigrants provoke
local opposition.” American Political Science Review 104(1):40–60.
Huckfeldt, Robert, Jeffery J Mondak, Michael Craw, and Jeanette Morehouse Mendez. 2005.
“Making sense of candidates: Partisanship, ideology, and issues as guides to judgment.”
Cognitive Brain Research 23(1):11–23.
Iversen, Torben and David Soskice. 2006. “Electoral institutions and the politics of coalitions:
Why some democracies redistribute more than others.” American Political Science Review
100(2):165–181.
Jennings, M Kent and Gregory B Markus. 1984. “Partisan orientations over the long haul: Re-
sults from the three-wave political socialization panel study.” American Political Science Re-
view 78(4):1000–1018.
Kriesi, Hanspeter, Edgar Grande, Martin Donezald, Marc Helbling, Dominic Hoeglinger, Swen
Hutter, and Bruno Wueest. 2012. “National political change in a globalizing world. Supply
side data on national election campaigns.” University of Zurich and Ludwig-Maximilians-
University of Munich.
Lindvall, Johannes. 2014. “The electoral consequences of two great crises.” European Journal
of Political Research 53(4):747–765.
Lowe, Will, Kenneth Benoit, Slava Mikhaylov, and Michael Laver. 2011. “Scaling policy pref-
erences from coded political texts.” Legislative Studies Quarterly 36(1):123–155.
Lupu, Noam. 2013. “Party brands and partisanship: Theory with evidence from a survey exper-
iment in Argentina.” American Journal of Political Science 57(1):49–64.
Margalit, Yotam. 2013. “Explaining social policy preferences: Evidence from the Great Reces-
sion.” American Political Science Review 107(1):80–103.
Martin, Cathie Jo and Kathleen Thelen. 2007. “The state and coordinated capitalism: contri-
38
butions of the public sector to social solidarity in postindustrial societies.” World Politics
60(1):1–36.
McCarty, Nolan, Keith Poole, and Howard Rosenthal. 2008. Polarized America: The Dance of
Ideology and Unequal Riches. Cambridge, MA: MIT Press.
Meltzer, Allan H. and Scott F. Richard. 1981. “A rational theory of the size of government.”
Journal of Political Economy 89(5):914–927.
Milazzo, Caitlin, James Adams, and Jane Green. 2012. “Are voter decision rules endogenous to
parties’ policy strategies? A model with applications to elite depolarization in post-Thatcher
Britain.” Journal of Politics 74(1):262–276.
Moene, Kove and Michael Wallerstein. 2001. “Inequality, social insurance, and redistribution.”
American Political Science Review 95(4):859–874.
Neundorf, Anja, Daniel Stegmueller, and Thomas J. Scotto. 2011. “The Individual Level Dy-
namics of Bounded Partisanship.” Public Opinion Quarterly 75(3):458–482.
Page, Benjamin and Robert Shapiro. 1992. The rational public: Fifty years of trends in Ameri-
cans’ policy preferences. Chicago: University of Chicago Press.
Sears, David O, Richard R Lau, Tom R Tyler, and Harris M Allen Jr. 1980. “Self-interest vs.
symbolic politics in policy attitudes and presidential voting.” American Political Science Re-
view 74(3):670–684.
Sears, Donals O. and Carolyn Funk. 1990. “The limited effect of economic self-interest on the
political attitudes of the mass public.” Journal of Behavioral Economics 19(3):247–271.
Sniderman, Paul M and John Bullock. 2004. Studies in public opinion: Attitudes, nonattitudes,
measurement error, and change, chap. A consistency theory of public opinion and politi-
cal choice: The hypothesis of menu dependence, pages 337–357. Princeton, NJ: Princeton
University Press.
Sniderman, Paul M and Matthew S Levendusky. 2007. Oxford Handbook of Political Behavior,
39
chap. An institutional theory of political choice, pages 437–456. Oxford: Oxford University
Press.
Sniderman, Paul M and Simon M Theriault. 2004. “The structure of political argument and the
logic The structure of political argument and the logic of issue framing.” In Studies in public
opinion, Paul M Sniderman and Willem E Saris, eds., pages 133–165, Princeton University
Press.
Snijders, Tom A.B. and Roel J. Bosker. 1999. Multilevel Analysis: An Introduction to Basic and
advanced multilevel modeling. London: Sage.
Soroka, Stuart N and Christopher Wlezien. 2008. “On the limits to inequality in representation.”
PS: Political Science & Politics 41(2):319–327.
Strauss, Claudia. 2012. Making Sense of Public Opinion: Conventional discourses, public opin-
ion, and political culture. Cambridge: Cambridge University Press.
Ura, Joseph Daniel and Christopher R Ellis. 2008. “Income, preferences, and the dynamics of
policy responsiveness.” PS: Political Science & Politics 41(4):785–794.
Volkens, Andrea, Pola Lehmann, Nicolas Merz, Sven Regel, Annika Werner, Onawa Lacewell,
and Henrike Schultze. 2013. “The Manifesto Data Collection. Manifesto Project.” Available
online : https://manifesto-project.wzb.eu.
Zaller, John. 1992. The nature and origins of mass opinion. Cambridge: Cambridge University
Press.
40