
Employee Referrals - Motivating Employees So They Produce More And Higher Quality Referrals
Do Informal Referrals Lead to Better Matches? Evidence from a
Firm�s Employee Referral System1
Meta Brown, Elizabeth Setren and Giorgio TopaResearch and Statistics Group
Federal Reserve Bank of New York33 Liberty Street
New York, NY 10045
February 2012
1Corresponding coauthor Giorgio Topa may be contacted at [email protected]. This paper isdedicated to the memory of Linda Datcher Loury, a pioneer in this literature, an excellent scholar anda great person. Fabian Lange, Charles Bellemare, Manolis Galenianos, Uta Schonberg, Wilbert van derKlaauw and seminar participants at the Society for Economic Dynamics and the Federal Reserve Bank ofNew York provided valuable comments. The views and opinions o¤ered in this paper do not necessarilyre�ect the position of the Federal Reserve Bank of New York or the Federal Reserve System.
Abstract
The limited nature of data on employment referrals in large business and household surveys has so
far restricted our understanding of the relationships among employment referrals, match quality,
wage trajectories and turnover. Using a new �rm-level dataset that includes explicit information
on whether a worker was referred by a current employee of the company, we are able to provide
rich detail on these empirical relationships for a single mid-to-large U.S. corporation, and to test
various predictions of the theoretical literature on labor market referrals. We �nd that referred
workers enter at higher wage levels, all else equal, but that the referred wage advantage dissipates
by the third year of employment. After the �fth year the referral-wage relationship is reversed.
Referred workers experience substantially less turnover, and this e¤ect is relatively long-lasting.
Despite higher predicted productivity for referred workers in the theoretical literature, we �nd, if
anything, slightly slower promotion rates for referred than for non-referred workers. Finally, the
wide range of skill and experience levels represented in this corporation permit detailed analysis of
the role of referrals for workers from support sta¤ to executives.
JEL codes: J30, J63, J64
1 Introduction
There is wide empirical consensus, both in economics and in sociology, on the widespread use of
informal referrals in the labor market.1 For instance, Corcoran et al. (1980) analyze national data
from the Panel Study of Income Dynamics (PSID) and �nd that between 52% and 58% of male
workers under the age of 45 heard about their current job from friends or relatives; for their �rst
job these estimates range between 55% and 67%.2 However, the information on referrals is often
indirect, and there is little direct evidence on the impact of labor market referrals on the quality
of the matches between �rms and workers.
The limited nature of data on employment referrals in large business and household surveys has
so far restricted our understanding of the relationships among employment referrals, match quality,
wage trajectories and turnover3. Using a new �rm-level dataset that includes explicit information
on whether a worker was referred by a current employee of the company, we are able to provide
rich detail on these empirical relationships for a single mid-to-large U.S. corporation, and to test
various predictions of the theoretical literature on labor market referrals.
We �nd that referred workers enter at higher wage levels, all else equal, but that the referred
wage advantage dissipates by the third year of employment. After the �fth year the referral-wage
relationship is reversed. Referred workers experience substantially less turnover, and this e¤ect is
relatively long-lasting. Despite higher predicted productivity for referred workers in the theoretical
literature, we �nd, if anything, slightly slower promotion rates for referred than for non-referred
workers. Finally, the wide range of skill and experience levels represented in this corporation permit
detailed analysis of the role of referrals for workers from support sta¤ to company executives.
The plan of the paper is as follows. Section 2 relates this paper to the rich and varied empirical
literature on employee networks in general and referral in particular. In Section 3 we review existing
theory on labor market referrals and note several testable predictions. Section 4 describes our new
�rm-level data on employee referral status, tenure outcomes, and promotion and salary trajectories.
1See Ioannides and Datcher Loury (2004) and Topa (2011) for surveys of the economics literature, and Marsdenand Gorman (2001) for a survey of the sociology literature.
2See also Datcher (1983). Pellizzari (2004) analyzes a large panel dataset of European households (the EuropeanCommunity Household Panel) and �nds that between 25% and 40% of respondents in most countries heard abouttheir current job through informal contacts. On the employer side, Marsden (2001) and Holzer (1987b) use nationalsurveys of U.S. �rms and �nd that a little over one third of �rms surveyed in 1991 and in 1982 (respectively) oftenused referrals from current employees when publicizing vacancies.
3A notable exception is Datcher (1983)
1
The empirical speci�cations used to test the various predictions generated by models of employee
referrals, results of these tests and other empirical �ndings are found in Section 5, and Section 6
concludes.
2 Related empirical literature
Empirical research on labor market referrals has emphasized the identi�cation of e¤ective proxies
for referred worker status, as a result of the di¢ culty of measuring referral status in most relevant
data sources. Recent research focuses on whether neighbors cluster in the same �rm or area as an
indication of the strength of informal referral networks (Bayer et al. 2008 and Hellerstein et al.
2008). Others study family based networks (Kramarz and Nordstrom Skans 2007) and educational
institutions (Oyer and Schaefer 2009). Giuliano et al. (2009) and Aslund et al. (2009) �nd a
relation between the ethnic status of managers and the ethnic composition of new hires using data
from one large U.S. retail �rm and Swedish social security data, respectively. Dustman, Glitz, and
Schonberg (2011) use ethnic minority groups as a source of variation in network distance between
current employees and new hires in German employment data.
With regard to the impact of referrals on hiring probabilities, Holzer (1987a) �nds that that the
probability of obtaining a job or receiving an o¤er through personal contacts is higher than that
through formal methods. Holzer (1988) also �nds that among all search methods, informal methods
(personal contacts and direct applications) generated the most o¤ers and acceptances conditional
on o¤er. The high fraction of jobs found through informal means re�ects both high usage and high
productivity of these methods. With regard to match outcomes, Datcher (1983) uses PSID data
and �nds lower turnover (quit rates) in jobs found through personal contacts rather than formal
means, for blacks and for college educated but not for those with high school or less.
A few richly informative studies of referral based on �rm-level data and explicit referral in-
formation address the subject from a sociological perspective. Fernandez and Weinberg (1997),
Fernandez and Castilla (2000, 2001) and Castilla (2005) use data from a retail bank and a call
center to study the role of referral networks in hiring for low to moderate skill jobs. Much of the
focus of these papers is on the hiring stage, and on initial productivity. Major �ndings include that
referred applicants are more likely to be hired after controlling for other observables, that referrers
2
do have relevant information about referred employees and that there is some evidence of assorta-
tive matching between referrer and referred. Castilla has direct measures of worker productivity
from a call center and �nds that referred workers are in fact more productive.
However, these studies do not follow employees for long post-hire periods, and they generally
do not rely on the tools of labor economics. This study is the �rst, to our knowledge, to use
explicit data on individual employees�referral status to relate referrals to immediate and long-term
employment outcomes including starting salary, salary trajectory over time, promotion patterns
and stability of the job match, and hence we are the �rst, again to our knowledge, to be able to test
the collection of predictions generated by the theoretical literature on employee referrals regarding
salary trajectories, promotion and turnover using explicit data on employees�referral status.
3 Theoretical models of employment referrals and their predic-
tions
Simon and Warner (1992) is an early and relatively in�uential example of the theory of labor
market referrals. They embed employee referrals in a Jovanovic (1979, 1984) model of job matching
and turnover, and use this partial equilibrium framework to derive predictions for di¤erences in
salary and match duration between referred and non-referred workers. They emphasize three
predictions that we will be able to address directly using our explicit referral information below.
Their model predicts that referred workers, or workers hired through the "old boy network", will
(i) earn higher starting salaries, (ii) gradually lose their salary advantage and (iii) display longer
tenure in the �rm than comparable workers hired through other means. As a result of their partial
equilibrium, dynamic framework, testing the types of predictions generated by the Simon and
Warner model involves immediate and ongoing observation of referred and non-referred workers in
a single employment spell, a task for which our panel of �rm-level data is well suited.4
Montgomery (1991) is another seminal paper on the role of referrals in the labor market. He
argues that referrals from current employees may reduce the adverse selection problem an employer
4Note that Simon and Warner test the predictions of their old boy network model using the 1972 Survey of Naturaland Social Scientists and Engineers, a collection of retrospective self-reports on employment experiences. We discusstheir �ndings in conjunction with our own empirical results below. While our data have the advantages of beingroughly 30-50 years more recent, being derived from an administrative source and representing a considerably widerrange of worker skill levels, their data have the obvious advantage of representing more than one �rm.
3
faces when trying to hire someone, if there is uncertainty about worker or match quality. He
formalizes this idea in a labor market model in which formal and informal search methods coexist in
equilibrium. Firms set their wages before observing a new worker�s productivity; current employees
are likely to know someone of similar quality given assortative matching in personal networks. This
implies that by relying on referrals employers can alleviate the adverse selection problem they
face. In equilibrium, the model implies that wages of jobs obtained through referrals are higher
than wages of jobs found through other means. Montgomery (1991) also derives some interesting
comparative statics: an increase in either network density or assortative matching increase referral
wages relative to market wages, and increases the dispersion in the wage distribution.
3.1 Prediction 1: Referred applicants are more likely to be hired
More recent theoretical papers on employee referrals include Galenianos (2011) and Dustmann et
al. (2011). Galenianos models worker and �rm search with and without productivity heterogeneity
in the presence of networks that yield (informative) referrals. As the (exogenous) rate at which
referrals are generated increases, the aggregate job �nding rate rises and labor market tightness
decreases. Together, these imply that a higher prevalence of referrals will be associated to higher
estimated matching e¢ ciency �in estimates of an aggregate matching function. Other predictions
include that referrals are associated with the hiring of more productive workers. Access to referral
networks both decreases a worker�s unemployment probability and increases the worker�s wage.
Further, a worker�s job-�nding rate increases with the rate of employment among members of her
network.
Importantly, the Galenianos model with worker heterogeneity delivers the theoretical impli-
cation that workers who meet a �rm through referrals are more likely to be hired than workers
who meet the �rm through random matching. This is because high productivity workers are more
likely to be employed and therefore are more likely to refer one of their social contacts. Because of
assortative matching, those who are referred are more likely to be other high productivity workers.
Therefore, when a worker and a �rm meet, a referred job candidate is more likely to be hired than a
non-referred one, all else equal. We will be able to test this hypothesis directly with our data. Note
that the Galenianos model emphasizes the roles of the job seeker and potential employer in the
context of a matching model, where referrals a¤ect the aggregate job �nding rate and the properties
4

of the equilibrium matching function. Therefore, some of its predictions may be best tested using
the business and household survey data on which much of the referral network has relied to date.
3.2 A simple model of employee referral
We brie�y present here a simple model of job matching, adapted heavily from Dustmann et al.
(2011). Dustmann et al. model both initial worker-�rm contact in referral and external markets
and the ongoing wage negotiation over time between a matched worker and the �rm. In this sense,
their approach �ts our current purposes more closely. They generate richer predictions for the
employment trajectory than other available models of employee referral, and they have more to say
about the wage renegotiation process within a single employment spell. For these reasons, we focus
on the Dustmann et al. model and intuitions behind its various predictions.
Let us begin by laying out the fundamental features of the Dustmann et al model, after which
we will provide some intuition for its main empirical predictions. The Dustmann et al. model draws
heavily on the speci�cation in Simon and Warner, which in turn is based on the job matching model
of Jovanovic. Hence the various approaches on which we pin our tests share common assumptions
and intuition. Consider an economy consisting of N workers and L �rms producing according to
a constant returns to scale technology, and in which �rms may enter (by posting a vacancy) and
leave freely. Firms and workers are risk neutral payo¤ maximizers. When unemployed, workers
receive unemployment bene�t b. Firms experience cost of an un�lled vacancy k. True underlying
productivity y is match-speci�c and drawn from distribution N(�; �2�):
When a worker and �rm meet, they observe a noisy signal of the match�s true productivity,
byj = y + "j , where "j � N(0; �2j ) and j 2 fR;Eg indicates the worker�s referred or external
market status: Given a posting, a referral may or may not be available to the �rm according to an
exogenous process. The e¤ect of the referral is to modify the informativeness of the productivity
signal observed by the worker and �rm, so that "R � N(0; �2R) and "E � N(0; �2E), with �2R < �2E :
In the interest of expositional simplicity, we abstract from several features of the problem
included in Dustmann et al. We assume a zero rate of match destruction and that employers and
employees observe the true match quality in the second period of employment with certainty, rather
than with a positive probability in each subsequent period of employment. Further, we limit the
time horizon to the two period case, where Dustmann et al. model in�nitely lived �rms and workers.
5

Finally, we set aside some structure on the employee network used by Dustmann et al. to allow
for equilibrium e¤ects of employment levels on job �nding rates and the like. These simpli�cations
allow us to reproduce and discuss certain central intuitions of the Dustmann et al. model brie�y
in our context. Where more extensive modeling is valuable, we simply refer to the original and
discuss its predictions in less speci�c terms.
Suppose, then, that the (somewhat simpli�ed) timing of events is as follows:
1. A �rm chooses to post a vacancy. With positive probability the �rm receives an employee
referral for the vacancy. Firm and referred worker observe signal byR of the referred worker�s quality.The �rm makes a wage o¤er. If the worker turns down the o¤er, the position remains open and
the worker remains unemployed for the duration of the period.
2. Workers who have received no o¤ers and �rms that have received no referrals meet in the
non-referral market according to a constant returns to scale matching function. On matching,
worker and �rm receive match quality signal byE : The �rm makes a wage o¤er. If the worker rejects
the o¤er then the vacancy remains open and the worker remains unemployed for the rest of the
period.
3. In the next period, each worker-�rm pair in a surviving match learns the true productivity
of the match. The �rm makes a new wage o¤er. If the employee turns down the wage o¤er then
the match is dissolved, the employee becomes unemployed and the position becomes vacant.
3.3 Wage and employment determination after true productivity is revealed
Following the revelation of true productivity y, workers and �rms allocate the surplus of the match
according to
W2(y) = w2(y)
V2(y) = y � w2(y);
where W2 represents the value to the worker following match quality revelation, V2 the value to the
�rm and w2 the wage. Total surplus from the match is y. Given a value of unemployment in this
period of b and that free entry drives the value of a vacancy to zero, only matches whose productivity
meet the total of worker and �rm outside options are continued after match quality revelation, so
6

that only matches such that y > y� where y� = b + 0 survive. Note that this reservation value is
common to matches produced by referrals and matches produced by the outside market.
3.4 Wage and employment determination with unknown productivity with and
without referral
De�ne mj to be the expected value of match productivity for a worker and �rm who have just met
through mechanism j 2 fR;Eg. Let wj represent the wage the �rm pays the worker in the current
period. Then
W1j = wj + �
Zmax(W2; b)dFj(yjmj ; �
2j ); (1)
where W1j represents the value of accepting the match for the worker, � is the discount rate and
dFj(yjmj ; �2j ) is the density of true match productivity given current expected productivity mj and
variance of the external market signal �2j :
Similarly, the value to the �rm of an accepted wage o¤er wj is
V1j = mj � wj + �Zmax(V2; 0)dFj(yjmj ; �
2j ):
We assume wages are determined by Nash bargaining, with share of the surplus going to the
worker, so that
W1j � U = (W1j � U + V1j);
where U represents the value of �rst period unemployment and is common to referred and external
market matches. Dustmann et al. demonstrate that there exists a reservation match quality m�j
such that, if m > m�j , workers prefer to accept the wage o¤er and �rms prefer to hire the worker,
where m�j satis�es W1j(m
�j )� U = V1j(m�
j ) = 0:
3.5 Prediction 2: Referred workers receive higher initial wages
Observe that the second term in expression (1) is increasing in the variance of the signal, �2j , and
that the worker�s value only need meet wj(m�j )+�
Rmax(W2; b)dFj(yjm�
j ; �2j ) = U in order for the
match to be sustained. Hence the reservation wage demanded by referred workers is higher than the
7

reservation wage demanded by non-referred workers as a result of �2R < �2E :5 The intuition behind
this result is that, for the external market worker, the greater uncertainty in future productivity and
therefore in the future wage implies greater probability mass over higher second period wages, while
she or he is insured against the greater probability mass in the lower tail of the match distribution
by the ability to quit in response to low match productivity realizations. In other words, the
external market worker faces a higher upside potential while being insured against bad draws, so
she has a lower initial reservation wage.
Both Simon and Warner and Galenianos also predict higher starting wages for referred workers.
The intuition driving this result is similar in Simon and Warner, while the source of the di¤erence in
Galenianos relies on homophily in referral networks and the higher average productivity of employed
than of unemployed workers.
3.6 Prediction 3: The referred worker wage advantage diminishes over time
As noted, Dustmann et al. employ a more complex version of the model than we have described
here. As a result, they are only able to generate predictions for the salary trajectory using numerical
methods. In an appendix to the paper, on page 34, they report numerical results indicating that
the wage advantage accruing to the (still employed) referred worker over the (still employed) non-
referred worker diminishes with tenure in the �rm.
In a simpler framework more closely resembling what we have described here, Simon and Warner
generate some intuition for this result by considering the limiting cases. Suppose, for example, that
referrals perfectly reveal true match productivity in the �rst period, so that �2R = 0. In this
case the referral market reservation match value reverts to y� = b, and as a result the �rst and
second period reservation productivity values for the referred case are identical. Further, in this
case referral wages are identical in the �rst and second periods, with no new information on match
productivity revealed at the start of the second period. Assuming a less than perfectly informative
signal for the external market (�2E > 0). this clearly implies a �atter wage pro�le for referred
than for non-referred workers. Further, as we discuss in Prediction 4, the model predicts lower
separations for referred than non-referred workers. Relatively more external market workers will
separate over time, from the low end of the match quality distribution: thus, those external market
5We leave proof that the reservation wage increases in the reservation match quality to Dustmann et al.
8
workers who stay with the �rm will exhibit higher wage growth on average because of the non-
random di¤erential attrition.
Note that Simon and Warner also consider the predicted e¤ect of referral where signals regard-
ing referred and non-referred workers�match productivities are equally informative, but referred
workers are on average of better match quality. This model generates an initial wage advantage for
the referred but similar wage growth for referred and non-referred workers, and Simon and Warner
interpret �ndings on the time path of the wage advantage of referred workers as a test of the relative
importance of mean productivity di¤erences and productivity signal informativeness in explaining
the referral advantage.
3.7 Prediction 4: Turnover is lower for referred workers
The lower turnover prediction in Dustmann et al. is analogous to the higher starting salary pre-
diction in Dustmann et al. As discussed above, they demonstrate that the reservation match
productivity in the referral market is higher than the reservation match quality in the external
market, m�R > m
�E , owing to the fact that greater uncertainty in true match productivity creates
greater opportunity for wage growth for external market hires. Given that referred workers are
better matched to their �rms than non-referred workers, the probability mass below the common
match productivity reservation value that applies to all workers after productivity is revealed is
greater for external market than for referred workers, and so more workers initially hired through
the external market separate from their matches following productivity revelation.
Returning to Simon and Warner�s limiting cases, suppose again that referrals perfectly reveal
true match productivity in the �rst period, so that �2R = 0. As discussed, in this case the referral
market reservation match value reverts to y� = b, the �rst and second period reservation productiv-
ity values for the referred case are identical, and wages are identical in the �rst and second periods.
No new information on match productivity is revealed at the start of the second period. As a
result, no referred worker separates from the �rm at the start of the second period. Assuming a
less than perfectly informative signal for the external market (�2E > 0), this limiting case generates
the extreme prediction that all turnover takes place among external market hires, and all referred
workers remain employed.
Alternatively, consider the case in which the external market productivity signal is completely
9
uninformative. Then the external market expected productivity distribution collapses to N(�; �2�)
and all external market job candidates meeting �rms are hired and draw the same wage (presuming
a su¢ ciently favorable underlying match quality distribution for employment to take place). If the
referral market productivity signal contains any information, then workers and �rms meeting by
referral, unlike those meeting in the external market, will be able to reject some lower segment of
signalled productivities. Therefore when match quality is fully realized for both external market and
referred worker-�rm pairs in the second period, the proportion of referred workers with realized
match productivities below the common reservation value of y� = b will be smaller than the
proportion of external market workers with match productivities below y� = b (which will simply
equal �( b���� )). Therefore the separation rate for referred workers following productivity revelation
will be smaller than the separation rate for non-referred workers following productivity revelation.
3.8 Prediction 5: The referred worker turnover advantage also diminishes over
time
Though our simple two period model, and the simple model of Simon and Warner, cannot address
patterns in turnover as tenure in the �rm varies more �nely, Dustmann et al. model a gradual
process of true productivity revelation. This approach allows members of the populations of referred
and non-referred workers to be subjected to the common post-revelation reservation match standard
gradually over time. As a result, surviving referred and non-referred employees gradually become
more similar. Dustmann et al. provide evidence, again numerical, that the di¤erence in the rate of
separation from the �rm between referred and non-referred workers should diminish over time.
3.9 Prediction 6: Referred workers have higher expected productivity
The higher reservation match productivity of referred workers (m�R > m
�E) predicted by the model
of Dustmann et al. would seem to predict higher expected match productivity for referred workers
in general. Simon and Warner make similar predictions regarding reservation match productivity,
and the link to expected match productivity over the full distributions of referred and non-referred
workers is more direct in their simpler context. Further, Galenianos generates higher employer pre-
dictions of referred worker initial productivity in a decidedly di¤erent context. As discussed above,
in a lower skilled pool of call center workers, Castilla (2005) �nds evidence of higher productivity
10
(in a piece-rate sense) for referred than for non-referred workers. Greater initial or expected pro-
ductivity of referred workers appears to be a common prediction of the employee referral literature.
4 Data and descriptive statistics
This study utilizes a unique dataset that includes all of the hires and applicants of a U.S. corporation
which employs between 2,000 and 5,000 people. The corporation hires people for a broad range of
tasks with all levels of educational backgrounds and years of work experience. This makes it an
ideal sample to study the e¤ect of referrals across a variety of skill and education backgrounds.
4.1 Applicant data
The dataset covers all applicants to the corporation from 2006 to 2010. The data contain infor-
mation about how the applicant found the position, whether through the corporation�s website,
campus recruiting, internet job boards, employee referrals, their own initiative, or another source.
In our data, an applicant can be associated to an employee referral in one of two ways: either if
the applicant indicated the name of a current employee as the source of a referral, or if a current
employee �claimed�that candidate as a referral (or both). In either case, once the applicant gets
to the interview stage, the information on the referral source is veri�ed by the corporation�s human
resources department.6
With the data, we calculate the number of applicants for each position and the portion of the
applicants that were referred.7 We have measures of the sta¤ level associated to each position,
which we group into �ve categories: support, junior, mid-level, senior, or executive sta¤. The data
also details the required years of job experience and education level. The outcomes of applicants,
including whether they received an interview or o¤er and whether they accepted the o¤er, are also
included. Lastly, the timing of the job posting appears in the data.
The estimation sample is restricted to include only job postings that result in a hire and those
6For many positions, if the employee referral leads to a hire and the newly hired worker stays at the organizationfor longer than six months, the employee who provided the referral receives a small monetary bonus. However, familymembers, company executives, direct supervisors or recruiters are not eligible for the award. We discuss below otherpotential sources of bias.
7For any given open position at the company, there may be multiple vacancies that the corporation is trying to�ll. However, 91 percent of positions are associated with a single vacancy. From here on, we refer to a �position�asa job posting for which there may be a single or several active vacancies.
11

that received more than one applicant. We remove internship postings and positions that were only
posted internally in the corporation. When former interns, former employees, or current employees
apply for a position, we include them in the calculation of the size of the applicant pool, but
we remove their individual observations from the estimation sample. If a former intern, former
employee, or current employee ultimately is hired for the position, then that job is excluded from
the sample. This re�ects our impression that these types of applicants likely experience di¤erent
hiring processes. We also exclude from our data postings for positions for which workers were hired
in bulk.
The �nal sample used in our analysis includes 62,127 job applicants for 340 positions. Therefore
the corporation hired 0.55% of applicants. Table 1 summarizes the key statistics of the applicant
data. Of all the applicants, 2.91% received interviews and 0.69% got job o¤ers. Almost 50% of the
applicants applied to junior sta¤ positions, followed by 27.8% to mid-level sta¤ positions, 18.4% for
senior sta¤ jobs, 2.79% for support sta¤ and 1.7% for executive positions. Comparatively, 39.0% of
jobs postings were for junior sta¤ positions, followed by 33.7% for mid-level sta¤, 20.3% for senior
sta¤, 4.8% for support sta¤, and 2.2% for executives. Similar patterns exist for the education
requirements, with 86.1% of postings requiring at least a Bachelor�s degree. The mean years of
experience required is 5.3. On average, 185 applicants apply for a given posting and 6.7 people
interview.
4.2 Employee data
The data also contain information on all of the hires from 2000 to the �rst half of 2011. The data
detail how the employee applied for the job, whether through internet job boards, the organization�s
website, college or career fairs, employee referrals, or other methods. As with the applicant data, in
order for a worker to be considered an employee referral, either the new hire must have reported the
referral when applying for the job, or a current employee must have referred that worker through
the company�s internal referral system (or both). The referral source is veri�ed by the corporation�s
human resources department at the interview stage of the hiring process. The employees�rank in
the organization, shifts, o¢ ce locations, full or part-time status, and on-leave status are observed at
six month intervals. If the worker leaves the organization or receives a promotion, this information
and the timing of the event appear in the data.
12
We restrict our estimation sample to include only �rst time hires because of likely di¤erences
in the referrals and promotions of former employees and interns compared to other employees. The
sample is also restricted to employees in the main location of the company. Interns are excluded from
the sample because they are never promoted and they are attached to the corporation for a brief
and externally determined period. Finally, we exclude the very top executives in the corporation.
The resulting estimation sample includes 1,774 unique employees, 29% of whom were referred
by current employees before being hired. Table 2 provides descriptive statistics for our employee
data estimation sample. Annual salary is reported in 2010 dollars. The salary �gures and the
rates reported in the top panel of Table 2 are based on our 12,447 pooled employee semiannual
observations. The mean and median annual salaries in the pooled data are similar, at $102,740 and
$97,377 2010 dollars respectively. The standard deviation of salaries is substantial, at $45,551, and
the salary range, from about $20,000 to over $300,000, is quite broad.
This salary range indicates a wide range of positions held in the corporation. Three percent of
observations represent employees who entered as support sta¤, 36 percent employees who entered as
junior sta¤, 41 percent employees who entered as mid-level sta¤, 18 percent employees who entered
as senior sta¤ and two percent employees who entered at the executive level. The overwhelming
majority of employees are full time, day shift workers who are not on leave. However, the sample
includes 50 night shift, 99 graveyard shift, 194 on leave and 111 part time employee-observations.
Of the 1,774 unique workers ever observed in our sample, 1,005 (57 percent) are observed to be
promoted during the sample window, and 638 (36 percent) are observed leaving the corporation.
The mean observed tenure in the organization by 2011 or exit, whichever occurs �rst, is 3.01
years. The mean time to promotion is 1.66 years. This averages the time between starting at the
corporation or between promotions for all occurrences of promotions in the data. For those that
receive a promotion, it takes on average 1.62 years to get promoted for the �rst time. In our sample
an average of 151 new employees join the corporation and 56 leave each year. Since our sample
contains only employees who began working at the organization in 2000 or later, the actual average
number of employees who leave each year is higher.
One meaningful shortcoming of our data in the context of the broad literature on employment
is the absence of data on hours of work. Our only measures of hours of work are indicators for
whether the employee is working part time and whether the employee is currently on leave. However,
13

there appears to be only modest variation in work hours in this sample. Roughly 97 percent of
our sample of semiannual observations represents full time workers. Of course, there could be
substantial unobserved hours variation among those workers whom the corporation classi�es as full
time. As a result of our lack of hours data, we are unable to infer hourly wages from annual salaries.
We consider annual salary (or log annual salary) as our primary outcome variable for the earnings
analysis portion of our empirical work.
In addition, the data do not include either education at the date of �rst employment or work
experience before applying to the organization. In order to estimate the log earnings regressions that
are standard in the literature, we require schooling and experience variables. Further, employees of
the corporation sta¤a wide range of positions, from support through executive, which clearly require
a wide range of schooling and experience levels. We address this data limitation using the sta¤
category indicators described above. Since we observe the education and experience requirements
for each job posting, we have a clear idea of the schooling and experience requirements associated
with each sta¤ level. We �nd that sta¤ categories summarize schooling and experience requirements
fairly e¤ectively. Hence we use sta¤ level at entry indicators in our earnings estimation to proxy
for the schooling, experience and experience squared regressors employed by the majority of the
literature.
A potentially important issue concerns the way in which an employee referral is recorded in our
data. As mentioned above, for an applicant (or new hire) to be considered an employee referral in
our data it must be the case that either the applicant indicated the referral source when applying
for the job, or a current employee referred that person for a position at the company through the
organization�s internal referral system (or both). There are several potential measurement issues
here, that may a¤ect our estimation results.
First, there may be under-reporting: someone may be hired through a referral even though the
referrer did not bother to �ll out the relevant form with the company�s referral system, and, in
addition, the referred worker did not indicate the referral source at the time of the application. The
combination of the two events seems unlikely: the referral recipient has the incentive to mention
the referral as it likely raises the chances of being o¤ered the job; the referrer, on the other hand,
has the incentive to �claim�the referral either for the monetary bonus or for other non-pecuniary
bene�ts. If there is any under-reporting, as long as it is uncorrelated with the referred worker�s
14
characteristics, then it will likely only lead to an attenuation bias in our estimates.8 Second,
and perhaps more importantly, it is possible that a current employee�s decision to formally refer
someone may be related to the candidate�s success during the various stages of the recruiting and
interviewing process for a given posting. This possibility is limited by the details of the referral
process: the latest that a current employee can �claim� someone as a referral is at the interview
stage, when the recruiter reviews the candidate�s initial application. Therefore, the referrer cannot
decide ex-post to refer someone, after observing whether the person is actually hired or not.
5 Empirical speci�cation and �ndings
5.1 Prediction 1: Referred candidates are more likely to be hired
A central prediction of Galenianos, as discussed above, is that referred workers are more likely to
be hired, all else equal. Our �rst empirical step is to test this prediction using our data on the
corporation�s applicant pool and resulting hires. Note that Castilla, Fernandez and Weinberg, and
Fernandez and Castilla all con�rm this prediction in their bank and call center single-�rm hiring
studies. Our test of this prediction extends the analysis to a broad range of skill levels and more
recent hiring data, and, in addition, informs our �ndings regarding longer-term worker experiences
for this particular corporation.
An initial perspective on the question of whether referrals increase the odds of being hired
is provided by the raw interview and job o¤er rates reported in Table 3. The most common
application source in the sample by far is internet job boards. Job board applicants constitute 60
percent of the applicant sample. Moving from left to right in the job board row of Table 3, these
job board applicants also constitute 41 percent of interviewees, 26 percent of o¤er recipients and
27 percent of �nal hires. In other words, there is a decisive downward trend over the hiring process
in the proportion of candidates achieving increasingly serious consideration who are sourced from
job boards. Similar downward trends over the hiring process can be seen for those who applied
through the corporation�s website and those who employed via their "own initiative". Referred
employees demonstrate the opposite pattern. While only 6 percent of applicants are referred by a
8However, if the employee�s decision to report a referral is correlated with something unobservable about thecandidate that in turn a¤ects her likelihood to be hired, then it will be di¢ cult to sign the direction of the bias.
15
current employee of the corporation, 21 percent of interviewees, 28 percent of those receiving o¤ers
and 29 percent of those who are hired are referred. The only other applicant sources showing this
type of increasing trajectory are the campus recruitment and "other" sources categories. Campus
recruitment is a very small proportion of this organization�s hiring e¤orts, and neither campus
recruitment nor other sources demonstrate as steep an increasing trajectory across the hiring process
as we observe for referred employees. The "other" category includes a variety of search methods that
comprised a small proportion of applicants. These methods include sta¢ ng agencies, job fairs, print
advertising, and professional a¢ liations. Though it is necessary to control for observable di¤erences
among applicants and positions before making �nal inferences regarding the relationship between
referrals and hiring outcomes, the unmanipulated data in Table 3 indicate a strong association
between referral and the odds of an interview or o¤er.
Next we adopt a more formal approach, modeling the probability of being hired by the corpo-
ration in a linear probability framework.9 Speci�cally, we estimate
Hij = XHi �
H + ZHj �H + f Ht �(tHj = t)g2010t=2006 + �
H�(tj > 2007) + "Hij ; (2)
where XHi is a vector of characteristics of applicant i including indicators for applicant source
among the set {referral, internet job board, corporate website, own initiative, other source}, ZHj
is a vector of characteristics of job posting j including number of applicants for the position,
proportion of the applicant pool that is referred, the sta¤ level of the position, the experience
requirement of the position and the educational requirement of the position, f�(tHj = t)g2010t=2005 is a
set of year indicators for the posting date of the position, �(tHj > 2007) is an indicator for whether
the position was posted since the start of the 2008-9 recession and "Hij is an idiosyncratic error
associated with the applicant i - posting j match.
The estimates generated using expression (2) are reported in Table 4. We estimate three versions
of the model. In the �rst, we de�ne outcome Hij as an indicator for whether applicant i was
interviewed for position j, and we estimate using the full sample of applicants.10 In the second,
9Our qualitative results are generally robust to a logistic speci�cation, and we include these estimates as appendixtables 1 and 2.10We do impose the sample requirement that we observe all variables included in the Table 4 estimation for the
applicant-position pair. The most restrictive of these sample requirements is that we observe the experience indicatedfor the position; 7302 of 69,429 applicants are applying to a job with missing experience requirement data.
16
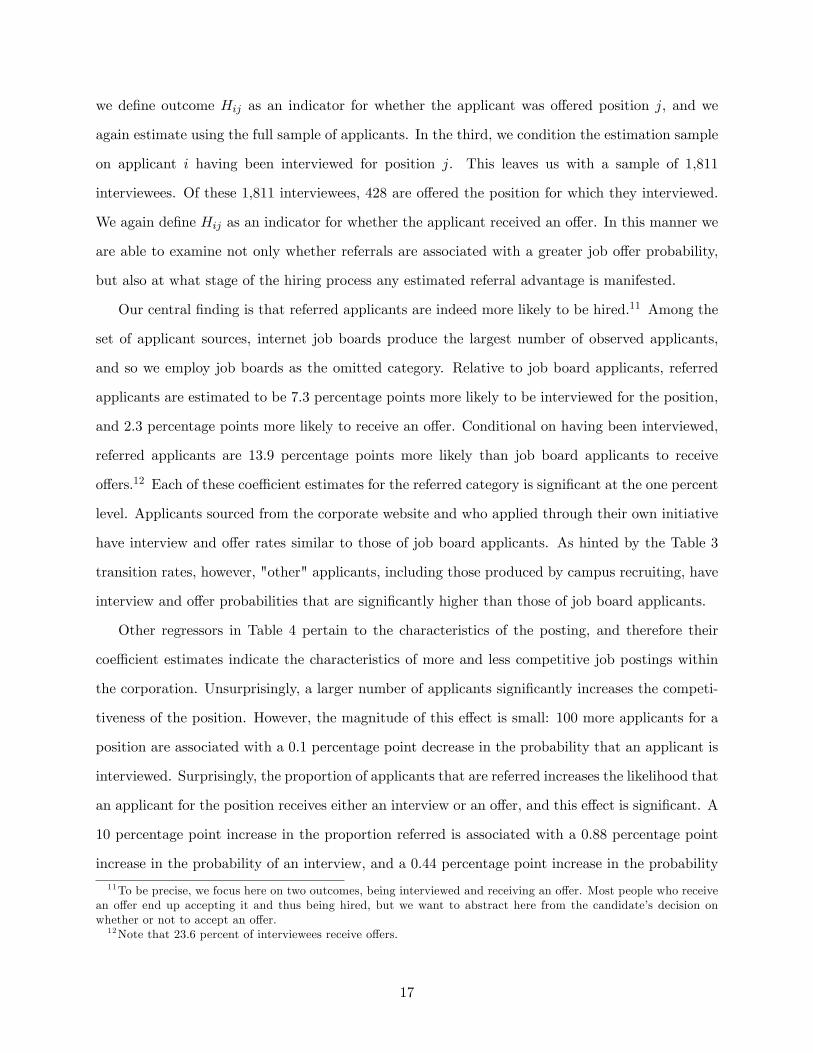
we de�ne outcome Hij as an indicator for whether the applicant was o¤ered position j, and we
again estimate using the full sample of applicants. In the third, we condition the estimation sample
on applicant i having been interviewed for position j. This leaves us with a sample of 1,811
interviewees. Of these 1,811 interviewees, 428 are o¤ered the position for which they interviewed.
We again de�ne Hij as an indicator for whether the applicant received an o¤er. In this manner we
are able to examine not only whether referrals are associated with a greater job o¤er probability,
but also at what stage of the hiring process any estimated referral advantage is manifested.
Our central �nding is that referred applicants are indeed more likely to be hired.11 Among the
set of applicant sources, internet job boards produce the largest number of observed applicants,
and so we employ job boards as the omitted category. Relative to job board applicants, referred
applicants are estimated to be 7.3 percentage points more likely to be interviewed for the position,
and 2.3 percentage points more likely to receive an o¤er. Conditional on having been interviewed,
referred applicants are 13.9 percentage points more likely than job board applicants to receive
o¤ers.12 Each of these coe¢ cient estimates for the referred category is signi�cant at the one percent
level. Applicants sourced from the corporate website and who applied through their own initiative
have interview and o¤er rates similar to those of job board applicants. As hinted by the Table 3
transition rates, however, "other" applicants, including those produced by campus recruiting, have
interview and o¤er probabilities that are signi�cantly higher than those of job board applicants.
Other regressors in Table 4 pertain to the characteristics of the posting, and therefore their
coe¢ cient estimates indicate the characteristics of more and less competitive job postings within
the corporation. Unsurprisingly, a larger number of applicants signi�cantly increases the competi-
tiveness of the position. However, the magnitude of this e¤ect is small: 100 more applicants for a
position are associated with a 0.1 percentage point decrease in the probability that an applicant is
interviewed. Surprisingly, the proportion of applicants that are referred increases the likelihood that
an applicant for the position receives either an interview or an o¤er, and this e¤ect is signi�cant. A
10 percentage point increase in the proportion referred is associated with a 0.88 percentage point
increase in the probability of an interview, and a 0.44 percentage point increase in the probability
11To be precise, we focus here on two outcomes, being interviewed and receiving an o¤er. Most people who receivean o¤er end up accepting it and thus being hired, but we want to abstract here from the candidate�s decision onwhether or not to accept an o¤er.12Note that 23.6 percent of interviewees receive o¤ers.
17
of an o¤er.
Sta¤ level coe¢ cient estimates indicate that support sta¤ positions are signi�cantly less com-
petitive than mid-level sta¤ positions, but that junior, senior and executive level sta¤ positions are
comparably competitive to mid-level sta¤ positions. Similarly, positions that require a high school
diploma are signi�cantly less competitive than positions that require a college degree, particularly
at the interview stage, while associate�s degree, college degree and other education requirement
positions are similarly competitive. However, we do �nd that positions that require a graduate
degree are signi�cantly more competitive than positions that require a college degree, particularly
at the interview stage.
Screening from the application to interview stage becomes stronger over time in our data, with
the probability of being interviewed conditional on applying decreasing by 0.5 percentage points
per year. Yet the probability of receiving an o¤er conditional on having been interviewed increases
signi�cantly over time, and the overall o¤er probability for applicants does not vary signi�cantly
over time. Finally, we see a lower probability for the applicant of being interviewed following
the start of the recession, with, again, no signi�cant change in the overall probability of an o¤er.
Together these estimates suggest that screening resources are being shifted to earlier points in the
hiring process over the course of the panel.
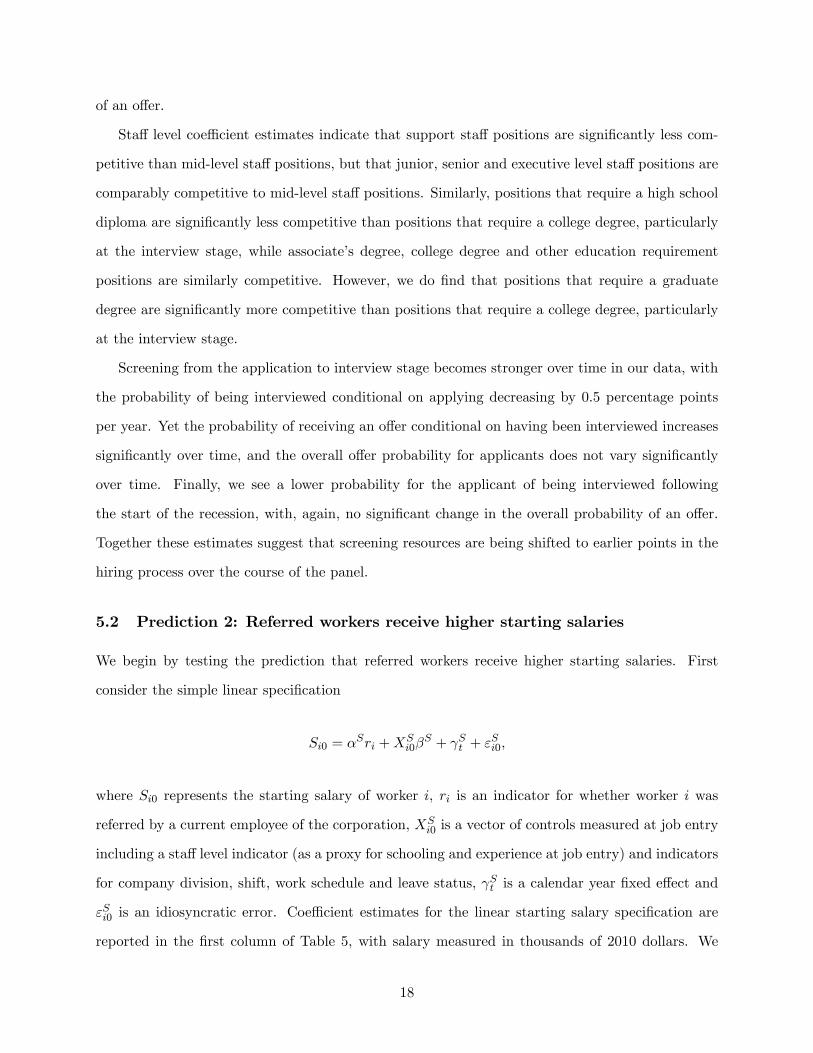
5.2 Prediction 2: Referred workers receive higher starting salaries
We begin by testing the prediction that referred workers receive higher starting salaries. First
consider the simple linear speci�cation
Si0 = �Sri +X
Si0�
S + St + "Si0;
where Si0 represents the starting salary of worker i, ri is an indicator for whether worker i was
referred by a current employee of the corporation, XSi0 is a vector of controls measured at job entry
including a sta¤ level indicator (as a proxy for schooling and experience at job entry) and indicators
for company division, shift, work schedule and leave status, St is a calendar year �xed e¤ect and
"Si0 is an idiosyncratic error. Coe¢ cient estimates for the linear starting salary speci�cation are
reported in the �rst column of Table 5, with salary measured in thousands of 2010 dollars. We
18

�nd that having been referred is associated with a $1,326 salary premium that is close to being
statistically signi�cant at the conventional levels (the p-value equals 0.107).
A more conventional speci�cation in the context of the literature is the following log earnings
regression:
lnSit = �L0 ri + �
L1 � it + �
L2 ri� it + �
L3 �
2it + �
L4 ri�
2it +X
Lit�
L + Lt + "Lit; (3)
where t represents calendar time and � it indicates tenure in the corporation for employee i at time t.
Again, ri is an indicator for whether worker i was referred by a current employee of the corporation,
XLit is a vector of controls including entering sta¤ level indicators (which again proxy for schooling
and experience at job entry) and indicators for entering company division, shift, work schedule and
leave status, Lt is a calendar year �xed e¤ect and "Lit is an idiosyncratic error. This log earnings
regression is estimated using pooled data on employee half years, and allows us both to compare
starting salaries for the referred and non-referred and to follow the e¤ect of referral on employees�
salary trajectories over time.
The estimated coe¢ cient on referral in the log salary regression, reported in Table 6, indicates
a 2.1 percent starting salary premium for referred workers. The coe¢ cient is signi�cant at the
one percent level. The magnitudes of the referral coe¢ cient estimates in the linear and log salary
regressions are roughly consistent, given mean and median salaries of $102,740 and $97,377, respec-
tively. Of course, there is wide dispersion in employee salaries in this corporation. Hence it is useful
to consider the initial referral premium in both level and percentage terms, and the combination
of the linear and the conventional log salary estimates allows us to do so. In sum, we �nd that an
employee referral is associated with a starting salary premium of 2.1 percent, or more than $1,300.
This result bears out the predictions of not only Dustmann et al., but also Simon and Warner and
Galenianos.13
5.3 Prediction 3: The referred worker salary advantage diminishes over time
As discussed in Section 3.6, however, current theory of labor market referrals predicts that the
referral e¤ect will dissipate over time, and the salaries of referred and non-referred workers who
13Simon and Warner also show evidence of higher initial wages when recollected jobs were based on referrals intheir retrospective 1972 survey of scientists and engineers.
19

remain with the corporation will converge. The log salary estimates reported in Table 6 provide a
test of the referred salary premium�s time trajectory.
We �nd that the referral e¤ect does indeed diminish over time. In all linear speci�cations
in Table 6, �2; the coe¢ cient on the interaction between the referral indicator and tenure in the
organization, is negative and signi�cant at the one percent level. In the quadratic speci�cation with
tenure squared, reported in column (3), the estimated values of �2 and �4 (i.e., the coe¢ cients on
the referral indicator multiplied by tenure and tenure squared) are both negative but the coe¢ cients
are not estimated very precisely.
Figure 1 depicts predicted salaries for referred and non-referred workers as tenure increases.
While the referred salary initially lies above the non-referred salary, referred and non-referred
salaries are roughly equivalent after three years of tenure with the corporation. Indeed, 95 percent
con�dence intervals only rule out common referred and non-referred salary levels for the �rst two
years of tenure in the corporation. This convergence of salaries after an initial advantage for the
referred is consistent with the theoretical predictions of the Dustmann et al. and Simon and Warner
models of labor market referrals.14
From six years of tenure on, the estimates predict a signi�cant salary advantage for the non-
referred. It is not clear what to make of this eventual non-referred advantage in the context of
the theory discussed earlier. Models like Dustmann et al. and Simon and Warner predict eventual
convergence in referred and non-referred salaries, but do not include a source of advantage for
non-referred workers who stay with the corporation. As we show in Section 5.4 below, we also �nd
that referred employees experience signi�cantly lower turnover than non-referred. Taken together,
these �ndings suggest a role for di¤erential investments in �rm-speci�c human capital, or perhaps
for non-pecuniary gains related to di¤erential a¢ nity between employees already at the �rm and
referred vs. non-referred hires. A valuable innovation in the theory of labor market referrals, then,
might be an extension of existing models that accounted for these observed patterns.
Finally, it is also evident in Figure 1 that all employees of the corporation enjoy a steep salary
increase with tenure, which appears to be the dominant feature of salary trajectories in this corpo-
14 It is important to note here that the model discussed in Section 3.2 and subsequent sub-Sections incorporatesthe e¤ect of di¤erential separations for referred and non-referred workers on salary gaps over time. Therefore, in theempirical exercise we do not need to correct our salary trajectory estimates for di¤erential attrition as the model�sprediction is conditional on turnover. We discuss this issue further in Section 5.4.
20
ration for both worker categories.
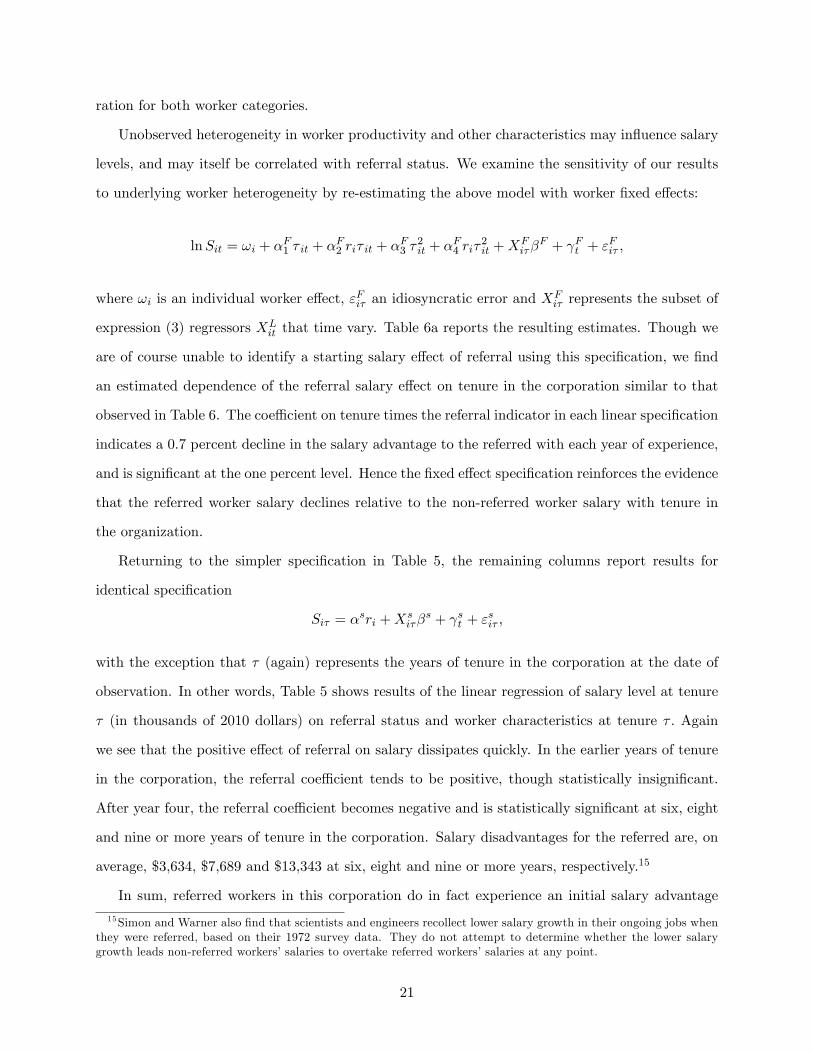
Unobserved heterogeneity in worker productivity and other characteristics may in�uence salary
levels, and may itself be correlated with referral status. We examine the sensitivity of our results
to underlying worker heterogeneity by re-estimating the above model with worker �xed e¤ects:
lnSit = !i + �F1 � it + �
F2 ri� it + �
F3 �
2it + �
F4 ri�
2it +X
Fi��
F + Ft + "Fi� ;
where !i is an individual worker e¤ect, "Fi� an idiosyncratic error and XFi� represents the subset of
expression (3) regressors XLit that time vary. Table 6a reports the resulting estimates. Though we
are of course unable to identify a starting salary e¤ect of referral using this speci�cation, we �nd
an estimated dependence of the referral salary e¤ect on tenure in the corporation similar to that
observed in Table 6. The coe¢ cient on tenure times the referral indicator in each linear speci�cation
indicates a 0.7 percent decline in the salary advantage to the referred with each year of experience,
and is signi�cant at the one percent level. Hence the �xed e¤ect speci�cation reinforces the evidence
that the referred worker salary declines relative to the non-referred worker salary with tenure in
the organization.
Returning to the simpler speci�cation in Table 5, the remaining columns report results for
identical speci�cation
Si� = �sri +X
si��
s + st + "si� ;
with the exception that � (again) represents the years of tenure in the corporation at the date of
observation. In other words, Table 5 shows results of the linear regression of salary level at tenure
� (in thousands of 2010 dollars) on referral status and worker characteristics at tenure � : Again
we see that the positive e¤ect of referral on salary dissipates quickly. In the earlier years of tenure
in the corporation, the referral coe¢ cient tends to be positive, though statistically insigni�cant.
After year four, the referral coe¢ cient becomes negative and is statistically signi�cant at six, eight
and nine or more years of tenure in the corporation. Salary disadvantages for the referred are, on
average, $3,634, $7,689 and $13,343 at six, eight and nine or more years, respectively.15
In sum, referred workers in this corporation do in fact experience an initial salary advantage
15Simon and Warner also �nd that scientists and engineers recollect lower salary growth in their ongoing jobs whenthey were referred, based on their 1972 survey data. They do not attempt to determine whether the lower salarygrowth leads non-referred workers�salaries to overtake referred workers�salaries at any point.
21

followed by a decline to non-referred salary levels, con�rming predictions of theoretical referral
models such as Simon and Warner and Dustmann et al. However, we also �nd a signi�cant and
economically substantial salary advantage for non-referred workers after �ve years. This is certainly
not consistent with the predictions of Simon and Warner, it does not appear to be consistent with
the predictions of Dustmann et al, and in general it is not clear how an eventual advantage for
non-referred workers who remain with the organization might be aligned with existing theory.
5.4 Prediction 4: Turnover is lower for referred workers
Next we turn to the theoretical prediction, reviewed in Section 3.7, that referred workers experience
lower rates of turnover after joining a �rm. We model separation from the corporation using the
discrete time proportional hazard framework found in Prentice-Gloeckler (1978) and Meyer (1990).
The instantaneous separation hazard at tenure � is
�Di� = �D0 (�) exp(Z
Di� �
D); (4)
where �D0 (�) is a baseline match dissolution hazard that is permitted to vary with tenure in the
corporation and
ZDi� �D = �D0 ri + �
D1 � + �
D2 ri� + eZDi��D:
Here eZDi� includes entering salary, company division and sta¤ level, current shift, leave status, parttime status, and in some speci�cations some subset of the interactions of starting sta¤ level and
the referral indicator, an indicator for recession/post-recession dates and the interaction of the
recession/post-recession indicator with the referral indicator. We are primarily interested in the
e¤ect of referral on the separation hazard, and any variation in the referral e¤ect on separation as
tenure increases.
Table 7 reports estimates of hazard model (4). We specify the tenure dependence of baseline
hazard �D0 (�) in one of two ways. In Table 7 speci�cations (1) and (3) through (8), we impose a
linear tenure dependence. Speci�cation (2) includes separate dummies for each observed 6 month
interval with the corporation, which we refer to as the fully nonparametric baseline hazard model.
Comparing the estimates in speci�cations (1) and (2), it appears that allowing a very �exible tenure
22

dependence in the baseline hazard has little e¤ect on the estimates. Further, we have estimated
speci�cations (3) through (8) with both linear and fully nonparametric assumptions on the baseline
hazard, and our qualitative results are essentially unchanged. In the interest of simplicity, we report
speci�cation (3) through (8) estimates assuming a linear baseline hazard.
In addition, the estimated values reported in Table 7 are in terms of exp(�), for ease of inter-
pretation. Where the regressor is an indicator variable, given (4), the reported exp(�) value can be
interpreted as the proportional change in the hazard associated with moving from a regressor value
of zero to a regressor value of one. This is measured relative to a baseline hazard, which represents
the separation hazard of a full time, day shift, not on leave, mid-level, non-referred employee who
has just entered the corporation during the pre-recession period. For example, the exp(�) value
in speci�cation (1) associated with an on leave worker indicates that, perhaps not surprisingly, a
worker currently on leave faces roughly three times the separation hazard of an employee who is
not currently on leave, all else equal.
Table 7 estimates indicate that referred workers do indeed experience lower separation rates
from the corporation. Speci�cations (1) and (2) show that referred workers are about 85 percent
as likely to leave the corporation as non-referred workers, and these �ndings are roughly signi�cant
at the ten percent level in each case.16
We �nd that most of this referral e¤ect arises from the pre-recession period. Turning to speci�ca-
tion (7), we see that pre-recession referred workers are 76 percent as likely to leave the organization
as pre-recession non-referred workers, and this e¤ect has a p-value of 0.045. However, the referral
e¤ect on separations for those hired after the start of the recession is much more moderate. For
people hired after 2007, referred workers are only 96 percent as likely to leave the corporation
compared to non-referred people, and this di¤erence is not statistically signi�cant. Similarly, if
one estimates using only the pre-recession sample, as in speci�cation (5), one �nds that referred
workers are 77 percent as likely to leave the corporation as non-referred workers, and the p-value
for this estimate is 0.056. The period beginning with the recession was one of meaningful changes
in employment practices for this particular corporation, as for many others. We �nd substantially
decreased turnover from the start of the recession, and decidedly di¤erent hiring practices. Thus
16Simon and Warner �nd that scientists and engineers in their 1972 retrospective survey recall longer job durationwhen they were referred, all else equal.
23

it is not surprising that employee referrals appear to function di¤erently for this corporation from
the start of the recession.
One might be concerned, given the predicted and observed tenure di¤erential between referred
and non-referred workers, that estimates of the salary dynamics of retained workers would re�ect
confounding dynamic selection e¤ects. It may be helpful to note at this point that the goal of
the salary trajectory estimates in Section 5.3 is to test the equilibrium predictions of models like
Dustmann et al. and Simon and Warner. Their salary trajectory predictions pertain explicitly
to the subset of referred and non-referred workers in ongoing matches, whose empirical analog is
the set of referred and non-referred employees who are retained by the corporation. Hence our
estimates of the salary trajectories of retained employees are, arguably, the appropriate objects
with which to test these predictions. Existing theory has limited or no predictions for the average
salary trajectory of all workers who were referred to a match and then stayed or left relative to the
average salary trajectory of all workers who were not referred to a match and then stayed or left.
Similarly, our estimates have nothing to say about average salary trajectories that are unconditional
on turnover.
5.5 Prediction 5: The referred worker turnover advantage also diminishes over
time
The signi�cant negative association between employee referrals and separation from the corporation
does not appear to diminish with tenure, despite the predictions of the theory. The general �ndings
regarding the relationship between tenure and separation in Table 7 appear to be that longer-
tenured workers are signi�cantly less likely to leave the corporation from the start of the recession
on, but that tenure in the corporation bears no signi�cant relationship to departure preceding the
recession. Speci�cation (3) adds a referral indicator times tenure regressor to the estimation, and
based on the speci�cation (3) estimates we see that the separation hazard increment associated
with referral does not appear to change in any noticeable way with tenure. Despite the (reasonably
intuitive) theoretical prediction that the lower departure rates for referred workers diminish over
time as the surviving non-referred workers become a more selected and better-matched group, the
empirical results indicate that, for this corporation at least, the decreased separation rate associated
with employee referrals is relatively long-lasting.
24
5.6 Prediction 6: Referred workers have higher expected productivity
Theoretical predictions regarding referrals generally emphasize higher initial employer approxima-
tions of worker productivity for workers hired through referrals than for workers not hired through
referrals. Though both worker productivity and employers�inferences regarding workers�produc-
tivity are di¢ cult to measure, an employer�s promotion decisions may o¤er a source of information
on perceived worker e¤ectiveness. Our dataset includes promotion indicators at six month inter-
vals. More than half of our estimation sample employees receive a promotion at some point in the
sample window.
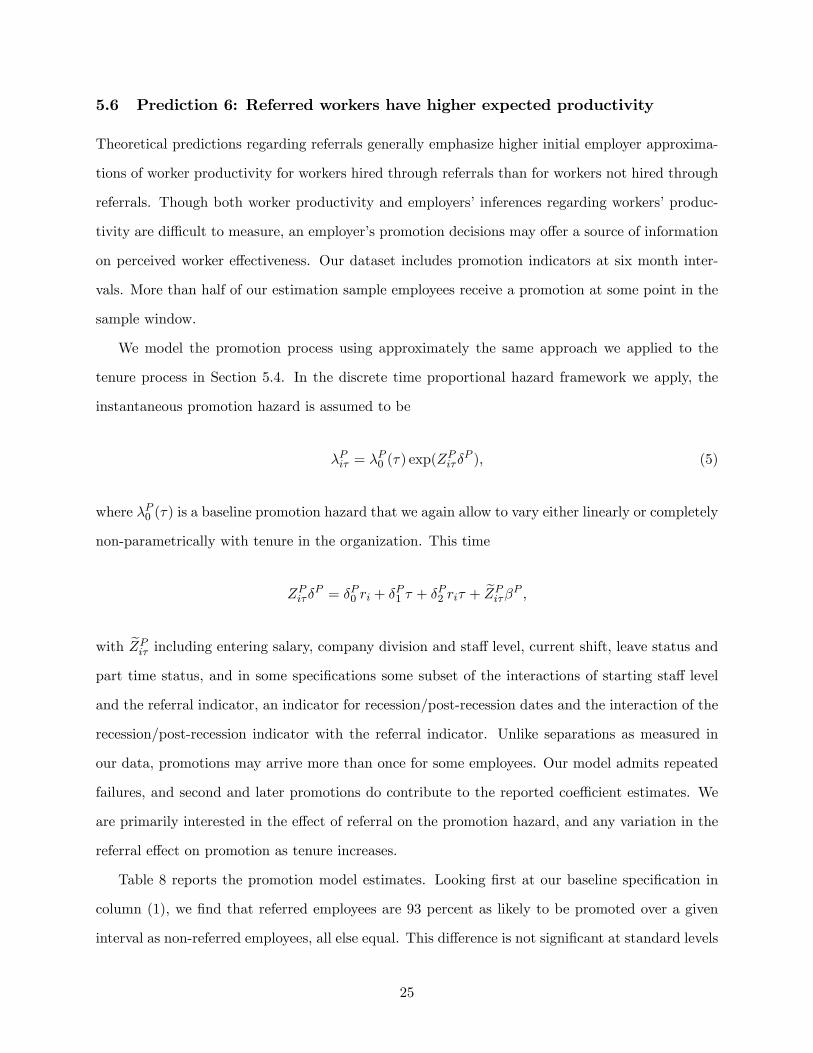
We model the promotion process using approximately the same approach we applied to the
tenure process in Section 5.4. In the discrete time proportional hazard framework we apply, the
instantaneous promotion hazard is assumed to be
�Pi� = �P0 (�) exp(Z
Pi��
P ); (5)
where �P0 (�) is a baseline promotion hazard that we again allow to vary either linearly or completely
non-parametrically with tenure in the organization. This time
ZPi��P = �P0 ri + �
P1 � + �
P2 ri� + eZPi��P ;
with eZPi� including entering salary, company division and sta¤ level, current shift, leave status andpart time status, and in some speci�cations some subset of the interactions of starting sta¤ level
and the referral indicator, an indicator for recession/post-recession dates and the interaction of the
recession/post-recession indicator with the referral indicator. Unlike separations as measured in
our data, promotions may arrive more than once for some employees. Our model admits repeated
failures, and second and later promotions do contribute to the reported coe¢ cient estimates. We
are primarily interested in the e¤ect of referral on the promotion hazard, and any variation in the
referral e¤ect on promotion as tenure increases.
Table 8 reports the promotion model estimates. Looking �rst at our baseline speci�cation in
column (1), we �nd that referred employees are 93 percent as likely to be promoted over a given
interval as non-referred employees, all else equal. This di¤erence is not signi�cant at standard levels
25
of con�dence. So, despite the predictions of higher initial perceived productivity that arise from the
theory, we cannot reject the hypothesis of equal promotion rates for the referred and non-referred,
and, if anything, referred employees achieve promotion more slowly than their non-referred peers.
Instead, other employee characteristics appear to drive promotion. Employees with longer
tenure in the corporation are signi�cantly more likely to be promoted. One year of tenure increases
the promotion probability over the next six months by �ve percentage points, all else equal. Em-
ployees with higher starting salaries, conditioning on sta¤ level, are more likely to be promoted.
Not surprisingly, full time, day shift, and active status workers are more likely to be promoted. The
relationship between sta¤ level and promotion rate is non-monotonic. Support sta¤ are promoted
at only 52 percent the rate of mid-level sta¤, and this di¤erence has a p-value of 0.003. Junior and
executive sta¤ are promoted at insigni�cantly higher rates than mid-level sta¤. However, senior
sta¤ are promoted at only 84 percent of the rate of mid-level sta¤, and this di¤erence is signi�cant
at the ten percent level. Finally, the rate of promotions at this corporation increased following the
start of the recession.
As in the case of separation, speci�cation (2) indicates that the promotion results described in
this section are robust to linear and non-parametric speci�cations of the tenure dependence of the
hazard. Turning to speci�cation (3), we �nd no signi�cant di¤erence in the tenure dependence of
promotion rates between the referred and non-referred. Theoretical predictions regarding whether
the initial higher productivity of referred workers would be sustained are unclear. In any case, the
data for this corporation do not support a meaningful di¤erence in employers�promotion decisions
for referred and non-referred workers over time.
Of course, the extent to which the promotion results provide a test of the theoretical predic-
tions regarding perceived worker productivity depend critically on the extent to which promotion
decisions are a valid measure of perceived worker productivity. To the extent that promotions are
a valid perceived productivity measure, our results do not support the claim that referred work-
ers�perceived initial productivity is signi�cantly higher than non-referred workers�perceived initial
productivity.
26
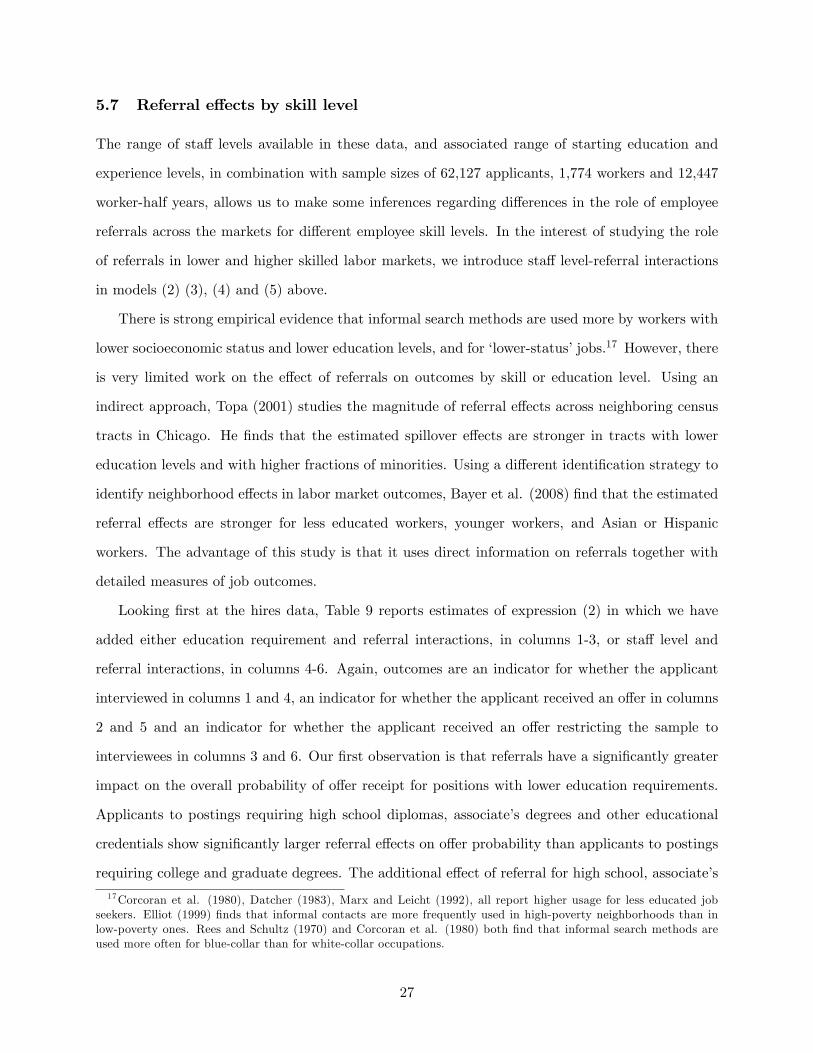
5.7 Referral e¤ects by skill level
The range of sta¤ levels available in these data, and associated range of starting education and
experience levels, in combination with sample sizes of 62,127 applicants, 1,774 workers and 12,447
worker-half years, allows us to make some inferences regarding di¤erences in the role of employee
referrals across the markets for di¤erent employee skill levels. In the interest of studying the role
of referrals in lower and higher skilled labor markets, we introduce sta¤ level-referral interactions
in models (2) (3), (4) and (5) above.
There is strong empirical evidence that informal search methods are used more by workers with
lower socioeconomic status and lower education levels, and for �lower-status�jobs.17 However, there
is very limited work on the e¤ect of referrals on outcomes by skill or education level. Using an
indirect approach, Topa (2001) studies the magnitude of referral e¤ects across neighboring census
tracts in Chicago. He �nds that the estimated spillover e¤ects are stronger in tracts with lower
education levels and with higher fractions of minorities. Using a di¤erent identi�cation strategy to
identify neighborhood e¤ects in labor market outcomes, Bayer et al. (2008) �nd that the estimated
referral e¤ects are stronger for less educated workers, younger workers, and Asian or Hispanic
workers. The advantage of this study is that it uses direct information on referrals together with
detailed measures of job outcomes.
Looking �rst at the hires data, Table 9 reports estimates of expression (2) in which we have
added either education requirement and referral interactions, in columns 1-3, or sta¤ level and
referral interactions, in columns 4-6. Again, outcomes are an indicator for whether the applicant
interviewed in columns 1 and 4, an indicator for whether the applicant received an o¤er in columns
2 and 5 and an indicator for whether the applicant received an o¤er restricting the sample to
interviewees in columns 3 and 6. Our �rst observation is that referrals have a signi�cantly greater
impact on the overall probability of o¤er receipt for positions with lower education requirements.
Applicants to postings requiring high school diplomas, associate�s degrees and other educational
credentials show signi�cantly larger referral e¤ects on o¤er probability than applicants to postings
requiring college and graduate degrees. The additional e¤ect of referral for high school, associate�s
17Corcoran et al. (1980), Datcher (1983), Marx and Leicht (1992), all report higher usage for less educated jobseekers. Elliot (1999) �nds that informal contacts are more frequently used in high-poverty neighborhoods than inlow-poverty ones. Rees and Schultz (1970) and Corcoran et al. (1980) both �nd that informal search methods areused more often for blue-collar than for white-collar occupations.
27

degree and other requirement postings relative to college postings is 2, 4 and 3 percentage points,
respectively, and each estimate is signi�cant at the �ve or the one percent level. The high school
and other education requirement e¤ects appear to operate mainly through the e¤ect of the referral
on being interviewed, while the associate�s degree e¤ect operates primarily between the interview
and the o¤er stage.
Secondly, referrals also have a signi�cantly larger positive impact on the probability of being
interviewed for positions with a graduate rather than college degree requirement. Thus, referral
e¤ects seem to have a U-shaped relationship with skill level. We conjecture that the corporation
may rely on referrals for di¤erent reasons at di¤erent points of the skill distribution. For positions
with lower education requirements, the corporation may use referrals to detect worker traits such
as reliability, punctuality, etc. At the high end of the skill distribution, the corporation may be
looking for things like initiative, leadership, and strategic thinking. This would certainly be an
interesting area for future research.
Turning to the sta¤ levels, referrals have a similar relationship to o¤er receipt for support,
junior and senior sta¤ as for mid-level sta¤. Point estimates for support, junior and senior sta¤
indicate a one percentage point smaller referral e¤ect than for mid-level sta¤, and are in some cases
signi�cant.18 For executives, however, the referral e¤ect on o¤er receipt is 4.5 percentage points
higher than the referral e¤ect on o¤er receipt for mid-level sta¤, and this di¤erence is signi�cant at
the one percent level. Estimated increments to the referral e¤ect for executives relative to mid-level
sta¤ are large at both the interview and o¤er stages. Thus the estimates suggest that referrals play
a substantially di¤erent role in the hiring of executives than in the hiring of rank-and-�le sta¤, and
are again consistent with the idea that the corporation may use referrals to detect qualities such
sh leadership and strategic thinking.
Analysis of referral e¤ects by sta¤ level in the employee log earnings regression reveals a non-
monotonic pattern. Support sta¤ experience a particularly strong salary referral advantage relative
to mid-level sta¤. Junior sta¤ and executives show signi�cantly lower initial salary referral ad-
vantages than the reference category. The estimated referral advantage of 3.4 percent of initial
salary is o¤set for junior sta¤ by a signi�cant 2.5 percent, indicating that junior sta¤ have a net
18The point estimates also indicate a large negative e¤ect of referral at the interview to o¤er stage for supportsta¤, but, given the small and insigni�cant di¤erence in the overall referral e¤ect on o¤ers for support and mid-levelsta¤, it is not clear how much to make of this result.
28

referral advantage of only about 0.9 percent of initial salary. More strikingly, the coe¢ cient on
the referral-executive interaction is -7.9 percent of starting salary, and is signi�cant at the one
percent level. On net, the referral e¤ect on initial salary for executives is -4.5 percent relative to
non-referred executives, and it is signi�cantly di¤erent from zero. Hence for executives there seems
to be a negative e¤ect of referrals on initial salary.19 While the estimate for junior sta¤ is not far
out of line with the referral e¤ects for the other sta¤ levels, the estimates indicate decisively that
referrals play a di¤erent role in determining executive salaries.
Returning to the separation results in Table 7, we �nd that the negative separation e¤ect of
referral we observe for the full sample appears to be largest among the support sta¤. The Table
7 column (4) point estimates for the referral and the referral times the support sta¤ indicator
interaction together indicate that referred support sta¤ are eight percent as likely to leave the
corporation as non-referred mid-level sta¤, and this estimated di¤erence is signi�cant at the �ve
percent level. Further, the association between referral and the probability of separation increases
roughly monotonically in sta¤ level, going from a large negative association at the support sta¤ level
to a large positive association for executives. While support sta¤ are much less likely to separate
from the corporation if referred, referred junior, mid-level and senior sta¤ are only somewhat less
likely to separate if referred, with separation rates relative to non-referred mid-level sta¤ of 87 to 88
percent. Echoing the results for initial salary, executives also demonstrate a unique referral-tenure
relationship. We �nd that referred executives are substantially more likely to leave the corporation
than non-referred mid-level sta¤. Based on the point estimates, referred executives are more than
twice as likely to leave as non-referred mid-level sta¤. However, as a result of the relatively small
sample of referred executives, this di¤erence is not quite signi�cant at conventional levels. Overall,
the separation results indicate large di¤erences in the role of employee referral in labor markets for
di¤erent skill levels, with a large positive association between referral and tenure in lower-skilled
jobs and some evidence of a negative association between referral and tenure in higher-skilled jobs.
Moving to the promotion results in Table 8, we observe no signi�cant di¤erences between referred
and non-referred promotion rates by sta¤ level. In general, promotion practices appear to be quite
similar for the referred and the non-referred.19There are only 9 unique executive referrals and 57 unique executive non-referrals in our data, therefore it is not
feasible to study the entire salary trajectory for executives separately from other employees.
29
In sum, employee referrals are associated with strong positive tenure e¤ects for lower skilled
workers. For most rank-and-�le workers they also tend to be associated with higher starting salaries.
However, referrals appear to function quite di¤erently in the market for executives. Their referrals
are associated with, if anything, shorter -lived matches and lower starting salaries. Our estimates
clearly indicate di¤erent roles for referrals across markets for di¤erent worker skill levels.20
Finally, we have also run our empirical analysis separately for some of the largest divisions within
the company, to see whether our results are robust to possibly di¤erent management practices
within the company. Our �ndings are qualitatively very similar across the four largest divisions of
the corporation, with some variation in the size of the estimated referral e¤ects on outcomes. For
instance, the estimated initial salary advantage for referred vs. non-referred workers ranges between
0.8 and 5.4 percent of initial salary across divisions. There is also some evidence in one division
that referrals are associated to a higher promotion hazard, suggesting higher perceived productivity
for referred hires. Overall, the results are remarkably similar across the entire corporation.
6 Conclusion
The limited nature of data on employment referrals in large business and household surveys has
so far limited our understanding of the relationships among employment referrals, match quality,
wage trajectories and turnover. Using a new �rm-level dataset that includes explicit information
on whether a worker was referred by a current employee of the company, we are able to provide
rich detail on these empirical relationships for a single mid-to-large corporation, and to test various
predictions of the theoretical literature on labor market referrals.
We �nd that referred workers enter at higher wage levels, all else equal, but that the referred
wage advantage dissipates by the sixth year of employment, after which the referral-wage rela-
tionship is reversed. Referred workers experience substantially longer tenure in the corporation.
Despite higher predicted productivity for referred workers in the theoretical literature, we �nd, if
anything, slightly slower promotion rates for referred than for non-referred workers. Finally, the
wide range of skill and experience levels represented in this corporation permit detailed analysis of
20One caveat is that, as noted above, we have relatively few observations for executives in our sample. Further,some of our results �for instance on the negative association between referrals and job tenure for executives �seemto be driven mostly by the post-recession period.
30

the role of referrals for workers from support sta¤ to company executives.
Our �ndings suggest a few interesting avenues for further research. First, we �nd that referred
workers tend to stay longer with the company, but eventually experience slower salary growth than
non-referred ones. This seems puzzling. As we discussed above, one possible explanation is that
referred workers may invest relatively more in �rm-speci�c human capital, which would limit their
outside options over time and therefore reduce their bargaining power within the corporation. An-
other possibility is that the eventual salary disadvantage is compensated by non-pecuniary aspects
of the job match, such as a more enjoyable work environment because the referred worker has social
contacts within the corporation. We plan to explore this possibility in future work by matching
demographic information for the referrer and the referred, and constructing measures of a¢ nity
between the referred worker�s attributes and his or her co-workers.
Second, we �nd some evidence of a U-shaped relationship between education or skill level, and
the size of the referral e¤ect on hiring outcomes. We conjecture that this non-monotonic relationship
may be explained by di¤erent roles played by referrals at di¤erent points in the skill distribution.
At low education or skill levels, referrals may be used to better detect desirable worker traits such
as punctuality and reliability, whereas at the higher end of the distribution they may be used to
screen for traits such as leadership and strategic vision. This could be another interesting area for
future research.
31
References
[1] Aslund, Olof and Oskar Nordstrom Skans (2009): nWill I See You at Work? Ethnic WorkplaceSegregation in Sweden 1985-2002", Industrial and Labor Relations Review, forthcoming
[2] Bayer, Patrick, Stephen L. Ross and Giorgio Topa (2008). "Place of work and place of residence:informal hiring networks and labor market outcomes." Journal of Political Economy 116 (6),1150-1196.
[3] Castilla, Emilio (2005). "Social networks and employee performance in a call center." AmericanJournal of Sociology 110 (5), 1243-1283.
[4] Corcoran, Mary, Linda Datcher and Greg Duncan (1980): "Information and In�uence Net-works in Labor Markets," in Five Thousand American Families: Patterns of EconomicProgress, edited by Greg Duncan and James Morgan, vol. 7, 1-37, Ann Arbor, MI: InstituteFor Social Research.
[5] Datcher, Linda. (1983): "The Impact of Informal Networks on Quit Behavior," The Review ofEconomics and Statistics, 65 (3), 491-495.
[6] Datcher, Linda Loury. (2006): "Some Contacts are More Equal than Others: Informal Net-works, Job Tenure, and Wages," Journal of Labor Economics, 24 (2), 299- 318.
[7] Dustmann, Christian, Albrecht Glitz and Uta Schoenberg (2012). "Referral-based job searchnetworks," manuscript, University College London.
[8] Fernandez, Roberto M., and Emilio J. Castilla. 2001. �How Much Is That Network Worth?Social Capital Returns for Referring Prospective Hires.�Pp. 85�104 in Social Capital: TheoryResearch, edited by Karen Cook, Nan Lin, and Ronald Burt.Hawthorne, N.Y.: Aldine DeGruyter.
[9] Fernandez, Roberto M., Emilio J. Castilla, and Paul Moore. 2000. �Social Capital at Work:Networks and Employment at a Phone Center.�American Journal of Sociology, 105 (5): 1288�1356.
[10] Fernandez, Roberto and Nancy Weineberg (1997). "Sifting and sorting: personal contacts andhiring in a retail bank." American Sociological Review 62, 883-902
[11] Galenianos, Manolis (2011), "Hiring Through Referrals," manuscript, Penn State University.
[12] Giuliano, Laura, David I. Levine, and Jonathan Leonard (2009): "Manager Race and the Raceof New Hires", Journal of Labor Economics, 27(4), 589-632
[13] Hellerstein, Judith, Melissa McInerney, and David Neumark (2008): "Measuring the Impor-tance of Labor Market Networks", IZA Discussion Paper No. 3750.
[14] Holzer, Harry J. (1987a): "Informal Job Search and Black Youth Unemployment," The Amer-ican Economic Review, 77 (3), 446-452.
[15] Holzer, Harry J. (1987b): "Hiring Procedures in the Firm: Their Economic Determinantsand Outcomes", in Human Resources and the Performance of the Firm, edited by Morris M.Kleiner, Richard N. Block, Myron Roomkin, and Sidney W. Salsburg, Madison, WI: IndustrialRelations Research Association.
32
[16] Holzer, Harry J. (1988): "Search Method Use by Unemployed Youth," Journal of Labor Eco-nomics, 6 (1), 1-20.
[17] Ioannides, Yannis M. and Linda Datcher Loury. (2004): "Job Information Networks, Neigh-borhood E¤ects, and Inequality," Journal of Economic Literature, 42 (4), 1056-1093.
[18] Jovanovic, Boyan. "Job Matching and the Theory of Turnover." Journal of Political Economy87 (October 1979): 972-90.
[19] Jovanovic, Boyan. "Matching, Turnover, and Unemployment." Journal of Political Economy92 (February 1984): 108-22.
[20] Kramarz, Francis and Oskar Nordstrom Skans (2007): "With a Little Help from My... Parents?Family Networks and Youth Labor Market Entry", CREST, mimeo.
[21] Marsden, Peter V. (2001): "Interpersonal Ties, Social Capital, and Employer Sta¢ ng Prac-tices", in Social Capital: Theory and Research, edited by Nan Lin, Karen Cook and Ronald S.Burt, New Brunswick, NJ: Transaction Publishers.
[22] Marsden, Peter V. and Elizabeth H. Gorman (2001): "Social Networks, Job Changes andRecruitment", in Sourcebook of labor Markets: Evolving Structures and Processes, edited byIvar Berg and Arne L. Kalleberg, New York, NY: Kluwer Academic/Plenum Publishers.
[23] Marx, Jonathan and Kevin T. Leicht (1992): "Formality of Recruitment to 229 Jobs: Variationby Race, Sex and Job Characteristics", Sociology and Social Research, Vol. 76, 190-196.
[24] Meyer, B.D. (1990), �Unemployment insurance and unemployment spells�Econometrica, 58(4),757-782.
[25] Montgomery, James D. (1991): "Social Networks and Labor-Market Outcomes: Toward anEconomic Analysis", American Economic Review, 81(5), 1407-18.
[26] Oyer, Paul and Scott Schaefer (2009): "The Personnel-Economic Geography of US Law Firmsand Law Schools", manuscript, Stanford Graduate School of Business.
[27] Prentice, R. and L. Gloeckler (1978), "Regression analysis of grouped survival data with ap-plication to breast cancer data," Biometrics, 34, 57-67.
[28] Simon, Curtis J. and John T. Warner (1992): "Matchmaker, Matchmaker: The E¤ect of OldBoy Networks on Job Match Quality, Earnings, and Tenure", Journal of Labor Economics,10(3), 306-330.
[29] Topa, Giorgio. (2001): "Social Interactions, Local Spillovers and Unemployment," Review ofEconomic Studies, vol. 68, no. 2, 261-295.
33
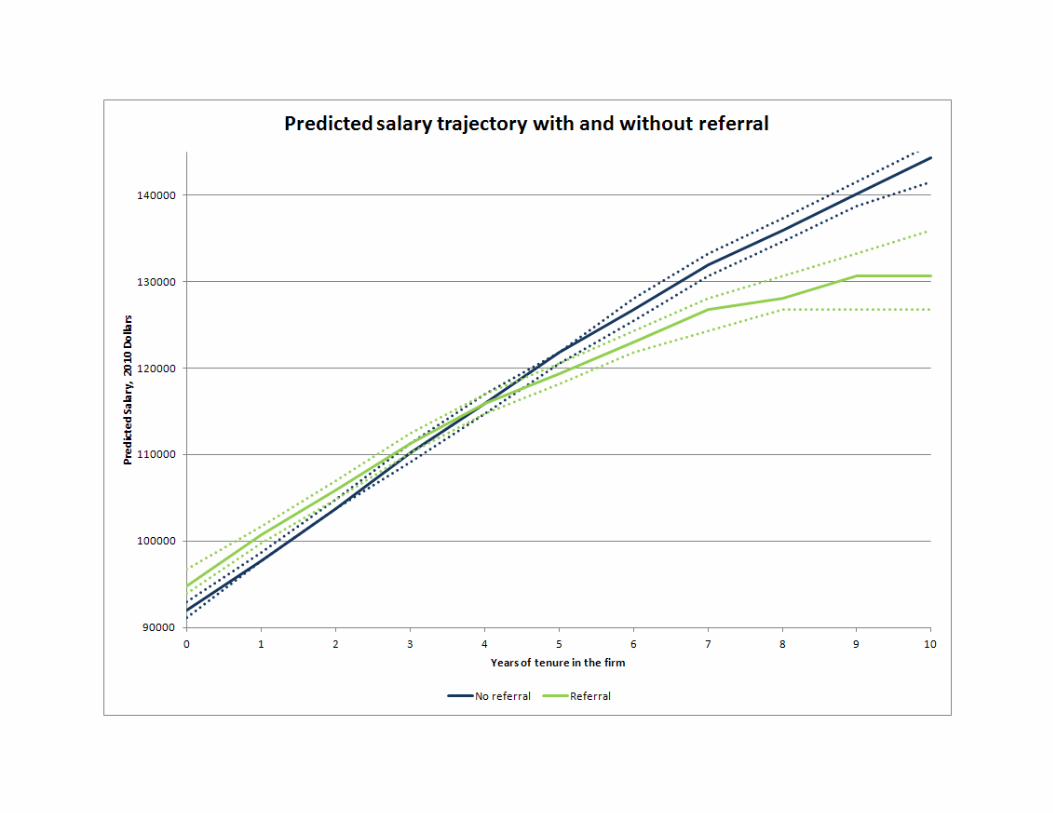

Table 1: Estimation Sample Descriptive Statistics Applicant Data
Characteristics Obs Proportion Obs Proportion
Full Sample - Number of Applicants 62,127 100%Number of Positions 315 100%
Number of Interviews 1,811 2.91%Number of Offers 428 0.69%Number of Hires 340 0.55%Unique Positions 315
Support Staff 1,732 2.79% 15 4.8%Junior Staff 30,685 49.39% 123 39.0%
Mid-level Staff 17,269 27.80% 106 33.7%Senior Staff 11,398 18.35% 64 20.3%
Executive 1,052 1.69% 7 2.2%
High School Required 1,537 2.47% 18 5.7%Associates Degree Required 935 1.50% 6 1.9%Bachelors Degree Required 38,057 61.26% 175 55.6%Graduate Degree Required 18,478 29.74% 96 30.5%
Education Requirement Not Indicated or Other 3,120 5.02% 20 6.3%
Year Job Posted Range 2006 - 2010 2006 - 2010
Years of Experience Required- mean; median; SD; min; max 4.687; 4; 3.20; 1; 12Number of Applicants for a Position- mean; median; SD; min; max 487.45; 341; 482.15; 1; 2,283Number of Interviews for a Position - mean; median; SD; min; max 6.705; 5; 6.990; 1; 52
Notes: Excluding 1 person pools and postings for which no one was hired
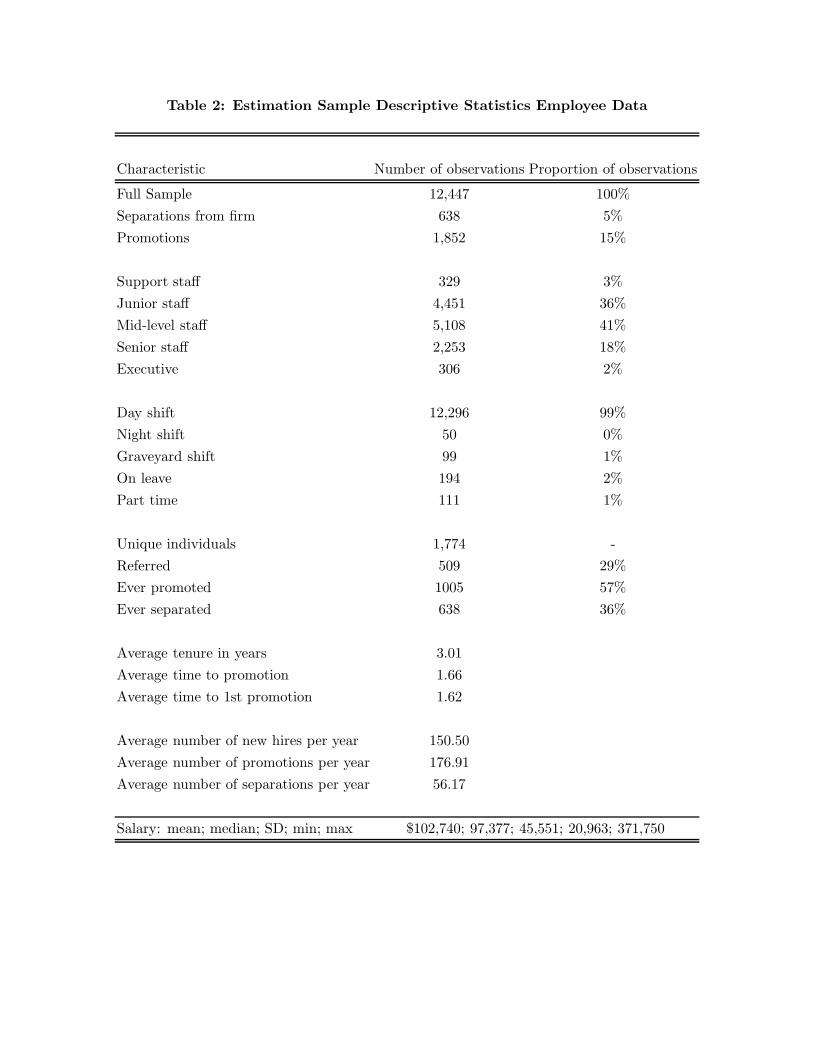
Table 2: Estimation Sample Descriptive Statistics Employee Data
Characteristic Number of observations Proportion of observations
Full Sample 12,447 100%Separations from firm 638 5%Promotions 1,852 15%
Support staff 329 3%Junior staff 4,451 36%Mid-level staff 5,108 41%Senior staff 2,253 18%Executive 306 2%
Day shift 12,296 99%Night shift 50 0%Graveyard shift 99 1%On leave 194 2%Part time 111 1%
Unique individuals 1,774 -Referred 509 29%Ever promoted 1005 57%Ever separated 638 36%
Average tenure in years 3.01Average time to promotion 1.66Average time to 1st promotion 1.62
Average number of new hires per year 150.50Average number of promotions per year 176.91Average number of separations per year 56.17
Salary: mean; median; SD; min; max $102,740; 97,377; 45,551; 20,963; 371,750

Table 3: Percent of Applicants at Each Stage by Method of Applying
Source Applicant Interview Offer Hired
Internet Job Board 60.08 39.98 23.6 23.53Firm website 14.78 10.1 9.58 10.59
Own initiative 10.08 7.73 7.01 5.59Other 6.88 13.93 21.26 23.53
Referred by current employee 6.09 21.37 27.34 29.12Campus Recruitment 2.09 6.91 11.21 7.64
Sum 100.0 100.0 100.0 100.0Total Sample: 62,127
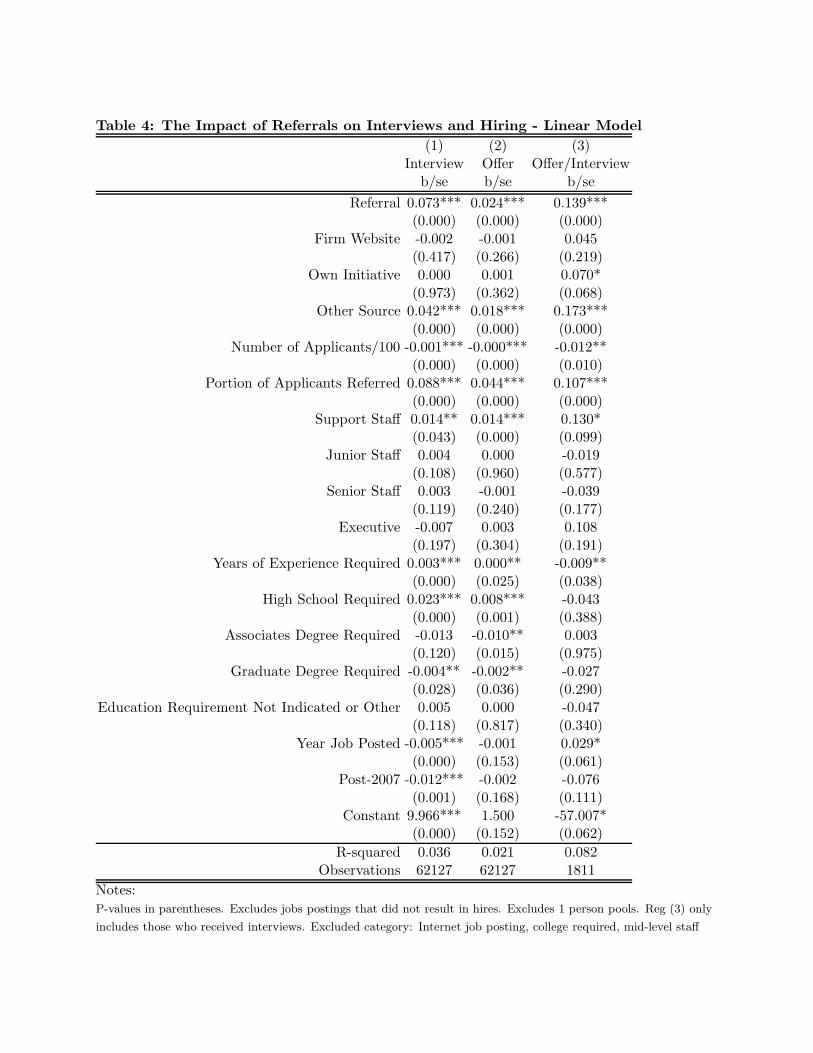
Table 4: The Impact of Referrals on Interviews and Hiring - Linear Model(1) (2) (3)
Interview Offer Offer/Interviewb/se b/se b/se
Referral 0.073*** 0.024*** 0.139***(0.000) (0.000) (0.000)
Firm Website -0.002 -0.001 0.045(0.417) (0.266) (0.219)
Own Initiative 0.000 0.001 0.070*(0.973) (0.362) (0.068)
Other Source 0.042*** 0.018*** 0.173***(0.000) (0.000) (0.000)
Number of Applicants/100 -0.001*** -0.000*** -0.012**(0.000) (0.000) (0.010)
Portion of Applicants Referred 0.088*** 0.044*** 0.107***(0.000) (0.000) (0.000)
Support Staff 0.014** 0.014*** 0.130*(0.043) (0.000) (0.099)
Junior Staff 0.004 0.000 -0.019(0.108) (0.960) (0.577)
Senior Staff 0.003 -0.001 -0.039(0.119) (0.240) (0.177)
Executive -0.007 0.003 0.108(0.197) (0.304) (0.191)
Years of Experience Required 0.003*** 0.000** -0.009**(0.000) (0.025) (0.038)
High School Required 0.023*** 0.008*** -0.043(0.000) (0.001) (0.388)
Associates Degree Required -0.013 -0.010** 0.003(0.120) (0.015) (0.975)
Graduate Degree Required -0.004** -0.002** -0.027(0.028) (0.036) (0.290)
Education Requirement Not Indicated or Other 0.005 0.000 -0.047(0.118) (0.817) (0.340)
Year Job Posted -0.005*** -0.001 0.029*(0.000) (0.153) (0.061)
Post-2007 -0.012*** -0.002 -0.076(0.001) (0.168) (0.111)
Constant 9.966*** 1.500 -57.007*(0.000) (0.152) (0.062)
R-squared 0.036 0.021 0.082Observations 62127 62127 1811
Notes:P-values in parentheses. Excludes jobs postings that did not result in hires. Excludes 1 person pools. Reg (3) only
includes those who received interviews. Excluded category: Internet job posting, college required, mid-level staff

Tab
le5:
Yea
rly
Sal
ary
Lev
els
wit
hC
urr
ent
Yea
rD
um
mie
s(i
nT
hou
sands
of$2
010)
Star
ting
Sala
ry1
Yea
r2
Yea
rs3
Yea
rs4
Yea
rs5
Yea
rs6
Yea
rs7
Yea
rs8
Yea
rs9+
Yea
rsR
efer
ral
1.32
60.
424
-0.1
210.
679
0.50
7-1
.401
-3.6
34*
-3.9
86-7
.689
*-1
3.34
3***
(0.1
07)
(0.5
01)
(0.8
64)
(0.4
48)
(0.6
77)
(0.3
90)
(0.0
99)
(0.1
92)
(0.0
63)
(0.0
00)
Nig
ht1.
813
0.99
9-1
.806
-6.2
94-9
.06
-13.
164
-25.
275
-27.
234
-34.
739*
*(0
.816
)(0
.855
)(0
.737
)(0
.265
)(0
.204
)(0
.127
)(0
.150
)(0
.160
)(0
.019
)G
rave
yard
5.66
4.57
41.
612
-2.0
5-1
0.20
8-1
0.99
-3.8
-4.7
76-3
.686
-10.
814
(0.2
51)
(0.1
27)
(0.6
42)
(0.6
15)
(0.1
21)
(0.2
34)
(0.7
45)
(0.7
14)
(0.8
00)
(0.5
47)
Par
tT
ime
-5.2
031.
331.
443
2.89
95.
794
6.05
9-1
0.87
8-8
.756
-3.1
67-1
1.14
3(0
.207
)(0
.732
)(0
.668
)(0
.463
)(0
.269
)(0
.515
)(0
.205
)(0
.399
)(0
.823
)(0
.311
)O
nLea
ve11
.54
-3.5
791.
493
-2.7
29-0
.591
-1.1
45-0
.965
-4.7
087.
665
-6.2
34(0
.451
)(0
.242
)(0
.567
)(0
.349
)(0
.874
)(0
.759
)(0
.842
)(0
.562
)(0
.476
)(0
.553
)Su
ppor
tSt
aff-5
5.95
9***
-54.
887*
**-5
7.20
1***
-58.
806*
**-6
0.33
6***
-61.
394*
**-6
3.57
9***
-68.
642*
**-7
5.33
5***
-78.
595*
**(0
.000
)(0
.000
)(0
.000
)(0
.000
)(0
.000
)(0
.000
)(0
.000
)(0
.000
)(0
.000
)(0
.000
)Ju
nior
Staff
-39.
085*
**-3
8.22
4***
-38.
152*
**-3
6.88
9***
-35.
962*
**-3
3.86
2***
-33.
982*
**-3
4.08
6***
-33.
453*
**-3
7.81
0***
(0.0
00)
(0.0
00)
(0.0
00)
(0.0
00)
(0.0
00)
(0.0
00)
(0.0
00)
(0.0
00)
(0.0
00)
(0.0
00)
Seni
orSt
aff41
.336
***
41.9
54**
*40
.880
***
40.8
57**
*41
.494
***
41.1
74**
*43
.854
***
47.8
86**
*49
.548
***
51.2
50**
*(0
.000
)(0
.000
)(0
.000
)(0
.000
)(0
.000
)(0
.000
)(0
.000
)(0
.000
)(0
.000
)(0
.000
)E
xecu
tive
145.
478*
**15
0.90
9***
158.
668*
**17
4.90
4***
177.
939*
**18
4.39
2***
200.
195*
**20
3.83
3***
211.
999*
**19
9.02
9***
(0.0
00)
(0.0
00)
(0.0
00)
(0.0
00)
(0.0
00)
(0.0
00)
(0.0
00)
(0.0
00)
(0.0
00)
(0.0
00)
Con
stan
t93
.283
***
92.6
51**
*97
.604
***
102.
793*
**11
1.47
2***
120.
609*
**12
8.90
9***
130.
182*
**13
8.35
0***
152.
139*
**(0
.000
)(0
.000
)(0
.000
)(0
.000
)(0
.000
)(0
.000
)(0
.000
)(0
.000
)(0
.000
)(0
.000
)R
-squ
ared
0.88
90.
889
0.88
40.
857
0.82
50.
794
0.79
0.75
0.76
30.
664
Obs
erva
tion
s17
7830
1022
9216
0312
1083
957
038
228
147
8
Not
es:
P-v
alu
esin
pare
nth
eses
.1
Yea
rre
gre
sses
the
sala
ryle
vel
sw
ith
obse
rvati
ons
from
6m
onth
sand
1yea
r,th
esu
bse
quen
tyea
rs’re
gre
ssio
ns
follow
sim
ilarly.
Excl
uded
Cate
gory
isnot
refe
rred
,day
tim
esh
ift,
full
tim
e,not
on
leav
e,m
id-lev
elst
aff,in
the
larg
est
div
isio
n.
Contr
ols
incl
uded
com
pany
div
isio
ns
Contr
ols
for
curr
ent
yea
rare
incl
uded
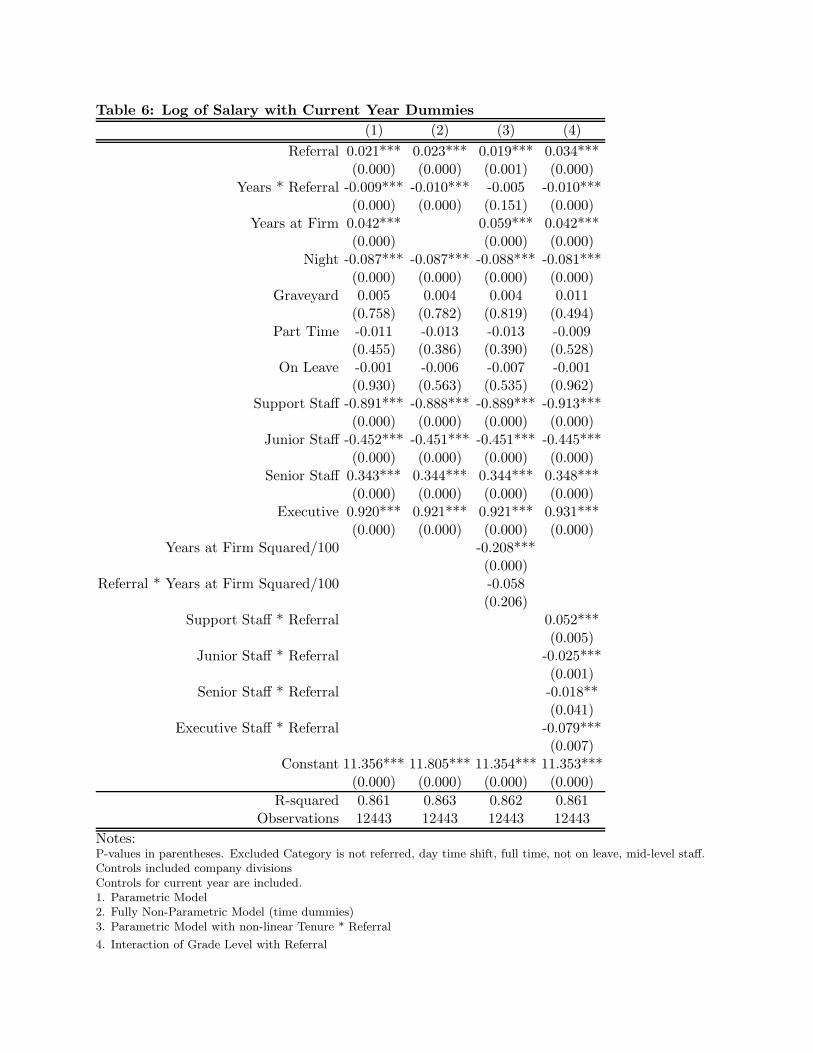
Table 6: Log of Salary with Current Year Dummies(1) (2) (3) (4)
Referral 0.021*** 0.023*** 0.019*** 0.034***(0.000) (0.000) (0.001) (0.000)
Years * Referral -0.009*** -0.010*** -0.005 -0.010***(0.000) (0.000) (0.151) (0.000)
Years at Firm 0.042*** 0.059*** 0.042***(0.000) (0.000) (0.000)
Night -0.087*** -0.087*** -0.088*** -0.081***(0.000) (0.000) (0.000) (0.000)
Graveyard 0.005 0.004 0.004 0.011(0.758) (0.782) (0.819) (0.494)
Part Time -0.011 -0.013 -0.013 -0.009(0.455) (0.386) (0.390) (0.528)
On Leave -0.001 -0.006 -0.007 -0.001(0.930) (0.563) (0.535) (0.962)
Support Staff -0.891*** -0.888*** -0.889*** -0.913***(0.000) (0.000) (0.000) (0.000)
Junior Staff -0.452*** -0.451*** -0.451*** -0.445***(0.000) (0.000) (0.000) (0.000)
Senior Staff 0.343*** 0.344*** 0.344*** 0.348***(0.000) (0.000) (0.000) (0.000)
Executive 0.920*** 0.921*** 0.921*** 0.931***(0.000) (0.000) (0.000) (0.000)
Years at Firm Squared/100 -0.208***(0.000)
Referral * Years at Firm Squared/100 -0.058(0.206)
Support Staff * Referral 0.052***(0.005)
Junior Staff * Referral -0.025***(0.001)
Senior Staff * Referral -0.018**(0.041)
Executive Staff * Referral -0.079***(0.007)
Constant 11.356*** 11.805*** 11.354*** 11.353***(0.000) (0.000) (0.000) (0.000)
R-squared 0.861 0.863 0.862 0.861Observations 12443 12443 12443 12443
Notes:P-values in parentheses. Excluded Category is not referred, day time shift, full time, not on leave, mid-level staff.Controls included company divisionsControls for current year are included.1. Parametric Model2. Fully Non-Parametric Model (time dummies)3. Parametric Model with non-linear Tenure * Referral
4. Interaction of Grade Level with Referral
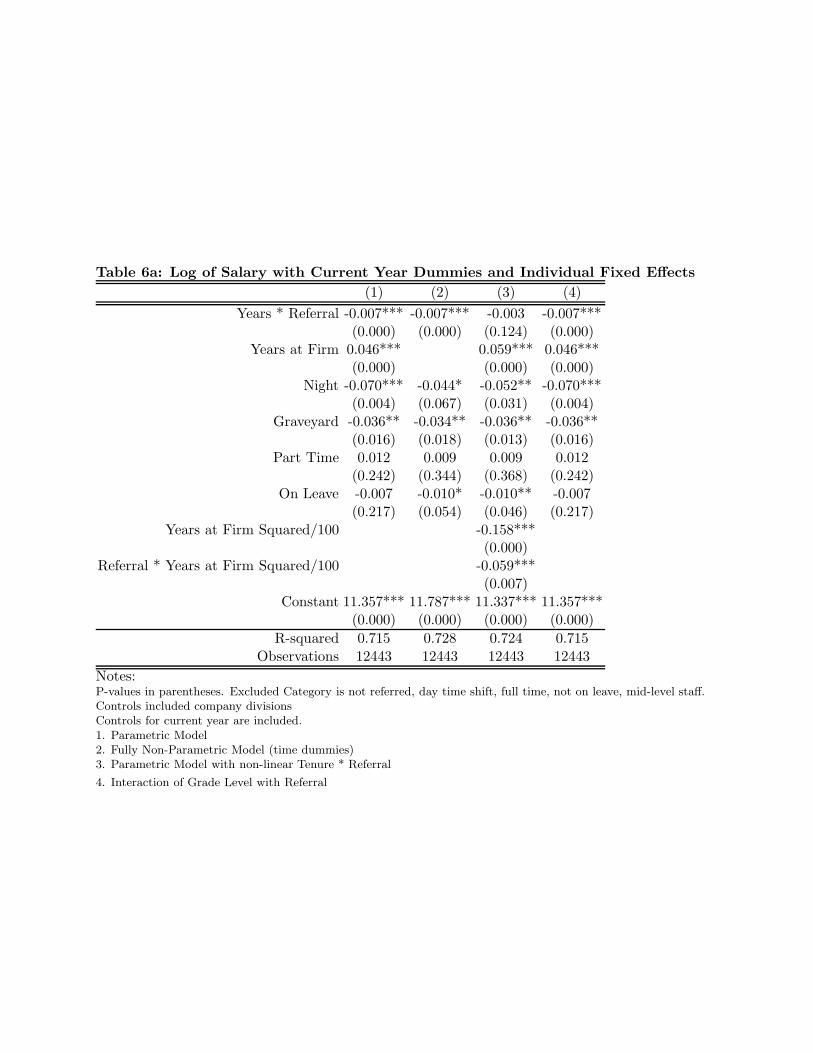
Table 6a: Log of Salary with Current Year Dummies and Individual Fixed Effects(1) (2) (3) (4)
Years * Referral -0.007*** -0.007*** -0.003 -0.007***(0.000) (0.000) (0.124) (0.000)
Years at Firm 0.046*** 0.059*** 0.046***(0.000) (0.000) (0.000)
Night -0.070*** -0.044* -0.052** -0.070***(0.004) (0.067) (0.031) (0.004)
Graveyard -0.036** -0.034** -0.036** -0.036**(0.016) (0.018) (0.013) (0.016)
Part Time 0.012 0.009 0.009 0.012(0.242) (0.344) (0.368) (0.242)
On Leave -0.007 -0.010* -0.010** -0.007(0.217) (0.054) (0.046) (0.217)
Years at Firm Squared/100 -0.158***(0.000)
Referral * Years at Firm Squared/100 -0.059***(0.007)
Constant 11.357*** 11.787*** 11.337*** 11.357***(0.000) (0.000) (0.000) (0.000)
R-squared 0.715 0.728 0.724 0.715Observations 12443 12443 12443 12443
Notes:P-values in parentheses. Excluded Category is not referred, day time shift, full time, not on leave, mid-level staff.Controls included company divisionsControls for current year are included.1. Parametric Model2. Fully Non-Parametric Model (time dummies)3. Parametric Model with non-linear Tenure * Referral
4. Interaction of Grade Level with Referral
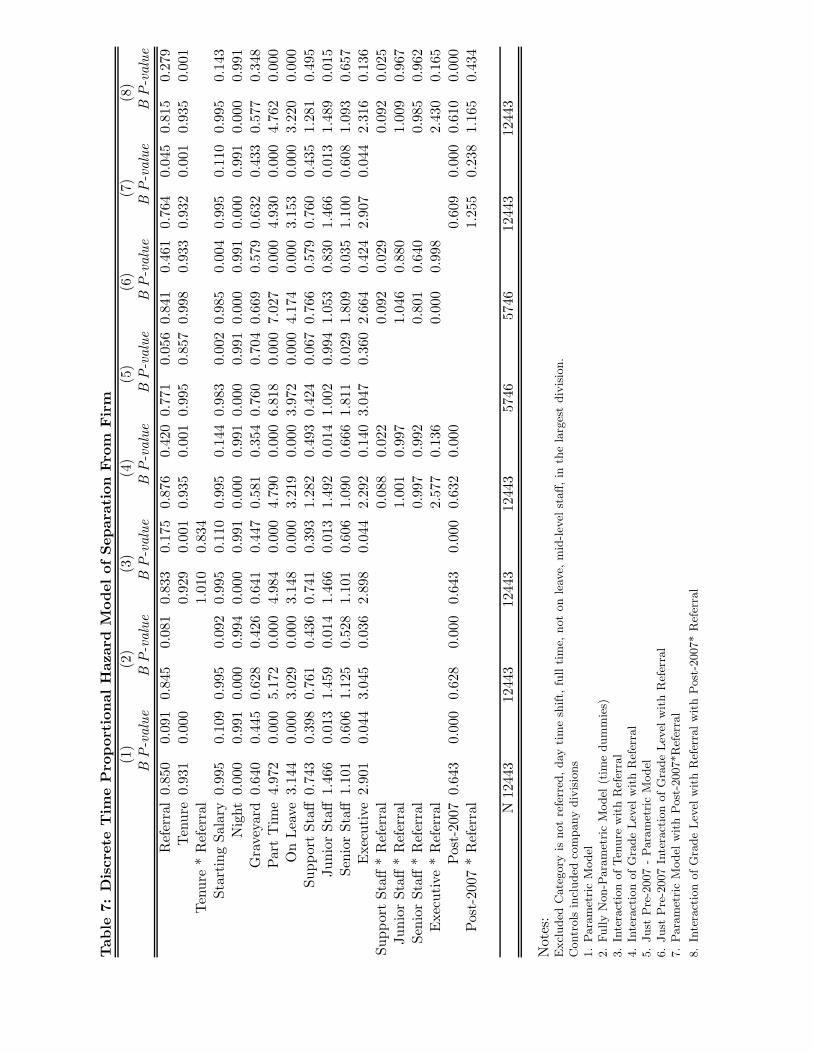
Tab
le7:
Dis
cret
eT
ime
Pro
por
tion
alH
azar
dM
odel
ofSep
arat
ion
Fro
mFir
m(1
)(2
)(3
)(4
)(5
)(6
)(7
)(8
)B
P-v
alue
BP-v
alue
BP-v
alue
BP-v
alue
BP-v
alue
BP-v
alue
BP-v
alue
BP-v
alue
Ref
erra
l0.
850
0.09
10.
845
0.08
10.
833
0.17
50.
876
0.42
00.
771
0.05
60.
841
0.46
10.
764
0.04
50.
815
0.27
9Ten
ure
0.93
10.
000
0.92
90.
001
0.93
50.
001
0.99
50.
857
0.99
80.
933
0.93
20.
001
0.93
50.
001
Ten
ure
*R
efer
ral
1.01
00.
834
Star
ting
Sala
ry0.
995
0.10
90.
995
0.09
20.
995
0.11
00.
995
0.14
40.
983
0.00
20.
985
0.00
40.
995
0.11
00.
995
0.14
3N
ight
0.00
00.
991
0.00
00.
994
0.00
00.
991
0.00
00.
991
0.00
00.
991
0.00
00.
991
0.00
00.
991
0.00
00.
991
Gra
veya
rd0.
640
0.44
50.
628
0.42
60.
641
0.44
70.
581
0.35
40.
760
0.70
40.
669
0.57
90.
632
0.43
30.
577
0.34
8Par
tT
ime
4.97
20.
000
5.17
20.
000
4.98
40.
000
4.79
00.
000
6.81
80.
000
7.02
70.
000
4.93
00.
000
4.76
20.
000
On
Lea
ve3.
144
0.00
03.
029
0.00
03.
148
0.00
03.
219
0.00
03.
972
0.00
04.
174
0.00
03.
153
0.00
03.
220
0.00
0Su
ppor
tSt
aff0.
743
0.39
80.
761
0.43
60.
741
0.39
31.
282
0.49
30.
424
0.06
70.
766
0.57
90.
760
0.43
51.
281
0.49
5Ju
nior
Staff
1.46
60.
013
1.45
90.
014
1.46
60.
013
1.49
20.
014
1.00
20.
994
1.05
30.
830
1.46
60.
013
1.48
90.
015
Seni
orSt
aff1.
101
0.60
61.
125
0.52
81.
101
0.60
61.
090
0.66
61.
811
0.02
91.
809
0.03
51.
100
0.60
81.
093
0.65
7E
xecu
tive
2.90
10.
044
3.04
50.
036
2.89
80.
044
2.29
20.
140
3.04
70.
360
2.66
40.
424
2.90
70.
044
2.31
60.
136
Supp
ort
Staff
*R
efer
ral
0.08
80.
022
0.09
20.
029
0.09
20.
025
Juni
orSt
aff*
Ref
erra
l1.
001
0.99
71.
046
0.88
01.
009
0.96
7Se
nior
Staff
*R
efer
ral
0.99
70.
992
0.80
10.
640
0.98
50.
962
Exe
cutive
*R
efer
ral
2.57
70.
136
0.00
00.
998
2.43
00.
165
Pos
t-20
070.
643
0.00
00.
628
0.00
00.
643
0.00
00.
632
0.00
00.
609
0.00
00.
610
0.00
0Pos
t-20
07*
Ref
erra
l1.
255
0.23
81.
165
0.43
4
N12
443
1244
312
443
1244
357
4657
4612
443
1244
3
Not
es:
Excl
uded
Cate
gory
isnot
refe
rred
,day
tim
esh
ift,
full
tim
e,not
on
leav
e,m
id-lev
elst
aff,in
the
larg
est
div
isio
n.
Contr
ols
incl
uded
com
pany
div
isio
ns
1.
Para
met
ric
Model
2.
Fully
Non-P
ara
met
ric
Model
(tim
edum
mie
s)3.
Inte
ract
ion
ofTen
ure
with
Ref
erra
l4.
Inte
ract
ion
ofG
rade
Lev
elw
ith
Ref
erra
l5.
Just
Pre
-2007
-Para
met
ric
Model
6.
Just
Pre
-2007
Inte
ract
ion
ofG
rade
Lev
elw
ith
Ref
erra
l7.
Para
met
ric
Model
wit
hPost
-2007*R
efer
ral
8.
Inte
ract
ion
ofG
rade
Lev
elw
ith
Ref
erra
lw
ith
Post
-2007*
Ref
erra
l
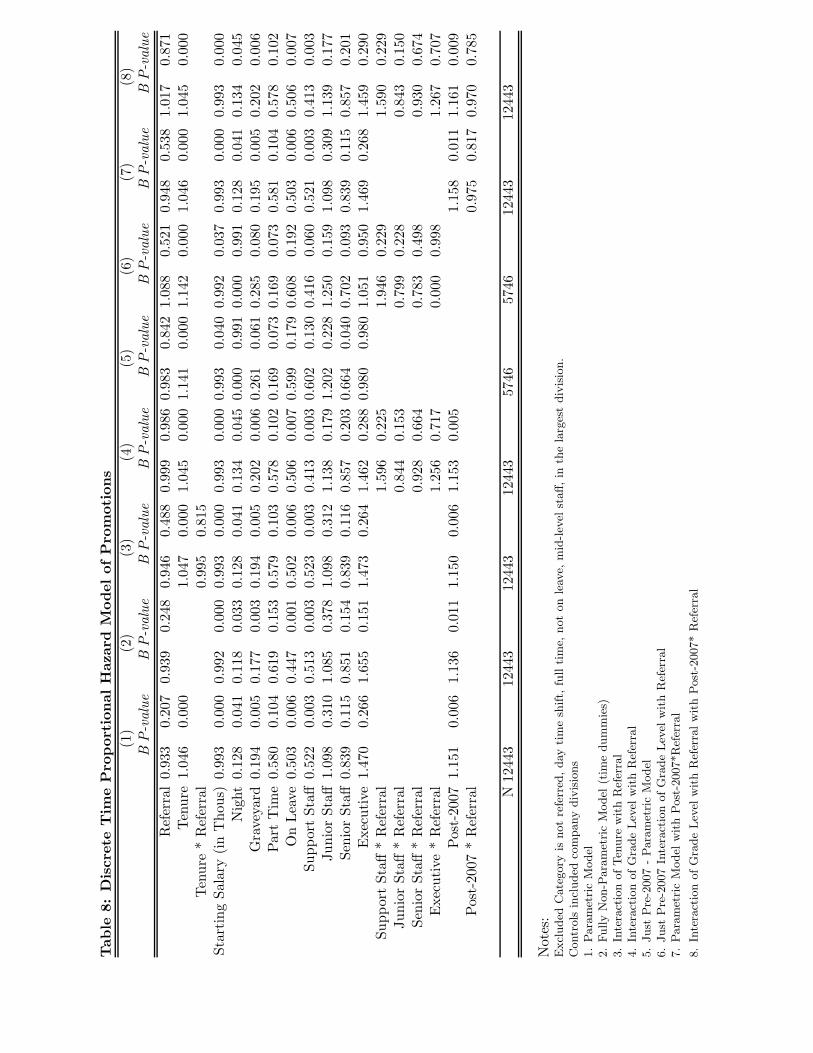
Tab
le8:
Dis
cret
eT
ime
Pro
por
tion
alH
azar
dM
odel
ofP
rom
otio
ns
(1)
(2)
(3)
(4)
(5)
(6)
(7)
(8)
BP-v
alue
BP-v
alue
BP-v
alue
BP-v
alue
BP-v
alue
BP-v
alue
BP-v
alue
BP-v
alue
Ref
erra
l0.
933
0.20
70.
939
0.24
80.
946
0.48
80.
999
0.98
60.
983
0.84
21.
088
0.52
10.
948
0.53
81.
017
0.87
1Ten
ure
1.04
60.
000
1.04
70.
000
1.04
50.
000
1.14
10.
000
1.14
20.
000
1.04
60.
000
1.04
50.
000
Ten
ure
*R
efer
ral
0.99
50.
815
Star
ting
Sala
ry(in
Tho
us)
0.99
30.
000
0.99
20.
000
0.99
30.
000
0.99
30.
000
0.99
30.
040
0.99
20.
037
0.99
30.
000
0.99
30.
000
Nig
ht0.
128
0.04
10.
118
0.03
30.
128
0.04
10.
134
0.04
50.
000
0.99
10.
000
0.99
10.
128
0.04
10.
134
0.04
5G
rave
yard
0.19
40.
005
0.17
70.
003
0.19
40.
005
0.20
20.
006
0.26
10.
061
0.28
50.
080
0.19
50.
005
0.20
20.
006
Par
tT
ime
0.58
00.
104
0.61
90.
153
0.57
90.
103
0.57
80.
102
0.16
90.
073
0.16
90.
073
0.58
10.
104
0.57
80.
102
On
Lea
ve0.
503
0.00
60.
447
0.00
10.
502
0.00
60.
506
0.00
70.
599
0.17
90.
608
0.19
20.
503
0.00
60.
506
0.00
7Su
ppor
tSt
aff0.
522
0.00
30.
513
0.00
30.
523
0.00
30.
413
0.00
30.
602
0.13
00.
416
0.06
00.
521
0.00
30.
413
0.00
3Ju
nior
Staff
1.09
80.
310
1.08
50.
378
1.09
80.
312
1.13
80.
179
1.20
20.
228
1.25
00.
159
1.09
80.
309
1.13
90.
177
Seni
orSt
aff0.
839
0.11
50.
851
0.15
40.
839
0.11
60.
857
0.20
30.
664
0.04
00.
702
0.09
30.
839
0.11
50.
857
0.20
1E
xecu
tive
1.47
00.
266
1.65
50.
151
1.47
30.
264
1.46
20.
288
0.98
00.
980
1.05
10.
950
1.46
90.
268
1.45
90.
290
Supp
ort
Staff
*R
efer
ral
1.59
60.
225
1.94
60.
229
1.59
00.
229
Juni
orSt
aff*
Ref
erra
l0.
844
0.15
30.
799
0.22
80.
843
0.15
0Se
nior
Staff
*R
efer
ral
0.92
80.
664
0.78
30.
498
0.93
00.
674
Exe
cutive
*R
efer
ral
1.25
60.
717
0.00
00.
998
1.26
70.
707
Pos
t-20
071.
151
0.00
61.
136
0.01
11.
150
0.00
61.
153
0.00
51.
158
0.01
11.
161
0.00
9Pos
t-20
07*
Ref
erra
l0.
975
0.81
70.
970
0.78
5
N12
443
1244
312
443
1244
357
4657
4612
443
1244
3
Not
es:
Excl
uded
Cate
gory
isnot
refe
rred
,day
tim
esh
ift,
full
tim
e,not
on
leav
e,m
id-lev
elst
aff,in
the
larg
est
div
isio
n.
Contr
ols
incl
uded
com
pany
div
isio
ns
1.
Para
met
ric
Model
2.
Fully
Non-P
ara
met
ric
Model
(tim
edum
mie
s)3.
Inte
ract
ion
ofTen
ure
with
Ref
erra
l4.
Inte
ract
ion
ofG
rade
Lev
elw
ith
Ref
erra
l5.
Just
Pre
-2007
-Para
met
ric
Model
6.
Just
Pre
-2007
Inte
ract
ion
ofG
rade
Lev
elw
ith
Ref
erra
l7.
Para
met
ric
Model
wit
hPost
-2007*R
efer
ral
8.
Inte
ract
ion
ofG
rade
Lev
elw
ith
Ref
erra
lw
ith
Post
-2007*
Ref
erra
l
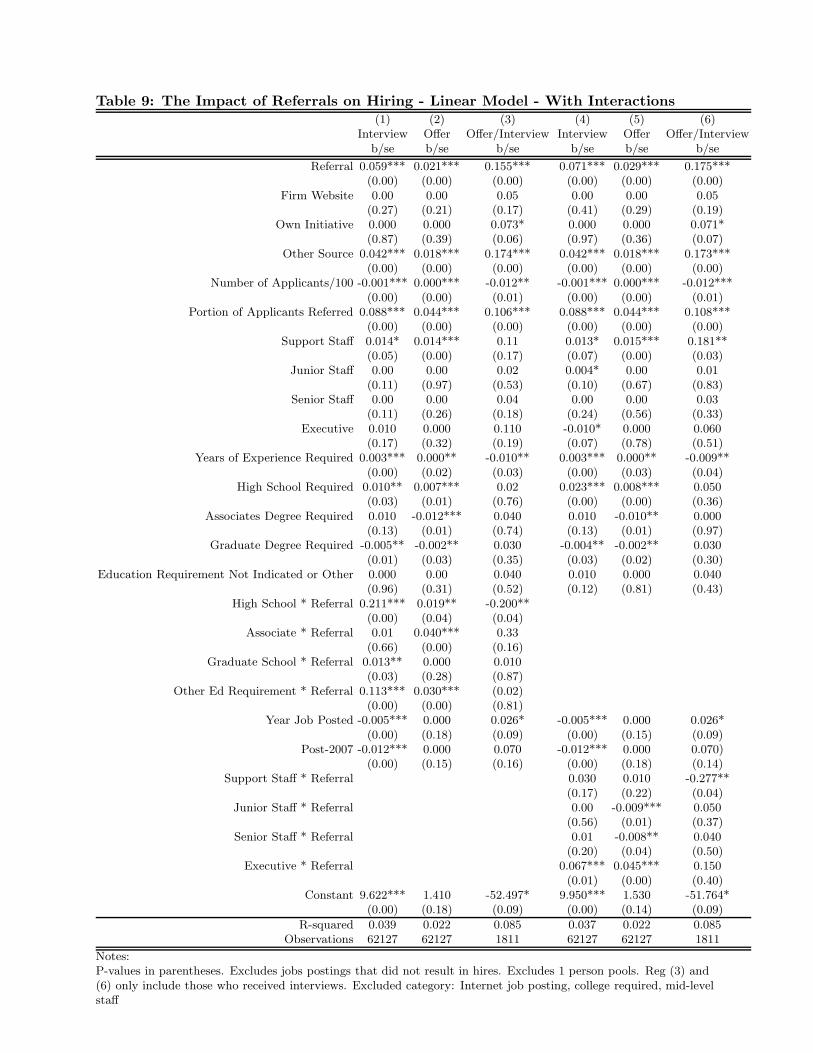
Table 9: The Impact of Referrals on Hiring - Linear Model - With Interactions(1) (2) (3) (4) (5) (6)
Interview Offer Offer/Interview Interview Offer Offer/Interviewb/se b/se b/se b/se b/se b/se
Referral 0.059*** 0.021*** 0.155*** 0.071*** 0.029*** 0.175***(0.00) (0.00) (0.00) (0.00) (0.00) (0.00)
Firm Website 0.00 0.00 0.05 0.00 0.00 0.05(0.27) (0.21) (0.17) (0.41) (0.29) (0.19)
Own Initiative 0.000 0.000 0.073* 0.000 0.000 0.071*(0.87) (0.39) (0.06) (0.97) (0.36) (0.07)
Other Source 0.042*** 0.018*** 0.174*** 0.042*** 0.018*** 0.173***(0.00) (0.00) (0.00) (0.00) (0.00) (0.00)
Number of Applicants/100 -0.001*** 0.000*** -0.012** -0.001*** 0.000*** -0.012***(0.00) (0.00) (0.01) (0.00) (0.00) (0.01)
Portion of Applicants Referred 0.088*** 0.044*** 0.106*** 0.088*** 0.044*** 0.108***(0.00) (0.00) (0.00) (0.00) (0.00) (0.00)
Support Staff 0.014* 0.014*** 0.11 0.013* 0.015*** 0.181**(0.05) (0.00) (0.17) (0.07) (0.00) (0.03)
Junior Staff 0.00 0.00 0.02 0.004* 0.00 0.01(0.11) (0.97) (0.53) (0.10) (0.67) (0.83)
Senior Staff 0.00 0.00 0.04 0.00 0.00 0.03(0.11) (0.26) (0.18) (0.24) (0.56) (0.33)
Executive 0.010 0.000 0.110 -0.010* 0.000 0.060(0.17) (0.32) (0.19) (0.07) (0.78) (0.51)
Years of Experience Required 0.003*** 0.000** -0.010** 0.003*** 0.000** -0.009**(0.00) (0.02) (0.03) (0.00) (0.03) (0.04)
High School Required 0.010** 0.007*** 0.02 0.023*** 0.008*** 0.050(0.03) (0.01) (0.76) (0.00) (0.00) (0.36)
Associates Degree Required 0.010 -0.012*** 0.040 0.010 -0.010** 0.000(0.13) (0.01) (0.74) (0.13) (0.01) (0.97)
Graduate Degree Required -0.005** -0.002** 0.030 -0.004** -0.002** 0.030(0.01) (0.03) (0.35) (0.03) (0.02) (0.30)
Education Requirement Not Indicated or Other 0.000 0.00 0.040 0.010 0.000 0.040(0.96) (0.31) (0.52) (0.12) (0.81) (0.43)
High School * Referral 0.211*** 0.019** -0.200**(0.00) (0.04) (0.04)
Associate * Referral 0.01 0.040*** 0.33(0.66) (0.00) (0.16)
Graduate School * Referral 0.013** 0.000 0.010(0.03) (0.28) (0.87)
Other Ed Requirement * Referral 0.113*** 0.030*** (0.02)(0.00) (0.00) (0.81)
Year Job Posted -0.005*** 0.000 0.026* -0.005*** 0.000 0.026*(0.00) (0.18) (0.09) (0.00) (0.15) (0.09)
Post-2007 -0.012*** 0.000 0.070 -0.012*** 0.000 0.070)(0.00) (0.15) (0.16) (0.00) (0.18) (0.14)
Support Staff * Referral 0.030 0.010 -0.277**(0.17) (0.22) (0.04)
Junior Staff * Referral 0.00 -0.009*** 0.050(0.56) (0.01) (0.37)
Senior Staff * Referral 0.01 -0.008** 0.040(0.20) (0.04) (0.50)
Executive * Referral 0.067*** 0.045*** 0.150(0.01) (0.00) (0.40)
Constant 9.622*** 1.410 -52.497* 9.950*** 1.530 -51.764*(0.00) (0.18) (0.09) (0.00) (0.14) (0.09)
R-squared 0.039 0.022 0.085 0.037 0.022 0.085Observations 62127 62127 1811 62127 62127 1811
Notes:P-values in parentheses. Excludes jobs postings that did not result in hires. Excludes 1 person pools. Reg (3) and(6) only include those who received interviews. Excluded category: Internet job posting, college required, mid-levelstaff
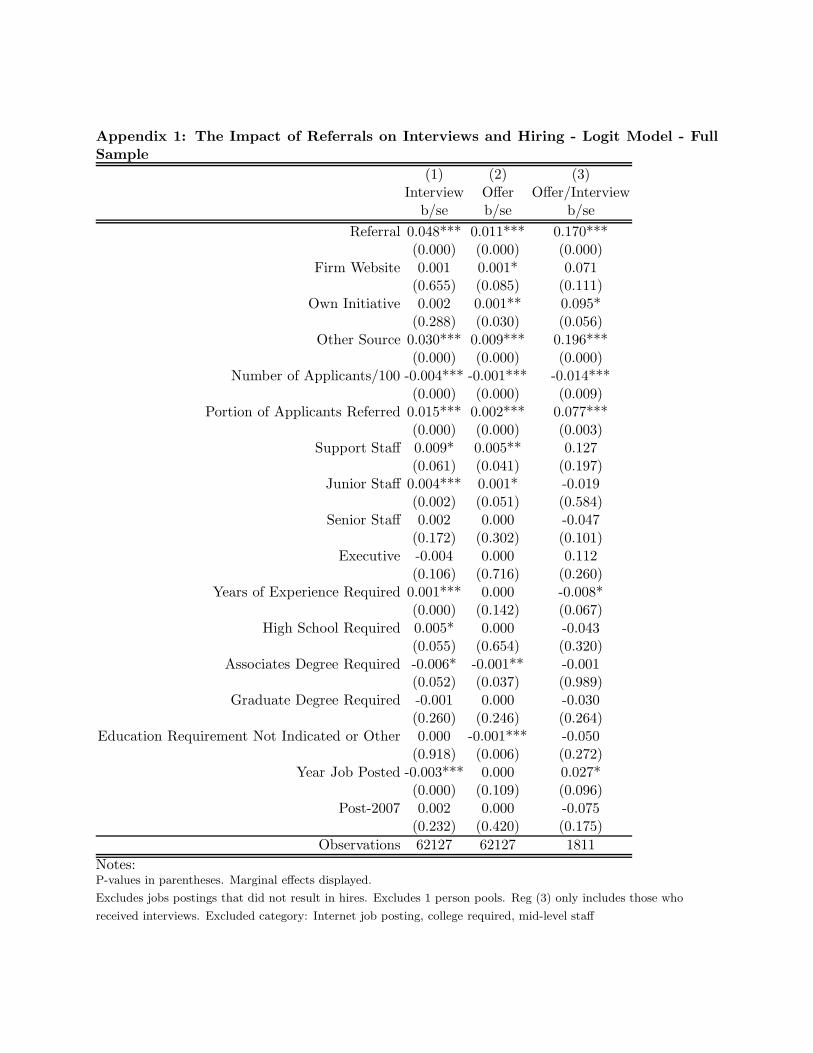
Appendix 1: The Impact of Referrals on Interviews and Hiring - Logit Model - FullSample
(1) (2) (3)Interview Offer Offer/Interview
b/se b/se b/seReferral 0.048*** 0.011*** 0.170***
(0.000) (0.000) (0.000)Firm Website 0.001 0.001* 0.071
(0.655) (0.085) (0.111)Own Initiative 0.002 0.001** 0.095*
(0.288) (0.030) (0.056)Other Source 0.030*** 0.009*** 0.196***
(0.000) (0.000) (0.000)Number of Applicants/100 -0.004*** -0.001*** -0.014***
(0.000) (0.000) (0.009)Portion of Applicants Referred 0.015*** 0.002*** 0.077***
(0.000) (0.000) (0.003)Support Staff 0.009* 0.005** 0.127
(0.061) (0.041) (0.197)Junior Staff 0.004*** 0.001* -0.019
(0.002) (0.051) (0.584)Senior Staff 0.002 0.000 -0.047
(0.172) (0.302) (0.101)Executive -0.004 0.000 0.112
(0.106) (0.716) (0.260)Years of Experience Required 0.001*** 0.000 -0.008*
(0.000) (0.142) (0.067)High School Required 0.005* 0.000 -0.043
(0.055) (0.654) (0.320)Associates Degree Required -0.006* -0.001** -0.001
(0.052) (0.037) (0.989)Graduate Degree Required -0.001 0.000 -0.030
(0.260) (0.246) (0.264)Education Requirement Not Indicated or Other 0.000 -0.001*** -0.050
(0.918) (0.006) (0.272)Year Job Posted -0.003*** 0.000 0.027*
(0.000) (0.109) (0.096)Post-2007 0.002 0.000 -0.075
(0.232) (0.420) (0.175)Observations 62127 62127 1811
Notes:P-values in parentheses. Marginal effects displayed.
Excludes jobs postings that did not result in hires. Excludes 1 person pools. Reg (3) only includes those who
received interviews. Excluded category: Internet job posting, college required, mid-level staff
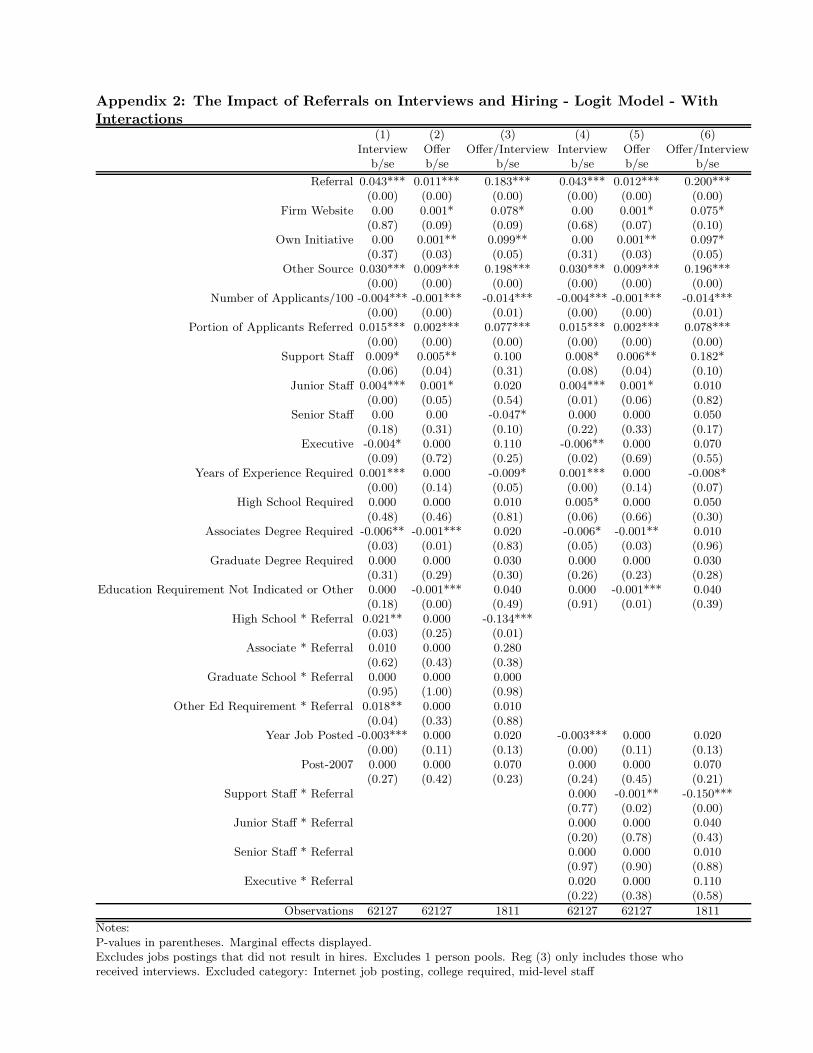
Appendix 2: The Impact of Referrals on Interviews and Hiring - Logit Model - WithInteractions
(1) (2) (3) (4) (5) (6)Interview Offer Offer/Interview Interview Offer Offer/Interview
b/se b/se b/se b/se b/se b/se
Referral 0.043*** 0.011*** 0.183*** 0.043*** 0.012*** 0.200***(0.00) (0.00) (0.00) (0.00) (0.00) (0.00)
Firm Website 0.00 0.001* 0.078* 0.00 0.001* 0.075*(0.87) (0.09) (0.09) (0.68) (0.07) (0.10)
Own Initiative 0.00 0.001** 0.099** 0.00 0.001** 0.097*(0.37) (0.03) (0.05) (0.31) (0.03) (0.05)
Other Source 0.030*** 0.009*** 0.198*** 0.030*** 0.009*** 0.196***(0.00) (0.00) (0.00) (0.00) (0.00) (0.00)
Number of Applicants/100 -0.004*** -0.001*** -0.014*** -0.004*** -0.001*** -0.014***(0.00) (0.00) (0.01) (0.00) (0.00) (0.01)
Portion of Applicants Referred 0.015*** 0.002*** 0.077*** 0.015*** 0.002*** 0.078***(0.00) (0.00) (0.00) (0.00) (0.00) (0.00)
Support Staff 0.009* 0.005** 0.100 0.008* 0.006** 0.182*(0.06) (0.04) (0.31) (0.08) (0.04) (0.10)
Junior Staff 0.004*** 0.001* 0.020 0.004*** 0.001* 0.010(0.00) (0.05) (0.54) (0.01) (0.06) (0.82)
Senior Staff 0.00 0.00 -0.047* 0.000 0.000 0.050(0.18) (0.31) (0.10) (0.22) (0.33) (0.17)
Executive -0.004* 0.000 0.110 -0.006** 0.000 0.070(0.09) (0.72) (0.25) (0.02) (0.69) (0.55)
Years of Experience Required 0.001*** 0.000 -0.009* 0.001*** 0.000 -0.008*(0.00) (0.14) (0.05) (0.00) (0.14) (0.07)
High School Required 0.000 0.000 0.010 0.005* 0.000 0.050(0.48) (0.46) (0.81) (0.06) (0.66) (0.30)
Associates Degree Required -0.006** -0.001*** 0.020 -0.006* -0.001** 0.010(0.03) (0.01) (0.83) (0.05) (0.03) (0.96)
Graduate Degree Required 0.000 0.000 0.030 0.000 0.000 0.030(0.31) (0.29) (0.30) (0.26) (0.23) (0.28)
Education Requirement Not Indicated or Other 0.000 -0.001*** 0.040 0.000 -0.001*** 0.040(0.18) (0.00) (0.49) (0.91) (0.01) (0.39)
High School * Referral 0.021** 0.000 -0.134***(0.03) (0.25) (0.01)
Associate * Referral 0.010 0.000 0.280(0.62) (0.43) (0.38)
Graduate School * Referral 0.000 0.000 0.000(0.95) (1.00) (0.98)
Other Ed Requirement * Referral 0.018** 0.000 0.010(0.04) (0.33) (0.88)
Year Job Posted -0.003*** 0.000 0.020 -0.003*** 0.000 0.020(0.00) (0.11) (0.13) (0.00) (0.11) (0.13)
Post-2007 0.000 0.000 0.070 0.000 0.000 0.070(0.27) (0.42) (0.23) (0.24) (0.45) (0.21)
Support Staff * Referral 0.000 -0.001** -0.150***(0.77) (0.02) (0.00)
Junior Staff * Referral 0.000 0.000 0.040(0.20) (0.78) (0.43)
Senior Staff * Referral 0.000 0.000 0.010(0.97) (0.90) (0.88)
Executive * Referral 0.020 0.000 0.110(0.22) (0.38) (0.58)
Observations 62127 62127 1811 62127 62127 1811
Notes:P-values in parentheses. Marginal effects displayed.Excludes jobs postings that did not result in hires. Excludes 1 person pools. Reg (3) only includes those whoreceived interviews. Excluded category: Internet job posting, college required, mid-level staff