
Diurnal Variability of Surface Temperature over Lakes ...
13
Atmosphere 2021, 12, 252. https://doi.org/10.3390/atmos12020252 www.mdpi.com/journal/atmosphere Article Diurnal Variability of Surface Temperature over Lakes: Case Study for Lake Huron Wen Chen 1 , Rachel T. Pinker 1, *, Gerardo Rivera 2 and Simon Hook 2 1 Department of Atmospheric and Oceanic Science, University of Maryland, College Park, MD 20742, USA; [email protected] 2 NASA Jet Propulsion Laboratory, M/S 183-501, 4800 Oak Grove Drive, Pasadena, CA 91109, USA; [email protected] (G.R.); [email protected] (S.H.) * Correspondence: [email protected] Abstract: The significance of the diurnal variability of Lake Surface Temperature (LST) has been recognized; yet, its magnitude in terms of spatial and temporal variability is not well known. At- tempts have been made to derive such information from satellites at a high spatial resolution; how- ever, most have been made from polar orbiting satellites that sample only twice per day. We have developed an approach to derive such information from geostationary satellites at an hourly time scale and at a spatial resolution of about 5 km. The approach to derive LST uses the Radiative Trans- fer for TIROS Operational Vertical Sounder (TOVS) (RTTOV) model driven by the Modern-Era Ret- rospective analysis for Research and Applications (MERRA)-2 information. The methodology has been implemented over Lake Huron for about six years. We present the results of the evaluation against various independent satellite products and demonstrate that there is a strong diurnal vari- ability in the skin temperature over the lake and that the lowest and highest values, as derived twice per day from polar orbiting satellites, may not represent the magnitude of the Diurnal Temperature Range (DTR). Keywords: lake temperature from satellites; diurnal cycle of lake temperature; diurnal temperature range (DTR) for lakes 1. Introduction Information on Lake Surface Temperature (LST) is important for many applications, such as estimating the evaporation from lakes. For example, evaporation accounts for 95% of the water budget in Lake Tanganyika, East Africa, (Spigel and Coulter [1]; Verburg and Hecky [2]); evaporative water loss has also been reported for the Great Lakes (Gronewold [3]). It is also important in modulating the geographical variability in evaporative demand in the surrounding areas of lakes (Kiefer et al. [4]). Another interesting application is the ability to detect regions of upwelling over lakes. Steissberg et al. [5] used images from the Advanced Spaceborne Thermal Emission and Reflection Radiometer (ASTER), the En- hanced Thematic Mapper (ETM+), and the Moderate Resolution Imaging Spectroradiom- eter (MODIS) to observe the spatial variability of upwelling events at Lake Tahoe. An upwelling is a process whereby water from below the surface is transported to the surface, which is important for sustaining biological activity. Information on LST is also used to formulate the lake water balance and for the calibration of satellite-measured LST against in situ measurements (Hook et al. 2007 [6], Thome [7]). The estimation of the evaporation from lakes is quite challenging. Depending on the methodology used, it requires multiple variables including the net radiation, heat storage, air temperature, water surface “skin” temperature, humidity, wind speed, and stability of the atmosphere. Information on the Lake Surface Temperature (LST) and on the atmos- phere above are not readily available. The flux of water vapor from a water surface is Citation: Chen, W.; Pinker, R.T.; Rivera, G.; Hook, S. Diurnal Variability of Surface Temperature over Lakes: Case Study for Lake Huron. Atmosphere 2021, 12, 252. https://doi.org/10.3390/ atmos12020252 Received: 18 December 2020 Accepted: 5 February 2021 Published: 13 February 2021 Publisher’s Note: MDPI stays neu- tral with regard to jurisdictional claims in published maps and insti- tutional affiliations. Copyright: © 2021 by the authors. Li- censee MDPI, Basel, Switzerland. This article is an open access article distributed under the terms and con- ditions of the Creative Commons At- tribution (CC BY) license (http://crea- tivecommons.org/licenses/by/4.0/).
Transcript of Diurnal Variability of Surface Temperature over Lakes ...

Atmosphere 2021, 12, 252. https://doi.org/10.3390/atmos12020252 www.mdpi.com/journal/atmosphere
Article
Diurnal Variability of Surface Temperature over Lakes: Case Study for Lake Huron Wen Chen 1, Rachel T. Pinker 1,*, Gerardo Rivera 2 and Simon Hook 2
1 Department of Atmospheric and Oceanic Science, University of Maryland, College Park, MD 20742, USA; [email protected]
2 NASA Jet Propulsion Laboratory, M/S 183-501, 4800 Oak Grove Drive, Pasadena, CA 91109, USA; [email protected] (G.R.); [email protected] (S.H.)
* Correspondence: [email protected]
Abstract: The significance of the diurnal variability of Lake Surface Temperature (LST) has been recognized; yet, its magnitude in terms of spatial and temporal variability is not well known. At-tempts have been made to derive such information from satellites at a high spatial resolution; how-ever, most have been made from polar orbiting satellites that sample only twice per day. We have developed an approach to derive such information from geostationary satellites at an hourly time scale and at a spatial resolution of about 5 km. The approach to derive LST uses the Radiative Trans-fer for TIROS Operational Vertical Sounder (TOVS) (RTTOV) model driven by the Modern-Era Ret-rospective analysis for Research and Applications (MERRA)-2 information. The methodology has been implemented over Lake Huron for about six years. We present the results of the evaluation against various independent satellite products and demonstrate that there is a strong diurnal vari-ability in the skin temperature over the lake and that the lowest and highest values, as derived twice per day from polar orbiting satellites, may not represent the magnitude of the Diurnal Temperature Range (DTR).
Keywords: lake temperature from satellites; diurnal cycle of lake temperature; diurnal temperature range (DTR) for lakes
1. Introduction Information on Lake Surface Temperature (LST) is important for many applications,
such as estimating the evaporation from lakes. For example, evaporation accounts for 95% of the water budget in Lake Tanganyika, East Africa, (Spigel and Coulter [1]; Verburg and Hecky [2]); evaporative water loss has also been reported for the Great Lakes (Gronewold [3]). It is also important in modulating the geographical variability in evaporative demand in the surrounding areas of lakes (Kiefer et al. [4]). Another interesting application is the ability to detect regions of upwelling over lakes. Steissberg et al. [5] used images from the Advanced Spaceborne Thermal Emission and Reflection Radiometer (ASTER), the En-hanced Thematic Mapper (ETM+), and the Moderate Resolution Imaging Spectroradiom-eter (MODIS) to observe the spatial variability of upwelling events at Lake Tahoe. An upwelling is a process whereby water from below the surface is transported to the surface, which is important for sustaining biological activity. Information on LST is also used to formulate the lake water balance and for the calibration of satellite-measured LST against in situ measurements (Hook et al. 2007 [6], Thome [7]).
The estimation of the evaporation from lakes is quite challenging. Depending on the methodology used, it requires multiple variables including the net radiation, heat storage, air temperature, water surface “skin” temperature, humidity, wind speed, and stability of the atmosphere. Information on the Lake Surface Temperature (LST) and on the atmos-phere above are not readily available. The flux of water vapor from a water surface is
Citation: Chen, W.; Pinker, R.T.;
Rivera, G.; Hook, S. Diurnal
Variability of Surface Temperature
over Lakes: Case Study for Lake
Huron. Atmosphere 2021, 12, 252.
https://doi.org/10.3390/
atmos12020252
Received: 18 December 2020
Accepted: 5 February 2021
Published: 13 February 2021
Publisher’s Note: MDPI stays neu-
tral with regard to jurisdictional
claims in published maps and insti-
tutional affiliations.
Copyright: © 2021 by the authors. Li-
censee MDPI, Basel, Switzerland.
This article is an open access article
distributed under the terms and con-
ditions of the Creative Commons At-
tribution (CC BY) license (http://crea-
tivecommons.org/licenses/by/4.0/).

Atmosphere 2021, 12, 252 2 of 13
largely governed by the magnitude of the vapor pressure gradient between the water sur-face and the overlying air. This gradient is determined by the surface temperature of the water, the absolute humidity in the atmosphere (e.g., vapor pressure), and the amount of turbulent mixing of air. Since the surface skin temperature is not readily available, short-cuts have been taken to facilitate such computations from wind speed, temperature, air pressure, and relative humidity. For instance, the aerodynamic method of Chou et al. [8] for oceans uses air temperature for the estimation of the saturation vapor pressure at the water surface. However, the air temperature was found to be lower by 1 to 2 °C than the surface water temperature, and therefore some prefer to use water temperatures at a 1-m depth to estimate the saturation vapor pressure at the water surface. Information on the LST can be instrumental for improving this shortcoming.
Most of the satellites that are used for estimating LST are in polar orbits. Remote sensing of the temperature is based on recording the emitted radiation from the earth sur-face in the spectral domain of 8–14 μm. In the case of inland water bodies, the most com-mon approach is the split-window technique where the difference between the two adja-cent thermal channels (10.5–11.5 μm, 11.5–12.5 μm) is taken as a measure of atmospheric attenuation in order to derive the Surface Temperature (ST) (Becker and Li [9]; Sobrino et al. [10]; Wan and Dozier [11]). Typically, ASTER data are acquired twice every 16 days, which is similar to Landsat, for which data at night are only saved by special request. MODIS data are acquired twice daily, but not at optimal times to observe the Diurnal Temperature Range (DTR). The hourly observation from geostationary satellites can meet the need for estimating the DTR (Sun et al. [12]). This is important since this parameter is used to address various scientific questions such as the impact of global warming on the DTR, as seen in the asymmetric trends of the daily maximum and minimum temperature, as discussed in Easterling et al. [13], Karl and Karoly [14], and Karl et al. [15–18]. Changes in DTR have many possible causes (cloud cover, aerosols, water vapor, or green-house gases). It was shown that lakes’ summer surface water temperatures rose rapidly (global mean of 0.34 °C/decade) between 1985 and 2009 (O’Reilly et al. [19]). There is evidence that global warming does have an impact on lake temperatures (Coats et al. [20]). Several studies have investigated the impacts of climate change on the lake surface water temper-ature (Livingstone [21]; Magee et al. [22]) and provided evidence that lakes are warming on a global scale (Schneider and Hook [23]). Woolway et al. [24] analyzed observational data from eight European lakes and investigated the changes in the annual minimum sur-face water temperature; they noted a substantial increase in the minimum lake surface temperature at an average rate of + 0.35 °C decade−1.
The lack of long-term in-situ data at a high temporal frequency is the main obstacle in identifying long-term trends. In this context, data from remote sensing as a substitute to in-situ data could play a key role in limnologic studies. The purpose of our study is to demonstrate that it is now possible to assess the temporal and spatial variability of LST in a systematic way, which is an important contribution for advancing research related to lakes. In Section 2, we will describe data used in this study; Section 3 will provide results and a summary, and discussion will be provided in Section 4.
2. Data Used in Current Study In the current study, LST as available from: (a) https://largelakes.jpl.nasa.gov/; (b) as
estimated from the Geostationary Operational Environmental Satellite East (GOES˗E) at the University of Maryland (UMD); and c) as derived from MODIS (Wan, [25]) will be compared at the Lake Huron JPL site (JPL500: 44.757° N, 82.34° W).
2.1. LST As Provided by JPL Several estimates of LST are provided from satellite observations at https://large-
lakes.jpl.nasa.gov/ for 169 of the world’s largest lakes. Specifically, the following satellite systems have been used: MODIS/Terra, MODIS/Aqua, AASTR, and the Advanced Very
Atmosphere 2021, 12, 252 3 of 13
High Resolution Radiometer (AVHRR) PathFinder data (http://data.nodc.noaa.gov/path-finder/Version5.2/). The methodology used to obtain the surface temperatures is given in Schneider and Hook [23]. For Lake Huron, the observations are taken at a site centered at JPL500 (44.757° N, 82.34° W). The data selection criteria used for the above data are: cloud free cases of good quality and an instrument viewing angle between –50 ° ~ +50 °. The data used in the comparison with the JPL products are from 2004 to 2008 only.
2.2. MODIS Daily Products We also used the MOD11C1 (Terra) version 6 LST as described in Wan [25]. This
product provides daytime and nighttime Land Surface Temperature and Emissivity val-ues in a 0.05 degree latitude/longitude Climate Modeling Grid (CMG) (5600 m at the equa-tor). A CMG granule follows a geographic grid, having 7200 columns and 3600 rows, which represent the entire globe. Each MOD11C1 product consists of the following infor-mation for daytime and nighttime: LST, quality control assessments, observation times, view zenith angles, number of clear-sky observations, and emissivity from bands 20, 22, 23, 29, 31, and 32 (bands 31 and 32 are daytime only), along with the percentage of land in the grid. As such, it can be used for estimating a proxy DTR. A detailed description of the product and downloading links can be found at: https://lpdaac.usgs.gov/prod-ucts/mod11c1v006/.
2.3. UMD GOES-E LST The Geostationary Operational Environment Satellite (GOES) systems (East and
West) provide continuous, timely, and high-quality observations over much of the West-ern Hemisphere. Since the GOES data archive extends well over three decades, its appli-cations for long-term climate change studies are being used extensively. The UMD GOES˗E LST product is based on a single channel retrieval methodology (Pinker et al. [26]) using the Radiative Transfer for TOVS (RTTOV) model v11.2 adjusted for the GEO-characteristics with atmospheric profiles data from the Modern-Era Retrospective analysis for Research and Applications (MERRA) ˗ 2 reanalysis four times a day (00, 06, 12, 18 h) (Ge-laro et al. [27]) and the CAMEL emissivity information (Borbas et al. [28]). The GOES product provides hourly LST from 2004 to 2009 at a 0.05° × 0.05° spatial resolution. This is important for many applications; for instance, most satellites estimate DTR from polar orbiting satellites that do not observe at optimal times in order to estimate DTR. Moreover, an evaluation against the “true” DTR as estimated from GOES observations will provide an opportunity to estimate bias in products based on the polar orbiters.
2.4. Spatial and Temporal Matching To accomplish spatial matching, we use the “nearest point” concept with respect to
the JPL500 location. If the number of GOES˗E nearest points is more than 2, the mean value of these points is calculated and weighted with their latitude and longitude. The time difference between the JPL LST and those from the GOES˗E nearest points must be under ±15 min.
3. Results In Figure 1, we compare the JPL products with the GOES˗E UMD estimates. It shows
the matched instantaneous cases for a period of five years (2004–2008). In general, there seems to be a good agreement between the various products, with few outliers for MODIS Terra and Aqua (red and blue dots). The possible reason for the outliers may be related to cloud detection issues for the illustrated cases.

Atmosphere 2021, 12, 252 4 of 13
Figure 1. Instantaneous LST as derived from the JPL archive for MODIS/Terra, MODIS/Aqua, AATSR, and from GOES-E UMD (matched in both time (±15 min) and location (0.05° × 0.05° box)) at JPL500 (44.757° N, 82.34° W). Red dot: MODIS/Aqua; Blue dot: MODIS/Terra; Green plus: AATSR; Black square: UMD GOES-E LST. Period covered is 2004–2008.
A comparison was also made between the GOES-E UMD product and the AVHRR PathFinder estimates (Figure 2). The PathFinder record is of interest since it spans climatic time scales. Few outliners in the PathFinder data are evident, yet the patterns of annual and interannual variations from both data sources follow each other closely with a corre-lation coefficient of 0.98. Overall, the AVHRR PathFinder results systematically overesti-mate the GOES-E values. The mean difference between them is about 1.34 °C (Table 1). This comparison will allow one to assess possible biases in the long-term AVHRR Path-Finder data.
Figure 2. Instantaneous LST as derived from the JPL archive for PathFinder and from GOES-E UMD. Red dot: PathFinder data; Blue dot: GOES-E UMD. Period covered is 2004–2008.
In Figure 3, we show the probability distribution of the differences in LST between MODIS/Aqua, MODIS/Terra, AATSR, AVHRR PathFinder, and GOES˗E UMD for 2004–2008. The statistics are given in Table 1. As evidenced, a better agreement is found between MODIS/Terra, MODIS/Aqua, AASTR, and GOES-E as compared to the AVHRR Path-Finder. The mean difference is less than 0.5 °C, and the Std and RMSE are less than 1.5 °C. The AVHRR PathFinder overestimates GOES-E, the Std (1.26 °C) and RMSE (1.83 °C) be-ing relatively larger than for the other cases.

Atmosphere 2021, 12, 252 5 of 13
Figure 3. Probability density distribution of the LST differences between MODIS/Aqua, MODIS/Terra, AATSR, AVHRR PathFinder, and GOES-E UMD for the period of 2004–2008.
Table 1. Statistics for Figure 3 comparing the differences between GOES-E and all the other JPL products.
GOES-E r Bias Std RMSE N PathFinder 0.98 1.34 1.26 1.83 318
MODIS-Terra 0.99 0.42 1.17 1.24 268 MODIS-Aqua 0.99 0.29 0.98 1.02 270
AASTR 0.99 0.38 1.06 1.12 102
In Figure 4, we illustrate the spatial and temporal variability of the “climatological” mean LST at different UTC times from GOES˗E during the period of 2004–2009. Specifi-cally, the averages for UTC00, UTC06, UTC12, and UTC18 (images for other hours are omitted) are shown. The LST temperature varies with time and space. In Figure 5, we show the frequency distribution of LST for cases illustrated in Figure 4. As evidenced, between UTC00 to UTC18 the median values can change between 9.5 and 11.2 °C, while the maxima range between 15.6 and 24.9 °C and the minima range between ˗0.5 and 3.60 °C. The temperature changes over time and space have implications for the estimates of the lake’s water budget.

Atmosphere 2021, 12, 252 6 of 13
Figure 4. Average LST at different UTC times from GOES-E during the period of 2004–2009. Shown are the following cases: (a) UTC00; (b) UTC06; (c) UTC12; and (d) UTC18.
Figure 5. Frequency distribution of hourly LSTs as derived from GOES-E for cases illustrated in Figure 4: (a) UTC00; (b) UTC06; (c) UTC1; and (d) UTC18.
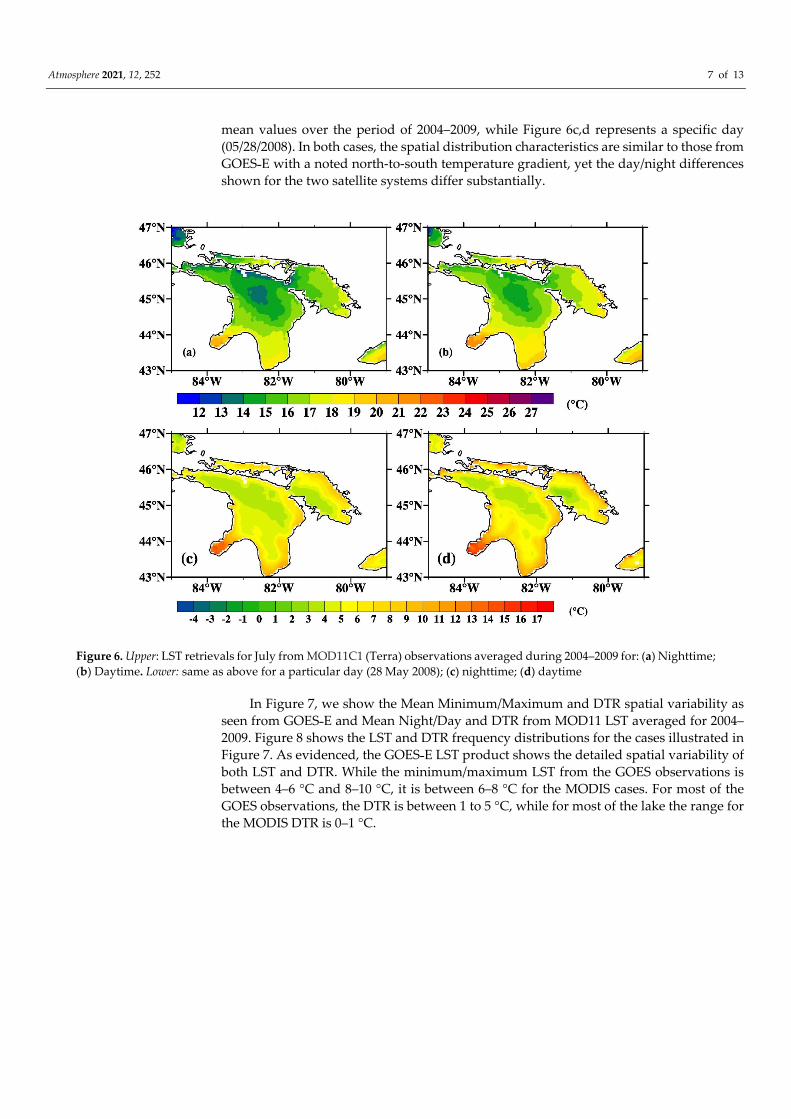
In Figure 6, we show an example of two types of observations for Lake Huron, as derived from MOD11C1 during daytime and nighttime in July. Figure 6a,b represents the
Atmosphere 2021, 12, 252 7 of 13
mean values over the period of 2004–2009, while Figure 6c,d represents a specific day (05/28/2008). In both cases, the spatial distribution characteristics are similar to those from GOES˗E with a noted north-to-south temperature gradient, yet the day/night differences shown for the two satellite systems differ substantially.
Figure 6. Upper: LST retrievals for July from MOD11C1 (Terra) observations averaged during 2004–2009 for: (a) Nighttime; (b) Daytime. Lower: same as above for a particular day (28 May 2008); (c) nighttime; (d) daytime
In Figure 7, we show the Mean Minimum/Maximum and DTR spatial variability as seen from GOES˗E and Mean Night/Day and DTR from MOD11 LST averaged for 2004–2009. Figure 8 shows the LST and DTR frequency distributions for the cases illustrated in Figure 7. As evidenced, the GOES˗E LST product shows the detailed spatial variability of both LST and DTR. While the minimum/maximum LST from the GOES observations is between 4–6 °C and 8–10 °C, it is between 6–8 °C for the MODIS cases. For most of the GOES observations, the DTR is between 1 to 5 °C, while for most of the lake the range for the MODIS DTR is 0–1 °C.

Atmosphere 2021, 12, 252 8 of 13
Figure 7. Left Column: (a) mean values of Min LST; (b) mean value of Max LST; (c) mean value of DTR as derived from GOES-E UMD; Right Column: same as the left column using information from MOD11C1 (Terra); (d) mean value of nighttime; (e) mean value of daytime; (f) mean value of proxy DTR All values are averaged for 2004–2009.

Atmosphere 2021, 12, 252 9 of 13
Figure 8. LST frequency distributions for the cases illustrated in Figure 7. Left Column: (a) mean values of Min LST; (b) mean value of Max LST; (c) mean value of DTR as derived from GOES-E UMD; Right Column: same as the left column using information from MOD11C1 (Terra); (d) mean value for nighttime; (e) mean value for daytime; (f) mean value for proxy DTR. All values are averaged for 2004–2009.
In Figure 9a, we show the annual variability of the average true minimum and max-imum LST over the lake as documented from GOES-E. In Figure 9b, the annual variability of the average nighttime and daytime values, as observed from MOD11C1, are presented.

Atmosphere 2021, 12, 252 10 of 13
These are frequently used to represent the DTR. As seen, the observations from polar or-biting satellites do not represent the true DTR well. Both GOES˗E and MOD11C1 capture the annual heating progress of the lake, with a maximum temperature reached in August (thermal inertia of water). However, the seasonality of the changes between the maximum and minimum or day and night LST differs. MOD11C1 observations show the same changes between day and night LST from January to December, while the changes be-tween the maximum and minimum LST from GOES˗E vary with the season.
Figure 9. (a) Annual change of the average maximum/minimum LST (DTR) over Lake Huron from GOES-E during 2004–2009; (b) annual change of the average Day/Night LST over Lake Huron from MOD11C1 (Terra) during 2004–2009.
4. Discussion Surface temperature plays a significant role in the water budget of lakes and the func-
tioning of lake ecosystems. It affects the thermal stratification, the solubility of dissolved oxygen, the metabolism and respiration of the lake’s fauna and flora, and the toxicity of pollutants (Stefan et al. [29]). Thermal infrared data from historical and recently launched satellites provide an opportunity to derive long-term information about the Earth surface temperature at unprecedented spatial and temporal resolutions. Such information has not
Atmosphere 2021, 12, 252 11 of 13
been readily available in the past, but it is needed in order to address key scientific issues related to climate change, to the energy budget at the surface, and to the development of new applications. Geostationary satellites have contributed substantially to the improve-ment in available temporal variability. The continuation of newly developed systems such as GOES˗16 and 17 (Laszlo et al. [30]) and HIMAWARI˗8/9 (Bessho et al. [31]) is enhancing the prospects for the usefulness of such records. Of particular interest is the impact of global warming on DTR due to differences in atmospheric heating during daytime and nighttime. The determination of heat transfer into the subsurface also requires infor-mation on the diurnal cycle of the surface temperature.
In this paper, we focus on the diurnal cycle of the temperature over Lake Huron as derived from GOES˗E LST at an hourly time scale and at a spatial resolution of about 5 km for a period of six years. We compare our results against JPL and MOD11C1 products. We found a diurnal variability of 1–5 °C in the skin temperature over the lake as observed from GOES˗E and that such a variability, when derived from the polar orbiting satellite, was much smaller, in the range of 0–1 °C. The magnitude of this variability (DTR), when observed from GOES˗E, changes with time and space. The proxy observations of DTR from MOD11C1 seem to have a constant value over the seasons.
Since information on the spatial and temporal variability of LST is of interest, initial attempts tried to model it empirically from air temperature at various time scales (Leath-ers et al. [32]; Shuter et al. [33]; McCombie [34]), (Livingstone and Lotter [35]; Livingstone et al. [36]). Sun et al. [37] applied a coupled atmosphere-lake model, which consisted of the NOAA Weather Research and Forecasting (WRF) model and the Princeton Ocean Model (POM), in order to understand the LST variability over lakes. It attempted to esti-mate mean daily lake surface water temperatures using only the air temperature, theoret-ical clear-sky solar radiation, and lake size. To verify the approach, measurements were made at a selection of lakes in southwest Greenland during the summers of 1998–2000. Picolroaz [38] simulated the lake surface temperature by means of a hybrid physically based/statistical model, also only using air temperature. When applied to Lake Superior and Lake Erie, the model showed performances that were comparable with those obtained when using process-based models. Sharma et al. [39] developed models that predicted annual maximum near-surface lake water temperatures for lakes across Canada using four statistical approaches. They found that climatic variables and the date of sampling were the most important factors for predicting the water temperature, while the lake mor-phology did not play a substantial role in the predictions across any of the spatial scales.
All of the diverse studies mentioned above demonstrate the extensive efforts made to obtain information on LST at various spatial and temporal resolution scales. Our study addresses the issue of such variability when it is detectable from space at unprecedented spatial and temporal scales and evaluates the credibility of the information. It is hoped that the derived information will result in useful applications in lake investigations.
Author Contributions: Conceptualization, R.T.P.; methodology, R.T.P. and W.C.; software, W.C.; validation, G.R. and W.C.; writing-original draft preparation, R.T.P. and W.C.; writing-review and editing, R.T.P. and W.C.; project administration, S.H.; writing-review and funding acquisition, S.H. All authors have read and agreed to the published version of the manuscript.
Funding: This research was funded by grant NNH12ZDA001N-MEASURES from NASA to JPL.
Institutional Review Board Statement: Not applicable.
Informed Consent Statement: Not applicable.
Data Availability Statement: The data are being prepared for publication on a website. Prior to this, the formal publication can be obtained upon request.
Acknowledgments: We acknowledge information from the MOD11_L2: MODIS/Terra Land Sur-face Temperature and Emissivity 5-Minute L2 Swath 1 km V006 data base (Zhengming Wan, PI), (https://search.earthdata.nasa.gov/search/graules/colltiondtails?p=C194001236LPDAAC_ECS&m=26.4375!136.6875!0!1!0!0%2C2&tl=1515438649!4!!&q=MOD11_L2%20V006), as provided under the

Atmosphere 2021, 12, 252 12 of 13
courtesy of the NASA EOSDIS Land Processes Distributed Active Archive Center (LP DAAC), USGS/Earth Resources Observation and Science (EROS) Center, Sioux Falls, South Dakota. GOES data were obtained from the NOAA Comprehensive Large Array data Stewardship system (CLASS) (https://www.bou.class.noaa.gov/saa/proucts/search?sub_id=0&datatype_faily=GVAR_IMG&sub-mit.x=25&submit.y=8). The team efforts in generating and providing all the required data are greatly appreciated.
Conflicts of Interest: The authors declare no conflict of interest. The funders had no role in the design of the study; in the collection, analyses, or interpretation of data; in the writing of the manu-script, or in the decision to publish the results.
References 1. Spigel, R.H.; Coulter, J.B. The Limnology Climatology and Paleoclimatology of the East African Lakes; Johnson, T.C., Okada, E.O., Eds.;
Gordon and Breach Publishers: Amsterdam, The Netherlands, 2007; pp. 103–140. 2. Verburg, P.; Hecky, R.E.; Kling, H. Ecological consequences of a century of warming in Lake Tanganyika. Science 2003, 25, 505–
507, doi:10.1126/science.1084846. 3. Gronewold, A.D.; Stow, C.A. Water loss from the Great Lakes. Science 2014, 343, 1084–1085, doi:10.1126/science.1249978. 4. Kiefer, I.; Odermatt, D.; Anneville, O.; Wüest, A.; Bouffard, D. Application of remote sensing for the optimization of in-situ
sampling for monitoring of phytoplankton abundance in a large lake. Sci. Total Environ. 2015, 527, 493–506, doi: 10.1016/j.sci-totenv.2015.05.011.
5. Steissberg, T.E.; Hook, S.J.; Schladow, S.G. Characterizing partial upwellings and surface circulation at Lake Tahoe, California-Nevada, USA with thermal infrared images. Remote Sens. Environ. 2005, 99, 2–15.
6. Hook, S.J.; Vaughan, R.G.; Tonooka, H.; Schladow, S.G. Absolute radiometric in-flight validation of mid infrared and thermal infrared data from ASTER and MODIS on the terra spacecraft using the Lake Tahoe, CA/NV, USA, automated validation site. IEEE Trans. Geosci. Remote Sens. 2007, 45, 1798–1807.
7. Thome, K.J. In-flight inter-sensor radiometric calibration using vicarious approaches. In Post-Launch Calibration of Satellite Sen-sors; Morain, S.A., Budge, A.M., Eds.; Taylor and Francis: London, UK, 2004; pp. 95–102.
8. Chou, S.-H.; Ferguson, M.P. Heat fluxes and roll circulations over the western Gulf Stream during an intense cold-air outbreak. Bound. Layer Meteorol. 1991, 55, 255–281.
9. Becker, F.; Li, Z.L. Toward a local split window method over land surface. Int. J. Remote Sens. 1990, 11, 369–393. 10. Sobrino, J.A.; Li, Z.L.; Stoll, M.P.; Becker, F. Improvements in the split window technique for land surface temperature deter-
mination. IEEE Trans. Geosci. Remote Sens. 1994, 32, 243–253. 11. Wan, Z.M.; Dozier, J. A generalized split-window algorithm for retrieving land-surface temperature from space. IEEE Trans.
Geosci. Remote Sens. 1996, 34, 892–905. 12. Sun, D.; Pinker, R.T.; Kafatos, M. Diurnal temperature range over the United States: A satellite view. Geophys. Res. Lett. 2006, 33,
L05705. 13. Easterling, D.R.; Horton, B.; Jones, P.D.; Peterson, T.C.; Karl, T.R. Maximum and minimum temperature trends for the globe.
Science 1997, 277, 364–367. 14. Karl, T.R.; Karoly, D.J. Diurnal temperature range as an index of global climate change during the twentieth century. Geophys.
Res. Lett. 2004, 31, L13217. 15. Karl, T.R.; Knight, R.W.; Gallo, K.P.; Peterson, T.C.; Jones, P.D.; Kukla, G.; Plummer, N.; Razuvayev, V.; Lindseay, J.; Charlson,
R.J. A new perspective on recent global warming: Asymmetric trends of daily maximum and minimum temperature. Bull. Am. Meteorol. Soc. 1993, 74, 1007–1023.
16. Karl, T.R.; Kukla, G.; Razuvayev, V.N. Global warming: Evidence for asymmetric diurnal temperature change. Geophys. Res. Lett. 1991, 18, 2253–2256.
17. Karl, T.R.; Kukla, G.; Gavin, J. Decreasing diurnal temperature range in the United States. J. Clim. Appl. Meteorol. 1984, 23, 1489–1504.
18. Karl, T.R.; Kukla, G.; Gavin, J. Recent temperature changes during overcast and clear skies on the United States. J. Clim. Appl. Meteorol. 1987, 26, 698–711.
19. O’Reilly, C.M.; Sharma, S.; Gray, D.K.; Hampton, S.E.; Read, J.S.; Rowley, R.J.; Schneider, P.; Lenters, J.D.; McIntyre, P.B.; Kra-emer, B.M.; et al. Rapid and highly variable warming of lake surface waters around the globe. Geophys. Res. Lett. 2015, 42, 1–9, doi:10.1002/2015gl066235.
20. Coats, R.; Perez-Losada, J.; Schladow, G.; Richards, R.; Goldman, C. The warming of Lake Tahoe. Clim. Change 2006, 76, 121–148.
21. Livingstone, D.M. Impact of secular climate change on the thermal structure of a large temperate central European lake. Clim. Change 2003, 57, 205–225.
22. Magee, M.R.; Wu, C.H.; Robertson, D.M.; Lathrop, R.C.; Hamilton, D.P. Trends and abrupt changes in 104 years of ice cover and water temperature in a dimictic lake in response to air temperature, wind speed, and water clarity drivers. Hydrol. Earth Syst. Sci. 2016, 20, 1681–1702.

Atmosphere 2021, 12, 252 13 of 13
23. Schneider, P.; Hook, S.J. Space observations of inland water bodies show rapid surface warming since 1985. Geophys Res Lett. 2010, 37, L22405, doi:10.1029/2010GL045059.
24. Woolway, R.I.; Weyhenmeyer, G.A.; Schmid, M.; Dokulil, M.T.; de Eyto, E.; Maberly, S.C.; May, L.; Merchant, C.J. Substantial increase in minimum lake surface temperatures under climate change. Clim. Change 2019, 155, 81–94.
25. Wan, Z. MODIS Land Surface Temperature Products Users’ Guide; Collection-6, ERI; University of California: Santa Barbara, CA, USA, 2014; doi:10.5067/MODIS/MOD11_L2.006.
26. Pinker, R.T.; Ma, Y.; Chen, W.; Hulley, G.; Borbas, E.; Islam, T.; Hain, C.; Cawse-Nicholson, K.; Hook, S.; Basara, J. Towards a unified and coherent land surface temperature Earth system data record from geostationary satellites. Remote Sens. 2019, 11, 1399.
27. Gelaro, R.; McCarty, W.; Suárez, M.J.; Todling, R.; Molod, A.; Takacs, L.; Randles, C.A.; Darmenov, A.; Bosilovich, M.G.; Reichle, R.; et al. The modern-era retrospective analysis for research and applications, version 2 (MERRA-2). J. Clim. 2017, 30, 5419–5454.
28. Borbas, E.; Hulley, G.; Feltz, M.; Knuteson, R.; Hook, S. The combined ASTER MODIS emissivity over land (CAMEL) Part 1: Methodology and high spectral resolution application. Remote Sens. 2018, 10, 643.
29. Stefan, H.G.; Fang, X.; Hondzo, M. Simulated climate change effects on year-round water temperatures in temperate zone lakes. Clim. Change 1998, 40, 547–576.
30. Laszlo, I.; Liu, H.; Kim, H.-Y.; Pinker, R.T. Shortwave radiation from ABI on the GOES-R series (Chapter 15). In SERIES: A New Generation of Geostationary Environmental Satellites 2019; Goodman, S.J., Schmit, T.J., Daniels, J., Redmon, R.J., Eds.; Elsevier: Amsterdam, The Netherlands, 2020.
31. Bessho, K.; Date, K.; Hayashi, M.; Ikeda, A.; Imai, T.; Inoue, H.; Kumagai, Y.; Miyakawa, T.; Murata, H.; Ohno, T.; et al. An introduction to Himawari-8/9—Japan’s new-generation geostationary meteorological satellites. J. Meteorol. Soc. Jpn. 2016, 94, 151–183, doi:10.2151/jmsj.2016-009.
32. Leathers, D.J.; Palecki, M.A.; Robinson, R.A.; Dewey, K.F. Climatology of the daily temperature range annual cycle in the United States. Clim. Res. 1998, 9, 197–211.
33. Shuter, B.J.; Schlesinger, B.A.; Zimmerman, A.P. Empirical predictors of annual surface water temperature cycles in North American lakes. Can. J. Fish. Aquat. Sci. 1983, 40, 1838–1845.
34. McCombie, A.M. Some relations between air temperatures and the surface water temperatures of lakes. Limnol. Oceanogr. 1959, 4, 252–258.
35. Livingstone, D.M.; Lotter, A.F. The relationship between air and water temperatures in lakes of the Swiss Plateau: A case study with pal\sgmaelig;olimnological implications. J. Paleolimnol. 1998, 19, 181–198.
36. Livingstone, D.M.; Lotter, A.F.; Walkery, I.R. The decrease in summer surface water temperature with altitude in Swiss Alpine Lakes: A comparison with air temperature lapse rates. Arct. Antarct. Alpine Res. 1999, 31, 341–352, doi:10.1080/15230430.1999.12003319.
37. Sun, X.; Xie, L.; Semazzi, F.H.M.; Liu, B. A numerical investigation of the precipitation over lake Victoria Basin using a coupled atmosphere-lake limited-area model. Adv. Meteorol. 2014, 2014, 960924, doi:10.1155/2014/960924.
38. Picolroaz, S. Prediction of lake surface temperature using the air2water model: Guidelines, challenges, and future perspectives. Adv. Oceanogr. Limnol. 2016, 7, doi:10.4081/aiol.2016.5791.
39. Sharma, S.; Walker, C.; Jackson, D.A. Empirical modelling of lake-water-temperature relationships: A comparison of approaches SAPNA. Freshwater Biol. 2008, 53, 897–911, doi:10.1111/j.1365-2427.2008.01943.x.


![Diurnal and Nocturnal Animals. Diurnal Animals Diurnal is a tricky word! Let’s all say that word together. Diurnal [dahy-ur-nl] A diurnal animal is an.](https://static.fdocuments.in/doc/165x107/56649dda5503460f94ad083f/diurnal-and-nocturnal-animals-diurnal-animals-diurnal-is-a-tricky-word-lets.jpg)