Diurnal cycle of the Intertropical Convergence Zone in the ... · Diurnal cycle of the...
10
Diurnal cycle of the Intertropical Convergence Zone in the east Pacific C. L. Bain, 1,2 G. Magnusdottir, 1 P. Smyth, 3 and H. Stern 4 Received 27 July 2010; revised 15 September 2010; accepted 4 October 2010; published 4 December 2010. [1] A data set of Intertropical Convergence Zone (ITCZ) extent and location in the eastern Pacific, 90°W–180°W, 0°N–25°N, is used to examine the diurnal cycle of cloudiness over the ocean. The data set was generated using a statistical model which utilizes 30 year, 3‐hourly infrared (IR) satellite data from 1980 to 2009. The ITCZ envelope of convection has a significant diurnal cycle across the whole domain, and the area of cloudiness “pulses” in extent, peaking in the afternoon. The diurnal cycle of brightness temperatures within the ITCZ changes from east to west, but generally there are two minima in mean IR, implying cold cloud is at a peak: one in the morning, 0600–0900 LST, and another in the afternoon, 1300–1600 LST. Decomposition of cloud top temperatures show that high cloud is at a maximum in the early morning and midlevel cloud peaks in the afternoon. Low cloud is at a maximum in the late evening (2200–0000 LST) and is immediately followed by increases in high cloud, suggesting that the deepest convective systems grow rapidly, within a few hours overnight. There are seasonal changes in the diurnal cycle of cloud top temperature, and it is suggested that colder mean temperatures are more likely in the afternoon when the ITCZ is more extensive. This is shown via seasonal changes and also by comparing El Niño years, when ITCZ is more present, to La Niña years. Citation: Bain, C. L., G. Magnusdottir, P. Smyth, and H. Stern (2010), Diurnal cycle of the Intertropical Convergence Zone in the east Pacific, J. Geophys. Res., 115, D23116, doi:10.1029/2010JD014835. 1. Introduction [2] The Intertropical Convergence Zone (ITCZ) can be seen as an organized zonal band of convection in the central and eastern Pacific during boreal summertime (May to October), when large‐scale low‐level convergence and convection occurs north of the equator. Here we use a newly generated data set [Bain et al., 2010] of ITCZ location and extent to characterize the diurnal cycle of convection within the ITCZ. The diurnal cycle has a strong signature in the tropics and presents an excellent framework, for example, for validating the cloud convection schemes that are used in global circulation models. The ITCZ data used in this study are available every 3 h, May through October, for 30 years from 1980 to 2009. The data set was created by a statistical model which identifies the ITCZ envelope of organized convection, rather than using a threshold of cold cloud. With this statistical approach, the ITCZ may include low clouds and clear sky if they are contained within the larger cloudy zone, and therefore represents the large‐scale weather fea- ture rather than deep convection only. [3] Tropical precipitation is highly influenced by the diurnal cycle of insolation. Satellite and weather station observations have shown that the diurnal cycle has a greater influence over land than in oceanic regions [Meisner and Arkin, 1987; Hendon and Woodberry, 1993]. However, Yang and Slingo [2001] noted that the strong diurnal signal over land can have influence over adjacent ocean regions, up to several hundred kilometers. In the western Pacific, this behavior has been noted near to island territories [Houze et al., 1981]. [4] The timing of convection is different for land and ocean, with deep convective peaks mostly in the late after- noon over land, and in the early morning over ocean [e.g., Janowiak et al., 1994]. This was also found in the idealized modeling studies of Liu and Moncrieff [1997]. The early morning peak in convection is often followed by a second peak in cloud or rain in the afternoon. For example, Chen and Houze [1997] found that small cloud systems over the west Pacific Ocean had two peaks, one at 0300–0600 local standard time (LST), the other at 1500–1800 LST. Some studies refer to this second peak as being part of a semidi- urnal cycle in convection over ocean. Not all observational studies have noted the second peak in convection, and there are varied opinions on the timing of the early morning peak. [5] Table 1 summarizes some of the key observational studies on the diurnal cycle of convection over ocean regions. The papers have been highly summarized and the techniques often simplified to provide quick comparisons. It is recommended to consult individual papers for provision 1 Department of Earth System Science, University of California, Irvine, California, USA. 2 Now at Met Office, Exeter, UK. 3 Department of Computer Science, University of California, Irvine, California, USA. 4 Department of Statistics, University of California, Irvine, California, USA. Copyright 2010 by the American Geophysical Union. 0148‐0227/10/2010JD014835 JOURNAL OF GEOPHYSICAL RESEARCH, VOL. 115, D23116, doi:10.1029/2010JD014835, 2010 D23116 1 of 10
Transcript of Diurnal cycle of the Intertropical Convergence Zone in the ... · Diurnal cycle of the...
Diurnal cycle of the Intertropical Convergence Zonein the east Pacific
C. L. Bain,1,2 G. Magnusdottir,1 P. Smyth,3 and H. Stern4
Received 27 July 2010; revised 15 September 2010; accepted 4 October 2010; published 4 December 2010.
[1] A data set of Intertropical Convergence Zone (ITCZ) extent and location in the easternPacific, 90°W–180°W, 0°N–25°N, is used to examine the diurnal cycle of cloudiness overthe ocean. The data set was generated using a statistical model which utilizes 30 year,3‐hourly infrared (IR) satellite data from 1980 to 2009. The ITCZ envelope of convectionhas a significant diurnal cycle across the whole domain, and the area of cloudiness“pulses” in extent, peaking in the afternoon. The diurnal cycle of brightness temperatureswithin the ITCZ changes from east to west, but generally there are two minima in mean IR,implying cold cloud is at a peak: one in the morning, 0600–0900 LST, and another in theafternoon, 1300–1600 LST. Decomposition of cloud top temperatures show that highcloud is at a maximum in the early morning and midlevel cloud peaks in the afternoon.Low cloud is at a maximum in the late evening (2200–0000 LST) and is immediatelyfollowed by increases in high cloud, suggesting that the deepest convective systems growrapidly, within a few hours overnight. There are seasonal changes in the diurnal cycleof cloud top temperature, and it is suggested that colder mean temperatures are more likelyin the afternoon when the ITCZ is more extensive. This is shown via seasonal changesand also by comparing El Niño years, when ITCZ is more present, to La Niña years.
Citation: Bain, C. L., G. Magnusdottir, P. Smyth, and H. Stern (2010), Diurnal cycle of the Intertropical Convergence Zonein the east Pacific, J. Geophys. Res., 115, D23116, doi:10.1029/2010JD014835.
1. Introduction
[2] The Intertropical Convergence Zone (ITCZ) can beseen as an organized zonal band of convection in the centraland eastern Pacific during boreal summertime (May toOctober), when large‐scale low‐level convergence andconvection occurs north of the equator. Here we use a newlygenerated data set [Bain et al., 2010] of ITCZ location andextent to characterize the diurnal cycle of convection withinthe ITCZ. The diurnal cycle has a strong signature in thetropics and presents an excellent framework, for example,for validating the cloud convection schemes that are used inglobal circulation models. The ITCZ data used in this studyare available every 3 h, May through October, for 30 yearsfrom 1980 to 2009. The data set was created by a statisticalmodel which identifies the ITCZ envelope of organizedconvection, rather than using a threshold of cold cloud. Withthis statistical approach, the ITCZ may include low cloudsand clear sky if they are contained within the larger cloudyzone, and therefore represents the large‐scale weather fea-ture rather than deep convection only.
[3] Tropical precipitation is highly influenced by thediurnal cycle of insolation. Satellite and weather stationobservations have shown that the diurnal cycle has a greaterinfluence over land than in oceanic regions [Meisner andArkin, 1987; Hendon and Woodberry, 1993]. However,Yang and Slingo [2001] noted that the strong diurnal signalover land can have influence over adjacent ocean regions,up to several hundred kilometers. In the western Pacific,this behavior has been noted near to island territories [Houzeet al., 1981].[4] The timing of convection is different for land and
ocean, with deep convective peaks mostly in the late after-noon over land, and in the early morning over ocean [e.g.,Janowiak et al., 1994]. This was also found in the idealizedmodeling studies of Liu and Moncrieff [1997]. The earlymorning peak in convection is often followed by a secondpeak in cloud or rain in the afternoon. For example, Chenand Houze [1997] found that small cloud systems over thewest Pacific Ocean had two peaks, one at 0300–0600 localstandard time (LST), the other at 1500–1800 LST. Somestudies refer to this second peak as being part of a semidi-urnal cycle in convection over ocean. Not all observationalstudies have noted the second peak in convection, and thereare varied opinions on the timing of the early morning peak.[5] Table 1 summarizes some of the key observational
studies on the diurnal cycle of convection over oceanregions. The papers have been highly summarized and thetechniques often simplified to provide quick comparisons. Itis recommended to consult individual papers for provision
1Department of Earth System Science, University of California, Irvine,California, USA.
2Now at Met Office, Exeter, UK.3Department of Computer Science, University of California, Irvine,
California, USA.4Department of Statistics, University of California, Irvine, California, USA.
Copyright 2010 by the American Geophysical Union.0148‐0227/10/2010JD014835
JOURNAL OF GEOPHYSICAL RESEARCH, VOL. 115, D23116, doi:10.1029/2010JD014835, 2010
D23116 1 of 10
Tab
le1.
Sum
maryof
Leading
Paperson
Diurnal
Cycle
Observatio
nsOvertheOcean
Study
Region
Data
RecordTim
eCon
vectivePeakOverOcean
Grayan
dJacobson
[197
7]a
Tropics
surfacestationrainfallacross
trop
ics
12yearsof
8mon
ths
(March–O
ct19
61–1
973)
Early
morning
peak
(stron
gerifconv
ectio
nstrong
er),
afternoo
npeak
introp
ical
Atlantic
Dorman
andBou
rke[197
9]a
Pacific
ship
rainfallob
servations
22years(195
0–19
72)
Early
morning
peak
Wexler[198
3]ITCZ,Pacific
andAtlantic
satellite
IRthreshold(240
K)
1mon
th(Jul–A
ug19
73)measurements
at11
30LST,23
30LST
Early
morning
peak
inmajority
ofoceanregion
,afternoo
npeak
inITCZ
Aug
ustin
e[198
4]W.Pacific
(168
°E–112
°W)
satellite
IRthreshold(253
K)
1mon
th(A
ug19
79)
Afterno
onpeak
with
second
arymorning
peak
Albrigh
tet
al.[198
5]W.Pacific
andSPCZ
satellite
IRthreshold(255
,23
7,21
8K)
2mon
ths(Jan–F
eb19
79)
Early
morning
peak
invery
deep
clou
ds,afternoo
npeak
indeep
clou
dMeisner
andArkin
[198
7]Pacific
(175
°E–25°E)
satellite
IRthreshold(235
K)
3years(198
1–19
84)
Afterno
onpeak
inITCZ,little
cycleob
served
elsewhere
Fuet
al.[199
0]Pacific
(110
°E–90°W)
satellite
IRandVSthreshold
combinedtechniqu
e2mon
ths(Jul
1983
,Jan19
84)
Early
morning
peak
indeep
clou
d,which
changes
20–4
0%in
size;medium
clou
dpeaksin
afternoo
nwhich
changes10
–20%
insize
Hendo
nan
dWoo
dberry
[199
3]Tropics
satellite
IRthreshold(230
K)
1year
(198
3–19
84)
Early
morning
(030
0–09
00LST)
Map
esan
dHou
ze[199
3]W.Pacific
(80°E–1
60°W
)satellite
IRthreshold(198
,20
8,23
5K)
3yearsof
4mon
ths(N
ov86
toFeb
87,
Nov
87to
Jan88
,Nov
88to
Jan89
)Early
morning
(alsono
tedexpansionof
area
inafternoo
n)
Jano
wiaket
al.[199
4]Tropics
satellite
IRthreshold(215
,22
5,23
5K)
4years(198
6–19
90)
Early
morning
peak
incold
clou
d(030
0–06
00LST),
warmer
clou
dalso
presentin
afternoo
nNittaan
dSekine
[199
4]W.Pacific
(140
°E–160
°W)
satellite
IRthreshold(250
K)
10years(198
0–19
90)
Early
morning
peak
0500–080
0LSTandafternoo
npeak
1300–1
500LSTin
theITCZin
summer
Chenan
dHou
ze[199
7]W.Pacific
(80°E–1
60°W
)satellite
IRthreshold(208
,23
5,26
0K)
andbu
oydata
4mon
ths(N
ov92
toFeb
93)
TOGA
COARE
Early
morning
peak
indeep
conv
ectio
n00
00–0
600LST.
Smallerclou
dsystem
speak
intheafternoo
n,andthe
earlymorning
Dai
[200
1]a
Global
rainfallfrom
surfacestations
22years(197
5–19
97)
Early
morning
peak
inrainfall(000
0–04
00LST
nonsho
wers,06
00LSTshow
ers)
Yan
gan
dSlingo
[200
1]Tropics
satellite
IRthreshold(230
K)fordeep
conv
ectio
n4yearswinters
andsummers(198
4/19
85,
1986
/198
7,19
87/198
8,19
91/199
2)Early
morning
(with
afternoo
npeakscloseto
land
)
Nesbittan
dZipser[200
3]a
Tropics
TRMM
rainfall
3years(199
7–20
00)
Early
morning
rainfallpeak
Serraan
dMcP
haden[200
4]a
Pacific
(10°N–10°S)
Rainfalldata
from
moo
redbu
oys
4years(Jun
1997
toDec
2001
)Early
morning
rainfallmax
(040
0–07
00LST),afternoo
nmax
during
Jul–Nov
inN.Pacific
andDec–M
arin
S.Pacific
Tianet
al.[200
4]Tropics
satellite
IRandUTH,remov
edclou
dsT<26
0K1year
(199
9)Early
morning
peak
indeep
conv
ectio
n(060
0–10
00LST);
afternoo
nconv
ectio
npeak
inNW
Pacific;UTH
peaks
atmidnigh
tYen
[200
5]W.Pacific
(90°E–1
70°W
,15
°S–45°N)
satellite
IRthreshold(250
K)
13years(198
0–19
93)
Latemorning
andearlyafternoo
n
Kum
aret
al.[200
6]a
Indian
Ocean
Tritonbu
oyrainfall
2years(200
1–20
03)
Early
morning
(090
0LST)andafternoo
n(180
0–21
00LST)
peaksin
summer
Kikuchi
andWan
g[200
8]a
Global
TRMM
rainfall
8years(199
8–20
06)
Morning
(060
0–09
00LST)peak
inrainfall;
little
season
alvariability
over
oceans
Yan
gan
dSm
ith[200
8]a
Global
TRMM
rainfall
7years(199
8–20
05)
Early
morning
(000
0–06
00LST)isprim
aryrainfall,
afternoo
nsecond
arymaxim
um(stratiform
rain)
Yan
get
al.[200
8]a
Global
TRMM
(TMI,PR)rainfall
7years(199
8–20
05)
Early
morning
(000
0–06
00LST)isprim
aryrainfall,
afternoo
nsecond
arymaxim
um(stratiform
rain)
a These
papers
areprim
arily
concernedwith
thediurnalcycleof
rainfall(the
majority
ofpapers
look
atthediurnalcycleof
clou
d).
BAIN ET AL.: DIURNAL CYCLE OF THE INTERTROPICAL CONVERGENCE ZONE D23116D23116
2 of 10
of the full scope of results. Table 1 represents a selectionof relevant papers; early papers (pre‐1977) which mainlyuse surface station data have been excluded due to fewerobservations. The studies shown are primarily derived fromsatellite data, ensuring coverage over remote ocean areas.The studies are mostly from the Pacific region; manyadditional studies from other ocean basins including theAtlantic are not shown.[6] Table 1 demonstrates the range of differences between
observational studies. In particular, many studies disagreeon the timing of peaks in tropical cloud; these differencesmay be due to the analysis technique used, time of year andaveraging. The results also vary depending on whether rain,cloudiness or cloud depth is analyzed. The majority ofstudies shown in the table relate to cloud. However, whererainfall is the primary interest, a footnote is given.[7] All papers note the early morning maximum in cold
cloud and rainfall excluding that of Meisner and Arkin[1987], who only found the afternoon peak in cold cloud inthe ITCZ and South Pacific convergence zone (SPCZ) regionand noticed little diurnal variability elsewhere. However,some papers note a single maximum in cloud or rainfall [e.g.,Dorman and Bourke, 1979; Meisner and Arkin, 1987; Dai,2001], whereas others show the presence of a second maxi-mum or semidiurnal cycle [e.g., Albright et al., 1985; Yen,2005; Yang et al., 2008]. Most recent papers have con-firmed that there is a semidiurnal cycle, and this view appearsto represent the current consensus.[8] The reasons for disparities between studies becomes
clearer in the detailed examination of the secondary maxi-mum in rainfall by Yang et al. [2008] and Yang and Smith[2008]. Their papers demonstrate that the afternoon maxi-mum in rainfall is likely the result of stratiform cloud andrain, which might not be sensed by thresholding techniqueswhich look exclusively for cold cloud. This was noted pre-viously by Chen and Houze [1997] as a possible reason fordiscrepancies among studies, i.e., why some of the studiesdid not find an afternoon peak in smaller cloud systems.[9] Studies specifically relating to the ITCZ diurnal cycle
of convection are less numerous. Nitta and Sekine [1994]presented the diurnal cycle over the west Pacific withemphasis on the ITCZ and SPCZ regions. They observedcold cloud in infrared (IR) satellite data, using a threshold of250 K to determine deep convection. They noted that in theITCZ region, the convection peaked in the early morning formost of the year, but there were two peaks in cloud duringthe summertime (0500–0800 LST and 1300–1500 LST)when the ITCZ region was more convectively active.McGarry and Reed [1978] discussed the ITCZ diurnal cyclein the Atlantic. The study was for boreal summertime only,during the most active period for African easterly waves.An afternoon maximum in convection was found, and theamplitude of the diurnal cycle was increased closer to theAfrican coastline. They also found that the afternoon max-imum in rainfall was primarily from cloud systems whosemass inflow encompassed large areas, implying that con-vergence and therefore uplift on the large scale was modu-lated to peak during afternoon hours. Magnusdottir andWang [2008] found that the Atlantic ITCZ was mostlycomposed of isolated disturbances or African easterly waves,whereas the east Pacific ITCZ appeared more zonally elon-gated. Differences in the diurnal cycle of the two regimes
may therefore be expected. Our study here will presentresults for the Pacific only.[10] This paper aims to define the diurnal cycle of the ITCZ
in the east Pacific. We have used our statistical model todetect the ITCZ in instantaneous satellite data. The advant-age is that we are able to use the ITCZ labels to diagnosethe reaction of the envelope of convection on short timescales (i.e., in 3‐hourly data to investigate the diurnal cycle).The ITCZ is mostly only defined in the literature on longtime‐averaged time scales using cold cloud thresholding[e.g., Waliser and Gautier, 1993], meaning that this infor-mation has not been previously available for study of thediurnal dynamics of the ITCZ. The climatology of the ITCZwas described by Bain et al. [2010], along with an evaluationof the data set in comparison to thresholding techniques andhuman eye interpretation. Here, we address the short time‐scale diurnal variation of the ITCZ and also characterizeits seasonal and longitudinal variability. Section 2 introducesthe data set of ITCZ observations, section 3 describes theresults and section 4 contains discussion and conclusions.
2. Data Set
[11] The data set of ITCZ location consists of a binary setof labels identifying presence/absence of ITCZ for each gridpoint in a 0.5 × 0.5 degree gridded IR satellite image. TheIR data are provided by the GridSat database [Knapp andKossin, 2007], and are from 90°W–180°W, 0°N–25°N onan evenly spaced grid. The ITCZ labels are available every3 h, 1980 to 2009 from May through October. In the win-tertime the ITCZ is less present, and weaker when it ispresent, and extratropical fronts intrude on the domain,making ITCZ identification more difficult.[12] The labels are generated by a Markov random field
statistical model, using IR data as input. The model calcu-lates the probability of ITCZ presence at each grid point andclassifies as ITCZ those points with probability greater than0.5. This ensures that grid points which are more likely to beITCZ then non‐ITCZ are included in the ITCZ label. Resultsare not sensitive to the threshold of 0.5 because a largemajority of grid points have probabilities of being ITCZ thatare near to zero or one. The probabilities depend on thefollowing factors: The likelihood (via Bayes rule) of theobserved IR value at the grid point, the presence/absenceof ITCZ at neighboring grid points in space and time, andthe latitude location of the grid point. The dependence onneighboring grid points introduces a recursive aspect tothe computation, and the location term ensures that onlytropical features are identified as being part of the ITCZ.The technique of Gibbs sampling [Geman and Geman,1984; Gilks et al., 1996] is used to stochastically searchfor high‐probability assignments of each grid point to ITCZpresence/absence, given the observed IR data. By thismethod, smooth, continuous regions of ITCZ are identified.Full details of the model and validation are given by Bainet al. [2010].[13] Bain et al. [2010] found that this statistical method
provided systematic improvement in labeling accuracyover other automated techniques when compared to humanlabelers. The statistical method was also more consistentwith other automated techniques (i.e., thresholding of IRand total precipitable water) than they were with each other.
BAIN ET AL.: DIURNAL CYCLE OF THE INTERTROPICAL CONVERGENCE ZONE D23116D23116
3 of 10
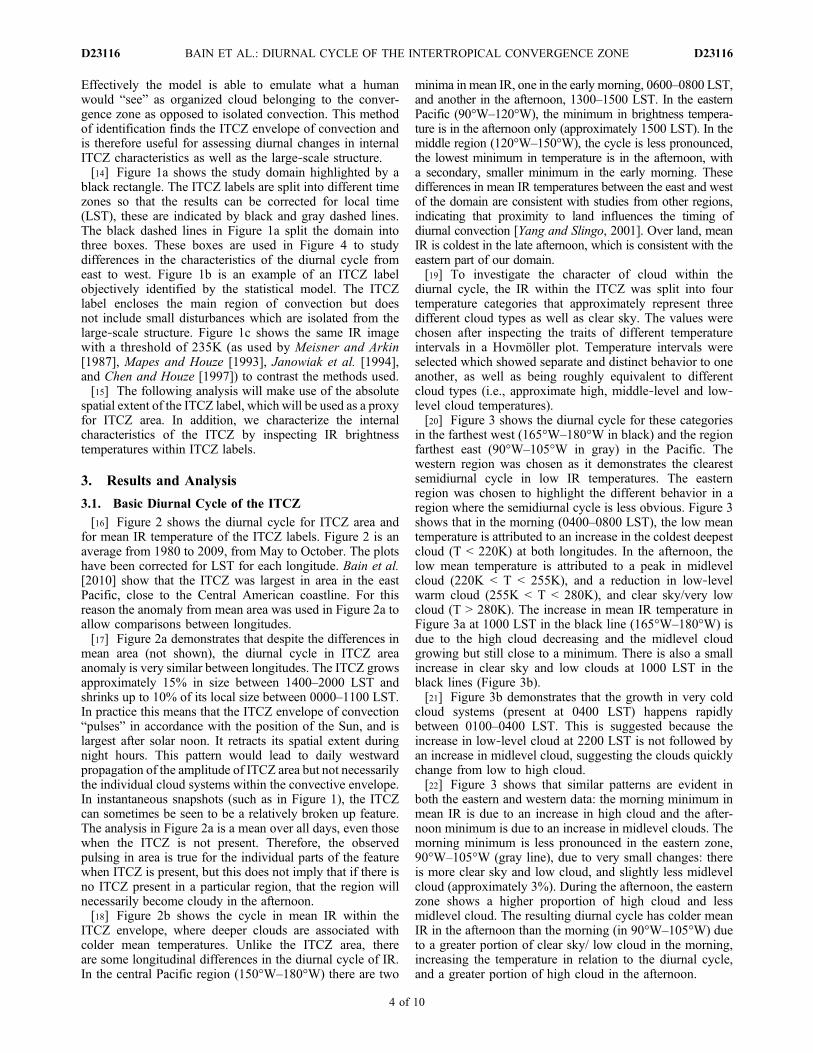
Effectively the model is able to emulate what a humanwould “see” as organized cloud belonging to the conver-gence zone as opposed to isolated convection. This methodof identification finds the ITCZ envelope of convection andis therefore useful for assessing diurnal changes in internalITCZ characteristics as well as the large‐scale structure.[14] Figure 1a shows the study domain highlighted by a
black rectangle. The ITCZ labels are split into different timezones so that the results can be corrected for local time(LST), these are indicated by black and gray dashed lines.The black dashed lines in Figure 1a split the domain intothree boxes. These boxes are used in Figure 4 to studydifferences in the characteristics of the diurnal cycle fromeast to west. Figure 1b is an example of an ITCZ labelobjectively identified by the statistical model. The ITCZlabel encloses the main region of convection but doesnot include small disturbances which are isolated from thelarge‐scale structure. Figure 1c shows the same IR imagewith a threshold of 235K (as used by Meisner and Arkin[1987], Mapes and Houze [1993], Janowiak et al. [1994],and Chen and Houze [1997]) to contrast the methods used.[15] The following analysis will make use of the absolute
spatial extent of the ITCZ label, which will be used as a proxyfor ITCZ area. In addition, we characterize the internalcharacteristics of the ITCZ by inspecting IR brightnesstemperatures within ITCZ labels.
3. Results and Analysis
3.1. Basic Diurnal Cycle of the ITCZ
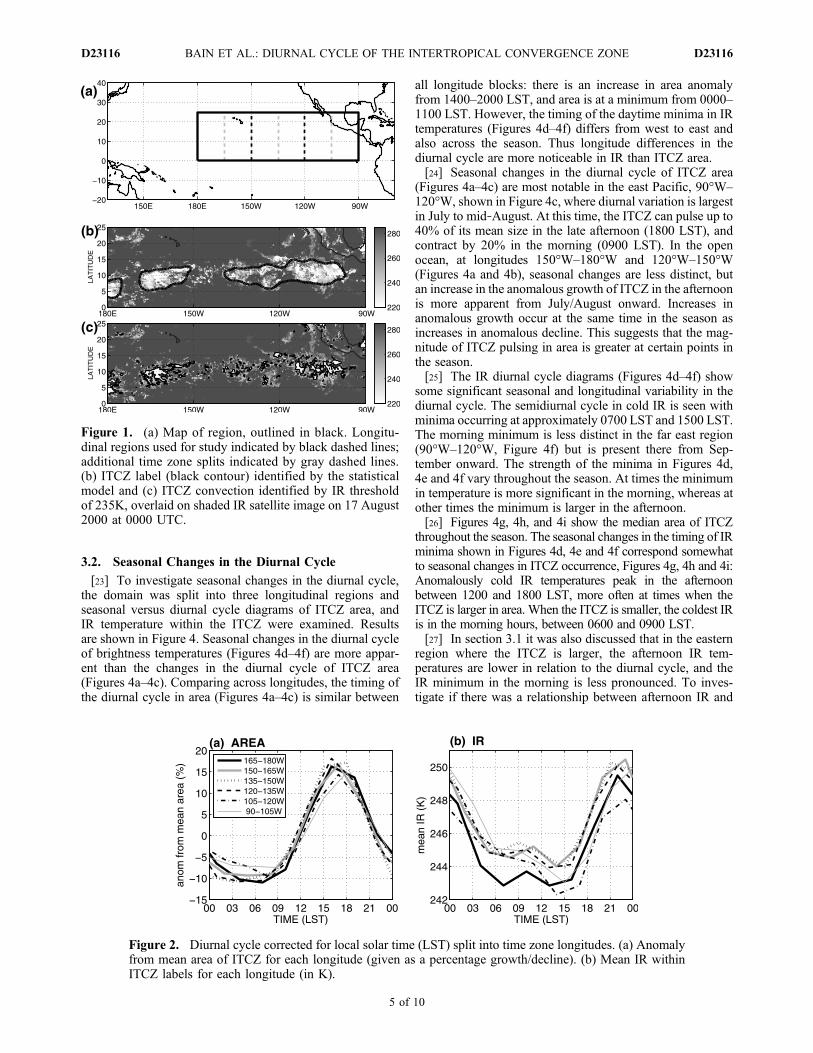
[16] Figure 2 shows the diurnal cycle for ITCZ area andfor mean IR temperature of the ITCZ labels. Figure 2 is anaverage from 1980 to 2009, from May to October. The plotshave been corrected for LST for each longitude. Bain et al.[2010] show that the ITCZ was largest in area in the eastPacific, close to the Central American coastline. For thisreason the anomaly from mean area was used in Figure 2a toallow comparisons between longitudes.[17] Figure 2a demonstrates that despite the differences in
mean area (not shown), the diurnal cycle in ITCZ areaanomaly is very similar between longitudes. The ITCZ growsapproximately 15% in size between 1400–2000 LST andshrinks up to 10% of its local size between 0000–1100 LST.In practice this means that the ITCZ envelope of convection“pulses” in accordance with the position of the Sun, and islargest after solar noon. It retracts its spatial extent duringnight hours. This pattern would lead to daily westwardpropagation of the amplitude of ITCZ area but not necessarilythe individual cloud systems within the convective envelope.In instantaneous snapshots (such as in Figure 1), the ITCZcan sometimes be seen to be a relatively broken up feature.The analysis in Figure 2a is a mean over all days, even thosewhen the ITCZ is not present. Therefore, the observedpulsing in area is true for the individual parts of the featurewhen ITCZ is present, but this does not imply that if there isno ITCZ present in a particular region, that the region willnecessarily become cloudy in the afternoon.[18] Figure 2b shows the cycle in mean IR within the
ITCZ envelope, where deeper clouds are associated withcolder mean temperatures. Unlike the ITCZ area, thereare some longitudinal differences in the diurnal cycle of IR.In the central Pacific region (150°W–180°W) there are two
minima in mean IR, one in the early morning, 0600–0800 LST,and another in the afternoon, 1300–1500 LST. In the easternPacific (90°W–120°W), the minimum in brightness tempera-ture is in the afternoon only (approximately 1500 LST). In themiddle region (120°W–150°W), the cycle is less pronounced,the lowest minimum in temperature is in the afternoon, witha secondary, smaller minimum in the early morning. Thesedifferences in mean IR temperatures between the east and westof the domain are consistent with studies from other regions,indicating that proximity to land influences the timing ofdiurnal convection [Yang and Slingo, 2001]. Over land, meanIR is coldest in the late afternoon, which is consistent with theeastern part of our domain.[19] To investigate the character of cloud within the
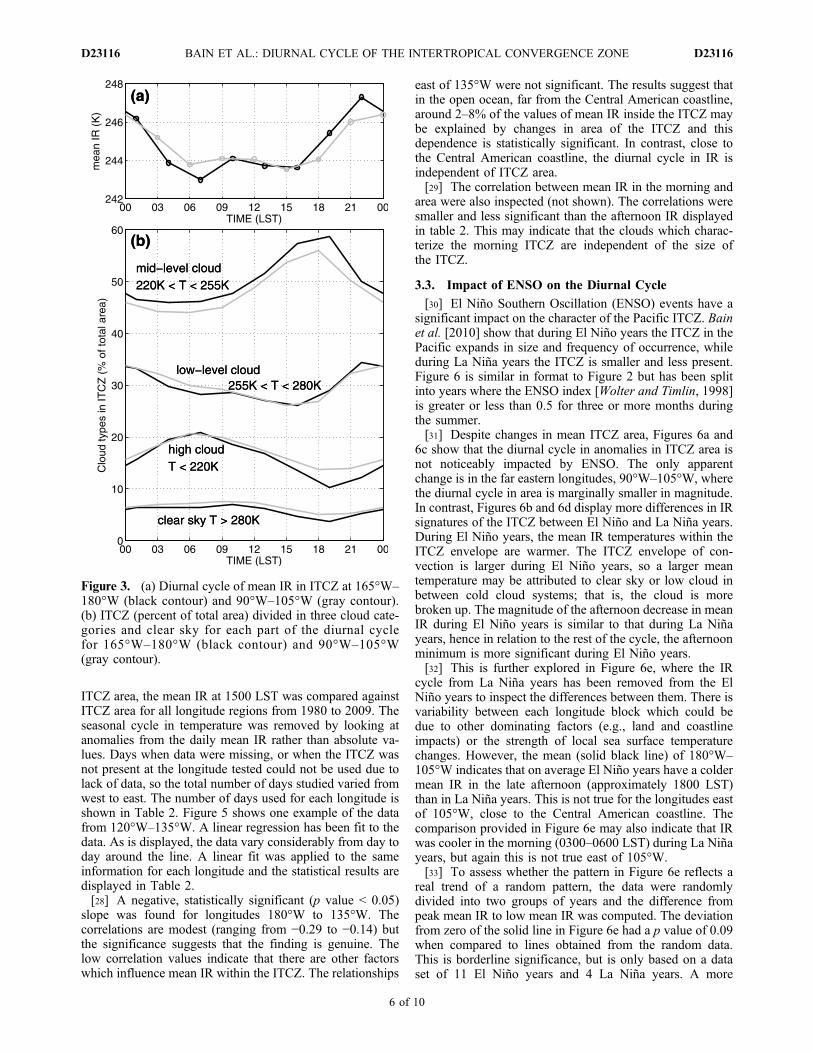
diurnal cycle, the IR within the ITCZ was split into fourtemperature categories that approximately represent threedifferent cloud types as well as clear sky. The values werechosen after inspecting the traits of different temperatureintervals in a Hovmöller plot. Temperature intervals wereselected which showed separate and distinct behavior to oneanother, as well as being roughly equivalent to differentcloud types (i.e., approximate high, middle‐level and low‐level cloud temperatures).[20] Figure 3 shows the diurnal cycle for these categories
in the farthest west (165°W–180°W in black) and the regionfarthest east (90°W–105°W in gray) in the Pacific. Thewestern region was chosen as it demonstrates the clearestsemidiurnal cycle in low IR temperatures. The easternregion was chosen to highlight the different behavior in aregion where the semidiurnal cycle is less obvious. Figure 3shows that in the morning (0400–0800 LST), the low meantemperature is attributed to an increase in the coldest deepestcloud (T < 220K) at both longitudes. In the afternoon, thelow mean temperature is attributed to a peak in midlevelcloud (220K < T < 255K), and a reduction in low‐levelwarm cloud (255K < T < 280K), and clear sky/very lowcloud (T > 280K). The increase in mean IR temperature inFigure 3a at 1000 LST in the black line (165°W–180°W) isdue to the high cloud decreasing and the midlevel cloudgrowing but still close to a minimum. There is also a smallincrease in clear sky and low clouds at 1000 LST in theblack lines (Figure 3b).[21] Figure 3b demonstrates that the growth in very cold
cloud systems (present at 0400 LST) happens rapidlybetween 0100–0400 LST. This is suggested because theincrease in low‐level cloud at 2200 LST is not followed byan increase in midlevel cloud, suggesting the clouds quicklychange from low to high cloud.[22] Figure 3 shows that similar patterns are evident in
both the eastern and western data: the morning minimum inmean IR is due to an increase in high cloud and the after-noon minimum is due to an increase in midlevel clouds. Themorning minimum is less pronounced in the eastern zone,90°W–105°W (gray line), due to very small changes: thereis more clear sky and low cloud, and slightly less midlevelcloud (approximately 3%). During the afternoon, the easternzone shows a higher proportion of high cloud and lessmidlevel cloud. The resulting diurnal cycle has colder meanIR in the afternoon than the morning (in 90°W–105°W) dueto a greater portion of clear sky/ low cloud in the morning,increasing the temperature in relation to the diurnal cycle,and a greater portion of high cloud in the afternoon.
BAIN ET AL.: DIURNAL CYCLE OF THE INTERTROPICAL CONVERGENCE ZONE D23116D23116
4 of 10
3.2. Seasonal Changes in the Diurnal Cycle
[23] To investigate seasonal changes in the diurnal cycle,the domain was split into three longitudinal regions andseasonal versus diurnal cycle diagrams of ITCZ area, andIR temperature within the ITCZ were examined. Resultsare shown in Figure 4. Seasonal changes in the diurnal cycleof brightness temperatures (Figures 4d–4f) are more appar-ent than the changes in the diurnal cycle of ITCZ area(Figures 4a–4c). Comparing across longitudes, the timing ofthe diurnal cycle in area (Figures 4a–4c) is similar between
all longitude blocks: there is an increase in area anomalyfrom 1400–2000 LST, and area is at a minimum from 0000–1100 LST. However, the timing of the daytime minima in IRtemperatures (Figures 4d–4f) differs from west to east andalso across the season. Thus longitude differences in thediurnal cycle are more noticeable in IR than ITCZ area.[24] Seasonal changes in the diurnal cycle of ITCZ area
(Figures 4a–4c) are most notable in the east Pacific, 90°W–120°W, shown in Figure 4c, where diurnal variation is largestin July to mid‐August. At this time, the ITCZ can pulse up to40% of its mean size in the late afternoon (1800 LST), andcontract by 20% in the morning (0900 LST). In the openocean, at longitudes 150°W–180°W and 120°W–150°W(Figures 4a and 4b), seasonal changes are less distinct, butan increase in the anomalous growth of ITCZ in the afternoonis more apparent from July/August onward. Increases inanomalous growth occur at the same time in the season asincreases in anomalous decline. This suggests that the mag-nitude of ITCZ pulsing in area is greater at certain points inthe season.[25] The IR diurnal cycle diagrams (Figures 4d–4f) show
some significant seasonal and longitudinal variability in thediurnal cycle. The semidiurnal cycle in cold IR is seen withminima occurring at approximately 0700 LST and 1500 LST.The morning minimum is less distinct in the far east region(90°W–120°W, Figure 4f) but is present there from Sep-tember onward. The strength of the minima in Figures 4d,4e and 4f vary throughout the season. At times the minimumin temperature is more significant in the morning, whereas atother times the minimum is larger in the afternoon.[26] Figures 4g, 4h, and 4i show the median area of ITCZ
throughout the season. The seasonal changes in the timing of IRminima shown in Figures 4d, 4e and 4f correspond somewhatto seasonal changes in ITCZ occurrence, Figures 4g, 4h and 4i:Anomalously cold IR temperatures peak in the afternoonbetween 1200 and 1800 LST, more often at times when theITCZ is larger in area. When the ITCZ is smaller, the coldest IRis in the morning hours, between 0600 and 0900 LST.[27] In section 3.1 it was also discussed that in the eastern
region where the ITCZ is larger, the afternoon IR tem-peratures are lower in relation to the diurnal cycle, and theIR minimum in the morning is less pronounced. To inves-tigate if there was a relationship between afternoon IR and
Figure 2. Diurnal cycle corrected for local solar time (LST) split into time zone longitudes. (a) Anomalyfrom mean area of ITCZ for each longitude (given as a percentage growth/decline). (b) Mean IR withinITCZ labels for each longitude (in K).
Figure 1. (a) Map of region, outlined in black. Longitu-dinal regions used for study indicated by black dashed lines;additional time zone splits indicated by gray dashed lines.(b) ITCZ label (black contour) identified by the statisticalmodel and (c) ITCZ convection identified by IR thresholdof 235K, overlaid on shaded IR satellite image on 17 August2000 at 0000 UTC.
BAIN ET AL.: DIURNAL CYCLE OF THE INTERTROPICAL CONVERGENCE ZONE D23116D23116
5 of 10
ITCZ area, the mean IR at 1500 LST was compared againstITCZ area for all longitude regions from 1980 to 2009. Theseasonal cycle in temperature was removed by looking atanomalies from the daily mean IR rather than absolute va-lues. Days when data were missing, or when the ITCZ wasnot present at the longitude tested could not be used due tolack of data, so the total number of days studied varied fromwest to east. The number of days used for each longitude isshown in Table 2. Figure 5 shows one example of the datafrom 120°W–135°W. A linear regression has been fit to thedata. As is displayed, the data vary considerably from day today around the line. A linear fit was applied to the sameinformation for each longitude and the statistical results aredisplayed in Table 2.[28] A negative, statistically significant (p value < 0.05)
slope was found for longitudes 180°W to 135°W. Thecorrelations are modest (ranging from −0.29 to −0.14) butthe significance suggests that the finding is genuine. Thelow correlation values indicate that there are other factorswhich influence mean IR within the ITCZ. The relationships
east of 135°W were not significant. The results suggest thatin the open ocean, far from the Central American coastline,around 2–8% of the values of mean IR inside the ITCZ maybe explained by changes in area of the ITCZ and thisdependence is statistically significant. In contrast, close tothe Central American coastline, the diurnal cycle in IR isindependent of ITCZ area.[29] The correlation between mean IR in the morning and
area were also inspected (not shown). The correlations weresmaller and less significant than the afternoon IR displayedin table 2. This may indicate that the clouds which charac-terize the morning ITCZ are independent of the size ofthe ITCZ.
3.3. Impact of ENSO on the Diurnal Cycle
[30] El Niño Southern Oscillation (ENSO) events have asignificant impact on the character of the Pacific ITCZ. Bainet al. [2010] show that during El Niño years the ITCZ in thePacific expands in size and frequency of occurrence, whileduring La Niña years the ITCZ is smaller and less present.Figure 6 is similar in format to Figure 2 but has been splitinto years where the ENSO index [Wolter and Timlin, 1998]is greater or less than 0.5 for three or more months duringthe summer.[31] Despite changes in mean ITCZ area, Figures 6a and
6c show that the diurnal cycle in anomalies in ITCZ area isnot noticeably impacted by ENSO. The only apparentchange is in the far eastern longitudes, 90°W–105°W, wherethe diurnal cycle in area is marginally smaller in magnitude.In contrast, Figures 6b and 6d display more differences in IRsignatures of the ITCZ between El Niño and La Niña years.During El Niño years, the mean IR temperatures within theITCZ envelope are warmer. The ITCZ envelope of con-vection is larger during El Niño years, so a larger meantemperature may be attributed to clear sky or low cloud inbetween cold cloud systems; that is, the cloud is morebroken up. The magnitude of the afternoon decrease in meanIR during El Niño years is similar to that during La Niñayears, hence in relation to the rest of the cycle, the afternoonminimum is more significant during El Niño years.[32] This is further explored in Figure 6e, where the IR
cycle from La Niña years has been removed from the ElNiño years to inspect the differences between them. There isvariability between each longitude block which could bedue to other dominating factors (e.g., land and coastlineimpacts) or the strength of local sea surface temperaturechanges. However, the mean (solid black line) of 180°W–105°W indicates that on average El Niño years have a coldermean IR in the late afternoon (approximately 1800 LST)than in La Niña years. This is not true for the longitudes eastof 105°W, close to the Central American coastline. Thecomparison provided in Figure 6e may also indicate that IRwas cooler in the morning (0300–0600 LST) during La Niñayears, but again this is not true east of 105°W.[33] To assess whether the pattern in Figure 6e reflects a
real trend of a random pattern, the data were randomlydivided into two groups of years and the difference frompeak mean IR to low mean IR was computed. The deviationfrom zero of the solid line in Figure 6e had a p value of 0.09when compared to lines obtained from the random data.This is borderline significance, but is only based on a dataset of 11 El Niño years and 4 La Niña years. A more
Figure 3. (a) Diurnal cycle of mean IR in ITCZ at 165°W–180°W (black contour) and 90°W–105°W (gray contour).(b) ITCZ (percent of total area) divided in three cloud cate-gories and clear sky for each part of the diurnal cyclefor 165°W–180°W (black contour) and 90°W–105°W(gray contour).
BAIN ET AL.: DIURNAL CYCLE OF THE INTERTROPICAL CONVERGENCE ZONE D23116D23116
6 of 10

comprehensive analysis would require a much larger sample(e.g., 50 years), which is not currently available.[34] Nonetheless, the results suggest that during El Niño
years, mean IR temperatures within the ITCZ envelope ofconvection appear colder in the afternoon than in themorning, whereas during La Niña years a semidiurnal cycleof mean IR is more apparent. This result is not beyond therange of random variation, but a larger sample would beneeded to investigate the behavior further.
4. Discussion and Conclusions
[35] It has been shown that the ITCZ in the east Pacifichas a diurnal cycle in area and cloud top temperature. Thearea covered by the cloudy envelope “pulses” on a dailybasis, where it grows on average 15% in size in the after-noon, and shrinks by 10% between 0000 and 0900 LST.This is the first study that we are aware of that presents thisinformation on the ITCZ. The cycle in mean cloud toptemperature is different in the east (90°W–120°W) from thatin the central (150°W–180°W) Pacific. In the centralPacific, there are two minima in the mean brightness tem-perature of the ITCZ. One is in the early morning and one isin the afternoon. In the east Pacific, mean IR reaches aminimum in the afternoon. We observed that the afternoonminimum in mean IR appears to be at a lower temperature(in relation to the diurnal cycle) when the ITCZ is seasonally
more present, and also during El Niño years in comparisonto La Niña years.[36] In section 3.1 it was shown that when the ITCZ is
larger (in the eastern part of the domain), there is a small
Figure 4. Diagrams showing the seasonal change in the diurnal cycle in: (a, b, c) anomalies in mean areaof ITCZ going from west to east, as indicated by the black boxes in Figure 1a, and (d, e, f) anomalies inmedian IR of the ITCZ. The longitudes are identified above the plots. Figures 4a–4f have been smoothedwith a 10 day running mean in the x direction. (g, h, i) The mean area of the ITCZ (1980–2009) for the plotsin each column, smoothed with a 60 day running mean.
Figure 5. Relationship between size of ITCZ (km2) andmean IR inside ITCZ label at 1500 LST for 135°W–150°W.There are 1793 days represented; statistical results of the fitare displayed in Table 2.
BAIN ET AL.: DIURNAL CYCLE OF THE INTERTROPICAL CONVERGENCE ZONE D23116D23116
7 of 10
increase in the proportion of low cloud (i.e., warmer tem-peratures) present in the early morning, while the proportionof medium‐level cloud decreases slightly. The increase inwarmer grid points may suggest that the distances between
deep cloud during the early morning peak in convection islarger when the area of ITCZ is larger. This assertion isplausible because the alternative situation is unlikely: thatthe high clouds are as closely grouped together as in a small
Table 2. Summary of Statistical Results From Comparing Area of ITCZ (km2) and Mean IR Anomaly With Respect to the Diurnal Cycle(K) Within ITCZ at 1500 LST to Investigate Whether the Diurnal Cycle of Cloud is Impacted by the Size of the ITCZ
Longitudes Number of Days Gradient of Fit (×10−6) Standard Error Correlation p Value
165°W–180°W 1716 −0.25 0.35 −0.17 <0.001150°W–165°W 1924 −0.52 0.39 −0.29 <0.001135°W−150°W 1793 −0.60 0.49 −0.28 <0.001120°W–135°W 2052 −0.23 0.37 −0.14 <0.001105°W–120°W 3089 0.01 0.24 0.00 0.8090°W–105°W 3086 −0.03 0.22 −0.03 0.14
Figure 6. (a) Anomaly from mean area of ITCZ for El Niño years (1982, 1986, 1987, 1991, 1993, 1994,1997, 2002, 2004, 2006, and 2009). (b) Mean IR within ITCZ labels for El Niño years. (c) Anomaly frommean area of ITCZ for La Niña years (1988, 1999, 2007, and 2008). (d) Mean IR within ITCZ labels forLa Niña years. (e) Difference between Figures 6b and 6d in bars representing longitudes. The line is themean from longitudes 180°W–105°W.
BAIN ET AL.: DIURNAL CYCLE OF THE INTERTROPICAL CONVERGENCE ZONE D23116D23116
8 of 10

ITCZ, and low‐level/clear sky is surrounding them,increasing the ITCZ area. This situation is unlikely becausethe statistical model uses probabilities based on IR value at agrid point and the surrounding grid points. Thus, if therewere large regions on the edge of the ITCZ of warm cloudand clear sky without any cold cloud, it would not belabeled as ITCZ.[37] Conversely, in the afternoon, the results indicate that
a larger ITCZ implies a colder mean temperature in relationto the diurnal cycle. This might be simply because the earlierminimum in cold temperature is less pronounced andtherefore the afternoon minimum is more distinct. Figure 3balso indicated that there was an increase in cold high cloudand a reduction in midlevel cloud during the afternoonminimum in the east compared to the west Pacific.[38] Our findings suggest that there are several factors
which may influence the timing of minimum temperaturewithin the diurnal cycle. This may account for the variabilityin the timing of convective peaks among the studies iden-tified in Table 1. In particular the following factors are likelyto have influenced the findings of earlier studies.[39] 1. The findings depend on how close to the continent
the study is conducted: the closer to land, the more likely themean IR reaches a minimum in the afternoon. The diurnalcycle of cloudiness is much stronger over land due to thelarger diurnal cycle in surface fluxes. Land convection typi-cally occurs in the late afternoon/evening, thus exertinginfluence over nearby ocean regions. Topography and coast-line orientation may also have an impact on local oceanweather, influencing the timing of convection and rainfall.Figure 3 demonstrated that high cloud is more likely in theafternoon close to land than over open ocean, concurring withprevious studies [Yang and Slingo, 2001].[40] 2. The results are sensitive to the time span used for
averaging, for example whether a study is at a particulartime in the seasonal cycle or an annual average. We haveshown that seasonal variations occur. This was also foundby Serra and McPhaden [2004] but no seasonal variationswere found by Kikuchi and Wang [2008]. It is possible thatthe signal was lost in the work by Kikuchi and Wang [2008]due to the dominating variability in the subtropics.[41] 3. The findings depend on what the analysis tech-
niques are identifying (is the study finding clouds or rain?total amount or intensity?). In particular, if thresholding isused, the timing of the diurnal peaks in cold cloud dependson the temperature being used for thresholding. Figure 3showed the variability in convective peaks between highcloud (T < 220K) and midlevel cloud (220K < T < 255K).Indiscriminate thresholding of cold cloud is possibly not thebest technique for characterizing the diurnal cycle over theocean, due to different cycle timing depending on the leveland type of cloud. In view of this, it is important to usealternative methods, such as our statistical model, to supportthe conclusions made from thresholding.[42] To summarize, the primary results from this study
are: (1) The area covered by the ITCZ envelope of con-vection pulses in size each day, reaching a peak in the lateafternoon. (2) There are two daily minima in brightnesstemperature in the ITCZ over the open ocean. (3) The peakin deep, cold cloud in the morning suggests rapidly grow-ing systems as it is not preceded by midlevel cloud. (4)The afternoon minimum in temperature appears more pro-
nounced when the ITCZ is more extensive in area, duringEl Niño and during midsummer.[43] This final point is consistent with findings by Gray
and Jacobson [1977], Meisner and Arkin [1987], Nittaand Sekine [1994] and Serra and McPhaden [2004]. Yanget al. [2008] conjectured that the only plausible explana-tion for an afternoon maximum in convection is an “oceansurface heating” mechanism. However, this mechanism maynot fully account for all situations when cold temperaturespeak in the afternoon rather than the morning. The greaterafternoon mean brightness temperature minimum is con-sistent with periods when the area covered by convection isgreater, during El Niño years, and when the ITCZ is at aseasonal peak. These events do not obviously correspond toa large diurnal signature in SSTs. We therefore suggest thatit is likely that changes in the strength of the afternoon peakin cold cloud is controlled by the atmospheric environmentrather than surface conditions. The afternoon peak in coldcloud may also be greater at times when the morning peak incold cloud is less pronounced due to decreased midlevelcloud and increased clear sky.
[44] Acknowledgments. The authors would like to acknowledgeJorge De Paz and Jason Kramer at UC Irvine for their work on the devel-opment of the statistical model. We would also like to thank Ken Knapp atNOAA’s National Climatic Data Center for providing all IR data from theGridSat (HURSAT‐Basin) archive. This research was supported by NSFgrant ATM0530926 and NOAA grant NA09OAR4310132.
ReferencesAlbright, M. D., E. E. Recker, and R. J. Reed (1985), The diurnal variationof deep convection and inferred precipitation in the central tropical Pacificduring January‐February 1979, Mon. Weather Rev., 113, 1663–1680.
Augustine, J. A. (1984), The diurnal variation of large‐scale inferred rain-fall over the tropical Pacific ocean during August 1979, Mon. WeatherRev., 112, 1745–1751.
Bain, C. L., J. D. Paz, J. Kramer, G. Magnusdottir, P. Smyth, H. Stern, andC.‐C. Wang (2010), Detecting the ITCZ in instantaneous satellite datausing spatial‐temporal statistical modeling: ITCZ climatology in the eastPacific, J. Clim., doi:10.1175/2010JCL13716.1, in press.
Chen, S., and R. A. Houze (1997), Diurnal variation and life‐cycle of deepconvective systems over the tropical Pacific warm pool,Q. J. R. Meteorol.Soc., 123, 357–388.
Dai, A. (2001), Global precipitation and thunderstorm frequencies. Part II:Diurnal variations, J. Clim., 14, 1112–1128.
Dorman, C. E., and R. H. Bourke (1979), Precipitation over the PacficOcean, 30°S to 60°N, Mon. Weather Rev., 107, 896–910.
Fu, R., A. D. Genio, and W. B. Rossow (1990), Behavior of deep convec-tive clouds in the tropical Pacific deduced from ISCCP radiances,J. Clim., 3, 1129–1152.
Geman, S., and D. Geman (1984), Stochastic relaxation, Gibbs distributionand the Bayesian restoration of images, IEEE Trans. Pattern Anal. Mach.Intell., 6, 721–741.
Gilks, W., S. Richardson, and D. Spiegelhalter (1996), Markov ChainMonte Carlo in Practice, Chapman and Hall, Boca Raton, Fla.
Gray, W. M., and R. W. Jacobson (1977), Diurnal‐variation of deepcumulus convection, Mon. Weather Rev., 105, 1171–1188.
Hendon, H. H., and K. Woodberry (1993), The diurnal cycle of tropicalconvection, J. Geophys. Res., 98, 16,623–16,637.
Houze, R. A., S. G. Geotis, F. D. Marks, and A. K. West (1981), Wintermonsoon convection in the vicinity of north Borneo. Part I: Structureand time variation of the clouds and precipitation, Mon. Weather Rev.,109, 1595–1614.
Janowiak, J. E., P. Arkin, and M. Morrissey (1994), An examination of thediurnal cycle in oceanic tropical rainfall using satellite and in situ data,Mon. Weather Rev., 122, 2296–2311.
Kikuchi, K., and B. Wang (2008), Diurnal precipitation regimes in theglobal tropics, J. Clim., 21, 2680–2696.
Knapp, K. R., and J. P. Kossin (2007), New global tropical cyclone datafrom ISCCP B1 geostationary satellite observations, J. Appl. RemoteSens., 1, 013505, doi:10.1117/1.2712816.
BAIN ET AL.: DIURNAL CYCLE OF THE INTERTROPICAL CONVERGENCE ZONE D23116D23116
9 of 10
Kumar, M. R. R., S. M. Pednekar, M. Katsumata, M. K. Antony, Y. Kuroda,and A. S. Unnikrishnan (2006), Seasonal variation of the diurnal cycle ofrainfall in the eastern equatorial Indian Ocean, Theor. Appl. Climatol., 85,117–122.
Liu, C., and M. W. Moncrieff (1997), A numerical study of the diurnalcycle of the tropical oceanic convection, J. Atmos. Sci., 55, 2329–2344.
Magnusdottir, G., and C.‐C. Wang (2008), Intertropical convergence zonesduring the active season in daily data, J. Atmos. Sci., 65, 2861–2876.
Mapes, B. E., and R. A. Houze (1993), Cloud clusters and superclustersover the oceanic warm pool, Mon. Weather Rev., 121, 1398–1415.
McGarry, M. M., and R. J. Reed (1978), Diurnal variations in convectiveactivity and precipitation during phases II and III of GATE, Mon.Weather Rev., 106, 101–113.
Meisner, B. N., and P. A. Arkin (1987), Spatial and annual variations in thediurnal cycle of large‐scale tropical convective cloudiness and precipita-tion, Mon. Weather Rev., 115, 2009–2032.
Nesbitt, S. W., and E. J. Zipser (2003), The diurnal cycle of rainfall andconvective intensity according to three years of TRMM measurements,J. Clim., 16, 1456–1475.
Nitta, T., and S. Sekine (1994), Diurnal variation of convective activityover the tropical western Pacfic, J. Meteorol. Soc. Jpn., 72, 627–641.
Serra, Y. L., and M. J. McPhaden (2004), In situ observations of diurnalvariability in rainfall over the tropical Pacific and Atlantic oceans,J. Clim., 17, 3496–3509.
Tian, B., B. J. Soden, and X. Wu (2004), Diurnal cycle of convection,clouds, and water vapor in the tropical upper troposphere: Satellitesversus a general circulation model, J. Geophys. Res., 109, D10101,doi:10.1029/2003JD004117.
Waliser, D. E., and C. Gautier (1993), A satellite‐derved climatology of theITCZ, J. Clim., 6, 2162–2174.
Wexler, R. (1983), Relative frequency and diurnal variation of high coldclouds in the tropical Atlantic and Pacific, Mon. Weather Rev., 111,1300–1304.
Wolter, K., and M. S. Timlin (1998), Measuring the strength of ENSOevents: How does 1997/98 rank?, Weather, 53, 315–324.
Yang, G. Y., and J. Slingo (2001), The diurnal cycle in the tropics, Mon.Weather Rev., 129, 784–801.
Yang, S., and E. A. Smith (2008), Convective‐stratiform precipitationvariability at seasonal scale from 8 yr of TRMM observations: Implica-tions for multiple modes of diurnal variability, J. Clim., 21, 4087–4114.
Yang, S., K.‐S. Kuo, and E. A. Smith (2008), Persistent nature of second-ary diurnal modes of precipitation over oceanic and continental regimes,J. Clim., 21, 4115–4131.
Yen, M.‐C. (2005), Interannual variation of the diurnal convection cycle inthe western North Pacific, Meteorol. Atmos. Phys., 90, 67–75.
C. L. Bain, Met Office, Exeter, EX1 3PB, UK.G. Magnusdottir, Department of Earth System Science, University of
California, Irvine, CA 92697, USA. ([email protected])P. Smyth, Department of Computer Science, University of California,
Irvine, CA 92697, USA.H. Stern, Department of Statistics, University of California, Irvine,
CA 92697, USA.
BAIN ET AL.: DIURNAL CYCLE OF THE INTERTROPICAL CONVERGENCE ZONE D23116D23116
10 of 10


![Diurnal and Nocturnal Animals. Diurnal Animals Diurnal is a tricky word! Let’s all say that word together. Diurnal [dahy-ur-nl] A diurnal animal is an.](https://static.fdocuments.in/doc/165x107/56649dda5503460f94ad083f/diurnal-and-nocturnal-animals-diurnal-animals-diurnal-is-a-tricky-word-lets.jpg)