Diurnal Thermal Regime in a Peat-Covered Palsa, Toolik...
6
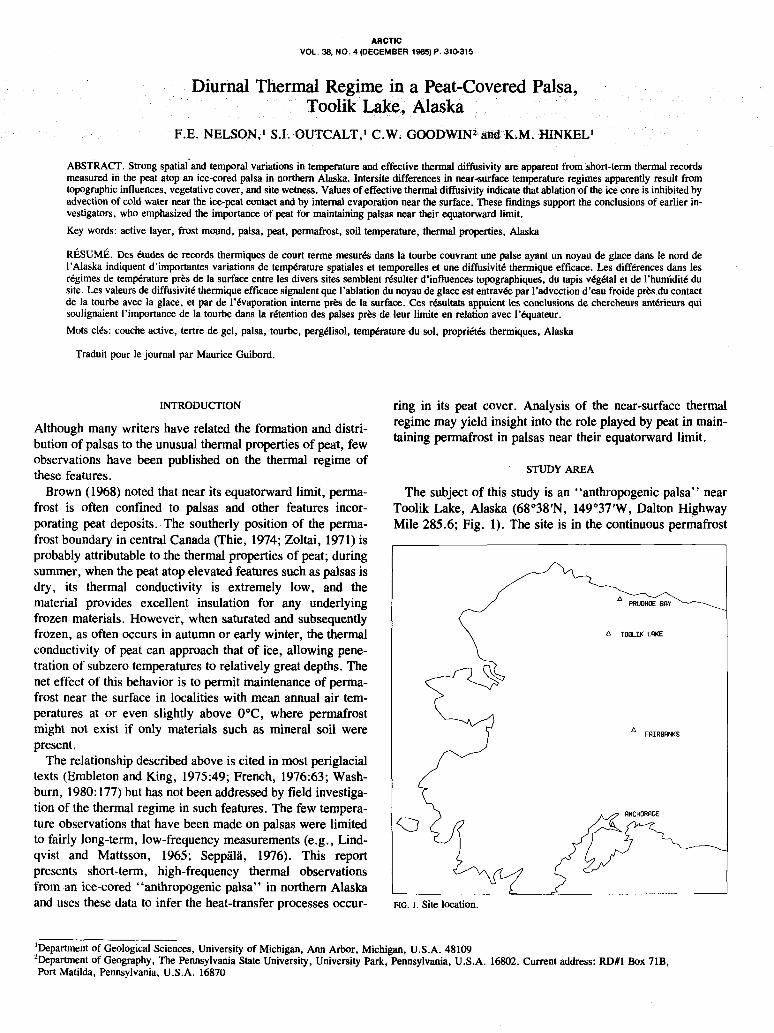
VOL. 38. NO. 4 (DECEMBER 1%) P. 31C-315 ARCTIC Diurnal Thermal Regime in a Peat-Covered Palsa, Toolik Lake, Alaska F.E. NELSON,’ S.I. OUTCALT,’ C. W. OOODWINZ and K.M. HINKEL’ ABSTRACT. Strong spatial‘and temporal variations in temperature and effective thermal diffusivity are apparent from short-term thermal records measured in the peat atop an icecored palsa in northern Alaska. Intersite differences in near-surface temperature regimes apparently result from topographic influences, vegetative cover, and site wetness. Values of effective thermal diffusivity indicate that ablation of the ice core is inhibited by advection of cold water near the ice-peat contact and by internal evaporation near the surface. These findings support the conclusions of earlier in- vestigators, who emphasized the importance of peat for maintaining palsas near their equatorward limit. Key words: active layer, frost mound, palsa, peat, permafrost, soil temperature, thermal properties, Alaska RÉSUMÉ. Des études de records thermiques de court terme mesurés dans la tourbe. couvrant une palse ayant un noyau de glace dans le nord de l’Alaska indiquent d’importantes variations de température spatiales et temporelles et une diffusiuité thermique efficace. Les différences dans les régimes de température prhs de la surface entre les divers sites semblent résulter d’influences topographiques, du tapis végétal et de l’humidité du site. Les valeursde diffusivité thermique efficace signalent que l’ablation du noyau de glace est entravk par I’advection d’eaufroide prbs du contact de la tourbe avec la glace, et par de I’évaporation interne pres de la surface. Ces rbultats appuient les conclusions de chercheurs antérieurs qui soulignaient l’importancede la tourbe dans la rétention des palses prbs de leur limite en relation avec I’clquateur. Mots cl&: couche active, tertre de gel, palsa, tourbe, pergélisol, temp6rature du sol, propriétés thermiques, Alaska Traduit pour le journal par Maurice Guibord. INTRODUCTION Although many writers have related the formation anL di istri- bution of palsas to the unusual thermal properties of peat, few observations have been published on the thermal regime of these features. Brown (1968) noted that near its equatorward limit, perma- frost is often confined to palsas and other features incor- porating peat deposits.. The southerly position of the perma- frost boundary in central Canada (Thie, 1974; Zoltai, 1971) is probably attributable to the thermal properties of peat; during summer, when the peat atop elevated features such as palsas is dry, its thermal conductivity is extremely low, and the material provides excellent insulation for any underlying frozen materials. However, when saturated and subsequently frozen, as often occurs in autumn or early winter, the thermal conductivity of peat can approach that of ice, allowing pene- tration of subzero temperatures to relatively great depths. The net effect of this behavior is to permit maintenance of perma- frost near the surface in localities with mean annual air tem- peratures at or even slightly above O’C, where permafrost might not exist if only materials such as mineral soil were present. The relationship described above is cited in most periglacial texts (Embleton and King, 1975:49; French, 1976:63; Wash- burn, 1980:177) but has not been addressed by field investiga- tion of the thermal regime in such features. The few tempera- ture observations that have been made on palsas were limited to fairly long-term, low-frequency measurements (e.g., Lind- qvist and Mattsson, 1965; Seppala, 1976). This report presents short-term, high-frequency thermal observations from an icecored “anthropogenic palsa” in northern Alaska and uses these data to infer the heat-transfer processes occur- ring in its peat cover. Analysis of the near-surface thermal regime may yieldinsight into the role played by peat in main- taining permafrost in palsas near their equatorward limit. STUDY AREA The subject of this study is an “anthropogenic palsa” near Toolik Lake, Alaska (68’38’N, 149’37W, Dalton Highway Mile 285.6; Fig. 1). The site is in the continuous permafrost c FRIRERNKS FIG. I. Site location. ‘Department of Geological Sciences, University of Michigan, Ann Arbor, Michigan, U.S.A. 48109 ’Department of Geography, The Pennsylvania State University, University Park, Pennsylvania, U.S.A. 16802. Current address: RD#l Box 71B, Port Matilda, Pennsylvania, U.S.A. 16870
-
Upload
truongminh -
Category
Documents
-
view
216 -
download
0
Transcript of Diurnal Thermal Regime in a Peat-Covered Palsa, Toolik...
VOL. 38. NO. 4 (DECEMBER 1%) P. 31C-315 ARCTIC
Diurnal Thermal Regime in a Peat-Covered Palsa, Toolik Lake, Alaska
F.E. NELSON,’ S.I. OUTCALT,’ C. W. OOODWINZ and K.M. HINKEL’
ABSTRACT. Strong spatial‘and temporal variations in temperature and effective thermal diffusivity are apparent from short-term thermal records measured in the peat atop an icecored palsa in northern Alaska. Intersite differences in near-surface temperature regimes apparently result from topographic influences, vegetative cover, and site wetness. Values of effective thermal diffusivity indicate that ablation of the ice core is inhibited by advection of cold water near the ice-peat contact and by internal evaporation near the surface. These findings support the conclusions of earlier in- vestigators, who emphasized the importance of peat for maintaining palsas near their equatorward limit.
Key words: active layer, frost mound, palsa, peat, permafrost, soil temperature, thermal properties, Alaska
RÉSUMÉ. Des études de records thermiques de court terme mesurés dans la tourbe. couvrant une palse ayant un noyau de glace dans le nord de l’Alaska indiquent d’importantes variations de température spatiales et temporelles et une diffusiuité thermique efficace. Les différences dans les régimes de température prhs de la surface entre les divers sites semblent résulter d’influences topographiques, du tapis végétal et de l’humidité du site. Les valeurs de diffusivité thermique efficace signalent que l’ablation du noyau de glace est entravk par I’advection d’eau froide prbs du contact de la tourbe avec la glace, et par de I’évaporation interne pres de la surface. Ces rbultats appuient les conclusions de chercheurs antérieurs qui soulignaient l’importance de la tourbe dans la rétention des palses prbs de leur limite en relation avec I’clquateur. Mots cl&: couche active, tertre de gel, palsa, tourbe, pergélisol, temp6rature du sol, propriétés thermiques, Alaska
Traduit pour le journal par Maurice Guibord.
INTRODUCTION
Although many writers have related the formation anL di istri- bution of palsas to the unusual thermal properties of peat, few observations have been published on the thermal regime of these features.
Brown (1968) noted that near its equatorward limit, perma- frost is often confined to palsas and other features incor- porating peat deposits.. The southerly position of the perma- frost boundary in central Canada (Thie, 1974; Zoltai, 1971) is probably attributable to the thermal properties of peat; during summer, when the peat atop elevated features such as palsas is dry, its thermal conductivity is extremely low, and the material provides excellent insulation for any underlying frozen materials. However, when saturated and subsequently frozen, as often occurs in autumn or early winter, the thermal conductivity of peat can approach that of ice, allowing pene- tration of subzero temperatures to relatively great depths. The net effect of this behavior is to permit maintenance of perma- frost near the surface in localities with mean annual air tem- peratures at or even slightly above O’C, where permafrost might not exist if only materials such as mineral soil were present.
The relationship described above is cited in most periglacial texts (Embleton and King, 1975:49; French, 1976:63; Wash- burn, 1980: 177) but has not been addressed by field investiga- tion of the thermal regime in such features. The few tempera- ture observations that have been made on palsas were limited to fairly long-term, low-frequency measurements (e.g., Lind- qvist and Mattsson, 1965; Seppala, 1976). This report presents short-term, high-frequency thermal observations from an icecored “anthropogenic palsa” in northern Alaska and uses these data to infer the heat-transfer processes occur-
ring in its peat cover. Analysis of the near-surface thermal regime may yield insight into the role played by peat in main- taining permafrost in palsas near their equatorward limit.
STUDY AREA
The subject of this study is an “anthropogenic palsa” near Toolik Lake, Alaska (68’38’N, 149’37W, Dalton Highway Mile 285.6; Fig. 1). The site is in the continuous permafrost
c FRIRERNKS
FIG. I . Site location.
‘Department of Geological Sciences, University of Michigan, Ann Arbor, Michigan, U.S.A. 48109 ’Department of Geography, The Pennsylvania State University, University Park, Pennsylvania, U.S.A. 16802. Current address: RD#l Box 71B, Port Matilda, Pennsylvania, U.S.A. 16870

DIURNAL THERMAL REGIME IN A PEAT-COVERED PALSA
zone. Galbraith, located 15 km south of Toolik Lake, has an estimated mean annual air temperature of -95°C (Haugen, 1982). The palsa is one of several that formed in the winter of 1978-79, apparently in response to road construction asso- ciated with the Trans-Alaska Pipeline System (Nelson and Outcalt, 1982). The palsas are approximately one metre in height and consist of massive ice cores overlain by 10-50 cm of peat and a small amount of mineral soil (Fig. 2).
FIG. 2. Typical palsa at Toolik Lake site. Note core of massive ice and over- lying peat layer (August 1983).
The palsas appear to have been produced by closed-system freezing within the active layer, in a manner ana€ogous to the formation of pingos in drained lake basins (Mackay, 1979). Construction of the gravel road berms impeded drainage at the site; the resulting increase in soil moisture retarded freezeback in localized areas and initiated small closed freezing systems. Crystallographic and chemical analyses (Outcalt, Nelson, Hinkel and Martin, 1986) indicates that progressive freezing from all sides resulted in concentration of supercooled water in constricted pockets within the active layer. Freezing of this water deformed the overlying layers and produced a mass of clean ice overlain by a relatively thin layer of peat. The ice cores have been preserved as permafrost, resulting in features that fit Washburn's (1983) definition of palsas.
Five mounds have been surveyed at irregular intervals, be-
, .',. , ,
31 1
ginning in July 1980. By August 1983, the summit elevations had decreased an average of only 11 cm, indicating that abla- tion of the ice cores in summer is minimal. Because the peat cover is typically only 10-50 cm thick on these features, this observation supports the hypothesis that the thermal properties of peat are conducive to preservation of palsas.
INSTRUMENTATION AND DATA COLLECTION
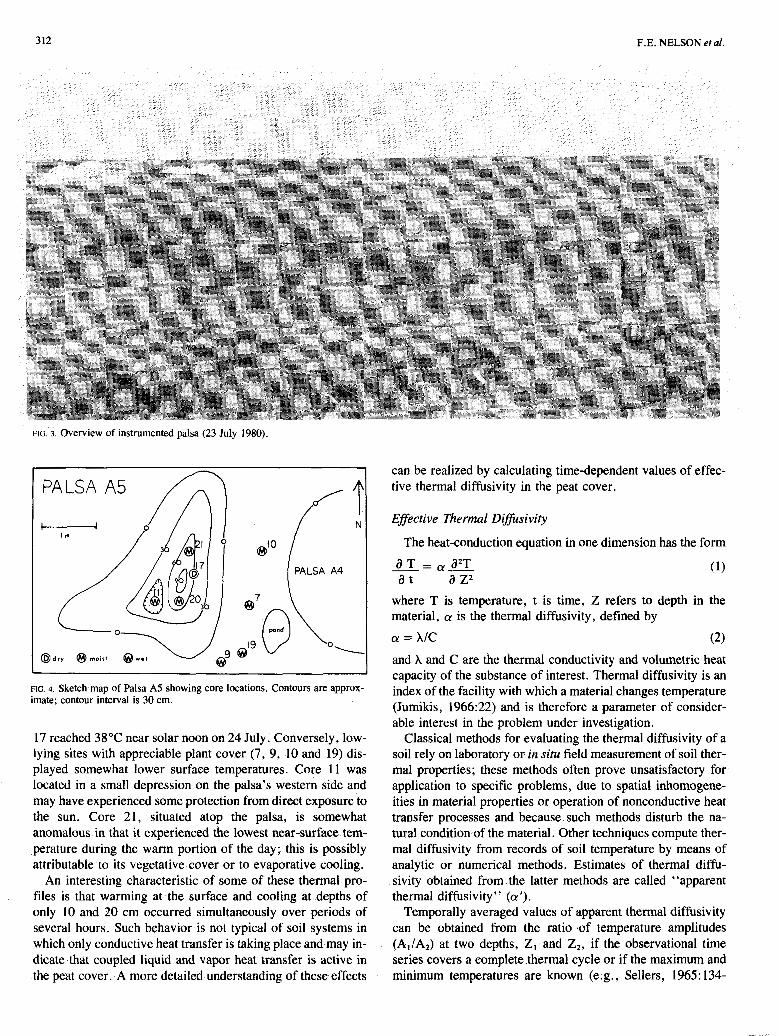
To gain m e r insight into the thermal processes occurring in such frost mounds, a detailed temperature record was ob- tained over a 24-hour period on and around the base of a typical palsa (A5) at the Toolik site. The temperature data were collected during a period of clear and nearly calm weather. Such conditions produce strong contrasts in surface temperature (e .g . , Outcalt , 1975).
Temperature data were obtained with a portable battery- operated data logger designed and constructed at the Penn- sylvania State University. The logger scans up to 192 sensors at intervals ranging from 10 min to 24 h, digitizes the sensor values, and stores the data on digital cassettes. Each cassette holds about 50 O00 data points; the data are extracted and pro- cessed by means of a microprocessor.
The Toolik data set is composed of temperatures measured in eight cores at depths of O , 1, 5, 10 and 20 cm in the peat cover of the palsa and around its base. Temperatures were measured with thermistors supported by epoxy-filled acrylic cylinders and placed in the peat cover normal to the surface. The thermistors were scanned at 10-min intervals for 24 h, yielding a time series of 144 temperature observations in each of 40 measurement locations, beginning at 20: 10 Alaska Standard Time on 23 July 1980. The absolute accuracy of the temperature measurements is approximately 0.2"C.
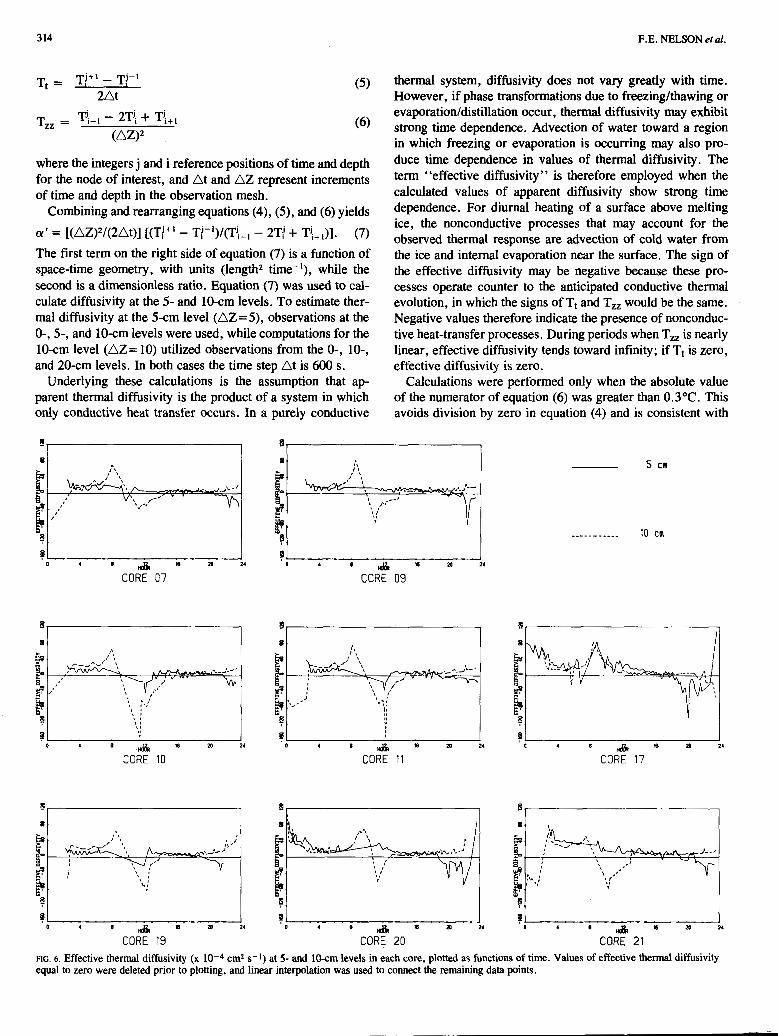
A brief description of the eight core sites is given in Table 1. The moisture status of each site is based on a nominal wet/ moist/dry categorization averaged over the core length (20 cm). An overview of the instrumented palsa and sketch map of the study area are given in Figures 3 and 4 respectively.
TABLE 1. Core site descriptions
Core Site description Surface cover Moisture class 7, 10 low, east side grasseslsedges moist 9 , 19 low, southeast side grasses/sedges 11
wet coHapse depression peat wet
17 near summit southeast exposure peat
20 dry
21 southwest exposure peat moist crest grasses/sedges moist
ANALYSIS
Temperature Records
The temperature records for each core are plotted as func- tions of time in Figure 5 . Some topoclimatic effects are dis- cernible from this illustration. Cores 17 and 20, with southerly exposures and little living vegetation, had very high surface temperatures during the afternoon; the surface temperature at
3 12 F.E. NELSON etal.
FIG. 3. Overview of instrumented palsa (23 July 1980).
FIG. 4. Sketch map of Palsa A5 showing core locations. Contours are approx- imate; contour interval is 30 cm.
17 reached 38°C near solar noon on 24 July. Conversely, low- lying sites with appreciable plant cover (7, 9, 19 and 19) dis- played somewhat lower surface temperatures. Core 1 1 was located in a small depression on the palsa’s western side and may have experienced some protection from direct exposure to the sun. Core 21, situated atop the palsa, is somewhat anomalous.in that it experienced the lowest near-surface tem- perature during the warm portion of the day; this is possibly attributable to its vegetative cover or to evaporative cooling.
An interesting characteristic of some of these thermal pro- . files is that warming at the surface and cooling at .depths of
only 10 and 20 cm occurred simultaneously over periods of several hours. Such behavior is not typical of soil systems in which only conductive heat transfer is taking place and.may in- dicate that coupled liquid and vapor heat transfer is active in the peat cover. A more detailed-understanding of these effects
can be realized by calculating time-dependent values of effec- tive thermal diffusivity in the peat cover.
Effective Thermal Difisivity
The heat-conduction equation in one dimension has the form
a T = (1) a t a z2
where T is temperature, t is time, Z refers to depth in the material, a is the thermal diffusivity, defined by a = MC (2)
and X and C are the thermal conductivity and volumetric heat capacity of the substance of interest. Thermal diffusivity is an index of the facility with which a material changes temperature (Jumikis, 1966:22) and is therefore a parameter of consider- able interest in the problem under investigation.
Classical methods for evaluating the thermal diffusivity of a soil rely on laboratory or in situ field measurement of soil ther- mal properties; these methods often prove unsatisfactory for. application to specific problems, due to spatial inhomogene- ities in material properties or operation of nonconductive heat transfer processes and because such methods disturb the na- tural condition.of the material. Other techniques compute ther- mal diffusivity from records of soil temperature by means of analytic or numerical methods. Estimates of thermal diffu- sivity obtained from. the latter methods are called “apparent thermal diffusivity” (a’).
Temporally averaged values of apparent thermal diffusivity can be obtained from the ratio ,of temperature amplitudes (Al/Az) at two depths, Z1 and Zz, if the observational time series covers a complete .thermal cycle or if the maximum and minimum temperatures are known (e.g., Sellers, 1965: 134-

~ ~, . DIURNAL THERMAL REGIME IN A PEAT-COVERED PALSA
. ~. . 313
CORE 07
w
P c
CORE IO
CORE 19
FIG. 5 . Thermal records at eight core locations.
137). The calculation takes the form
= : Eiiz]
X
% B EQ 0
0
0 4 8 H d 3 R I B 2 0 2 4
CORE 09
0 4 8 ,,& 16 20 24
CORE 11
in which w is the angular frequency of oscillation, given by w = 2 r/P, and P is the period of the temperature wave.
The average diffusivity for each core calculated by the amplitude-ratio method is reported in Table 2; even these tem- porally averaged values span two orders of magnitude. The
TABLE 2. Average thermal diffusivity (x cmz s") calculated by amplitude-ratio method
Ratio levels (cm) Core 0- 1 1-5 5-10 10-20
7
18 . 3 23 439 11 3 6 14 247 10 9 6 18 139 9
12 4 11 305
16 8 7 252 21 18 8 10 46 20 6 5 17 56 19
22 8 5 49 17
CORE 17
7 7 B 16 20 24
CORE 21
high values centered on the 0.5-cm level may have been pro- duced by near-surface air circulation in the relatively dry peat or may simply reflect the difficulty of defining the complex air-vegetation-soil "boundary. " The general tendency for higher values of apparent diffusivity with depth and the high values centered on the 15-cm level (calculated from the ampli- tude ratio between 10 and 20 cm) suggest that processes other than pure conduction were operating. These large spatial variations in a relatively homogeneous medium indicate that large differences in heat-transfer processes occur over small horizontal and vertical distances.
Apparent thermal diffusivity can also be calculated using finite-difference techniques (e.g., McGaw et al., 1978), which provide estimates at numerous times over the diurnal thermal cycle. Apparent thermal diffusivity was estimated from the thermal records shown in Figure 5 by
CY = Tt/Tzz (4)
where Tt and T, are the finitedifference approximations of d T/d t and d2T/d Zz in equation (1). The procedure obtains approximations for the time and space derivatives, respective- ly, from equations ( 5 ) and (6):
314 F.E. NELSON et al.
where the integers j and i reference positions of time and depth for the node of interest, and At and AZ represent increments of time and depth in the observation mesh.
Combining and rearranging equations (4), (5), and (6) yields
a' = [(~lZ)~/(2At)] [(Ti+' - Ti-l)/(TJi-l - 2Ti + T{+')]. (7) The first term on the right side of equation (7) is a function of space-time geometry, with units (length2 time"), while the second is a dimensionless ratio. Equation (7) was used to cal- culate diffusivity at the 5- and IO-cm levels. To estimate ther- mal diffusivity at the 5-cm level (AZ=5), observations at the 0-, 5-, and 10-cm levels were used, while computations for the 10-cm level (AZ= 10) utilized observations from the 0-, lo-, and 20cm levels. In both cases the time step At is 600 s.
Underlying these calculations is ,the assumption that ap- parent thermal diffusivity is the product of a system in which only conductive heat transfer occurs. In a purely conductive
n I
:r-----l
1 4 I ,& m m 24
CORE 10
thermal system, diffusivity does not vary greatly with time. However, if phase transformations due to freezing/thawing or evaporationldistillation occur, thermal diffusivity may exhibit strong time dependence. Advection of water toward a region in which freezing or evaporation is occurring may also pro- duce time dependence in values of thermal diffusivity . The term "effective diffusivity" is therefore employed when the calculated values of apparent diffusivity show strong time dependence. For diurnal heating of a surface above melting ice, the nonconductive processes that may account for the observed thermal response are advection of cold water from the ice and internal evaporation near the surface. The sign of the effective diffusivity may be negative because these pro- cesses operate counter to the anticipated conductive thermal evolution, in which the signs of Tt and Tzz would be the same. Negative values therefore indicate the presence of nonconduc- tive heat-transfer processes. During periods when T, is nearly linear, effective diffusivity tends toward infinity; if Tt is zero, effective diffusivity is zero.
Calculations were performed only when the absolute value of the numerator of equation (6) was greater than 0.3"C. This avoids division by zero in equation (4) and is consistent with
?- 1 & m m 2 8
CORE 09
_ _ _ _ _ _ _ _ _ _ _ 10 CM
- 1 I
tl 4 J a & s m a z r
CORE 17
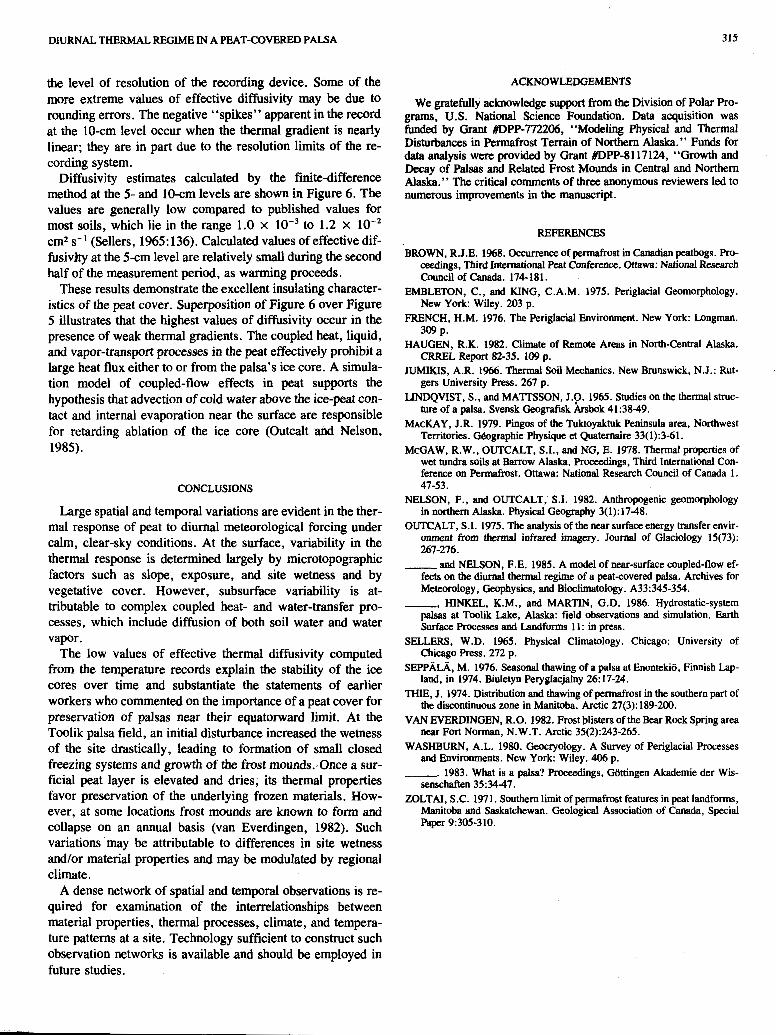
FIG. 6. Effective thermal diffusivity (x 10-4 cmz s- I ) at 5- and 10-cm levels in each core, plotted as functions of time. Values of effective thermal diffusivity equal to zero were deleted prior to plotting, and linear interpolation was used to connect the remaining data points.
DIURNAL THERMAL REGIME IN A PEAT-COVERED PALSA
the level of resolution of the recording device. Some of the more extreme values of effective diffusivity may be due to rounding errors. The negative “spikes” apparent in the record at the lOcm level occur when the thermal gradient is nearly linear; they are in part due to the resolution limits of the re- cording system.
Diffusivity estimates calculated by the finitedifference method at the 5- and 10-cm levels are shown in Figure 6. The values are generally low compared to published values for most soils, which lie in the range 1.0 x to 1.2 X lo-* cmz s” (Sellers, 1965: 136). Calculated values of effective dif- fusivity at the 5 c m level are relatively small during the second half of the measurement period, as warming proceeds.
These results demonstrate the excellent insulating character- istics of the peat cover. Superposition of Figure 6 over Figure 5 illustrates that the highest values of diffusivity occur in the presence of weak thermal gradients. The coupled heat, liquid, and vapor-transport processes in the peat effectively prohibit a large heat flux either to or from the palsa’s ice core. A simula- tion model of coupled-flow effects in peat supports the hypothesis that advection of cold water above the ice-peat con- tact and internal evaporation near the surface are responsible for retarding ablation of the ice core (Outcalt and Nelson, 1985).
CONCLUSIONS
Large spatial and temporal variations are evident in the ther- mal response of peat to diurnal meteorological forcing under calm, clear-sky conditions. At the surface, variability in the thermal response is determined largely by microtopographic factors such as slope, exposure, and site wetness and by vegetative cover. However, subsurface variability is at- tributable to complex coupled heat- and water-transfer pro- cesses, which include diffusion of both soil water and water vapor.
The low values of effective thermal diffusivity computed from the temperature records explain the stability of the ice cores over time and substantiate the statements of earlier workers who commented on the importance of a peat cover for preservation of palsas near their equatorward limit. At the Toolik palsa field, an initial disturbance increased the wetness of the site drastically, leading to formation of small closed freezing systems and growth of the frost mounds. Once a sur- ficial peat layer is elevated and dries, its thermal properties favor preservation of the underlying frozen materials. How- ever, at some locations frost mounds are known to form and collapse on an annual basis (van Everdingen, 1982). Such variations may be attributable to differences in site wetness and/or material properties and may be modulated by regional climate.
A dense network of spatial and temporal observations is re- quired for examination of the interrelationships between material properties, thermal processes, climate, and tempera- ture patterns at a site. Technology sufficient to construct such observation networks is available and should be employed in future studies.
313
ACKNOWLEDGEMENTS
We gratefully acknowledge support from the Division of Polar Pro- grams, US. National Science Foundation. Data acquisition was funded by Grant #DPP-772206, “Modeling Physical and Thermal Disturbances in Permafrost Terrain of Northern Alaska.” Funds for data analysis were provided by Grant #DPP-8117124, “Growth and Decay of Palsas and Related Frost Mounds in Central and Northern Alaska.” The critical comments of three anonymous reviewers led to numerous improvements in the manuscript.
REFERENCES
BROWN, R.J.E. 1%8. Occurrence of permafrost in Canadian peatbogs. Pro- ceedings, Third International Peat Conference. Ottawa: National Research Council of Canada. 174-181.
EMBLETON, C., and KING, C.A.M. 1975. Periglacial Geomorphology. New York: Wiley. 203 p.
FRENCH, H.M. 1976. The Periglacial Environment. New York: Longman.
HAUGEN, R.K. 1982. Climate of Remote Areas in North-Central Alaska. CRREL Report 82-35. 109 p.
JUMWS, A.R. 1966. Thermal Soil Mechanics. New Brunswick, N.J.: Rut- gers University Press. 267 p.
LINDQVIST, S., and MATTSSON, J.9. 1965. Studies on the thermal struc- ture of a palm. Svensk Geografisk Arsbok 41:3849.
MAcKAY, J.R. 1979. Pingos of the Tuktoyaktuk Peninsula area, Northwest Territories. Gbgraphie Physique et Quaternaire 33(1):3-61.
McGAW, R.W., OUTCALT, S.I., and NG, E. 1978. Thermal properties of wet tundra soils at Barrow Alaska. Proceedings, Third International Con- ference on Permafrost. Ottawa: National Research Council of Canada 1. 47-53.
NELSON, F., and OUTCALT,’ S.I. 1982. Anthropogenic geomorphology in northern Alaska. Physical Geography 3(1):1748.
OUTCALT, S.I. 1975. The analysis of the near surface energy transfer envir- onment from thermal infrared. imagery. Journal of Glaciology 15(73):
and NELSON, F.E. 1985. A model of near-surface coupled-flow ef- fects on the diurnal thermal regime of a peatcovered palsa. Archives for Meteorology, Geophysics, and Bioclimatology. A33:345-354.
-, HINKEL, K.M., and MARTIN, G.D. 1986. Hydrostatic-system palsas at Toolik Lake, Alaska: field observations and simulation. Earth Surface Processes and Landforms 11: in press.
SELLERS, W.D. 1%5. Physical Climatology. Chicago: University of Chicago Press. 272 p.
SEPPALA, M. 1976. Seasonal thawing of a palsa at Enontekio, Finnish Lap- land, in 1974. Biuletyn Peryglacjalny 26:17-24.
THIE, J. 1974. Distribution and thawing of permafrost in the southern part of the discontinuous zone in Manitoba. Arctic 27(3):189-200.
VAN EVERDINGEN, R.O. 1982. Frost blisters of the Bear Rock Spring area near Fort Norman, N.W.T. Arctic 35(2):243-265.
WASHBURN, A.L. 1980. Geocryology. A Survey of Periglacial Processes and Environments. New York: Wiley. 406 p.
-. 1983. What is a palsa? Proceedings, Gottingen Akademie der Wis- senschaften 3 5 3 4 7 .
ZOLTAI, S.C. 1971. Southern limit of permafrost features in peat landforms, Manitoba and Saskatchewan. Geological Association of Canada, Special Paper 9:305-310.
309 p.
267-276.


![Diurnal and Nocturnal Animals. Diurnal Animals Diurnal is a tricky word! Let’s all say that word together. Diurnal [dahy-ur-nl] A diurnal animal is an.](https://static.fdocuments.in/doc/165x107/56649dda5503460f94ad083f/diurnal-and-nocturnal-animals-diurnal-animals-diurnal-is-a-tricky-word-lets.jpg)