Diurnal and Seasonal Cycles of Cloud Occurrences, Types, and
20
Diurnal and Seasonal Cycles of Cloud Occurrences, Types, and Radiative Impact over West Africa DOMINIQUE BOUNIOL,FLEUR COUVREUX,PIERRE-HONORE ´ KAMSU-TAMO,MADELEINE LEPLAY, FRANC xOISE GUICHARD, AND FLORENCE FAVOT GAME-CNRM, CNRS-Me ´te ´ o-France, Toulouse, France EWAN J. O’CONNOR University of Reading, Reading, United Kingdom, and Finnish Meteorological Institute, Helsinki, Finland (Manuscript received 2 March 2011, in final form 26 July 2011) ABSTRACT This study focuses on the occurrence and type of clouds observed in West Africa, a subject that has been neither much documented nor quantified. It takes advantage of data collected above Niamey, Niger, in 2006 with the Atmospheric Radiation Measurement (ARM) Mobile Facility. A survey of cloud characteristics inferred from ground measurements is presented with a focus on their seasonal evolution and diurnal cycle. Four types of clouds are distinguished: high-level clouds, deep convective clouds, shallow convective clouds, and midlevel clouds. A frequent occurrence of the latter clouds located at the top of the Saharan air layer is highlighted. High-level clouds are ubiquitous throughout the period whereas shallow convective clouds are mainly noticeable during the core of the monsoon. The diurnal cycle of each cloud category and its seasonal evolution are investigated. CloudSat and Cloud–Aerosol Lidar and Infrared Pathfinder Satellite Observations (CALIPSO) data are used to demonstrate that these four cloud types (in addition to stratocumulus clouds over the ocean) are not a particularity of the Niamey region and that midlevel clouds are present over the Sahara during most of the monsoon season. Moreover, using complementary datasets, the radiative impact of each type of clouds at the surface level has been quantified in the short- and longwave domains. Midlevel clouds and anvil clouds have the largest impact, respectively, in longwave (about 15 W m 22 ) and shortwave (about 150 W m 22 ) radiation. Furthermore, midlevel clouds exert a strong radiative forcing during the spring at a time when the other cloud types are less numerous. 1. Introduction Several authors (Cess et al. 1996; Dufresne and Bony 2008) have invoked clouds as a major source of un- certainty for future climate projections, in particular through a diversity of feedbacks between clouds and radiative processes. Furthermore, clouds also strongly affect weather forecasts and play an important role in the water cycle. In the tropics, a majority of cloud studies have focused on oceanic regions, and much less is known and understood about clouds occurring over continental regions. This is particularly true in areas where data are sparse, like West Africa. During the monsoon season (June–September) in West Africa the rain originates mainly from mesoscale convective systems (Mathon et al. 2002). These con- vective systems are often associated with extended an- vils (Leary and Houze 1979; Gamache and Houze 1983; Houze 2004) located in the upper troposphere. How- ever, very little is known about other cloud systems oc- curring in this region or about cloud systems occurring before the monsoon onset. Major advances in the docu- mentation of the cloud occurrence, diurnal cycles, or intraseasonal variations were achieved from the Global Atmospheric Research Program (GARP) Atlantic Tropi- cal Experiment (GATE) and through geostationary sat- ellite measurements (Duvel 1989). The climate of such a continental region is however expected to be sensitive to cloud feedbacks on radiative processes that are themselves affecting the surface processes and energy balance (e.g., Betts and Viterbo 2005; Betts 2007; Garratt 1993). Clouds Corresponding author address: Dominique Bouniol, GAME- CNRM, 42 Ave. Gaspard Coriolis, 31057 Toulouse CEDEX, France. E-mail: [email protected] 534 JOURNAL OF APPLIED METEOROLOGY AND CLIMATOLOGY VOLUME 51 DOI: 10.1175/JAMC-D-11-051.1 Ó 2012 American Meteorological Society
Transcript of Diurnal and Seasonal Cycles of Cloud Occurrences, Types, and

Diurnal and Seasonal Cycles of Cloud Occurrences, Types, andRadiative Impact over West Africa
DOMINIQUE BOUNIOL, FLEUR COUVREUX, PIERRE-HONORE KAMSU-TAMO, MADELEINE LEPLAY,FRANCxOISE GUICHARD, AND FLORENCE FAVOT
GAME-CNRM, CNRS-Meteo-France, Toulouse, France
EWAN J. O’CONNOR
University of Reading, Reading, United Kingdom, and Finnish Meteorological Institute, Helsinki, Finland
(Manuscript received 2 March 2011, in final form 26 July 2011)
ABSTRACT
This study focuses on the occurrence and type of clouds observed in West Africa, a subject that has been
neither much documented nor quantified. It takes advantage of data collected above Niamey, Niger, in 2006
with the Atmospheric Radiation Measurement (ARM) Mobile Facility. A survey of cloud characteristics
inferred from ground measurements is presented with a focus on their seasonal evolution and diurnal cycle.
Four types of clouds are distinguished: high-level clouds, deep convective clouds, shallow convective clouds,
and midlevel clouds. A frequent occurrence of the latter clouds located at the top of the Saharan air layer is
highlighted. High-level clouds are ubiquitous throughout the period whereas shallow convective clouds are
mainly noticeable during the core of the monsoon. The diurnal cycle of each cloud category and its seasonal
evolution are investigated. CloudSat and Cloud–Aerosol Lidar and Infrared Pathfinder Satellite Observations
(CALIPSO) data are used to demonstrate that these four cloud types (in addition to stratocumulus clouds
over the ocean) are not a particularity of the Niamey region and that midlevel clouds are present over the
Sahara during most of the monsoon season. Moreover, using complementary datasets, the radiative impact of
each type of clouds at the surface level has been quantified in the short- and longwave domains. Midlevel
clouds and anvil clouds have the largest impact, respectively, in longwave (about 15 W m22) and shortwave
(about 150 W m22) radiation. Furthermore, midlevel clouds exert a strong radiative forcing during the spring
at a time when the other cloud types are less numerous.
1. Introduction
Several authors (Cess et al. 1996; Dufresne and Bony
2008) have invoked clouds as a major source of un-
certainty for future climate projections, in particular
through a diversity of feedbacks between clouds and
radiative processes. Furthermore, clouds also strongly
affect weather forecasts and play an important role in
the water cycle. In the tropics, a majority of cloud studies
have focused on oceanic regions, and much less is known
and understood about clouds occurring over continental
regions. This is particularly true in areas where data are
sparse, like West Africa.
During the monsoon season (June–September) in
West Africa the rain originates mainly from mesoscale
convective systems (Mathon et al. 2002). These con-
vective systems are often associated with extended an-
vils (Leary and Houze 1979; Gamache and Houze 1983;
Houze 2004) located in the upper troposphere. How-
ever, very little is known about other cloud systems oc-
curring in this region or about cloud systems occurring
before the monsoon onset. Major advances in the docu-
mentation of the cloud occurrence, diurnal cycles, or
intraseasonal variations were achieved from the Global
Atmospheric Research Program (GARP) Atlantic Tropi-
cal Experiment (GATE) and through geostationary sat-
ellite measurements (Duvel 1989). The climate of such
a continental region is however expected to be sensitive to
cloud feedbacks on radiative processes that are themselves
affecting the surface processes and energy balance (e.g.,
Betts and Viterbo 2005; Betts 2007; Garratt 1993). Clouds
Corresponding author address: Dominique Bouniol, GAME-
CNRM, 42 Ave. Gaspard Coriolis, 31057 Toulouse CEDEX,
France.
E-mail: [email protected]
534 J O U R N A L O F A P P L I E D M E T E O R O L O G Y A N D C L I M A T O L O G Y VOLUME 51
DOI: 10.1175/JAMC-D-11-051.1
� 2012 American Meteorological Society

and cloud feedbacks are thus a key component of the
monsoon system that need to be better documented and
understood.
A major advance over poorly documented regions
was achieved in 2006 with the launch of the CloudSat
(Stephens et al. 2002) and Cloud–Aerosol Lidar and
Infrared Pathfinder Satellite Observations (CALIPSO;
Winker et al. 2007) satellites that provide a cloud radar
and a lidar within the A-Train constellation. This down-
ward sampling provides bidimensional ‘‘slices’’ within
cloud systems. The orbits of the constellation are sun
synchronous, passing over the equator at about 0130
(night) and 1330 (day) mean local time (twice per day).
The A-Train’s orbit repeats approximately the same
ground track every 16 days.
Figure 1 shows this 16-day ground track over a 108W–
108E transect domain located over West Africa. In the
north–south direction, this domain is sampled only twice
per day (one during daytime and one during nighttime)
and, because of the sun-synchronous orbit, at fixed hours.
Documenting the seasonal and diurnal cloud cover evo-
lution using the CloudSat–CALIPSO dataset may then
be biased by this temporal subsampling.
As detailed in the following, the African monsoon is
characterized by a well-defined meridional structure, in
particular in surface albedo, vegetation, and atmospheric
circulation, with relatively weaker longitudinal variations.
This feature provides a valuable constrain for modeling
and model-evaluation purposes (Zheng and Eltahir 1998;
Hourdin et al. 2009). Here, we focus on the cloud cover
latitudinal variations by assuming that any track in the
domain shown in Fig. 1 is representative of a north–
south vertical slice at 08 longitude. A daily documen-
tation of the latitudinal cloud cover variations results
from this assumption. It is further compatible with the
African Monsoon Multidisciplinary Analysis (AMMA)
cross-section (AMMA-CROSS) framework developed in
Hourdin et al. (2009) and can be related to dynamical
features described in this paper.
In coincidence with the launch of the CloudSat and
CALIPSO satellites, the Atmospheric Radiation Mea-
surement (ARM) Mobile Facility (AMF) was deployed
for one year (2006) at the Niamey, Niger, airport (Miller
and Slingo 2007), as part of the AMMA field experiment
(Redelsperger et al. 2006; Lebel et al. 2010). The AMF is
a portable facility equipped with cloud-dedicated in-
strumentation (vertically pointing 94-GHz radar and li-
dar) that provides continuous, high temporal cloud profile
documentation, a radiosounding facility, and surface
budget measurements. Niamey is located at 13.58N and
2.38E (black square in Fig. 1), which corresponds to the
transition region between the Sahel and the Sahara
Desert, one of the driest regions in the world. These data
provide a high-frequency temporal sampling at this lo-
cation that may be compared with satellite data in order
to identify any possible bias related to the A-Train’s
much coarser sampling. Conversely, the ground-based
FIG. 1. Sixteen days of A-Train ground track over the AMMA-
CROSS domain as defined in Hourdin et al. (2009). The black
square indicates the location of Niamey (13.58N, 2.38W).
MARCH 2012 B O U N I O L E T A L . 535

measurements and resulting climatology correspond to
a particular location and the satellite data may be used
to generalize the results obtained at this particular lo-
cation to the continental scale.
Only a few recent studies have made use of the West
Africa AMF dataset for climatological purposes so far.
Kollias et al. (2009) analyze the relationships between
clouds, precipitation, and the thermodynamical envi-
ronment from daily to longer time scales without explicit
consideration of cloud types. Protat et al. (2010) focused
on the statistical properties of ice clouds and how they
differ with those encountered over Darwin, Australia, in
another monsoon region. In contrast, the purpose of this
paper is first to document the cloud characteristics, the
diurnal cycles, and patterns of seasonal evolution of all
cloud types encountered in the Niamey region during
spring and summer. This includes covering the pre-
monsoon and monsoon periods, both of which are cli-
matologically important and known to display distinct
surface and dynamic large-scale features (Sultan and
Janicot 2003).
These investigations are motivated by and useful for
the following purposes. First, this research can serve as
a reference to be compared with space-borne measure-
ments or used in order to evaluate cloud classifications
from geostationary satellites. Such a characterization is
also useful in order to infer the ability of models, either
numerical weather prediction or general circulation
model, in reproducing the observed cloud seasonal and
diurnal cycles. A step forward is achieved with an eval-
uation of the radiative impact of each cloud category on
the surface radiative fluxes. This can also further be used
to assess the radiative impact of each type of clouds in
models.
This paper is organized as follows. Section 2 presents
the data and the processing applied in order to compute
the cloud frequency of occurrence at a half-hour scale.
This section also presents how the data are sorted ac-
cording to defined categories. The intraseasonal evolu-
tion and the diurnal cycle are then investigated in section
3. In section 4 the impact of each cloud category on the
surface fluxes is quantified. Concluding remarks and per-
spectives are given in the last section.
2. Cloud frequency of occurrence
A detailed description of the AMF instrumentation
may be found in Miller and Slingo (2007). The basic
strategy of the ARM stations [Stokes and Schwartz
(1994); disseminated around the globe] is to continu-
ously collect vertical profiles of cloud properties using
cloud radar (35 or 94 GHz) and lidar and to measure
fluxes and meteorological variables at the surface
simultaneously. These measurements were developed in
the early 1990s and have since allowed us to build cloud
climatologies (Protat et al. 2010; Comstock et al. 2002;
Mather and McFarlane 2009) as well as to evaluate the
ability of models to produce the right statistics for cloud
variables (see, e.g., Hogan et al. 2001; Bouniol et al. 2010).
Indeed, macrophysical (cloud frequency of occurrence,
cloud-base and -top height), microphysical (ice and liquid
water content), radiative (effective radius) properties, or
even heating profiles (Mather and McFarlane 2009) may
be derived from these measurements. This paper is
mainly devoted to the documentation of cloud frequency
of occurrence and cloud radiative impact on ground radi-
ative fluxes within West Africa.
A key point lies in the definition of the cloud fre-
quency of occurrence, even if the general definition
‘‘number of cloudy observations to the total number of
observations at each level’’ is used. To do so, the data
have been categorized following the process described
in Illingworth et al. (2007) and fully detailed in Hogan
and O’Connor (2010). This algorithm provides cloud
profiles every 43 s with 60-m vertical resolution. Special
care has been taken not to consider rain and drizzle as
clouds (each gate of the radar–lidar profile being cate-
gorized). Therefore, only the presence of liquid droplets,
ice droplets, supercooled droplets, or melting ice makes
the ‘‘pixel’’ cloudy. Figure 2a shows the cloud frequency
of occurrence derived from the AMF data at the Niamey
site from 1 June to 30 September 2006.
Depending on the objectives, the cloud frequency of
occurrence may be computed from ground-based in-
strumentation over different time spans. For instance, if
one considers the data at full resolution (temporal and
vertically; red line in Fig. 2a) a mean frequency of oc-
currence of approximately 8% is obtained (thin black
line in Fig. 2a). This is very similar to the results ob-
tained by Protat et al. (2010). On the other hand, for
comparison with models (Hogan et al. 2001; Bouniol
et al. 2010), it is necessary to compute the cloud frequency
of occurrence from the observations at the model grid
scale. The horizontal wind speed can be used to determine
at each grid point an averaging time (see, e.g., Hogan et al.
2001) corresponding to the model horizontal resolution.
The observed cloud frequency of occurrence profile is
then representative of a model grid. The chosen model
grid may lead to substantial differences in the profiles
of the frequency of occurrence, as illustrated in Fig. 2a,
where observed cloud occurrences computed using the
European Centre for Medium-Range Weather Forecasts
(ECMWF) grid (0.58 latitude–longitude squared and 91
vertical levels; dashed black line) or the Met Office global
model grid (60-km2 horizontal resolution and 50 vertical
levels; dotted black line) are also shown. Both models
536 J O U R N A L O F A P P L I E D M E T E O R O L O G Y A N D C L I M A T O L O G Y VOLUME 51

also have a variable vertical resolution that has been
taken into account for computing the profiles. The main
conclusion arising from this comparison is that the cloud
frequency of occurrence is scale dependent and no ‘‘uni-
versal’’ profile can be derived. Important, though, is that
the broad shape and peaking levels remain identical.
Xi et al. (2010) provide similar results. Namely, they
stated that when comparing clouds from weather or cli-
mate models to cloud frequency of occurrence derived
from data, the temporal averaging time should be matched
to the size of the model resolution.
The green line is obtained by binning the data on a
30-min time base and keeping the full vertical resolution.
An increase in the peak value appears relative to the red
line (full resolution) because a grid box is considered
cloudy as soon as some clouds have been included within
it, independent of the value of the cloud fraction. This
finding is in agreement with the results of Xi et al. (2010)
over the southern Great Plains (see their Fig. 3). To re-
flect what can be found in the models, a vertical variable-
resolution grid has been defined (100-m resolution below
5 km, 200 m between 5 and 10 km, and 400 m above),
and the corresponding occurrence profiles with the high
vertical resolution or the defined grid are shown in Fig. 2a
as green and black lines, respectively. Averaging on the
vertical also leads to an increase, more significant in the
upper levels where the resolution is coarser, of the peak
values. To truly identify the impact of changing the ver-
tical resolution, one may also compare the red and blue
profiles where the full time resolution is used, but the
vertical grid is used in the blue profile computation. In the
following the cloud profiles are computed with 30-min
averages and on this variable vertical grid (black line).
The cloud frequency of occurrence displays three
peaks: two with the same magnitude in the middle levels
(7 km) and in the high level (13 km) and one of smaller
magnitude in the low levels (1.5 km). A contribution
between 4 and 16 km from a deep convective system is
also observed. On the basis of previous studies, the three
peaks identified in Fig. 2a may be associated with three
different cloud categories in addition to clouds directly
associated with deep convection. Kollias et al. (2009)
found a bimodal structure (peaking at 11.5 and 5.5 km)
for the average profile of the cloud and precipitation
fraction. When exploring the seasonal evolution, we found
trimodality from July to September and bimodality from
April to June (see section 3).
These cloud categories were reported in previous
studies. Hayward and Oguntoyinbo (1987) or Slingo
(1980) proposed a general characterization of the cloud
cover into West Africa that included four categories.
Houze and Betts (1981) summarized the observations of
FIG. 2. (a) Cloud frequency of occurrence for the 2006 monsoon season (1 Jun–30 Sep)
computed from the AMF radar–lidar at Niamey using different temporal and vertical grid
resolutions (defined in text, one color for each temporal and vertical grid combination), using
the ECMWF model grid (dashed black line) and the Met Office global model grid (dotted black
line). (b) AMF cloud frequency of occurrence (30 min/grid) for each cloud category (see text
for definitions).
MARCH 2012 B O U N I O L E T A L . 537

Simpson (1976), Borovikov et al. (1978), Peskow (1980),
and Lebedeva and Zavelskaya (1980), who found from
whole-sky camera photography in GATE a frequent
presence of several cloud layers, including cumulus clouds
with bases near 500 m and layer clouds with midtropo-
spheric bases near 4 km. Holle et al. (1979) determined
that the frequency of low clouds (including deep cumulus
and cumulonimbus as well as stratus and stratocumulus)
was maximal just south of 78–88N (thus about 500 km
south of Niamey). Following these earlier works, we de-
fine the following categories.
d The low-level cloud category includes clouds with a top
lower than 3 km and a base not higher than 500 m
above the lifting condensation level computed from the
meteorological surface measurements.d The midlevel cloud category has a base between 3 and
7 km. Duvel (1989), using geostationary satellite data,
noted the significant amount of this type of cloud but
mentioned that the nature and the origin of these
clouds are unclear.d The cirrus category for clouds has a base above 8 km.
Several authors [see Fueglistaler et al. (2009) for a re-
view] mention the existence of cirrus in the tropopause
transition layer [which may be optically quite thin and
even subvisible; Sassen and Cho (1992); Jensen et al.
(1996)]. Several explanations were invoked for their
origin: either convective (Hartmann et al. 2002; Dessler
and Yang 2003; Jensen et al. 1996), associated with
vertically propagating Kelvin and gravity waves
(Boehm and Verlinde 2000), or synoptic-scale ascent
along isentropic surfaces (Pfister et al. 2001; Jensen
et al. 1996).d The last category corresponds to deep clouds associated
with convective systems. They are first determined by
using the melting layer in the radar measurement. If
a cloud depth (larger than 5 km) above this melting
layer is found, the profile is classified as convective and
this property is propagated temporally before and after
in order to include anvil clouds. The classification of
nonprecipitating anvils within convective clouds may
not be obvious from a vertically pointing perspective
since the edge of a convective system may be classified
as cirrus. In such situations, the freezing level is never
identified. To avoid this issue, we use the results of
a tracking algorithm (Arnaud et al. 1992; Mathon and
Laurent 2001; Fiolleau et al. 2009). When a cloud is
classified as cirrus, it is sought whether the corre-
sponding location in the satellite image is associated
with a tracked cell. If this is the case, the sampled
cloud is reclassified in the convective category and this
property is propagated temporally before and after
the sampled profile.
The respective contributions of each cloud category to
the mean profile (black boldface line in Fig. 2a) are
shown in Fig. 2b, where the larger frequency of occur-
rence is attributable to cirrus clouds. At this point, the
instrumental limitations must be mentioned. As the
AMF instruments are sampling clouds from base to top,
the vertical extension of the convective profile may be
underestimated. Indeed, rain processes and water clouds
strongly attenuate the radar signal and may extinguish
completely the lidar signal before it reaches the cloud
top (Spinhirne 1993). If one of the instruments does not
present enough sensitivity to detect thin clouds, then the
profile of the frequency of occurrence will be under-
estimated as well. To quantify this bias, the use of satellite
data that sample from top to bottom (and in particular the
CALIPSO results) is valuable. A comparison of the cloud
frequency of occurrence profiles derived from AMF
measurements with the one derived from A-Train data is
proposed in Fig. 3.
The cloud frequencies of occurrence are shown for
August (Fig. 3a) and June–September (Fig. 3b). Two
years are displayed for the satellite data because, even
if 2006 is of major interest because it temporarily co-
incided with AMF measurements, this year corresponds
to the beginning of operation of the CloudSat radar and
CALIPSO lidar. Therefore, some gaps exist in the 2006
dataset. Conversely, the 2008 dataset is by far more
continuous. The presented A-Train profiles correspond
to extraction at the latitude of Niamey (they have been
computed using the strategy described in the introduction:
assuming that any track within the Fig. 1 domain is rep-
resentative of 08 longitude, binning the latitude in 0.18N
intervals and the altitude in 0.5-km intervals). Pre-
cipitation has been removed from the data, using the
precipitation flag of the 2B-CLDCLASS CloudSat prod-
uct. When the flag indicates precipitation, data are flagged
as precipitation from the bottom up to the melting level
(diagnose from the ECMWF-AUX CloudSat product)
and data from contiguous profiles are also classified as
precipitation as long as cloud is found above and below
the melting level. As may be seen in the bottom panel
in Fig. 3, about 50 profiles for 1 month (and 170 profiles
for 4 months) have been used to compute the satellite
occurrence profile, composed equally of daytime and
nighttime profiles.
First, both the AMF and 2006 A-Train products
(comparison of solid black and green lines) indicate
a similar vertical structure with three different peaks. The
differences in intensity between the AMF data (black
line) and the satellite data (green line) occurrence profiles
are linked to differences in the sampling between ground-
based (temporally integrated) and satellite (spatially in-
tegrated) data. Different sensitivity tests have been
538 J O U R N A L O F A P P L I E D M E T E O R O L O G Y A N D C L I M A T O L O G Y VOLUME 51

performed (not shown) in order to evaluate the impact of
the domain width or bin size (horizontal and vertical).
The main result from these tests is that the occurrence
profiles do not change significantly when reducing the
domain width. The main impact is to reduce the amount
of data used in the statistics computation, which leads to
noisier profiles. A larger impact is found for the size of the
horizontal bin, but the vertical structure of the profile
does not change. The comparison between the A-Train
profiles for the 2006 (green line) and 2008 (blue line)
datasets suggests that the interannual variability is rela-
tively small.
The respective amplitudes of the peak value of the
A-Train profile are useful for inferring a potential impact
from the lack of sensitivity of the ground-based radar and
lidar. First, the peak value for high-level clouds is higher
(about 14 km) in the satellite data compared to the
ground-based data (about 13 km). For both the ground-
based and satellite datasets, low- and midlevel peaks
present the same relative amplitudes (in Fig. 3b): about
0.1 (a slightly larger value is found for 2008) for the low-
level peak and about 0.2–0.3 for the midlevel peak. In
contrast the high-level peak has the same magnitude as
the midlevel peak for the ground-based profile but is 50%
larger for the CloudSat–CALIPSO profile. This result
indicates that a given amount of high-level clouds is un-
derestimated in the ground-based dataset either due to
attenuation–extinction by the underlying cloud layers or
FIG. 3. Cloud frequency of occurrence (solid line) computed from the A-Train CloudSat–
CALIPSO data for 2006 (green) and 2008 (blue) and from the AMF data (black) collected
during 2006 for (a) August and (b) June–September. The AMF profile has been subsampled at
the time of the A-Train passes (0130 and 1330 local time) at the Niamey latitude (red). Dashed
(dotted) lines are the profiles for nighttime (daytime) datasets. The bottom panel shows the
amount of satellite data included for computation of the satellite profiles for 2006 (green) and
2008 (blue) with solid, dotted, and dashed symbols for total, daytime, and nighttime datasets,
respectively.
MARCH 2012 B O U N I O L E T A L . 539

to a lack of instrumental sensitivity. The amount of high-
level clouds missed due to a potential lack of sensitivity of
the AMF instrumentation may be further estimated via
a classification of the A-Train data according to the four
previous categories. Indeed, by comparing the relative
amplitude of the ‘‘cirrus only (in the sampled column)’’
occurrence profiles versus the ‘‘cirrus and other clouds’’
occurrence profiles obtained with A-Train data, one
should be able to precisely identify the amount of the
cirrus only situation missed by the AMF data. Such a ca-
pability using the A-Train data remains to be developed,
and this constitutes a valuable perspective of the present
work. From a general point of view, the comparison
shown in Fig. 3 demonstrates that the methodology pro-
posed for using the CloudSat–CALIPSO data is suitable
for documenting the cloud cover evolution at the scale of
West Africa. The comparison of the ground-based profile
with the satellite profile shown in Fig. 3 allows us to
evaluate possible compensating effects in the satellite
mean profiles due to the temporal subsampling of the
cloud system over this region. To do so, the AMF profile
has been subsampled at the same times (approximately
0130 and 1330 local time) and the resulting mean profile
appears as a solid red curve in Fig. 3. This presents a
rather similar pattern of behavior, which suggests that
even if some compensating effects occur, the main fea-
tures are captured.
The AMF and A-Train datasets can also be separated
between day- and nighttime profiles (dashed–dotted lines
in Fig. 3) in order to infer possible diurnal fluctuations in
the cloud cover. These comparisons show that important
differences exist for low-level and high-level clouds with
more low-level clouds during daytime and more high-
level clouds during nighttime. The next section investi-
gates further the diurnal cycle and its seasonal evolution
by making use of high-frequency ground-based mea-
surements.
3. Seasonal evolution and diurnal cycle
The West African monsoon has a strong seasonal
cycle in both its surface and atmospheric large-scale
properties [see, e.g., Le Barbe et al. (2002) for rainfall].
The purpose of this section is to investigate the evolu-
tion of cloud frequency of occurrence associated with
the monsoon seasonal cycle. Major intense rainfalls
appear near the Gulf of Guinea starting in April (with
a quasi-stationary ITCZ located at 58N), move up to
108N during summer (with a fully developed monsoon
in August), and then retreat back to the south after
mid-September. This signals the seasonal march of the
ITCZ (Sultan and Janicot 2000; Le Barbe et al. 2002;
Redelsperger et al. 2002) between 108W and 58E where
a meridional land–sea contrast exists. The northward
migration is characterized by an abrupt shift in the
major rain zone referred to as monsoon onset. Sultan
and Janicot (2000) propose as a mean date for this shift
over the period 1968–90: 24 June with a standard de-
viation of 8.0 days. In 2006 (the year of interest for this
paper), the monsoon activity was less developed in June
but had a similar extension when compared with the cli-
matology in July. The monsoon onset was determined to
be around 10 July 2006 (Janicot et al. 2008).
a. Seasonal evolution of the cloud frequencyof occurrence
Figure 4 presents the monthly evolution of each cloud
category derived from the AMF data at the Niamey site.
The dotted black line corresponds to the frequency of
cloud occurrence of all clouds without distinction. As
expected, August (monsoon peak) is the cloudiest month,
with about 0.2 of cloud frequency of occurrence. The
frequency of occurrence of convective cloud (light blue)
is well correlated with the monsoon seasonal cycle with
a progressive increase of frequency beginning in June,
peaking in August, and decreasing in September. The
relatively high frequency of occurrence in May (0.1) is in
fact associated with three days of convective activity
(between the 19th and 21st of the month) in the Niamey
area but no other convective events occurred before the
beginning of June. Also well correlated with the monsoon
cycle is the frequency of occurrence of low-level clouds
(green), which begins in May but appears more distinc-
tively in July, grows in August, and decreases in September.
In contrast, the peak in frequency of occurrence of
midlevel clouds (blue line in Fig. 4) is observable for
each month without evident links with the monsoon cy-
cle. As stressed by Duvel (1989), the processes that gen-
erate such midlevel clouds are questionable. Johnson
et al. (1999) investigated the thermodynamical environ-
ment in which such midlevel clouds occur (they are
termed congestus in their paper). They showed that they
are often associated with a stable layer whose strength
appears sufficient to delay or limit cloud growth and to
promote detrainment near those levels. However here,
such clouds are already present in the preonset period
(April–May) when very few convective systems occurred.
This contrasts with the results of Johnson et al. (1999),
who relate these clouds to deep convective activity and
melting. Finally, cirrus clouds (red line) are present in all
months but with a distinct maximum in May. To compare
the macrophysical properties of cirrus clouds (red line in
Fig. 4) with nonprecipitating high clouds generated by
convective activity (anvils), the convective category has
been divided into two subcategories: anvils (dashed light-
blue line) and precipitating clouds (dotted light-blue
540 J O U R N A L O F A P P L I E D M E T E O R O L O G Y A N D C L I M A T O L O G Y VOLUME 51

line). The frequencies of occurrence of cirrus and anvils
present different shapes and amplitudes: the cirrus pro-
files always peak higher (about 13-km altitude) than the
anvils profiles (about 10 km) and they are always more
frequent. In addition, it has been demonstrated, using
satellite data, that this frequency is certainly under-
estimated.
As proposed in the previous section, one may try to
generalize the results obtained at the Niamey site to the
West Africa scale by using the satellite data. Figure 5
shows monthly latitude–altitude cross sections of cloud
frequency of occurrence between 58S and 458N derived
from A-Train data. The Niamey latitude is shown by the
vertical dotted line, and the two dashed lines roughly
correspond to the Guinea coast and the limit of the
Mediterranean Sea. Only the 2008 seasonal cycle is
shown here in order to be able to document the pre-
monsoon period (data in 2006 were only available after
15 June).
The monsoon jump is observable between June and
July with a northward shift of the cloud cover following
the motion of the ITCZ. The cloud categories identified
in section 2 in the AMF data are observable along these
cross sections. High-level clouds present the strongest
occurrence during the premonsoon period, and extend
from the Atlantic Ocean up to the Sahel where the
Niamey site is located. During this period, 58N corre-
sponds to the location where most convective events
occur. In June the ITCZ is still located in the area of the
Guinea Gulf but with a strong decrease in the occur-
rence of these high-level clouds, in particular over the
ocean, which suggests that these clouds do not only have
a purely convective origin. This decrease in high-level
cloud over the ocean (and south of the convective ac-
tivity zone) continues as the convective activity moves
northward. Midlevel clouds consistently extend across
West Africa, and notably over the Sahara between May
and September. Finally, low-level clouds appear to be
FIG. 4. Seasonal evolution of the cloud frequency of occurrence (April–September 2006) for each cloud
category (one color per category) derived from the AMF data.
MARCH 2012 B O U N I O L E T A L . 541

clearly tied to the monsoon cycle with a frequency that
becomes more substantial over the continent after the
monsoon jump. One may also note the strong occur-
rence of low-level clouds over the ocean (stratocumulus)
before and during the monsoon.
b. Seasonal evolution of the cloud frequency ofoccurrence diurnal cycle
In this section the diurnal cycle of each cloud category
is investigated as a function of the monsoon evolution
using a monthly time step and is presented in Fig. 6 (for
convection subdivided in precipitating in filled contours
and anvil in solid line contours) and Fig. 7 (for low-level
cloud in green, midlevel cloud in blue, and cirrus in red).
These figures show the cloud frequency of occurrence
from AMF data of a given cloud category as a function
of altitude and hour in daytime. It appears that all cloud
categories display a diurnal cycle evolving from month
to month.
Precipitating convection (Fig. 6) occurs almost ex-
clusively in the evening, after 1800 UTC in June at
Niamey, and anvils (open contours) are strongly tied to
this maximum of occurrence of precipitating clouds (i.e.,
they do not persist for long periods of time after the
precipitating convection occurred). This observation is
in agreement with a predominance of the small-sized
minimally propagating convective events, mostly driven
by the diurnal cycle of surface and boundary layer pro-
cesses; since over land daytime heating exerts the primary
control on the diurnal cycle of precipitating convection
(Johnson et al. 2010). Further, during the monsoon sea-
son (July–August) two peaks appear in the diurnal cycle:
one centered in the afternoon and the other in the
morning. This picture is consistent with the results of
Rickenbach et al. (2009). They show that the afternoon
peak may be associated, as in June, with locally gene-
rated convection. The earlier occurrence of this after-
noon peak as the season evolves is possibly due to a
moister boundary layer enabling an earlier triggering of
convective processes. On the other hand, the morning
peak is associated with propagating systems initiated
during the afternoon over the relief east of the Niamey
FIG. 5. Monthly latitude–altitude cross sections of cloud frequency of occurrence (shaded) computed
from the CloudSat radar and CALIPSO lidar data between 108E and 108W for the 2008 monsoon season.
Vertical dashed lines correspond to the mean positions of the Guinea Gulf (58N) and the Mediterranean
Sea (358N). Dotted line shows the latitude of Niamey (13.58N).
542 J O U R N A L O F A P P L I E D M E T E O R O L O G Y A N D C L I M A T O L O G Y VOLUME 51

region (Mathon et al. 2002; Diongue et al. 2002). Using
back trajectories, Rickenbach et al. (2009) determine that
they are generated the day before (between 1200 and
1800 UTC) in the Aır Mountains and the Jos Plateau.
Extended anvils follow these precipitating cloud systems.
In September it is mainly the morning peaks that remain
(associated with following extended anvils), suggesting
fewer occurrences of local generated convective systems.
This pattern of behavior is clearly shown in Fig. 4b of
Rickenbach et al. (2009).
The growth of the boundary layer linked to the day-
time increase of sensible heat flux is well observable on
the diurnal cycle of low-level clouds (green contours in
Fig. 7) and, as already mentioned in Fig. 4, is correlated
with the mature monsoon. The maximum of occurrence
is found in August with a diurnal cycle clearly identifi-
able since July. These clouds appear earlier in August in
agreement with a moister boundary layer at the Niamey
location, leading to a lower lifting condensation level
(corresponding approximately to the cloud base) and
deeper clouds. Once the monsoon begins to retreat
(southward motion of the monsoon flux in September),
a diurnal cycle somewhat similar to that observed in July
returns.
Midlevel clouds (blue contours in Fig. 7) present a max-
imum of occurrence in the early morning and then a day-
time decrease (except in August) until about 1900 UTC.
These clouds generally occurred around the top of the
Saharan air layer, which also corresponds to a maximum
in the relative humidity profiles. A visual inspection of
the AMF data suggests that these clouds may have been
generated through different processes (not shown). In
some occasions, they appear deeper (altocumulus type)
and may lead to evaporating precipitation, in contrast
to the congestus of Johnson et al. (1999), which may
lead to substantial precipitation. On other occasions,
they appear rather thin and horizontally extended, often
located at the top of the Saharan air layer. According
FIG. 6. Monthly diurnal cloud frequency of occurrence derived from AMF data for convective cloud
types subdivided in two subcategories: clouds that lead to precipitation (open contours; grayscale) and
clouds that do not lead to precipitation (anvils; solid lines, spaced every 0.05). May has not been included
because the cloud category for this month is only available for 3 days.
MARCH 2012 B O U N I O L E T A L . 543

to their altitudes, they are expected to be mixed-phase
clouds.
Finally, cirrus clouds (red contours in Fig. 7) occur all
day long at Niamey. A noticeable feature appears, on
the diurnal cycle of this cloud category, with a decrease
in cloud-top altitude around the middle of the day, while
the distribution of the frequency of occurrence at the
cloud base remains unchanged. The time location of this
decrease in cloud-top altitude evolves during the season
(from about 1200 UTC in April to 1500 UTC in August).
Between 9 and 12 km, the AMF lidar is generally nec-
essary to detect these relatively optically thin clouds.
FIG. 7. As in Fig. 6, but for nonconvective cloud categories: cirrus cloud (red contours), midlevel clouds
(blue contours), and boundary layer clouds (green contours), and one panel per month. A contour is
shown for every 0.05.
544 J O U R N A L O F A P P L I E D M E T E O R O L O G Y A N D C L I M A T O L O G Y VOLUME 51

However, during the day the lidar experiences a drop in
its sensitivity due to solar background noise (Spinhirne
1993) causing the undetectability of thin cirrus during
daylight hours. It is then questionable to determine if the
observation of this trough is in fact an observation of the
lidar sensitivity diurnal cycle. This diurnal cycle must
then be determined in independent datasets that are
insensitive to the diurnal cycle. Unfortunately, the cloud
radar sensitivity was not sufficient to characterize the
diurnal evolution of these thin cirrus (not shown).
Nevertheless, during the AMMA experiment the
radiosounding network has been substantially reinforced,
which provides an additional way to investigate this di-
urnal feature. In particular, at the Niamey location four
soundings per days were launched during the synoptic
hours. The AMMA radiosonde dataset has been cor-
rected to minimize any potential humidity bias. A con-
ditional sampling has been applied to this dataset in order
to sort it in three subsets: measurements in clear sky,
measurements in a single cloud category (cirrus in the
present case), and measurements in other cloud cate-
gories or multi-cloud-categories situations. The whole
troposphere is sampled within about 1.5 h by sondes,
which simultaneously drift horizontally with the wind.
It is then difficult to consider that the atmospheric
column sampled at the Niamey location by the ground-
based instrumentation is the same as that sampled by
the sondes. However, the cloud category of interest
(cirrus) generally presents a large horizontal extent and
slowly evolves (this point has been checked in geosta-
tionary imagery). The hypothesis that the sonde ther-
modynamical profiles, once sorted, are characteristic of
cirrus or clear-sky situations is then assumed.
Figure 8 shows the monthly mean diurnal cycle of
cloud frequency of occurrence from AMF data for the
cirrus category with the contoured relative humidity
anomaly from interpolated radiosondes (relative hu-
midity with respect to ice in cirrus situations minus rela-
tive humidity with respect to ice in clear-sky situations)
superimposed. A positive anomaly means that the cloudy
situations present higher relative humidity with respect to
the clear-sky situations. As expected, the larger values
of the anomalies are generally found in the cloud layer.
Close to cloud top, the relative humidity anomaly pres-
ents a diurnal cycle similar to cirrus, with a decrease in the
anomaly around the middle of the day. The minimum
cannot be located with accuracy since these contours result
from an interpolation of values obtained at the synoptic
times (0000, 0600, 1200, and 1800 UTC). Nevertheless, this
finding suggests that the observed diurnal cycle of the
cirrus category is not an instrumental effect (due to
a decrease in the sensitivity of the lidar measurements).
Liu and Zipser (2009) investigated the day versus night
differences in water vapor and thin cloud observations
near the tropical tropopause. They found that in the
16-km layer, clouds occur more frequently over Africa
during night than during day; however, they did not
separate the thin clouds observed in this layer as a func-
tion of their generation process. They found that the di-
urnal cycle of thin clouds, water vapor, deep convection,
and the temperature are correlated in this layer. In our
case we find a similar correlation, even if the thin anvil
clouds directly detrained from convection are classified in
the anvil category (in fact, Fig. 6 also shows the diurnal
drought at the top of the anvil layer). Therefore, it may be
argued that the observed diurnal cycle of cirrus clouds is
more the result of the local diurnal variation of temper-
ature in a saturated tropical tropopause layer. Inspection
of the diurnal cycle of cirrus in the MSG classification also
suggests such a diurnal cycle.
4. Radiative impact of cloud categories
Clouds strongly affect the radiation balance at the
earth’s surface by reducing the incident solar radiation,
absorbing thermal infrared (IR) radiation emitted by
the surface and the lower atmosphere, and emitting IR
back to the surface. The net effect of clouds on the surface
radiation balance depends significantly on cloud proper-
ties, surface properties, and solar elevation, as a function
of latitude and season (Zhang et al. 1996). Over land, the
incident solar radiation flux determines, in large part, the
surface temperature and the rate of evapotranspiration,
with important consequences on atmosphere–surface
interactions and the global hydrological cycle. Cloud
radiative forcing at the surface is defined as the dif-
ference between surface downward flux and clear-sky
surface downward flux (Ramanathan et al. 1989). In
this section the radiative forcing of the various cloud
categories on shortwave and longwave fluxes at the
surface is investigated.
a. Cloud radiative impact in the shortwave
The downwelling shortwave flux incoming at the sur-
face depends on the first order of the sinus of the solar
elevation angle and on scatter, absorption, and reflection
(albedo effect) by clouds. In clear-sky conditions, the
gaseous absorption (water vapor, ozone), Rayleigh scat-
tering, absorption, and scattering by aerosols impact the
atmosphere transmissivity. On the other hand, West
Africa is notably subject to large smoke and mineral
dust loads that can significantly modify the regional
radiative budget (Li et al. 2004; Mallet et al. 2009).
Indeed, the Sahara Desert acts as the strongest source
of mineral dust aerosol in the world. Dust particles
have a complex impact on the radiative transfer process
MARCH 2012 B O U N I O L E T A L . 545

because of their ability to interact both in shortwave
and longwave radiation.
To estimate the radiative forcing at the surface for
each cloud category, it is first necessary to estimate the
clear-sky shortwave downwelling flux. Two methods
have been designed in order to quantify the clear-sky
shortwave flux. Figure 9a illustrates both for a particular
day (15 august 2006). As a first step, the measured
shortwave flux is sorted according to the cloud (or clear
sky) category previously defined (situations where sev-
eral categories occur in the same column are not con-
sidered). This sorting is illustrated in Fig. 9a with for this
FIG. 8. Monthly diurnal cloud frequency of occurrence for the cirrus category from the AMF data (gray
levels) with relative humidity anomaly superimposed (contour spacing 10%) interpolated from 6-hourly
measurements, dashed for positive values and dotted for negative values, one panel per month. The zero
contour is shown by the solid boldface line.
546 J O U R N A L O F A P P L I E D M E T E O R O L O G Y A N D C L I M A T O L O G Y VOLUME 51

day two different cloud categories, cirrus and midlevel
clouds; the remaining part of the day is characterized by
clear sky. Around 1400 UTC midlevel clouds underlie
the cirrus clouds. The corresponding profiles are not
included in the analysis because the forcing of each
cloud category would not be identifiable and no crosses
appear in Fig. 9a at this time. The clear-sky points ex-
hibit the expected sine shape with the solar elevation
angle. However, the amplitude of this sine-shaped curve
must be corrected for the clear-sky atmosphere trans-
missivity (including aerosol effects).
The first method for estimating clear-sky downwelling
shortwave flux consists of simulating the shortwave flux
at the top of the atmosphere (green curve in Fig. 9a) and
then fitting it (dashed green curve) to the clear-sky
measurements. The fitting coefficient value (correspond-
ing to the transmissivity of the clear-sky atmosphere) is
expected to depend strongly on the aerosol load of the
particular day. As an example, the fitting coefficient is
0.6 for this day and an aerosol optical depth (AOD) of
about 1 is measured by the Aerosol Robotic Network
(AERONET) station located at Banizoumbou, Niger
(about 50 km from Niamey), which is a rather large value
for August. The main disadvantage of this method is that
the fitting coefficient is considered constant for the entire
day and that clear-sky measurements have to be present
each day. The cloud radiative forcing is then computed
only when the clear-sky flux has been determined. The
second method consists of making the assumption that
on a monthly scale one may build a composite of the
clear-sky incoming shortwave radiation by averaging
all the clear-sky measurements (at the time they were
taken) obtained for the particular month. Figure 9a
shows a composite for the month of August. It appears
that the clear-sky measurements from 15 August 2006
(black crosses) contribute to a decrease in the incoming
shortwave radiation for this month, likely because of
a significant aerosol load for this day. By taking the
difference with the same composites built for each
cloud category, one assumes that the contributions of
variations in the atmospheric state and aerosol load are
minimized.
Figure 9b illustrates the seasonal evolution of the
aerosol load in the Niamey area and the fitting co-
efficient’s monthly variability. The mean values of the
aerosol load and fitting coefficients may be separated
into two families: April–June, which present large aerosol
loads and a strong variability in the amount of aerosols
present in the atmosphere, and July–September, with
reduced load and variability. This reduced load may be
explained by the occurrence during this period of pre-
cipitating events, which moisten the surface and scavenge
the atmosphere, as well as the presence of vegetation at
the ground, which prevents the emission of dust. In re-
sponse to the larger variability during the premonsoon
period, a larger variability is found for the fitting co-
efficients in comparison with the full monsoon season. A
correlation coefficient can be computed between these
two parameters leading to values from about 20.8 to 20.9
for the dry period that become from about 20.6 to 20.3
FIG. 9. Illustration of the retrieval of the shortwave cloud radiative forcing. (a) Downwelling shortwave
flux at the surface on 15 Aug 2006, sorted according to the cloud category encountered in the atmospheric
column: clear sky (black), cirrus (red), and midlevel clouds (blue). Gray crosses show the monthly
composite of the clear-sky downwelling flux at the surface. The solid green line is the simulated incoming
shortwave at the top of the atmosphere and the dashed green line is the same curve but fitted to the clear-
sky measurements. (b) AOD as a function of the fitting coefficients (see text for explanation). For each
month (one color per month), the vertical bars link the minimum and maximum values of AOD and the
horizontal bars the minimum and maximum values of the fitting coefficient.
MARCH 2012 B O U N I O L E T A L . 547

for the wet season, showing that when strong aerosol
events occur they are at the first order controlling the
transmissivity of the clear-sky atmosphere.
Both methods have been applied to the present data-
set. In the following, results from the second approach are
mainly presented; however, the results from the first
method lead to the same conclusions. Figure 10a shows
the cloud radiative forcing in the shortwave radiation
obtained by differencing the monthly composite of a
given cloud category with the monthly composite in
clear-sky situations. Each symbol represents a monthly
mean value. It may be observed that all cloud categories
have an impact on the shortwave results. For midlevel
clouds a monthly decrease of incoming shortwave radia-
tion between 50 and 150 W m22 is found. The impact
increases (in absolute value) as the monsoon migrates
over the continent, suggesting a possible change in the
cloud nature or a potential source of such clouds by deep
convection, as suggested by Johnson et al. (1999). As
expected, low-level clouds have a strong impact —a de-
crease of between 50 and 150 W m22. Note that we pri-
marily consider here the wettest months (July–September),
when a significant number of such clouds exists (see Fig. 4).
This estimation is in good agreement with the cloud radi-
ative forcing computed by Berg et al. (2011) for shallow
cumuli sampled (245.5 W m22) during summertime
at the ARM’s Southern Great Plains (SGP) site. Note
that here and in the following, such comparisons are
provided as a rough guide; the sun elevation angle, the
atmospheric water vapor and temperature, and the
amount and type of aerosols all differ among studies
and these factors are also expected to modulate the
impact of clouds on the surface incoming radiative
fluxes.
Fairall et al. (2008) compute the cloud radiative forcing
as the difference between measurements of all-sky flux in
FIG. 10. Monthly mean (symbols) and standard deviation (vertical lines) of cloud radiative
forcing at the surface deduced from AMF observations (a) in the shortwave, (b) in the long-
wave, and (c) for the net radiative impact (computed from diurnal composites).
548 J O U R N A L O F A P P L I E D M E T E O R O L O G Y A N D C L I M A T O L O G Y VOLUME 51

the shortwave domain when shallow cumuli are present
and the clear-sky radiative flux by using parameteri-
zations tuned to accommodate regional and seasonal
variability. Berg et al. (2011) also mention that at the
same site Dong et al. (2006) estimated a forcing of
287.6 W m22, but they included all low-level cloud
with a top lower than 3 km. The method used by Dong
et al. (2006) to determine the clear-sky radiative flux is
slightly different since they temporally interpolated the
clear-sky measurements. The value found in this study
(and its variability) is in the same range as in those former
studies. Cirrus clouds (present ubiquitously all along
the period) reduce the incoming shortwave of about 30–
50 W m22 (with a relative small month-to-month spread).
Dupont and Haeffelin (2008) estimated the cloud radia-
tive effect of various cirrus cloud types [using the same
kind of methodology as Fairall et al. (2008)] and found an
average reduction of 56 W m22 at ground level for an
observatory site located in western Europe. Using satellite
data, Chen et al. (2000) found an average reduction of
shortwave radiation of 222 W m22. Finally, anvil clouds
present a strong impact, in particular for months of strong
occurrence (July–September) where the decrease varies
between 200 and up to 300 W m22. In radar–lidar ob-
servations, cirrus and nonprecipitating anvils may appear
rather similar; however, when the cloud radiative forcing
in the shortwave domain is considered, a radically differ-
ent signal appears. The separation of the cirrus and anvil
categories based on associated formation processes is
therefore also justified for radiative purposes. Indeed,
different microphysical properties are expected (large
amount of small ice particles of about 15 mm for cirrus
compared to larger ice particles in anvils) leading to
differences in the radiative properties since a connec-
tion exists between cloud albedo, cloud emissivity, and
ice water path (Stephens et al. 1990; Jensen et al. 1996).
The strong variability observed (even for a given cloud
category) in the cloud radiative forcing is not a surprise
since the present quantification does not take into ac-
count the detailed macrophysical properties of the cloud
and in particular the cloud depth.
b. Cloud radiative impact in the longwave
In contrast to shortwave radiation, the longwave in-
coming flux at the surface does not vary much diurnally;
however, the atmosphere transmissivity in the longwave
domain is sensitive to the atmospheric gases, aerosols,
and clouds. In particular, the abundance of moisture
in the atmosphere makes the atmosphere strongly ab-
sorptive to the longwave radiation. Generally, clouds
occur with saturation and therefore higher amounts of
water vapor may be expected in the cloud vicinity. If one
wants to properly estimate the cloud radiative forcing in
the longwave domain, it would be necessary to estimate
the incoming longwave flux in clear-sky situations on
a day scale, which requires some knowledge of the tem-
perature and water vapor fields. Within the framework of
the AMMA project, this diurnal documentation is only
poorly resolved with a maximum of four routine sound-
ings per day (this number may reach eight for short par-
ticular periods). Another possibility is to compute the
difference at the monthly scale between the incoming
longwave radiation for each cloud category and the clear-
sky composite as in the second method of the previous
section. If we expect that this averaging would reduce the
aerosol impact in the longwave domain, this may not
be the case for atmospheric gases or for temperature.
However, this method provides inferences on the cloud
radiative forcing in the longwave domain (Fig. 10b). Note
that for longwave radiation, it is only the monthly mean
value (one symbol for each category) that is shown.
The vertical dashed line represents the standard de-
viation of the difference in the diurnal composite. Square
symbols correspond to cirrus clouds, and, as may be ex-
pected from much earlier works (Manabe and Wetherald
1967; Cox 1971; Stephens and Webster 1981), they are
generally associated with a small positive anomaly in the
longwave domain that involves a heating of the tropo-
sphere owing to an increased emission to the surface by
the cirrus layer (Stephens and Webster 1981). Dupont
and Haeffelin (2008) estimated the cloud radiative effect
of cirrus clouds at surface level for a midlatitude site
(using a parameterization for the clear-sky fluxes and
measurements for cloudy situations) and found values
ranging from 26 up to 30 W m22 with a mean impact
near 5 W m22. The lower values (between 1 and 5 W m22)
obtained here could be partly related to competing
effects from aerosols and also the moister conditions
encountered during the summer in the Sahel. The mois-
ture effect may be more crucial to the radiative impact.
Indeed, as the monsoon evolves to its mature stage, the
integrated water path increases over the Sahel.
The enhancement of downwelling longwave flux in-
duced by the clouds is reduced by enhanced absorption
of the moister atmosphere below. This results in a down-
welling longwave forcing at the surface that is only slightly
larger than the clear-sky situation (e.g., Dong et al. 2006;
Slingo et al. 2009). The slightly negative longwave cloud
radiative forcing of anvils found in September may ap-
pear surprising though. Such a result cannot be inter-
preted solely in terms of cloud radiative forcing. Rather,
it likely involves coupled fluctuations of temperature,
water vapor, and clouds; in particular, the atmosphere
associated with the large Sahelian anvils occurring at
that time often displays strong cold anomalies. In addi-
tion, the longwave emission from the underlying wetted
MARCH 2012 B O U N I O L E T A L . 549
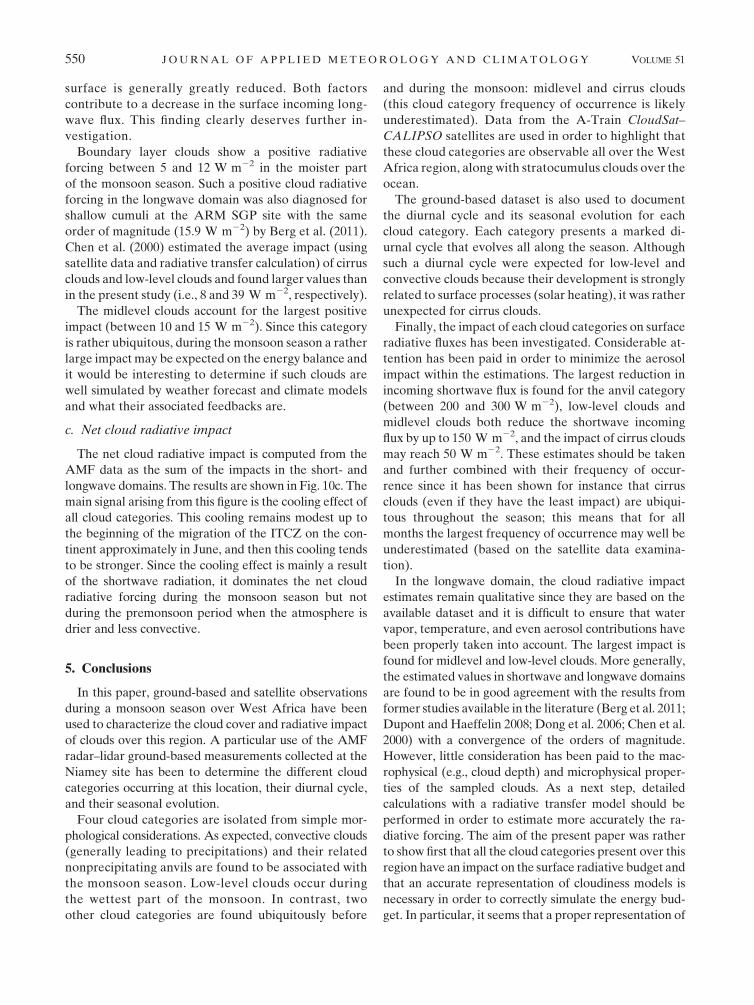
surface is generally greatly reduced. Both factors
contribute to a decrease in the surface incoming long-
wave flux. This finding clearly deserves further in-
vestigation.
Boundary layer clouds show a positive radiative
forcing between 5 and 12 W m22 in the moister part
of the monsoon season. Such a positive cloud radiative
forcing in the longwave domain was also diagnosed for
shallow cumuli at the ARM SGP site with the same
order of magnitude (15.9 W m22) by Berg et al. (2011).
Chen et al. (2000) estimated the average impact (using
satellite data and radiative transfer calculation) of cirrus
clouds and low-level clouds and found larger values than
in the present study (i.e., 8 and 39 W m22, respectively).
The midlevel clouds account for the largest positive
impact (between 10 and 15 W m22). Since this category
is rather ubiquitous, during the monsoon season a rather
large impact may be expected on the energy balance and
it would be interesting to determine if such clouds are
well simulated by weather forecast and climate models
and what their associated feedbacks are.
c. Net cloud radiative impact
The net cloud radiative impact is computed from the
AMF data as the sum of the impacts in the short- and
longwave domains. The results are shown in Fig. 10c. The
main signal arising from this figure is the cooling effect of
all cloud categories. This cooling remains modest up to
the beginning of the migration of the ITCZ on the con-
tinent approximately in June, and then this cooling tends
to be stronger. Since the cooling effect is mainly a result
of the shortwave radiation, it dominates the net cloud
radiative forcing during the monsoon season but not
during the premonsoon period when the atmosphere is
drier and less convective.
5. Conclusions
In this paper, ground-based and satellite observations
during a monsoon season over West Africa have been
used to characterize the cloud cover and radiative impact
of clouds over this region. A particular use of the AMF
radar–lidar ground-based measurements collected at the
Niamey site has been to determine the different cloud
categories occurring at this location, their diurnal cycle,
and their seasonal evolution.
Four cloud categories are isolated from simple mor-
phological considerations. As expected, convective clouds
(generally leading to precipitations) and their related
nonprecipitating anvils are found to be associated with
the monsoon season. Low-level clouds occur during
the wettest part of the monsoon. In contrast, two
other cloud categories are found ubiquitously before
and during the monsoon: midlevel and cirrus clouds
(this cloud category frequency of occurrence is likely
underestimated). Data from the A-Train CloudSat–
CALIPSO satellites are used in order to highlight that
these cloud categories are observable all over the West
Africa region, along with stratocumulus clouds over the
ocean.
The ground-based dataset is also used to document
the diurnal cycle and its seasonal evolution for each
cloud category. Each category presents a marked di-
urnal cycle that evolves all along the season. Although
such a diurnal cycle were expected for low-level and
convective clouds because their development is strongly
related to surface processes (solar heating), it was rather
unexpected for cirrus clouds.
Finally, the impact of each cloud categories on surface
radiative fluxes has been investigated. Considerable at-
tention has been paid in order to minimize the aerosol
impact within the estimations. The largest reduction in
incoming shortwave flux is found for the anvil category
(between 200 and 300 W m22), low-level clouds and
midlevel clouds both reduce the shortwave incoming
flux by up to 150 W m22, and the impact of cirrus clouds
may reach 50 W m22. These estimates should be taken
and further combined with their frequency of occur-
rence since it has been shown for instance that cirrus
clouds (even if they have the least impact) are ubiqui-
tous throughout the season; this means that for all
months the largest frequency of occurrence may well be
underestimated (based on the satellite data examina-
tion).
In the longwave domain, the cloud radiative impact
estimates remain qualitative since they are based on the
available dataset and it is difficult to ensure that water
vapor, temperature, and even aerosol contributions have
been properly taken into account. The largest impact is
found for midlevel and low-level clouds. More generally,
the estimated values in shortwave and longwave domains
are found to be in good agreement with the results from
former studies available in the literature (Berg et al. 2011;
Dupont and Haeffelin 2008; Dong et al. 2006; Chen et al.
2000) with a convergence of the orders of magnitude.
However, little consideration has been paid to the mac-
rophysical (e.g., cloud depth) and microphysical proper-
ties of the sampled clouds. As a next step, detailed
calculations with a radiative transfer model should be
performed in order to estimate more accurately the ra-
diative forcing. The aim of the present paper was rather
to show first that all the cloud categories present over this
region have an impact on the surface radiative budget and
that an accurate representation of cloudiness models is
necessary in order to correctly simulate the energy bud-
get. In particular, it seems that a proper representation of
550 J O U R N A L O F A P P L I E D M E T E O R O L O G Y A N D C L I M A T O L O G Y VOLUME 51

midlevel clouds is critical because of their strong occur-
rence at regional scales, particularly over the Sahel and
Sahara. From a physical-processes point of view or per-
spective, it would be particularly valuable to better un-
derstand and document the origins of these midlevel
clouds. The ensemble of mechanisms behind their exis-
tence likely differs from those highlighted by Johnson
et al. (1999) over the Pacific warm pool for congestus
clouds. However, our study highlights the significance of
this intermediate category of clouds across West Africa.
More generally, the present work contains an un-
precedented documentation of cloud characteristics in
a region where very little was known about clouds be-
fore 2006. Our research provides new diagnostics that
can be further used to investigate whether numerical
weather prediction and general circulation models are
able to represent the observed characteristics, starting
with their diurnal and seasonal patterns of evolution.
Finally, the present work, and in particular the spatial
extension of the cloud radiative forcing quantification,
are under investigation using the A-Train dataset and
the present category sorting together with additional
AMMA in situ datasets available along the meridional
West African transect.
Acknowledgments. Based on a French initiative, AMMA
was built by an international scientific group and is
currently funded by a large number of agencies, espe-
cially from France, the United Kingdom, the United
States, and Africa, and by an EU program. Detailed
information on scientific coordination and funding is
available on the AMMA International Internet site (http://
www.amma-international.org). The Niamey AMF data
were obtained from the Atmospheric Radiation Mea-
surement (ARM) Program Archive of the Department
of Energy. CloudSat data are obtained from CIRA of
Colorado State University. ICARE and NASA gave
access to the CALIOP data. This work was financially
supported by CNES.
REFERENCES
Arnaud, Y., M. Desbois, and J. Maizi, 1992: Automatic tracking
and characterization of African convective systems on Me-
teosat pictures. J. Appl. Meteor., 31, 443–453.
Berg, L. K., E. I. Kassianov, C. N. Long, and D. L. Mills Jr., 2011:
Surface summertime radiative forcing by shallow cumuli at the
Atmospheric Radiation Measurement Southern Great Plains
site. J. Geophys. Res., 116, D01202, doi:10.1029/2010JD014593.
Betts, A. K., 2007: Coupling of water vapor convergence, clouds,
precipitation, and land surface processes. J. Geophys. Res.,
112, D10108, doi:10.1029/2006JD008191.
——, and P. Viterbo, 2005: Land-surface, boundary layer, and
cloud-field coupling over the southwestern Amazon in ERA-
40. J. Geophys. Res., 110, D14108, doi:10.1029/2004JD005702.
Boehm, M. T., and J. Verlinde, 2000: Stratospheric influence on
upper tropospheric tropical cirrus. Geophys. Res. Lett., 27,
3209–3212.
Borovikov, A. M., and I. P. Mazin, and A. N. Nevzorov, 1978: Cloud
structure peculiarities in the eastern zone of tropical Atlantic.
Proc. Int. Scientific Conf. on the Energetics of the Tropical At-
mosphere, Geneva, Switzerland, International Council of Sci-
entific Unions/World Meteorological Society, 43–47.
Bouniol, D., and Coauthors, 2010: Using continuous ground-based
radar and lidar measurements for evaluation of the repre-
sentation of clouds in four operational models. J. Appl. Me-
teor. Climatol., 49, 1971–1991.
Cess, R. D., and Coauthors 1996: Cloud feedback in atmospheric
general circulation models: An update. J. Geophys. Res., 101
(D8), 12 791–12 794.
Chen, T., W. B. Rossow, and Y. Zhang, 2000: Radiative effects of
cloud-type variations. J. Climate, 13, 264–286.
Comstock, J. M., T. P. Ackerman, and G. G. Mace, 2002: Ground-
based lidar and radar remote sensing of tropical cirrus clouds at
Nauru Island: Cloud statistics and radiative impact. J. Geophys.
Res., 107, 4714, doi:10.1029/2002JD002203.
Cox, S. K., 1971: Cirrus clouds and climate. J. Atmos. Sci., 28, 1513–
1515.
Dessler, A. E., and P. Yang, 2003: The distribution of tropical thin
cirrus clouds inferred from Terra MODIS data. J. Climate, 16,
1241–1247.
Diongue, A., J.-P. Lafore, J.-L. Redelsperger, and R. Roca, 2002:
Numerical study of Sahelian synoptic weather system: Initia-
tion and mature stages of convection and its interactions with
the large-scale dynamics. Quart. J. Roy. Meteor. Soc., 128,
1899–1927, doi:10.1256/003590002320603467.
Dong, X., B. Xi, and P. Minnis, 2006: A climatology of midlatitude
continental clouds from the ARM SGP Central Facility. Part
II: Cloud fraction and surface radiative forcing. J. Climate, 19,
1765–1783.
Dufresne, J.-L., and S. Bony, 2008: An assessment of the primary
sources of spread of global warming estimates from coupled
atmosphere–ocean models. J. Climate, 21, 5135–5144.
Dupont, J.-C., and M. Haeffelin, 2008: Observed instantaneous
cirrus radiative effect on surface-level shortwave and long-
wave irradiances. J. Geophys. Res., 113, D21202, doi:10.1029/
2008JD009838.
Duvel, J. P., 1989: Convection over tropical Africa and the Atlantic
Ocean during northern summer. Part I: Interannual and di-
urnal variations. Mon. Wea. Rev., 117, 2782–2799.
Fairall, C. W., T. Utall, D. Hazen, J. Haire, M. F. Cronin, N. Bond,
and D. E. Veron, 2008: Observations of cloud, radiation, and
surface forcing in the equatorial eastern Pacific. J. Climate, 21,
655–673.
Fiolleau, T., M. Tomasini, R. Roca, J.-P. Lafore, H. Laurent,
T. Lebel, and K. Ramage, 2009: Summertime climatology of
mesoscale convective systems over West Africa from 24-years
of METEOSAT observations. Geophysical Research Abstracts,
Vol. 11, Abstract ECU2009-9104.
Fueglistaler, S., A. E. Dessler, T. J. Dunkerton, I. Folkins, Q. Fu,
P. W. Mote, 2009: Tropical tropopause layer. Rev. Geo-
phys., 47, RG1004, doi:10.1029/2008RG000267.
Gamache, J. F., and R. A. Houze Jr., 1983: Water budget of a me-
soscale convective system in the tropics. J. Atmos. Sci., 40,
1835–1850.
Garratt, J. R., 1993: Sensitivity of climate simulations to land-surface
and atmospheric boundary-layer treatments—A review. J. Cli-
mate, 6, 419–448.
MARCH 2012 B O U N I O L E T A L . 551

Hartmann, D. L., J. R. Holton, and Q. Fu, 2002: The heat balance of
the tropical tropopause, cirrus, and stratospheric dehydration.
Geophys. Res. Lett., 28, 1969–1972.
Hayward, D., and J. Oguntoyinbo, 1987: Climatology of West Africa.
Hutchinson Education, 271 pp.
Hogan, R. J., and E. J. O’Connor, cited 2010: Instrument synergy/
target categorization. [Available online at http://www.cloud-
net.org/data/products/categorize.html.]
——, C. Jakob, and A. J. I. Illingworth, 2001: Comparison of
ECMWF winter-season cloud fraction with radar-derived
values. J. Appl. Meteor., 40, 513–525.
Holle, R. L., J. Simpson, and S. W. Leavitt, 1979: GATE B-scale
cloudiness from whole-sky cameras on four U.S. ships. Mon.
Wea. Rev., 107, 874–895.
Hourdin, F., and Coauthors, 2009: AMMA-Model Intercomparison
Project. Bull. Amer. Meteor. Soc., 91, 95–104.
Houze, R. A., Jr., 2004: Mesoscale convective systems. Rev. Geo-
phys., 42, RG4003, doi:10.1029/2004RG000150.
——, and A. K. Betts, 1981: Convection in GATE. Rev. Geophys.,
19, 541–576.
Illingworth, A. J., and Coauthors, 2007: Cloudnet: Continuous evalu-
ation of cloud profiles in seven operational models using ground-
based observations. Bull. Amer. Meteor. Soc., 88, 883–898.
Janicot, S., and Coauthors, 2008: Large-scale overview of the
summer monsoon over West Africa during the AMMA field
experiment in 2006. Ann. Geophys., 26, 2569–2595, doi:10.5194/
angeo-26-2569-2008.
Jensen, E. J., O. B. Toon, H. B. Selkirk, J. D. Spinhirne, and M. R.
Schoeberl, 1996: On the formation and persistence of sub-
visible cirrus clouds near the tropical tropopause. J. Geophys.
Res., 101, 21 361–21 375.
Johnson, R. H., T. M. Rickenbach, S. A. Rutledge, P. E. Ciesielski,
and W. H. Schubert, 1999: Trimodal characteristics of tropical
convection. J. Climate, 12, 2397–2418.
——, P. E. Ciesielski, T. S. L’Ecuyer, and A. Newman, 2010: Di-
urnal cycle of convection during the 2004 North American
Monsoon Experiment. J. Climate, 23, 1060–1078.
Kollias, P., M. A. Miller, K. L. Johnson, M. P. Jensen, and
D. Troyan, 2009: Cloud thermodynamic, and precipitation
observations in West Africa during 2006. J. Geophys. Res.,
114, D00E08, doi:10.1029/2008JD010641.
Leary, C. A., and R. A. Houze Jr., 1979: Melting and evaporation of
hydrometeors in precipitation from the anvil clouds of deep
tropical convection. J. Atmos. Sci., 36, 669–679.
Le Barbe, L., T. Lebel, and D. Tapsoba, 2002: Rainfall variability in
West Africa during the years 1950–90. J. Climate, 15, 187–202.
Lebedeva, N. V., and N. A. Zavelskaya, 1980: Convection in the
tropical ocean. Conference on Scientific Results of GATE,
Kiev, USSR, Int. Council of Scientific Unions/World Meteo-
rological Organization.
Lebel, T., and Coauthors, 2010: The AMMA field campaign:
Multiscale and multidisciplinary observations in the West
African region. Quart. J. Roy. Meteor. Soc., 136 (S1), 8–33,
doi:10.1002/qj.486.
Li, F., A. M. Vogelmann, and V. Ramanathan, 2004: Saharan dust
aerosol radiative forcing measured from space. J. Climate, 17,
2558–2571.
Liu, C., and E. Zipser, 2009: Implications of the day versus night
differences of water vapor, carbon monoxide, and thin cloud
observations near the tropical tropopause. J. Geophys. Res.,
114, D09303, doi:10.1029/2008JD011524.
Mallet, M., P. Tulet, D. Sercxa, F. Solmon, G. Dubovik, J. Pelon,
V. Pont, and O. Thouron, 2009: Impact of dust aerosols on the
radiative budget, surface heat fluxes, heating rate profiles and
convective activity over West Africa during March 2006. At-
mos. Chem. Phys., 9, 7143–7160.
Manabe, S., and R. T. Wetherald, 1967: Thermal equilibrium of the
atmosphere with a given distribution of relative humidity.
J. Atmos. Sci., 24, 241–259.
Mather, J. H., and S. A. Mc Farlane, 2009: Cloud classes and ra-
diative heating profiles at the Manus and Nauru Atmospheric
Radiation Measurement (ARM) site. J. Geophys. Res., 114,
D19204, doi:10.1029/2009JD011703.
Mathon, V., and H. Laurent, 2001: The life cycle of Sahelian me-
soscale convective cloud systems. Quart. J. Roy. Meteor. Soc.,
127, 377–406.
——, ——, and T. Lebel, 2002: Mesoscale convective system
rainfall in the Sahel. J. Appl. Meteor., 41, 1081–1092.
Miller, M. A., A. Slingo, 2007: The ARM Mobile Facility and its
first international deployment: Measuring flux divergence in
West Africa. Bull. Amer. Meteor., Soc., 88, 1229–1244.
Peskow, B. E., 1980: Clouds and convection. Conf. on Scientific
Results of GATE, Kiev, USSR, Int. Council of Scientific
Unions/World Meteorological Organization.
Pfister, L., and Coauthors, 2001: Aircraft observations of thin cirrus
clouds near the tropical tropopause. J. Geophys. Res., 106
(D9), 9765–9786.
Protat, A., J. Delanoe, A. Plana-Fattori, P. May, and E. O’Connor,
2010: The statistical properties of tropical ice clouds generated
by the West African and Australian monsoons from ground-
based radar-lidar observations. Quart. J. Roy. Meteor. Soc.,
136, 345–363, doi:10.1002/qj.490.
Ramanathan, V., R. Cess, E. Harisson, P. Minnis, B. Barkstrom,
A. Ahmad, D. Hartmann, 1989: Cloud-radiative forcing and
climate: Results from the Earth Radiation Budget Experi-
ment. Science, 243, 57–63.
Redelsperger, J.-L., A. Diongue, A. Diehdou, J.-P. Ceron,
M. Diop, J.-F. Gueremy, and J.-P. Lafore, 2002: Multi-scale
description of a Sahelian synoptic weather system represen-
tative of the West African monsoon. Quart. J. Roy. Meteor.
Soc., 128, 1229–1257.
——, and Coauthors, 2006: AMMA, un projet international et
multidisciplinaire de la mousson ouest-africaine. La Meteor-
ologie, 54, 22–32.
Rickenbach, T., R. Nieto Ferreira, N. Guy, and E. Williams, 2009:
Radar-observed squall line propagation and the diurnal cycle
of convection in Niamey, Niger, during the 2006 African
Monsoon and Multidisciplinary Analysis Intensive Ob-
serving Period. J. Geophys. Res., 114, D03107, doi:10.1029/
2008JD010871.
Sassen, K., and B. S. Cho, 1992: Subvisual-thin cirrus clouds lidar
data set for satellite verification and climatological research.
J. Appl. Meteor., 31, 1275–1285.
Simpson, J., 1976: The GATE aircraft program: A personal view.
Bull. Amer. Meteor. Soc., 57, 27–30.
Slingo, A., H. E. White, N. A. Bharmal, and G. J. Robinson, 2009:
Overview of observations from the RADAGAST experiment in
Niamey, Niger: 2. Radiative fluxes and divergences. J. Geophys.
Res., 114, D00E04, doi:10.1029/2008JD010497.
Slingo, J., 1980: A cloud parameterization scheme derived from
GATE data for use with a numerical model. Quart. J. Roy.
Meteor. Soc., 106, 747–770.
Spinhirne, J. D., 1993: Micro pulse lidar. IEEE Trans. Geosci.
Remote Sens., 31, 48–55.
Stephens, G. L., and P. J. Webster, 1981: Clouds and climate:
Sensitivity of simple systems. J. Atmos. Sci., 38, 235–247.
552 J O U R N A L O F A P P L I E D M E T E O R O L O G Y A N D C L I M A T O L O G Y VOLUME 51

——, S.-C. Tsay, P. W. Stackhouse Jr., and P. J. Flatau, 1990: The
relevance of the microphysical and radiative properties of
cirrus clouds to climate and climatic feedback. J. Atmos. Sci.,
47, 1742–1753.
——, and Coauthors, 2002: The CloudSat mission and the
A-Train: A new dimension of space-based observations of
clouds and precipitation. Bull. Amer. Meteor. Soc., 83, 1771–
1790.
Stokes, G. M., and S. E. Schwartz, 1994: The Atmospheric Radi-
ation Measurement (ARM) Program: Programmatic back-
ground and design of the cloud and radiation test bed. Bull.
Amer. Meteor. Soc., 75, 1201–1221.
Sultan, B., and S. Janicot, 2003: The West African monsoon dy-
namics. Part II: The ‘‘preonset’’ and the ‘‘onset’’ of the sum-
mer monsoon. J. Climate, 16, 3407–3427.
——, and ——, 2000: Abrupt shift of the ITCZ over West Africa
and intra-seasonal variability. Geophys. Res. Lett., 27, 3353–3356.
Winker, D., W. Hunt, M. McGill, 2007: Initial performance assess-
ment of CALIOP. Geophys. Res. Lett., 34, L19803, doi:10.1029/
2007GL030135.
Xi, B., X. Dong, P. Minnis, and M. M. Khaiyer, 2010: A 10-year
climatology of cloud cover and vertical distribution derived
from both surface and GOES observations over the DOE
ARM SGP site. J. Geophys. Res., 115, D12124, doi:10.1029/
2009JD012800.
Zhang, T., K. Stammes, and S. A. Bowling, 1996: Impact of clouds
on surface radiative fluxes and snowmelt in the Arctic and
subarctic. J. Climate, 9, 2110–2123.
Zheng, X., and E. A. B. Eltahir, 1998: The role of vegetation in the
dynamics of West African monsoons. J. Climate, 11, 2078–2096.
MARCH 2012 B O U N I O L E T A L . 553