Distributed Solar interconnection Challenges and best ...
12
1220 19TH STREET, NW, SUITE 800 WASHINGTON, DC 20036-2405 SOLARELECTRICPOWER.ORG OCTOBER 2014 Distributed Solar Interconnection Challenges and Best Practices MIRIAM MAKHYOUN RESEARCH MANAGER BECKY CAMPBELL SENIOR RESEARCH MANAGER MIKE TAYLOR DIRECTOR OF RESEARCH
Transcript of Distributed Solar interconnection Challenges and best ...

1220 19th Street, NW, Suite 800 WaShiNgtoN, DC 20036-2405 SolareleCtriCpoWer.org
oCtober 2014
Distributed Solar interconnection Challenges and best practices
MiriaM MakhyouN reSearCh MaNager
beCky CaMpbell SeNior reSearCh MaNager
Mike taylor DireCtor of reSearCh

solar electric power association
DistributeD solar interconnection challenges anD best Practices
executive summary .............................................................................................................................. 1
1| current interconnection lanDscaPe
How Many Systems Are Interconnected Annually per Utility? ................................................................. 2
How Long Does It Take for Utilities to Process Interconnection Applications? ...................................... 3
2| aPProaches to interconnection Proces sing
How Are Applications Processed? ................................................................................................................ 4
What Is the Role of Incentives in Gathering Information? ........................................................................ 5
3|DistributeD interconnection challenges
What Are Utility Customers Saying? ............................................................................................................ 6
What Are the Biggest Interconnection Challenges for Utilities? .............................................................. 7
4|conclusion ............................................................................................................................................. 8
backgrounD & sources ...................................................................................................................... 9
This research was conducted as part of a U.S. Department of Energy SunShot Incubator Award in partnership with Clean Power Research.
contents

DistributeD solar interconnection challenges anD best Practices
11
the continued growth of the distributed solar market in the United States has spurred electric
utilities, regulators and stakeholders to consider improvements to distributed generation (DG) interconnection processes.1
More than 475,000 solar energy systems were interconnected in the U.S. by the end of 2013 but 1 million are expected by the end of 2017.2
Based on the current trajectory set forth under the purview of the U.S. Department of Energy SunShot Initiative, permitting, inspection and interconnection (PII) soft costs are expected to drop from a current cost of $0.17/watt to $0.14/watt by 2020.3
While the actual cost metrics for utility PII are undetermined, they are real. A survey and interviews conducted by Solar Electric Power Association (SEPA) in 2014 have uncovered utility initiatives to lower the administrative costs of DG interconnection, making the process of connecting to the grid simpler and more transparent for customers.
key takeaways q
1. the market is highly concentrated, with 75 percent of distributed solar power interconnections processed by fewer than 5 percent of utilities.
2. about 15 percent of utilities have optimized processing high numbers of interconnections in short periods of time, so there is opportunity for utilities to improve interconnection processes and reduce soft costs for both utilities and the solar industry.
3. utilities are facing common challenges as they move towards more streamlined interconnection application processing, including: keeping customers up-to-date on the status of their application (status transparency); ensuring application accuracy and completeness; communicating with customers; and reporting.
4. only 17 percent of utilities are able to process applications online, but many utilities indicated they are planning to move to an online platform.
5. Utilities offering an online application platform are able to process applications twice as quickly as utilities only accepting emailed, mailed or in-person applications.5
executive summary
DistributeD solar interconnection challenges anD best Practices

solar electric power association
22
How many solar interconnection applications did utilities process in 2013?
<10074.7%
1,500-1,999100-49911.8%
1,000-1,4991.7%
500-9995.9%
>2,0004.6%1.3%
number of solar interconnection aPPlications utilities ProcesseD in 2013 q
� Utilities receiving 500 interconnection applications per year see an equivalent of two applications per business day, compared to utilities receiving 10,000 applications per year that see an equivalent of 40 applications per work day.
� In a prior survey, residential installations accounted for 93 percent of interconnections in 2013, making them likely candidates for fast-track interconnection processing where it exists.
� One utility noted that as the number of interconnected customers has increased, processes have become more streamlined, including the use of smart meters (for remote meter programming) and online application procedures. In spite of this modernization, it found that interconnected customers often still require direct one-on-one communication to complete the process, which adds up as the number of interconnections increase.
� With 75 percent of distributed solar power interconnections processed by fewer than 5 percent of utilities, soft cost reductions resulting from improved interconnection processes for these
larger programs can have a significant impact on the solar industry.
� Today more than 86 percent of utliities are processing fewer than 500 solar interconnection applications, but with the rapid growth of solar, these utilities may consider preparing for growing volumes of applications, and determine how to effectively integrate higher levels of distributed solar generation in the near future.
OF INTERCONNECTIONSWERE PROCESSED BY
78%
<5%OF UTILITIES
1| current interconnection lanDscaPe
how many systems are interconnecteD annually Per utility?
Utility departments participating in the interconnection process in order of most to least commonly involved:
interconnection touch Points
1. Metering department
2. Distribution engineering
3. Field inspection
4. Interconnection administration
5. Incentive administration
6. Grid planning
7. Legal

DistributeD solar interconnection challenges anD best Practices
33
How long, on average, utilities take to complete a residential interconnection—from application to approval.
<2 WEEKS28.3%
4-8 WEEKS23.3%
2-4 WEEKS26.7%
NOT TRACKING10.0%
8+ WEEKS11.7%
how long, on average, utilities take to comPlete a resiDential interconnection—from aPPlication to aPProval q
� It takes an average of about four weeks from submittal of an interconnection application to utility approval in 2014. This is the same amount of time it took in 2008. The average drops to less than two weeks for utilities using an online platform.
� For utilities receiving fewer than 500 applications, 41 percent of them process applications within two weeks, whereas only 15 percent of utilities with more than 500 applications average a two-week turnaround from request to approval to interconnect.
1. Customer submits interconnection application.
2. Utility reviews application and determines eligibility for net energy metering (NEM) or other programs. Depending on system size and location, and interconnection requirements, studies may be required prior to proceeding.
3. After distributed solar system is installed, customer submits as-built information to utility.
4. Interconnection agreement is executed between the utility and distributed solar customer.
5. Customer sends the utility a building and/or electrical permit.
6. If required, utility inspects installed system.
7. Distributed solar customer receives interconnection approval from the utility.
tyPical stePs in the DistributeD solar interconnection aPProval Process
how long Does it take for utilities to Process interconnection aPPlications?
1| current interconnection lanDscaPe

solar electric power association
44
0 20 40 60 80 100
LESS THAN2 WEEKS
2 TO 4 WEEKS
MORE THAN4 WEEKS
MANUAL
ONLINE
* This infographic is based on data from utilities interconnecting at least 500 DG solar energy systems per year.
aPPlication Process useD q
� When looking at a sample of utilities that process applications online, 50 percent interconnect their customers in less than two weeks, compared with the utility average of 28 percent for that same time frame.
� One utility reported that an online application process resulted in fewer customer inquiries, an ability to handle a higher volume of applications, better integration with internal departments, better overall customer service, and better records management compared with its legacy application system (NV Energy).
Incorporating an online application process may help utilities alleviate some of the biggest challenges in the interconnection process. Online tools can:
� Restrict submissions to fully completed applications—prompting applicants when information is missing.
� Capture data once, and auto-fill forms, documents and other information to eliminate errors.
� Give customers online access to track the status of their application.
� Automate communications so that program administrators can easily keep customers informed.
� Store data in secure databases and make it accessible for analysis, reporting and operational integration.
benefits of an online aPPlication Process
UTILITIES' APPLICATION
PROCESSES(ONLINE VS. MANUAL).
ONLINE MANUAL
17%
83%
Time Manual OnlineLess than 2 weeks 12% 50%2 to 4 weeks 41% 25%More than 4 weeks 47% 25%
OF ONLINE APPLICATIONSARE COMPLETED IN
50%
<2weeks
how long it takes utilities to Process an interconnection aPPlication (online vs manual) q
2| aPProaches to interconnection Processing
how are aPPlications ProcesseD?

DistributeD solar interconnection challenges anD best Practices
55
Percentage of utilities collecting detailed systeminformation by whether Incentives are offered.
Time Manual OnlineLess than 2 weeks 12% 50%2 to 4 weeks 41% 25%More than 4 weeks 47% 25%
NO INCENTIVES
72%
INCENTIVES
81%
UTILITIES OFFERINGSOLAR INCENTIVES ARE
TO COLLECT DETAILEDSYSTEM INFORMATION
9%MORELIKELY
Percentage of utilities collecting DetaileD system information by whether incentives are offereD q
� Respondents were asked what kinds of information they collect for non-incentivized systems through interconnection applications. PV system installation details may vary between interconnection and incentive applications, unless the two are combined into one document (see example to the right).
� Decline of incentive programs is leading to loss of detailed installed DG information that is important internally to the utility as well as well as the solar market overall.
� As state or utility incentive programs are phased out utilities may consider the value of detailed PV system information, and potentially increase the amount of information collected on interconnection applications.
� PV system information needs to be accessible for a variety of uses (market intelligence, operations)—typically that means putting it into an accessible database.
Rank in SuRveyincentive (example)
inteRconnection (example)
1. INvERTER MANUFACTURER AND MODEL
n n
2. MODULE MANUFACTURER AND MODEL
n n
3. Pv MODULE NAMEPLATE RATING n ToTal sysTem only
4. INvERTER qUANTITy n
5. INvERTER NAMEPLATE RATING n
6. Pv MODULE qUANTITy n n
7. ESTIMATED ANNUAL PRODUCTION (kWh) n
8. SySTEM COST
9. ORIENTATION (LOCATION, TILT, AzIMUTH)
n
10. SySTEM SHADING
most common information being collecteD by utilities
what is the role of incentives in gathering information?
2| aPProaches to interconnection Processing

solar electric power association
66
What customers like about the interconnection process.
2Good
Comunication
3Fast
Process
4Easy to
UnderstandGuidelines
1Simple
ApplicationProcess
what customers want in the interconnection Process q
� Utilities noted that a lack of application status transparency is the biggest gripe that customers have with the interconnection process.
� Public Service Electric & Gas Company is addressing this by developing an online portal for customers to check status in real-time.
� NV Energy is using PowerClerk Interconnect, which it said is increasing transparency.
� Many utilities pointed out that the interconnection processing timeline is perceived by their customers as taking too long.
MOST NEEDED IMPROVEMENT:
APPLICATION STATUSTRANSPARENCY
For the past four years, Central Hudson Gas and Electric of New york has held an annual solar summit that provides an educational opportunity for local solar installation companies working within the region. One focus of its summit has been increasing awareness of technical challenges that the utility sometimes faces during the interconnection process. SEPA considers Central Hudson’s annual summit a best practice in proactively engaging the solar industry in meaningful discussions for the benefit of increased transparency and coordination.
”best Practices” tiP
3| DistributeD interconnection challenges
what are utility customers saying?
DistributeD solar interconnection challenges anD best Practices
77
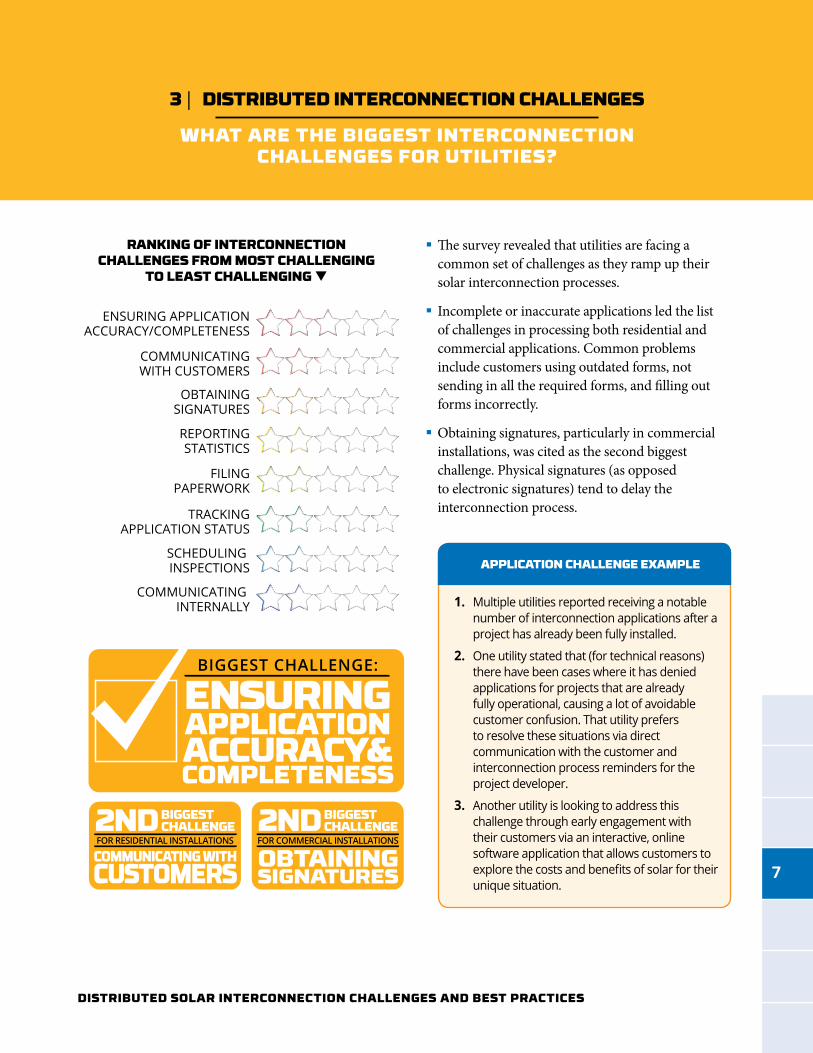
� The survey revealed that utilities are facing a common set of challenges as they ramp up their solar interconnection processes.
� Incomplete or inaccurate applications led the list of challenges in processing both residential and commercial applications. Common problems include customers using outdated forms, not sending in all the required forms, and filling out forms incorrectly.
� Obtaining signatures, particularly in commercial installations, was cited as the second biggest challenge. Physical signatures (as opposed to electronic signatures) tend to delay the interconnection process.
ranking of interconnection challenges from most challenging
to least challenging q
COMMUNICATING INTERNALLY
SCHEDULING INSPECTIONS
TRACKINGAPPLICATION STATUS
FILINGPAPERWORK
OBTAININGSIGNATURES
REPORTINGSTATISTICS
COMMUNICATINGWITH CUSTOMERS
ENSURING APPLICATIONACCURACY/COMPLETENESS
Interconnection challenges
BIGGEST CHALLENGE:
ENSURINGAPPLICATIONACCURACY&COMPLETENESS
COMMUNICATING WITH
CUSTOMERS
FOR RESIDENTIAL INSTALLATIONS2ND BIGGEST
CHALLENGE
OBTAININGSIGNATURES
FOR COMMERCIAL INSTALLATIONS2ND BIGGEST
CHALLENGE
1. Multiple utilities reported receiving a notable number of interconnection applications after a project has already been fully installed.
2. One utility stated that (for technical reasons) there have been cases where it has denied applications for projects that are already fully operational, causing a lot of avoidable customer confusion. That utility prefers to resolve these situations via direct communication with the customer and interconnection process reminders for the project developer.
3. Another utility is looking to address this challenge through early engagement with their customers via an interactive, online software application that allows customers to explore the costs and benefits of solar for their unique situation.
aPPlication challenge examPle
what are the biggest interconnection challenges for utilities?
3| DistributeD interconnection challenges

solar electric power association
88
15.1% of utilities have mastered the art of processing a larger than
average number of interconnection requests within a quick timeframe.
In spite of having quick processing times, the majority of the utilities in this category agreed
that an online application process would be on their list of top improvements.
> 4 WEEKS< 4 WEEKSINTERCONNECTION SPEED
> 50
0<
500
NU
MB
ER
OF
AP
PL
ICA
TIO
NS
PE
R Y
EA
R
28.3% of utilities are slow in processing a below average number
of interconnection applications.
Utilities in this category acknowledged a need for streamlined processes and were
interested in online application capabilities to improve the ease of tracking applications.
Some also indicated a need for better coordination with local jurisdictions
approving building permits.
47.2% of utilities have fast interconnection times when
processing a below average number of interconnection applications.
Several utilities in this category noted that process improvements had been optimized, while others expressed additional interest in
increased customer transparency, online application processes, and a need to prepare
for future increases in application volume.
9.4% of utilities process a larger than average number of
interconnection requests, but do so at a pace that demonstrates there
is room for improvement.
The utilities in this category overwhelmingly supported the idea of moving toward an
online application process—both to assist with streamlining and to improve transparency for the customer.
� Only 15 percent of utilities have mastered the art of the interconnection process while 85 percent have considerable room for improvement.
� While several utilities said they would like to be able to offer online processing for interconnection applications, only 17 percent currently do.
� The considerable projected growth in the solar market implies that utilities—no matter how many incentive applications they are processing today—may consider giving additional attention to streamlining their interconnection procedures to handle increasing volumes of applications.
� Taking DG interconnection online reduces soft costs for the solar industry through simpler application processes, and a shorter time to interconnection.
� Utility-side soft costs associated with DG interconnection are also addressed with online application processing by enabling utilities to handle larger volumes of applications, and reducing time spent correcting errors, tracking down customers, responding to customer inquiries and reporting.
DistributeD solar interconnection challenges anD best Practices
conclusion

DistributeD solar interconnection challenges anD best Practices
99
� In July and August 2014, SEPA surveyed 400 utilities seeking information about interconnection processes, including: annual volume of applications, processing timelines, submission methods, and notable strengths and challenges. The response rate was 16 percent from utilities representing an array of utility ownership types, located in 25 states. SEPA also interviewed several utilities over the phone to support the online survey with qualitative responses and information.
� Demographics from SEPA’s annual utility solar survey and the interconnection survey informing this report are closely aligned based on number of annual interconnection and utility ownership type.
sources q
1. Distributed generation is a method of generating electricity from multiple small energy sources very near to where the electricity is actually used.
2. Makhyoun, M., Taylor, M., & Clark, S. (2014). Utility Solar Market Snapshot. Solar Electric Power Association. Retrieved from http://www.solarelectricpower.org/media/180658/solar-market-snapshot-ver8.pdf
3. Ardani, K., Seif, D., Margolis, R., Morris, J., Davidson, C., Truitt, S., & Torbert, R. (2013, August). Non-Hardware (“Soft”) Cost-Reduction Roadmap for Residential and Small Commercial Solar Photovoltaics, 2013-2020. National Renewable Energy Laboratory; Rocky Mountain Institute. Retrieved from http://www.nrel.gov/docs/fy13osti/59155.pdf
4. Applications processed via email, mail, or in-person are referred to as “manual” henceforth in the report.
5. Makhyoun, M., Taylor, M., & Clark, S. (2014). Utility Solar Market Snapshot. Solar Electric Power Association. Retrieved from http://www.solarelectricpower.org/media/180658/solar-market-snapshot-ver8.pdf
6. Solar America Board for Codes and Standards. (2014). Recommended Standards for Pv Modules and Systems. Retrieved from http://www.solarabcs.com/about/publications/reports/standards/
7. Letendre, S., & Taylor, M. (2008). Residential Photovoltaic Metering and Interconnection Study: Utility Perspectives and Practices. Solar Electric Power Association. Retrieved from http://www.solarelectricpower.org/media/8178/sepa-pv-metering.pdf
8. CPS Energy. (2014). CPS Energy Solar Pv Program Application. Retrieved from http://www.cpsenergysavers.com/docs/rebate-forms-and-applications/solar_pv_application.pdf
9. CPS Energy. (2014). CPS Energy Distributed Energy Resources Manual, p. 61. Retrieved from http://www.cpsenergy.com/files/DER_Manual.pdf
Where responding utilities operate.
19% CALIFORNIA
14% WEST
20% CENTRAL
46% EAST
20%
14%
19%46%
where resPonDing utilities oPerate q
backgrounD & sources
DistributeD solar interconnection challenges anD best Practices

1220 19th Street, NW, Suite 800, WaShiNgtoN, DC 20036-2405 SolareleCtriCpoWer.org | tel: +1.202.857.0898