Disaggregation of the SDG indicators related to food and agriculture · 2020. 5. 13. · Confidence...
24
UN Statistics Division Regional Workshop on Data Disaggregation for SDGs, 19 - 21 November 2019, Istanbul, Turkey Piero Demetrio Falorsi, Sara Viviani, Ayça Dönmez Senior Statistician - ISTAT, Statistician - FAO, Statistician - FAO Disaggregation of the SDG indicators related to food and agriculture
Transcript of Disaggregation of the SDG indicators related to food and agriculture · 2020. 5. 13. · Confidence...
UN Statistics Division
Regional Workshop on Data Disaggregation for SDGs,
19 - 21 November 2019, Istanbul, Turkey
Piero Demetrio Falorsi, Sara Viviani, Ayça Dönmez
Senior Statistician - ISTAT, Statistician - FAO, Statistician - FAO
Disaggregation of the SDG indicators related
to food and agriculture

Outline
o Introduction
o Methodology
o Resultso Measure of accuracy estimation for SDG 2.1.2 - Prevalence of
moderate or severe food insecurity in the population
o Measure of accuracy for SDG 2.1.2 by gender
o Conclusion
2

3
Introductiono FAO is the custodian UN agency for 21 SDG indicators and is a contributing
agency to another five indicators, spanning SDGs 2, 5, 6, 12, 14, and 15.
o FAO is investing in strengthening the capacities of Member countries to collect
data and monitor the 21 SDG indicators and their methodologies.

Introductiono On January 2019, all data disaggregation dimensions and categories for the global
SDG indicator framework were compiled after consulting all FAO SDG focal
points on disaggregation dimensions and shared with the Inter-agency and Expert
Group on SDG Indicators (IAEG-SDGs).
o Based on the resulting data disaggregation matrix prepared by the IAEG-SDGs;
especially Goal 2 indicators 2.1.1, 2.1.2, 2.3.1 and 2.3.2 and Goal 5 indicator 5.a.1
rely on a larger number of disaggregation dimensions.
4
Gender Age
Geographical location
(urban/rural)
Other Geographical
location - Sub-national (e.g.,
province)
Income/ economic
status/ poor and
vulnerableEthnicity
(indigenous)Education
Level
Type of Enterprise (Farming/ Pastoral/
Forestry/Fisheries)
Size of Enterprise
(Small/Medium/Large)
Agroecologicalzone (Climate
variables/ Type of Soil/
Geomorphology)
Type of Tenure
(Customary/ Freehold/
Leasehold/Other)
Type of Legally
Recognized Document
2.1.1 M M F F M
2.1.2 M M F F M F
2.3.1 M F O M M M O
2.3.2 M F O M M O
5.a.1 M F F F F M F
MMinimum Set of
Disaggregation
The disaggregation dimensions specifically mentioned in the target or indicator name and information on the
categories.
OOther Current
Disaggregation
Any additional data disaggregation dimensions beyond those included in the minimum set for which data are
available in the database.
FFuture Additional
Disaggregation
Data disaggregation dimensions and categories mentioned in the metadata for the indicator, but not currently
included in the database

Introduction
Indicator 2.1.2 Prevalence of moderate or severe food insecurity in the population, based on the Food Insecurity Experience Scale (FIES)
o This indicator provides internationally-comparable estimates of the proportion of the population facing moderate or severe difficulties in accessing food.
o The Food Insecurity Experience Scale (FIES) produces a measure of the severity of food insecurity experienced by individuals or households, based on direct interviews.
o The FIES Survey Module (FIES-SM) is composed of eight questions with simple dichotomous responses (“yes”/”no”).
o Respondents are asked whether anytime during a certain reference period they have worried about their ability to obtain enough food, their household has run out of food, or if they have been forced to compromise the quality or quantity of the food they ate due to limited availability of money or other resources to obtain food
5

Introduction
6
Indicator 2.1.2 Prevalence of moderate or severe food insecurity in the
population, based on the Food Insecurity Experience Scale (FIES)
o As of 2018, over 150 countries’ FIES data are available from 2014 to 2018.
o The data source for most of the FAO member countries is the Gallup World
Poll (GWP). In addition, FIES compatible data from official national surveys are
already available for some countries (the US, Canada, Mexico, Guatemala, Brazil,
Ecuador and Seychelles). Morover, since 2015 the FIES has already been included
in official surveys in Burkina Faso, Kenya, Pakistan, Indonesia and St. Lucia.
o When food-insecurity prevalence estimates are based on FIES data collected in
the GWP, with national sample sizes of about 1000 in most countries.
o To reduce the impact of year-to-year sampling variability, country-level estimates
are presented as three-year averages, computed as averages of all available
years in the considered triennia.
o Data have been subject to a validation process and only results validated by
national statistical offices are published at country level.

Introduction
o The use of traditional survey tools and sampling methods impose limitations on the production of disaggregated data as well as relevant reliable estimates for small population groups and/or geographical areas.
As a result, data are not able to drive the transformative changes required to achieve sustainable development, or shed light on the situation of the most vulnerable groups so as not to “leave no one behind”.
o The main strategic choice is whether To limit the use of the data and allow the dissemination of only the
main indicators having a certified accuracy OR To make the system more flexible for the users, allowing the
production of disaggregated outputs making users aware of the accuracy of the results.
o This policy on one hand enhances the relevance of the information disseminated but on the other hand reduces the risk of an inappropriate use of the data.
7

o Proposed method for the measure of accuracy: Global
Variance (GV; Wolter, 1986) which is simple to use and to
communicate to users.
o Denoted with 𝐹 the estimate of a target parameter for a given
population, the estimate of the GV is obtained as the sum of
estimates of two components; i.e. the sampling and
measurement (or model) variances,
𝐺𝑉 𝐹 = 𝑉𝑃 𝐸𝑀 𝐹 + 𝐸𝑃 𝑉𝑀 𝐹 (1)
o The survey package in R calculates this estimator (Lumley, T. ,
2019)
8
Methodology

o Results for measure of accuracy estimation for SDG 2.1.2 - Prevalence of moderate or severe food insecurity in the population, based on the Food Insecurity Experience Scale (FIES).
The parameter of interest 𝐹 is the prevalence of
food insecurity at a given level of severity, where
𝐹 =1
𝑁 𝑘𝜖𝑈 𝑝𝑘 and
𝑝𝑘 unknown probability for the unit k of being food
insecure at a given level of severity of food insecurity.
9
Results

Geographical coverage: The results are based
on the full list of countries surveyed in the Gallup
World Poll and which gave consent for publication
of the SDG data; i.e. 77 countries in total.
Time series: 3 year averages 2016-2018
Disaggregation: By gender
Margins of error at 90% confidence level are
produced for the prevalence of food insecurity (at
moderate or severe and severe only levels) in the
adult population and in the population disaggregated
by gender.
10
Results

Margin of errors for the prevalence of moderate or severe food
insecurity (SDG 2.1.2), total versus by gender, 2016-18:
11
Results
Prevelance at moderate or severe level:
Average Margin of ErrorsGender ÷ Total
2016-182016-18
Gallup - Total 0.017
Gallup - Female 0.021 1.25
Gallup - Male 0.021 1.27
-0.005
0.005
0.015
0.025
0.035
0.045
-0.005 0.005 0.015 0.025 0.035 0.045
Mar
gin
of
erro
rs (
mo
e) in
mal
e an
d f
emal
e p
op
ula
tio
n
Margin of errors (moe) in total adult population
ModSev_Total_2016_18 ModSev_Male 2016_18
ModSev_Female 2016_18

Prevelance at moderate or severe level 2016-18:
Average RSE
Sampling Measurement
Gallup - Total 7.07 0.59
Gallup - Female 8.62 0.83
Gallup - Male 9.00 0.89
12
Results
Average Relative Standard Error (RSE) = Average of SE/Prevelance*100
Relative standard error for the prevalence of moderate or severe food
insecurity (SDG 2.1.2), total versus by gender, 2016-18:
Average ratio between the error (being due to measurement or sampling)
and prevalence rates at moderate or severe, and severe only, food insecurity,
for the adult population (All) and by gender
Margins of error by gender are, on average, approximately 1.3% larger than
margins of error of the total prevalence

13
ResultsConfidence interval for the prevalence of moderate or severe food
insecurity (SDG 2.1.2), total versus by gender, 2016-18:
0.26
0.28
0.30
0.32
0.34
0.36
0.38
0.40
0.42
0.44
0.46
Total Male Female Total Male Female
Egypt Bangladesh
Confidence Interval Total Prevelance_ModSev
Countries with large population sizes

14
ResultsConfidence interval for the prevalence of moderate or severe food
insecurity (SDG 2.1.2), total versus by gender, 2016-18:
0.02
0.03
0.04
0.05
0.06
0.07
0.08
0.09
0.10
0.11
0.12
Total Male Female Total Male Female
Russian Federation Iceland
Confidence interval Prevelance_ModSev
Countries with large population size versus small population size

15
ResultsConfidence interval for the prevalence of moderate or severe food
insecurity (SDG 2.1.2), total versus by gender, 2016-18:
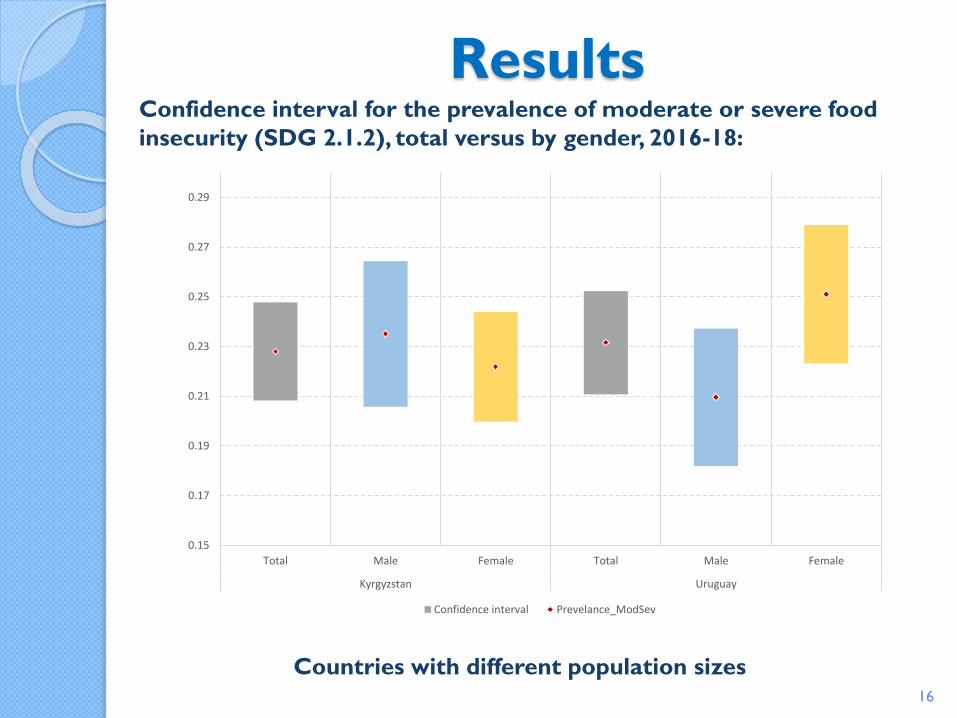
Countries with different population sizes
0.45
0.47
0.49
0.51
0.53
0.55
0.57
0.59
0.61
0.63
Total Male Female Total Male Female
Afghanistan Gambia
Confidence Interval Total Prevelance_ModSev
16
ResultsConfidence interval for the prevalence of moderate or severe food
insecurity (SDG 2.1.2), total versus by gender, 2016-18:
Countries with different population sizes
0.15
0.17
0.19
0.21
0.23
0.25
0.27
0.29
Total Male Female Total Male Female
Kyrgyzstan Uruguay
Confidence interval Prevelance_ModSev

17
ResultsConfidence interval for the prevalence of moderate or severe food
insecurity (SDG 2.1.2), total versus by gender, 2016-18:
Countries with different population sizes, with similar prevalence levels
0.45
0.5
0.55
0.6
0.65
0.7
0.75
Total Male Female Total Male Female Total Male Female Total Male Female Total Male Female
Afghanistan Gambia Eswatini Angola Togo
Confidence Interval Total Prevelance_ModSev

18
ResultsConfidence interval for the prevalence of moderate or severe food
insecurity (SDG 2.1.2), total versus by gender, 2016-18:
Countries with different population sizes, with similar prevalence levels
0.15
0.17
0.19
0.21
0.23
0.25
0.27
0.29
Total Male Female Total Male Female Total Male Female Total Male Female Total Male Female
Costa Rica Kyrgyzstan Uruguay Moldova Mongolia
Confidence Interval Total Prevelance_ModSev

19
ResultsConfidence interval for the prevalence of moderate or severe food
insecurity (SDG 2.1.2), total versus by gender, 2016-18:
Countries with different population sizes, with similar prevalence levels
0.2
0.22
0.24
0.26
0.28
0.3
0.32
0.34
0.36
Total Male Female Total Male Female Total Male Female Total Male Female Total Male Female
Moldova Mongolia Mexico Tajikistan Argentina
Confidence Interval Total Prevelance_ModSev

Conclusions
◦ It is essential to measure and communicate the accuracy of an estimate. Users should
have a say in determining the fitness for use of an estimate.
◦ With the help of the proposed method for the measure of accuracy, disaggregated
data should be disseminated by making users aware of the accuracy of the results.
◦ GV explicitly considers the main sources of variability and is relatively stable over
time, unless there is a change of the sample design properties and of the parameters
of the super-population models used for building the predictions.
21
o Comparison with countries using other national surveys (i.e.
other than Gallup) that already collect FIES compatible data,
such as USA.
o Other disaggregation dimensions; such as geographical –
rural/urban
o Other FAO-relevant SDG indicators
22
Future steps

References
Wolter, K. M. (1985) Introduction to Variance Estimation, New York, Springer-Verlag.
Lumley, T. (2019) Analysis of Complex Survey Samples - R package ‘survey’, Link: https://cran.r-project.org/web/packages/survey/survey.pdf
24

25
Annex: List of countries (Gallup)
No Country No Country No Country
1 Afghanistan 27 Greece 53 Netherlands
2 Albania 28 Guatemala 54 New Zealand
3 Angola 29 Guinea 55 Niger
4 Argentina 30 Honduras 56 Norway
5 Armenia 31 Hungary 57 Philippines
6 Australia 32 Iceland 58 Poland
7 Austria 33 Ireland 59 Portugal
8 Bangladesh 34 Israel 60 Romania
9 Belgium 35 Italy 61 Russia
10 Bosnia and Herzegovina 36 Japan 62 Serbia
11 Botswana 37 Kazakhstan 63 Sierra Leone
12 Bulgaria 38 Kyrgyzstan 64 Singapore
13 Cambodia 39 Latvia 65 Slovakia
14 Cameroon 40 Lesotho 66 South Africa
15 Costa Rica 41 Liberia 67 Republic of Korea
16 Croatia 42 Lithuania 68 Spain
17 Czechia 43 Luxembourg 69 Eswatini
18 Denmark 44 Macedonia 70 Sweden
19 Egypt 45 Mauritius 71 Switzerland
20 El Salvador 46 Mexico 72 Tajikistan
21 Estonia 47 Moldova 73 Togo
22 Finland 48 Mongolia 74 Ukraine
23 France 49 Montenegro 75United Kingdom of Great
Britain and Northern Ireland
24 Gambia 50 Mozambique 76 Uruguay
25 Georgia 51 Namibia 77 Viet Nam
26 Germany 52 Nepal