DIGITAL MEDIA | INTERNET | SAAS SECTOR REPORT · 3 GCA OVERVIEW Internet / Digital Media / SaaS...
18
DIGITAL MEDIA | INTERNET | SAAS SECTOR REPORT September 2018
Transcript of DIGITAL MEDIA | INTERNET | SAAS SECTOR REPORT · 3 GCA OVERVIEW Internet / Digital Media / SaaS...

DIGITAL MEDIA | INTERNET | SAASSECTOR REPORT
September 2018

2
Select Financing Transactions Quarterly Financing Volume ($Bn) (1)(2) Quarterly M&A Volume ($Bn) (4)
Select M&A Transactions
Company Amount ($MM) Acquirer Target EV ($Bn)
$1,000 $6.6
$550 $2.5
$500 $2.4
$427 $1.9
$400 $1.6
$300 $0.4
BIRD $300 $0.3
$295 $0.1
Last 12 Months Digital Media Price Performance vs. S&P 500 (5)
419
2018 Financing Transactions (1)(2)(3)
$36.7 Billion
2018 Financing Volume (1)(2)(3)
$36.1 Billion
2018 M&A Volume (3)(4)
50
2018 M&A Transactions (3)(4)
(10%)
5%
20%
35%
50%
226
184167
190 200 198 193180
119
0
50
100
150
200
250
$14
$8 $8
$15 $16$13 $13
$17
$13
$0
$5
$10
$15
$20
$55
$36
$14 $14 $17$29
$65
$13 $14
$0
$20
$40
$60
$80
32
25 2621
2832
1417 16
0
10
20
30
40
32%
16%
NewTV
DEAL DASHBOARD Internet / Digital Media / SaaS
Notes:Source: Capital IQ, PitchBook, and Dow Jones VentureSource. 1) Criteria based on internet/digital media/SaaS Series A and subsequent rounds of global financings greater than or equal to $10MM. 2) Financings include Venture and Private Equity Growth/Expansion activity for internet/digital media/SaaS sectors. 3) Figures reflect total transactions and volume to date. 4) Criteria based on global target internet/digital media/SaaS M&A deals with transaction enterprise values greater than $50MM. 5) Search/online advertising composite, internet commerce composite, internet content composite, diversified marketing composite, SaaS composite and social media composite used as proxy for internet/digital media/SaaS
landscape. Details on companies included can be found on the public valuation company slides.
DM Composite SPX
Quarterly Financing Deal Count (1)(2) Quarterly M&A Deal Count

3
GCA OVERVIEWInternet / Digital Media / SaaS Team
*Sascha Pfeiffer, Thomas Egli, and Tobias Schultheiss are Managing Directors at GCA Altium AG, a wholly owned subsidiary of GCA Corporation.**Tomohiko Kubota is a Vice President at GCA Corporation.
New York640 Fifth Avenue, 10
thFl.
New York, NY 10019United States
Phone: (212) 999-7090
Tokyo11-1 Marunouchi 1-chome
Chiyoda-ku, Tokyo 100-6230Japan
Phone: +81 (3) 6212-7100
San FranciscoOne Maritime Plaza, 25th Fl.
San Francisco, CA 94111United States
Phone: (415) 318-3600
London1 Southampton St.London WC2R0LRUnited Kingdom
Phone: +44 20 7484 4040
FrankfurtThurn-und-Taxis-Platz 6
D-60313 FrankfurtGermany
Phone: +49 (0) 69 204 34 6410
Paul DiNardo Rich Jasen John Lambros James Orozco Joshua Wepman
Managing Director Managing Director Managing Director Managing Director Managing Director
Phone: (212) 999-7097 Phone: (415) 318-3653 Phone: (212) 999-7083 Phone: (415) 318-3667 Phone: (212) 999-7092
Mobile: (650) 483-7246 Mobile: (415) 308-4760 Mobile: (917) 744-9011 Mobile: (415) 722-0922 Mobile: (917) 306-4168
[email protected] [email protected] [email protected] [email protected] [email protected]
Sascha Pfeiffer* Giuseppe Diprima Thomas Egli* Tobias Schultheiss* Tomohiko Kubota**
Managing Director Vice President Managing Director Managing Director Vice President
Phone: +49 (0) 69 204 34 6410 Phone: (212) 999-7088 Phone: +41 (0) 43 499 43 43 Phone: +49 (0) 69 204 34 6410 Phone: +81 (3) 6212-7129
[email protected] [email protected] [email protected] [email protected] [email protected]

4
80%
90%
100%
110%
120%
5/31/2018 6/13/2018 6/26/2018 7/9/2018 7/22/2018 8/4/2018 8/17/2018 8/30/2018
80%
100%
120%
140%
160%
180%
8/31/2017 10/22/2017 12/13/2017 2/3/2018 3/27/2018 5/18/2018 7/9/2018 8/30/2018
9.0%9.2%
16.4%
13.6%
10.7%
49.0%
65.4%
26.1%
56.2%
5.3%
1.2%0.3%
14.7%
4.8%
(12.1%)
Internet / Digital Media / SaaS
Diversified Marketing(5)
Internet Content(3)
Search / Online Advertising(1)
Gaming(7)
Media Conglomerates(6)
Internet Commerce(2)
SaaS(8)
Publishers(4)
NASDAQ
Social Media (9)
Last 12 Months Last 3 Months
2.2%
52.0%
5.2%
11.5%
(7.7%)
INDUSTRY STOCK MARKET VALUATION
Notes:(1) Search/Online Advertising Composite includes: CRTO, GOOGL, MCHX, MRIN, MSFT, QNST, AIM:RTHM, RUBI, TTD, YNDX.(2) Internet Commerce Composite includes: AMZN, APRN, BABA, BKNG, CARG, CMPR, CPRT, EBAY, ETSY, EXPE, FLWS, GRUB, NFLX, OSTK, PRSS, QUOT, SFIX, SSTK, STMP, TRVG, TZOO.(3) Internet Content Composite includes: TGNA, CRCM, DHX, EHTH, GDDY, IAC, RENN, SFLY, TTGT, XOXO, ZG.(4) Publishers Composite includes: GCI, GHC, ENXTPA:MMB, MDP, NWSA, NYT, LSE:PSON, TSX:TRI, LSE:UBM.(5) Diversified Marketing Composite includes: ADS, EFX, LSE:EXPN, HHS, IPG, MDCA, NLSN, LSE:WPP.(6) Media Conglomerates Composite includes: CBS, CMCSA, DIS, DISCA, TSE:6758 (SONY), VIAB, ENXTPA:VIV.(7) Gaming Composite includes: ATVI, CYOU, TSE:2432 (DENA), EA, GLUU, TSE:3632 (GREE), TSE:3765 (GHO), KOSE:A035420 (NVR), KOSE:A036570 (NCSOFT), NTES, SEHK:700 (TENCENT),ENXTPA:UBI, ZNGA. (8) SaaS Composite includes: APTI, AYX, BCOV, BOX, CLDR, COUP, CRM, CSOD, DBX, ECOM, EVBG, HUBS, LOGM, LPSN, MB, MDB, MRIN, NOW, NTNX, OKTA, RNG, RP, SHOP, SSTI, ULTI, VERI, WDAY, YEXT, ZEN, ZUO.(9) Social Media includes: FB, TSE:3938 (LINE), P, SNAP, SPOT, TWTR, YELP.

5
INDUSTRY STOCK MARKET VALUATIONInternet / Digital Media / SaaS: Financial Metrics
EV / 2018E Revenue EV / 2018E EBITDA
Notes:(1) Search/Online Advertising Composite includes: CRTO, GOOGL, MCHX, MRIN, MSFT, QNST, AIM:RTHM, RUBI, TTD, YNDX.(2) Internet Commerce Composite includes: AMZN, APRN, BABA, BKNG, CARG, CMPR, CPRT, EBAY, ETSY, EXPE, FLWS, GRUB, NFLX, OSTK, PRSS, QUOT, SFIX, SSTK, STMP, TRVG, TZOO.(3) Internet Content Composite includes: TGNA, CRCM, DHX, EHTH, GDDY, IAC, RENN, SFLY, TTGT, XOXO, ZG.(4) Publishers Composite includes: GCI, GHC, ENXTPA:MMB, MDP, NWSA, NYT, LSE:PSON, TSX:TRI, LSE:UBM.(5) Diversified Marketing Composite includes: ADS, EFX, LSE:EXPN, HHS, IPG, MDCA, NLSN, LSE:WPP.(6) Media Conglomerates Composite includes: CBS, CMCSA, DIS, DISCA, TSE:6758 (SONY), VIAB, ENXTPA:VIV.(7) Gaming Composite includes: ATVI, CYOU, TSE:2432 (DENA), EA, GLUU, TSE:3632 (GREE), TSE:3765 (GHO), KOSE:A035420 (NVR), KOSE:A036570 (NCSOFT), NTES, SEHK:700 (TENCENT),ENXTPA:UBI, ZNGA. (8) SaaS Composite includes: APTI, AYX, BCOV, BOX, CLDR, COUP, CRM, CSOD, DBX, ECOM, EVBG, HUBS, LOGM, LPSN, MB, MDB, MRIN, NOW, NTNX, OKTA, RNG, RP, SHOP, SSTI, ULTI, VERI, WDAY, YEXT, ZEN, ZUO.(9) Social Media includes: FB, TSE:3938 (LINE), P, SNAP, SPOT, TWTR, YELP.
30.7x
24.3x
20.8x18.1x
17.0x
13.5x11.6x 11.4x
9.5x
0.0x
5.0x
10.0x
15.0x
20.0x
25.0x
30.0x
35.0x Mean: 17.4x
Median: 17.0x9.7x
6.1x
5.0x3.9x 3.6x 3.3x
2.6x 2.3x 2.2x
0.0x
2.0x
4.0x
6.0x
8.0x
10.0x
12.0x Mean: 4.3x
Median: 3.6x

6
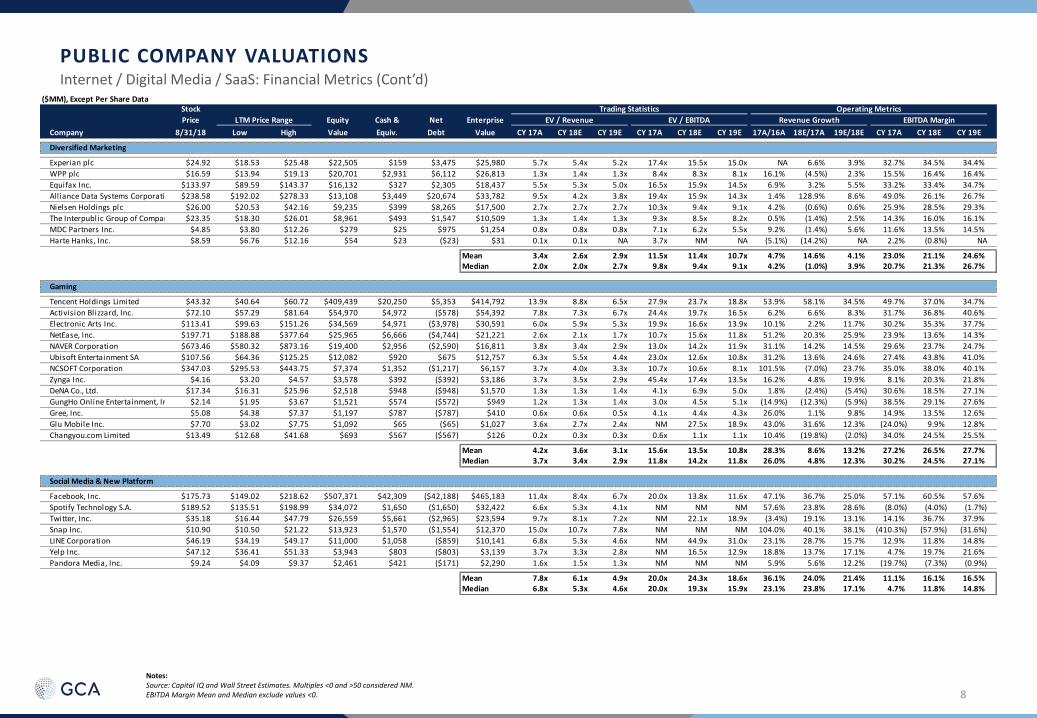
PUBLIC COMPANY VALUATIONSInternet / Digital Media / SaaS: Financial Metrics (Cont’d)
Notes:Source: Capital IQ and Wall Street Estimates. Multiples <0 and >50 considered NM.EBITDA Margin Mean and Median exclude values <0.
($MM), Except Per Share DataStock Trading Statistics Operating Metrics
Price LTM Price Range Equity Cash & Net Enterprise EV / Revenue EV / EBITDA Revenue Growth EBITDA Margin
Company 8/31/18 Low High Value Equiv. Debt Value CY 17A CY 18E CY 19E CY 17A CY 18E CY 19E 17A/16A 18E/17A 19E/18E CY 17A CY 18E CY 19E
Search / Online Advertising
Microsoft Corporation $112.33 $72.92 $112.78 $861,371 $133,669 ($46,161) $815,210 8.5x 7.0x 6.3x 24.5x 16.8x 15.0x 7.6% 22.3% 10.0% 34.8% 41.5% 42.1%
Alphabet Inc. $1,218.19 $909.70 $1,273.89 $847,468 $102,254 ($98,273) $749,195 6.8x 5.5x 4.7x 20.9x 14.9x 12.2x 22.8% 23.7% 17.3% 32.3% 36.8% 38.1%
Yandex N.V. $32.13 $30.29 $44.49 $10,529 $1,532 ($1,216) $9,313 5.7x 5.2x 4.1x 23.8x 17.2x 11.8x 31.8% 9.8% 26.6% 24.0% 30.2% 34.6%
The Trade Desk, Inc. $141.88 $40.70 $143.47 $6,089 $142 ($142) $5,947 19.3x 12.9x 9.8x NM 41.8x 31.9x 51.9% 49.1% 31.6% 24.1% 30.9% 30.8%
Criteo S.A. $24.81 $21.00 $49.00 $1,662 $480 ($477) $1,185 0.5x 1.2x 1.2x 5.2x 3.9x 3.7x 27.7% (58.1%) 6.8% 10.0% 31.4% 31.6%
QuinStreet, Inc. $15.17 $5.10 $16.42 $715 $65 ($65) $650 1.9x 1.5x 1.4x NM 16.3x 12.8x 12.1% 29.6% 10.7% 3.4% 9.2% 10.5%
The Rubicon Project, Inc. $3.98 $1.48 $4.20 $201 $104 ($104) $97 0.6x 0.9x 0.7x 1.4x NM 24.1x (39.2%) (29.4%) 19.4% 45.6% (17.3%) 3.1%
RhythmOne plc $2.53 $2.00 $4.93 $199 $37 $13 $212 NA 0.6x 0.5x NM 4.6x 3.4x NA NA 17.0% NA 12.1% 14.1%
Marchex, Inc. $2.88 $2.52 $3.67 $112 $77 ($77) $36 0.4x 0.4x 0.4x 35.6x 29.7x 19.8x (30.3%) (5.4%) 1.2% 1.1% 1.4% 2.1%
Mean 5.5x 3.9x 3.2x 18.6x 18.1x 15.0x 25.6% 26.9% 15.6% 21.9% 21.5% 23.0%Median 3.8x 1.5x 1.4x 22.3x 16.5x 12.8x 17.5% 16.0% 17.0% 24.0% 30.2% 30.8%
Internet Content
IAC/InterActiveCorp $197.20 $111.73 $202.86 $16,410 $1,765 $231 $16,641 5.0x 4.0x 3.5x 49.1x 16.8x 13.7x 5.3% 26.9% 13.2% 10.2% 23.6% 25.5%
GoDaddy Inc. $81.46 $42.54 $81.95 $13,512 $840 $1,744 $15,256 6.8x 5.8x 5.1x NM 20.9x 18.9x 20.8% 18.8% 12.1% 13.1% 27.5% 27.1%
Zillow Group, Inc. $48.10 $37.96 $65.42 $9,616 $900 ($505) $9,110 8.5x 6.8x 4.7x NM 36.7x 28.6x 27.2% 24.2% 44.5% 7.7% 18.5% 16.5%
Shutterfly, Inc. $77.68 $39.76 $100.34 $2,598 $201 $1,022 $3,620 3.0x 1.8x 1.6x 21.8x 8.7x 8.4x 4.9% 70.1% 12.5% 13.9% 20.5% 19.0%
TEGNA Inc. $11.64 $10.00 $15.60 $2,506 $25 $3,107 $5,613 2.9x 2.6x 2.6x 9.0x 7.5x 8.3x (5.0%) 13.8% (0.5%) 32.9% 34.6% 31.5%
XO Group Inc. $30.06 $17.49 $35.83 $756 $117 ($117) $640 4.0x 3.8x 3.5x 38.2x 17.4x 15.5x 5.5% 4.6% 9.0% 10.4% 21.9% 22.5%
TechTarget, Inc. $23.99 $9.92 $34.47 $662 $34 ($7) $655 6.0x 5.3x 4.7x 43.5x 20.4x 16.3x 1.8% 14.2% 12.9% 13.9% 25.9% 28.7%
Care.com, Inc. $19.43 $13.15 $22.95 $607 $114 ($114) $494 2.8x 2.6x 2.3x 42.1x 15.6x 13.1x 7.6% 10.5% 13.5% 6.7% 16.5% 17.3%
eHealth, Inc. $29.19 $13.61 $32.96 $560 $31 ($31) $529 3.3x 2.4x 2.1x NM 21.7x 14.5x (7.3%) 40.1% 15.3% (16.0%) 11.0% 14.2%
Renren Inc. $1.73 $1.66 $18.70 $119 - - $119 0.6x 0.2x NA NM NA NA 220.6% 151.0% NA (42.5%) NA NA
DHI Group, Inc. $2.15 $1.25 $3.25 $116 $10 $9 $125 0.6x 0.8x 0.8x 4.1x 4.0x 4.2x (8.4%) (21.7%) (3.9%) 14.7% 19.1% 19.1%
Mean 4.0x 3.3x 3.1x 29.7x 17.0x 14.1x 24.8% 32.0% 12.9% 11.2% 21.9% 22.1%Median 3.3x 2.6x 3.1x 38.2x 17.1x 14.1x 5.3% 18.8% 12.7% 10.4% 21.2% 20.8%

7
Notes:Source: Capital IQ and Wall Street Estimates. Multiples <0 and >50 considered NM.EBITDA Margin Mean and Median exclude values <0.
PUBLIC COMPANY VALUATIONSInternet / Digital Media / SaaS: Financial Metrics (Cont’d)
($MM), Except Per Share DataStock Trading Statistics Operating Metrics
Price LTM Price Range Equity Cash & Net Enterprise EV / Revenue EV / EBITDA Revenue Growth EBITDA Margin
Company 8/31/18 Low High Value Equiv. Debt Value CY 17A CY 18E CY 19E CY 17A CY 18E CY 19E 17A/16A 18E/17A 19E/18E CY 17A CY 18E CY 19E
Internet Commerce
Amazon.com, Inc. $2,012.71 $931.75 $2,025.57 $981,682 $27,050 $18,739 $1,000,421 5.6x 4.3x 3.5x NM 31.0x 23.5x 30.8% 32.0% 22.0% 8.5% 13.7% 14.8%
Alibaba Group Holding Limited $175.01 $164.25 $211.70 $450,113 $27,971 ($7,109) $443,004 12.7x 8.3x 6.0x 31.3x 24.2x 17.3x 68.3% 53.0% 39.5% 40.5% 34.3% 34.5%
Netflix, Inc. $367.68 $172.44 $423.21 $160,109 $3,906 $4,436 $164,545 14.1x 10.4x 8.4x NM NM NM 32.4% 35.5% 24.3% 7.8% 13.0% 15.4%
Booking Holdings Inc. $1,951.55 $1,630.56 $2,228.99 $92,644 $7,332 $1,430 $94,075 7.4x 6.6x 5.9x 19.1x 16.5x 14.7x 18.0% 13.2% 12.0% 38.8% 39.7% 39.8%
eBay Inc. $34.61 $32.86 $46.99 $34,248 $4,007 $5,234 $39,482 4.1x 3.7x 3.4x 13.4x 10.9x 10.2x 6.5% 12.9% 7.8% 30.7% 33.5% 33.2%
Expedia Group, Inc. $130.50 $98.52 $154.24 $19,503 $4,563 ($332) $19,171 1.9x 1.7x 1.5x 16.5x 10.1x 8.8x 14.7% 12.1% 12.0% 11.5% 16.8% 17.3%
Copart, Inc. $64.31 $31.81 $64.78 $14,938 $204 $196 $15,134 9.3x 8.1x 7.6x 23.1x 20.7x 19.4x 18.6% 14.2% 6.6% 40.3% 39.2% 39.2%
GrubHub Inc. $144.11 $49.60 $145.09 $13,036 $482 ($360) $12,677 18.6x 12.9x 10.1x NM 47.6x 36.0x 38.5% 43.6% 27.7% 20.4% 27.1% 28.1%
Etsy, Inc. $48.69 $15.27 $50.60 $5,831 $568 ($291) $5,540 12.6x 9.3x 7.3x NM 41.0x 29.8x 20.9% 34.7% 28.5% 10.9% 22.8% 24.3%
CarGurus, Inc. $49.32 $25.85 $56.17 $5,399 $142 ($142) $5,257 16.6x 12.0x 9.7x NM NM NM 59.9% 38.4% 24.2% 6.0% 7.9% 9.0%
Stamps.com Inc. $248.45 $160.00 $285.75 $4,511 $283 ($201) $4,309 9.2x 7.7x 6.6x 23.3x 16.5x 13.7x 28.7% 19.2% 17.7% 39.5% 46.9% 47.9%
Cimpress N.V. $140.00 $92.01 $171.76 $4,324 $44 $926 $5,250 2.2x 1.9x 1.8x 23.3x 14.5x 12.0x 26.0% 11.2% 7.2% 9.2% 13.3% 15.1%
Stitch Fix, Inc. $40.58 $14.48 $41.58 $3,971 $287 ($287) $3,684 3.4x 2.7x 2.3x NM NM NM 25.5% 23.8% 20.1% 3.5% 3.7% 3.9%
Shutterstock, Inc. $55.04 $32.39 $55.41 $1,924 $290 ($290) $1,635 2.9x 2.6x 2.3x 32.8x 15.5x 12.9x 12.7% 13.8% 11.3% 8.9% 16.7% 18.0%
trivago N.V. $4.83 $4.01 $15.72 $1,694 $115 ($115) $1,579 1.3x 1.5x 1.4x NM NM NM 56.2% (13.1%) 5.6% (1.1%) (2.7%) 1.4%
Quotient Technology Inc. $14.95 $10.35 $17.85 $1,422 $358 ($207) $1,215 3.8x 3.1x 2.5x NM 20.2x 14.0x 17.1% 23.3% 24.0% 3.6% 15.1% 17.6%
Overstock.com, Inc. $29.20 $22.10 $89.80 $847 $152 ($149) $698 0.4x 0.4x 0.4x NM NM NM (3.1%) 6.7% 6.0% (1.7%) (8.1%) (2.0%)
1-800-FLOWERS.COM, Inc. $12.05 $8.85 $15.00 $778 $147 ($45) $734 0.6x 0.6x 0.6x 10.4x 9.2x 8.6x (2.7%) 2.8% 5.6% 6.1% 6.7% 6.8%
Blue Apron Holdings, Inc. $2.02 $1.72 $6.25 $389 $183 $14 $403 0.5x 0.6x 0.5x NM NM NM 10.8% (20.8%) 10.7% (17.0%) (10.3%) (3.0%)
Travelzoo $12.40 $5.75 $21.15 $152 $19 ($19) $133 1.2x 1.2x 1.1x 21.1x 13.8x 10.8x (6.8%) 8.2% 6.2% 5.9% 8.3% 10.0%
Mean 6.4x 5.0x 4.1x 21.4x 20.8x 16.6x 23.6% 18.2% 15.9% 14.6% 17.9% 18.8%Median 3.9x 3.4x 2.9x 22.1x 16.5x 13.9x 19.7% 14.0% 12.0% 8.7% 14.4% 16.3%
Media Conglomerates / Selected Entertainment
Comcast Corporation $36.99 $30.43 $44.00 $169,486 $5,726 $58,854 $228,340 2.7x 2.6x 2.5x 8.2x 7.8x 7.4x 5.1% 5.9% 2.1% 32.9% 32.8% 33.5%
The Walt Disney Company $112.02 $96.20 $117.90 $166,601 $4,326 $19,347 $185,948 3.3x 3.1x 3.0x 11.0x 10.6x 10.4x 1.0% 6.4% 3.4% 30.4% 29.6% 29.3%
Sony Corporation $57.27 $36.44 $57.94 $72,631 $20,594 ($8,689) $63,942 1.0x 0.8x 0.8x 5.8x 6.4x 5.9x 16.7% 23.3% 2.0% 17.3% 12.7% 13.4%
Vivendi SA $25.94 $23.01 $28.87 $32,869 $4,421 $840 $33,709 2.3x 2.1x 2.0x 21.8x 16.6x 14.7x 30.8% 7.1% 5.0% 10.4% 12.7% 13.6%
CBS Corporation $53.02 $47.54 $64.69 $19,937 $252 $9,598 $29,535 2.2x 2.0x 1.9x 9.7x 8.9x 8.3x 4.0% 6.9% 7.1% 22.3% 22.7% 22.7%
Discovery, Inc. $27.83 $15.99 $29.72 $19,726 $429 $17,900 $37,626 5.7x 3.5x 3.3x 14.7x 9.2x 8.2x 5.9% 65.7% 4.5% 39.0% 37.7% 40.7%
Viacom, Inc. $29.28 $22.13 $35.55 $11,796 $929 $9,159 $20,955 1.6x 1.6x 1.5x 7.1x 6.9x 6.4x 2.8% (0.3%) 5.1% 22.5% 23.5% 24.1%
Mean 2.7x 2.2x 2.2x 11.2x 9.5x 8.8x 9.5% 16.4% 4.2% 25.0% 24.5% 25.3%Median 2.3x 2.1x 2.0x 9.7x 8.9x 8.2x 5.1% 6.9% 4.5% 22.5% 23.5% 24.1%
Publishers
Thomson Reuters Corporation $44.37 $35.70 $46.72 $31,062 $927 $6,909 $37,971 3.4x 6.9x 6.5x 15.1x 29.9x 27.3x 1.5% (51.5%) 6.6% 22.3% 23.1% 23.7%
Informa plc $9.90 $8.53 $11.29 $12,379 $174 $3,579 $15,958 6.7x 5.3x 4.3x 21.1x 15.8x 12.4x 43.1% 26.4% 23.4% 31.8% 33.6% 34.6%
Pearson plc $11.91 $7.31 $12.63 $9,228 $435 $1,118 $10,346 1.7x 1.9x 1.9x 13.8x 11.7x 10.8x 8.5% (11.4%) (0.5%) 12.3% 16.3% 17.7%
News Corporation $13.07 $12.84 $17.29 $7,646 $2,034 ($82) $7,564 1.0x 0.8x 0.7x 9.3x 6.4x 5.8x 0.5% 29.6% 4.0% 10.6% 11.9% 12.6%
The New York Times Company $23.30 $16.95 $26.85 $3,842 $530 ($278) $3,564 2.3x 2.1x 2.0x 13.7x 13.3x 11.6x 7.2% 9.8% 5.1% 16.6% 15.6% 16.9%
Lagardère SCA $29.48 $25.53 $33.30 $3,778 $734 $1,713 $5,491 0.6x 0.7x 0.6x 7.4x 7.4x 7.1x 8.8% (1.5%) 4.0% 8.7% 8.9% 8.9%
Graham Holdings Company $562.65 $536.90 $625.45 $3,008 $763 ($277) $2,731 1.5x 1.0x NA 8.5x 7.7x NA (5.5%) 46.4% NA 17.7% 13.3% NA
Meredith Corporation $51.65 $47.30 $72.25 $2,317 $438 $2,698 $5,015 4.2x 1.6x 1.6x 15.3x 8.4x 6.5x (5.3%) 152.2% 2.7% 27.2% 19.8% 24.8%
Gannett Co., Inc. $10.28 $7.94 $12.38 $1,162 $210 $127 $1,289 0.4x 0.4x 0.4x 4.3x 3.8x 3.9x 2.6% 2.0% (1.8%) 10.4% 11.4% 11.4%
Mean 2.4x 2.3x 2.3x 12.0x 11.6x 10.7x 6.8% 22.5% 5.4% 17.5% 17.1% 18.8%Median 1.7x 1.6x 1.8x 13.7x 8.4x 9.0x 2.6% 9.8% 4.0% 16.6% 15.6% 17.3%
8
PUBLIC COMPANY VALUATIONSInternet / Digital Media / SaaS: Financial Metrics (Cont’d)
Notes:Source: Capital IQ and Wall Street Estimates. Multiples <0 and >50 considered NM.EBITDA Margin Mean and Median exclude values <0.
($MM), Except Per Share DataStock Trading Statistics Operating Metrics
Price LTM Price Range Equity Cash & Net Enterprise EV / Revenue EV / EBITDA Revenue Growth EBITDA Margin
Company 8/31/18 Low High Value Equiv. Debt Value CY 17A CY 18E CY 19E CY 17A CY 18E CY 19E 17A/16A 18E/17A 19E/18E CY 17A CY 18E CY 19E
Diversified Marketing
Experian plc $24.92 $18.53 $25.48 $22,505 $159 $3,475 $25,980 5.7x 5.4x 5.2x 17.4x 15.5x 15.0x NA 6.6% 3.9% 32.7% 34.5% 34.4%
WPP plc $16.59 $13.94 $19.13 $20,701 $2,931 $6,112 $26,813 1.3x 1.4x 1.3x 8.4x 8.3x 8.1x 16.1% (4.5%) 2.3% 15.5% 16.4% 16.4%
Equifax Inc. $133.97 $89.59 $143.37 $16,132 $327 $2,305 $18,437 5.5x 5.3x 5.0x 16.5x 15.9x 14.5x 6.9% 3.2% 5.5% 33.2% 33.4% 34.7%
Alliance Data Systems Corporation $238.58 $192.02 $278.33 $13,108 $3,449 $20,674 $33,782 9.5x 4.2x 3.8x 19.4x 15.9x 14.3x 1.4% 128.9% 8.6% 49.0% 26.1% 26.7%
Nielsen Holdings plc $26.00 $20.53 $42.16 $9,235 $399 $8,265 $17,500 2.7x 2.7x 2.7x 10.3x 9.4x 9.1x 4.2% (0.6%) 0.6% 25.9% 28.5% 29.3%
The Interpublic Group of Companies, Inc.$23.35 $18.30 $26.01 $8,961 $493 $1,547 $10,509 1.3x 1.4x 1.3x 9.3x 8.5x 8.2x 0.5% (1.4%) 2.5% 14.3% 16.0% 16.1%
MDC Partners Inc. $4.85 $3.80 $12.26 $279 $25 $975 $1,254 0.8x 0.8x 0.8x 7.1x 6.2x 5.5x 9.2% (1.4%) 5.6% 11.6% 13.5% 14.5%
Harte Hanks, Inc. $8.59 $6.76 $12.16 $54 $23 ($23) $31 0.1x 0.1x NA 3.7x NM NA (5.1%) (14.2%) NA 2.2% (0.8%) NA
Mean 3.4x 2.6x 2.9x 11.5x 11.4x 10.7x 4.7% 14.6% 4.1% 23.0% 21.1% 24.6%Median 2.0x 2.0x 2.7x 9.8x 9.4x 9.1x 4.2% (1.0%) 3.9% 20.7% 21.3% 26.7%
Gaming
Tencent Holdings Limited $43.32 $40.64 $60.72 $409,439 $20,250 $5,353 $414,792 13.9x 8.8x 6.5x 27.9x 23.7x 18.8x 53.9% 58.1% 34.5% 49.7% 37.0% 34.7%
Activision Blizzard, Inc. $72.10 $57.29 $81.64 $54,970 $4,972 ($578) $54,392 7.8x 7.3x 6.7x 24.4x 19.7x 16.5x 6.2% 6.6% 8.3% 31.7% 36.8% 40.6%
Electronic Arts Inc. $113.41 $99.63 $151.26 $34,569 $4,971 ($3,978) $30,591 6.0x 5.9x 5.3x 19.9x 16.6x 13.9x 10.1% 2.2% 11.7% 30.2% 35.3% 37.7%
NetEase, Inc. $197.71 $188.88 $377.64 $25,965 $6,666 ($4,744) $21,221 2.6x 2.1x 1.7x 10.7x 15.6x 11.8x 51.2% 20.3% 25.9% 23.9% 13.6% 14.3%
NAVER Corporation $673.46 $580.32 $873.16 $19,400 $2,956 ($2,590) $16,811 3.8x 3.4x 2.9x 13.0x 14.2x 11.9x 31.1% 14.2% 14.5% 29.6% 23.7% 24.7%
Ubisoft Entertainment SA $107.56 $64.36 $125.25 $12,082 $920 $675 $12,757 6.3x 5.5x 4.4x 23.0x 12.6x 10.8x 31.2% 13.6% 24.6% 27.4% 43.8% 41.0%
NCSOFT Corporation $347.03 $295.53 $443.75 $7,374 $1,352 ($1,217) $6,157 3.7x 4.0x 3.3x 10.7x 10.6x 8.1x 101.5% (7.0%) 23.7% 35.0% 38.0% 40.1%
Zynga Inc. $4.16 $3.20 $4.57 $3,578 $392 ($392) $3,186 3.7x 3.5x 2.9x 45.4x 17.4x 13.5x 16.2% 4.8% 19.9% 8.1% 20.3% 21.8%
DeNA Co., Ltd. $17.34 $16.31 $25.96 $2,518 $948 ($948) $1,570 1.3x 1.3x 1.4x 4.1x 6.9x 5.0x 1.8% (2.4%) (5.4%) 30.6% 18.5% 27.1%
GungHo Online Entertainment, Inc. $2.14 $1.95 $3.67 $1,521 $574 ($572) $949 1.2x 1.3x 1.4x 3.0x 4.5x 5.1x (14.9%) (12.3%) (5.9%) 38.5% 29.1% 27.6%
Gree, Inc. $5.08 $4.38 $7.37 $1,197 $787 ($787) $410 0.6x 0.6x 0.5x 4.1x 4.4x 4.3x 26.0% 1.1% 9.8% 14.9% 13.5% 12.6%
Glu Mobile Inc. $7.70 $3.02 $7.75 $1,092 $65 ($65) $1,027 3.6x 2.7x 2.4x NM 27.5x 18.9x 43.0% 31.6% 12.3% (24.0%) 9.9% 12.8%
Changyou.com Limited $13.49 $12.68 $41.68 $693 $567 ($567) $126 0.2x 0.3x 0.3x 0.6x 1.1x 1.1x 10.4% (19.8%) (2.0%) 34.0% 24.5% 25.5%
Mean 4.2x 3.6x 3.1x 15.6x 13.5x 10.8x 28.3% 8.6% 13.2% 27.2% 26.5% 27.7%Median 3.7x 3.4x 2.9x 11.8x 14.2x 11.8x 26.0% 4.8% 12.3% 30.2% 24.5% 27.1%
Social Media & New Platform
Facebook, Inc. $175.73 $149.02 $218.62 $507,371 $42,309 ($42,188) $465,183 11.4x 8.4x 6.7x 20.0x 13.8x 11.6x 47.1% 36.7% 25.0% 57.1% 60.5% 57.6%
Spotify Technology S.A. $189.52 $135.51 $198.99 $34,072 $1,650 ($1,650) $32,422 6.6x 5.3x 4.1x NM NM NM 57.6% 23.8% 28.6% (8.0%) (4.0%) (1.7%)
Twitter, Inc. $35.18 $16.44 $47.79 $26,559 $5,661 ($2,965) $23,594 9.7x 8.1x 7.2x NM 22.1x 18.9x (3.4%) 19.1% 13.1% 14.1% 36.7% 37.9%
Snap Inc. $10.90 $10.50 $21.22 $13,923 $1,570 ($1,554) $12,370 15.0x 10.7x 7.8x NM NM NM 104.0% 40.1% 38.1% (410.3%) (57.9%) (31.6%)
LINE Corporation $46.19 $34.19 $49.17 $11,000 $1,058 ($859) $10,141 6.8x 5.3x 4.6x NM 44.9x 31.0x 23.1% 28.7% 15.7% 12.9% 11.8% 14.8%
Yelp Inc. $47.12 $36.41 $51.33 $3,943 $803 ($803) $3,139 3.7x 3.3x 2.8x NM 16.5x 12.9x 18.8% 13.7% 17.1% 4.7% 19.7% 21.6%
Pandora Media, Inc. $9.24 $4.09 $9.37 $2,461 $421 ($171) $2,290 1.6x 1.5x 1.3x NM NM NM 5.9% 5.6% 12.2% (19.7%) (7.3%) (0.9%)
Mean 7.8x 6.1x 4.9x 20.0x 24.3x 18.6x 36.1% 24.0% 21.4% 11.1% 16.1% 16.5%Median 6.8x 5.3x 4.6x 20.0x 19.3x 15.9x 23.1% 23.8% 17.1% 4.7% 11.8% 14.8%

9
PUBLIC COMPANY VALUATIONSInternet / Digital Media / SaaS: Financial Metrics (Cont’d)
Notes:Source: Capital IQ and Wall Street Estimates. Multiples <0 and >50 considered NM.EBITDA Margin Mean and Median exclude values <0.
($MM), Except Per Share DataStock Trading Statistics Operating Metrics
Price LTM Price Range Equity Cash & Net Enterprise EV / Revenue EV / EBITDA Revenue Growth EBITDA Margin
Company 8/31/18 Low High Value Equiv. Debt Value CY 17A CY 18E CY 19E CY 17A CY 18E CY 19E 17A/16A 18E/17A 19E/18E CY 17A CY 18E CY 19E
SaaS
salesforce.com, inc. $152.68 $92.11 $154.97 $115,533 $3,427 $971 $116,504 11.1x 8.8x 7.3x NM 36.8x 30.1x 24.9% 25.7% 20.4% 8.6% 24.0% 24.4%
ServiceNow, Inc. $196.36 $110.17 $201.00 $34,941 $1,750 ($893) $34,049 17.6x 13.1x 10.2x NM NM 36.8x 39.0% 34.7% 28.8% 0.8% 25.6% 27.6%
Workday, Inc. $154.54 $95.35 $155.81 $33,381 $2,985 ($1,808) $31,573 14.7x 11.4x 9.0x NM NM 44.2x 36.1% 29.1% 26.5% (7.8%) 17.2% 20.4%
Shopify Inc. $145.67 $89.35 $176.60 $15,506 $1,574 ($1,574) $13,932 20.7x 13.5x 9.7x NM NM NM 72.9% 53.3% 38.5% (4.8%) 3.3% 6.2%
DocuSign, Inc. $62.44 $37.00 $68.35 $11,995 $732 ($732) $11,262 21.7x 17.2x 14.5x NM NM NM 35.9% 26.4% 18.9% 1.9% 6.3% 8.5%
Dropbox, Inc. $26.85 $26.25 $43.50 $10,802 $982 ($814) $9,988 9.0x 7.3x 6.3x NM 33.3x 28.5x 31.0% 24.1% 15.8% 6.2% 21.8% 22.0%
The Ultimate Software Group, Inc. $309.67 $181.59 $309.73 $9,652 $188 ($175) $9,477 10.1x 8.3x 7.0x NM 34.5x 28.1x 20.4% 20.9% 18.7% 7.9% 24.1% 25.0%
Nutanix, Inc. $56.32 $20.02 $64.87 $9,613 $934 ($505) $9,108 9.7x 7.4x 5.8x NM NM NM 46.6% 30.1% 28.2% (33.5%) (7.0%) (2.5%)
RingCentral, Inc. $93.15 $38.45 $95.60 $7,416 $567 ($207) $7,210 15.6x 11.0x 9.0x NM NM NM 30.2% 41.1% 23.2% (2.4%) 11.7% 12.6%
Zendesk, Inc. $68.89 $27.06 $69.98 $7,300 $684 ($238) $7,061 16.4x 12.1x 9.3x NM NM NM 38.0% 36.0% 29.9% (21.0%) 6.8% 9.5%
Okta, Inc. $61.83 $24.50 $62.39 $6,591 $536 ($272) $6,319 24.3x 17.7x 13.4x NM NM NM 62.2% 37.4% 31.9% (42.8%) (15.0%) (5.9%)
RealPage, Inc. $62.40 $38.40 $62.55 $5,648 $373 $225 $5,873 8.8x 6.7x 5.9x NM 25.6x 20.8x 18.1% 29.8% 14.6% 14.1% 26.3% 28.3%
HubSpot, Inc. $143.70 $71.00 $144.55 $5,575 $550 ($242) $5,333 14.2x 10.7x 8.6x NM NM NM 38.6% 32.7% 24.5% (8.2%) 9.4% 11.3%
LogMeIn, Inc. $85.95 $77.05 $134.80 $4,458 $199 $1 $4,459 4.5x 3.7x 3.5x 16.9x 10.2x 9.4x 194.5% 20.3% 7.0% 26.6% 36.7% 37.4%
Coupa Software Incorporated $71.71 $29.37 $72.36 $4,087 $443 ($275) $3,813 20.4x 16.2x 13.0x NM NM NM 39.6% 26.2% 24.1% (21.6%) (0.8%) 4.5%
MongoDB, Inc. $71.96 $24.62 $73.71 $3,643 $523 ($312) $3,331 21.6x 15.2x 11.2x NM NM NM 52.4% 42.2% 34.8% (61.1%) (31.8%) (17.3%)
Alteryx, Inc. $58.05 $18.64 $58.60 $3,534 $331 ($162) $3,371 25.6x 17.5x 13.1x NM NM NM 53.4% 46.5% 33.6% (10.9%) (4.5%) (1.1%)
Box, Inc. $24.56 $17.25 $29.79 $3,478 $204 ($111) $3,367 6.7x 5.5x 4.6x NM NM NM 27.0% 20.0% 21.1% (22.6%) 3.8% 7.0%
Cornerstone OnDemand, Inc. $56.56 $33.57 $57.00 $3,324 $642 ($102) $3,222 6.7x 6.1x 5.7x NM 36.8x 24.4x 13.9% 8.7% 8.2% (7.5%) 16.7% 23.3%
Zuora, Inc. $27.58 $18.75 $37.78 $2,964 $179 ($161) $2,803 16.7x 12.2x 9.7x NM NM NM 48.6% 36.3% 26.4% (24.9%) (18.6%) (12.9%)
Yext, Inc. $24.86 $10.58 $27.19 $2,451 $125 ($125) $2,326 13.7x 10.2x 7.8x NM NM NM 37.0% 33.6% 31.6% (36.1%) (15.5%) (10.6%)
Cloudera, Inc. $15.01 $12.57 $22.43 $2,224 $378 ($378) $1,846 5.0x 4.2x 3.5x NM NM NM 40.8% 20.2% 19.1% (102.9%) (18.7%) (11.5%)
MINDBODY, Inc. $37.10 $23.35 $45.50 $1,771 $326 ($80) $1,691 9.3x 6.8x 5.4x NM NM NM 31.4% 35.9% 25.3% (3.6%) 1.1% 4.9%
Everbridge, Inc. $60.21 $21.83 $61.50 $1,769 $106 ($14) $1,755 16.8x 12.2x 9.7x NM NM NM 35.8% 38.1% 26.1% (15.4%) (2.1%) 1.6%
Apptio, Inc. $38.80 $16.56 $39.58 $1,730 $249 ($141) $1,588 8.4x 6.8x 5.9x NM NM NM 17.4% 23.3% 16.7% (10.7%) 4.2% 6.6%
LivePerson, Inc. $26.90 $10.80 $26.90 $1,679 $70 ($70) $1,609 7.4x 6.5x 5.8x NM NM NM (1.8%) 12.6% 11.9% 4.3% 9.1% 10.5%
ShotSpotter, Inc. $57.04 $9.33 $57.15 $614 $15 ($15) $600 25.2x 17.7x 13.1x NM NM NM 53.2% 42.9% 35.1% (1.8%) 12.2% 21.0%
Domo, Inc. $23.51 $15.79 $28.86 $587 $239 ($142) $445 4.1x 3.4x 2.8x NM NM NM 45.6% 21.1% 21.5% (157.5%) (105.2%) (63.4%)
ChannelAdvisor Corporation $13.05 $8.30 $15.63 $356 $51 ($49) $307 2.5x 2.3x 2.2x NM 37.3x 27.6x 8.2% 7.0% 7.1% (5.8%) 6.3% 7.9%
Brightcove Inc. $8.20 $6.30 $10.75 $295 $27 ($27) $267 1.7x 1.6x 1.5x NM NM 31.3x 3.8% 7.4% 8.0% (9.2%) 1.3% 4.7%
Veritone, Inc. $10.44 $10.00 $74.92 $206 $78 ($78) $127 8.8x 6.9x 4.5x NM NM NM 61.7% 28.0% 54.1% (324.0%) (239.8%) (151.8%)
Mean 12.9x 9.7x 7.7x 16.9x 30.7x 28.1x 40.5% 28.8% 23.6% 2.3% 8.6% 10.5%Median 11.1x 8.8x 7.3x 16.9x 34.5x 28.3x 37.0% 29.1% 24.1% (8.2%) 4.2% 7.0%

10
Valuation Correlation to Growth and Cash Flow
Notes:Source: Capital IQ and Wall Street Estimates. When analyzing the same data set, R value of 2018E Revenue Multiple and 2018E Revenue Growth % is 0.76.
CY 2018E Revenue Growth % + CY 2018E FCF Margin %
Ente
rpri
se V
alu
e /
CY
20
18
E R
eve
nu
e
PUBLIC SAAS COMPANIES
Company Identifier
APPF
APTI
BCOV
BOX
COUP
CRM
CSOD
ECOM
EVBG
HUBS
LPSN
MB
MRIN
NOW
NTNX
RNG
RP
SHOP
ULTI
WDAY
ZEN
Selected Public SaaS Companies
WDAY
NOW
ULTI
SHOP
ZEN
CSOD
RP
HUBS
BOX
RNGMB
APPF
LPSN
BCOVECOM
MRIN
COUP
CRM
EVGB
APTINTNX
2.0x
4.0x
6.0x
8.0x
10.0x
12.0x
14.0x
16.0x
18.0x
(10%) 0% 10% 20% 30% 40% 50% 60% 70%
R = 0.84

11
Notes:Multiples <0x or >50x considered NM.Disclosed transactions with Enterprise Value <$50MM not included. (1) Multiples based on Capital IQ consensus estimates.
RECENT ACQUISITIONSInternet / Digital Media / SaaS
($MM)
Announced Date Acquirer Target Enterprise Value EV / LTM Rev. EV / LTM EBITDA EV / NTM Rev. EV / NTM EBITDA
9/4/208 $295 NA NA NA NA
8/31/2018 $82 NA NA NA NA
8/29/2018 $210 NA NA NA NA
8/23/2018 $157 0.8x 5.8x 1.0x 5.1x
8/10/2018 $1,520 NA NA NA NA
8/3/2018 $120 NA NA NA NA
8/2/2018 $2,350 NA NA NA NA
8/2/2018 $63 NA NA NA NA
8/1/2018 $600 NA NA NA NA
7/31/2018 $220 NA NA NA NA
7/28/2018 $135 10.2x 23.7x NA NA
7/25/2018 $390 NA NA NA NA
7/23/2018 $140 NA NA NA NA
(1)
(1)

12
Notes:Multiples <0x or >50x considered NM.Disclosed transactions with Enterprise Value <$50MM not included. (1) Multiples based on Capital IQ consensus estimates.(2) Enterprise Value inclusive of total potential earnout.(3) Multiples based on Wall St. Estimates.
RECENT ACQUISITIONSInternet / Digital Media / SaaS (Cont’d)
($MM)
Announced Date Acquirer Target Enterprise Value EV / LTM Rev. EV / LTM EBITDA EV / NTM Rev. EV / NTM EBITDA
7/18/2018 $133 2.1x 13.1x NA NA
7/16/2018 $800 NA NA NA NA
7/2/2018 $2,300 NA NA NA NA
7/2/2018 $110 4.0x NA NA NA
6/25/2018 $3,547 NA NA NA NA
6/25/2018 $1,600 4.6x NA NA NA
6/21/2018 $1,864 2.5x 12.7x 2.5x 9.8x
6/21/2018 $124 NA NA NA NA
6/18/2018 $2,092 4.8x 10.9x NA NA
6/12/2018 $290 NA NA NA NA
6/11/2018 $1,550 NA NA NA NA
6/4/2018 $850 4.7x NA NA NA
5/21/2018 $1,680 11.2x NA NA NA
(3)
(1)
(1)
(1)
(1) (2)
(3)
B2C Component
(1)
Marketing Solutions Division
13
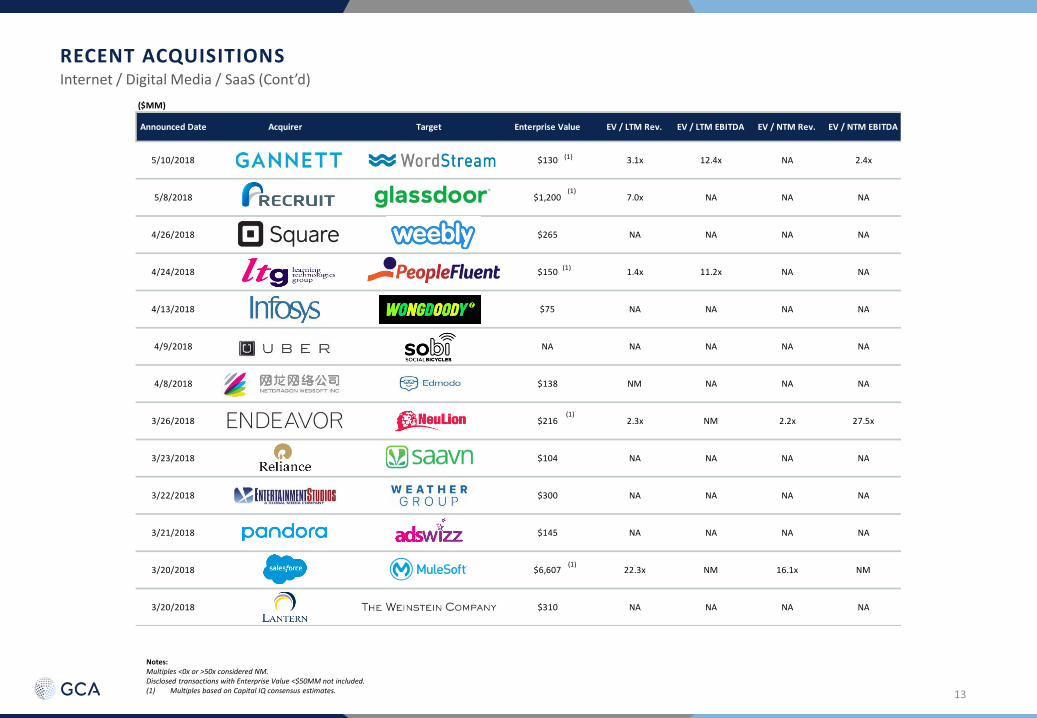
Notes:Multiples <0x or >50x considered NM.Disclosed transactions with Enterprise Value <$50MM not included. (1) Multiples based on Capital IQ consensus estimates.
RECENT ACQUISITIONSInternet / Digital Media / SaaS (Cont’d)
($MM)
Announced Date Acquirer Target Enterprise Value EV / LTM Rev. EV / LTM EBITDA EV / NTM Rev. EV / NTM EBITDA
5/10/2018 $130 3.1x 12.4x NA 2.4x
5/8/2018 $1,200 7.0x NA NA NA
4/26/2018 $265 NA NA NA NA
4/24/2018 $150 1.4x 11.2x NA NA
4/13/2018 $75 NA NA NA NA
4/9/2018 NA NA NA NA NA
4/8/2018 $138 NM NA NA NA
3/26/2018 $216 2.3x NM 2.2x 27.5x
3/23/2018 $104 NA NA NA NA
3/22/2018 $300 NA NA NA NA
3/21/2018 $145 NA NA NA NA
3/20/2018 $6,607 22.3x NM 16.1x NM
3/20/2018 $310 NA NA NA NA
(1)
(1)
(1)
(1)
(1)

14
RECENT ACQUISITIONSInternet / Digital Media / SaaS (Cont’d)
Notes:Multiples <0x or >50x considered NM.Disclosed transactions with Enterprise Value <$50MM not included. (1) Multiples based on Capital IQ consensus estimates.
($MM)
Announced Date Acquirer Target Enterprise Value EV / LTM Rev. EV / LTM EBITDA EV / NTM Rev. EV / NTM EBITDA
2/26/2018 $126 1.5x 9.6x NA NA
2/15/2018 $1,056 9.5x 33.1x 8.6x 20.6x
2/15/2018 $50 16.7x NA NA NA
2/14/2018 $112 NA NA NA NA
2/13/2018 $186 NA NA NA NA
2/7/2018 $65 NA NA NA NA
1/30/2018 $224 NA NA NA NA
1/30/2018 $2,484 9.2x NM NM NM
1/29/2018PR Solutions & DM Services Businesses
$335 NA NA NA NA
1/23/2018 $175 NA NA NA NA
1/10/2018 $90 NA NA NA NA
12/14/2017 $85,743 2.9x 13.3x 2.7x 11.4x
12/13/2017 $550 NA NA NA NA
(1)
(1)
(1)
(1)
(1)

15
RECENT ACQUISITIONSInternet / Digital Media / SaaS (Cont’d)
Notes:Multiples <0x or >50x considered NM.Disclosed transactions with Aggregate Value <$50MM not included.(1) LTM multiples based on period ending 11/28/17.(2) Multiples based on Capital IQ Estimates.(3) Represents acquisition of additional 4% of target for 51% ownership.
($MM)
Announced Date Acquirer Target Enterprise Value EV / LTM Rev. EV / LTM EBITDA EV / NTM Rev. EV / NTM EBITDA
12/7/2017 $90 NA NA NA NA
12/4/2017 $70 NA NA NA NA
11/29/2017 $990 2.2x 11.9x NA NA
11/27/2017 $459 2.2x NM 2.2x 19.8x
11/26/2017 $2,713 1.0x 7.2x 1.1x 7.1x
11/16/2017 $112 NA NA NA NA
11/9/2017 $291 NA NA NA NA
10/31/2017 $93 NA NA NA NA
10/23/2017 $1,913 5.4x NM 4.7x 19.3x
10/17/2017 $200 NA NA NA NA
10/17/2017 $1,019 3.4x 46.0x NA NA
10/8/2017 $820 NA NA NA NA
9/26/2017 $807 NA NA NA NA
(2)
(1)(2)
(3)
(1)
(2)
(2)

16
IPO PIPELINEInternet / Digital Media / SaaS: IPOs in Public Registration
Notes:Source: Capital IQ and SEC.gov.(1) LTM as of 9/11/18.
($MM)
Offering Amounts $10MM or Greater
Primary Initial Initial Offering LTM
Issuer Industry Filing Date Amount Description Revenue EBIT % Adj. EBITDA
Internet Software and Services 09/06/18 $100
Upwork Inc. operates an online platform that
connects businesses and freelancers. Its platform
comprise freelancers in content marketing,
customer service, data science and analytics,
graphic design, mobile development, sales, and web
development categories.
$229 NM NM
Internet Software and Services 09/05/18 $100
Elastic B.V. develops and delivers technology that
enables users to search structured and unstructured
data for a range of consumer and enterprise
applications.
$185 NM NM
Internet Software and Services 08/29/18 $100
SurveyMonkey Inc. develops online survey software
to Fortune 100 companies, other businesses,
academic institutions, organizations, and individuals
worldwide.
$234 NM $59
Internet Software and Services 08/23/18 $210
Eventbrite, Inc. operates as a technology platform
worldwide. Its platform integrates components
needed to plan, promote, and produce live events
that allow creators to reduce friction and costs,
increase reach, and drive ticket sales.
$256 NM NM
(1)
(1)
(1)
(1)

17
VENTURE CAPITAL INDUSTRYTMT: Transactions Since Q2 2003
Notes:(1) Number of TMT VC Investments per PriceWaterhouseCoopers / NVCA MoneyTree report. TMT inclusive of Computers and Peripherals, Electronics / Instrumentation, IT Services, Media and Entertainment, Networking and Equipment,
Semiconductors, Software and Telecommunications until Q3 2016. As of Q4 2016, TMT inclusive of Computer Hardware / Services, Electronics, Internet, Media (Traditional), Mobile / Telecommunications, Risk & Security Systems, and Software.
(1)
0
200
400
600
800
1,000
$0
$2
$4
$6
$8
$10
$12
$14
Q2 2003 Q2 2004 Q2 2005 Q2 2006 Q2 2007 Q2 2008 Q2 2009 Q2 2010 Q2 2011 Q2 2012 Q2 2013 Q2 2014 Q2 2015 Q2 2016 Q2 2017 Q2 2018
Nu
mb
er o
f In
vest
men
ts
$B
n
Quarter - Year
Number of Deals Investment Amount

18
GCA OVERVIEWSelected Recent Internet, Digital Media & SaaS Transactions
Notes:(1) The above transactions represent a compilation of past and current deals that GCA entities, including GCA Advisors, LLC, GCA Corporation and GCA Altium, have advised on.
Acquisition of Financing Acquired by Acquired by Acquired by Acquired by Acquired by Acquired by Acquisition of
Series C
We Advised the Buyer Financial Advisor We Advised the Seller We Advised the Seller We Advised the Seller We Advised the Seller We Advised the Seller We Advised the Seller We Advised the Buyer
Acquired by Financing Acquired by Acquired by Strategic Investment Acquired By Acquired By Sale of Controlling Preferred Stock
Series C from Interest to
We Advised the Seller Financial Advisor We Advised the Seller We Advised the Seller We Advised the Seller We Advised the Seller We Advised the Seller We Advised the Seller Financial Advisor
Divestiture of
Acquired by Acquired by Acquired by Acquired by Acquired by Preferred Stock Equity Investment Acquisition of
to
We Advised the Seller We Advised the Seller We Advised the Seller We Advised the Seller We Advised the Seller We Advised the Seller Financial Advisor Financial Advisor We Advised the Buyer
Strategic Alternatives Preferred Stock Acquired by Acquired by Acquired by Acquired by Preferred Stock Preferred Stock Acquired by
& Capital Allocation
UndisclosedConsortium Led by
Strategic Advisor Financial Advisor We Advised the Seller We Advised the Seller We Advised the Seller We Advised the Seller Financial Advisor Financial Advisor We Advised the Seller
Sale of
Acquired by Acquired by Acquired by Acquired by Acquired by Acquired by Acquired by Acquired by
to
A subsidiary of
We Advised the Seller We Advised the Seller We Advised the Seller We Advised the Seller We Advised the Seller We Advised the Seller We Advised the Seller We Advised the Seller We Advised the Seller