Developmental Cis-Regulatory Analysis of the Cyclin D Gene ...
164
e University of Maine DigitalCommons@UMaine Electronic eses and Dissertations Fogler Library 8-2014 Developmental Cis-Regulatory Analysis of the Cyclin D Gene in the Sea Urchin Strongylocentrotus purpuratus Christopher Michael McCarty Follow this and additional works at: hp://digitalcommons.library.umaine.edu/etd Part of the Cell and Developmental Biology Commons is Open-Access Dissertation is brought to you for free and open access by DigitalCommons@UMaine. It has been accepted for inclusion in Electronic eses and Dissertations by an authorized administrator of DigitalCommons@UMaine. Recommended Citation McCarty, Christopher Michael, "Developmental Cis-Regulatory Analysis of the Cyclin D Gene in the Sea Urchin Strongylocentrotus purpuratus" (2014). Electronic eses and Dissertations. 2189. hp://digitalcommons.library.umaine.edu/etd/2189
Transcript of Developmental Cis-Regulatory Analysis of the Cyclin D Gene ...

The University of MaineDigitalCommons@UMaine
Electronic Theses and Dissertations Fogler Library
8-2014
Developmental Cis-Regulatory Analysis of theCyclin D Gene in the Sea UrchinStrongylocentrotus purpuratusChristopher Michael McCarty
Follow this and additional works at: http://digitalcommons.library.umaine.edu/etd
Part of the Cell and Developmental Biology Commons
This Open-Access Dissertation is brought to you for free and open access by DigitalCommons@UMaine. It has been accepted for inclusion inElectronic Theses and Dissertations by an authorized administrator of DigitalCommons@UMaine.
Recommended CitationMcCarty, Christopher Michael, "Developmental Cis-Regulatory Analysis of the Cyclin D Gene in the Sea Urchin Strongylocentrotuspurpuratus" (2014). Electronic Theses and Dissertations. 2189.http://digitalcommons.library.umaine.edu/etd/2189

DEVELOPMENTAL CIS-REGULATORY ANALYSIS OF THE CYCLIN D
GENE IN THE SEA URCHIN, STRONGYLOCENTROTUS PURPURATUS
By
Christopher Michael McCarty
B.S. The University of Maine, 1997
M.S. The University of Maine, 2000
A DISSERTATION
Submitted in Partial Fulfillment of the
Requirements for the Degree of
Doctor of Philosophy
(in Biomedical Sciences)
The Graduate School
The University of Maine
August 2014
Advisory Committee:
James Coffman, Associate Professor, Mount Desert Island Biological
Laboratory, Advisor
Carol Bult, Professor, The Jackson Laboratory
Thomas Gridley, Senior Scientist, Maine Medical Center Research Institute
Robert Gundersen, Associate Professor, The University of Maine
Antonio Planchart, Assistant Professor, North Carolina State University
ii
DISSERTATION ACCEPTANCE STATEMENT
On behalf of the Graduate Committee for Christopher M. McCarty I affirm that
this manuscript is the final and accepted dissertation. Signatures of all committee
members are on file with the Graduate School at the University of Maine, 42 Stodder
Hall, Orono, Maine.
James A. Coffman 8/15/14
Dr. James A. Coffman, Associate Professor <Date>

LIBRARY RIGHTS STATEMENT
In presenting this dissertation in partial fulfillment of the requirements for an
advanced degree at The University of Maine, I agree that the Library shall make it freely
available for inspection. I further agree that permission for “fair use” copying of this
dissertation for scholarly purposes may be granted by the Librarian. It is understood that
any copying or publication of this dissertation for financial gain shall not be allowed
without my written permission.
Signature: Christopher M. McCarty
Date: 8/15/14
DEVELOPMENTAL CIS-REGULATORY ANALYSIS OF THE CYCLIN D
GENE IN THE SEA URCHIN STRONGYLOCENTROTUS PURPURATUS
By Christopher M. McCarty
Dissertation Advisor: Dr. James A. Coffman
An Abstract of the Dissertation Presented
in Partial Fulfillment of the Requirements for the
Degree of Doctor of Philosophy
(in Biomedical Sciences)
August 2014
Proper execution of animal development requires that it be integrated with cell
division. In part, this is made possible due to cell cycle regulatory genes becoming
dependent upon developmental signaling pathways that regulate their transcription.
Cyclin D genes are important bridges linking the regulation of the cell cycle to
development because these genes regulate the cell cycle, growth and differentiation in
response to intercellular signaling. In this dissertation, a cis-regulatory analysis of a
cyclin D gene, Sp-CycD, in the sea urchin, Strongylocentrotus purpuratus, is presented.
While the promoters of vertebrate cyclin D genes have been analyzed, the cis-regulatory
sequences across an entire cyclin D locus that regulate its expression pattern have not.
From conducting the cis-regulatory analysis of Sp-CycD, regulatory regions
located within six defined regions were identified. Two of these regions were found
upstream of the start of transcription, but the remaining regions were found within
introns. Regarding their activity patterns, two intronic regions were most strongly active
at the time of induction of Sp-CycD expression, implying they contributed to this
induction. The activity patterns of other regions indicated that each could have distinct

roles, including controlling and maintaining Sp-CycD expression as it becomes spatially
restricted during and after gastrulation.
The sequences of the regulatory regions were analyzed. In three regions
subregions containing the cis-regulatory modules responsible for activity were found, and
in two other regions, sequences that lacked activating regulatory activity were found,
allowing the identities of active regulatory sequences to be inferred. The sequences of
each region were further analyzed for bearing significantly represented potential binding
sites for transcription factors expressed in developmental lineages of the embryo where
Sp-CycD is expressed. The transcription factors included those that act downstream of
Wnt-beta catenin and Delta-Notch signaling pathways that induce the development of the
endoderm and mesoderm; and those expressed within the Gene Regulatory Networks that
contribute to the development of these lineages. From this, testable linkages between
these binding sites and transcription factors that could regulate the expression of Sp-CycD
as development progresses were identified, providing the foundation for future work.
iii
ACKNOWLEDGEMENTS
First, I am grateful for the help of my advisor Dr. James Coffman, whose advice
and careful guidance through numerous drafts, despite his other obligations, resulted in a
published paper and in this completed dissertation. Without this help, these documents
would have been of much lesser quality. Likewise, I thank the members of my PhD
committee, including Drs. Carol Bult, Thomas Gridley, Robert Gundersen and Antonio
Planchart. They provided encouragement and advice as I progressed through this
program. Specific individuals contributed to the research. Christine Smith of the Mt.
Desert Island Biological Lab was responsible for sequencing of all the reporter constructs
described in this dissertation, and also provided technical help. The 13-tag reporters
described in Chapter 2 were freely provided by Dr. Jongmin Nam, then of the Davidson
lab at CalTech. Dr. Nam also provided instructions for how to utilize these reporters. Dr.
R. Andrew Cameron of the Davidson lab provided guidance on how to use SpBase to
find specific sequences of interest, and Julie Hahn of CalTech provided the Sp-CycD
BAC described in Chapter 2. Sea urchins were provided by Pete Halmay and Pat Leahy.
Former lab mates Alison Coluccio and Dr. Anthony Robertson are thanked for providing
technical support and advice. I also would like to thank the Mt. Desert Island Biological
Laboratory and Maine INBRE for providing funding support for this study. I am also
grateful to the Graduate School of Biomedical Sciences and Engineering, and, fellow
students within it, especially those who provided great encouragement as I prepared for
my defense. In addition, I am indebted to my family, including my parents, grandparents,
aunt and brother. They provided an underlying motivation for undertaking this project.
iv
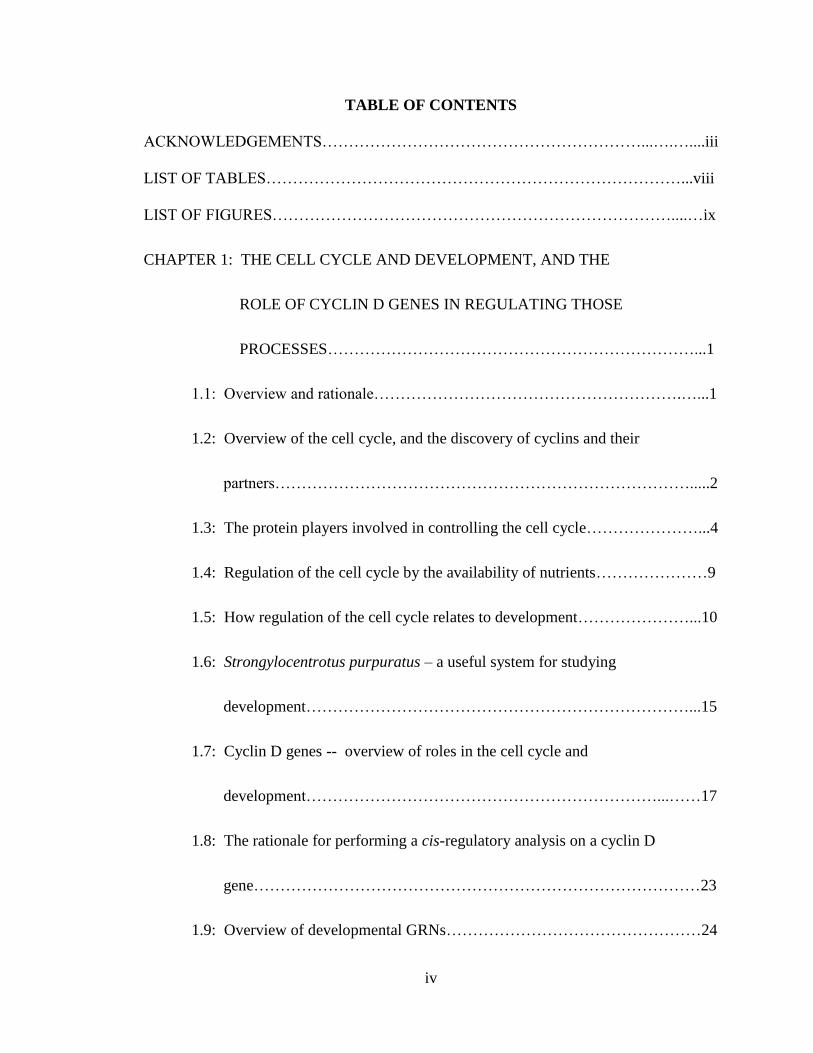
TABLE OF CONTENTS
ACKNOWLEDGEMENTS……………………………………………………...….…....iii
LIST OF TABLES……………………………………………………………………...viii
LIST OF FIGURES…………………………………………………………………....…ix
CHAPTER 1: THE CELL CYCLE AND DEVELOPMENT, AND THE
ROLE OF CYCLIN D GENES IN REGULATING THOSE
PROCESSES……………………………………………………………...1
1.1: Overview and rationale………………………………………………….…...1
1.2: Overview of the cell cycle, and the discovery of cyclins and their
partners…………………………………………………………………….....2
1.3: The protein players involved in controlling the cell cycle…………………...4
1.4: Regulation of the cell cycle by the availability of nutrients…………………9
1.5: How regulation of the cell cycle relates to development…………………...10
1.6: Strongylocentrotus purpuratus – a useful system for studying
development………………………………………………………………...15
1.7: Cyclin D genes -- overview of roles in the cell cycle and
development…………………………………………………………...……17
1.8: The rationale for performing a cis-regulatory analysis on a cyclin D
gene…………………………………………………………………………23
1.9: Overview of developmental GRNs…………………………………………24
v
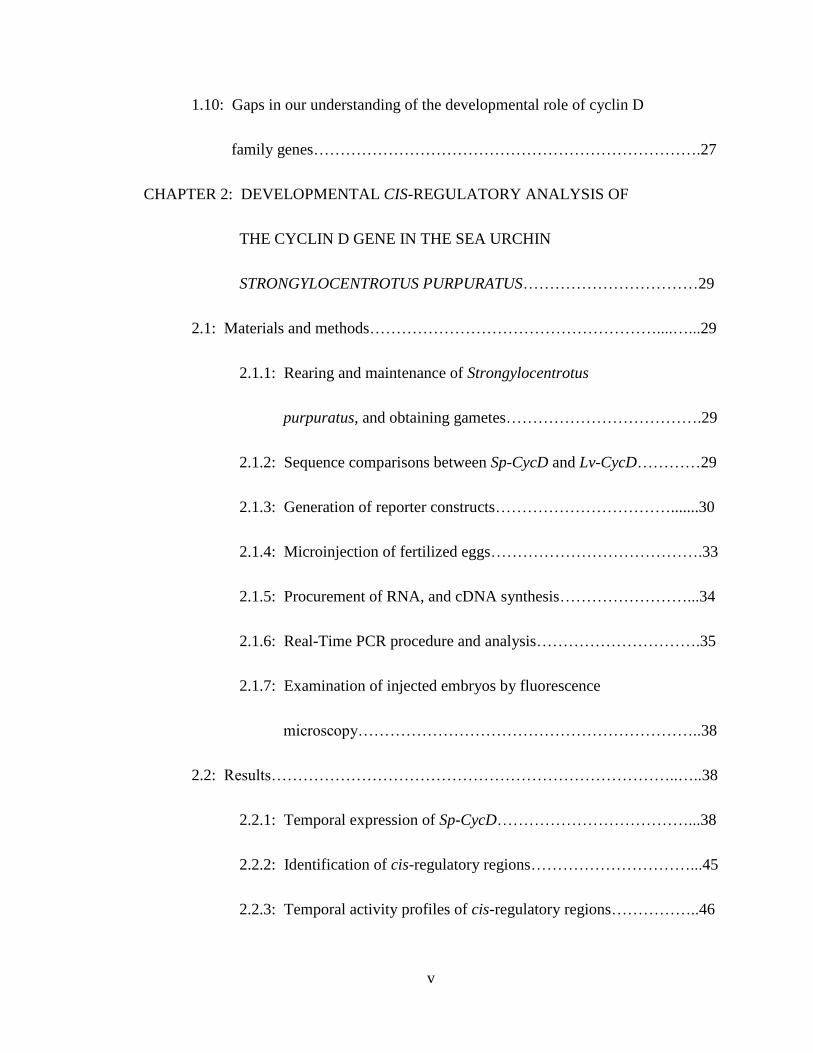
1.10: Gaps in our understanding of the developmental role of cyclin D
family genes……………………………………………………………….27
CHAPTER 2: DEVELOPMENTAL CIS-REGULATORY ANALYSIS OF
THE CYCLIN D GENE IN THE SEA URCHIN
STRONGYLOCENTROTUS PURPURATUS……………………………29
2.1: Materials and methods………………………………………………....…...29
2.1.1: Rearing and maintenance of Strongylocentrotus
purpuratus, and obtaining gametes……………………………….29
2.1.2: Sequence comparisons between Sp-CycD and Lv-CycD…………29
2.1.3: Generation of reporter constructs…………………………….......30
2.1.4: Microinjection of fertilized eggs………………………………….33
2.1.5: Procurement of RNA, and cDNA synthesis……………………...34
2.1.6: Real-Time PCR procedure and analysis………………………….35
2.1.7: Examination of injected embryos by fluorescence
microscopy………………………………………………………..38
2.2: Results…………………………………………………………………..…..38
2.2.1: Temporal expression of Sp-CycD………………………………...38
2.2.2: Identification of cis-regulatory regions…………………………...45
2.2.3: Temporal activity profiles of cis-regulatory regions……………..46
vi
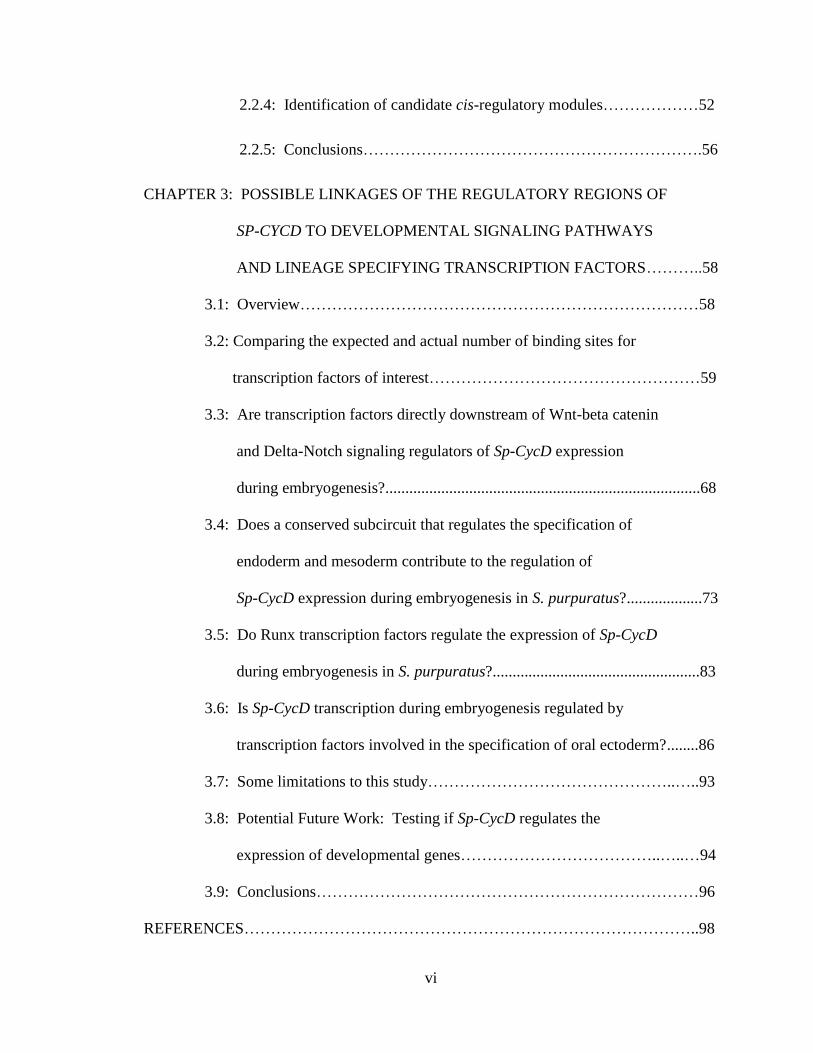
2.2.4: Identification of candidate cis-regulatory modules………………52
2.2.5: Conclusions……………………………………………………….56
CHAPTER 3: POSSIBLE LINKAGES OF THE REGULATORY REGIONS OF
SP-CYCD TO DEVELOPMENTAL SIGNALING PATHWAYS
AND LINEAGE SPECIFYING TRANSCRIPTION FACTORS………..58
3.1: Overview…………………………………………………………………58
3.2: Comparing the expected and actual number of binding sites for
transcription factors of interest……………………………………………59
3.3: Are transcription factors directly downstream of Wnt-beta catenin
and Delta-Notch signaling regulators of Sp-CycD expression
during embryogenesis?...............................................................................68
3.4: Does a conserved subcircuit that regulates the specification of
endoderm and mesoderm contribute to the regulation of
Sp-CycD expression during embryogenesis in S. purpuratus?...................73
3.5: Do Runx transcription factors regulate the expression of Sp-CycD
during embryogenesis in S. purpuratus?....................................................83
3.6: Is Sp-CycD transcription during embryogenesis regulated by
transcription factors involved in the specification of oral ectoderm?........86
3.7: Some limitations to this study………………………………………..…..93
3.8: Potential Future Work: Testing if Sp-CycD regulates the
expression of developmental genes………………………………..…..…94
3.9: Conclusions………………………………………………………………96
REFERENCES…………………………………………………………………………..98

vii
APPENDIX A. LIST OF GENES REFERENCED…………………………………….113
APPENDIX B. PRIMER SEQUENCES……………………………………………….117
APPENDIX C. LISTING OF REGULATORY REGIONS TESTED AND THE
13-TAG REPORTER TO WHICH EACH WAS LINKED…………...129
APPENDIX D. SEQUENCE DETAILS OF ACTIVE REGULATORY
REGIONS…………………………………………………………….130
APPENDIX E. CLUSTER-BUSTER OUTPUT FOR REGIONS 5, 6 AND 19………140
APPENDIX F. EXCEL FILE SHOWING GOODNESS OF FIT
CALUCLATIONS………………………………………......SEPARATE
viii
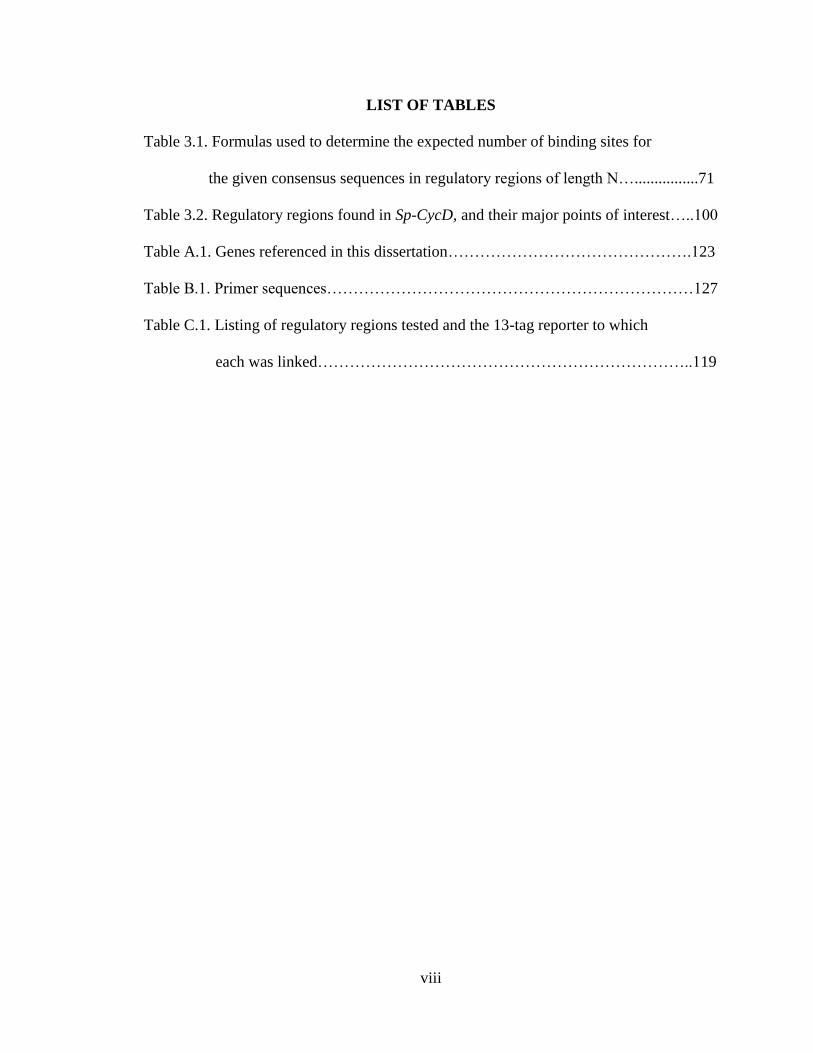
LIST OF TABLES
Table 3.1. Formulas used to determine the expected number of binding sites for
the given consensus sequences in regulatory regions of length N…................71
Table 3.2. Regulatory regions found in Sp-CycD, and their major points of interest…..100
Table A.1. Genes referenced in this dissertation……………………………………….123
Table B.1. Primer sequences……………………………………………………………127
Table C.1. Listing of regulatory regions tested and the 13-tag reporter to which
each was linked……………………………………………………………..119
ix
LIST OF FIGURES
Fig. 2.1. Endogenous Sp-CycD expression from different embryo cultures,
as determined by quantitative RT-PCR………………………………………...39
Fig. 2.2. Expression of endogenous Sp-CycD and microinjected mcherry-
linked BAC bearing Sp-CycD plus 90 kb and 13 kb of up and
downstream sequence…………………………………………………………..40
Fig. 2.3. Identifying cis-regulatory sequences……………………………………….…42
Fig. 2.4. Results of additional experiments showing the activities of tested regions……43
Fig. 2.5. Comparison of the temporal activities of regulatory regions of Sp-CycD,
with the results of individual experiments for the temporal activity of
each region shown…………………………………………………………...…47
Fig. 2.6. Averaged temporal activity profiles……………………………………………48
Fig. 2.7. Testing for variations in activity attributed to differences between 13-tag
reporters at 12 hpf……………………………………………………………...51
Fig. 2.8. Identification of cis-regulatory modules………………………………………..53
Fig. 2.9. Comparison of the temporal activities of region 2 and subregion 2-2
when linked to the reporter vector EpGFPII……………………………….…..54
Fig. 3.1. Number of potential binding sites in regions and subregions of Sp-CycD
for selected transcription factors discussed in the text……………………….....64
Fig. 3.2. Expression profiles of selected transcription factors discussed in the text…..…67
Fig. 3.3. The GRN subcircuit specifying endomesoderm in sea urchin and sea star….....75
Figure D.1. Sequence details of active regulatory regions of Sp-CycD………………..120

x
Fig. E.1. Cluster Buster output for regions 5 (panel A), 6 (panel B) and 19
(panel C)……………………………………………………………...……….130
Fig. F.1. Excel file showing Goodness of Fit calculations………………….....…POCKET
1
CHAPTER 1:
THE CELL CYCLE AND DEVELOPMENT, AND THE ROLE OF CYCLIN D
GENES IN REGULATING THOSE PROCESSES
1.1 Overview and rationale
This dissertation describes a cis-regulatory analysis of the cyclin D gene, Sp-
CycD, in the sea urchin, Strongylocentrotus purpuratus. Genes of the cyclin D family,
which are primarily regulated at the level of transcription [1], are important contributing
regulators of both the cell cycle and development. Despite this, to date, no cyclin D gene
has been subjected to a comprehensive cis-regulatory analysis to identify the regulatory
sequences within its locus that allow the gene to transcriptionally respond to
developmental signals. As a result of the cis-regulatory analysis of Sp-CycD, cis-
regulatory regions were identified in discreet regions found both upstream of the start of
transcription, but also, intronically. Because, as will become apparent below, cyclin D
family genes function within the context of both the cell cycle and development, before
describing the results of the cis-regulatory analysis in more detail, an overview of the cell
cycle, its link to development, and the role of cyclin D family genes in these processes is
given.
Please note: A number of genes are introduced in this dissertation. Generally, within the
main text, the most common names are given. For official names and Gene Identification
numbers, provided by NCBI Gene [2] for all genes except for those derived from the sea
urchin, Strongylocentrotus purpuratus; or by SpBase [3] for genes described in S.
purpuratus, see Appendix A, Table A.1.
2
1.2 Overview of the cell cycle, and the discovery of cyclins and their partners
In animal development, cells become integrated into a cooperative community.
To do this, cells must successfully reproduce themselves, and they must do so in
relationship to their neighbors. At the heart of this process is the cell cycle – the means
by which cells reproduce themselves. The cell cycle involves a large number of
molecular players. The first group consists of the group of proteins, such as DNA
helicases, polymerases, topoisomerases and associated factors that replicate the cell’s
DNA, along with the histone proteins, acetylases and deacetylases, that regulate the
disassembly and assembly of DNA into chromatin and chromosomes, which must be
mitotically segregated into daughter cells following replication of the DNA. However,
this multitude of proteins must be set into motion in a coordinated manner, and groups of
them must also silenced after cells have been replicated and further replication is either
permanently, or temporarily not needed. The involved players were discovered over
many years [4], and will be introduced as this Introduction proceeds.
Important regulatory drivers of the cell cycle are a family of proteins known as
cyclins. The first cyclins were discovered in the sea urchin, Lytechinus pictus by the Hunt
group, working at the Marine Biological Laboratory, who labeled proteins from fertilized
eggs with [35
S]methionine, ran the proteins on an SDS gel, and discovered a protein in
early cleaving embryos that abruptly was destroyed before each cleavage, then appeared
again, in a cyclical manner [5, 6]. Proteins showing this periodic behavior were likewise
discovered in clam [5, 6]. Due to its cyclical synthesis and destruction coinciding with
the beginning and end of each cell cycle, this protein was called “cyclin”[5, 6] This
cyclin, later termed cyclin B, is a member of a larger family of cyclin proteins [1]. The
3
Hunt group hypothesized but did not prove that the cyclin protein they had discovered
played a role in regulating the cell cycle; their evidence was purely correlative.
Ruderman and colleagues [7] provided direct evidence that a cyclin protein in clams,
cyclin A, when injected into G2/M arrested oocytes, could induce M phase. Since that
time, other cyclins were discovered, found to be expressed in all eukaryotes, from yeast
to mammals, and together with a network of other proteins with which they interact,
found to be fundamental players in the eukaryotic cell cycle [1, 8]. How could cyclins
regulate the cell cycle? In part, cyclins were found to accomplish this by interacting with
and activating cyclin-dependent kinases (CDKs), the first characterized of which, cyclin-
dependent kinase 2 was discovered in yeast [9]. In each case, the interaction between
each cyclin protein and its CDK partner is mediated by a 100 amino acid “cyclin box”
within each cyclin protein. This interaction requires the presence on the CDK of the
amino acid motif PSTAIR [1]. The CDKs are serine/threonine protein kinases. There are
a number of different CDKs, each of which is involved in phosphorylating specific
substrate proteins to allow specific stages of the cell cycle to proceed. For example,
CDK4 and 6 phosphorylate the retinoblastoma (RB) protein, which acts as a cell cycle
inhibitor in the absence of such phosphorylation. In the presence of such
phosphorylation, RB releases E2F transcription factors needed for the progression of S
phase [1].
4
1.3 The protein players involved in controlling the cell cycle
A transition is now made to listing and giving some of the functions of the
network of proteins that drive the cell cycle, focusing first on members of the cyclin
family, the proteins with which they directly interact, and the stages of the cell cycle that
are set in motion by those interactions. As will become evident below, it has been shown
that specific stages of the cell cycle are associated with the activities of specific members
of the cyclin and CDK families. However, it should be noted that recent work by
Coudreuse and Nurse [10] showed that in fusion yeast, it is possible to engineer a single
CDK to drive the entire cell cycle in this organism, without the need for the input from
any cyclins, despite the fact that this organism possesses at least 4 different cyclins. This
relates to the fact that the seemingly unique roles of specific cyclin-CDK complexes may
in part be due not to intrinsic properties of the complexes themselves, but due to where
they are localized within a cell [1].
Herein, a simplified overview of how the cell cycle is set in motion by
extracellular signals [1, 8, 11, 12] is presented. An important caveat is that many of the
experimental findings upon which this overview is based are derived from work on
cultured cells, especially mammalian cells [12] rather than from developing organisms.
As this Introduction proceeds, how the cell cycle is linked to the gene regulatory
networks within a whole developing organism will be described, but first, the discussion
of the cell cycle overview begun above will be finished. In a cell cycle permissive
signaling environment, combinations of developmental signaling pathways converge to
activate transcription of cyclin D gene(s). Cyclin D family genes are indeed important
integrators of multiple developmental signaling pathways and their associated
5
downstream activated transcription factors [13]. Due to this, cyclin D family genes have
been called “signal sensors” that couple signals received by cells to progression from G1
to S phase of the cell cycle [14], and this characterization relates to findings pertaining to
their discovery. Cyclin D genes were first characterized by the Sherr group [15],
although the newly identified cyclins were not yet given the designation “cyclin D” at the
time of this characterization. The newly identified cyclins, originally named p36CYL
,
based on their size of 36 kd, were required for mouse macrophages to overcome G1 and
enter S phase in response to the growth factor Colony-Stimulating Factor 1, but, after
this, were no longer required for the cells to complete the cell cycle, their protein levels
falling during S phase to a low after mitosis. In the absence of such stimulation, the cells
never entered S phase, and died. Subsequent work provided support for the role of
cyclin D genes as the “signal sensors” that couple signals received by cells to progression
from G1 to S phase of the cell cycle [14].
Cyclin D family genes may also actively prevent the cell cycle from proceeding
forward under appropriate conditions. This is based on work by Kozar et al [16]. These
authors obtained fibroblasts from day 13.5 C57BL/6 mouse embryos in which all three
mammalian cyclin D genes, Ccnd1, Ccnd2 and Ccnd3, had been knocked out. As a
control, fibroblasts from littermate controls were used. When both groups of fibroblasts
were transfected with retrovirus encoding the cell cycle inhibitor P16ink4a, the
proliferation of control cells was inhibited, as expected. However, the inhibition of
proliferation by this cell cycle inhibitor was almost completely prevented in the cyclin D-
null fibroblasts.
6
An explanation of how the cell cycle is driven forward will now be presented.
Cyclin D mRNA levels are low in the absence of inducing signals, and, in addition,
cyclin D proteins are unstable, exhibiting half lives of about 20 minutes [1]. The
instability of cyclin D proteins is due in part to the presence of C-terminal PEST
sequences, which signal for these proteins to be destroyed by ubiquitination [1]. Once
transcribed and translated, cyclin D proteins bind to and activate serine/threonine protein
kinases, termed cyclin-dependent kinases (CDKs), such as CDKs 4 and 6. CDK4 and
CDK6 phosphorylate proteins of the RB family. The path to discovery of the first
described gene of this family, RB, was begun in 1971 by Knudson [17], who discussed
how retinoblastoma tumors of the eye were brought about in patients who had inherited a
mutated version of a gene. This one mutant copy could not by itself elicit cancer, but if
the second copy became mutated somatically, retinoblastoma tumors would result.
Ultimately, the RB gene was cloned by Friend et al. in 1986 [18].
Proteins of the RB family are termed “pocket proteins” [19, 20], because they
share a conserved “pocket domain” which binds to target proteins that bear the motif
LXCXE [21]. Besides RB, the family also contains the proteins P107 and P130 [22] .
All three of these proteins play primarily inhibitory functions at the gene promoters that
are regulated by the E2F transcription factor family, with P107 and P130 acting as a
complex at such promoters [22]. There is also evidence that RB and P107 + P130 differ
in terms of the E2F target genes they regulate. This was shown in 1997 by Hurford et al
[23]. These authors demonstrated that deletion of either Rb, or both P107 + P130 (but not
either of the latter singly) in mice led to either the upregulation or downregulation of
different cell cycle regulatory genes in cell cultures derived from these mice. For
7
example, the cell cycle regulators B-MYB, CDK2, and E2F1, and cyclin A2 were de-
repressed by deletion of P107 + P130, whereas cyclin E was derepressed by deletion of
Rb. Another way that proteins of the RB family carry out their regulatory function is by,
in their hypo-phosphorylated state, recruiting transcriptional repressors, such as histone
deacetylases to the promoters of E2F-regulated genes [21, 24, 25].
As introduced above, the activity of cyclin-CDK and RB family proteins regulates
the transcription of genes in part by regulating the interaction of proteins of the E2F
family with these genes’ promoters. The E2F genes have multiple family members,
which regulate the transcription of different genes. They carry out their transcriptional
regulation through forming heterodimers with proteins termed DP proteins. By carrying
out this transcriptional regulation, E2F family genes can affect cell proliferation, and also
developmental fate (reviewed in [26]). The target genes of E2F family genes have been
queried by genome wide analysis of binding sites [27, 28] . This has shown that E2F
family genes regulate a variety of genes, including those involved in the regulation of
chromatin, DNA replication, DNA repair, the cell cycle, and development. The fact that
E2F family genes undertake such diverse processes is of relation to cyclin D family
genes, which, as described later in this Chapter, regulate developmental processes as well
as the cell cycle.
Among the genes that are transcribed by activated E2F transcription factors is a
second group of cyclins, of which focus is made on cyclins of the cyclin E family [12].
Cyclin E proteins interact with CDK2 family proteins, leading to their activation. This
has at least two consequences. First, the cyclin E-CDK2 complexes further
phosphorylate RB family proteins, which have already been phosphorylated by cyclin D-
8
CDK4. Therefore, the actions of signal-sensing cyclin D-CDK4 ultimately set in motion
a positive feedback loop that contributes to making a single cell cycle irreversible.
Because of this, the state through which cells pass to reach this irreversible status is
known as the “restriction point.” However, because each subsequent cell cycle includes
another G1 stage, these subsequent cell cycles depend on the continued presence of
induction signals, in the absence of which, these cycles will cease [12, 14, 29].
Continuing with the discussion of the activation of cyclin E-CDK2 complexes and its
relationship to cell cycle progression, the second consequence of the activation of cyclin
E-CDK2 complexes is the activation by phosphorylation of various transcription factors,
which ultimately leads to the transcription of genes critical for progression through the
cell cycle. These include genes necessary for DNA synthesis, along with those needed
for mitosis [4, 12].
It is in part through the above mechanisms that cells progress from the first gap
phase, G1, to the DNA synthesis stage, S, of the cell cycle. After this, if conditions are
favorable, cells will then prepare for and undergo mitosis, as described herein [8, 12].
The commencement of mitosis is brought about through passage through another
restriction point, the G2-M phase. Key players involved in this progression include the A
type cyclins, which associate with CDK1 and CDK2, and are active first, followed by the
B type cyclins, which become active as the A type cyclins are ubiquitinated and
degraded. At least 70 proteins involved in mitosis are phosphorylated through cyclin B-
induced CDK activity. Another of several important players includes CDC25
phosphatase proteins. The role of these proteins only becomes clear in light of the fact
that not all phosphorylation events that occur during the cell cycle are activating; some
9
are inhibitory, and these inhibitory phosphorylations relate to the negative regulation of
the cell cycle, discussed further below. These inhibitory phosphorylations are carried out
by kinases of the WEE and MYT families [8, 12]. These inhibitory phosphorylations,
which act as another safeguard gate to prevent the cell cycle from proceeding
inappropriately, occur on cyclin-dependent kinases involved in both the G1 to S phase
and G2 to M phase of the cell cycle. Proteins of the CDC25 phosphatase family act as
positive regulators of the cell cycle by removing these inhibitory phosphates, thus
allowing the cell cycle to proceed. After the completion of mitosis, cells face another
decision, to either continue cycling or to enter a resting stage termed G0 [8, 12]. Cycling
cells may enter G0 for a number of reasons, of which focus is given to developmental
ones. Cells may find themselves at a stage of development where they must differentiate,
a process often referred to as terminal differentiation. An important theme arises with
respect to this fact: development and the cell cycle must somehow be linked in order for
cells to behave in a manner that relates to their temporal and spatial position within a
developing organism. As signal-responsive cyclins that play a role in the decision of
cells to cycle or not to cycle in response to extracellular signals, cyclin D genes play
important contributory roles in this process. Further expansion on the relationship of the
cell cycle to development is described in the section of this Introduction, “How regulation
of the cell cycle relates to development.”
1.4 Regulation of the cell cycle by the availability of nutrients
Besides being regulated by developmental signaling pathways, the cell cycle is
also regulated by the availability of nutrients. An important pathway that cells use to
couple the availability or lack of nutrients, along with the presence of growth factors to
10
the decision about whether to proceed with the cell cycle is the mTOR pathway [30]. It
has been shown that this pathway exerts its effect, at least in part, by regulation of the
cyclin D1 gene (in a human cell line), both at the level of transcription [31], and also by
controlling the levels of both cyclin D1 mRNA and cyclin D1 protein (in a 3T3 mouse
cell line). It should be noted that animal cells are not unique in becoming dependent on
extrinsic cues for their cell cycles to proceed. For example, in the plant Arabidopsis,
evidence suggests that cyclin D type genes couple development from juvenile to adult
plant by the availability of sugar [32]. Polymenis and Schmidt showed that in the
unicellular yeasts, the cyclin protein involved in the G1 to S phase transition, CLN3, is
translationally regulated by a 5’ sequence in its mRNA that senses the level of translation
in the yeast [33]. The theme that arises from these observations is that the eukaryotic cell
cycle is not solely autonomous – its passage is coupled to the availability of nutrients
and/or developmental signals, depending on the the identity of the organism in which the
cell cycle is taking place. The next section explores this theme further – by describing
how the the cell cycle and development are related
1.5 How regulation of the cell cycle relates to development
Up until now, most of the discussion has focused on how the cell cycle is driven
forward. However, in order to better understand how the cell cycle is linked to
development, it is critical to understand how the cell cycle can be negatively regulated [8,
34, 35]. Both driving the cell cycle forward and inhibition of the cell cycle must be
properly coordinated with an organism’s developmental status. This importance will
become evident as some of the mechanisms for inhibiting the cell cycle are discussed.
11
In acting as cell cycle inhibitors, proteins of the RB family play important roles in
allowing cells to differentiate [21]. For example, RB contributes to the differentiation of
adipocytes by at least two mechanisms. First, in line with its aforementioned role, RB,
inhibits cell cycle in adipocytes in part by inhibiting cell cycle promoting transcription
factors, such as those of the E2F family. In concert with this, RB family proteins induce
differentiation in this system by activating the differentiation promoting transcription
factor C/EBPα, thus exhibiting a transcriptional activation as well as inhibitory role.
Results from work in knockout strains of mice demonstrate that members of the
Rb family are needed for normal development, due in part to the necessity for their cell
cycle inhibitory and differentiation-inducing properties. This is shown by the fact that
knockout of these genes in mice is embryonic lethal, due to defects in the erythrocyte
lineage and over-cell proliferation in the liver [20]. Of interest, cyclin D triple knockout
C57BL/6 mice likewise die in utero, but due to under-production of hematopoietic cells
rather than due to over-production [16]. This is not surprising given that, as explained
above, RB family proteins function downstream of signal-activated cyclin D proteins
[14].
The relationship between cyclin D, cyclin E and E2F is likely not simply linear.
This was shown through work in Drosophila by Buttitta et al [36]. Given that E2F acts
downstream of cyclin D-CDK4 and cyclin E-CDK2, a reasonable hypothesis would be
that simply activating E2F, irrespective of either cyclin D or cyclin E, could prevent cells
from exiting the cell cycle. However, these authors showed that, at least in Drosophila, it
is necessary to activate both E2F, plus either cyclin D or cyclin E to prevent cells from
exiting the cell cycle before completing differentiation.
12
Given that cells exit the cell cycle and enter G0 when they differentiate, it might
be hypothesized that the states of cycling through the cell cycle and differentiation are
mutually exclusive. Is this a developmental rule? Related to this question, Korzelius et
al. showed that in C. elegans, artificially activating cyclin D-CDK4 or cyclin E-CDK2
could cause differentiated muscle cells enter S phase or mitosis, respectively [37]. In a
related study, Sage et al. [38] showed that targeted deletion of Rb genes in mammalian
hair cells of the ear causes those cells to undergo the cell cycle but still maintain
functions such as the abilities to respond to mechanosensation and express at least some
markers of differentiation. Similarly, Ajioka et al.[39] characterized, in vivo,
differentiated interneurons in mice (strain not provided) lacking two of the Rb family
members, Rb and P130, but not P107. These authors found that after several weeks,
differentiated interneurons bearing this genotype would re-enter the cell cycle. However,
these cells maintained various phenotypes of differentiation, such as the ability to form
neurites and synapses. Whether these interneurons were fully differentiated was not
clear, because the authors did not compare the gene expression pattern of these
interneurons to differentiated interneurons in wildtype mice.
These findings relate to another aspect of the cell cycle– that it can be modulated
during development, as the two processes are linked [40]. During the earliest cleavage
stages in vertebrates and sea urchins, the fertilized egg divides a number of times in
preparation for subsequent rearrangements that begin with gastrulation. These earliest
cell divisions are driven by maternal factors that are stored in the egg cytoplasm [41, 42].
During these earliest divisions, the cell cycle is essentially intrinsic, moving forward
13
without the cues of extracellular signals. At this stage, the cell cycle consists of just two
phases, S, where the DNA is synthesized, followed rapidly by M, mitosis.
However, even during these earliest divisions in animals, cells are not found
within a developmental void: their position within the developing embryo will dictate
their eventual developmental fate. For example, in the sea urchin, cells that will become
various developmental lineages are formed in distinct parts of the cleaving embryo [42,
43]. This is due to exposure of the cells in different embryonic territories, initially, to
maternally stored factors that will subsequently set in motion specific developmental
programs for each uniquely located group of cells [41, 43]. Maternal factors also include
mRNAs that encode cyclins A and B, which can play a role in the transition from S to M
phase by activating cyclin A and B dependent kinases [41].
There then arrives an important transition termed the maternal to zygotic
transition [44]. At this stage, two critical events occur to set the developing embryo on
its independent trajectory. First, maternal regulators of the cell cycle are degraded.
Second, transcription of the embryo’s own genes that regulate the cell cycle and
development is commenced. Degradation of maternal RNAs is triggered by the
presence of sequences within the maternal RNAs that signal for the binding of factors,
such as enzymes that remove the polyA tails. Maternal RNAs with different functions
are degraded at different rates, with those that code for factors that regulate the cell cycle
among the first to be eliminated [44]. This allows the cell cycle to begin to be regulated
by external rather than maternal cues.
As maternal transcripts become degraded, activation of transcription of the
zygotic genome begins. A combination of factors may induce transcription of zygotic

14
genes. These factors include changes in the nuclear to cytoplasmic ratio with successive
cell divisions, during which cells become successively smaller during cleavage; presence
of a molecular clock, for which the molecular components are being elucidated; and
changes to chromatin within the embryo’s nuclei [44]. The timing of the onset of
transcription from the zygotic genome varies between animals [44]. In sea urchin,
transcripts synthesized by the embryo itself are detected at the zygote stage [44]. These
include transcripts of genes that comprise the Gene Regulatory Networks (GRNs),
introduced more fully below, that control sea urchin embryogenesis [45]. However,
these development-regulating GRNs are activated by maternal factors that are stored in
the egg cytoplasm. For example, the GRN that controls the development of the lineage
comprising the endoderm and mesoderm, that is, the endomesoderm, requires maternal
Wnt6 transcripts in order to be activated [46].
An important event for which the timing coincides with the maternal to zygotic
transition is the introduction of gap phases in the cell cycle. The introduction of these
gap phases, G1 and G2 [41] is important for a number of reasons. First, as noted, their
terminal boundaries serve as cell cycle checkpoints whereby cells will not commit to
replicating their DNA or undergoing mitosis if errors are present. Second, and related to
the theme being developed for this dissertation, the checkpoints are important from a
developmental perspective: after completion of M, there exists another gap phase G0,
during which cells can decide to exit the cell cycle and differentiate. Cells make this
decision based in part on the developmental context in which they find themselves. In
short, cells sense and respond to developmental signaling factors. The maternal factors
that cells encounter differ upon their position in the embryo [42, 43]. Cells respond to
15
these factors by activating the transcription of a specific subset of genes [45]. Some of
these genes code for other transcription factors, and others code for specific terminal
differentiation factors that do not themselves activate other genes, but impart on a cell a
specific phenotype related to its temporal and spatial position within the developing
embryo [43]. Ultimately, what is set in motion within a specified cell type is a network of
transcriptional-regulatory interactions between specific genes within the organism’s
developmental program [45]. This relates to gene regulatory networks (GRNs), which
are explained more below.
1.6 Strongylocentrotus purpuratus – a useful system for studying development
The purple sea urchin, Strongylocentrotus purpuratus is an ideal system for
studying questions relating to development and the cell cycle, due to a number of recent
developments. These include the fact that the genome of this organism has been
sequenced, and its genes have been annotated [47], revealing that most of the gene
families found in vertebrates are also found in S. purpuratus. These include, for example,
most transcription factor family members, developmental signaling pathways, genes
involved in the immune and complement systems, ABC transporters, genes involved in
adhesion, such as integrins and cadherins, and genes expressed in the nervous and
sensory systems [47]. With respect to transcription factor families, the members of
various families have been well annotated, including, for example, Fox genes [48], Ets
genes [49], Zinc finger genes [50], and Homeobox genes [51]. In addition, the
transcriptome of the sea urchin embryo was studied by Samanta et al. [52]. These
investigators identified thousands of genes across many functional classes that were
transcribed during embryogenesis. Of interest, the Samanta et al. study described

16
transcription from intergenic regions. Although the function of these latter transcripts
was not determined by Samanta et al.[52], this study has not been the only one to identify
such entities. For example, Kim et al. [53] identified RNA species they termed enhancer
RNAs that were transcribed from neuronal enhancers. Likewise, the functions of these
species remained unknown, but it was speculated that they might play a role in gene
regulation. The existence of these newly characterized RNAs is of interest, because it
relates somewhat to the project described in this dissertation, which identifies and
characterizes conserved non-exon regions within a cyclin D gene that regulate its
expression, although it does not address whether any RNAs are transcribed from these
regions. An update on the status of the transcriptome of S. purpuratus was published in
2012 [48]. Although that study focused on protein coding genes, the knowledge obtained
in that project allowed gene models postulated in the previous work of Sodergren et al.
[47] to be revised based on the identity and pattern of transcription of genes that are
expressed from early embryo through juvenile stages.
Of relevance to this project, in S. purpuratus, the genes involved in regulating the
cell cycle in this organism have been annotated [54]. This annotation showed that with
the exception of the INK4 and ARF tumor repressor families, all family members
involved in both positive and negative control of the cell cycle were present, although
often with fewer representative members than found in vertebrates.
As noted earlier, the cell cycle is linked to development [40, 41]. In this
Introduction, an attempt has also been made to show specific examples of how the cell
cycle and developmental signaling and environmental factors related to nutrition are
linked. To date, the role of cell cycle regulatory genes in controlling developmentally
17
important transcriptional networks has been largely neglected in the field of animal
development. For example, in S. purpuratus, cell cycle regulatory genes have not yet
been linked to the developmental GRNs in this organism [55]. The relationship of cell
cycle regulatory genes to the transcriptional regulatory networks of which they are part
has been studied in systems such as yeast [56, 57] but not so much in the development of
animals, except as pertains to the study of cancer, and in such studies, the techniques used
are largely computational methods that make predictions that have yet to be
experimentally verified [58]. As alluded to above and will become further evident below,
genes of the cyclin D family, could play an important role in linking the cell cycle to the
GRN. With this in mind, this project focuses on a cis-regulatory analysis of the cyclin D
gene, Sp-CycD, of S. purpuratus. Cyclin D genes are now described in more detail.
1.7 Cyclin D genes -- overview of roles in the cell cycle and development
As described above, the eukaryotic cell cycle is regulated by the cyclins [59]. As
described earlier, cyclins were first identified in sea urchin embryos as proteins that
accumulated and then were destroyed with different phases of the cell cycle [5]. While
the cyclins expressed during early development before the maternal to zygotic transition
are byproducts primarily of maternal mRNAs, as noted, the D-type cyclins become active
at the maternal to zygotic transition. Linked to this fact, analysis of cyclin D promoters,
generally in vitro, and primarily with the vertebrate cyclin D1 gene, has shown the
existence of binding sites for dozens of transcription factors that act downstream from
most of the developmentally important signaling pathways, giving further evidence for
roles of cyclin D genes as developmental sensors that contribute to the regulation of
development by linking receipt of extracellular signals to downstream developmental
18
responses [13]. This is related to the fact that the well characterized role of cyclin D
genes in bringing about the G1 to S transition in the cell cycle is triggered by receipt by
the cell of mitogenic signals, stemming from virtually all the developmental signaling
pathways [59].
Driving the G1 to S phase of the cell cycle may be one of many roles for cyclin D
genes, and in fact, in certain developmental contexts, cyclin D genes may not be needed
for the G1 to S phase transition. For example, work carried out by the Sicinski lab has
shown that knockout mice lacking all three of the mammalian cyclin D genes are viable
throughout much of embryogenesis, before dying due to deficits in the hematopoietic
lineages [16]. It is possible that these findings could be due to functional redundancy
with other cyclin genes. For example, in 1999, Geng et al. [60] showed that in a mouse
strain where the cyclin D coding sequence had been replaced with that of cyclin E, cyclin
E rescued the phenotypes caused by cyclin D loss. Further support of this came from
Keenan et al. in 2004 [61]. These authors showed that if cyclin D1 synthesis was blocked
in Chinese hamster embryonic fibroblasts, progression through G1 to S phase of the cell
cycle was blocked. However, this block was overcome by expression of cyclin E-CDK2.
Moreover, cyclin E-CDK2 carried out this rescue through inactivation of RB via
phosphorylation, and concomitant activation of E2F. Moore et al.[62] showed that
depletion of cyclin D in developing sea urchin embryos did not affect total cell number in
late gastrula stage embryos. However, Robertson et al. [63] examining the effect of
cyclin D knockdown on cell numbers in blastula stage embryos, showed that depletion of
cyclin D did reduce cell numbers at that stage of development.
19
In addition to their important role in regulating the cell cycle in response to
developmental signals, genes of the cyclin D family also play other developmental roles.
For example, Datar et al.[64] showed that in Drosophila, cyclin D and its partner CDK4
induce cellular growth (increase in cell size) but not cell proliferation. Related to its role
in regulating cell growth, cyclin D genes have also been shown to down-regulate
catabolic genes [37]. Moore et al. [62] showed that cyclin D in the developing sea urchin
embryo is not expressed until blastula stage, and that this expression is required for
development of normal larval morphology. Inducing cyclin D expression during
cleavage caused death. Similar findings were reported by Tanaka et al. [65] who,
working in a different developmental system, Xenopus laevis, showed that cyclin D1
RNA in that organism was not detected until the midblastula stage. Both Moore et al.
and Tanaka et al. showed that cyclin D expression became successively restricted as
development proceeded, to dividing cells of the gut and ectoderm in the sea urchin, and
to neural plate and eye vesicles in Xenopus [62, 65].
A point of contention has been the role of cyclin D genes in differentiation. The
most common view has been that cyclin D cells are cell cycle regulators, and that it is
their down-regulation that allows cells to exit the cell cycle and differentiate [66]. This
view is supported by studies, such as that of Adachi et al. [67] who demonstrate that
degradation of cyclin D1 and D2 caused by switching growth factor medium is associated
with ceasing of the cell cycle in immature myeloid cells and their differentiation into
neutrophils. In developing mouse spermatogonia, cyclins D1 and D3 appear to regulate
the cell cycle, whereas the expression cyclin D2 appears to be required for differentiation
into A1 spermatogonia [68]. The complexity of this situation is further revealed by the

20
fact that cyclin D3’s role may be context dependent, regulating the G1 to S transition in
spermatogonia, but perhaps regulating differentiation in Sertoli and Leydig cells [68]. In
skeletal muscle, cyclin D3 and its associated CDK4 has been shown to repress
differentiation by directly inhibiting the association of the transcriptional regulators
MEF2C and GRIP-1 required for the muscle cell differentiation program to be activated
[69].
Understanding the mechanisms through which the expression of cyclin D family
genes is regulated is also medically pertinent, with cyclin D genes, particularly cyclin D1,
being commonly mis-regulated in various cancers, with the cyclin D1 gene being the
second most amplified gene in human cancers [70, 71], and its mis-regulation being
associated with the development of a variety of these diseases [72-74]. Moreover, this
gene could be an important chemotherapeutic target, based on a recent finding that
expression of this gene may be required for the viability of certain cancers, but may not
be needed in adult tissues that have completed development [75]. Also of medical
relevance, cyclin D and its partners have been shown to regulate the activity of
telomerase [76-78], findings which are pertinent to better understanding both cancer and
aging [79].
Clearly genes of the cyclin D family play important roles in development, and in
both normal and disease-compromised biological processes. Of interest, recent work has
provided evidence that cyclin D proteins may carry out some of their functions by
pathways distinct from the best characterized activation of CDKs. In particular, recent
work has shown that cyclin D proteins may act directly as transcription factors, perhaps
in concert with other transcription factors. For example, the Sicinski group [80] showed

21
that during mouse embryogenesis, the cyclin D1 protein was found associated with
promoters of developmentally active genes, and, in particular, was shown to recruit
CREB binding protein histone acetyltransferase to the Notch1 gene. Moreover, if the
cyclin D1 gene was ablated in retinas, NOTCH1 activation was lessened, leading to
decreased cell proliferation in that organ, an effect that could be rescued by introduction
of an artificially activated Notch1 gene. In related work, Lukaszewicz and Anderson [81]
showed that the cyclin D1 protein promotes neurogenesis in the developing mouse spinal
cord by inducing expression of the transcription factor Hes6. As described near the end
of Chapter 3, the weight of the evidence indicates that cyclin D genes carry out their
transcriptional roles indirectly, via protein-protein interactions with sequence-specific
DNA binding transcription factors.
How are levels in the cell of the developmentally important cyclin D genes
regulated? Due to its instability as a protein, cyclin D is primarily regulated at the level
of transcription [1]. Work from numerous groups has provided evidence in support of
this by describing how developmentally important signaling pathways and their
associated transcription factors regulate the transcription of cyclin D genes. For example,
transcription factors of the TCF family that are the effectors of the Wnt-β-catenin
pathway regulate the expression of cyclin D genes. Shtutman et al. [82] and Tetsu and
McCormick [83] showed that activation of β-catenin, working through the TCF
homologue LEF1, increased transcription of cyclin D1 via LEF1 binding sites in the
promoter. Pradeep et al. demonstrated that cyclin D1 activation depended primarily on
activation in its promoter of a CRE responsive element, but that a TCF4 site contributed
to a lesser extent [84]. Baek et al. [85], working on a mouse cell line, showed that LEF1,
22
along with histone deacetylase 1 and a complex of E2F4 and P130, repress the cyclin D1
promoter until repression is lifted by activation of the Wnt-β catenin pathway.
The regulation of cyclin D expression has also been linked to Runx transcription
factors. For example, Bernardin-Fried et al. [86] found that levels of the Runx protein
AML1 varied during the cell cycle in a pattern similar to that displayed by cyclin D3.
Inhibition of AML1 lead to loss of cyclin D3 expression, and AML1 was shown to
interact with and activate the cyclin D3 promoter. Knockdown of the sea urchin Runx
gene Runt1 caused a decrease in cyclin D RNA expression, as well as decrease in
expression of several Wnt genes, such as Wnt4, Wnt7, Wnt8, Wnt6, Wnt7 and Wnt9 [63].
Further, Robertson et al. [63] showed that blocking Runt1, Wnt8, or cyclin D expression
caused a decrease in cell numbers in blastula stage embryos, and that Runt1 bound the 5’
flanking regions of CycD, Wnt6 and Wnt8.
The regulation of cyclin D genes by other developmentally important signaling
pathways and associated transcription factors has also been examined. Examples include
the MAPK cascade [87]; heat shock proteins [88]; E2F (of interest since E2F
transcription factors are themselves regulated by cyclin D genes during the G1 to S phase
transition of the cell cycle) [89]; G proteins, steroid hormones and nuclear receptors [90];
Sp1 [91]; STAT5 [92]; STAT3 [93]; and TGFα [94].
Transcription factors mediate their effects, in part, by binding to gene promoters.
Related to this, the cyclin D1 promoter has been extensively analyzed, although the work
involved has focused mostly on in vitro systems [13]. Examples of specific papers
analyzing cyclin D promoters include Kitazawa et al. [95] and Matsumura et al [92]. To
date, cyclin D promoters have not been subjected to a great deal of analysis in an in vivo
23
context. An exception concerns work done by Tanaka et al. working with Xenopus [65].
After examining the in vivo expression profile of endogenous cyclin D1, these authors
created reporter constructs with specified deletions of the cyclin D1 promoter, and
analyzed the effect on reporter gene activity. These authors found that the regulatory
elements identified in the promoter were not sufficient to explain the full expression
profile of cyclin D1, so they suggested that other sequence elements might be involved.
This finding also provides an impetus for undertaking the project described in this
dissertation – a comprehensive cis-regulatory analysis of a cyclin D gene.
1.8 The rationale for performing a cis-regulatory analysis on a cyclin D gene
Focus is now made on the main subject of this dissertation – a cis-regulatory
analysis of the Sp-CycD gene in the sea urchin Strongylocentrotus purpuratus. To
understand how the expression of a gene is regulated during development requires a cis-
regulatory analysis of that gene. Typically, developmentally regulated genes contain
multiple DNA sequence regions, up to several hundred basepairs in length, that bind
groups of transcription factors that play a role in regulating a gene’s pattern of expression
[45]. These regulatory regions are termed cis-regulatory modules (CRMs). Some of
these regions play stimulatory roles in specific cells, others have inhibitory roles, and still
others act as boosters or inhibitors of other cis-regulatory modules [45]. The function of
cis-regulatory modules can be examined by incorporating them into reporter constructs,
injecting the latter into developing embryos, and observing the spatial and temporal
expression pattern of the reporter genes. Such cis-regulatory analyses have been
successfully applied in S. purpuratus to numerous genes, such as CyIIIa [96], SM50 [97],
Endo16 [98, 99], CyIIa [100], Wnt8 [101], Nodal [102], and Delta [103].

24
The efficiency with which potential CRM-containing regions of a gene are
identified can be increased using a number of computational approaches. One such
method is to identify regions of sequence conservation. This method, termed
“phylogenetic footprinting,” is based on the premise that sequences within the same gene
that are evolutionarily conserved between different species of sufficient evolutionary
distance may exhibit this conservation because they are functional [104, 105]. With
respect to this, sequence comparisons between the genes of S. purpuratus and the sea
urchin L. variegatus have been shown to reliably predict CRMs [106, 107]. A
comprehensive program for identifying conserved and potentially functional regulatory
sequences is FamilyRelationsII [106]. This program has been demonstrated to accurately
predict cis-regulatory regions ([106] and references therein). The identification of
regions containing potential cis-regulatory modules can also be facilitated by identifying
sequence regions that have clusters of binding sites for known transcription factors, as
such regions have been shown to often be regulatory in nature [108].
Performing a cis-regulatory analysis of a gene is the only way to definitively, by
experiment, link that gene to the gene regulatory network (GRN) of which it is a part,
because such an analysis is required to identify the transcription factors of a gene
regulatory network that directly regulate the expression of the gene being studied [45].
1.9 Overview of developmental GRNs
Gene regulatory networks (GRNs) are important “drivers” of development [45,
55, 109]. Gene regulatory networks prescribe how the information encoded in the
genome is to be used during development of an organism. Visualized in diagrammatic
form [55] GRNs consist of networks of all regulatory genes known to be active in
25
development. Among the best worked-out lineages in developing embryonic S.
purpuratus are the endomesoderm lineages, and, to a lesser extent, the lineage specifying
the ectoderm [55]. GRNs show not only the genes involved in specifying a
developmental lineage or structure, but, more importantly, the regulatory interactions
between those genes. These interactions can range from simple, as for example, when a
transcription factor activates a gene that produces an end product, such as a skeletal
protein that is expressed in and characteristic of a particular cell type, or complex, as in
circuits where transcription factors can successively activate or inhibit other transcription
factors through negative and/or positive feedback loops [45].
Development is best described as a system property that results from the
interactions between genes. Developmental GRNs present these interactions, and explain
how they lead to specific phenotypes at specific times and specific places within a
developing embryo [45, 109-112]. Developmental GRNs are modular, being composed
of individual subcircuits of interacting genes. These subcircuits, which can be classified
based on their function, have been described as the “building blocks” of developmental
GRNs. The genes within these subcircuits can be classified based on whether they only
receive signals from other genes, but do not themselves communicate with other genes;
or both receive input from other genes, but respond with an output that regulates the
transcription of other genes. An example of the former would be a gene that encodes a
structural product but does not transcriptionally regulate any other genes [111].
Examples of the latter would be transcription factors, and signaling genes that lead to the
transcriptional expression of such transcription factors [45].

26
The subcircuits within developmental GRNs can be classified into a number of
different types [45]. Among developmental questions that can be answered by study of
subcircuits are: what causes a particular transcription factor to be expressed in a
particular spatial domain but not in others; what causes a particular gene to be activated
at a particular time and place, and then have its expression become extinguished; is a
particular gene activated by binding of one transcription factor, or does it require binding
of more than one specific transcription factor to become activated; how is “community
effect” signaling, in which all cells within a given spatial territory express the same
assortment of genes, maintained? Developmental GRNs ultimately consist of all the
subcircuits that are active in all regions of an embryo, and how they change over time to
bring about developmental phenotypes. A goal of researchers who decipher GRNs is to
eventually construct global GRNs that encompass all regulatory genes expressed during
development. Progress toward this goal is being made by analyzing the entire
transcriptome during sea urchin embryonic development [113].
Despite the fact that their structures are still being deciphered, the
developmental GRNs of S. purpuratus that regulate the development of specific tissue
lineages within embryos are complete enough to allow them to be used to explain how
certain regulatory genes that are active in specific developmental lineages communicate
and cooperate with each other to bring about specific phenotypes in terms of expressed
genes and resultant developmental morphology and behavior, within those lineages. This
knowledge was gained by either individually perturbing expression, generally by
knockdown using morpholino antisense oligonucleotides but sometimes by over-
expression, of each regulatory gene in the regulatory network, followed by cataloging the

27
effect on expression of every other gene in the network. From this analysis, it can be
determined which genes are regulated by each gene whose expression was
experimentally perturbed. To determine whether each gene whose expression is affected
by the experimental perturbation of the each regulatory gene is direct or indirect, cis-
regulatory analyses of genes whose expression profiles were affected by perturbation of
each regulatory gene were, and are being conducted. Therefore, direct transcriptional
regulatory interactions between genes in the network can be deduced, verified by direct
experimental evidence [45].
1.10 Gaps in our understanding of the developmental role of cyclin D family genes
At least two gaps in understanding exist with respect to cyclin D family genes.
First, to date, the cyclin D gene of S. purpuratus (Sp-CycD) has not been linked to sea
urchin developmental GRNs. GRNs of strongest interest include that specifying the
endomesoderm, the precursor to the endoderm and mesoderm lineages; and that
specifying the ectoderm. This is because Sp-CycD becomes confined to the
endomesoderm and oral ectoderm as development proceeds [62], and this pattern of
expression is likely controlled by the genes expressed in those territories, which is in turn
controlled by the respective GRNs. Second, as noted above, Wnt signaling has been
shown to regulate expression of cyclin D genes, and Wnt8 is a key gene in the
endomesoderm GRN, showing multiple linkages [55]. Runt1, which is required for both
Wnt8 and cyclin D expression in the blastula [63], is also ultimately expressed in the
endomesoderm, as well as in oral and ciliated band ectoderm, in an overall pattern that is
similar to Sp-CycD’s pattern of expression [114].
28
A second gap in understanding with respect to cyclin D family genes is that none
has been subjected to a comprehensive cis-regulatory analysis, the experimental method
needed to verify linkages between a gene and the developmental GRNs of which it is a
part. Evidence has also been provided in this Introduction that cyclin D genes, due to
their transcriptional regulation by numerous developmentally important pathways, and
due to their ability to in turn regulate aspects of both the cell cycle and development, play
important developmental roles. Due to the above noted gaps in understanding, a cis-
regulatory analysis of the entire Sp-CycD gene has been undertaken, as described in the
following chapters, based on the premise that genes of the cyclin D family are an
important bridge linking the cell cycle to development [40]. A cis-regulatory analysis of
Sp-CycD in S. purpuratus would identify the DNA sequence modules that control its
expression pattern. Since cis-regulatory elements control expression by interacting with
transcription factors from developmental pathways, they can link a gene to a GRN of
which it is a part. Indeed, a gene is confirmed to be part of a GRN by just such an
analysis [45]. Therefore, as described in Chapter 2, a developmental cis-regulatory
analysis of Sp-CycD of S. purpuratus was conducted.
29
CHAPTER 2
DEVELOPMENTAL CIS-REGULATORY ANALYSIS OF THE CYCLIN D
GENE IN THE SEA URCHIN STRONGYLOCENTROTUS PURPURATUS
Herein, a developmental cis-regulatory analysis of the cyclin D gene, Sp-CycD, in
S. purpuratus is presented. As explained in Chapter 1, it is proposed that this work can
serve as the basis for incorporation of this developmentally important gene into the GRNs
that regulate embryonic development in S. purpuratus. The methods used to carry out
this work are first described. Subsequently, the results, and the interpretation of those
results are presented. It should be noted that the material presented in this Chapter is
taken, essentially in whole, with only slight modifications, from a recently published
paper [115].
2.1 Materials and methods
2.1.1 Rearing and maintenance of Strongylocentrotus purpuratus, and obtaining
gametes
Strongylocentrotus purpuratus adults were obtained from the Pt. Loma Marine
Invertebrate Lab (Lakeside, CA), and kept in a seawater aquarium at ~12oC. Sperm and
eggs were obtained by shaking, or by injection with 0.55 M KCl using established
methods [116]. Embryos were cultured in artificial sea water.
2.1.2 Sequence comparisons between Sp-CycD and Lv-CycD
The cyclin D sequence from Lytechinus variegatus (Lv-CycD) used for
comparison to Sp-CycD sequence was obtained from two sources, a BAC containing 17
kb of sequence upstream of exon 1, and as a series of isotigs from an Lv-CycD draft
sequence available at SpBase [3]. Sequence comparisons were made using Family
30
Relations II [106, 117]. FamilyRelationsII compares sequences using a “sliding window,”
so that conserved sequences found in the genes being tested will be identified irrespective
of their location or orientation in each gene. Sequences in Sp-CycD of at least 20 bp that
shared at least 90% similarity with Lv-CycD were selected for further analysis.
2.1.3 Generation of reporter constructs
To generate EpGFPII-linked reporter constructs [118], regions of interest were
amplified by PCR using high fidelity DNA polymerases purchased from Roche or New
England BioLabs. For template, either BAC DNA bearing the Sp-CycD locus, or if PCR
from that template was unsuccessful, sea urchin genomic DNA, was used. Primers were
modified on their 5’ and 3’ ends to have KpnI and SmaI sites, plus 15 bp homology with
the multiple cloning site of EpGFPII cut with those enzymes. The primer modifications
were 5’-CTATCGATAGGTACC and 5’-ACAGTTTAACCCGGG, for the forward and
reverse primers, respectively. Primers were designed using Primer 3, available online
[119]. For regions to be incorporated into 13-tag vectors rather than EpGFPII, the
forward primer was not modified, while the reverse primer was modified by the addition
of 5’-TTGAAGTAGCTGGCAGTGACGT at its 5’ end to enable linkage by fusion PCR
to 13 tag-bearing reporters as described below. The sequences of primers used to amplify
all regions used for analysis are shown in Appendix B Table B.1.
Amplified regions of interest were ligated to EpGFPII reporter vectors using
conventional methods. Reporter constructs were then linearized with KpnI followed by
purification with a PCR purification kit (Nucleospin Gel and PCR Cleanup, Clontech)
before being used for injecting embryos.
31
13-tag-linked reporter constructs were made as follows. Bacterial cultures
bearing each 13 tag reporter were grown up from stab cultures (provided by J. Nam,
Davidson lab, California Institute of Techology) as follows. First, derivatives of each
stab culture were individually streaked onto LB agar plates containing chloramphenicol
(12.5 μg/ml). Colonies from each plate were then placed into 5 ml LB +
chloramphenicol (12.5 μg/ml) and grown overnight at 37oC, with shaking. 200 μl of each
overnight culture was then used to inoculate 1 ml LB + chloramphenicol (12.5 μg/ml) + 1
μl Copy Control Induction Solution (epicentre). These cultures were then incubated at
37oC, shaking at 290 rpm for 5 hours before being subjected to miniprepping (Spin
Miniprep Kit, Qiagen). The resultant minipreps were then used as templates for PCR that
would be used to modify their structure somewhat from that presented in the original
Nam et al. paper [120] (J. Nam, personal communication). These modifications involved
replacing, on each 13 tag reporter, the Sp-gatae basal promoter given in the Nam and
colleagues paper [120] with an Sp-nodal basal promoter. For this modification, a forward
primer, new_mNBP,
(5’-
ACGTCACTGCCAGCTACTTCAACTTGGAAGGTAAGGTCTCAAGTATTTAAGAT
TGAGGGCTCACGGGCACCTTCtcatcttacaagtgaatcacaa), bearing the Sp-nodal basal
promoter annealed just 3’ to the Sp-gatae promoter on each original 13 tag vector. In this
primer, the non-underlined nucleotides in red font on the 5’ end were for subsequent
linking by fusion PCR to the 3’ end of a regulatory region to be tested bearing the
complementary sequence, 5’-TTGAAGTAGCTGGCAGTGACGT; the underlined
sequence corresponded to a disarmed nodal basal promoter; and the lowercase part
32
annealed to the 5’ end of each 13 tag vector being amplified (J. Nam, personal
communication). The reverse primer, end_core-polyA, (5’-
CACAAACCACAACTAGAATGCA) annealed ~23 nucleotides downstream of the 13
tag basic unit unique on each reporter (J. Nam, personal communication, May, 2011).
Minipreps of each of the 13 tag vectors were then used as templates in PCR reactions
containing the two above primers. For these reactions, Phusion DNA polymerase (New
England BioLabs) and the following cycling conditions were used: 98oC x 30 sec; 35
cycles of 98oC x 7 sec, 60.8
oC x 20 sec, 72
oC x 20 sec; 72
oC x 10 min. PCR products of
the 13 tag reporters, which now bore the Sp-nodal basal promoter instead of the Sp-gatae
promoter, were subjected to PCR purification (Nucleospin Gel and PCR Cleanup,
Clontech). At this point, these PCR products could be used for subsequent linking by
fusion PCR to amplified potential regulatory regions of interest from Sp-CycD.
Potential regulatory regions in Sp-CycD were amplified with either Expand High
Fidelity DNA polymerase (Roche) or Expand Long Template PCR System (Roche) and
purified as described in Nam et al [120]. Amplified regions were linked by fusion PCR
to 13-tag reporter constructs using Expand High Fidelity DNA polymerase (Roche) as
described in Nam et al [120]. If fusion PCR products could not be generated using
Expand High Fidelity DNA polymerase (Roche), then Expand Long Template PCR
System (Roche) was used. Fusion PCR products were run on a gel and subjected to gel
purification (Nucleospin Gel and PCR Cleanup, Clontech). PCR products run on the gel
were visualized by blue light from a Safe Imager (Invitrogen) rather than ultraviolet
illumination to limit damage to the DNA. By comparing the activity of reporter
constructs bearing known active regions that had been purified by either gel purification
33
with the aid of blue light or by PCR purification, it was determined that gel purification
with the aid of blue light did not prevent the detection of active regulatory regions (data
not shown). All PCR products were sequenced to ensure generation of desired products.
From analysis of these sequences, it was determined that gel purification was successful
in removing the majority of contaminating PCR side products for all 13 tag-linked
regions except for 13 tag-linked region 3, for which sequencing showed a roughly 1:1
mixture of 13-tag linked region 3 and non-specific amplification products (data not
shown). Despite multiple attempts at optimization, it was not possible to remove these
non-specific amplification products from 13-tag linked region 3.
The sequences for upstream regions 2 and 4 presented in this dissertation are from
the full sequencing of clones bearing these regions used in this study. The sequences of
all of the other regions, for which the correct identity in each case was confirmed by
partial sequencing and by running 13 tag-linked reporters of each on a gel to check sizes,
are taken directly from Sp-CycD sequence accessed using GBrowse V3.1, located at the
SpBase website [3, 121].
Each region was attached to a specific 13 tag reporter, X-13Y, where X denotes
the region and Y denotes the tag, as indicated in Appendix C, Table C.1.
2.1.4 Microinjection of fertilized eggs
For reporter constructs containing region(s) linked to the reporter vector EpGFPII
[118], a 10 μl injection solution contained ~10 nmols of reporter construct along with 165
to 200 ng of HindIII digested then purified genomic DNA; and 0.12 M KCl. Injection
solutions comprising potential CRM-containing regions linked to 13-tag vectors were
made based on Nam and colleagues’ paper [120], but with some modifications. First, a

34
Master Pool containing ~10-12 13-tag linked reporter constructs was made as directed
[120]. However, for the final injection solution of 10 μl, the volume of Master Pool mix
used was increased form 0.5 μl to 1 μl. The final mix also contained ~200-270 ng
HindIII digested then purified genomic DNA, plus 0.12 M KCl. Microinjection was done
using established methods [122], with ~100-150 embryos being injected with injection
solution containing EpGFPII-linked reporters and > 200 embryos being injected with
injection solution containing 13-tag-linked reporters. For this study, a BAC (BAC 4013
F-18 mCherry, prepared by the Sp Genome Research Resource at Caltech) bearing the
Sp-CycD gene plus ~90 kb upstream and ~13 kb downstream sequence was also utilized.
BAC DNA was prepared using a BACMAX DNA Purification Kit (epicentre) from
bacterial stab cultures that were grown up under selection from chloramphenicol (12.5
μg/ml). BAC DNA was dialyzed and microinjected based on previous methods [123] .
Injection needles were pulled from capillary tubing (FHC, catalog number 30-30-0) using
a Flaming/Brown Micropipette Puller (Sutter Instrument Co, Model P-97).
2.1.5 Procurement of RNA, and cDNA synthesis
For assays of endogenous Sp-CycD expression, embryos were cultured at a
concentration of ~1200 embryos per 4 ml at 15oC in 4 ml each in 6 well plates. At
specified time points, embryos were harvested by centrifugation and RNA was obtained
using an Rneasy Plus mini kit (Qiagen). Lysates were first passed through a
QIAshredder (Qiagen) before processing to obtain RNA. DNA was removed from
lysates as described in the kit’s instructions. For each time point, RNA equivalent to 30
ng per 20 μl reaction was converted to cDNA using random hexamers and the FirstStrand
cDNA Synthesis kit (Invitrogen Life Technologies). For embryos injected with
35
EpGFPII-based reporter vectors, RNAs and DNAs were obtained with a DNA/RNA ALL
Prep kit (Qiagen). cDNA synthesis was carried out using random hexamers as directed
by the manufacturer, with 3 μl RNA used for each 20 μl reaction. For embryos injected
with 13-tag-linked reporter vectors, RNAs and DNAs were extracted for each time point
using the DNA/RNA ALL Prep kit (Qiagen). Before cDNA synthesis, RNAs were
treated with DNAse as directed by the DNA/RNA ALL Prep kit instructions. cDNA
synthesis was conducted using the FirstStrand Synthesis kit on RNA equivalent to 3 μl
per 20 μl reaction using a gene specific primer, that is, one specific for the 13 tag vectors,
5'-ATGCTTTATTTGTTC [120]. The exception for this was the experiment for
biological replicate #5 (Fig. 2.4), for which random hexamers were used.
2.1.6 Real-Time PCR procedure and analysis
Real-Time PCR experiments were conducted using Perfecta SYBR Green Fast
Mix (Quanta BioSciences) and a LightCycler 480 II instrument (Roche). cDNA and
DNA equivalent to 1.3 μl and 1.6 μl per 12 μl reaction were used. Unless indicated
otherwise, all reactions were done in duplicate. The reaction profile used was 95oC for
10 minutes, followed by 40 cycles of 95oC for 30 seconds, 60
oC for 1 minute. The
relative quantification setting was used. All reactions were subjected to melt curve
analysis as well.
To determine endogenous Sp-CycD expression, primers specific for exon 1 of
cyclin D were used (5’-TTTGTTGTGCTTTGAGCAAGA and 5’-
CGAACATCCAATCCACGACT). Ct values were obtained for each time point and
compared to those derived from expression of ubiquitin in the same samples. Sp-CycD
expression levels for each time point were determined by finding the difference in Ct

36
values between the Real-Time PCR reactions conducted for Sp-CycD expression and
ubiquitin expression. The primers used to detect ubiquitin expression were: 5’-
CACAGGCAAGACCATCACAC and 5’-GAGAGAGTGCGACCATCCTC. Next, the
Ct value difference between Sp-CycD and ubiquitin from each time point was compared
to this difference at the first time point, generally 10 hours post-fertilization (hpf),
yielding a ΔΔCt value for each time point. Relative expression values at each time point
were then computed using the formula Expression = 1/2ΔΔCt
. These Ct values were
derived from cDNA samples subjected to Real-Time PCR.
To calculate expression of GFP derived from injection of embryos with
EpGFPII-region of interest-linked reporter vectors, Ct values derived from expression of
GFP were determined using GFP specific primers (5’-AGGGCTATGTGCAGGAGAGA
and 5’-CTTGTGGCCGAGAATGTTTC). Ct values derived from GFP expression were
then normalized to Ct values derived from expression of ubiquitin by finding the
difference between Ct values of GFP and ubiquitin at each time point. These Ct values
were derived from cDNA samples subjected to Real-Time PCR. To account for how
much GFP-linked construct was injected for each time point, Ct values were likewise
obtained using the same GFP specific primers on DNA samples derived from each time
point. The difference between each ubiquitin normalized Ct value and the corresponding
value derived from Real-Time PCR with GFP primers on the corresponding DNA sample
for that time point was determined for each time point. All such ubiquitin- and amount-
injected-normalized values were then further normalized to that of the first time point by
finding the difference between the former and each of the latter. The resultant ΔΔCt
values were used to calculate the relative expression of GFP at each time point as above.
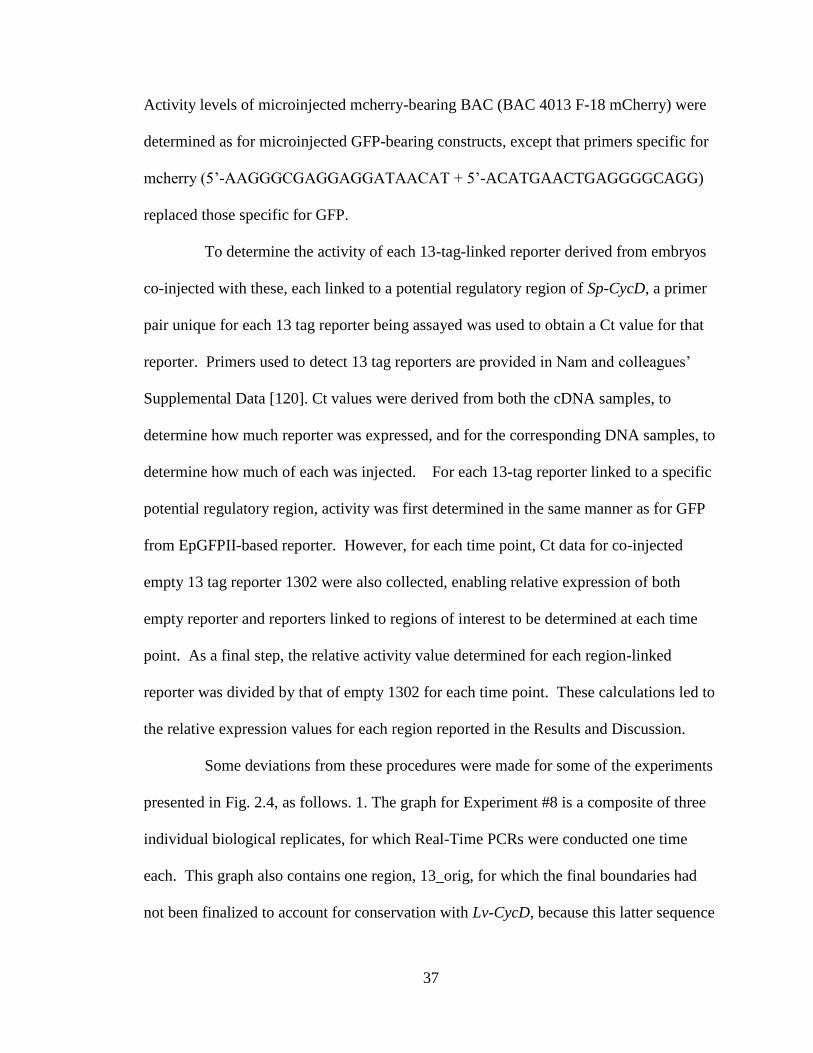
37
Activity levels of microinjected mcherry-bearing BAC (BAC 4013 F-18 mCherry) were
determined as for microinjected GFP-bearing constructs, except that primers specific for
mcherry (5’-AAGGGCGAGGAGGATAACAT + 5’-ACATGAACTGAGGGGCAGG)
replaced those specific for GFP.
To determine the activity of each 13-tag-linked reporter derived from embryos
co-injected with these, each linked to a potential regulatory region of Sp-CycD, a primer
pair unique for each 13 tag reporter being assayed was used to obtain a Ct value for that
reporter. Primers used to detect 13 tag reporters are provided in Nam and colleagues’
Supplemental Data [120]. Ct values were derived from both the cDNA samples, to
determine how much reporter was expressed, and for the corresponding DNA samples, to
determine how much of each was injected. For each 13-tag reporter linked to a specific
potential regulatory region, activity was first determined in the same manner as for GFP
from EpGFPII-based reporter. However, for each time point, Ct data for co-injected
empty 13 tag reporter 1302 were also collected, enabling relative expression of both
empty reporter and reporters linked to regions of interest to be determined at each time
point. As a final step, the relative activity value determined for each region-linked
reporter was divided by that of empty 1302 for each time point. These calculations led to
the relative expression values for each region reported in the Results and Discussion.
Some deviations from these procedures were made for some of the experiments
presented in Fig. 2.4, as follows. 1. The graph for Experiment #8 is a composite of three
individual biological replicates, for which Real-Time PCRs were conducted one time
each. This graph also contains one region, 13_orig, for which the final boundaries had
not been finalized to account for conservation with Lv-CycD, because this latter sequence

38
was unavailable when Experiment #8 was done. 2. In Experiment #7, region 18, not
discussed, showed significant activity. This region was considered to be of interest
before the boundaries of regions 5 and 6, which were also shown to be active, as
discussed in the Results, had been finalized. Since the termini of region 18 overlap with
regions 5 and 6 (see Fig. 2.3A), and since regions 5 and 6 contain all of the conserved
sequence found in region 18 (Fig. 2.3A), region 18 was not further studied.
2.1.7 Examination of injected embryos by fluorescence microscopy
Eggs were arrayed on 50 mm glass bottom dishes (MatTek), and fertilized and
injected as described above. At time points of interest, injected embryos were visualized
with an Axiovert 200 fluorescence microscope (Zeiss).
2.2 Results
2.2.1 Temporal expression of Sp-CycD
The temporal profile of embryonic Sp-CycD expression was assayed by
quantitative RT-PCR. As reported previously by others [62], expression commenced
~10-12 hpf (early blastula), then increased at least up to pluteus stage (72 hpf) (Fig. 2.1).
Interestingly, there was substantial variation between biological replicates.

39
Fig. 2.1 Endogenous Sp-CycD expression from different embryo cultures, as
determined by quantitative RT-PCR. Expression values are of relative expression with
respect to that at the first time point. A. Temporal expression patterns of Sp-CycD in
experiments derived from embryo cultures 1-3. Each experiment shown in panel A
consisted of one technical replicate on a unique embryo culture. B. Graph of experiments
derived from embryo cultures 4 and 5. In this case, each graph represents the mean of two
technical replicates done on one embryo culture each.
The temporal activities of endogenous Sp-CycD and a bacterial artificial
chromosome (BAC) bearing Sp-CycD with mCherry knocked into exon 1 were co-
assayed. This BAC encompassed sequence from ~90 kb upstream of the gene to ~13 kb
40
downstream. Both endogenous Sp-CycD and the injected BAC exhibited similar
temporal activities (Fig. 2.2, panel A), suggesting the information needed to regulate
embryonic Sp-CycD expression is within this BAC. It should also be noted that the
expression profiles of endogenous Sp-CycD and the Sp-CycD-mcherry BAC were similar
to that of Sp-CycD derived from the transcriptome analysis of S. purpuratus, worked out
by the Davidson lab (Fig. 2.2, panel B, [3]).
Fig. 2.2. A. Expression of endogenous Sp-CycD and microinjected mcherry-linked
BAC bearing Sp-CycD plus 90 kb and 13 kb of up and downstream sequence.
Relative levels of Sp-CycD mRNA were measured at each indicated time point by qRT-
PCR as described in the text. Each graph represents two technical replicates done on one
biological replicate. B. Transcription profile of Sp-CycD as taken from SpBase [3]. The
original data are from Tu et al [124].

41
The cis-regulatory analysis conducted for this project encompassed from ~13 kb
upstream of exon 1 to ~7 kb downstream from the end of exon 5 (Fig. 2.3A).

42
Fig. 2.3. Identifying cis-regulatory sequences. A. Regions tested for CRM-containing
activity. Sp-CycD, plus 13 kb upstream and 7 kb downstream sequence is shown. Exons:
black; potential CRM-containing regions: blue; sequences
with > 90% similarity to Lv-CycD: red; active regions: boxed. B. Representative
activity profiles. Each panel is from the indicated experiment 1, 2 or 6. Asterisks denote
significant activity. See Fig. 2.4 for additional activity profiles.

43
Fig. 2.4 Results of additional experiments showing the activities of tested regions.
Notes: 1. The fact that region 21 showed significant activity at 10 hpf in Experiment #7
was attributed to the low background expression level in that experiment. Region 21 did
not show significant activity in other experiments. 2. In at least two additional
experiments assaying each, regions 12 and 13 showed only background activity; and in
one additional experiment, region 22 showed only background activity (data not shown)
Figure continues on next page.

44
Fig 2.4 continued.

45
2.2.2 Identification of cis-regulatory regions
Twenty-two regions spanning upstream and intronic sequence of Sp-CycD were
selected to assay for regulatory activity (Fig. 2.3A). The boundaries of most were chosen
based on the presence of sequences of > 20 bp with > 90% similarity to Lv-CycD from L.
variegatus (Fig. 2.3A) [3]. This criterion was based on the fact that sequence
comparisons between genes in S. purpuratus and L. variegatus reliably predict S.
purpuratus CRMs [106, 107]. This analysis was comprehensive: all non-exonic
sequence except 1 bp between the 3’ end of region 10 and the 5’ end of exon 5, and 2 bp
between the 3’ end of region 11 and the 5’ end of region 21 was tested.
Candidate cis-regulatory regions were assayed for activity using the ‘13-tag’
reporters developed by Nam and colleagues [120]. Representative results are in Fig. 2.3B
and Fig. 2.4. In each experiment, a region was classified as significantly active if activity
at one or more time points was > 2.5 times that of the mean activity of regions in the
middle 40% of the distribution [120].
Several active regions were identified. Region 5, (2.4 kb) in the first half of
intron 2 (Fig. 2.3A) showed the strongest activity, with significant activity at all tested
time points from ~10-60 hpf. This activity was ~15 times greater than that of empty
reporter at its peak, and at least 2 times higher than those of the next most active regions.
The next most active regions were region 2 (~3.6 kb), located ~4.6 kb upstream from the
beginning of exon 1; region 6 (2.7 kb), comprising the 3’ half of intron 2; region 19 (4.6
kb), in intron 4; followed by region 4 (2.1 kb), which abuts exon 1; and region 17 (2.1 kb)
in intron 1 (Fig. 2.3 and 2.4). Regions 2 and 6 always showed significant activity for at
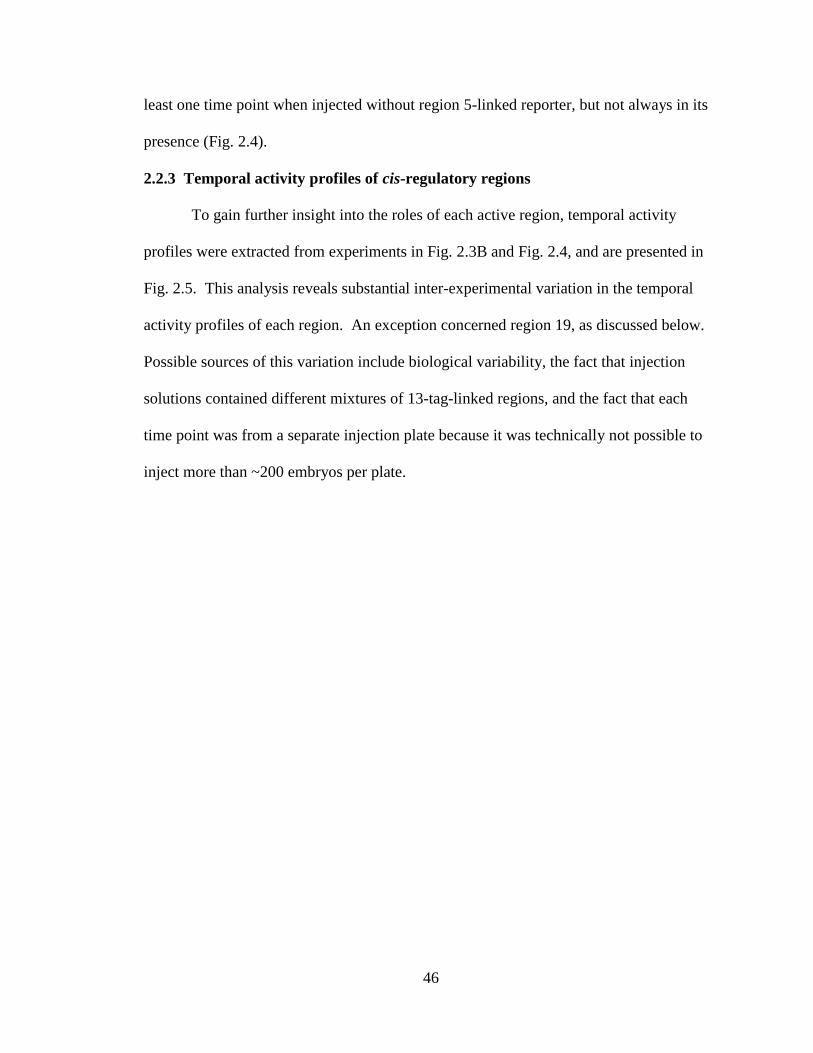
46
least one time point when injected without region 5-linked reporter, but not always in its
presence (Fig. 2.4).
2.2.3 Temporal activity profiles of cis-regulatory regions
To gain further insight into the roles of each active region, temporal activity
profiles were extracted from experiments in Fig. 2.3B and Fig. 2.4, and are presented in
Fig. 2.5. This analysis reveals substantial inter-experimental variation in the temporal
activity profiles of each region. An exception concerned region 19, as discussed below.
Possible sources of this variation include biological variability, the fact that injection
solutions contained different mixtures of 13-tag-linked regions, and the fact that each
time point was from a separate injection plate because it was technically not possible to
inject more than ~200 embryos per plate.

47
Fig. 2.5. Comparison of the temporal activities of regulatory regions of Sp-CycD,
with the results of individual experiments for the temporal activity of each region
shown. Temporal activity profiles are derived from embryos injected with regions linked
to 13-tag reporters. Experiments shown in the key for each graph each correspond to a
unique experiment corresponding to a unique embryo culture. Experiment “X” in a given
panel utilized the same embryo culture as Experiment “X” in a different panel. For
example, Experiment 1 in the graphs for regions 2, 4 and 6 corresponds to the same
experiment. Note also that Experiments #1, #2 and #6 are extracted from panels 1, 2 and
6, respectively, in Fig. 2.3B. The other labeled time course graphs are extracted from the
graphs bearing the same labels in Fig. 2.4. In all cases, activity at each time point is with
respect to that of 1302 empty reporter at the corresponding time point.
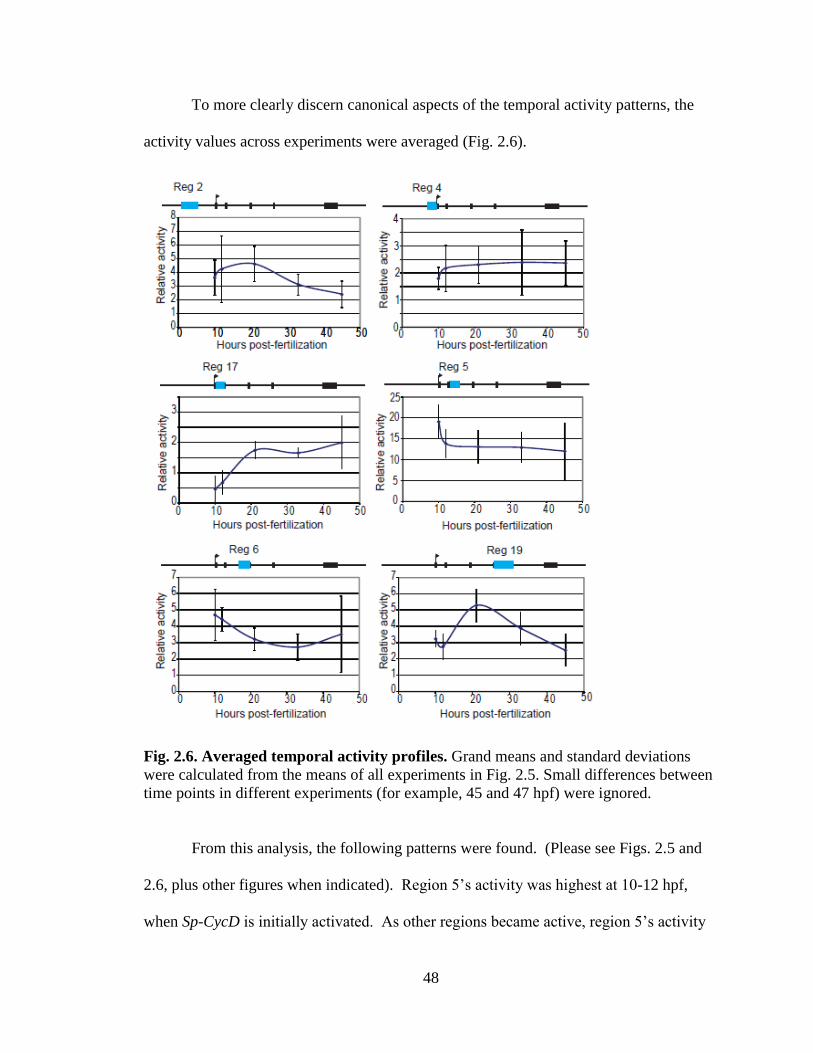
48
To more clearly discern canonical aspects of the temporal activity patterns, the
activity values across experiments were averaged (Fig. 2.6).
Fig. 2.6. Averaged temporal activity profiles. Grand means and standard deviations
were calculated from the means of all experiments in Fig. 2.5. Small differences between
time points in different experiments (for example, 45 and 47 hpf) were ignored.
From this analysis, the following patterns were found. (Please see Figs. 2.5 and
2.6, plus other figures when indicated). Region 5’s activity was highest at 10-12 hpf,
when Sp-CycD is initially activated. As other regions became active, region 5’s activity
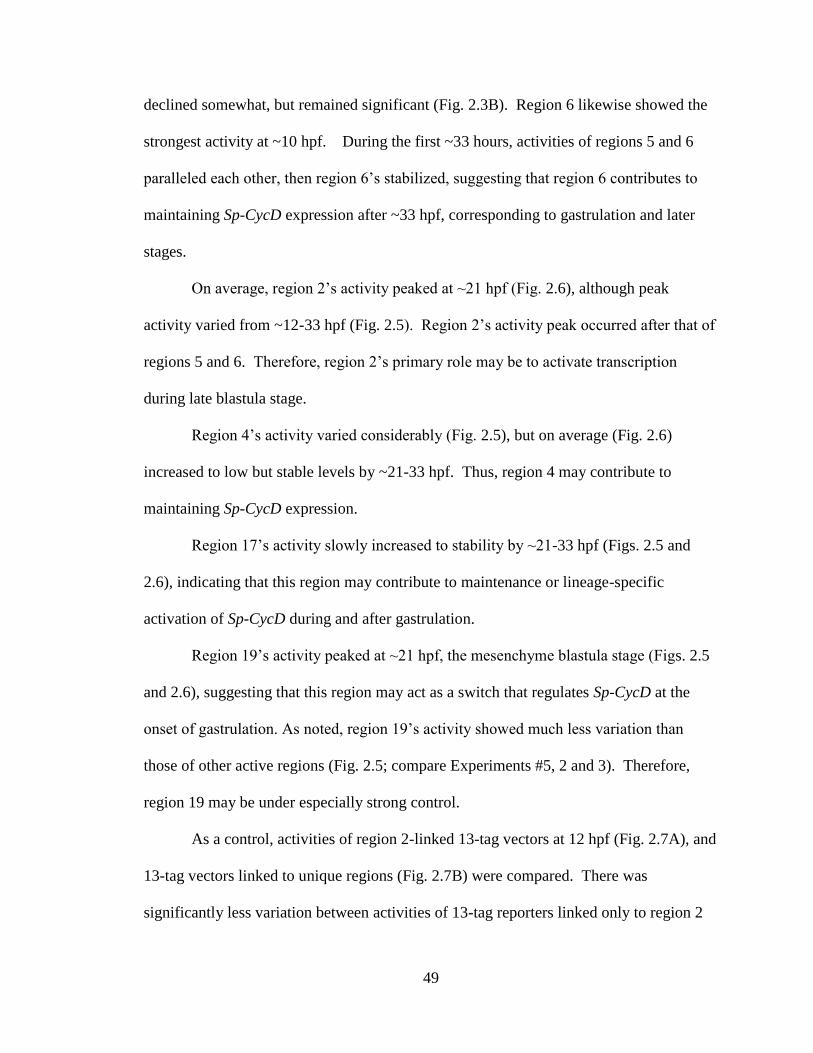
49
declined somewhat, but remained significant (Fig. 2.3B). Region 6 likewise showed the
strongest activity at ~10 hpf. During the first ~33 hours, activities of regions 5 and 6
paralleled each other, then region 6’s stabilized, suggesting that region 6 contributes to
maintaining Sp-CycD expression after ~33 hpf, corresponding to gastrulation and later
stages.
On average, region 2’s activity peaked at ~21 hpf (Fig. 2.6), although peak
activity varied from ~12-33 hpf (Fig. 2.5). Region 2’s activity peak occurred after that of
regions 5 and 6. Therefore, region 2’s primary role may be to activate transcription
during late blastula stage.
Region 4’s activity varied considerably (Fig. 2.5), but on average (Fig. 2.6)
increased to low but stable levels by ~21-33 hpf. Thus, region 4 may contribute to
maintaining Sp-CycD expression.
Region 17’s activity slowly increased to stability by ~21-33 hpf (Figs. 2.5 and
2.6), indicating that this region may contribute to maintenance or lineage-specific
activation of Sp-CycD during and after gastrulation.
Region 19’s activity peaked at ~21 hpf, the mesenchyme blastula stage (Figs. 2.5
and 2.6), suggesting that this region may act as a switch that regulates Sp-CycD at the
onset of gastrulation. As noted, region 19’s activity showed much less variation than
those of other active regions (Fig. 2.5; compare Experiments #5, 2 and 3). Therefore,
region 19 may be under especially strong control.
As a control, activities of region 2-linked 13-tag vectors at 12 hpf (Fig. 2.7A), and
13-tag vectors linked to unique regions (Fig. 2.7B) were compared. There was
significantly less variation between activities of 13-tag reporters linked only to region 2

50
than between those linked to different regions, indicating that differences in activity
among regions could mostly be attributed to region-specific differences rather than 13-tag
reporter-specific differences.

51
Fig 2.7. Testing for variations in activity attributed to differences between 13-tag
reporters at 12 hpf. A. Testing for variation in expression between activities of the same
region (region 2) when linked to different 13-tag reporters. Two biological replicates, 1
and 2, each broken down into two graphs, a and b, are presented. In each case, “a” shows
the activity of each individual region 2-linked reporter, whereas “b” shows the grand
mean of the activities of all region 2-linked reporters, along with the standard deviation
of those means. B. The grand means and standard deviations resulting from averaging
the activities of multiple regions (not just region 2) when linked to 13-tag reporters. To
construct these graphs, the average activity level and standard deviation for all regions at
12 hpf was determined for each experiment in Fig. 2.3. Note that the standard deviations
are much less when all 13-tag reporters are linked to the same region (region 2) than
when these reporters are all linked to different regions.

52
2.2.4 Identification of candidate cis-regulatory modules
Since the sizes of the identified regulatory regions ranged from ~2-5 kb (Fig.
2.3A), additional analysis was needed to identify CRMs, which are generally only up to
several hundred bp [45]. By using a combination of computational approaches to analyze
each region (Fig. 2.8; Appendix D, Fig. D.1; Appendix E, Fig. E.1), candidate CRMs
were identified within each. The activities of several of these were verified
experimentally. (Please note: Several transcription factor binding sites highlighted in
Appendices D and E may only be briefly introduced in this Chapter, or not mentioned at
all. Further discussion is provided in Chapter 3).
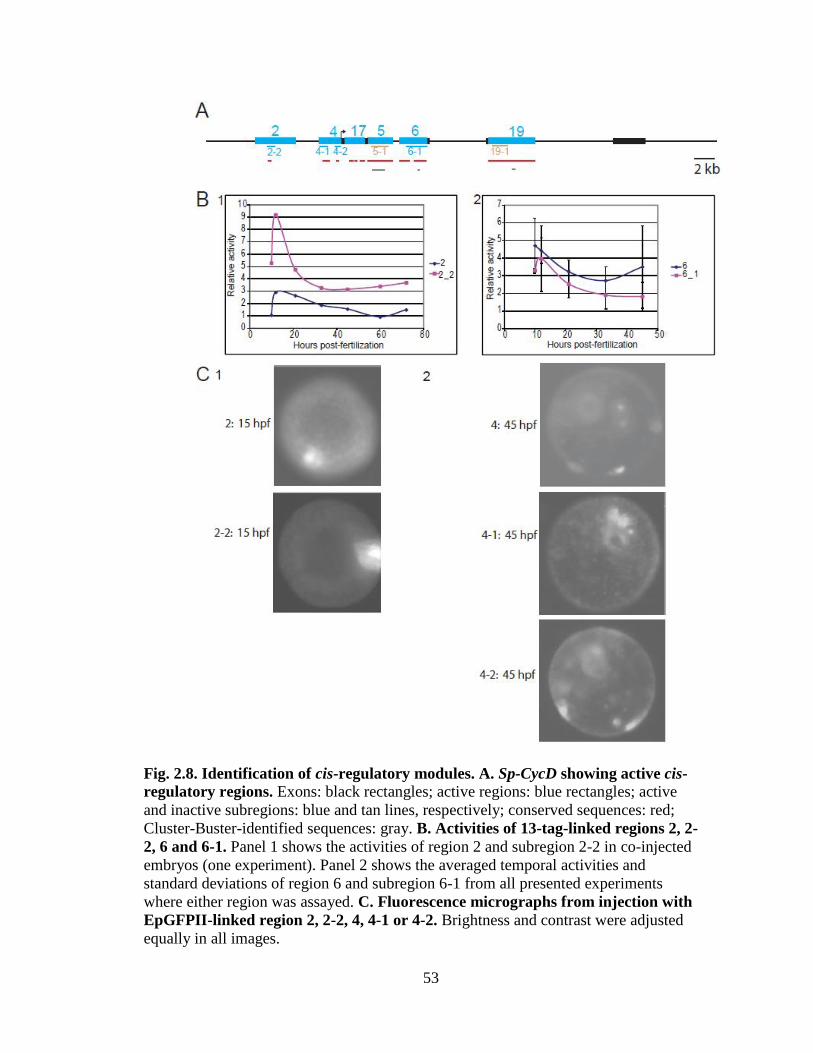
53
Fig. 2.8. Identification of cis-regulatory modules. A. Sp-CycD showing active cis-
regulatory regions. Exons: black rectangles; active regions: blue rectangles; active
and inactive subregions: blue and tan lines, respectively; conserved sequences: red;
Cluster-Buster-identified sequences: gray. B. Activities of 13-tag-linked regions 2, 2-
2, 6 and 6-1. Panel 1 shows the activities of region 2 and subregion 2-2 in co-injected
embryos (one experiment). Panel 2 shows the averaged temporal activities and
standard deviations of region 6 and subregion 6-1 from all presented experiments
where either region was assayed. C. Fluorescence micrographs from injection with
EpGFPII-linked region 2, 2-2, 4, 4-1 or 4-2. Brightness and contrast were adjusted
equally in all images.

54
Region 2 contains a 0.5 kb subregion, 2-2, encompassing sequence conserved at >
90% with Lv-CycD (Fig. 2.8A; Appendix D, Fig. D.1). Experimental analysis using both
13-tag and EpGFPII-linked versions of region 2 and subregion 2-2 showed that subregion
2-2’s temporal activity mirrored region 2’s (Fig. 2.8B, panel 1; Fig. 2.9). Further analysis
showed that the activities of each were detected at blastula stage by fluorescence
microscopy (Figs. 2.8A and 2.8C, panel 1). Together, these findings indicate that
subregion 2-2 contains a CRM.
Fig. 2.9. Comparison of the temporal activities of region 2 and subregion 2-2 when
linked to the reporter vector EpGFPII. The plots are from separate experiments
derived from different embryo cultures, in each of which EpGFPII-linked region 2 or
subregion 2-2 were separately injected. Activity in each case is with respect to that at the
time point with the lowest activity. Error bars for region 2 (error bars are small) are
standard deviations of two technical replicates done on a representative biological
replicate. Note that error bars are not shown for subregion 2-2, for which
one technical replicate of one biological replicate is shown.
Region 4 contains two active subregions (4-1 and 4-2; Fig. 2.8A). Subregion 4-1
overlaps partly with conserved sequence (Fig. 2.8A; Appendix D, Fig. D.1), and bears a
potential Runx site (Appendix D, Fig. D.1). Sequence within subregion 4-1 was
previously found by chromatin immunoprecipitation to bind the Runx protein SpRunt-1,
which was shown to regulate Sp-CycD [63]. Subregion 4-2 contains a 22 bp conserved
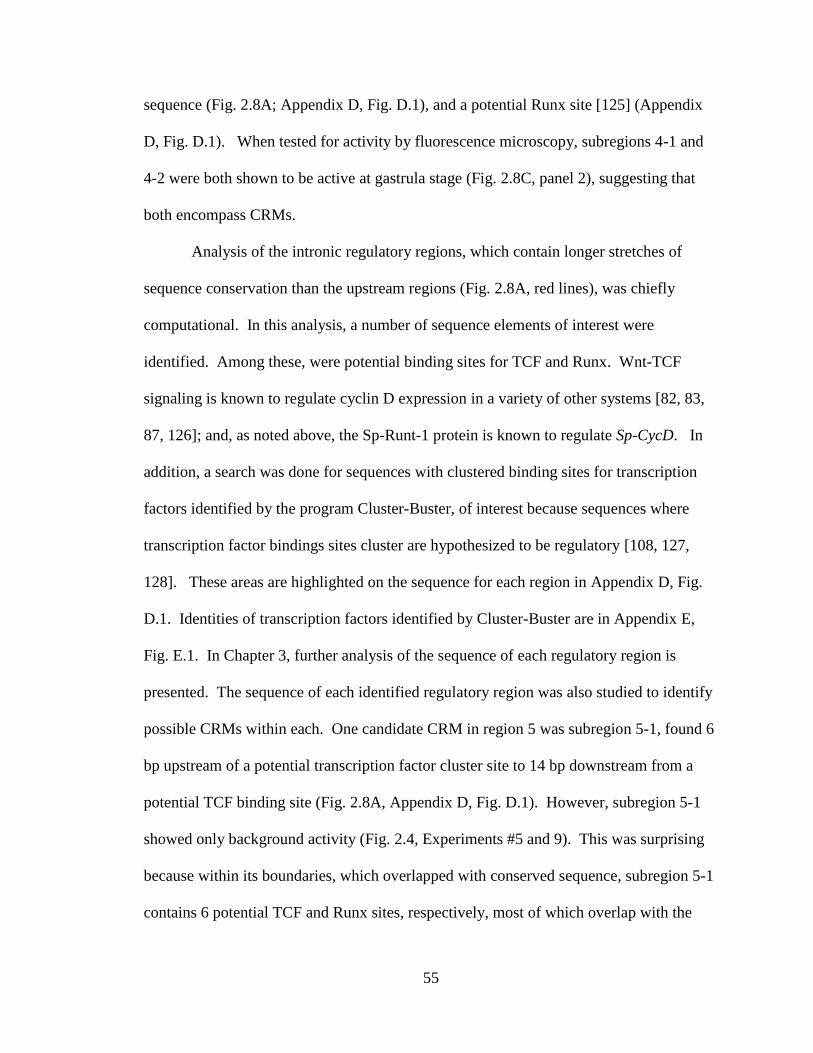
55
sequence (Fig. 2.8A; Appendix D, Fig. D.1), and a potential Runx site [125] (Appendix
D, Fig. D.1). When tested for activity by fluorescence microscopy, subregions 4-1 and
4-2 were both shown to be active at gastrula stage (Fig. 2.8C, panel 2), suggesting that
both encompass CRMs.
Analysis of the intronic regulatory regions, which contain longer stretches of
sequence conservation than the upstream regions (Fig. 2.8A, red lines), was chiefly
computational. In this analysis, a number of sequence elements of interest were
identified. Among these, were potential binding sites for TCF and Runx. Wnt-TCF
signaling is known to regulate cyclin D expression in a variety of other systems [82, 83,
87, 126]; and, as noted above, the Sp-Runt-1 protein is known to regulate Sp-CycD. In
addition, a search was done for sequences with clustered binding sites for transcription
factors identified by the program Cluster-Buster, of interest because sequences where
transcription factor bindings sites cluster are hypothesized to be regulatory [108, 127,
128]. These areas are highlighted on the sequence for each region in Appendix D, Fig.
D.1. Identities of transcription factors identified by Cluster-Buster are in Appendix E,
Fig. E.1. In Chapter 3, further analysis of the sequence of each regulatory region is
presented. The sequence of each identified regulatory region was also studied to identify
possible CRMs within each. One candidate CRM in region 5 was subregion 5-1, found 6
bp upstream of a potential transcription factor cluster site to 14 bp downstream from a
potential TCF binding site (Fig. 2.8A, Appendix D, Fig. D.1). However, subregion 5-1
showed only background activity (Fig. 2.4, Experiments #5 and 9). This was surprising
because within its boundaries, which overlapped with conserved sequence, subregion 5-1
contains 6 potential TCF and Runx sites, respectively, most of which overlap with the
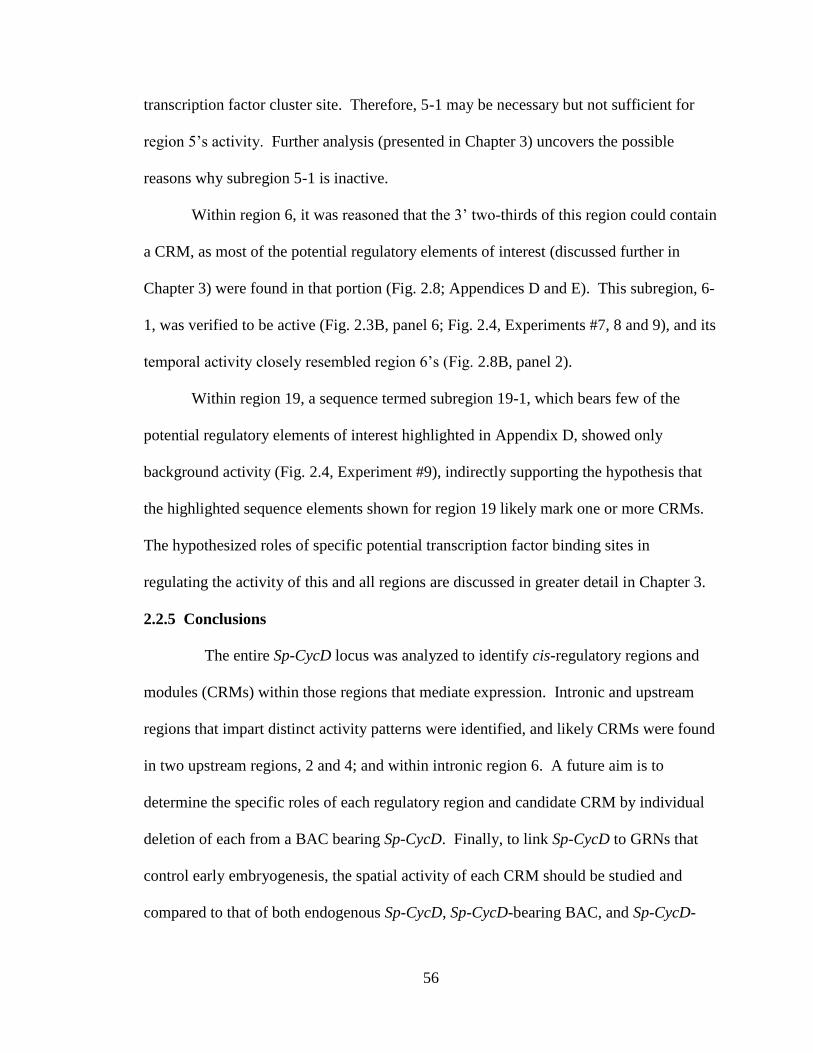
56
transcription factor cluster site. Therefore, 5-1 may be necessary but not sufficient for
region 5’s activity. Further analysis (presented in Chapter 3) uncovers the possible
reasons why subregion 5-1 is inactive.
Within region 6, it was reasoned that the 3’ two-thirds of this region could contain
a CRM, as most of the potential regulatory elements of interest (discussed further in
Chapter 3) were found in that portion (Fig. 2.8; Appendices D and E). This subregion, 6-
1, was verified to be active (Fig. 2.3B, panel 6; Fig. 2.4, Experiments #7, 8 and 9), and its
temporal activity closely resembled region 6’s (Fig. 2.8B, panel 2).
Within region 19, a sequence termed subregion 19-1, which bears few of the
potential regulatory elements of interest highlighted in Appendix D, showed only
background activity (Fig. 2.4, Experiment #9), indirectly supporting the hypothesis that
the highlighted sequence elements shown for region 19 likely mark one or more CRMs.
The hypothesized roles of specific potential transcription factor binding sites in
regulating the activity of this and all regions are discussed in greater detail in Chapter 3.
2.2.5 Conclusions
The entire Sp-CycD locus was analyzed to identify cis-regulatory regions and
modules (CRMs) within those regions that mediate expression. Intronic and upstream
regions that impart distinct activity patterns were identified, and likely CRMs were found
in two upstream regions, 2 and 4; and within intronic region 6. A future aim is to
determine the specific roles of each regulatory region and candidate CRM by individual
deletion of each from a BAC bearing Sp-CycD. Finally, to link Sp-CycD to GRNs that
control early embryogenesis, the spatial activity of each CRM should be studied and
compared to that of both endogenous Sp-CycD, Sp-CycD-bearing BAC, and Sp-CycD-

57
bearing BAC in which each of the regions in question has been individually deleted. In
Chapter 3, further analysis of the sequence of each regulatory region is presented in order
to gain better insight into how the expression of Sp-CycD could be regulated by
endomesoderm and ectoderm-specifying transcription factors expressed during
embryogenesis.

58
CHAPTER 3
POSSIBLE LINKAGES OF THE REGULATORY REGIONS OF SP-CYCD
TO DEVELOPMENTAL SIGNALING PATHWAYS AND LINEAGE
SPECIFYING TRANSCRIPTION FACTORS
3.1 Overview
During development, cis-regulatory modules (CRMs) carry out their tasks by
binding to transcription factors that are expressed within the cells as development
proceeds. In S. purpuratus, the set of transcription factors that is expressed during
embryogenesis is well worked out [129]. As presented in Chapter 1, transcription factors
that regulate development do so via Gene Regulatory Networks (GRNs).
In Chapter 2, a cis-regulatory analysis of Sp-CycD during development was
described. In addition, the sequence of each active regulatory region was analyzed to
identify candidate transcription factors that could potentially regulate each region's
activity (Appendices D and E). In Chapter 2, only a preliminary discussion of the results
of this analysis was provided. The purpose of this Chapter is to provide a more in depth
analysis. In addition, at the end of the chapter, how Sp-CycD itself could regulate the
expression of developmental regulatory genes will be discussed.
In addressing how Sp-CycD, through its regulatory regions, could be regulated
by specific, developmentally-expressed transcription factors, this Chapter discusses a
number of different groups of transcription factors. The first group comprises
transcription factors expressed within the endomesoderm, the lineage that gives rise to
the endoderm and mesoderm lineages. This lineage is one of two major lineages in the
embryo where expression of Sp-CycD becomes confined during and after gastrulation

59
[62]. Insight into how this localized expression is controlled can be gained by identifying
transcription factors active within that lineage that could bind to the regulatory regions of
Sp-CycD. From the large set of transcription factors expressed within the endomesoderm
GRN [55], focus will be made on a subset of transcription factors that are expressed
within a conserved subcircuit that plays a central role in the specification of endoderm
and mesoderm from that lineage [130, 131]. Since the transcription of the genes
expressed within the endomesoderm is largely induced by two signaling pathways, the
Wnt-beta catenin and Delta-Notch pathways [111], available evidence that transcription
factors activated directly downstream from these two signaling pathways regulate the
expression of Sp-CycD is given. This Chapter also presents evidence that Runx
transcription factors could regulate the transcription of Sp-CycD. As discussed in
Chapter 1, Runx transcription factors act in a context-dependent manner to regulate the
transcription of genes, in part, by inducing the recruitment of other transcription factors
[132]. Finally, since, along with the endoderm, Sp-CycD becomes confined to the oral
ectoderm after gastrulation [62], the evidence that the transcription of Sp-CycD could be
regulated by transcription factors expressed within the GRN that regulates the
development of the oral ectoderm is discussed. While this Chapter is essentially
conjecture, it provides the basis for future work.
3.2 Comparing the expected and actual number of binding sites for transcription
factors of interest
As described in section 3.1 above, the regulatory regions of Sp-CycD identified
in Chapter 2 were analyzed for binding sites for transcription factors present in GRNs
active in developmental lineages where Sp-CycD is expressed during embryogenesis.
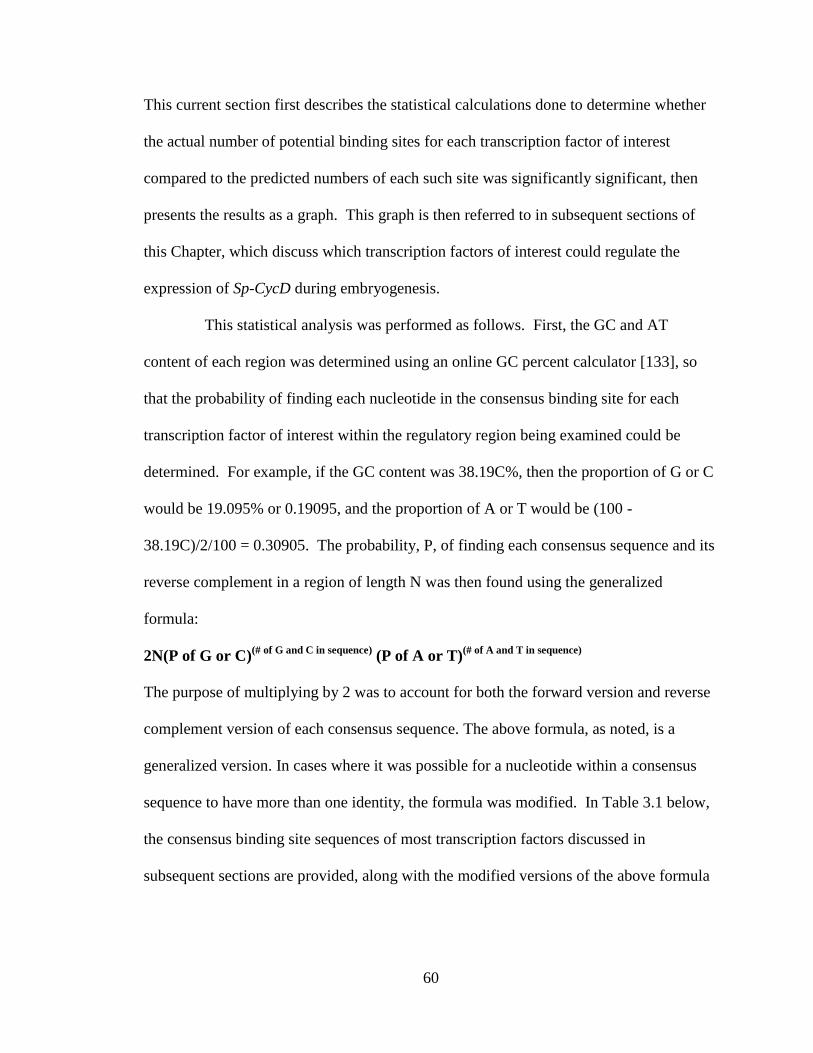
60
This current section first describes the statistical calculations done to determine whether
the actual number of potential binding sites for each transcription factor of interest
compared to the predicted numbers of each such site was significantly significant, then
presents the results as a graph. This graph is then referred to in subsequent sections of
this Chapter, which discuss which transcription factors of interest could regulate the
expression of Sp-CycD during embryogenesis.
This statistical analysis was performed as follows. First, the GC and AT
content of each region was determined using an online GC percent calculator [133], so
that the probability of finding each nucleotide in the consensus binding site for each
transcription factor of interest within the regulatory region being examined could be
determined. For example, if the GC content was 38.19C%, then the proportion of G or C
would be 19.095% or 0.19095, and the proportion of A or T would be (100 -
38.19C)/2/100 = 0.30905. The probability, P, of finding each consensus sequence and its
reverse complement in a region of length N was then found using the generalized
formula:
2N(P of G or C)(# of G and C in sequence)
(P of A or T)(# of A and T in sequence)
The purpose of multiplying by 2 was to account for both the forward version and reverse
complement version of each consensus sequence. The above formula, as noted, is a
generalized version. In cases where it was possible for a nucleotide within a consensus
sequence to have more than one identity, the formula was modified. In Table 3.1 below,
the consensus binding site sequences of most transcription factors discussed in
subsequent sections are provided, along with the modified versions of the above formula

61
used to calculate the predicted number of forward and reverse complement binding sites
for each transcription factor in a regulatory region of sequence length N.
Table 3.1 Formulas used to determine the expected number of binding sites for the given
consensus sequences in regulatory regions of length N.
Note: Lowercase “n” within a sequence denotes any nucleotide; capital “N” in a formula
denotes sequence length; and “P” in a formula denotes probability. The consensus
sequences were determined by examining the references cited below. These sequences
are composites of the sequences provided in the references cited in this table. The figure
legend of Appendix D, Fig. D.1 shows the original sequences that were used to determine
the consensus sequences shown in this table.
Bra
Consensus sequence: (A/G)(A/T)(A/T)nTn(A/G)CAC(C/T)T
Formula: 2N(PA+PG)^2(PA+PT)^2(PT or PA)^3(PC)^2(PC+PT)^1
Reference for consensus sequence: [134]
FoxA
Consensus sequence: (A/G)(A/C)(A/C)T(G/A)TT(A/T/G)(A/T)TT(T/C)
Formula: 2N(PA+PG)^2(PA+PC)^2(PA or PT)^5(1-PC)^1(PA+PT)^1(PT+PC)^1
Reference for consensus sequence: Reverse complement of sequences identified by
Cluster-Buster [127]
GataC
Consensus sequence: (T/G/A)(T/A)(G/C)AGACT(T/A)AGC(T/G)
Formula: 2N(1-PC)^1(PT+PA)^2(PC+PG)^1(PA or PT)^4(PC or PG)^4(PT+PG)^1
References for consensus sequence: Gata-1 binding sites identified by Transfac [135]
were stated to be GataC sites, because GataC is a homolog of Gata-1 [136].
Su(H)
Consensus sequence: (C/G)(G/A)TG(A/G)GA(A/T/G)
Formula: 2N(PC+PG)^1(PG+PA)^2(PA or PT)^2(PG)^2(1-PC)^1
Reference for consensus sequence: [137]
Runx
Consensus sequence: (C/T)G(C/T)GGTn
Formula: 2N(PC+PT)^2(PG)^3(PT)^1
References for consensus sequence: [63, 125]
TCF
Consensus sequence: ACAAAG
Formula: 2N(PA)^4(PA or PG)^2
References for consensus sequence: Cited in [63].

62
Fig. 3.1 on page 64 presents the predicted and actual numbers of potential
binding sites in each regulatory region for the transcription factors presented in Table 3.1,
and indicates whether the difference between predicted and actual values are statistically
significant, as determined by Goodness of Fit Tests (G Tests) [138], by providing the p
values in each case of a statistically significant difference. The calculations used to
perform these tests are shown in Appendix F, Fig. F.1 (see separate Excel file provided).
As described in Robin et al., the Goodness of Fit Test, can be used to determine whether
a sequence motif is significantly more or less represented in one sequence than another
[139]. Although Robin et al. were comparing counts of motifs in two different
sequences, the Goodness of Fit Test was appropriate in the individual analysis of each
regulatory region of Sp-CycD because the distributions of the predicted numbers of each
binding site are not normally distributed. Rather, each starts at zero, rises to a mean that
is the predicted number of binding sites, then decreases to successively smaller values.
Each of these distributions is therefore skewed to the left. As shown in Appendix F (in
separate Excel file), each G test examined sufficient numbers of binding sites to be
reliable, because, for each binding site, the G score was calculated by using the predicted
and actual numbers of not only the binding site in question, but also, its non-version.
For example, region 2 had 2.4 expected Otx binding sites and about 598.1 expected non-
Otx binding sites. These non-Otx binding sites would be motifs of the same length as the
Otx binding site, but with different sequences. Therefore, information encompassed in
the whole sequence was taken into account when undertaking the statistical calculation.
In the current example, the sequence would be considered a population of Otx binding
sites and non-Otx binding sites, ultimately summing up to all sites of the same length in
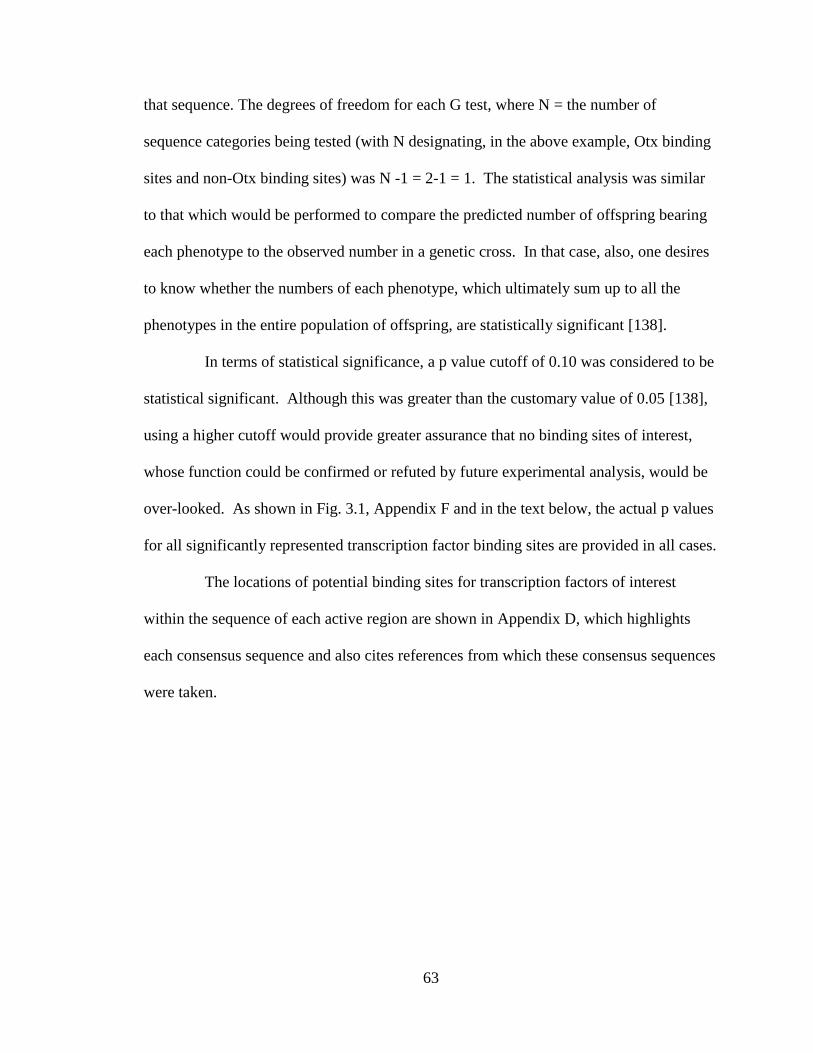
63
that sequence. The degrees of freedom for each G test, where N = the number of
sequence categories being tested (with N designating, in the above example, Otx binding
sites and non-Otx binding sites) was N -1 = 2-1 = 1. The statistical analysis was similar
to that which would be performed to compare the predicted number of offspring bearing
each phenotype to the observed number in a genetic cross. In that case, also, one desires
to know whether the numbers of each phenotype, which ultimately sum up to all the
phenotypes in the entire population of offspring, are statistically significant [138].
In terms of statistical significance, a p value cutoff of 0.10 was considered to be
statistical significant. Although this was greater than the customary value of 0.05 [138],
using a higher cutoff would provide greater assurance that no binding sites of interest,
whose function could be confirmed or refuted by future experimental analysis, would be
over-looked. As shown in Fig. 3.1, Appendix F and in the text below, the actual p values
for all significantly represented transcription factor binding sites are provided in all cases.
The locations of potential binding sites for transcription factors of interest
within the sequence of each active region are shown in Appendix D, which highlights
each consensus sequence and also cites references from which these consensus sequences
were taken.

64
Fig. 3.1. Number of potential binding sites in regions and subregions of Sp-CycD for
selected transcription factors discussed in the text. For each transcription factor
binding site in each regulatory region, both the predicted number and actual number of
potential binding sites in each region are provided. Whether the difference between the
predicted and actual number of binding sites for each transcription factor in each
regulatory region was significant, as determined by a Goodness of Fit Test, is indicated in
each graph by the p values appearing above different comparisons. If a p value is not
shown, this indicates that the difference between actual and predicted number of a given
binding site was not statistically significant. Statistical calculations were done as
described in the current section (3.2) and associated Table 3.1.
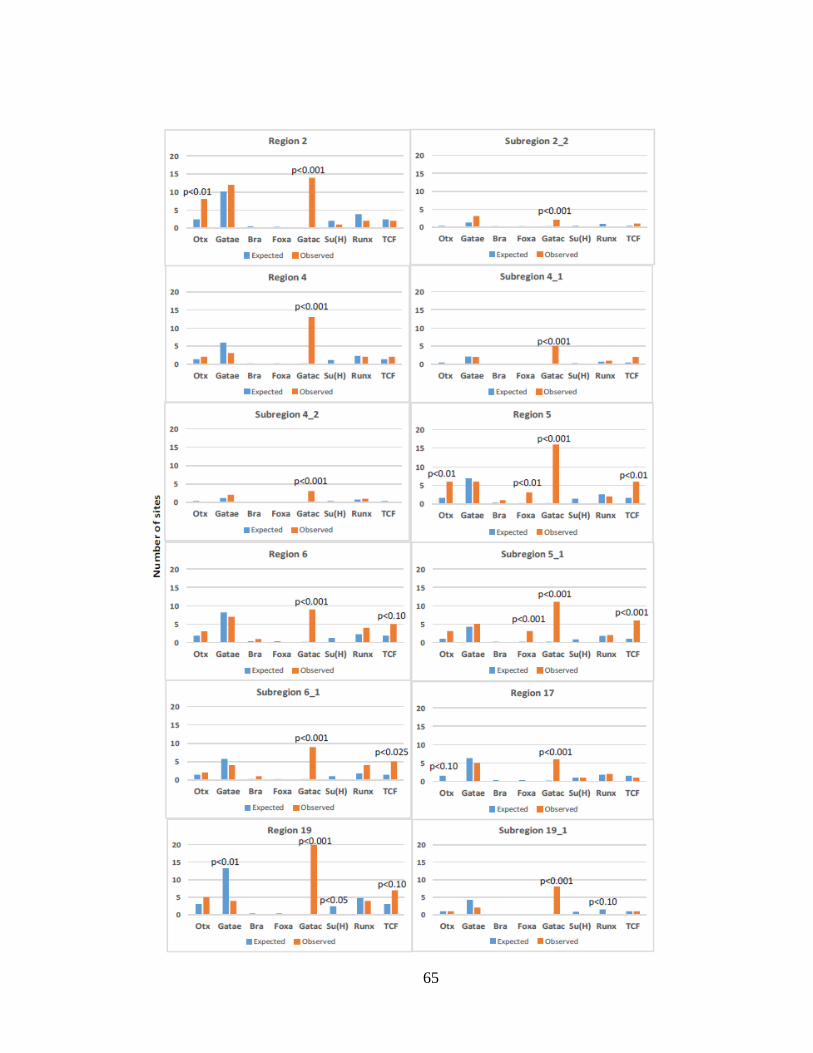
65

66
The expression profiles of transcription factors that could regulate the
expression of Sp-CycD have been worked out [124]. The expression profiles of some of
these transcription factors, taken directly from SpBase [3] are reproduced in Fig. 3.2.
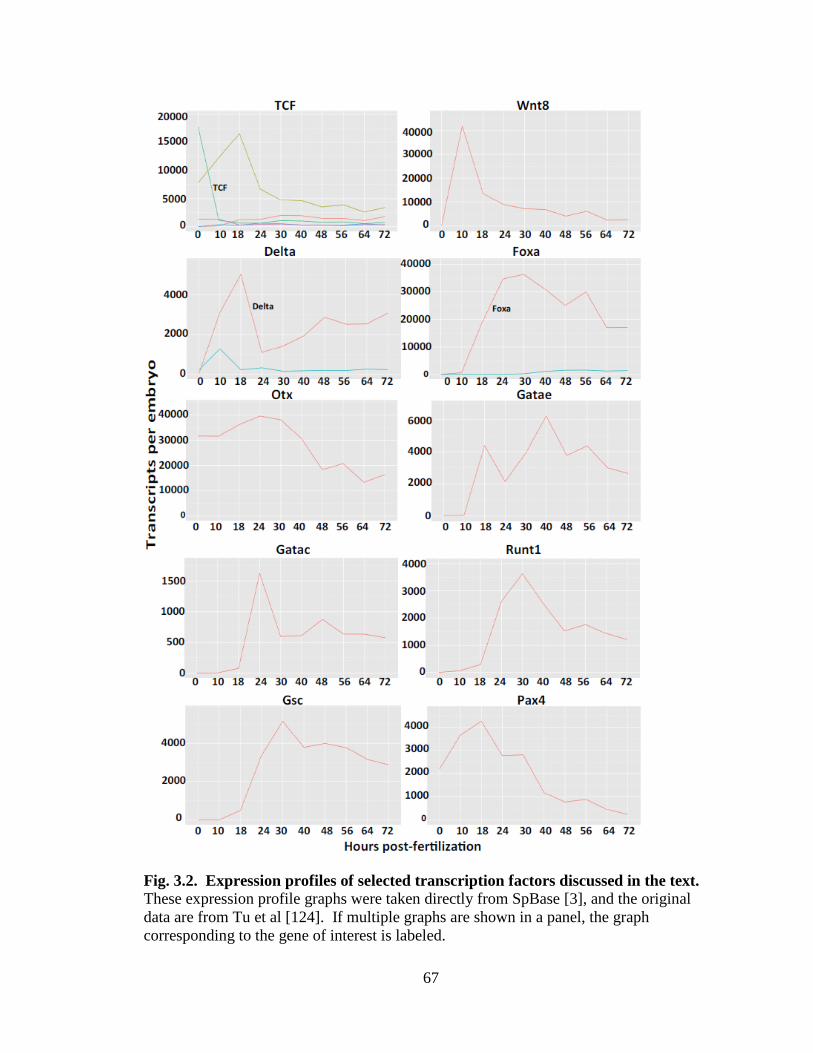
67
Fig. 3.2. Expression profiles of selected transcription factors discussed in the text. These expression profile graphs were taken directly from SpBase [3], and the original
data are from Tu et al [124]. If multiple graphs are shown in a panel, the graph
corresponding to the gene of interest is labeled.
68
3.3 Are transcription factors directly downstream of Wnt-beta catenin and Delta-
Notch signaling regulators of Sp-CycD expression during embryogenesis?
In S. purpuratus, the developmental divergence of the endodermal and
mesodermal lineages from endomesoderm (one of the two major areas, the other being
oral ectoderm, where Sp-CycD expression becomes confined as embryogenesis proceeds
[62]) is primarily directed by the Delta-Notch and Wnt-beta catenin signaling pathways
[111, 140, 141]. Endodermal and mesodermal fates are attained by gradual activation of
solely Wnt-beta catenin signaling in presumptive endoderm and Delta-Notch signaling in
presumptive mesoderm [141]. Within presumptive mesoderm, Delta-Notch signaling
inhibits expression of Hox 11/13B, which is a key transcription factor in an endoderm-
specific gene regulatory subcircuit that contains the transcription factors Bra, Foxa, and
Blimp1b. When allowed to be active, this regulatory subcircuit also leads to the
maintenance of expression of the Wnt ligand. Furthermore, in presumptive mesoderm,
Delta-Notch signaling triggers export of TCF transcription factors from cell nuclei. This
makes these cells resistant to Wnt signaling, prevents them from becoming induced to
become endoderm, and sets them on a developmental trajectory to become mesoderm
[141]. Therefore, one role for Delta-Notch signaling within presumptive mesoderm is an
inhibitory one: inhibiting the expression of genes involved in the specification of
endoderm.
The above description would suggest that mesoderm formation induced through
Delta-Notch signaling takes place solely through a passive process – the inhibition of
Wnt signaling. However, Su(H), the transcription factor induced by Delta-Notch
signaling, directly activates expression of the transcription factors HesC, Gcm and Gatae

69
in presumptive non-skeletogenic mesoderm [55]. Regarding presumptive endoderm,
since Hox 11/13B is not inhibited by Delta-Notch signaling in this lineage, expression of
the Wnt ligand is able to be maintained there. This activates beta-catenin, which interacts
with the TCF transcription factor, converting it from an inhibitor to an activator of
transcription of endodermal-specific genes. This further sets this region on a trajectory to
become endoderm [141].
To gain insight into how the expression of Sp-CycD might be regulated during
the specification of endoderm and mesoderm, the active regulatory regions within it were
queried for possible binding sites for the above described transcription factors whose
expression is regulated by Wnt-beta catenin and Delta-Notch signaling (Fig 3.1;
Appendix D, Fig. D.1).
There is evidence, based on sequence analysis of active regions for potential TCF
binding sites, that Sp-CycD expression is regulated by the Wnt-beta catenin-TCF pathway
(Fig. 3.1; Appendix D, Fig. D.1; Appendix F, Fig. F.1). Of the active regulatory regions,
regions 5 (p<0.01), 6 (p<0.10) and 19 (p<0.10) all have significantly more potential TCF
binding sites than would be predicted by chance (Fig. 3.1; G-test results in Appendix F,
Fig. F.1). Potential binding sites for TCF within region 5 all fall within subregion 5-1
(Appendix D), which, as described in Chapter 2 (Fig. 2.4), is an inactive subregion. This
does not mean that these TCF sites are non-functional. The fact that there are 6 such
potential sites within a relatively short sequence argues against that idea, as does the fact
that this number of TCF binding sites in subregion 5-1 compared to the number predicted
is clearly statistically significant (p value <0.001) (Fig. 3.1; Appendix F). Rather, it is
hypothesized based on these findings that TCF is necessary but not sufficient to induce

70
the activity of region 5. Regarding region 6, all of the potential TCF binding sites fall
within subregion 6-1, (Appendix D, Fig. D.1). In addition, like region 6, the number of
TCF binding sites compared to the number predicted in subregion 6-1 is statistically
significant (p<0.025; Fig. 3.1 and Appendix F, Fig. F.1). This finding supports the
proposition that TCF may regulate the activity of region 6, and that of subregion 6-1
within it.
Region 19 has the greatest number of potential TCF binding sites of all the active
regions (Fig. 3.1; Appendix D, Fig. D.1). In addition, the number of such sites is
significantly more than would be predicted (p value < 0.10; see Appendix F, Fig. F.1; and
Fig. 3.1). Therefore, TCF likely plays a role in regulating the activity of region 19. This
hypothesis is further supported based on the locations of the potential TCF binding sites
within active region 19 and inactive subregion 19-1. All but one of the 7 potential TCF
binding sites fall outside of subregion 19-1 (Appendix D, Fig. D.1). Since region 19 as a
whole is active, this finding further strengthens the hypothesis that TCF regulates the
activity of region 19. As discussed below, region 19 contains binding sites for other
potentially regulatory transcription factors as well.
To determine which regulatory regions might be regulated by Delta-Notch
signaling, potential Su(H) binding sites in the regulatory regions of Sp-CycD were
searched for based on the sequences of Su(H) binding sites given in a 2006 paper by
Ransick and Davidson [137]. The only potential Su(H) binding sites were found within
regions 2 and 17, which each bore one such site. However, this number was not
statistically significant for either of these regions, as determined by a G test (Fig. 3.1;
71
Appendix F, Fig. F.1). Related to this, Region 19, which was predicted, based on its
length to have ~2 Su(H) binding sites, bore none, significantly less than expected (p <
0.05). None of the active regions had any identified binding sites for the transcription
factors HesC or Gcm, whose transcription within presumptive non-skeletogenic
mesoderm is directly activated by Su(H) [55]. However, Su(H) also activates the
expression of Gatae in non-skeletogenic mesoderm [55]. Region 19, which, as discussed
later in this Chapter, could play an important role during gastrulation, when mesodermal
cells, such as blastocoelar cells, delaminate from the archenteron [142], has significantly
over-represented binding sites for Gatae (p < 0.01; see Fig. 3.1 and Appendix F).
Therefore, Delta-Notch signaling could indirectly regulate the expression of Sp-CycD
through region 19 by activating expression of Gatae.
There is additional evidence that Delta-Notch signaling could indirectly regulate
the temporal transcription of Sp-CycD. As described near the end of section 3.4, the
regulatory regions of Sp-CycD all contain many potential binding sites for Gatac at levels
much greater than would be predicted by chance (see Fig. 3.1; in all cases, p < 0.001).
Because this transcription factor is activated downstream from Delta-Notch signaling
[143], Delta-Notch signaling could regulate the expression of Sp-CycD indirectly via this
transcription factor.
In addition, Delta-Notch signaling could act in another capacity – an inhibitory
one. As described above, Delta-Notch signaling during embryogenesis in sea urchin
leads, within presumptive mesoderm, to the inhibition of a subcircuit containing the
transcription factors Bra, Foxa, and Blimp1b that are involved in the specification of

72
endoderm. Of these, as discussed again below, Foxa is the transcription factor whose
change in expression mediated by Delta-Notch signaling would most likely affect the
expression of Sp-CycD, through region 5. This is because region 5 bears three potential
Foxa binding sites, a statistically significant number (p < 0.01), since this region was not
predicted to bear any such sites (Fig. 3.1). In contrast, Blimp1b binding sites are not
found within any of the regulatory regions of Sp-CycD discovered in this analysis, and
Bra is not statistically over or under-represented in any region.
The explanation for why cyclin D can be expressed in mesoderm may lie partly in
the fact that, while TCF can act as a transcriptional activator, as it does when beta-catenin
is triggered by Wnt signaling to translocate to the nucleus, in the absence of such
signaling, TCF, by complexing with Groucho, acts as a transcriptional repressor [144].
Delta-Notch signaling can trigger export of TCF from the cell nuclei [141]. It is possible
that Delta-Notch signaling, by triggering the export of inhibitory TCF from cell nuclei in
mesoderm, removes this repressive barrier and allows Sp-CycD to be expressed in this
lineage.
One way to test if Delta-Notch signaling regulates the expression of Sp-CycD
would be to compare the transcript levels of cyclin D in control embryos to those in
which Notch signaling was blocked. Notch signaling occurs when the binding of Delta
ligand on one cell binds to the Notch receptor on an adjacent cell, triggering the enzyme
gamma secretase to cleave an intracellular portion of the Notch receptor [145] . Since this
signaling can be blocked by administering inhibitors of gamma secretase [145], it is
73
proposed that such inhibitors could be used to test the effect of inhibiting Notch signaling
on the expression of Sp-CycD during embryogenesis.
3.4 Does a conserved subcircuit that regulates the specification of endoderm and
mesoderm contribute to the regulation of Sp-CycD expression during embryogenesis
in S. purpuratus?
In section 3.3, the roles of Delta-Notch and Wnt-beta catenin-TCF signaling in
possibly regulating the expression of Sp-CycD was discussed. As noted, these pathways
are important in inducing the formation of mesoderm and endoderm, respectively. Based
on this theme – the relationship between regulation of expression of Sp-CycD and the
formation of mesodermal and endodermal lineages, this section explores whether a
conserved subcircuit within the GRN controlling the development of mesoderm and
endoderm could regulate the expression of Sp-CycD. The conservation of this subcircuit
was uncovered through a comparative study of the endomesoderm GRNs of the sea
urchin S. purpuratus and the sea star A. miniata [130, 131]. This study revealed
transcription factors of which both their identities and pattern of linkages to other
transcription factors is conserved. These transcription factors included Blimp1, Otx, Bra,
Foxa, Gatae, Gatac, and Bra [130]. The lineage specifying functions of these
transcription factors were also conserved. That is, in both sea urchin and sea star,
Blimp1, Bra and Foxa contribute to the specification of endoderm; Gatac contributes to
the specification of mesoderm; and Gatae and Otx contribute to the specification of both
endoderm and mesoderm [130]. An important purpose of the conserved subcircuit
between sea urchin and sea star is to ultimately allow the expression of Gatae [131].

74
While, as just noted, this transcription factor is expressed in both mesoderm and
endoderm, its expression is essential for the expression of regulatory genes expressed in
the endoderm [130, 131]. A direct reproduction of a figure from the 2007 paper by this
group is given in Fig. 3.3. Both the transcription factor genes and many of the linkages
between them by which they regulate each other’s expression are conserved in both sea
urchin and sea star.
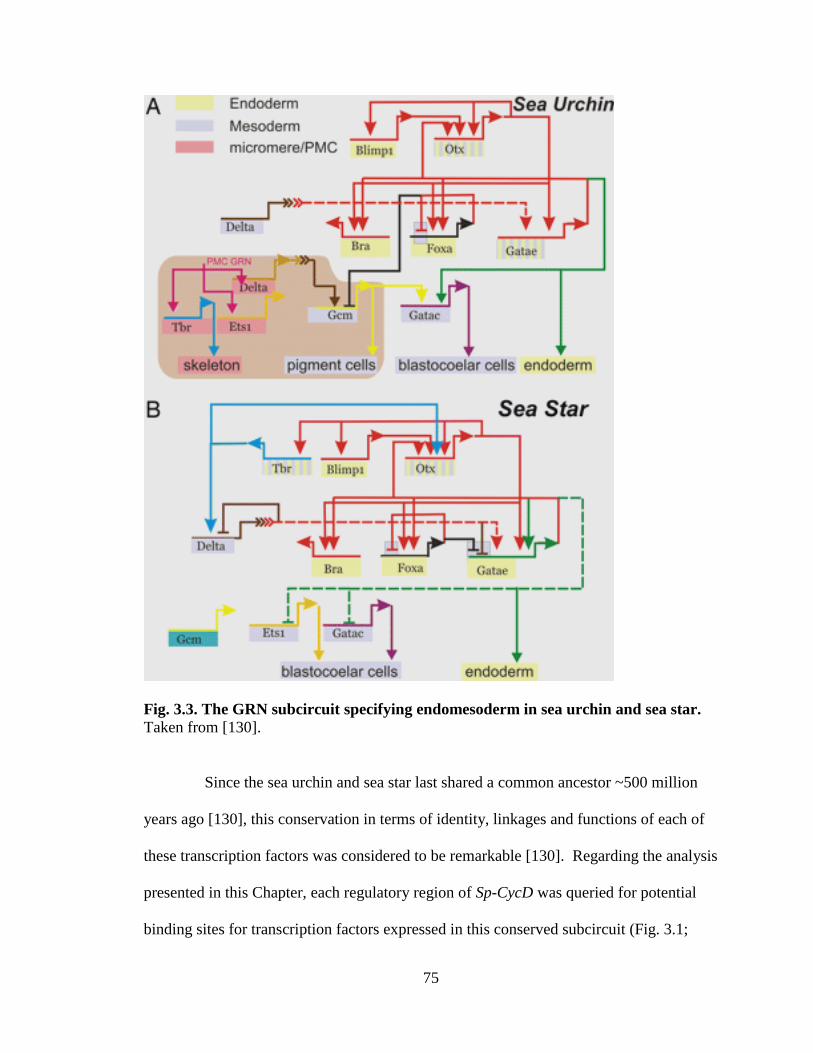
75
Fig. 3.3. The GRN subcircuit specifying endomesoderm in sea urchin and sea star. Taken from [130].
Since the sea urchin and sea star last shared a common ancestor ~500 million
years ago [130], this conservation in terms of identity, linkages and functions of each of
these transcription factors was considered to be remarkable [130]. Regarding the analysis
presented in this Chapter, each regulatory region of Sp-CycD was queried for potential
binding sites for transcription factors expressed in this conserved subcircuit (Fig. 3.1;
76
Appendix F, Fig. F.1). Within this section, each region is discussed separately for
potential binding sites for all transcription factors expressed within this conserved
subcircuit except for Gatac. Since all the regulatory regions bore significantly more
potential binding sites for this transcription factor than would be predicted based on their
lengths (Fig. 3.1; Appendix F, Fig. F.1), and since the number of binding sites were
statistically significant in all cases (Fig. 3.1; Appendix F, Fig. F.1) the possible roles of
this transcription factor in regulating the expression of Sp-CycD are discussed primarily
at the end of this section.
Region 2 is notable for bearing 8 potential binding sites for Otx, which is
expressed in the gut [130] (p < 0.01; Fig. 3.1; Appendix F, Fig. F.1), whereas it would be
predicted to bear only 2 of these binding sites. As shown in Moore et al. [62], one of the
lineages where Sp-CycD becomes confined as development proceeds is the gut. It is
hypothesized that one of the regulatory regions responsible for this expression pattern is
region 2, and that region 2, in part, mediates this through its Otx binding sites.
As described in Chapter 2, region 2 also bears within it an active subregion, 2-2,
whose expression profile is similar in shape to that of region 2 (Chapter 2, Figs. 2.8 and
2.9). None of the potential Otx binding sites in region 2 are within the boundaries of
subregion 2-2. These potential Otx binding sites in region 2 are likely to be important
due to their statistical over-representation (Fig. 3.1; Appendix F, Fig. F.1; p < 0.01).
Binding sites for Otx can also serve as binding sites for the transcriptional repressor Gsc
[146]. It could be argued that lack of binding sites for a repressor, such as Gsc, may
explain why subregion 2-2 has a higher activity profile than region 2. In terms of
activating the activity of subregion 2-2, Gatac could play an important role, as potential
77
binding sites for this transcription factor are over-represented in region 2 (p < 0.001; Fig.
3.1; Appendix F, Fig. F.1). Of note, of the discussed transcription factor binding sites,
only Gatac binding sites are significantly over-represented in subregion 2-2. Therefore,
Gatac may be the only one of the discussed transcription factors that could be activating
subregion 2-2.
Region 4 is most notable for containing an excess of potential Gatac binding
sites (p < 0.001; Appendix F, Fig. F.1; Fig. 3.1). Region 4 does not bear an excess of
actual to predicted binding sites for any other transcription factors conserved within the
conserved endomesoderm-specifying subcircuit. This could indicate that the expression
of this region is controlled primarily by Gatac. Alternatively, the fact that a regulatory
region does not bear a statistically significant number of binding sites for a transcription
factor of interest does not mean that the binding sites it does possess are non-functional.
Indeed, the number of potential Runx binding sites in region 4 (2 actual vs. ~ 2 predicted;
see Fig. 3.1; Appendix F, Fig. F.1) was not significant. However, as described in both
Chapter 2 and section 3.5, one of these Runx binding sites has been confirmed previously
to be functional. As described in Chapter 2, region 4 bears two subregions, 4-1 and 4-2,
which were active (Fig. 2.8), although their temporal activity profiles were not compared
quantitatively to that of region 4. It is of interest that two subregions separated by
intervening sequence, as is the case for subregions 4-1 and 4-2 in region 4 (Appendix D,
Fig. D.1) could both be functional, indicating that both could be separate CRMs.
Region 5 was of strong interest due to it having by far the most robust activity
of all the active regulatory regions identified in Sp-CycD, showing statistically significant
activity at all developmental time points examined from when Sp-CycD becomes induced

78
at ~10-12 hours post-fertilization (hpf) through mid-gastrula stage (Chapter 2, Fig. 2.3).
These results would indicate that region 5 would have many linkages to transcription
factors expressed in the endomesoderm GRN. The analysis of region 5’s sequence for
binding sites for such transcription factors indicates that, indeed, this may be the case.
Region 5 bears six potential binding sites for Gatae (Fig. 3.1; Appendix D, Fig. D.1),
although this number was not significantly more than the ~ 7 such sites predicted (Fig.
3.1; Appendix F, Fig. F.1). Region 5 also contains three potential binding sites for Foxa
(Fig. 3.1) compared to none predicted (p value <0.01; Fig. 3.1; Appendix F, Fig. F.1).
What is especially interesting regarding the potential Foxa binding sites is that region 5 is
the only region with binding sites for this endoderm-specifying transcription factor (Fig.
3.1). The expression of this transcription factor commences at ~10 hpf (as shown at
SpBase [3]), which would support the hypothesis that it could contribute to the induction
of region 5’s activity. The potential binding sites of Foxa are all within subregion 5-1
(Appendix D, Fig. D.1). The fact that this subregion is inactive does not mean that these
Foxa sites are non-functional. Given their over-representation within this subregion,
three sites compared to the zero predicted by chance (p < 0.001) (Fig. 3.1; Appendix F,
Fig. F.1), that hypothesis is unlikely. Rather, it is proposed that the Foxa sites are
necessary but not sufficient for the activity of region 5.
In a related finding, region 5 bears a potential binding site for the endoderm-
expressed factor Bra. Although the possession of one such site was not statistically
significant (Appendix F, Fig. F.1; Fig. 3.1), it could still be of interest. Along with region
6 (where the possession of a single potential binding site for Bra is likewise not
statistically significant as shown in Appendix F, Fig. F.1; and Fig. 3.1), region 5 is one of

79
only two of the six regulatory regions that has a binding site for Bra. In support of a
functional role of Bra in regulating the expression of regions 5 and 6, subregion 5-1,
which is inactive (Chapter 2, Fig. 2.4) lacks a potential binding site for Bra, while
subregion 6-1, which, like region 6, is active (Fig. 2.8) contains region 6’s potential Bra
binding site.
Region 5 also bears six potential binding site for Otx (Fig. 3.1), a significant
number (p < 0.01; Fig. 3.1; Appendix F, Fig. F.1). Of interest, the potential binding sites
for Bra and Otx fall in the regions located 5’ and 3’ to inactive subregion 5-1 (Appendix
D, Fig. D.1). The majority of the other potential transcription factor binding sites in
region 5 fall within subregion 5-1. From these findings, it is hypothesized that the
transcription factor binding sites within region 5 that are within the boundaries of
subregion 5-1 are necessary but not sufficient to allow the activity of region 5, and, by
extension, of Sp-CycD. For region 5 to be activated, the above noted Bra and Otx sites,
which are outside the boundaries of subregion 5-1, may be critical.
It would be informative to compare the spatial expression of region 5 to that of
the other regions, and to test the effect of mutating the above noted transcription factor
binding sites on that activity pattern. It would be predicted, based on its possession of
binding sites for both Bra and Foxa, both of which are endoderm-specifying transcription
factors [130], that region 5 would be more strongly expressed in endoderm than the other
regions, but, due to also containing binding sites of transcription factors Gatac and Otx,
(Fig. 3.1), that are expressed in mesoderm; and in both mesoderm and endoderm,
respectively, would also be expressed in mesoderm. Indeed, region 5 may play an
especially important role in allowing Sp-CycD to be expressed in both of these lineages.
80
As has already been partly discussed, region 6 has nearly the same contingent of
transcription factor binding sites as region 5, with most of these sites falling within
subregion 6-1, which shows a similar temporal expression profile to the whole of region
6. However, unlike region 5, region 6 does not include any site for Foxa. In addition,
unlike region 5, which has significantly more than predicted potential binding sites for
Otx, region 6 does not possess sufficient Otx sites compared to the number predicted to
reach statistical significance (Fig. 3.1; Appendix F, Fig. F.1). These observations may
explain why its expression is much lower, in absolute levels, than that of region 5. It
would also be predicted that region 6, along with other regions that lack Foxa, might have
less of a role in mediating the expression of Sp-CycD in endoderm than would region 5.
This would be tested by examining spatial activity profiles of region-linked reporters.
Region 17, the region with the lowest activity level of all the regulatory regions
(Chapter 2), is also notable for bearing five potential binding sites for a transcription
factor from the conserved endoderm-mesoderm specifying subcircuit, Gatae. However,
approximately 6 such sites were predicted, and the possession of five such sites was not
statistically significant (Fig. 3.1; Appendix F, Fig. F.1). However, other than Gatac,
Gatae provides the best candidate for functional analysis, simply because binding sites
for several other candidate regulators were either missing, or were under-represented
(Fig. 3.1; Appendix F, Fig. F.1). Otherwise, compared to the other regulatory regions of
Sp-CycD, region 17 has the least number of potential binding sites for the above
discussed transcription factors. This sparseness of binding sites for regulatory
transcription factors may account for region 17 having the lowest activity of all
discovered regulatory regions of Sp-CycD. This does not mean that this region has an
81
unimportant regulatory role. The fact that its activity continuously rises argues against
this. The fact that its activity is low could in fact argue that this region plays an
important role in mediating the spatial activity of Sp-CycD as this gene’s spatial activity
becomes increasingly restricted after gastrulation. This finding may relate to that of a
cis-regulatory analysis done by Arone and Davidson from 1998 [147], where they
showed that a cis-regulatory module required for expression of the CyIIa gene, which is
expressed after most cell types have already been specified, is much simpler in structure
than that of the cis-regulatory modules controlling the expression of genes that are
expressed earlier in development, when territories are still being specified (as reviewed in
a 1997 paper by the same authors) [148]. Region 17 becomes most active (by ~21 hpf, as
shown in Chapter 2, Fig. 2.6), as Sp-CycD is becoming restricted to cells in well
established territories, such as the gut and oral ectoderm [62]. Based on the work of
Arone and Davidson just described, a relatively simple regulatory structure might
therefore be expected of region 17.
Region 19 was most notable for having a distinctive temporal activity profile
that reproducibly peaked at ~21 hpf, a time point that occurs shortly before gastrulation
begins (Chapter 2, Fig. 2.6). As described in Chapter 2, region 19 contains a subregion,
19-1, which, by itself, is not functional. Located 3’ with respect to subregion 19-1 is
sequence that is rich in potential binding sites for various transcription factors of interest
(Appendix D, Fig. D.1). Four of these transcription factors have numbers of potential
binding sites that occur significantly more often than would be predicted by chance
within the whole of region 19 (Fig. 3.1; Appendix F, Fig. F.1). It should be noted here
that although region 19 possesses fewer potential Runx binding sites that would be

82
predicted based on its length (4 actual vs. ~ 5 predicted, a non-significant difference; Fig.
3.1), one of the potential Runx binding sites overlaps with a potential TCF binding site
(Appendix D, Fig. D.1, toward 3’ end of region 19). This finding is of interest because
region 19 is the only one of the identified regulatory regions of Sp-CycD that shows this
overlap between a potential Runx and TCF binding site. This overlap could indicate that
this potential TCF site is functional, for reasons described in the next section. As
described in section 3.3, TCF acts directly downstream of Wnt-beta catenin signaling that
is involved in the specification of endoderm. Given that the activity of region 19 peaks at
~21 hpf, which just shortly precedes the beginning of gastrulation [43, 111], the
overlapping potential Runx and TCF site in region 19 could contribute significantly to
this temporal activity pattern.
A general observation is that none of the regulatory regions of Sp-CycD had any
potential binding sites for Blimp1 (Fig. 3.1). However, this does not preclude the
regulation of Sp-CycD transcription by this transcription factor. This is because within
the endomesoderm specifying subcircuit conserved between sea urchin and starfish, the
Otx and Blimp1 genes regulate each others’ expression through a positive feedback loop,
in which each gene activates transcription of the other [130]. Blimp1 could thus regulate
the expression of Sp-CycD indirectly by regulating the transcription of Otx, for which, as
noted, regions 2, 5 and 17 have significantly over-represented potential binding sites (Fig.
3.1).
Of potential binding sites for transcription factors in the conserved GRN
subcircuit, the most prevalent are those for TRANSFAC 4.0 flagged binding sites for
Gata1 (Appendix D, Fig. D.1; Fig. 3.1). All the identified regulatory regions of Sp-CycD

83
possess statistically significant numbers of potential binding sites for this transcription
factor (p < 0.001 in all cases; Fig. 3.1; Appendix F, Fig. F.1). These sites were
hypothesized to mark potential binding sites for Gatac, since Gatac is a homolog of
vertebrate Gata1/2/3 [136]. Gatac is expressed strongly in blastocoelar cells, which act as
immune cells, as shown in unpublished work by Rast, and described in [130] and [142].
In addition, the transcription of Gatac is regulated by the Delta-Notch-induced
transcription factor Gcm, and also, by another transcription factor within the conserved
endomesoderm-specifying subcircuit, Gatae [130]. Delta-Notch activated Gatac has also
been shown to be expressed in the non-skeletogenic mesoderm [143] from which the
blastocoelar cells are derived [142]. Delta-Notch signaling could therefore contribute to
the regulation of Sp-CycD expression in non-skeletogenic mesodermal-derived cells, such
as blastocoelar cells, through activation of Gatac.
Also of interest, in several instances (Appendix D, Fig. D.1), the potential Gatac
binding sites overlap with the binding sites for other transcription factors, including TCF,
Gatae, Otx and Runx, indicating potential cooperative interactions. Since the marked
potential Gatac sites are TRANSFAC-identified binding sites for Gata1, they may not all
correspond to Gatac sites. However, any region that possesses such sites would have the
potential to be expressed in blastocoelar cells. This could be readily tested.
3.5 Do Runx transcription factors regulate the expression of Sp-CycD during
embryogenesis in S. purpuratus?
Runx transcription factors are developmentally important proteins that regulate
transcription by interacting with other developmentally expressed transcription factors
[132]. Moreover, Runx transcription factors interact with the two signaling pathways –
84
Wnt-beta catenin and Delta-Notch [132] – that, as described in section 3.3, are involved
in the specification of endoderm and mesoderm. It was shown by Robertson et al. [63]
that SpRunt1 binds to and regulates the expression of the Wnt8 gene, which functions
upstream of TCF. There is also evidence that Runx transcription factors regulate the
expression of cyclin D genes. The embryonically expressed Runx gene SpRunt1 shows
an expression profile similar to that of Sp-CycD, being globally expressed at
mesenchyme blastula stage, then becoming restricted mainly to gut and oral ectoderm
[114]. In addition, as described by Robertson et al. [63], knockdown of SpRunt1 leads to
under-expression of Sp-CycD. Also, as described in Chapter 2, chromatin
immunoprecipitation experiments indicate that SpRunt1 binds to one of the predicted
Runx binding sites in region 4, within sequence corresponding to subregion 4-1. Along
with this, potential Runx binding sites are distributed among several of the regulatory
regions of Sp-CycD.
Since Runx transcription factors carry out their functions by interacting with
other transcription factors, the binding sites of strongest interest included those that were
adjacent to or overlapped for binding sites for other transcription factors discussed in this
Chapter (see Appendix D). This is true for region 2, where, toward the 3’ end, a potential
Runx binding site overlaps with a potential Gatae site; and, as first introduced in the
previous section, for region 19, where a potential Runx binding site overlaps with a
potential binding site for TCF. Regarding the sequence site in region 19 where a
potential Runx binding site overlaps with a potential TCF binding site (Appendix D, Fig
D.1), there is reason to propose that this overlap could be functional, based on the
findings and discussion presented by Robertson et al. [63]. In that study, the transcription

85
of the Wnt8 gene was shown to be regulated by a cis-regulatory element in which a TCF
binding site overlapped on its 3’ end with a Blimp1 binding site. Since it was known that
binding of TCF to can induce looping of that DNA, which in turn can cause nearby
transcription factors that bind to sites in that loop to functionally interact with each other,
it had been predicted by Minokawa et al. that just upstream of the TCF binding site, there
existed the binding site for another transcription factor [63, 101]. Robertson et al.
showed that this was a Runx binding site, and demonstrated that it was functional using
site-directed mutagenesis.
The 3’ end of the overlapping potential TCF and Runx binding sites in region
19 ends at position 4186 (Appendix D, Fig. D.1). Of interest, a potential binding site for
Gatac was found about 50 bp from the 3’ end of the overlapping potential Runx and TCF
binding sites. There were also several other instances of Runx and Gatac binding sites
being in close proximity, sometimes adjacent or overlapping (Appendix D, Fig. D.1). In
addition, analysis of the region 19 sequence with TRANSFAC 4.0 revealed a potential
binding site for C/EBPalpha from position 4182 to 4191 (data not shown), a position that
overlapped with this potential Runx binding site. This latter finding was of interest
because Puig-Kroger et al. (2003) [149] found that Runx and C/EBP transcription factors
regulated the CD11a integrin gene in myeloid cells by binding to overlapping binding
sites within the regulatory region of this gene. In S. purpuratus, blastocoelar cells,
which, which, like myeloid cells, are immunocytes [142], delaminate from the tip of the
ingressing gut [142]. Region 19, its activity peaking at ~21 hpf, could, in addition to
perhaps acting as a switch to contribute to expression during gastrulation, also help
activate expression during the differentiation of future blastocoelar cells.

86
It should be noted that the existence of a Runx binding site without any nearby
binding sites for other transcription factors discussed in this Chapter does not diminish
the potential importance of these sites. One example of such a site would be the earlier
mentioned potential binding site for SpRunt1 in subregion 4-1, which does not overlap
with or fall adjacent to any binding sites for the transcription factors discussed in this
Chapter. There could be other, non-discussed transcription factors with which SpRunt1
could interact. In the case of the Runx binding site in region 4, this site extends from
position 725-731 within this region. Analysis of the region 4 sequence for TRANSFAC
4.0 identified transcription factors revealed binding sites for several nearby transcription
factors, including Sp1 and USF (data not shown). That the Sp1 and Runx binding sites
could function together is based on the finding that an enhancer active in osteoblasts was
bound by both of these transcription factors, although the binding sites were separated by
about 25 bp [150]. From this discussion, it is argued that, although the regulatory regions
of Sp-CycD each bear less than the predicted number of potential Runx binding sites (Fig.
3.1), at least some of these sites, including at least one in region 4, and perhaps those that
may mediate the interaction of Runx with other transcription factors, either are, or could
be functional.
3.6 Is Sp-CycD transcription during embryogenesis regulated by transcription
factors involved in the specification of oral ectoderm?
During and after gastrulation, as noted, the expression of the cyclin D gene in
the sea urchin becomes confined to the endomesoderm, oral ectoderm and ciliary band.
In the previous sections of this Chapter, discussion focused on the transcriptional inputs

87
that might regulate the expression of Sp-CycD in the endomesoderm. The purpose of this
section is to identify transcriptional inputs that could regulate the expression of Sp-CycD
in another region where it becomes confined during and after gastrulation: the oral
ectoderm. The structure of the GRN that contributes to the development of the ectoderm
in S. purpuratus [55, 151] was more recently deciphered than that of the endomesoderm
GRN [152]. The expression patterns of the transcription factors comprising this GRN are
regulated by Nodal signaling, the distribution of which along the oral-aboral axis is
regulated by Lefty and a mitochondrial redox gradient [153-155]. Among the
transcription factors expressed within this GRN [151] that could regulate the expression
of Sp-CycD, focus is made on Pax41 and Gsc. These two transcription factors may play
roles in regulating the expression of Sp-CycD by directly binding to its regulatory
regions. With respect to Gsc, this transcription factor acts as a transcriptional repressor in
the oral ectoderm [151], restricting the expression of a number of genes. In 2001, the
Angerer lab showed if translation of Gsc was blocked, then both gastrulation and the
separation of the ectoderm into oral and aboral lineages were blocked or inhibited [146].
Related to this finding, this transcription factor was shown to be expressed in some cells
of the vegetal plate that later ingressed during gastrulation, and to be strongly expressed
in lineages that became the oral ectoderm [146]. Further study showed that Gsc
competed for the same binding sites as Otx, a transcription factor expressed throughout
the ectoderm (along with endomesoderm, as described in section 3.4). By doing so, Gsc
interfered with the function of Otx in presumptive oral ectoderm, and contributed to the
development of this lineage. Since Otx and Gsc bind to the same sequence, at least some
of the potential Otx binding sites in regulatory regions can also be hypothesized to be
88
potential Gsc binding sites. Regions that bear significantly greater than the predicted
number of binding sites for Otx, and therefore, for Gsc, include regions 2 and 5 (p < 0.01
in both cases; Fig. 3.1; Appendix F, Fig. F.1). One observation that requires further
analysis is that oral ectoderm is one of the areas where Sp-CycD expression becomes
confined as development proceeds [62]. Given that Otx is a transcriptional activator and
Gsc is a repressor, further work is needed to determine how each cooperate to regulate
the expression of Sp-CycD.
As noted, another transcription factor involved in the specification of the oral
ectoderm GRN, Pax4, is likewise a possible candidate for regulating the expression of
Sp-CycD within the oral ectoderm. This transcription factor is expressed relatively early
during development, with it showing its second highest expression level at 10 hpf, before
peaking at 18 hpf (Fig. 3.2, taken from SpBase [3]). Related to this finding, a sequence
within region 5, the region with the highest early activity, identified by Cluster-Buster
[127] as an area where transcription factors might cluster was shown to have a ten closely
spaced potential binding sites for mammalian Pax4, with some of these sites overlapping
(Appendix D, Fig. D.1; Appendix E, Fig. E.1). Although the transcription factor binding
sites identified by Cluster-Buster are not from S. purpuratus, human and mouse Pax4 are
both homologs to Pax4 of S. purpuratus [51]. Therefore, the potential Pax4 binding sites
identified by Cluster-Buster are putative binding sites for Sp-Pax4, which therefore may,
by acting through region 5, medidate the expression of Sp-CycD in oral ectoderm.
Region 5 and 17 have both been described as possibly contributing to the expression of
Sp-CycD in the oral ectoderm, and they may divide their labor. Region 5 may function

89
early, as oral ectoderm is being specified, whereas region 17 may function later, as this
territory becomes a discreet and mature part of the embryo.
Table 3.2 summarizes the major findings for each regulatory region discussed in
both Chapter 2 and the current Chapter.
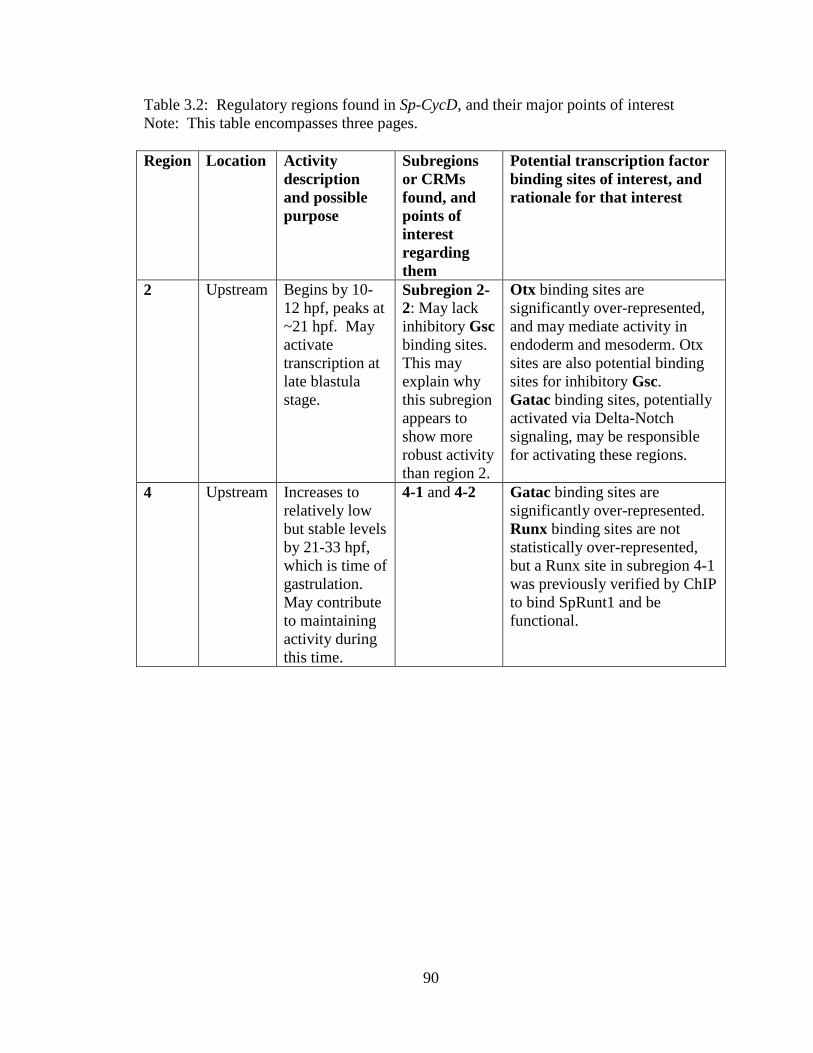
90
Table 3.2: Regulatory regions found in Sp-CycD, and their major points of interest
Note: This table encompasses three pages.
Region Location Activity
description
and possible
purpose
Subregions
or CRMs
found, and
points of
interest
regarding
them
Potential transcription factor
binding sites of interest, and
rationale for that interest
2 Upstream Begins by 10-
12 hpf, peaks at
~21 hpf. May
activate
transcription at
late blastula
stage.
Subregion 2-
2: May lack
inhibitory Gsc
binding sites.
This may
explain why
this subregion
appears to
show more
robust activity
than region 2.
Otx binding sites are
significantly over-represented,
and may mediate activity in
endoderm and mesoderm. Otx
sites are also potential binding
sites for inhibitory Gsc.
Gatac binding sites, potentially
activated via Delta-Notch
signaling, may be responsible
for activating these regions.
4 Upstream Increases to
relatively low
but stable levels
by 21-33 hpf,
which is time of
gastrulation.
May contribute
to maintaining
activity during
this time.
4-1 and 4-2 Gatac binding sites are
significantly over-represented.
Runx binding sites are not
statistically over-represented,
but a Runx site in subregion 4-1
was previously verified by ChIP
to bind SpRunt1 and be
functional.
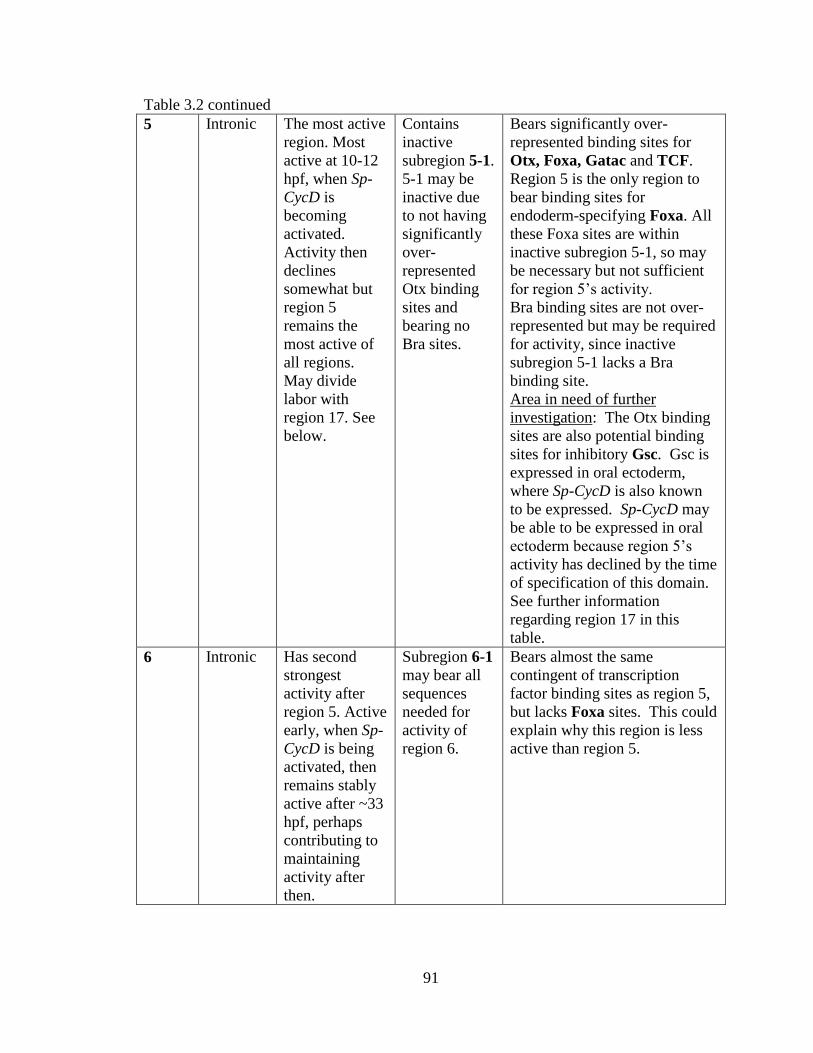
91
Table 3.2 continued
5 Intronic The most active
region. Most
active at 10-12
hpf, when Sp-
CycD is
becoming
activated.
Activity then
declines
somewhat but
region 5
remains the
most active of
all regions.
May divide
labor with
region 17. See
below.
Contains
inactive
subregion 5-1.
5-1 may be
inactive due
to not having
significantly
over-
represented
Otx binding
sites and
bearing no
Bra sites.
Bears significantly over-
represented binding sites for
Otx, Foxa, Gatac and TCF.
Region 5 is the only region to
bear binding sites for
endoderm-specifying Foxa. All
these Foxa sites are within
inactive subregion 5-1, so may
be necessary but not sufficient
for region 5’s activity.
Bra binding sites are not over-
represented but may be required
for activity, since inactive
subregion 5-1 lacks a Bra
binding site.
Area in need of further
investigation: The Otx binding
sites are also potential binding
sites for inhibitory Gsc. Gsc is
expressed in oral ectoderm,
where Sp-CycD is also known
to be expressed. Sp-CycD may
be able to be expressed in oral
ectoderm because region 5’s
activity has declined by the time
of specification of this domain.
See further information
regarding region 17 in this
table.
6 Intronic Has second
strongest
activity after
region 5. Active
early, when Sp-
CycD is being
activated, then
remains stably
active after ~33
hpf, perhaps
contributing to
maintaining
activity after
then.
Subregion 6-1
may bear all
sequences
needed for
activity of
region 6.
Bears almost the same
contingent of transcription
factor binding sites as region 5,
but lacks Foxa sites. This could
explain why this region is less
active than region 5.

92
Table 3.2 continued
17 Intronic Has the lowest
activity of all
regions but is of
interest because
its highest and
maintained
activity occurs
after ~21 hpf
through at least
45 hpf, when
Sp-CycD
expression is
becoming
restricted to gut
and oral
ectoderm.
Has sparsest number of binding
sites for lineage-specifying
transcription factors of all active
regions. This may relate to this
region playing a role in
regulating Sp-CycD expression
as it becomes spatially
restricted. Regions, such as
region 5, which many more
transcription factor binding
sites, may play role in activating
Sp-CycD expression.
In contrast to region 5, bears
significantly fewer than
predicted number of Gsc
binding sites. Region 17 may
therefore allow Sp-CycD to be
expressed in oral ectoderm.
19 Intronic Has
reproducible
activity pattern
that peaks at
~21 hpf, shortly
before
gastrulation
begins.
Bears inactive
subregion 19-
1.
3’ end is rich in binding sites for
various transcription factors. In
particular, the TCF binding
sites may be of interest,
especially one that overlaps
with a potential Runx binding
site. Although Runx binding
sites are under-represented,
region 19 is the only region to
show an overlap between a
potential Runx and TCF binding
site. This TCF site could
function to regulate activity just
before the onset of gastrulation,
when this region reaches peak
activity.
This same Runx site also
overlaps with potential
C/EBPalpha site. Since Runx
and C/EBPalpha transcription
factors regulate development of
myeloid cells, this Runx-
C/EBPalpha site could regulate
expression in blastocoelar cells,
which ingress shortly after
region 19’s activity peak.

93
3.7 Some limitations to this study
It can be seen that of 22 potential regulatory regions identified by sequence
conservation (Chapter 2, Fig. 2.3), only 6 were shown to be active during embryogenesis
through gastrulation. There could be at least three reasons for this finding. First, it is
possible for postulated regulatory regions that are identified computationally to be
inactive in the analyses carried out here to still be functional [106]. In addition, some of
the regions identified as inactive might function as repressors. This possibility was not
tested during the cis-regulatory analysis of Sp-CycD because the method of Nam et al.
used to test the activity of potential regulatory regions can only be used to identify
positively acting regions, but not repressors [120]. Second, it is also possible that some
of the regions shown to be inactive during embryogenesis could play a role in the
expression of Sp-CycD in the adult. A third reason concerns the fact that all regions
chosen to be tested for analysis were hypothesized, due to possession of various potential
regulatory elements within their sequences, to be potentially regulatory. As described in
Chapter 2, the activity values of all of these regions were used to determine a
“background” level of region activity. Regions whose activities were at least 2.5 times
greater than this background level were considered to have statistically significant
activity. This statistical criterion was based on that used by Nam et al. in the 2010 high
throughput identification of cis-regulatory modules [120]. However, in that study, the
authors did not pre-select regions that were hypothesized to be active. Instead, regions to
be tested for activity were selected at random. In this dissertation, then, only the most
active regions in a population of regions already hypothesized to be active were being

94
tested. Therefore, it is possible that some regions with relatively low activity may have
been scored as inactive.
3.8 Potential Future Work: Testing if Sp-CycD regulates the expression of
developmental genes
Apart from acting as a regulator of the cell cycle, as introduced in Chapter 1,
there is evidence that genes of the cyclin D family can regulate the transcription of other
genes. The weight of the evidence indicates that cyclin D proteins accomplish this by
undergoing protein-protein interactions with transcription factors and other DNA
interacting proteins rather than directly binding to DNA. These interactions can then
induce the transcription of genes whose regulatory regions are bound by these factors.
For example, Bienvenu et al. [80] showed that cyclin D1 was associated with the
promoters of genes that were being expressed in the tissues being examined. However,
cyclin D1 was also shown to interact with transcription factors whose consensus binding
sites were found within the promoters that were shown to be bound by cyclin D1. From
this, it would be concluded that, rather than binding to these genes directly, cyclin D1
bound to these genes through recruitment by these transcription factors.
In a recent study by Paulkin and Vallier [156], the protein-protein interactions
of cyclin D family genes were related to the two, at first thought, disparate roles of cyclin
D genes in regulating both the cell cycle and development. Working with pluriopotent
stem cells, the authors showed that these cells could be coaxed via growth factors to be
more likely to differentiate into endoderm or into neuroectoderm, depending on the levels
of cyclin D proteins within those cells. Moreover, these cyclin D proteins carried out
their regulatory functions through their “classical” roles of activating cdks 4 and 6 within
95
the cytoplasm. When active, these SMAD proteins translocated to the nucleus and
induced the transcription of genes whose protein products led to the development of
endoderm. Phosphorylation of these SMAD proteins by the cdks led to their degradation
and prevented them from translocating to the nucleus to contribute to the formation of
endoderm. In this case, the cells would activate transcription factors that led instead
primarily to the formation of neuroectoderm. However, if cyclin D protein levels were
low, then endoderm-specifying transcription factors would be more able to translocate to
the nucleus, and the stem cells would be more likely to differentiate into endoderm.
Which developmental program – the formation of neuroectoderm or endoderm – was set
in motion depended on levels of cyclin D proteins, which in turn, depended on the stage
of the cell cycle. Therefore, cyclin D proteins, through protein-protein interactions, can
function to link the stage of the cell cycle in which cells receive signals to the
developmental program that those cells undergo.
From this summary, a larger theme emerges. Cyclin D family proteins interact
with multiple proteins both within the nucleus and in the cytoplasm. Through these
interactions, they can modulate the expression of genes, which in turn regulates
developmental outcome. In this dissertation, the primary focus was on elucidating the
inputs into Sp-CycD that regulate its expression. However, as is suggested from the
above described studies, this gene, as a member of the cyclin D family of genes, likely
has regulatory outputs into developmental regulatory genes. Within S. purpuratus, the
cyclin D gene Sp-CycD also plays an important developmental role, as shown by Moore
et al. [62].

96
It would also be important to identify and confirm the genes whose expression
was regulated by cyclin D. This could be accomplished by using morpholino antisense
oligonucleotides to knockdown Sp-CycD, similar to that done by Moore et al. [62], then
using either quantitative RT-PCR or the more recently developed Nanostring technology
[157] to measure the resultant levels of all developmental regulatory genes of the
endomesoderm GRN. The data gained from these experiments could be related to those
gained from the experiments just described where the protein binding partners of Sp-
CycD were determined. In particular, it could be determined if the regulatory regions of
genes whose expression was shown to be significantly affected by the knockdown of Sp-
CycD have binding sites for any of the transcription factors shown to interact with Sp-
CycD. These experiments would further complete our understanding of how Sp-CycD
fits into the developmental GRNs of S. purpuratus by complementing the cis-regulatory
analysis that was the primary focus of this dissertation.
3.9 Conclusions
This dissertation presented a cis-regulatory analysis of the Sp-CycD gene during
embryogenesis in S. purpuratus. Regulatory regions that were proposed to regulate the
expression of Sp-CycD during development were identified and characterized. In this
chapter, further analysis was done to identify the developmentally regulated transcription
factors that could mediate the expression of this regulatory gene. This work and analysis
presented in this dissertation is pertinent because genes of the cyclin D family are
developmental regulatory genes, acting as signal-controlled regulators of cell growth, the
cell cycle, and development (Chapter 1).
97
This work is the first to provide a comprehensive cis-regulatory analysis across
the entire locus of a cyclin D gene. The analysis identified several regions, both
upstream and downstream of the locus, that were experimentally verified as regulatory
regions. In this final Chapter, potential linkages between these regions and the
developmental lineages where Sp-CycD is expressed were identified. This provides the
foundation for experimentally testing each of these linkages in order to integrate this
developmentally important gene into the GRNs that control embryogenesis in the
important model organism, S. purpuratus.
98
REFERENCES
[1] J. Pines, Cyclins and cyclin-dependent kinases: a biochemical view, Biochem J 308 (
Pt 3) (1995) 697-711.
[2] NCBI Gene. Available at: http://www.ncbi.nlm.nih.gov/gene.
[3] SpBase. Available at: http://www.spbase.org/SpBase/.
[4] P. Nurse, A long twentieth century of the cell cycle and beyond, Cell 100 (2000) 71-
78.
[5] T. Evans, E.T. Rosenthal, J. Youngblom, D. Distel, T. Hunt, Cyclin: a protein
specified by maternal mRNA in sea urchin eggs that is destroyed at each cleavage
division, Cell 33 (1983) 389-396.
[6] T. Hunt, The discovery of cyclin (I), Cell 116 (2004) S63-64, 61 p following S65.
[7] K.I. Swenson, K.M. Farrell, J.V. Ruderman, The clam embryo protein cyclin A
induces entry into M phase and the resumption of meiosis in Xenopus oocytes, Cell 47
(1986) 861-870.
[8] K. Vermeulen, D.R. Van Bockstaele, Z.N. Berneman, The cell cycle: a review of
regulation, deregulation and therapeutic targets in cancer, Cell Prolif 36 (2003) 131-149.
[9] M.G. Lee, P. Nurse, Complementation used to clone a human homologue of the
fission yeast cell cycle control gene cdc2, Nature 327 (1987) 31-35.
[10] D. Coudreuse, P. Nurse, Driving the cell cycle with a minimal CDK control
network, Nature 468 (2010) 1074-1079.
[11] M. Malumbres, M. Barbacid, To cycle or not to cycle: a critical decision in cancer,
Nat Rev Cancer 1 (2001) 222-231.
[12] M. Malumbres, M. Barbacid, Mammalian cyclin-dependent kinases, Trends
Biochem Sci 30 (2005) 630-641.
[13] E.A. Klein, R.K. Assoian, Transcriptional regulation of the cyclin D1 gene at a
glance, J Cell Sci 121 (2008) 3853-3857.
[14] C.J. Sherr, Cancer cell cycles, Science 274 (1996) 1672-1677.
[15] H. Matsushime, M.F. Roussel, R.A. Ashmun, C.J. Sherr, Colony-stimulating factor 1
regulates novel cyclins during the G1 phase of the cell cycle, Cell 65 (1991) 701-713.
99
[16] K. Kozar, M.A. Ciemerych, V.I. Rebel, H. Shigematsu, A. Zagozdzon, E. Sicinska,
Y. Geng, Q. Yu, S. Bhattacharya, R.T. Bronson, K. Akashi, P. Sicinski, Mouse
development and cell proliferation in the absence of D-cyclins, Cell 118 (2004) 477-491.
[17] A.G. Knudson, Jr., Mutation and cancer: statistical study of retinoblastoma, Proc
Natl Acad Sci U S A 68 (1971) 820-823.
[18] S.H. Friend, R. Bernards, S. Rogelj, R.A. Weinberg, J.M. Rapaport, D.M. Albert,
T.P. Dryja, A human DNA segment with properties of the gene that predisposes to
retinoblastoma and osteosarcoma, Nature 323 (1986) 643-646.
[19] A. Vidal, A. Koff, Cell-cycle inhibitors: three families united by a common cause,
Gene 247 (2000) 1-15.
[20] G. Mulligan, T. Jacks, The retinoblastoma gene family: cousins with overlapping
interests, Trends Genet 14 (1998) 223-229.
[21] M.M. Lipinski, T. Jacks, The retinoblastoma gene family in differentiation and
development, Oncogene 18 (1999) 7873-7882.
[22] K.R. Stengel, C. Thangavel, D.A. Solomon, S.P. Angus, Y. Zheng, E.S. Knudsen,
Retinoblastoma/p107/p130 pocket proteins: protein dynamics and interactions with target
gene promoters, J Biol Chem 284 (2009) 19265-19271.
[23] R.K. Hurford, Jr., D. Cobrinik, M.H. Lee, N. Dyson, pRB and p107/p130 are
required for the regulated expression of different sets of E2F responsive genes, Genes
Dev 11 (1997) 1447-1463.
[24] R.X. Luo, A.A. Postigo, D.C. Dean, Rb interacts with histone deacetylase to repress
transcription, Cell 92 (1998) 463-473.
[25] L. Magnaghi-Jaulin, R. Groisman, I. Naguibneva, P. Robin, S. Lorain, J.P. Le
Villain, F. Troalen, D. Trouche, A. Harel-Bellan, Retinoblastoma protein represses
transcription by recruiting a histone deacetylase, Nature 391 (1998) 601-605.
[26] S. van den Heuvel, N.J. Dyson, Conserved functions of the pRB and E2F families,
Nat Rev Mol Cell Biol 9 (2008) 713-724.
[27] A.P. Bracken, M. Ciro, A. Cocito, K. Helin, E2F target genes: unraveling the
biology, Trends Biochem Sci 29 (2004) 409-417.
[28] B. Ren, H. Cam, Y. Takahashi, T. Volkert, J. Terragni, R.A. Young, B.D. Dynlacht,
E2F integrates cell cycle progression with DNA repair, replication, and G(2)/M
checkpoints, Genes Dev 16 (2002) 245-256.
[29] C.J. Sherr, Principles of tumor suppression, Cell 116 (2004) 235-246.
100
[30] R. Watanabe, L. Wei, J. Huang, mTOR signaling, function, novel inhibitors, and
therapeutic targets, J Nucl Med 52 497-500.
[31] J.F. Gera, I.K. Mellinghoff, Y. Shi, M.B. Rettig, C. Tran, J.H. Hsu, C.L. Sawyers,
A.K. Lichtenstein, AKT activity determines sensitivity to mammalian target of
rapamycin (mTOR) inhibitors by regulating cyclin D1 and c-myc expression, J Biol
Chem 279 (2004) 2737-2746.
[32] S. Lorenz, S. Tintelnot, R. Reski, E.L. Decker, Cyclin D-knockout uncouples
developmental progression from sugar availability, Plant Mol Biol 53 (2003) 227-236.
[33] M. Polymenis, E.V. Schmidt, Coupling of cell division to cell growth by
translational control of the G1 cyclin CLN3 in yeast, Genes Dev 11 (1997) 2522-2531.
[34] M.B. Kastan, J. Bartek, Cell-cycle checkpoints and cancer, Nature 432 (2004) 316-
323.
[35] M. Malumbres, M. Barbacid, Cell cycle, CDKs and cancer: a changing paradigm,
Nat Rev Cancer 9 (2009) 153-166.
[36] L.A. Buttitta, A.J. Katzaroff, C.L. Perez, A. de la Cruz, B.A. Edgar, A double-
assurance mechanism controls cell cycle exit upon terminal differentiation in Drosophila,
Dev Cell 12 (2007) 631-643.
[37] J. Korzelius, I. The, S. Ruijtenberg, M.B. Prinsen, V. Portegijs, T.C. Middelkoop,
M.J. Groot Koerkamp, F.C. Holstege, M. Boxem, S. van den Heuvel, Caenorhabditis
elegans cyclin D/CDK4 and cyclin E/CDK2 induce distinct cell cycle re-entry programs
in differentiated muscle cells, PLoS Genet 7 (2011) e1002362.
[38] C. Sage, M. Huang, K. Karimi, G. Gutierrez, M.A. Vollrath, D.S. Zhang, J. Garcia-
Anoveros, P.W. Hinds, J.T. Corwin, D.P. Corey, Z.Y. Chen, Proliferation of functional
hair cells in vivo in the absence of the retinoblastoma protein, Science 307 (2005) 1114-
1118.
[39] I. Ajioka, R.A. Martins, I.T. Bayazitov, S. Donovan, D.A. Johnson, S. Frase, S.A.
Cicero, K. Boyd, S.S. Zakharenko, M.A. Dyer, Differentiated horizontal interneurons
clonally expand to form metastatic retinoblastoma in mice, Cell 131 (2007) 378-390.
[40] J.A. Coffman, Cell cycle development, Dev Cell 6 (2004) 321-327.
[41] Y. Budirahardja, P. Gonczy, Coupling the cell cycle to development, Development
136 (2009) 2861-2872.
[42] E.H. Davidson, How embryos work: a comparative view of diverse modes of cell
fate specification, Development 108 (1990) 365-389.

101
[43] E.H. Davidson, R.A. Cameron, A. Ransick, Specification of cell fate in the sea
urchin embryo: summary and some proposed mechanisms, Development 125 (1998)
3269-3290.
[44] W. Tadros, H.D. Lipshitz, The maternal-to-zygotic transition: a play in two acts,
Development 136 (2009) 3033-3042.
[45] E.H. Davidson, The Regulatory Genome: Gene Regulatory Networks in
Development and Evolution, Elsevier/Academic Press, Amsterdam ; Boston, 2006.
[46] J. Croce, R. Range, S.Y. Wu, E. Miranda, G. Lhomond, J.C. Peng, T. Lepage, D.R.
McClay, Wnt6 activates endoderm in the sea urchin gene regulatory network,
Development 138 (2011) 3297-3306.
[47] E. Sodergren, G.M. Weinstock, E.H. Davidson, R.A. Cameron, R.A. Gibbs, R.C.
Angerer, L.M. Angerer, M.I. Arnone, D.R. Burgess, R.D. Burke, J.A. Coffman, M. Dean,
M.R. Elphick, C.A. Ettensohn, K.R. Foltz, A. Hamdoun, R.O. Hynes, W.H. Klein, W.
Marzluff, D.R. McClay, R.L. Morris, A. Mushegian, J.P. Rast, L.C. Smith, M.C.
Thorndyke, V.D. Vacquier, G.M. Wessel, G. Wray, L. Zhang, C.G. Elsik, O. Ermolaeva,
W. Hlavina, G. Hofmann, P. Kitts, M.J. Landrum, A.J. Mackey, D. Maglott, G.
Panopoulou, A.J. Poustka, K. Pruitt, V. Sapojnikov, X. Song, A. Souvorov, V. Solovyev,
Z. Wei, C.A. Whittaker, K. Worley, K.J. Durbin, Y. Shen, O. Fedrigo, D. Garfield, R.
Haygood, A. Primus, R. Satija, T. Severson, M.L. Gonzalez-Garay, A.R. Jackson, A.
Milosavljevic, M. Tong, C.E. Killian, B.T. Livingston, F.H. Wilt, N. Adams, R. Belle, S.
Carbonneau, R. Cheung, P. Cormier, B. Cosson, J. Croce, A. Fernandez-Guerra, A.M.
Geneviere, M. Goel, H. Kelkar, J. Morales, O. Mulner-Lorillon, A.J. Robertson, J.V.
Goldstone, B. Cole, D. Epel, B. Gold, M.E. Hahn, M. Howard-Ashby, M. Scally, J.J.
Stegeman, E.L. Allgood, J. Cool, K.M. Judkins, S.S. McCafferty, A.M. Musante, R.A.
Obar, A.P. Rawson, B.J. Rossetti, I.R. Gibbons, M.P. Hoffman, A. Leone, S. Istrail, S.C.
Materna, M.P. Samanta, V. Stolc, W. Tongprasit, Q. Tu, K.F. Bergeron, B.P. Brandhorst,
J. Whittle, K. Berney, D.J. Bottjer, C. Calestani, K. Peterson, E. Chow, Q.A. Yuan, E.
Elhaik, D. Graur, J.T. Reese, I. Bosdet, S. Heesun, M.A. Marra, J. Schein, M.K.
Anderson, V. Brockton, K.M. Buckley, A.H. Cohen, S.D. Fugmann, T. Hibino, M. Loza-
Coll, A.J. Majeske, C. Messier, S.V. Nair, Z. Pancer, D.P. Terwilliger, C. Agca, E.
Arboleda, N. Chen, A.M. Churcher, F. Hallbook, G.W. Humphrey, M.M. Idris, T.
Kiyama, S. Liang, D. Mellott, X. Mu, G. Murray, R.P. Olinski, F. Raible, M. Rowe, J.S.
Taylor, K. Tessmar-Raible, D. Wang, K.H. Wilson, S. Yaguchi, T. Gaasterland, B.E.
Galindo, H.J. Gunaratne, C. Juliano, M. Kinukawa, G.W. Moy, A.T. Neill, M. Nomura,
M. Raisch, A. Reade, M.M. Roux, J.L. Song, Y.H. Su, I.K. Townley, E. Voronina, J.L.
Wong, G. Amore, M. Branno, E.R. Brown, V. Cavalieri, V. Duboc, L. Duloquin, C.
Flytzanis, C. Gache, F. Lapraz, T. Lepage, A. Locascio, P. Martinez, G. Matassi, V.
Matranga, R. Range, F. Rizzo, E. Rottinger, W. Beane, C. Bradham, C. Byrum, T. Glenn,
S. Hussain, G. Manning, E. Miranda, R. Thomason, K. Walton, A. Wikramanayke, S.Y.
Wu, R. Xu, C.T. Brown, L. Chen, R.F. Gray, P.Y. Lee, J. Nam, P. Oliveri, J. Smith, D.
Muzny, S. Bell, J. Chacko, A. Cree, S. Curry, C. Davis, H. Dinh, S. Dugan-Rocha, J.
Fowler, R. Gill, C. Hamilton, J. Hernandez, S. Hines, J. Hume, L. Jackson, A. Jolivet, C.
102
Kovar, S. Lee, L. Lewis, G. Miner, M. Morgan, L.V. Nazareth, G. Okwuonu, D. Parker,
L.L. Pu, R. Thorn, R. Wright, The genome of the sea urchin Strongylocentrotus
purpuratus, Science 314 (2006) 941-952.
[48] Q. Tu, R.A. Cameron, K.C. Worley, R.A. Gibbs, E.H. Davidson, Gene structure in
the sea urchin Strongylocentrotus purpuratus based on transcriptome analysis, Genome
Res 22 (2012) 2079-2087.
[49] F. Rizzo, M. Fernandez-Serra, P. Squarzoni, A. Archimandritis, M.I. Arnone,
Identification and developmental expression of the ets gene family in the sea urchin
(Strongylocentrotus purpuratus), Dev Biol 300 (2006) 35-48.
[50] S.C. Materna, M. Howard-Ashby, R.F. Gray, E.H. Davidson, The C2H2 zinc finger
genes of Strongylocentrotus purpuratus and their expression in embryonic development,
Dev Biol 300 (2006) 108-120.
[51] M. Howard-Ashby, S.C. Materna, C.T. Brown, L. Chen, R.A. Cameron, E.H.
Davidson, Identification and characterization of homeobox transcription factor genes in
Strongylocentrotus purpuratus, and their expression in embryonic development, Dev Biol
300 (2006) 74-89.
[52] M.P. Samanta, W. Tongprasit, S. Istrail, R.A. Cameron, Q. Tu, E.H. Davidson, V.
Stolc, The transcriptome of the sea urchin embryo, Science 314 (2006) 960-962.
[53] T.K. Kim, M. Hemberg, J.M. Gray, A.M. Costa, D.M. Bear, J. Wu, D.A. Harmin,
M. Laptewicz, K. Barbara-Haley, S. Kuersten, E. Markenscoff-Papadimitriou, D. Kuhl,
H. Bito, P.F. Worley, G. Kreiman, M.E. Greenberg, Widespread transcription at neuronal
activity-regulated enhancers, Nature 465 182-187.
[54] A. Fernandez-Guerra, A. Aze, J. Morales, O. Mulner-Lorillon, B. Cosson, P.
Cormier, C. Bradham, N. Adams, A.J. Robertson, W.F. Marzluff, J.A. Coffman, A.M.
Geneviere, The genomic repertoire for cell cycle control and DNA metabolism in S.
purpuratus, Dev Biol 300 (2006) 238-251.
[55] Endomesoderm and Ectoderm Gene Networks. Available at:
http://sugp.caltech.edu/endomes/.
[56] T.I. Lee, N.J. Rinaldi, F. Robert, D.T. Odom, Z. Bar-Joseph, G.K. Gerber, N.M.
Hannett, C.T. Harbison, C.M. Thompson, I. Simon, J. Zeitlinger, E.G. Jennings, H.L.
Murray, D.B. Gordon, B. Ren, J.J. Wyrick, J.B. Tagne, T.L. Volkert, E. Fraenkel, D.K.
Gifford, R.A. Young, Transcriptional regulatory networks in Saccharomyces cerevisiae,
Science 298 (2002) 799-804.
[57] N.M. Luscombe, M.M. Babu, H. Yu, M. Snyder, S.A. Teichmann, M. Gerstein,
Genomic analysis of regulatory network dynamics reveals large topological changes,
Nature 431 (2004) 308-312.

103
[58] Y. Zhang, J. Xuan, B.G. de los Reyes, R. Clarke, H.W. Ressom, Reconstruction of
gene regulatory modules in cancer cell cycle by multi-source data integration, PLoS One
5 (2010) e10268.
[59] A.W. Murray, Recycling the cell cycle: cyclins revisited, Cell 116 (2004) 221-234.
[60] Y. Geng, W. Whoriskey, M.Y. Park, R.T. Bronson, R.H. Medema, T. Li, R.A.
Weinberg, P. Sicinski, Rescue of cyclin D1 deficiency by knockin cyclin E, Cell 97
(1999) 767-777.
[61] S.M. Keenan, N.H. Lents, J.J. Baldassare, Expression of cyclin E renders cyclin D-
CDK4 dispensable for inactivation of the retinoblastoma tumor suppressor protein,
activation of E2F, and G1-S phase progression, J Biol Chem 279 (2004) 5387-5396.
[62] J.C. Moore, J.L. Sumerel, B.J. Schnackenberg, J.A. Nichols, A. Wikramanayake,
G.M. Wessel, W.F. Marzluff, Cyclin D and cdk4 are required for normal development
beyond the blastula stage in sea urchin embryos, Mol Cell Biol 22 (2002) 4863-4875.
[63] A.J. Robertson, A. Coluccio, P. Knowlton, C. Dickey-Sims, J.A. Coffman, Runx
expression is mitogenic and mutually linked to Wnt activity in blastula-stage sea urchin
embryos, PLoS One 3 (2008) e3770.
[64] S.A. Datar, H.W. Jacobs, A.F. de la Cruz, C.F. Lehner, B.A. Edgar, The Drosophila
cyclin D-Cdk4 complex promotes cellular growth, Embo J 19 (2000) 4543-4554.
[65] T. Tanaka, M. Kubota, K. Shinohara, K. Yasuda, J.Y. Kato, In vivo analysis of the
cyclin D1 promoter during early embryogenesis in Xenopus, Cell Struct Funct 28 (2003)
165-177.
[66] L.A. Buttitta, B.A. Edgar, Mechanisms controlling cell cycle exit upon terminal
differentiation, Curr Opin Cell Biol 19 (2007) 697-704.
[67] M. Adachi, M.F. Roussel, K. Havenith, C.J. Sherr, Features of macrophage
differentiation induced by p19INK4d, a specific inhibitor of cyclin D-dependent kinases,
Blood 90 (1997) 126-137.
[68] T.L. Beumer, H.L. Roepers-Gajadien, I.S. Gademan, H.B. Kal, D.G. de Rooij,
Involvement of the D-type cyclins in germ cell proliferation and differentiation in the
mouse, Biol Reprod 63 (2000) 1893-1898.
[69] J.B. Lazaro, P.J. Bailey, A.B. Lassar, Cyclin D-cdk4 activity modulates the
subnuclear localization and interaction of MEF2 with SRC-family coactivators during
skeletal muscle differentiation, Genes Dev 16 (2002) 1792-1805.
[70] S. Jirawatnotai, Y. Hu, W. Michowski, J.E. Elias, L. Becks, F. Bienvenu, A.
Zagozdzon, T. Goswami, Y.E. Wang, A.B. Clark, T.A. Kunkel, T. van Harn, B. Xia, M.

104
Correll, J. Quackenbush, D.M. Livingston, S.P. Gygi, P. Sicinski, A function for cyclin
D1 in DNA repair uncovered by protein interactome analyses in human cancers, Nature
474 (2011) 230-234.
[71] R. Beroukhim, C.H. Mermel, D. Porter, G. Wei, S. Raychaudhuri, J. Donovan, J.
Barretina, J.S. Boehm, J. Dobson, M. Urashima, K.T. Mc Henry, R.M. Pinchback, A.H.
Ligon, Y.J. Cho, L. Haery, H. Greulich, M. Reich, W. Winckler, M.S. Lawrence, B.A.
Weir, K.E. Tanaka, D.Y. Chiang, A.J. Bass, A. Loo, C. Hoffman, J. Prensner, T. Liefeld,
Q. Gao, D. Yecies, S. Signoretti, E. Maher, F.J. Kaye, H. Sasaki, J.E. Tepper, J.A.
Fletcher, J. Tabernero, J. Baselga, M.S. Tsao, F. Demichelis, M.A. Rubin, P.A. Janne,
M.J. Daly, C. Nucera, R.L. Levine, B.L. Ebert, S. Gabriel, A.K. Rustgi, C.R. Antonescu,
M. Ladanyi, A. Letai, L.A. Garraway, M. Loda, D.G. Beer, L.D. True, A. Okamoto, S.L.
Pomeroy, S. Singer, T.R. Golub, E.S. Lander, G. Getz, W.R. Sellers, M. Meyerson, The
landscape of somatic copy-number alteration across human cancers, Nature 463 (2010)
899-905.
[72] J.P. Alao, The regulation of cyclin D1 degradation: roles in cancer development and
the potential for therapeutic invention, Mol Cancer 6 (2007) 24.
[73] W. Jiang, S.M. Kahn, N. Tomita, Y.J. Zhang, S.H. Lu, I.B. Weinstein, Amplification
and expression of the human cyclin D gene in esophageal cancer, Cancer Res 52 (1992)
2980-2983.
[74] K. Maeda, Y. Chung, S. Kang, M. Ogawa, N. Onoda, Y. Nishiguchi, T. Ikehara, B.
Nakata, M. Okuno, M. Sowa, Cyclin D1 overexpression and prognosis in colorectal
adenocarcinoma, Oncology 55 (1998) 145-151.
[75] Y.J. Choi, X. Li, P. Hydbring, T. Sanda, J. Stefano, A.L. Christie, S. Signoretti, A.T.
Look, A.L. Kung, H. von Boehmer, P. Sicinski, The requirement for cyclin D function in
tumor maintenance, Cancer Cell 22 (2012) 438-451.
[76] O.G. Opitz, Y. Suliman, W.C. Hahn, H. Harada, H.E. Blum, A.K. Rustgi, Cyclin D1
overexpression and p53 inactivation immortalize primary oral keratinocytes by a
telomerase-independent mechanism, J Clin Invest 108 (2001) 725-732.
[77] S. Jagadeesh, P.P. Banerjee, Telomerase reverse transcriptase regulates the
expression of a key cell cycle regulator, cyclin D1, Biochem Biophys Res Commun 347
(2006) 774-780.
[78] C.J. Frank, M. Hyde, C.W. Greider, Regulation of telomere elongation by the cyclin-
dependent kinase CDK1, Mol Cell 24 (2006) 423-432.
[79] B. Bernardes de Jesus, M.A. Blasco, Telomerase at the intersection of cancer and
aging, Trends Genet 29 (2013) 513-520.

105
[80] F. Bienvenu, S. Jirawatnotai, J.E. Elias, C.A. Meyer, K. Mizeracka, A. Marson,
G.M. Frampton, M.F. Cole, D.T. Odom, J. Odajima, Y. Geng, A. Zagozdzon, M. Jecrois,
R.A. Young, X.S. Liu, C.L. Cepko, S.P. Gygi, P. Sicinski, Transcriptional role of cyclin
D1 in development revealed by a genetic-proteomic screen, Nature 463 (2010) 374-378.
[81] A.I. Lukaszewicz, D.J. Anderson, Cyclin D1 promotes neurogenesis in the
developing spinal cord in a cell cycle-independent manner, Proc Natl Acad Sci U S A
108 (2011) 11632-11637.
[82] M. Shtutman, J. Zhurinsky, I. Simcha, C. Albanese, M. D'Amico, R. Pestell, A. Ben-
Ze'ev, The cyclin D1 gene is a target of the beta-catenin/LEF-1 pathway, Proc Natl Acad
Sci U S A 96 (1999) 5522-5527.
[83] O. Tetsu, F. McCormick, Beta-catenin regulates expression of cyclin D1 in colon
carcinoma cells, Nature 398 (1999) 422-426.
[84] A. Pradeep, C. Sharma, P. Sathyanarayana, C. Albanese, J.V. Fleming, T.C. Wang,
M.M. Wolfe, K.M. Baker, R.G. Pestell, B. Rana, Gastrin-mediated activation of cyclin
D1 transcription involves beta-catenin and CREB pathways in gastric cancer cells,
Oncogene 23 (2004) 3689-3699.
[85] S.H. Baek, C. Kioussi, P. Briata, D. Wang, H.D. Nguyen, K.A. Ohgi, C.K. Glass, A.
Wynshaw-Boris, D.W. Rose, M.G. Rosenfeld, Regulated subset of G1 growth-control
genes in response to derepression by the Wnt pathway, Proc Natl Acad Sci U S A 100
(2003) 3245-3250.
[86] F. Bernardin-Fried, T. Kummalue, S. Leijen, M.I. Collector, K. Ravid, A.D.
Friedman, AML1/RUNX1 increases during G1 to S cell cycle progression independent of
cytokine-dependent phosphorylation and induces cyclin D3 gene expression, J Biol Chem
279 (2004) 15678-15687.
[87] C. Albanese, K. Wu, M. D'Amico, C. Jarrett, D. Joyce, J. Hughes, J. Hulit, T.
Sakamaki, M. Fu, A. Ben-Ze'ev, J.F. Bromberg, C. Lamberti, U. Verma, R.B. Gaynor,
S.W. Byers, R.G. Pestell, IKKalpha regulates mitogenic signaling through transcriptional
induction of cyclin D1 via Tcf, Mol Biol Cell 14 (2003) 585-599.
[88] H. Kamano, K.H. Klempnauer, B-Myb and cyclin D1 mediate heat shock element
dependent activation of the human HSP70 promoter, Oncogene 14 (1997) 1223-1229.
[89] R.J. Lee, C. Albanese, M. Fu, M. D'Amico, B. Lin, G. Watanabe, G.K. Haines, 3rd,
P.M. Siegel, M.C. Hung, Y. Yarden, J.M. Horowitz, W.J. Muller, R.G. Pestell, Cyclin D1
is required for transformation by activated Neu and is induced through an E2F-dependent
signaling pathway, Mol Cell Biol 20 (2000) 672-683.
106
[90] R.G. Pestell, C. Albanese, A.T. Reutens, J.E. Segall, R.J. Lee, A. Arnold, The
cyclins and cyclin-dependent kinase inhibitors in hormonal regulation of proliferation and
differentiation, Endocr Rev 20 (1999) 501-534.
[91] H.M. Lin, R.G. Pestell, A. Raz, H.R. Kim, Galectin-3 enhances cyclin D(1)
promoter activity through SP1 and a cAMP-responsive element in human breast
epithelial cells, Oncogene 21 (2002) 8001-8010.
[92] I. Matsumura, T. Kitamura, H. Wakao, H. Tanaka, K. Hashimoto, C. Albanese, J.
Downward, R.G. Pestell, Y. Kanakura, Transcriptional regulation of the cyclin D1
promoter by STAT5: its involvement in cytokine-dependent growth of hematopoietic
cells, Embo J 18 (1999) 1367-1377.
[93] J.F. Bromberg, M.H. Wrzeszczynska, G. Devgan, Y. Zhao, R.G. Pestell, C.
Albanese, J.E. Darnell, Jr., Stat3 as an oncogene, Cell 98 (1999) 295-303.
[94] Y.X. Yan, H. Nakagawa, M.H. Lee, A.K. Rustgi, Transforming growth factor-alpha
enhances cyclin D1 transcription through the binding of early growth response protein to
a cis-regulatory element in the cyclin D1 promoter, J Biol Chem 272 (1997) 33181-
33190.
[95] S. Kitazawa, R. Kitazawa, S. Maeda, Transcriptional regulation of rat cyclin D1
gene by CpG methylation status in promoter region, J Biol Chem 274 (1999) 28787-
28793.
[96] C.V. Kirchhamer, E.H. Davidson, Spatial and temporal information processing in
the sea urchin embryo: modular and intramodular organization of the CyIIIa gene cis-
regulatory system, Development 122 (1996) 333-348.
[97] K.W. Makabe, C.V. Kirchhamer, R.J. Britten, E.H. Davidson, Cis-regulatory control
of the SM50 gene, an early marker of skeletogenic lineage specification in the sea urchin
embryo, Development 121 (1995) 1957-1970.
[98] C.H. Yuh, E.H. Davidson, Modular cis-regulatory organization of Endo16, a gut-
specific gene of the sea urchin embryo, Development 122 (1996) 1069-1082.
[99] C.H. Yuh, H. Bolouri, E.H. Davidson, Cis-regulatory logic in the endo16 gene:
switching from a specification to a differentiation mode of control, Development 128
(2001) 617-629.
[100] M.I. Arnone, L.D. Bogarad, A. Collazo, C.V. Kirchhamer, R.A. Cameron, J.P.
Rast, A. Gregorians, E.H. Davidson, Green Fluorescent Protein in the sea urchin: new
experimental approaches to transcriptional regulatory analysis in embryos and larvae,
Development 124 (1997) 4649-4659.
107
[101] T. Minokawa, A.H. Wikramanayake, E.H. Davidson, cis-Regulatory inputs of the
wnt8 gene in the sea urchin endomesoderm network, Dev Biol 288 (2005) 545-558.
[102] J. Nam, Y.H. Su, P.Y. Lee, A.J. Robertson, J.A. Coffman, E.H. Davidson, Cis-
regulatory control of the nodal gene, initiator of the sea urchin oral ectoderm gene
network, Dev Biol 306 (2007) 860-869.
[103] R. Revilla-i-Domingo, T. Minokawa, E.H. Davidson, R11: a cis-regulatory node of
the sea urchin embryo gene network that controls early expression of SpDelta in
micromeres, Dev Biol 274 (2004) 438-451.
[104] D.A. Tagle, B.F. Koop, M. Goodman, J.L. Slightom, D.L. Hess, R.T. Jones,
Embryonic epsilon and gamma globin genes of a prosimian primate (Galago
crassicaudatus). Nucleotide and amino acid sequences, developmental regulation and
phylogenetic footprints, J Mol Biol 203 (1988) 439-455.
[105] M. Blanchette, M. Tompa, Discovery of regulatory elements by a computational
method for phylogenetic footprinting, Genome Res 12 (2002) 739-748.
[106] C.T. Brown, Y. Xie, E.H. Davidson, R.A. Cameron, Paircomp, FamilyRelationsII
and Cartwheel: tools for interspecific sequence comparison, BMC Bioinformatics 6
(2005) 70.
[107] C.H. Yuh, C.T. Brown, C.B. Livi, L. Rowen, P.J. Clarke, E.H. Davidson, Patchy
interspecific sequence similarities efficiently identify positive cis-regulatory elements in
the sea urchin, Dev Biol 246 (2002) 148-161.
[108] B.P. Berman, Y. Nibu, B.D. Pfeiffer, P. Tomancak, S.E. Celniker, M. Levine, G.M.
Rubin, M.B. Eisen, Exploiting transcription factor binding site clustering to identify cis-
regulatory modules involved in pattern formation in the Drosophila genome, Proc Natl
Acad Sci U S A 99 (2002) 757-762.
[109] E.H. Davidson, Emerging properties of animal gene regulatory networks, Nature
468 (2010) 911-920.
[110] E.H. Davidson, J.P. Rast, P. Oliveri, A. Ransick, C. Calestani, C.H. Yuh, T.
Minokawa, G. Amore, V. Hinman, C. Arenas-Mena, O. Otim, C.T. Brown, C.B. Livi,
P.Y. Lee, R. Revilla, A.G. Rust, Z. Pan, M.J. Schilstra, P.J. Clarke, M.I. Arnone, L.
Rowen, R.A. Cameron, D.R. McClay, L. Hood, H. Bolouri, A genomic regulatory
network for development, Science 295 (2002) 1669-1678.
[111] I.S. Peter, E.H. Davidson, Modularity and design principles in the sea urchin
embryo gene regulatory network, FEBS Lett 583 (2009) 3948-3958.
108
[112] S. Ben-Tabou de-Leon, E.H. Davidson, Experimentally based sea urchin gene
regulatory network and the causal explanation of developmental phenomenology, Wiley
Interdiscip Rev Syst Biol Med 1 (2009) 237-246.
[113] Q. Tu, R.A. Cameron, E.H. Davidson, Quantitative developmental transcriptomes
of the sea urchin Strongylocentrotus purpuratus, Dev Biol 385 (2014) 160-167.
[114] A.J. Robertson, C.E. Dickey, J.J. McCarthy, J.A. Coffman, The expression of
SpRunt during sea urchin embryogenesis, Mech Dev 117 (2002) 327-330.
[115] C.M. McCarty, J.A. Coffman, Developmental cis-regulatory analysis of the cyclin
D gene in the sea urchin Strongylocentrotus purpuratus, Biochem Biophys Res Commun
440 (2013) 413-418.
[116] K.R. Foltz, N.L. Adams, L.L. Runft, Echinoderm eggs and embryos: procurement
and culture, Methods Cell Biol 74 (2004) 39-74.
[117] Cartwheel Site. Available at: http://cartwheel.idyll.org/.
[118] R.A. Cameron, P. Oliveri, J. Wyllie, E.H. Davidson, cis-Regulatory activity of
randomly chosen genomic fragments from the sea urchin, Gene Expr Patterns 4 (2004)
205-213.
[119] Steve Rozen, Helen J. Skaletsky (1998) Primer3. Available at:
http://biotools.umassmed.edu/bioapps/primer3_www.cgi.
[120] J. Nam, P. Dong, R. Tarpine, S. Istrail, E.H. Davidson, Functional cis-regulatory
genomics for systems biology, Proc Natl Acad Sci U S A 107 (2010) 3930-3935.
[121] R.A. Cameron, M. Samanta, A. Yuan, D. He, E. Davidson, SpBase: the sea urchin
genome database and web site, Nucleic Acids Res 37 (2009) D750-754.
[122] M.S. Cheers, C.A. Ettensohn, Rapid microinjection of fertilized eggs, Methods Cell
Biol 74 (2004) 287-310.
[123] J. Smith, E.H. Davidson, Gene regulatory network subcircuit controlling a dynamic
spatial pattern of signaling in the sea urchin embryo, Proc Natl Acad Sci U S A 105
(2008) 20089-20094.
[124] Q. Tu, A. Cameron, E.H. Davidson, Quantitative developmental transcriptomes of
the sea urchin Strongylocentrotus purpuratus, Dev Biol 385 (2014) 160-167.
[125] I.N. Melnikova, B.E. Crute, S. Wang, N.A. Speck, Sequence specificity of the core-
binding factor, J Virol 67 (1993) 2408-2411.
109
[126] R.A. Rimerman, A. Gellert-Randleman, J.A. Diehl, Wnt1 and MEK1 cooperate to
promote cyclin D1 accumulation and cellular transformation, J Biol Chem 275 (2000)
14736-14742.
[127] Cluster Buster. Available at: http://zlab.bu.edu/cluster-buster/.
[128] M.C. Frith, M.C. Li, Z. Weng, Cluster-Buster: Finding dense clusters of motifs in
DNA sequences, Nucleic Acids Res 31 (2003) 3666-3668.
[129] Q. Tu, R.A. Cameron, K.C. Worley, R.A. Gibbs, E.H. Davidson, Gene structure in
the sea urchin Strongylocentrotus purpuratus based on transcriptome analysis, Genome
Res 22 (2013) 2079-2087.
[130] V.F. Hinman, E.H. Davidson, Evolutionary plasticity of developmental gene
regulatory network architecture, Proc Natl Acad Sci U S A 104 (2007) 19404-19409.
[131] V.F. Hinman, A.T. Nguyen, R.A. Cameron, E.H. Davidson, Developmental gene
regulatory network architecture across 500 million years of echinoderm evolution, Proc
Natl Acad Sci U S A 100 (2003) 13356-13361.
[132] J.A. Coffman, Is Runx a linchpin for developmental signaling in metazoans?, J Cell
Biochem 107 (2009) 194-202.
[133] ENDMEMO DNA/RNA GC content calculator. Available at:
http://www.endmemo.com/bio/gc.php.
[134] T. Kusch, T. Storck, U. Walldorf, R. Reuter, Brachyury proteins regulate target
genes through modular binding sites in a cooperative fashion, Genes Dev 16 (2002) 518-
529.
[135] gene-regulation.com. Available at: http://www.gene-
regulation.com/pub/programs.html#alibaba2
[136] P.Y. Lee, E.H. Davidson, Expression of Spgatae, the Strongylocentrotus purpuratus
ortholog of vertebrate GATA4/5/6 factors, Gene Expr Patterns 5 (2004) 161-165.
[137] A. Ransick, E.H. Davidson, cis-regulatory processing of Notch signaling input to
the sea urchin glial cells missing gene during mesoderm specification, Dev Biol 297
(2006) 587-602.
[138] R.R. Sokal, F.J. Rohlf, Biometry : the principles and practice of statistics in
biological research, 3rd ed., W.H. Freeman, New York, 1995.
[139] S. Robin, S. Schbath, V. Vandewalle, Statistical tests to compare motif count
exceptionalities, BMC Bioinformatics 8 (2007) 84.

110
[140] E.H. Davidson, J.P. Rast, P. Oliveri, A. Ransick, C. Calestani, C.H. Yuh, T.
Minokawa, G. Amore, V. Hinman, C. Arenas-Mena, O. Otim, C.T. Brown, C.B. Livi,
P.Y. Lee, R. Revilla, M.J. Schilstra, P.J. Clarke, A.G. Rust, Z. Pan, M.I. Arnone, L.
Rowen, R.A. Cameron, D.R. McClay, L. Hood, H. Bolouri, A provisional regulatory
gene network for specification of endomesoderm in the sea urchin embryo, Dev Biol 246
(2002) 162-190.
[141] A.J. Sethi, R.M. Wikramanayake, R.C. Angerer, R.C. Range, L.M. Angerer,
Sequential signaling crosstalk regulates endomesoderm segregation in sea urchin
embryos, Science 335 (2012) 590-593.
[142] C.R. Tamboline, R.D. Burke, Secondary mesenchyme of the sea urchin embryo:
ontogeny of blastocoelar cells, J Exp Zool 262 (1992) 51-60.
[143] S.C. Materna, E.H. Davidson, A comprehensive analysis of Delta signaling in pre-
gastrular sea urchin embryos, Dev Biol 364 (2012) 77-87.
[144] M.D. Gordon, R. Nusse, Wnt signaling: multiple pathways, multiple receptors, and
multiple transcription factors, J Biol Chem 281 (2006) 22429-22433.
[145] R. Olsauskas-Kuprys, A. Zlobin, C. Osipo, Gamma secretase inhibitors of Notch
signaling, Onco Targets Ther 6 943-955.
[146] L.M. Angerer, D.W. Oleksyn, A.M. Levine, X. Li, W.H. Klein, R.C. Angerer, Sea
urchin goosecoid function links fate specification along the animal-vegetal and oral-
aboral embryonic axes, Development 128 (2001) 4393-4404.
[147] M.I. Arnone, E.L. Martin, E.H. Davidson, Cis-regulation downstream of cell type
specification: a single compact element controls the complex expression of the CyIIa
gene in sea urchin embryos, Development 125 (1998) 1381-1395.
[148] M.I. Arnone, E.H. Davidson, The hardwiring of development: organization and
function of genomic regulatory systems, Development 124 (1997) 1851-1864.
[149] A. Puig-Kroger, T. Sanchez-Elsner, N. Ruiz, E.J. Andreu, F. Prosper, U.B. Jensen,
J. Gil, P. Erickson, H. Drabkin, Y. Groner, A.L. Corbi, RUNX/AML and C/EBP factors
regulate CD11a integrin expression in myeloid cells through overlapping regulatory
elements, Blood 102 (2003) 3252-3261.
[150] T.L. McCarthy, C. Ji, Y. Chen, K.K. Kim, M. Imagawa, Y. Ito, M. Centrella, Runt
domain factor (Runx)-dependent effects on CCAAT/ enhancer-binding protein delta
expression and activity in osteoblasts, J Biol Chem 275 (2000) 21746-21753.
[151] E. Li, S.C. Materna, E.H. Davidson, New regulatory circuit controlling spatial and
temporal gene expression in the sea urchin embryo oral ectoderm GRN, Dev Biol 382
(2013) 268-279.

111
[152] E. Li, M. Cui, I.S. Peter, E.H. Davidson, Encoding regulatory state boundaries in
the pregastrular oral ectoderm of the sea urchin embryo, Proc Natl Acad Sci U S A 111
(2014) E906-913.
[153] J.A. Coffman, A. Coluccio, A. Planchart, A.J. Robertson, Oral-aboral axis
specification in the sea urchin embryo III. Role of mitochondrial redox signaling via
H2O2, Dev Biol 330 (2009) 123-130.
[154] J.A. Coffman, J.J. McCarthy, C. Dickey-Sims, A.J. Robertson, Oral-aboral axis
specification in the sea urchin embryo II. Mitochondrial distribution and redox state
contribute to establishing polarity in Strongylocentrotus purpuratus, Dev Biol 273 (2004)
160-171.
[155] J.A. Coffman, A. Wessels, C. DeSchiffart, K. Rydlizky, Oral-aboral axis
specification in the sea urchin embryo, IV: hypoxia radializes embryos by preventing the
initial spatialization of nodal activity, Dev Biol 386 (2014) 302-307.
[156] S. Pauklin, L. Vallier, The cell-cycle state of stem cells determines cell fate
propensity, Cell 155 (2013) 135-147.
[157] G.K. Geiss, R.E. Bumgarner, B. Birditt, T. Dahl, N. Dowidar, D.L. Dunaway, H.P.
Fell, S. Ferree, R.D. George, T. Grogan, J.J. James, M. Maysuria, J.D. Mitton, P. Oliveri,
J.L. Osborn, T. Peng, A.L. Ratcliffe, P.J. Webster, E.H. Davidson, L. Hood, K. Dimitrov,
Direct multiplexed measurement of gene expression with color-coded probe pairs, Nat
Biotechnol 26 (2008) 317-325.
[158] D.E. Quelle, F. Zindy, R.A. Ashmun, C.J. Sherr, Alternative reading frames of the
INK4a tumor suppressor gene encode two unrelated proteins capable of inducing cell
cycle arrest, Cell 83 (1995) 993-1000.
[159] C.A. Mao, L. Gan, W.H. Klein, Multiple Otx binding sites required for expression
of the Strongylocentrotus purpuratus Spec2a gene, Dev Biol 165 (1994) 229-242.
[160] T. Kiyama, N. Zhang, S. Dayal, P. Yun Lee, S. Liang, J.T. Villinski, W.H. Klein,
Strongylocentrotus purpuratus transcription factor GATA-E binds to and represses
transcription at an Otx-Goosecoid cis-regulatory element within the aboral ectoderm-
specific spec2a enhancer, Dev Biol 280 (2005) 436-447.
[161] C.H. Yuh, E.R. Dorman, M.L. Howard, E.H. Davidson, An otx cis-regulatory
module: a key node in the sea urchin endomesoderm gene regulatory network, Dev Biol
269 (2004) 536-551.
[162] Y. Liu, S. Nandi, A. Martel, A. Antoun, I. Ioshikhes, A. Blais, Discovery,
optimization and validation of an optimal DNA-binding sequence for the Six1
homeodomain transcription factor, Nucleic Acids Res 40 (2012) 8227-8239.
112
[163] Sequence Manipulation Suite: DNA Pattern Find. Available at:
http://www.bioinformatics.org/sms2/dna_pattern.html.
[164] P. Stothard, The sequence manipulation suite: JavaScript programs for analyzing
and formatting protein and DNA sequences, Biotechniques 28 (2000) 1102, 1104.
[165] T. Von Ohlen, D. Lessing, R. Nusse, J.E. Hooper, Hedgehog signaling regulates
transcription through cubitus interruptus, a sequence-specific DNA binding protein, Proc
Natl Acad Sci U S A 94 (1997) 2404-2409.

113
APPENDIX A: LIST OF GENES REFERENCED
Table A.1: Genes referenced in this dissertation
Notes: 1. The name used in the text is given, along with the species in which the gene
being referenced was described, followed by the official name, provided by either NCBI
Gene [2] for all genes except for those described in Strongylocentrotus purpuratus, or
SpBase [3] for genes described in S. purpuratus. 2. If the name given in the text is a
protein, or is written out in full, then that name is not italicized. Italicized names given
under Official Names refer to genes rather than proteins. 3. If a gene family containing
multiple members is mentioned, but the individual members are not individually
described, then, generally, these are not provided in this table, although one example may
sometimes be provided.
Name used in text Species Official name GeneIdentier
AML1 (RUNX1) Mus musculus Runx1 12394
B-MYB Mus musculus Mybl2 1785
Bra S. purpuratus Sp-Bra SPU_013015
Cdc25 phosphatase1 Mus musculus Cdc25c 12532
C/EBPalpha Mus musculus Cebpa 12606
CLN3 Saccharomyces CLN3 1201
cerevisiae
cyclin A Clam Not found
Cyclin A S. purpuratus Sp-CycA SPU_003528
Cyclin A1 Mus musculus Ccna1 12427
Cyclin A2 Mus musculus Ccna2 12428
Cyclin B1 Mus musculus Ccnb1 268697
Cyclin B2 Mus musculus Ccnb2 12442
cyclin B Lytechinus pictus Not found
Cyclin B S. purpuratus Sp-Cycb SPU_015285
Cyclin D Arabidopsis Not found
Cyclin D C. elegans cyd-1 174941
Cyclin D Drosophila CycD 32551
Cyclin D S. purpuratus Sp-CycD SPU_007013
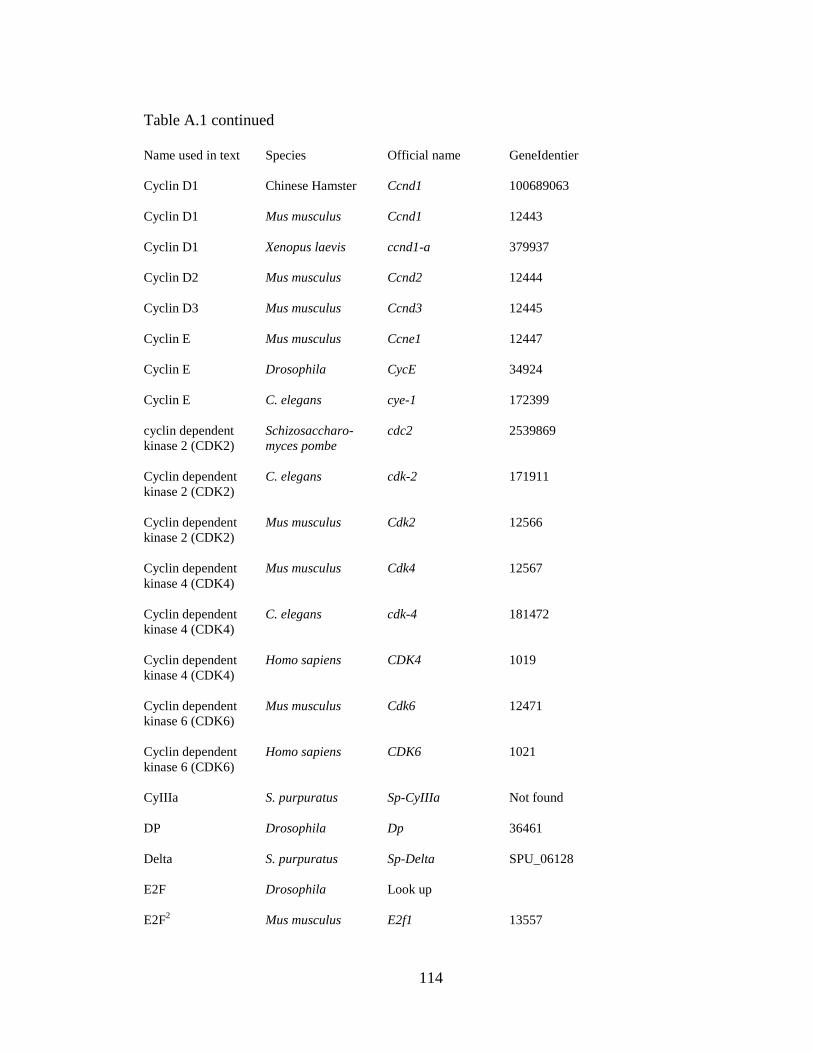
114
Table A.1 continued
Name used in text Species Official name GeneIdentier
Cyclin D1 Chinese Hamster Ccnd1 100689063
Cyclin D1 Mus musculus Ccnd1 12443
Cyclin D1 Xenopus laevis ccnd1-a 379937
Cyclin D2 Mus musculus Ccnd2 12444
Cyclin D3 Mus musculus Ccnd3 12445
Cyclin E Mus musculus Ccne1 12447
Cyclin E Drosophila CycE 34924
Cyclin E C. elegans cye-1 172399
cyclin dependent Schizosaccharo- cdc2 2539869
kinase 2 (CDK2) myces pombe
Cyclin dependent C. elegans cdk-2 171911
kinase 2 (CDK2)
Cyclin dependent Mus musculus Cdk2 12566
kinase 2 (CDK2)
Cyclin dependent Mus musculus Cdk4 12567
kinase 4 (CDK4)
Cyclin dependent C. elegans cdk-4 181472
kinase 4 (CDK4)
Cyclin dependent Homo sapiens CDK4 1019
kinase 4 (CDK4)
Cyclin dependent Mus musculus Cdk6 12471
kinase 6 (CDK6)
Cyclin dependent Homo sapiens CDK6 1021
kinase 6 (CDK6)
CyIIIa S. purpuratus Sp-CyIIIa Not found
DP Drosophila Dp 36461
Delta S. purpuratus Sp-Delta SPU_06128
E2F Drosophila Look up
E2F2 Mus musculus E2f1 13557
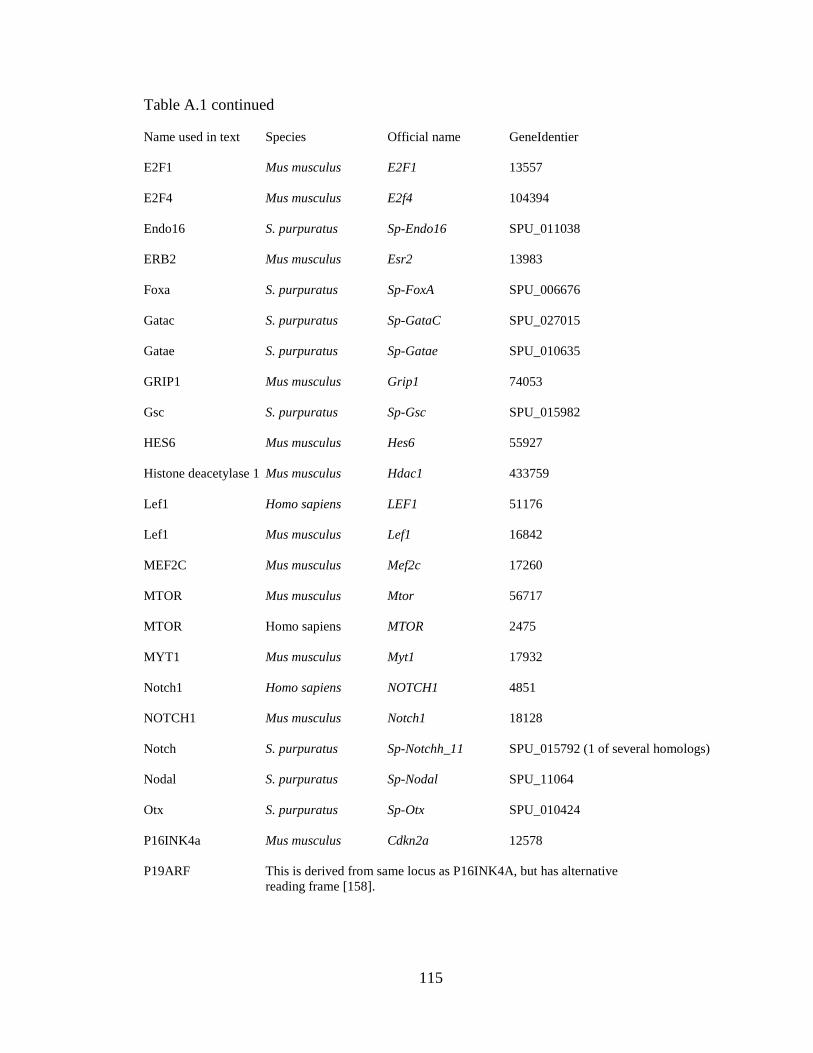
115
Table A.1 continued
Name used in text Species Official name GeneIdentier
E2F1 Mus musculus E2F1 13557
E2F4 Mus musculus E2f4 104394
Endo16 S. purpuratus Sp-Endo16 SPU_011038
ERB2 Mus musculus Esr2 13983
Foxa S. purpuratus Sp-FoxA SPU_006676
Gatac S. purpuratus Sp-GataC SPU_027015
Gatae S. purpuratus Sp-Gatae SPU_010635
GRIP1 Mus musculus Grip1 74053
Gsc S. purpuratus Sp-Gsc SPU_015982
HES6 Mus musculus Hes6 55927
Histone deacetylase 1 Mus musculus Hdac1 433759
Lef1 Homo sapiens LEF1 51176
Lef1 Mus musculus Lef1 16842
MEF2C Mus musculus Mef2c 17260
MTOR Mus musculus Mtor 56717
MTOR Homo sapiens MTOR 2475
MYT1 Mus musculus Myt1 17932
Notch1 Homo sapiens NOTCH1 4851
NOTCH1 Mus musculus Notch1 18128
Notch S. purpuratus Sp-Notchh_11 SPU_015792 (1 of several homologs)
Nodal S. purpuratus Sp-Nodal SPU_11064
Otx S. purpuratus Sp-Otx SPU_010424
P16INK4a Mus musculus Cdkn2a 12578
P19ARF This is derived from same locus as P16INK4A, but has alternative
reading frame [158].

116
Table A.1 continued
Name used in text Species Official name GeneIdentier
P53 Homo sapiens TP53 7157
P107 Homo sapiens RBL1 5933
P107 Mus musculus Rbl1 19650
P130 Homo sapiens RBL2 5934
P130 Mus musculus Rbl2 19651
Pax4 S. purpuratus Sp-Pax4 Not listed
Retinoblastoma (Rb) Mus musculus Rb1 19645
Retinoblastoma (Rb) Homo sapiens RB1 5925
Runx1 Mus musculus Runx1 12394
Runt1 S. purpuratus Sp-Runt1 SPU_006917
SM50 S. purpuratus Sp-Sm50 SPU_018811
Sp1 Homo sapiens SP1 6667
Stat3 Mus musculus Stat3 20848
STAT5 Homo sapiens STAT5 50695
Su(H) S. purpuratus Sp-SuH SPU_021566
TCF S. purpuratus Sp-Tcf SPU_009520
Telomerase Homo sapiens TERT 7015
Telomerase Mus musculus Tert 21752
TGFA Homo sapiens TGFA 7039
WEE Mus musculus Wee1 22390
Wnt6 S. purpuratus Sp-Wnt6 SPU_13570
Wnt8 S. purpuratus Sp-Wnt8 SPU_020371

117
APPENDIX B: PRIMER SEQUENCES
Table B.1: Primer sequences
Notes: 1. In each case, the forward primer is shown before the reverse primer. 2. The
primers shown below were those used for linking potential regulatory regions of Sp-CycD
to 13 tag reporters by fusion PCR. The nucleotides colored red in each reverse primer do
not anneal with the Sp-CycD gene, but enable integration with a 13 tag reporter construct
during fusion PCR. 3. As noted in Materials and Methods, to generate PCR products for
incorporation into EpGFPII rather than linkage to 13 tag reporters, the forward primer in
each case is preceded on its 5’ end with the modification 5’-CTATCGATAGGTACC.
For the reverse primer, the 5’-TTGAAGTAGCTGGCAGTGACGT modification is
replaced with 5’-ACAGTTTAACCCGGG.
A. For amplifying the indicated tested regions of Sp-CycD:
1: CAGATAAGATGTGAAGTGATGTTGG and
TTGAAGTAGCTGGCAGTGACGTAAGTAAATTTTGTTTTGGCCTGA
14: ACATGCAGTCAGGCCAAAAC and
TTGAAGTAGCTGGCAGTGACGTTTCCCCTGGCTACCAGTATG
2: GTAGCCAGGGGAATCGTGT and
TTGAAGTAGCTGGCAGTGACGTTCTGCAATCTTTGCTCACTTT
14: ACATGCAGTCAGGCCAAAAC and
TTGAAGTAGCTGGCAGTGACGTTTCCCCTGGCTACCAGTATG
15: GGTGTGGAACCATAGCCGTA and
TTGAAGTAGCTGGCAGTGACGTGAGAGAATGTGAAAGAGATAGAGAAGG
3: CGTTTCAAATGTACTTTTAATGAAGC and
TTGAAGTAGCTGGCAGTGACGTATTTGGCCTAGGCAACAGTG
16: ACAAAATGACGTGATCTATAGGC and
TTGAAGTAGCTGGCAGTGACGTTCAATATTGGGAGGACTGTGC
4: TTAATAAATGCGCACAGTCCTC and
TTGAAGTAGCTGGCAGTGACGTTGGAATGGGTTATTTATTTCTGTTC
17: AGTATTTTTCACTTTTCTCGGTTTCAA and
TTGAAGTAGCTGGCAGTGACGTCTGCAGAAAACAAACAAAAAGA
5: ACTCGTAAGTATTTCCATTTTTGG and
TTGAAGTAGCTGGCAGTGACGTCTAGGCTATTGAGGGCTTAGAG
18: AGAACAAAGAGACTGGTTTGTCG and
TTGAAGTAGCTGGCAGTGACGTAAGCTTTTGCACTTTGTATTTGG
6: CAGACGGAGTTGTCATAGTT and
TTGAAGTAGCTGGCAGTGACGTATTTCTGTGAATTGGGAAGAAAA
7: ACAGGTAAGCCAAACCCGTCCT and
TTGAAGTAGCTGGCAGTGACGTAGAGTAGAGGGGGAAAGAG
8: ATCTTCGGAATGGATTGTGG and
TTGAAGTAGCTGGCAGTGACGTAGAACCAGTGGAAGCACACC
19: AACCGTAAGTACATTTTATTTGTT and
TTGAAGTAGCTGGCAGTGACGTTTTACTTGGTACACTTCCAGCTT
9: TTTGATGATGCAATAAAGAAAGAAA and
TTGAAGTAGCTGGCAGTGACGTTAAATGTAACTTTGTACAGGCTGTTTG
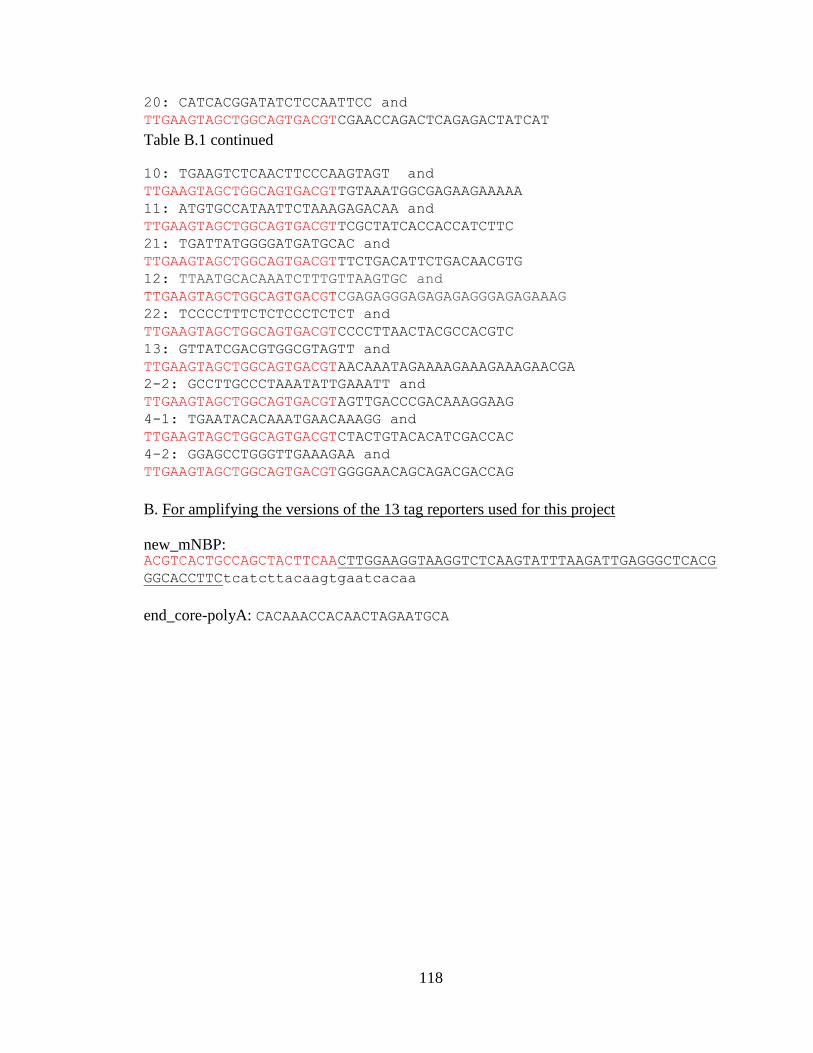
118
20: CATCACGGATATCTCCAATTCC and
TTGAAGTAGCTGGCAGTGACGTCGAACCAGACTCAGAGACTATCAT
Table B.1 continued
10: TGAAGTCTCAACTTCCCAAGTAGT and
TTGAAGTAGCTGGCAGTGACGTTGTAAATGGCGAGAAGAAAAA
11: ATGTGCCATAATTCTAAAGAGACAA and
TTGAAGTAGCTGGCAGTGACGTTCGCTATCACCACCATCTTC
21: TGATTATGGGGATGATGCAC and
TTGAAGTAGCTGGCAGTGACGTTTCTGACATTCTGACAACGTG
12: TTAATGCACAAATCTTTGTTAAGTGC and
TTGAAGTAGCTGGCAGTGACGTCGAGAGGGAGAGAGAGGGAGAGAAAG
22: TCCCCTTTCTCTCCCTCTCT and
TTGAAGTAGCTGGCAGTGACGTCCCCTTAACTACGCCACGTC
13: GTTATCGACGTGGCGTAGTT and
TTGAAGTAGCTGGCAGTGACGTAACAAATAGAAAAGAAAGAAAGAACGA
2-2: GCCTTGCCCTAAATATTGAAATT and
TTGAAGTAGCTGGCAGTGACGTAGTTGACCCGACAAAGGAAG
4-1: TGAATACACAAATGAACAAAGG and
TTGAAGTAGCTGGCAGTGACGTCTACTGTACACATCGACCAC
4-2: GGAGCCTGGGTTGAAAGAA and
TTGAAGTAGCTGGCAGTGACGTGGGGAACAGCAGACGACCAG
B. For amplifying the versions of the 13 tag reporters used for this project
new_mNBP: ACGTCACTGCCAGCTACTTCAACTTGGAAGGTAAGGTCTCAAGTATTTAAGATTGAGGGCTCACG
GGCACCTTCtcatcttacaagtgaatcacaa
end_core-polyA: CACAAACCACAACTAGAATGCA
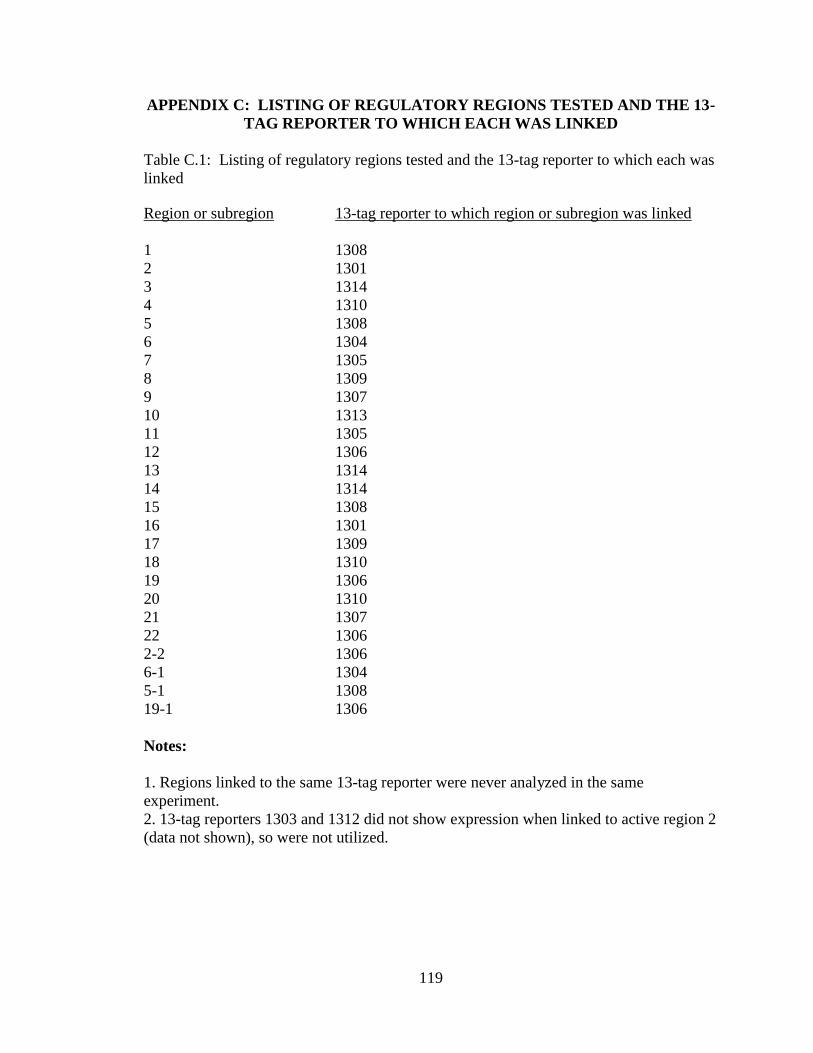
119
APPENDIX C: LISTING OF REGULATORY REGIONS TESTED AND THE 13-
TAG REPORTER TO WHICH EACH WAS LINKED
Table C.1: Listing of regulatory regions tested and the 13-tag reporter to which each was
linked
Region or subregion 13-tag reporter to which region or subregion was linked
1 1308
2 1301
3 1314
4 1310
5 1308
6 1304
7 1305
8 1309
9 1307
10 1313
11 1305
12 1306
13 1314
14 1314
15 1308
16 1301
17 1309
18 1310
19 1306
20 1310
21 1307
22 1306
2-2 1306
6-1 1304
5-1 1308
19-1 1306
Notes:
1. Regions linked to the same 13-tag reporter were never analyzed in the same
experiment.
2. 13-tag reporters 1303 and 1312 did not show expression when linked to active region 2
(data not shown), so were not utilized.
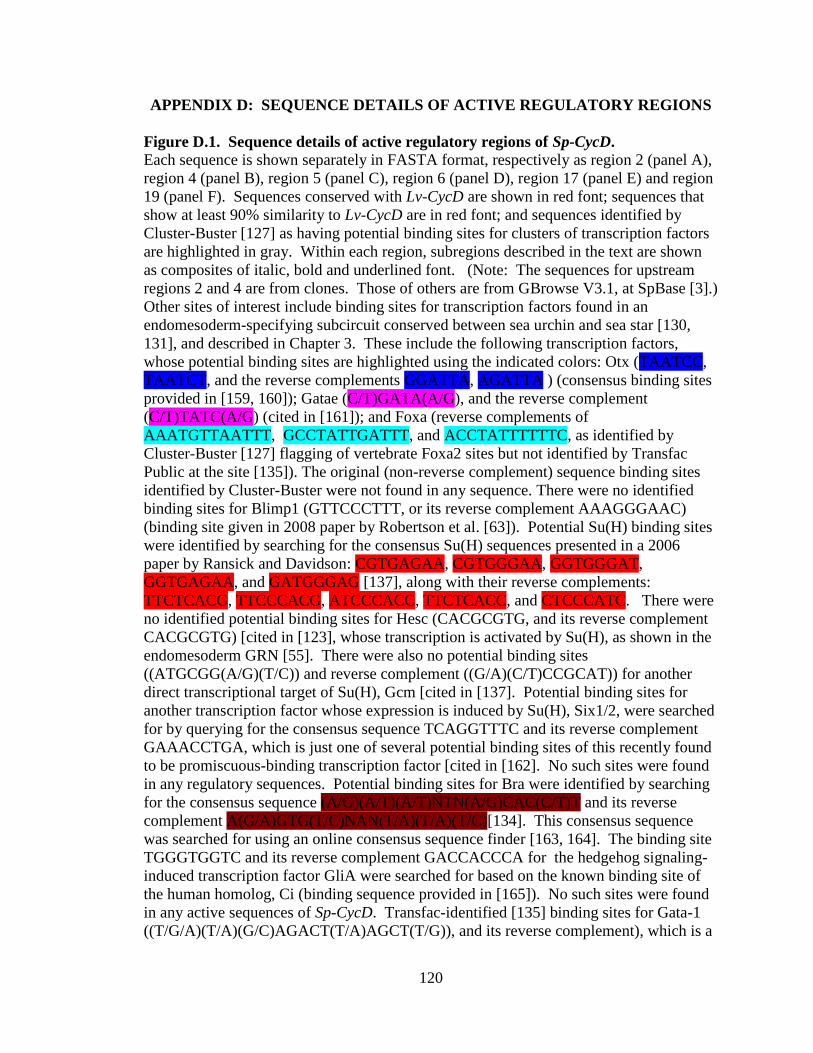
120
APPENDIX D: SEQUENCE DETAILS OF ACTIVE REGULATORY REGIONS
Figure D.1. Sequence details of active regulatory regions of Sp-CycD.
Each sequence is shown separately in FASTA format, respectively as region 2 (panel A),
region 4 (panel B), region 5 (panel C), region 6 (panel D), region 17 (panel E) and region
19 (panel F). Sequences conserved with Lv-CycD are shown in red font; sequences that
show at least 90% similarity to Lv-CycD are in red font; and sequences identified by
Cluster-Buster [127] as having potential binding sites for clusters of transcription factors
are highlighted in gray. Within each region, subregions described in the text are shown
as composites of italic, bold and underlined font. (Note: The sequences for upstream
regions 2 and 4 are from clones. Those of others are from GBrowse V3.1, at SpBase [3].)
Other sites of interest include binding sites for transcription factors found in an
endomesoderm-specifying subcircuit conserved between sea urchin and sea star [130,
131], and described in Chapter 3. These include the following transcription factors,
whose potential binding sites are highlighted using the indicated colors: Otx (TAATCC,
TAATCT, and the reverse complements GGATTA, AGATTA ) (consensus binding sites
provided in [159, 160]); Gatae (C/T)GATA(A/G), and the reverse complement
(C/T)TATC(A/G) (cited in [161]); and Foxa (reverse complements of
AAATGTTAATTT, GCCTATTGATTT, and ACCTATTTTTTC, as identified by
Cluster-Buster [127] flagging of vertebrate Foxa2 sites but not identified by Transfac
Public at the site [135]). The original (non-reverse complement) sequence binding sites
identified by Cluster-Buster were not found in any sequence. There were no identified
binding sites for Blimp1 (GTTCCCTTT, or its reverse complement AAAGGGAAC)
(binding site given in 2008 paper by Robertson et al. [63]). Potential Su(H) binding sites
were identified by searching for the consensus Su(H) sequences presented in a 2006
paper by Ransick and Davidson: CGTGAGAA, CGTGGGAA, GGTGGGAT,
GGTGAGAA, and GATGGGAG [137], along with their reverse complements:
TTCTCACG, TTCCCACG, ATCCCACC, TTCTCACC, and CTCCCATC. There were
no identified potential binding sites for Hesc (CACGCGTG, and its reverse complement
CACGCGTG) [cited in [123], whose transcription is activated by Su(H), as shown in the
endomesoderm GRN [55]. There were also no potential binding sites
((ATGCGG(A/G)(T/C)) and reverse complement ((G/A)(C/T)CCGCAT)) for another
direct transcriptional target of Su(H), Gcm [cited in [137]. Potential binding sites for
another transcription factor whose expression is induced by Su(H), Six1/2, were searched
for by querying for the consensus sequence TCAGGTTTC and its reverse complement
GAAACCTGA, which is just one of several potential binding sites of this recently found
to be promiscuous-binding transcription factor [cited in [162]. No such sites were found
in any regulatory sequences. Potential binding sites for Bra were identified by searching
for the consensus sequence (A/G)(A/T)(A/T)NTN(A/G)CAC(C/T)T and its reverse
complement A(G/A)GTG(T/C)NAN(T/A)(T/A)(T/C)[134]. This consensus sequence
was searched for using an online consensus sequence finder [163, 164]. The binding site
TGGGTGGTC and its reverse complement GACCACCCA for the hedgehog signaling-
induced transcription factor GliA were searched for based on the known binding site of
the human homolog, Ci (binding sequence provided in [165]). No such sites were found
in any active sequences of Sp-CycD. Transfac-identified [135] binding sites for Gata-1
((T/G/A)(T/A)(G/C)AGACT(T/A)AGCT(T/G)), and its reverse complement), which is a

121
Figure caption of Fig. D.1 continued
homolog of Gatac (cited in [136]), are highlighted in dark green. Potential TCF sites
(ACAAAG and its reverse complement CTTTGT) (cited in [63]) are highlighted in light
green. The following consensus sequences, highlighted in yellow, were considered
potential Runx binding sites: TGTGGT and its reverse complement ACCACA (based on
consensus binding site provided in reference [63]); and (C/T)G(C/T)GGT(C/T) and its
reverse complement (A/G)ACC(A/G)C(A/G), the consensus binding site for Runx an
early paper characterizing these transcription factors [125]. Two other transcription
factors discussed in the text include Gsc and Pax41. Gsc, a competitor with Otx, binds to
the same binding sites as Otx [146]. Therefore, Otx binding site can also be considered
as Gsc binding sites. Binding sites for Pax4 are not shown individually in this figure.
As shown in Appendix E, analysis of the sequences of the regulatory regions using
Cluster-Buster [127] yielded potential binding sites for this transcription factor in region
5, at the following positions within this region: 509-538; 626-655; 1045-1074; 1047-
1076; 1048-1077; 1210-1239; 1214-1243; 1490-1519; 1491-1520; and 1492-1521. These
areas are distinguished in the figure by increasing their font sizes to 16 rather
than 11 used in the rest of the figure. These areas are also highlighted in the Cluster-
Buster output from the analysis of region 5 in Appendix E. These regions appear within
the bp identified by Cluster-Buster as potential areas where transcription factor binding
sites might cluster, which, as noted above, are highlighted in gray.
Note: Sequences labelled as indicated in the above two page figure legend begin on the
next page.
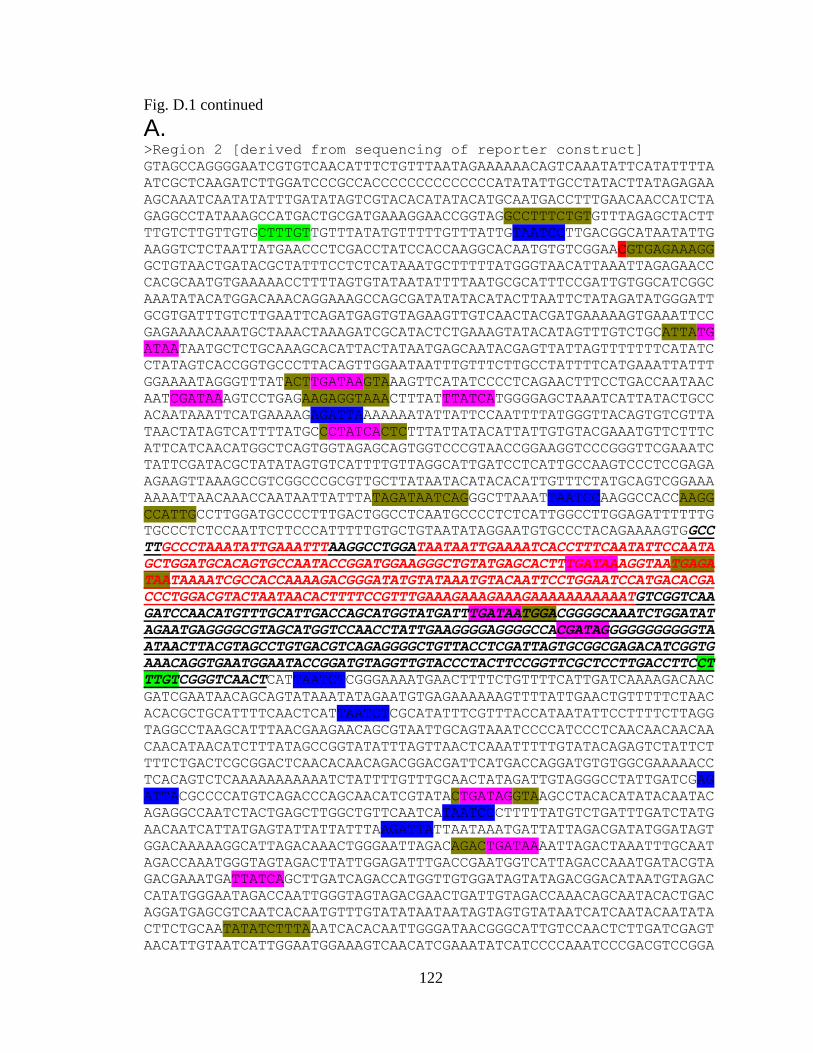
122
Fig. D.1 continued
A. >Region 2 [derived from sequencing of reporter construct]
GTAGCCAGGGGAATCGTGTCAACATTTCTGTTTAATAGAAAAAACAGTCAAATATTCATATTTTA
ATCGCTCAAGATCTTGGATCCCGCCACCCCCCCCCCCCCCATATATTGCCTATACTTATAGAGAA
AGCAAATCAATATATTTGATATAGTCGTACACATATACATGCAATGACCTTTGAACAACCATCTA
GAGGCCTATAAAGCCATGACTGCGATGAAAGGAACCGGTAGGCCTTTCTGTGTTTAGAGCTACTT
TTGTCTTGTTGTGCTTTGTTGTTTATATGTTTTTGTTTATTGTAATCCTTGACGGCATAATATTG
AAGGTCTCTAATTATGAACCCTCGACCTATCCACCAAGGCACAATGTGTCGGAACGTGAGAAAGG
GCTGTAACTGATACGCTATTTCCTCTCATAAATGCTTTTTATGGGTAACATTAAATTAGAGAACC
CACGCAATGTGAAAAACCTTTTAGTGTATAATATTTTAATGCGCATTTCCGATTGTGGCATCGGC
AAATATACATGGACAAACAGGAAAGCCAGCGATATATACATACTTAATTCTATAGATATGGGATT
GCGTGATTTGTCTTGAATTCAGATGAGTGTAGAAGTTGTCAACTACGATGAAAAAGTGAAATTCC
GAGAAAACAAATGCTAAACTAAAGATCGCATACTCTGAAAGTATACATAGTTTGTCTGCATTATG
ATAATAATGCTCTGCAAAGCACATTACTATAATGAGCAATACGAGTTATTAGTTTTTTTCATATC
CTATAGTCACCGGTGCCCTTACAGTTGGAATAATTTGTTTCTTGCCTATTTTCATGAAATTATTT
GGAAAATAGGGTTTATACTTGATAAGTAAAGTTCATATCCCCTCAGAACTTTCCTGACCAATAAC
AATCGATAAAGTCCTGAGAAGAGGTAAACTTTATTTATCATGGGGAGCTAAATCATTATACTGCC
ACAATAAATTCATGAAAAGAGATTAAAAAAATATTATTCCAATTTTATGGGTTACAGTGTCGTTA
TAACTATAGTCATTTTATGCCCTATCACTCTTTATTATACATTATTGTGTACGAAATGTTCTTTC
ATTCATCAACATGGCTCAGTGGTAGAGCAGTGGTCCCGTAACCGGAAGGTCCCGGGTTCGAAATC
TATTCGATACGCTATATAGTGTCATTTTGTTAGGCATTGATCCTCATTGCCAAGTCCCTCCGAGA
AGAAGTTAAAGCCGTCGGCCCGCGTTGCTTATAATACATACACATTGTTTCTATGCAGTCGGAAA
AAAATTAACAAACCAATAATTATTTATAGATAATCAGGGCTTAAATTAATCCAAGGCCACCAAGG
CCATTGCCTTGGATGCCCCTTTGACTGGCCTCAATGCCCCTCTCATTGGCCTTGGAGATTTTTTG
TGCCCTCTCCAATTCTTCCCATTTTTGTGCTGTAATATAGGAATGTGCCCTACAGAAAAGTGGCC
TTGCCCTAAATATTGAAATTTAAGGCCTGGATAATAATTGAAAATCACCTTTCAATATTCCAATA
GCTGGATGCACAGTGCCAATACCGGATGGAAGGGCTGTATGAGCACTTTGATAAAGGTAATGAGA
TAATAAAATCGCCACCAAAAGACGGGATATGTATAAATGTACAATTCCTGGAATCCATGACACGA
CCCTGGACGTACTAATAACACTTTTCCGTTTGAAAGAAAGAAAGAAAAAAAAAAATGTCGGTCAA
GATCCAACATGTTTGCATTGACCAGCATGGTATGATTTGATAATGGACGGGGCAAATCTGGATAT
AGAATGAGGGGCGTAGCATGGTCCAACCTATTGAAGGGGAGGGGCCACGATAGGGGGGGGGGGTA
ATAACTTACGTAGCCTGTGACGTCAGAGGGGCTGTTACCTCGATTAGTGCGGCGAGACATCGGTG
AAACAGGTGAATGGAATACCGGATGTAGGTTGTACCCTACTTCCGGTTCGCTCCTTGACCTTCCT
TTGTCGGGTCAACTCATTAATCTCGGGAAAATGAACTTTTCTGTTTTCATTGATCAAAAGACAAC
GATCGAATAACAGCAGTATAAATATAGAATGTGAGAAAAAAGTTTTATTGAACTGTTTTTCTAAC
ACACGCTGCATTTTCAACTCATTAATCTCGCATATTTCGTTTACCATAATATTCCTTTTCTTAGG
TAGGCCTAAGCATTTAACGAAGAACAGCGTAATTGCAGTAAATCCCCATCCCTCAACAACAACAA
CAACATAACATCTTTATAGCCGGTATATTTAGTTAACTCAAATTTTTGTATACAGAGTCTATTCT
TTTCTGACTCGCGGACTCAACACAACAGACGGACGATTCATGACCAGGATGTGTGGCGAAAAACC
TCACAGTCTCAAAAAAAAAAATCTATTTTGTTTGCAACTATAGATTGTAGGGCCTATTGATCGAG
ATTACGCCCCATGTCAGACCCAGCAACATCGTATACTGATAGGTAAGCCTACACATATACAATAC
AGAGGCCAATCTACTGAGCTTGGCTGTTCAATCATAATCCCTTTTTATGTCTGATTTGATCTATG
AACAATCATTATGAGTATTATTATTTAAGATTATTAATAAATGATTATTAGACGATATGGATAGT
GGACAAAAAGGCATTAGACAAACTGGGAATTAGACAGACTGATAAAATTAGACTAAATTTGCAAT
AGACCAAATGGGTAGTAGACTTATTGGAGATTTGACCGAATGGTCATTAGACCAAATGATACGTA
GACGAAATGATTATCAGCTTGATCAGACCATGGTTGTGGATAGTATAGACGGACATAATGTAGAC
CATATGGGAATAGACCAATTGGGTAGTAGACGAACTGATTGTAGACCAAACAGCAATACACTGAC
AGGATGAGCGTCAATCACAATGTTTGTATATAATAATAGTAGTGTATAATCATCAATACAATATA
CTTCTGCAATATATCTTTAAATCACACAATTGGGATAACGGGCATTGTCCAACTCTTGATCGAGT
AACATTGTAATCATTGGAATGGAAAGTCAACATCGAAATATCATCCCCAAATCCCGACGTCCGGA
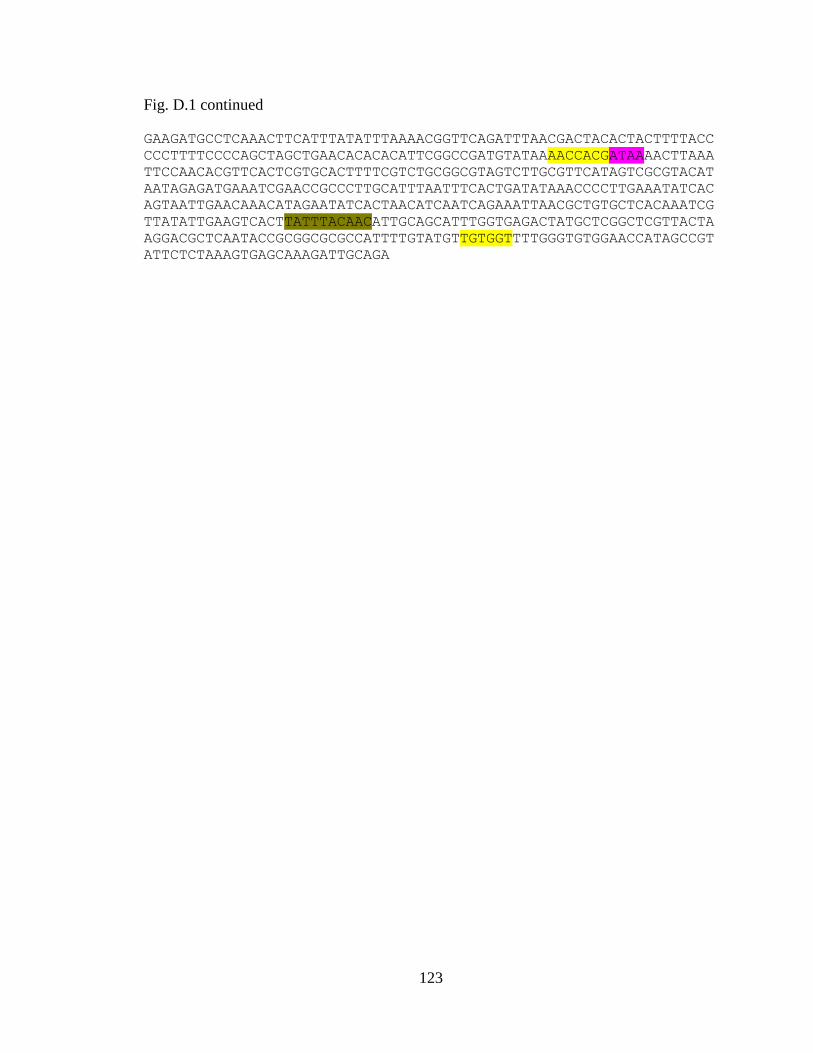
123
Fig. D.1 continued
GAAGATGCCTCAAACTTCATTTATATTTAAAACGGTTCAGATTTAACGACTACACTACTTTTACC
CCCTTTTCCCCAGCTAGCTGAACACACACATTCGGCCGATGTATAAAACCACGATAAAACTTAAA
TTCCAACACGTTCACTCGTGCACTTTTCGTCTGCGGCGTAGTCTTGCGTTCATAGTCGCGTACAT
AATAGAGATGAAATCGAACCGCCCTTGCATTTAATTTCACTGATATAAACCCCTTGAAATATCAC
AGTAATTGAACAAACATAGAATATCACTAACATCAATCAGAAATTAACGCTGTGCTCACAAATCG
TTATATTGAAGTCACTTATTTACAACATTGCAGCATTTGGTGAGACTATGCTCGGCTCGTTACTA
AGGACGCTCAATACCGCGGCGCGCCATTTTGTATGTTGTGGTTTTGGGTGTGGAACCATAGCCGT
ATTCTCTAAAGTGAGCAAAGATTGCAGA

124
Fig. D.1 continued
B. >Region 4 [derived from sequencing of reporter construct]
TTAATAAATGCGCACAGTCCTCCCAATATTGAATACACAAATGAACAAAGGTCCGAATTTGTTAT
TTATAATTCGATTGAGAAAGATAATGAAAAGGTTGAAAAAGATTATTCTCTGACCAAAATTTTTG
TTAGAGAAAAGGTAAAACGCATGAATCCATGATTATTAATTTTGTGTAAGGAAAATGAAACGTGT
AGAAAAATGGGCAATATCCTATCGATTAATATTGCTCATATATGATTATTTCATATTCGATCCTT
TTACAATGAATTCATTTATAGAAACGAATGTATCCGTGTGTTGTGAAATGAGCACTGTATCCGTG
TATTTTGCAATGAAAAGGCAGTAAAAAAAAAATCCCAATATTTGTATTCACCAGCGAGTTTTAAT
CATATACCGGGGAACTTTATCACCTTTATATATATCATTACTATATACGACAAAATCAATTACCA
ATTATTCAATTAATAACGAGCTCTCGACCTTCCATGGTATATTAACTTTGGCAGCGCTGAAAAGC
GAAGCCAAAGGGTCTTGCTTTTGTAGACTACAGATCTCGCTGTGGGCCGAGTTTTTTTTTCATTG
TACGCTACGCTACATGTTAGCACGATCAAGGAAGTTATGTCTCGCTTATGTACACCGTCTACGGG
AGAGAGCAATGTCTATAGAGTTAATGGCCATTCACTTTGTACACGTGTGTATGTTGTGTATGGGG
CTAGGCTGCCGTGGTCGATGTGTACAGTAGTGCAGTGAGATATGAATGCATTGGAGTGAGATACT
TCACTATAGCTGTACTGCACACAGTAAATTACATAGAGTAGTGCGTGGAGTCAAGTTGTATGCAG
CTAGCTAGTTTGCTGGAAAATATTTCAAAAATCATAAAATCGCTCATACATAACCAAAAGTGATA
ATCCAACCATTCATCATGTTCAGAAAAATATGATCTTTCCAATGAACTGATTTATTTTCAAAAAT
TTCACGATTATTTTTTTTTCGTGCATAGGCCTATACGCCTATTGTCATATTGAGTGTGTACTAAA
TATTTCTGGGCTAATACTAGAATAATTGATATAACTATTGAGAAGTGATACATTGAAAAGGAAGC
CGTTCATGATAATGCAAAAAGGTTAGAGATACATATTATAAGTTTTCAACCTTTTATCCTTCATG
ATCTGTCTTTCGTCATATGGACTGAACATGAAGCGTGTAATGATTTAGAATTATATTTTAATATA
TTAATTATAGCCAGTAATGATAAAGTGGTGCTGGAATGATTTGTTAGGGATTTTGGGGAAGTTCT
TGTTTCCGAAATTATTGGCAACCATAAGCGCTGGACACTTACATTTGACCATGGCCGCCCCAGCA
CTTCGGCCATTCCTAAACTAGTTGACCATTCAAAGCTAAACATTCCATCGAAAGATATAACCGGC
CCTAGCCAGTTTTCCACTACACACGTGAATACACCAGACCATATTACAAGGGACCGACAAGAGAC
TAGCTTGACCCAAATACTACCCCACCCCCTCATCTTCTCAAACTTCTCCCCCCCCCCCCCCCCCG
ACTCCACCCTAGAAGGCGGAGCCTGGGTTGAAAGAAAAGACAGAGAGAGAGGGAGAGAGATAGAG
AGAATGAAGGAGAGAGCTTAGTGTGTGGTATATTACATGTAGCTCAGTGATATAGTACGGTACTA
AAATATATAGGCCAAGCTTTTGACCAATCAAATGGTAGCACGGTCTGATCTTATGCATATTCAAC
AACCACTAGTTGCCGGTCGAATGTACACGTTTTACACGTTGAAGCAATGTGTGCATCACAAGCAT
GCGTTGTGAAGGAAATATCAAAGCATTCGGCAAAGGGACAGCACCGAATACGTACAGGCCTAACA
GACAATCCCAGAACGAACGAGAAAAGTTTTGGAGTTTGGGTATTAGTGGTGATTTTACCCGTTTT
CGCCAATATTCTGATCTCCAATCTCCACTGGGTTTGTAGGTTCTGGTCGTCTGCTGTTCCCCTTG
TGTCAAGTCACCAAAACTATCCCATTTTCCCACCCCTTTTTCACATTGGAAGTTAAAAAAGAACA
GAAATAAATAACCCATTCCA
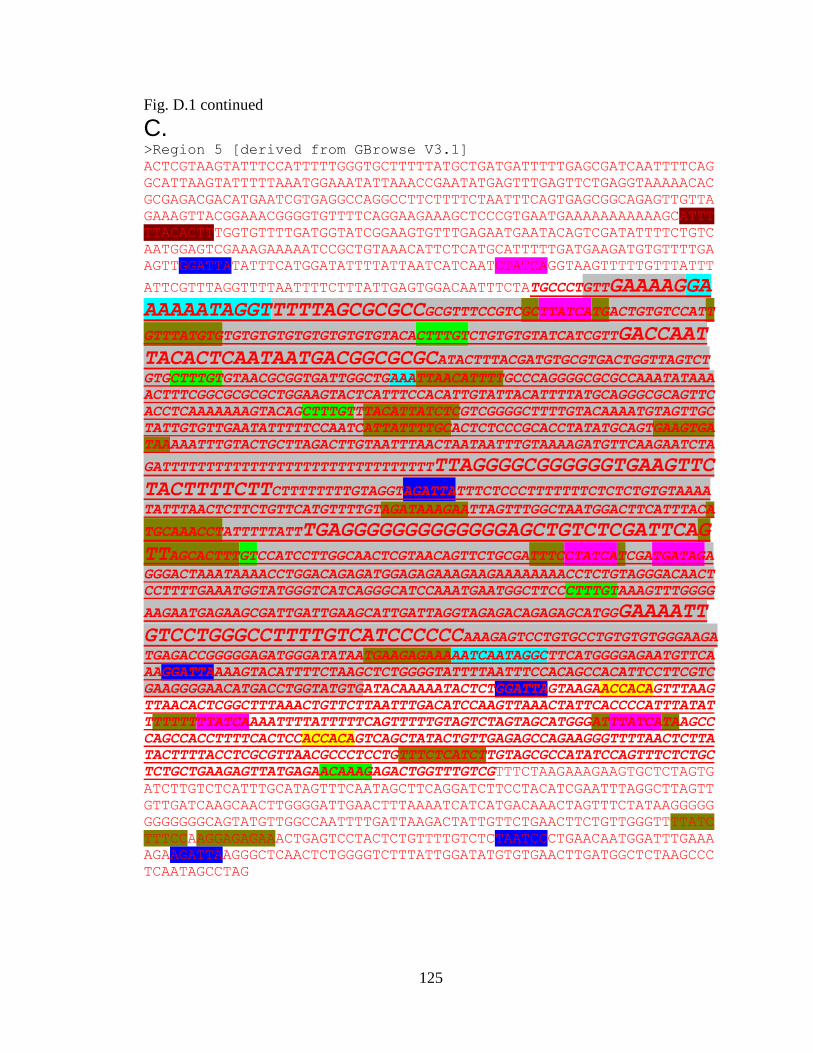
125
Fig. D.1 continued C. >Region 5 [derived from GBrowse V3.1]
ACTCGTAAGTATTTCCATTTTTGGGTGCTTTTTATGCTGATGATTTTTGAGCGATCAATTTTCAG
GCATTAAGTATTTTTAAATGGAAATATTAAACCGAATATGAGTTTGAGTTCTGAGGTAAAAACAC
GCGAGACGACATGAATCGTGAGGCCAGGCCTTCTTTTCTAATTTCAGTGAGCGGCAGAGTTGTTA
GAAAGTTACGGAAACGGGGTGTTTTCAGGAAGAAAGCTCCCGTGAATGAAAAAAAAAAAGCATTT
TTACACTTTGGTGTTTTGATGGTATCGGAAGTGTTTGAGAATGAATACAGTCGATATTTTCTGTC
AATGGAGTCGAAAGAAAAATCCGCTGTAAACATTCTCATGCATTTTTGATGAAGATGTGTTTTGA
AGTTGGATTATATTTCATGGATATTTTATTAATCATCAATCTATCAGGTAAGTTTTTGTTTATTT
ATTCGTTTAGGTTTTAATTTTCTTTATTGAGTGGACAATTTCTATGCCCTGTTGAAAAGGA
AAAAATAGGTTTTTAGCGCGCCGCGTTTCCGTCGCTTATCATGACTGTGTCCATT
GTTTATGTGTGTGTGTGTGTGTGTGTGTACACTTTGTCTGTGTGTATCATCGTTGACCAAT
TACACTCAATAATGACGGCGCGCATACTTTACGATGTGCGTGACTGGTTAGTCTGTGCTTTGTGTAACGCGGTGATTGGCTGAAATTAACATTTTGCCCAGGGGCGCGCCAAATATAAA
ACTTTCGGCGCGCGCTGGAAGTACTCATTTCCACATTGTATTACATTTTATGCAGGGCGCAGTTC
ACCTCAAAAAAAGTACAGCTTTGTTTACATTATCTCGTCGGGGCTTTTGTACAAAATGTAGTTGC
TATTGTGTTGAATATTTTTCCAATCATTATTTTGCACTCTCCCGCACCTATATGCAGTGAAGTGA
TAAAAATTTGTACTGCTTAGACTTGTAATTTAACTAATAATTTGTAAAAGATGTTCAAGAATCTA
GATTTTTTTTTTTTTTTTTTTTTTTTTTTTTTTTTAGGGGCGGGGGGTGAAGTTC
TACTTTTCTTCTTTTTTTTGTAGGTAGATTATTTCTCCCTTTTTTTCTCTCTGTGTAAAATATTTAACTCTTCTGTTCATGTTTTGTAGATAAAGAATTAGTTTGGCTAATGGACTTCATTTACA
TGCAAACCTATTTTTATTTGAGGGGGGGGGGGGGAGCTGTCTCGATTCAG
TTAGCACTTTGTCCATCCTTGGCAACTCGTAACAGTTCTGCGATTTCCTATCATCGATGATAGAGGGACTAAATAAAACCTGGACAGAGATGGAGAGAAAGAAGAAAAAAAACCTCTGTAGGGACAACT
CCTTTTGAAATGGTATGGGTCATCAGGGCATCCAAATGAATGGCTTCCCTTTGTAAAGTTTGGGG
AAGAATGAGAAGCGATTGATTGAAGCATTGATTAGGTAGAGACAGAGAGCATGGGAAAATT
GTCCTGGGCCTTTTGTCATCCCCCCAAAGAGTCCTGTGCCTGTGTGTGGGAAGATGAGACCGGGGGAGATGGGATATAATGAAGAGAAAAATCAATAGGCTTCATGGGGAGAATGTTCA
AAGGATTAAAAGTACATTTTCTAAGCTCTGGGGTATTTTAATTTCCACAGCCACATTCCTTCGTC
GAAGGGGAACATGACCTGGTATGTGATACAAAAATACTCTGGATTAGTAAGAACCACAGTTTAAG
TTAACACTCGGCTTTAAACTGTTCTTAATTTGACATCCAAGTTAAACTATTCACCCCATTTATAT
TTTTTTTTATCAAAATTTTATTTTTCAGTTTTTGTAGTCTAGTAGCATGGGATTTATCATAAGCC
CAGCCACCTTTTCACTCCACCACAGTCAGCTATACTGTTGAGAGCCAGAAGGGTTTTAACTCTTA
TACTTTTACCTCGCGTTAACGCCCTCCTGTTTCTCATCTTGTAGCGCCATATCCAGTTTCTCTGC
TCTGCTGAAGAGTTATGAGAACAAAGAGACTGGTTTGTCGTTTCTAAGAAAGAAGTGCTCTAGTG
ATCTTGTCTCATTTGCATAGTTTCAATAGCTTCAGGATCTTCCTACATCGAATTTAGGCTTAGTT
GTTGATCAAGCAACTTGGGGATTGAACTTTAAAATCATCATGACAAACTAGTTTCTATAAGGGGG
GGGGGGGCAGTATGTTGGCCAATTTTGATTAAGACTATTGTTCTGAACTTCTGTTGGGTTTTATC
TTTCCAAGGAGAGAAACTGAGTCCTACTCTGTTTTGTCTCTAATCCCTGAACAATGGATTTGAAA
AGAAGATTAAGGGCTCAACTCTGGGGTCTTTATTGGATATGTGTGAACTTGATGGCTCTAAGCCC
TCAATAGCCTAG

126
Fig. D.1 continued D. >Region 6 [derived from GBrowse V3.1]
CAGACGGAGTTGTCATAGTTAACTCTTATAAAACAAGGATTTTTTTTCTAAAATAGGAAAAAGCG
TATCAGTGACACCATCGTCCTTGCAAAAACAAGGTCAAGCAAAGTATACTGCAGATCAGTTTGTT
GTGGGTGTTATAAGTTCTTACTAAGTTATGATATCTTTTTGCCATAAATAATTTAATTTGCCACA
CTAGGAAATAGAAGCGACTTTTTAGATTTAATCAGCTTCAATAAAAATGACATAGAATTTATATT
TATAAATGTCACTTTGCATTTGCAGTATGCATGTCTTCAAAGAAAGGAAAATTTGTTTCATAGTT
ACTATTAGAATGGAATATATTTAATGAAAATCATCATTCATTTAAAGTGCATTTTTGAAGTTGGT
CTTTAATCTTTTCTCACATGTATTCAATTCAAGCGATTATCGTATCGATACCTTTAACGTCGAAA
CAGGATGTGGCATTTGATAATTAGCCTACGAGTGTGAAATATGAACTTCGGTCATTCCTTCTTTC
ATTTAACGAGACAGACGATTTATGAATGAGCCGGTTCATTTACTTGAGAAATAATTTCACTGGGA
TCTCAAGATAGATACTTTATTTGATTATTTTTAAGCAGTGACAAGTATGAAAATACAAACTGCAT
GGCCTCTGCTTTCATAGTTTTTACTCTTTAAACATATACCGGTAGAAAATAAACAGAACCAATTT
TTAGTTTAGCAATTTACTGGTTTCGTTTTATTCATAATTTAGTCTCAGCCGGGCCCAGACACCAA
ATACAAAGTGCAAAAGCTTTTCTTTCACTTAAACAAAAACAGGACTTGATTGAGAGTTGATCGAG
GAGGGATTCCGGATGTGATAGGATCCTTGTTATGTTTCAATTGATGTTAATTATTTCCCCTTTCT
TGTTCTTAATCCTCCTCTCAGTGTGCGTTAAAAAAAGTCACATGGATGAGAGGGGATTCTCGTTC
AGTGAGTATTTGTCAGAAATTGGAGATTGTGAAATGTTTGCTGGTGGTACTCTATGGACAGTTTA
GCCTGCAAGAGGGCAACGATTACATAAGCGTGTTTCCTCATTTAAAAACACTCAAAGTGAACATT
ACATAGATCATGTGATGAATTCACACCTATTTTTTTAAGCACATGTAGGGCCTGTTCGACCAAGA
AAATATGTGGGGAAAATGCATTTACTATAGCTATAACACAAAAATCTTATCCAATATGAAATGAA
CAAAAACACCACCCATTGTAGTGAAGGTTTCTGTTATTTATGTTCAATCGTGACTGCAATTTTAG
ATTTTCACAATTTTGTTGTAAATTTTAATAAATTCAATACAAAGTTTAATAATCAGAGTTCTTTT
GCCAAACTGCCAGAGATGATATGATCTGTGAAGAATCAGTAGGGTATTCATTCTGTGAGTAGTTC
ATCAGGCGTATCTGGCTCCGAACTGATTATTTCCCCCTCGTGTTATTTTAGGAGTGTCATTGACT
TGTGATAGAGATGAATGTGGTCACTCATGATCTACTTGGGTTTCATGCGGTCTGAGAAGACCGAT
GAAAATCCTGAAAAGGGCATTTGGTCTTCGCTAGCAAAAATGAAACAGGATCTAGGTTTTAATTT
TGACAAAAGTGACACTATTCACGTTAAGTGTTTCCTTTTCTTTAGTCTTGATGTGCAAGTAGAGA
TAAAGGATTTGATACCGAATGTGTGGTCAAATTATCTTGATAAAAAAAAAGCGGTCTTGTTCTTT
TGTTTCCCTCTTCGCACATTCGACCACAGAGTATGTAAATTGGACACTTCCATGCATGAGGATCA
TGTCTCTTCAGAGCAAAAATGGCGTTGGATCTGTGTTGAAAGTATATGATTCACCGGTAATGCCT
TTCTGGCATCAAAGAGTTAATTTATTTCATTTCCTTCATCAAAGTACAGTGTAGAGCCTAGATCA
AACTGTATAATGTGCTCTTATCACAAGATCTGAATATTATGCATTAATATTTTAAGGTGGGAGGC
TTTGTGTGTGTGTGTGTGTGTGTGGGGGGGGGGTGTTGTGGGTACAGTTAGGTACTAAGGTTATA
TTATACACCATGCCCTTTTTTTTTATTAAATGGTATTATGCACATGATTGATTAACCCTTTCAAT
GATTTCGGAGCAGACAATGTTTTAATAAAAAAATTGATGGTAGTGAAACAGTGCTCAGGCGCTGC
ACATCATCGTATGATGGATATCGTCCAATAAGGAGCATACCAGTACTTGTAGGTTACCGTTTCTT
AGAAAAGACCCTTTTAGAATTATCAGGAATGTGTTTGGAAAGTAATTTTAGATTTTCATCATCAA
CAACTTTAAGATGTCATTAGTAATTGACTATAACTTGGCTAGCCAGATTGTAAAGGAGAAGTAAT
ATGTCATAATCTTACAATAAAAAAAACATGTCTGTTAGTTGCAACTTGCAAGTGTACTTTCTGTA
TTTGCATCATGTAAGATCTACCATAAAAATAGTTCAGCTCCCTAACATGGTCCAATTTTGTATAA
AGTTCAAAATGTGCGAAATACAATATTATTTGATGTACTCCATGTTTCTTCATTCTCTTAAGCAT
ACCCTAGATGGCGCTGTTTACAAAGTATTAACCTGAATGCTATTGTTTTTGTCTTCCTTTGTTTT
TCTTCCCAATTCACAGAAAT
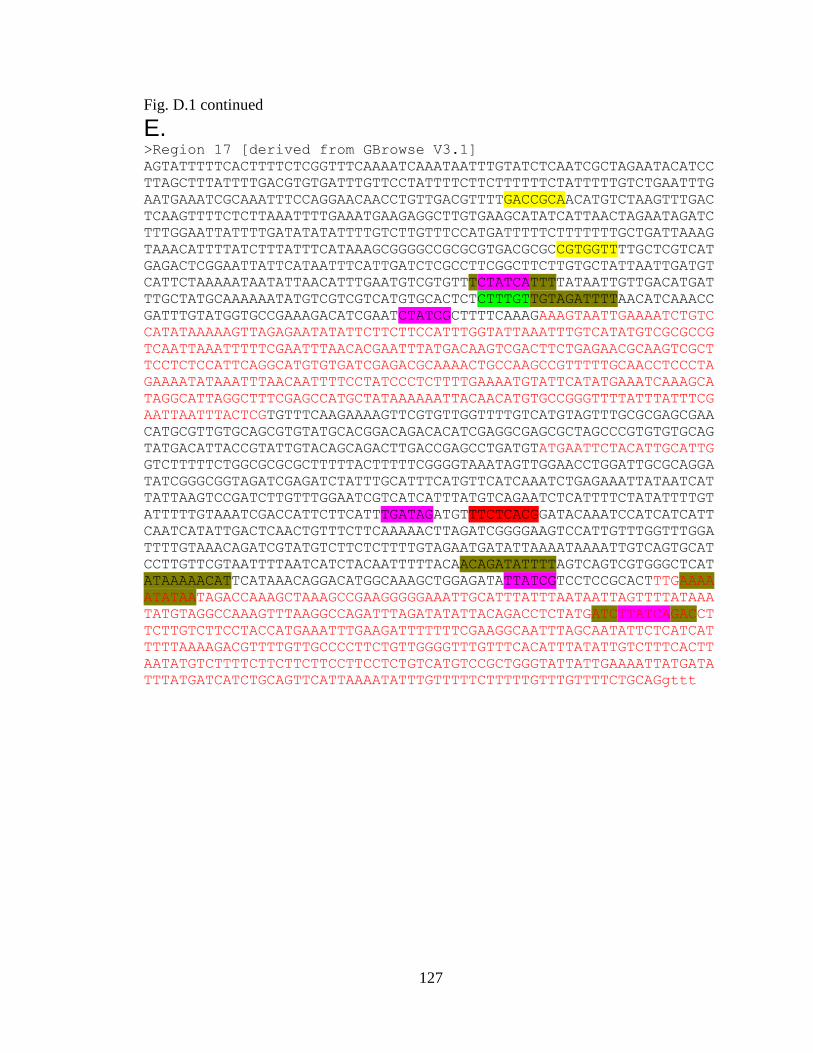
127
Fig. D.1 continued E. >Region 17 [derived from GBrowse V3.1]
AGTATTTTTCACTTTTCTCGGTTTCAAAATCAAATAATTTGTATCTCAATCGCTAGAATACATCC
TTAGCTTTATTTTGACGTGTGATTTGTTCCTATTTTCTTCTTTTTTCTATTTTTGTCTGAATTTG
AATGAAATCGCAAATTTCCAGGAACAACCTGTTGACGTTTTGACCGCAACATGTCTAAGTTTGAC
TCAAGTTTTCTCTTAAATTTTGAAATGAAGAGGCTTGTGAAGCATATCATTAACTAGAATAGATC
TTTGGAATTATTTTGATATATATTTTGTCTTGTTTCCATGATTTTTCTTTTTTTGCTGATTAAAG
TAAACATTTTATCTTTATTTCATAAAGCGGGGCCGCGCGTGACGCGCCGTGGTTTTGCTCGTCAT
GAGACTCGGAATTATTCATAATTTCATTGATCTCGCCTTCGGCTTCTTGTGCTATTAATTGATGT
CATTCTAAAAATAATATTAACATTTGAATGTCGTGTTTCTATCATTTTATAATTGTTGACATGAT
TTGCTATGCAAAAAATATGTCGTCGTCATGTGCACTCTCTTTGTTGTAGATTTTAACATCAAACC
GATTTGTATGGTGCCGAAAGACATCGAATCTATCGCTTTTCAAAGAAAGTAATTGAAAATCTGTC
CATATAAAAAGTTAGAGAATATATTCTTCTTCCATTTGGTATTAAATTTGTCATATGTCGCGCCG
TCAATTAAATTTTTCGAATTTAACACGAATTTATGACAAGTCGACTTCTGAGAACGCAAGTCGCT
TCCTCTCCATTCAGGCATGTGTGATCGAGACGCAAAACTGCCAAGCCGTTTTTGCAACCTCCCTA
GAAAATATAAATTTAACAATTTTCCTATCCCTCTTTTGAAAATGTATTCATATGAAATCAAAGCA
TAGGCATTAGGCTTTCGAGCCATGCTATAAAAAATTACAACATGTGCCGGGTTTTATTTATTTCG
AATTAATTTACTCGTGTTTCAAGAAAAGTTCGTGTTGGTTTTGTCATGTAGTTTGCGCGAGCGAA
CATGCGTTGTGCAGCGTGTATGCACGGACAGACACATCGAGGCGAGCGCTAGCCCGTGTGTGCAG
TATGACATTACCGTATTGTACAGCAGACTTGACCGAGCCTGATGTATGAATTCTACATTGCATTG
GTCTTTTTCTGGCGCGCGCTTTTTACTTTTTCGGGGTAAATAGTTGGAACCTGGATTGCGCAGGA
TATCGGGCGGTAGATCGAGATCTATTTGCATTTCATGTTCATCAAATCTGAGAAATTATAATCAT
TATTAAGTCCGATCTTGTTTGGAATCGTCATCATTTATGTCAGAATCTCATTTTCTATATTTTGT
ATTTTTGTAAATCGACCATTCTTCATTTGATAGATGTTTCTCACGGATACAAATCCATCATCATT
CAATCATATTGACTCAACTGTTTCTTCAAAAACTTAGATCGGGGAAGTCCATTGTTTGGTTTGGA
TTTTGTAAACAGATCGTATGTCTTCTCTTTTGTAGAATGATATTAAAATAAAATTGTCAGTGCAT
CCTTGTTCGTAATTTTAATCATCTACAATTTTTACAACAGATATTTTAGTCAGTCGTGGGCTCAT
ATAAAAACATTCATAAACAGGACATGGCAAAGCTGGAGATATTATCGTCCTCCGCACTTTGAAAA
ATATAATAGACCAAAGCTAAAGCCGAAGGGGGAAATTGCATTTATTTAATAATTAGTTTTATAAA
TATGTAGGCCAAAGTTTAAGGCCAGATTTAGATATATTACAGACCTCTATGATCTTATCAGACCT
TCTTGTCTTCCTACCATGAAATTTGAAGATTTTTTTCGAAGGCAATTTAGCAATATTCTCATCAT
TTTTAAAAGACGTTTTGTTGCCCCTTCTGTTGGGGTTTGTTTCACATTTATATTGTCTTTCACTT
AATATGTCTTTTCTTCTTCTTCCTTCCTCTGTCATGTCCGCTGGGTATTATTGAAAATTATGATA
TTTATGATCATCTGCAGTTCATTAAAATATTTGTTTTTCTTTTTGTTTGTTTTCTGCAGgttt
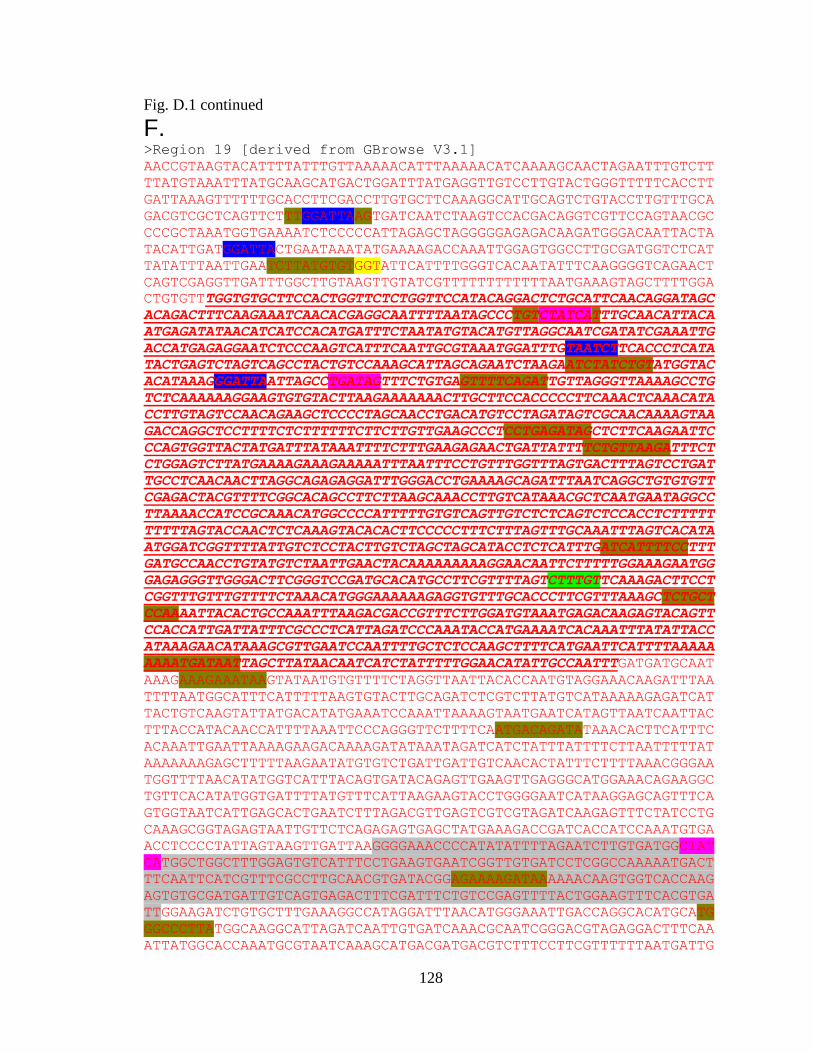
128
Fig. D.1 continued F. >Region 19 [derived from GBrowse V3.1]
AACCGTAAGTACATTTTATTTGTTAAAAACATTTAAAAACATCAAAAGCAACTAGAATTTGTCTT
TTATGTAAATTTATGCAAGCATGACTGGATTTATGAGGTTGTCCTTGTACTGGGTTTTTCACCTT
GATTAAAGTTTTTTGCACCTTCGACCTTGTGCTTCAAAGGCATTGCAGTCTGTACCTTGTTTGCA
GACGTCGCTCAGTTCTTTGGATTAAGTGATCAATCTAAGTCCACGACAGGTCGTTCCAGTAACGC
CCCGCTAAATGGTGAAAATCTCCCCCATTAGAGCTAGGGGGAGAGACAAGATGGGACAATTACTA
TACATTGATGGATTACTGAATAAATATGAAAAGACCAAATTGGAGTGGCCTTGCGATGGTCTCAT
TATATTTAATTGAATCTTATGTGTGGTATTCATTTTGGGTCACAATATTTCAAGGGGTCAGAACT
CAGTCGAGGTTGATTTGGCTTGTAAGTTGTATCGTTTTTTTTTTTTAATGAAAGTAGCTTTTGGA
CTGTGTTTGGTGTGCTTCCACTGGTTCTCTGGTTCCATACAGGACTCTGCATTCAACAGGATAGC
ACAGACTTTCAAGAAATCAACACGAGGCAATTTTAATAGCCCTGTCTATCATTTGCAACATTACA
ATGAGATATAACATCATCCACATGATTTCTAATATGTACATGTTAGGCAATCGATATCGAAATTG
ACCATGAGAGGAATCTCCCAAGTCATTTCAATTGCGTAAATGGATTTGTAATCTTCACCCTCATA
TACTGAGTCTAGTCAGCCTACTGTCCAAAGCATTAGCAGAATCTAAGAATCTATCTGTATGGTAC
ACATAAAGGGATTAATTAGCCTGATAGTTTCTGTGAGTTTTCAGATTGTTAGGGTTAAAAGCCTG
TCTCAAAAAAGGAAGTGTGTACTTAAGAAAAAAACTTGCTTCCACCCCCTTCAAACTCAAACATA
CCTTGTAGTCCAACAGAAGCTCCCCTAGCAACCTGACATGTCCTAGATAGTCGCAACAAAAGTAA
GACCAGGCTCCTTTTCTCTTTTTTCTTCTTGTTGAAGCCCTCCTGAGATAGCTCTTCAAGAATTC
CCAGTGGTTACTATGATTTATAAATTTTCTTTGAAGAGAACTGATTATTTTCTGTTAAGATTTCT
CTGGAGTCTTATGAAAAGAAAGAAAAATTTAATTTCCTGTTTGGTTTAGTGACTTTAGTCCTGAT
TGCCTCAACAACTTAGGCAGAGAGGATTTGGGACCTGAAAAGCAGATTTAATCAGGCTGTGTGTT
CGAGACTACGTTTTCGGCACAGCCTTCTTAAGCAAACCTTGTCATAAACGCTCAATGAATAGGCC
TTAAAACCATCCGCAAACATGGCCCCATTTTTGTGTCAGTTGTCTCTCAGTCTCCACCTCTTTTT
TTTTTAGTACCAACTCTCAAAGTACACACTTCCCCCTTTCTTTAGTTTGCAAATTTAGTCACATA
ATGGATCGGTTTTATTGTCTCCTACTTGTCTAGCTAGCATACCTCTCATTTGATCATTTTCCTTT
GATGCCAACCTGTATGTCTAATTGAACTACAAAAAAAAAGGAACAATTCTTTTTGGAAAGAATGG
GAGAGGGTTGGGACTTCGGGTCCGATGCACATGCCTTCGTTTTAGTCTTTGTTCAAAGACTTCCT
CGGTTTGTTTGTTTTCTAAACATGGGAAAAAAGAGGTGTTTGCACCCTTCGTTTAAAGCTCTGCT
CCAAAATTACACTGCCAAATTTAAGACGACCGTTTCTTGGATGTAAATGAGACAAGAGTACAGTT
CCACCATTGATTATTTCGCCCTCATTAGATCCCAAATACCATGAAAATCACAAATTTATATTACC
ATAAAGAACATAAAGCGTTGAATCCAATTTTGCTCTCCAAGCTTTTCATGAATTCATTTTAAAAA
AAAATGATAATTAGCTTATAACAATCATCTATTTTTGGAACATATTGCCAATTTGATGATGCAAT
AAAGAAAGAAATAAGTATAATGTGTTTTCTAGGTTAATTACACCAATGTAGGAAACAAGATTTAA
TTTTAATGGCATTTCATTTTTAAGTGTACTTGCAGATCTCGTCTTATGTCATAAAAAGAGATCAT
TACTGTCAAGTATTATGACATATGAAATCCAAATTAAAAGTAATGAATCATAGTTAATCAATTAC
TTTACCATACAACCATTTTAAATTCCCAGGGTTCTTTTCAATGACAGATATAAACACTTCATTTC
ACAAATTGAATTAAAAGAAGACAAAAGATATAAATAGATCATCTATTTATTTTCTTAATTTTTAT
AAAAAAAGAGCTTTTTAAGAATATGTGTCTGATTGATTGTCAACACTATTTCTTTTAAACGGGAA
TGGTTTTAACATATGGTCATTTACAGTGATACAGAGTTGAAGTTGAGGGCATGGAAACAGAAGGC
TGTTCACATATGGTGATTTTATGTTTCATTAAGAAGTACCTGGGGAATCATAAGGAGCAGTTTCA
GTGGTAATCATTGAGCACTGAATCTTTAGACGTTGAGTCGTCGTAGATCAAGAGTTTCTATCCTG
CAAAGCGGTAGAGTAATTGTTCTCAGAGAGTGAGCTATGAAAGACCGATCACCATCCAAATGTGA
ACCTCCCCTATTAGTAAGTTGATTAAGGGGAAACCCCATATATTTTAGAATCTTGTGATGGCTAT
CATGGCTGGCTTTGGAGTGTCATTTCCTGAAGTGAATCGGTTGTGATCCTCGGCCAAAAATGACT
TTCAATTCATCGTTTCGCCTTGCAACGTGATACGGAGAAAAGATAAAAAACAAGTGGTCACCAAG
AGTGTGCGATGATTGTCAGTGAGACTTTCGATTTCTGTCCGAGTTTTACTGGAAGTTTCACGTGA
TTGGAAGATCTGTGCTTTGAAAGGCCATAGGATTTAACATGGGAAATTGACCAGGCACATGCATG
GGCCCTTATGGCAAGGCATTAGATCAATTGTGATCAAACGCAATCGGGACGTAGAGGACTTTCAA
ATTATGGCACCAAATGCGTAATCAAAGCATGACGATGACGTCTTTCCTTCGTTTTTTAATGATTG

129
Fig. D.1 continued
GAAATGAAAGATGCATATATTTATAGCATTGAGATCTCTGTCAAATGCATCAAAATATGAATGAA
TCCATTTTTGTGAAGTATGAGGAATAAACACATGGAAATAGAAACAGTGACCTCTCTCTCTCTCT
CTCTCTTTCTCTCTCTCTCTTTCTCTCCACTTCTGACCAATCATTGTGAAGTTGTGTTAGGTGTC
CATTGTCAATGCCATTTACATCTTGAACTTGCCCCCAATGTGGTAAAAATTTCTGGAAACGCTGC
ATGCCACAGAACTAATAAACAAACTTGAGCTACATTGTACGAAGAAATAAAGTGCTATGATTATC
ATTTGTGGTCTAACACACATTGTATCCTCCTGCCTTTTCTTCCATCATCACACTCGCCCCTCTTC
GTCAGGAAAGGGGGGGGGGGGCGGTGAGGAACCCCTAGTCTGTGCCTGGGCATGTTATTAGCACT
TTAAAGGAGGGATTAGTTGAGATAAACCTACCTTTATTCTCCACTTGAGCTAAGCTAAGCTGAAT
AGTTCTAAGCTCTTCAGAGAATTTAATGATTCTTATAAAACATTGGGGTGAGACGATTAAATTGA
ATCTCATAGAAATGTTCCAGTTTTTCCAAAGCTAAGAATTTGACGGTCAACTTTGCCAAAGATCT
GCAACGATTCGGTCGGTATTCATGCGATGGGTATGATTGGTAGAAAACGTCTTGTAACCAGACTA
CATGTGAACACTTTGTGAACTCTTCTACGATGGCAAATGTCACAAGGGTTGGGTCATGTCTGGCC
CTCAGCAGAAAAAGAGACAAACTTTGTCCAAATCTGCGAAATTCCTGAGGCTCGCATACCATTCC
TGACCCCCAATATCCCCTTCGAGACCCAATTTCCCAAGATTTCTCAAGATTTTCTCACTCTATTG
ATGACAAAAAGAAAAAGGGTGAGTCATCCGCCCTGAAAAGTGGCTAGCAGAAAAGAAACAAATGG
TTGACCAAACAAGCTGTGAAGAGGATGCACCCTTTGAGGTTTTGAGTTCCCCTAATCTGTGTGAT
TAACCTTCCAAAGTCACACCACAAAGAATTGAGTATCAGGGACTAAAGAGGGTCCTCTTGCCAGA
AAGAACAAAAAAAATCCTTAGCAGTGCAATGAAAAGAGATACATAATTGGAACTTTCCCTCAACC
CTCCCCCAATGAAAAAAGATGAGTAATAAATACAAACAAGAACAAAACAGAACACAGATTGTAAA
AAACAACAACAAATAAAGTAACCAAATAAAATGGCTGAATTATGCTGAGTACATTTACAACCCTG
GATTTCTATTTCTATCCCGCTGCTGATTTTGTTTATAGAGCGAAAGCATCAAATCCTTGATTACT
CATGCGCTTTGTTATTATTTGTCTGCCTTCATGAGACTAATCAAGTCAACAGTCTTCAAATCAAC
AAAGGGTACTAGACTAGAAGGGCGTCAACTAAGAATTCTTTGTTTTTCCTGGAGTCAACAAATGT
AAACCAAGCTGGAAGTGTACCAAGTAAA

130
APPENDIX E: CLUSTER-BUSTER OUTPUT FOR REGIONS 5, 6 AND 19
Fig. E.1. Cluster Buster output for regions 5 (panel A), 6 (panel B) and 19 (panel C).
Binding sites for Pax4, the significance of which is described in the text, are shown in
larger font than for the other transcription factors.
Note: This figure continues for several pages.
A >Cluster-buster output for region 5
Motif Position Strand Score Sequence MA0045 HMG-IY HMG 506 to 521 + 9.95 gttgaaaaggaaaaaa
MA0013 Broad-complex_4 ZN-FINGER, C2H2 507 to 517 + 6.44 ttgaaaaggaa
MA0045 HMG-IY HMG 507 to 522 + 7.28 ttgaaaaggaaaaaat
MA0010 Broad-complex_1 ZN-FINGER, C2H2 508 to 521 + 6.23 tgaaaaggaaaaaa
MA0120 ID1 ZN-FINGER, C2H2 508 to 519 - 8.95 ttttccttttca
MA0010 Broad-complex_1 ZN-FINGER, C2H2 509 to 522 + 6.25 gaaaaggaaaaaat
MA0028 ELK1 ETS 509 to 518 + 6.76 gaaaaggaaa
MA0050 IRF1 TRP-CLUSTER 509 to 520 + 6.57 gaaaaggaaaaa
MA0068 Pax4 PAIRED-HOMEO 509 to 538 + 6.42 gaaaaggaaaaaataggtttttagcgcgcc
MA0120 ID1 ZN-FINGER, C2H2 509 to 520 - 6.12 tttttccttttc
Ets 510 to 520 + 7.33 aaaaggaaaaa
MA0039 Klf4 ZN-FINGER, C2H2 510 to 519 + 6.56 aaaaggaaaa
MA0021 Dof3 ZN-FINGER, DOF 511 to 516 + 6.03 aaagga
MA0039 Klf4 ZN-FINGER, C2H2 511 to 520 + 6.26 aaaggaaaaa
MA0081 SPIB ETS 511 to 517 + 7.1 aaaggaa
MA0013 Broad-complex_4 ZN-FINGER, C2H2 512 to 522 + 6.04 aaggaaaaaat
MA0026 E74A ETS 512 to 518 + 6.23 aaggaaa
MA0049 Hunchback ZN-FINGER, C2H2 512 to 521 + 6.95 aaggaaaaaa
MA0098 c-ETS ETS 513 to 518 - 6.77 tttcct
MA0039 Klf4 ZN-FINGER, C2H2 516 to 525 + 6.69 aaaaaatagg
MA0011 Broad-complex_2 ZN-FINGER, C2H2 519 to 526 - 6.1 acctattt
E2F 528 to 539 + 6.18 tttagcgcgccg
MA0024 E2F1 Unknown 528 to 535 + 6.5 tttagcgc
E2F 530 to 541 - 6.14 cgcggcgcgcta
MA0123 ABI4 AP2 530 to 539 - 7.49 cggcgcgcta
MA0079 SP1 ZN-FINGER, C2H2 531 to 540 - 8.21 gcggcgcgct
MA0123 ABI4 AP2 532 to 541 - 6.37 cgcggcgcgc
MA0028 ELK1 ETS 542 to 551 - 6.9 gcgacggaaa
GATA 548 to 560 - 6.52 tcatgataagcga
MA0089 TCF11-MafG bZIP 556 to 561 + 7.31 catgac
MA0077 SOX9 HMG 567 to 575 - 8.18 aaacaatgg
MA0040 Foxq1 FORKHEAD 568 to 578 + 8.5 cattgtttatg
MA0030 FOXF2 FORKHEAD 569 to 582 - 8.05 cacacataaacaat
MA0084 SRY HMG 569 to 577 - 6.08 ataaacaat
MA0087 Sox5 HMG 569 to 575 - 6.34 aaacaat
MA0021 Dof3 ZN-FINGER, DOF 601 to 606 - 6.02 aaagtg
CCAAT 623 to 638 + 6.32 gttgaccaattacact
MA0060 NF-Y CAAT-BOX 623 to 638 + 6.57 gttgaccaattacact
MA0068 Pax4 PAIRED-HOMEO 626 to 655 + 6.02 gaccaattacactcaataatgacggcgcgc
MA0075 Prrx2 HOMEO 630 to 634 + 7 aatta
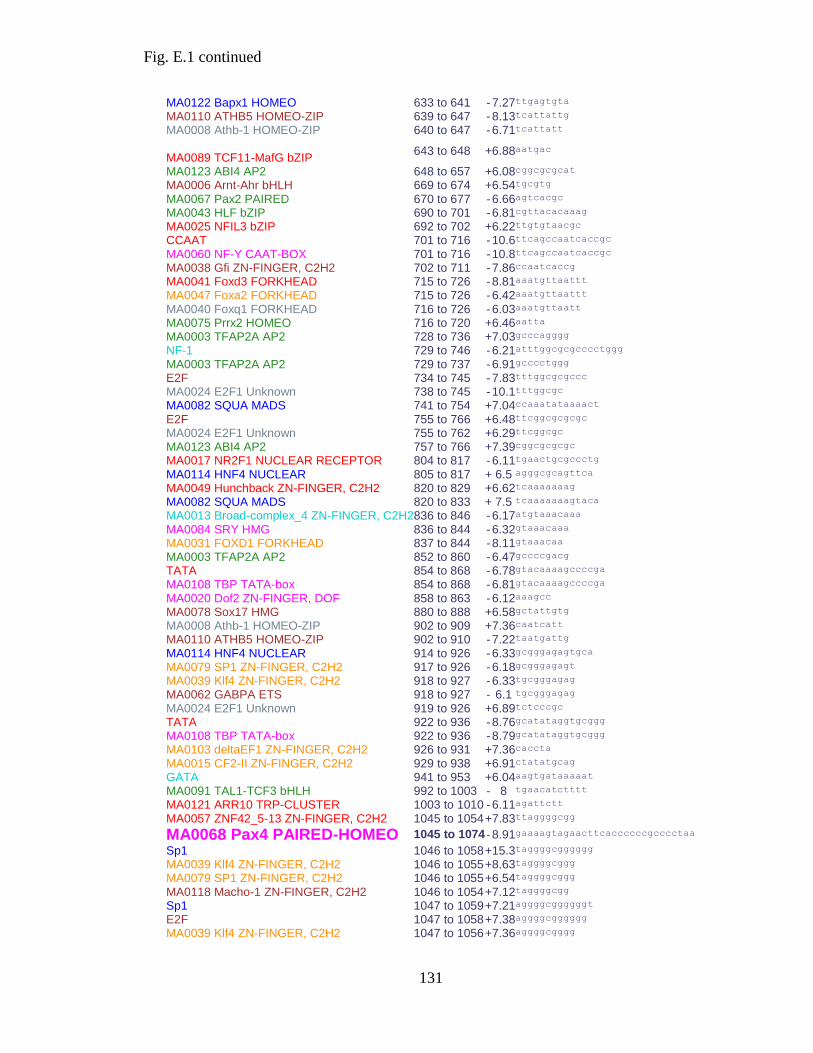
Fig. E.1 continued
131
MA0122 Bapx1 HOMEO 633 to 641 - 7.27 ttgagtgta
MA0110 ATHB5 HOMEO-ZIP 639 to 647 - 8.13 tcattattg
MA0008 Athb-1 HOMEO-ZIP 640 to 647 - 6.71 tcattatt
MA0089 TCF11-MafG bZIP
643 to 648 + 6.88 aatgac
MA0123 ABI4 AP2 648 to 657 + 6.08 cggcgcgcat
MA0006 Arnt-Ahr bHLH 669 to 674 + 6.54 tgcgtg
MA0067 Pax2 PAIRED 670 to 677 - 6.66 agtcacgc
MA0043 HLF bZIP 690 to 701 - 6.81 cgttacacaaag
MA0025 NFIL3 bZIP 692 to 702 + 6.22 ttgtgtaacgc
CCAAT 701 to 716 - 10.6 ttcagccaatcaccgc
MA0060 NF-Y CAAT-BOX 701 to 716 - 10.8 ttcagccaatcaccgc
MA0038 Gfi ZN-FINGER, C2H2 702 to 711 - 7.86 ccaatcaccg
MA0041 Foxd3 FORKHEAD 715 to 726 - 8.81 aaatgttaattt
MA0047 Foxa2 FORKHEAD 715 to 726 - 6.42 aaatgttaattt
MA0040 Foxq1 FORKHEAD 716 to 726 - 6.03 aaatgttaatt
MA0075 Prrx2 HOMEO 716 to 720 + 6.46 aatta
MA0003 TFAP2A AP2 728 to 736 + 7.03 gcccagggg
NF-1 729 to 746 - 6.21 atttggcgcgcccctggg
MA0003 TFAP2A AP2 729 to 737 - 6.91 gcccctggg
E2F 734 to 745 - 7.83 tttggcgcgccc
MA0024 E2F1 Unknown 738 to 745 - 10.1 tttggcgc
MA0082 SQUA MADS 741 to 754 + 7.04 ccaaatataaaact
E2F 755 to 766 + 6.48 ttcggcgcgcgc
MA0024 E2F1 Unknown 755 to 762 + 6.29 ttcggcgc
MA0123 ABI4 AP2 757 to 766 + 7.39 cggcgcgcgc
MA0017 NR2F1 NUCLEAR RECEPTOR 804 to 817 - 6.11 tgaactgcgccctg
MA0114 HNF4 NUCLEAR 805 to 817 + 6.5 agggcgcagttca
MA0049 Hunchback ZN-FINGER, C2H2 820 to 829 + 6.62 tcaaaaaaag
MA0082 SQUA MADS 820 to 833 + 7.5 tcaaaaaaagtaca
MA0013 Broad-complex_4 ZN-FINGER, C2H2 836 to 846 - 6.17 atgtaaacaaa
MA0084 SRY HMG 836 to 844 - 6.32 gtaaacaaa
MA0031 FOXD1 FORKHEAD 837 to 844 - 8.11 gtaaacaa
MA0003 TFAP2A AP2 852 to 860 - 6.47 gccccgacg
TATA 854 to 868 - 6.78 gtacaaaagccccga
MA0108 TBP TATA-box 854 to 868 - 6.81 gtacaaaagccccga
MA0020 Dof2 ZN-FINGER, DOF 858 to 863 - 6.12 aaagcc
MA0078 Sox17 HMG 880 to 888 + 6.58 gctattgtg
MA0008 Athb-1 HOMEO-ZIP 902 to 909 + 7.36 caatcatt
MA0110 ATHB5 HOMEO-ZIP 902 to 910 - 7.22 taatgattg
MA0114 HNF4 NUCLEAR 914 to 926 - 6.33 gcgggagagtgca
MA0079 SP1 ZN-FINGER, C2H2 917 to 926 - 6.18 gcgggagagt
MA0039 Klf4 ZN-FINGER, C2H2 918 to 927 - 6.33 tgcgggagag
MA0062 GABPA ETS 918 to 927 - 6.1 tgcgggagag
MA0024 E2F1 Unknown 919 to 926 + 6.89 tctcccgc
TATA 922 to 936 - 8.76 gcatataggtgcggg
MA0108 TBP TATA-box 922 to 936 - 8.79 gcatataggtgcggg
MA0103 deltaEF1 ZN-FINGER, C2H2 926 to 931 + 7.36 caccta
MA0015 CF2-II ZN-FINGER, C2H2 929 to 938 + 6.91 ctatatgcag
GATA 941 to 953 + 6.04 aagtgataaaaat
MA0091 TAL1-TCF3 bHLH 992 to 1003 - 8 tgaacatctttt
MA0121 ARR10 TRP-CLUSTER 1003 to 1010 - 6.11 agattctt
MA0057 ZNF42_5-13 ZN-FINGER, C2H2 1045 to 1054 + 7.83 ttaggggcgg
MA0068 Pax4 PAIRED-HOMEO 1045 to 1074 - 8.91 gaaaagtagaacttcaccccccgcccctaa
Sp1 1046 to 1058 + 15.3 taggggcgggggg
MA0039 Klf4 ZN-FINGER, C2H2 1046 to 1055 + 8.63 taggggcggg
MA0079 SP1 ZN-FINGER, C2H2 1046 to 1055 + 6.54 taggggcggg
MA0118 Macho-1 ZN-FINGER, C2H2 1046 to 1054 + 7.12 taggggcgg
Sp1 1047 to 1059 + 7.21 aggggcggggggt
E2F 1047 to 1058 + 7.38 aggggcgggggg
MA0039 Klf4 ZN-FINGER, C2H2 1047 to 1056 + 7.36 aggggcgggg
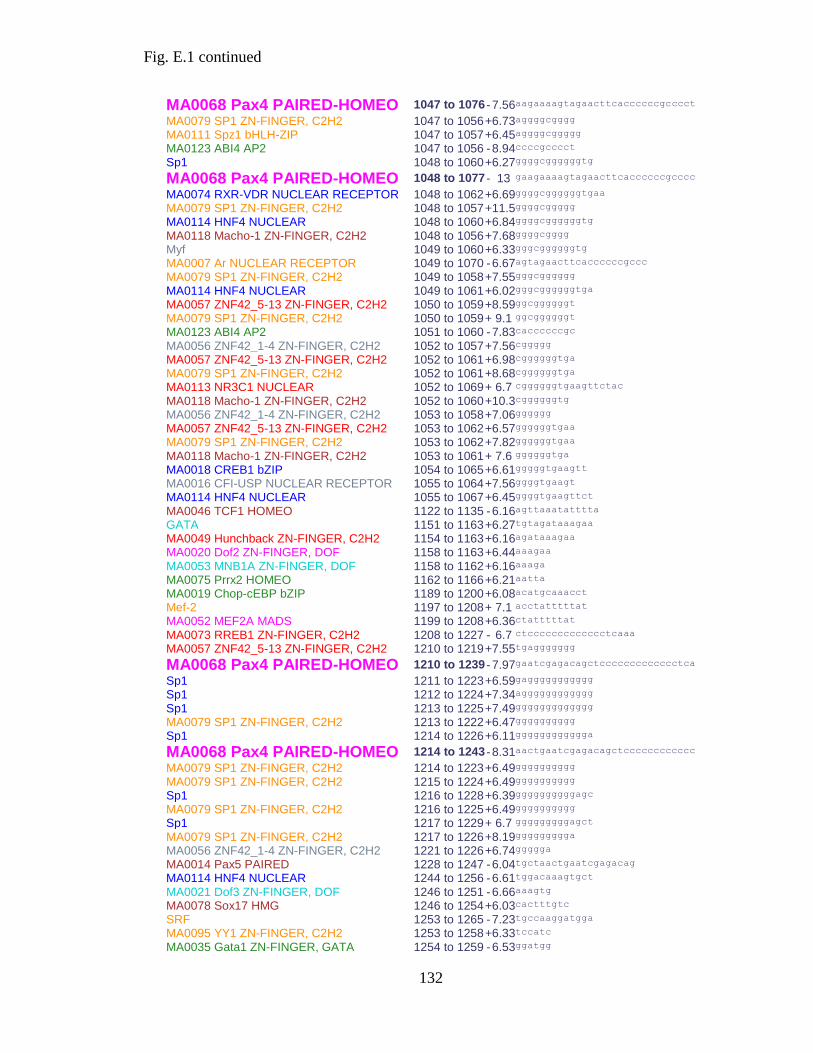
Fig. E.1 continued
132
MA0068 Pax4 PAIRED-HOMEO 1047 to 1076 - 7.56 aagaaaagtagaacttcaccccccgcccct
MA0079 SP1 ZN-FINGER, C2H2 1047 to 1056 + 6.73 aggggcgggg
MA0111 Spz1 bHLH-ZIP 1047 to 1057 + 6.45 aggggcggggg
MA0123 ABI4 AP2 1047 to 1056 - 8.94 ccccgcccct
Sp1 1048 to 1060 + 6.27 ggggcggggggtg
MA0068 Pax4 PAIRED-HOMEO 1048 to 1077 - 13 gaagaaaagtagaacttcaccccccgcccc
MA0074 RXR-VDR NUCLEAR RECEPTOR 1048 to 1062 + 6.69 ggggcggggggtgaa
MA0079 SP1 ZN-FINGER, C2H2 1048 to 1057 + 11.5 ggggcggggg
MA0114 HNF4 NUCLEAR 1048 to 1060 + 6.84 ggggcggggggtg
MA0118 Macho-1 ZN-FINGER, C2H2 1048 to 1056 + 7.68 ggggcgggg
Myf 1049 to 1060 + 6.33 gggcggggggtg
MA0007 Ar NUCLEAR RECEPTOR 1049 to 1070 - 6.67 agtagaacttcaccccccgccc
MA0079 SP1 ZN-FINGER, C2H2 1049 to 1058 + 7.55 gggcgggggg
MA0114 HNF4 NUCLEAR 1049 to 1061 + 6.02 gggcggggggtga
MA0057 ZNF42_5-13 ZN-FINGER, C2H2 1050 to 1059 + 8.59 ggcggggggt
MA0079 SP1 ZN-FINGER, C2H2 1050 to 1059 + 9.1 ggcggggggt
MA0123 ABI4 AP2 1051 to 1060 - 7.83 caccccccgc
MA0056 ZNF42_1-4 ZN-FINGER, C2H2 1052 to 1057 + 7.56 cggggg
MA0057 ZNF42_5-13 ZN-FINGER, C2H2 1052 to 1061 + 6.98 cggggggtga
MA0079 SP1 ZN-FINGER, C2H2 1052 to 1061 + 8.68 cggggggtga
MA0113 NR3C1 NUCLEAR 1052 to 1069 + 6.7 cggggggtgaagttctac
MA0118 Macho-1 ZN-FINGER, C2H2 1052 to 1060 + 10.3 cggggggtg
MA0056 ZNF42_1-4 ZN-FINGER, C2H2 1053 to 1058 + 7.06 gggggg
MA0057 ZNF42_5-13 ZN-FINGER, C2H2 1053 to 1062 + 6.57 ggggggtgaa
MA0079 SP1 ZN-FINGER, C2H2 1053 to 1062 + 7.82 ggggggtgaa
MA0118 Macho-1 ZN-FINGER, C2H2 1053 to 1061 + 7.6 ggggggtga
MA0018 CREB1 bZIP 1054 to 1065 + 6.61 gggggtgaagtt
MA0016 CFI-USP NUCLEAR RECEPTOR 1055 to 1064 + 7.56 ggggtgaagt
MA0114 HNF4 NUCLEAR 1055 to 1067 + 6.45 ggggtgaagttct
MA0046 TCF1 HOMEO 1122 to 1135 - 6.16 agttaaatatttta
GATA 1151 to 1163 + 6.27 tgtagataaagaa
MA0049 Hunchback ZN-FINGER, C2H2 1154 to 1163 + 6.16 agataaagaa
MA0020 Dof2 ZN-FINGER, DOF 1158 to 1163 + 6.44 aaagaa
MA0053 MNB1A ZN-FINGER, DOF 1158 to 1162 + 6.16 aaaga
MA0075 Prrx2 HOMEO 1162 to 1166 + 6.21 aatta
MA0019 Chop-cEBP bZIP 1189 to 1200 + 6.08 acatgcaaacct
Mef-2 1197 to 1208 + 7.1 acctatttttat
MA0052 MEF2A MADS 1199 to 1208 + 6.36 ctatttttat
MA0073 RREB1 ZN-FINGER, C2H2 1208 to 1227 - 6.7 ctccccccccccccctcaaa
MA0057 ZNF42_5-13 ZN-FINGER, C2H2 1210 to 1219 + 7.55 tgaggggggg
MA0068 Pax4 PAIRED-HOMEO 1210 to 1239 - 7.97 gaatcgagacagctccccccccccccctca
Sp1 1211 to 1223 + 6.59 gaggggggggggg
Sp1 1212 to 1224 + 7.34 agggggggggggg
Sp1 1213 to 1225 + 7.49 ggggggggggggg
MA0079 SP1 ZN-FINGER, C2H2 1213 to 1222 + 6.47 gggggggggg
Sp1 1214 to 1226 + 6.11 gggggggggggga
MA0068 Pax4 PAIRED-HOMEO 1214 to 1243 - 8.31 aactgaatcgagacagctcccccccccccc
MA0079 SP1 ZN-FINGER, C2H2 1214 to 1223 + 6.49 gggggggggg
MA0079 SP1 ZN-FINGER, C2H2 1215 to 1224 + 6.49 gggggggggg
Sp1 1216 to 1228 + 6.39 ggggggggggagc
MA0079 SP1 ZN-FINGER, C2H2 1216 to 1225 + 6.49 gggggggggg
Sp1 1217 to 1229 + 6.7 gggggggggagct
MA0079 SP1 ZN-FINGER, C2H2 1217 to 1226 + 8.19 ggggggggga
MA0056 ZNF42_1-4 ZN-FINGER, C2H2 1221 to 1226 + 6.74 ggggga
MA0014 Pax5 PAIRED 1228 to 1247 - 6.04 tgctaactgaatcgagacag
MA0114 HNF4 NUCLEAR 1244 to 1256 - 6.61 tggacaaagtgct
MA0021 Dof3 ZN-FINGER, DOF 1246 to 1251 - 6.66 aaagtg
MA0078 Sox17 HMG 1246 to 1254 + 6.03 cactttgtc
SRF 1253 to 1265 - 7.23 tgccaaggatgga
MA0095 YY1 ZN-FINGER, C2H2 1253 to 1258 + 6.33 tccatc
MA0035 Gata1 ZN-FINGER, GATA 1254 to 1259 - 6.53 ggatgg
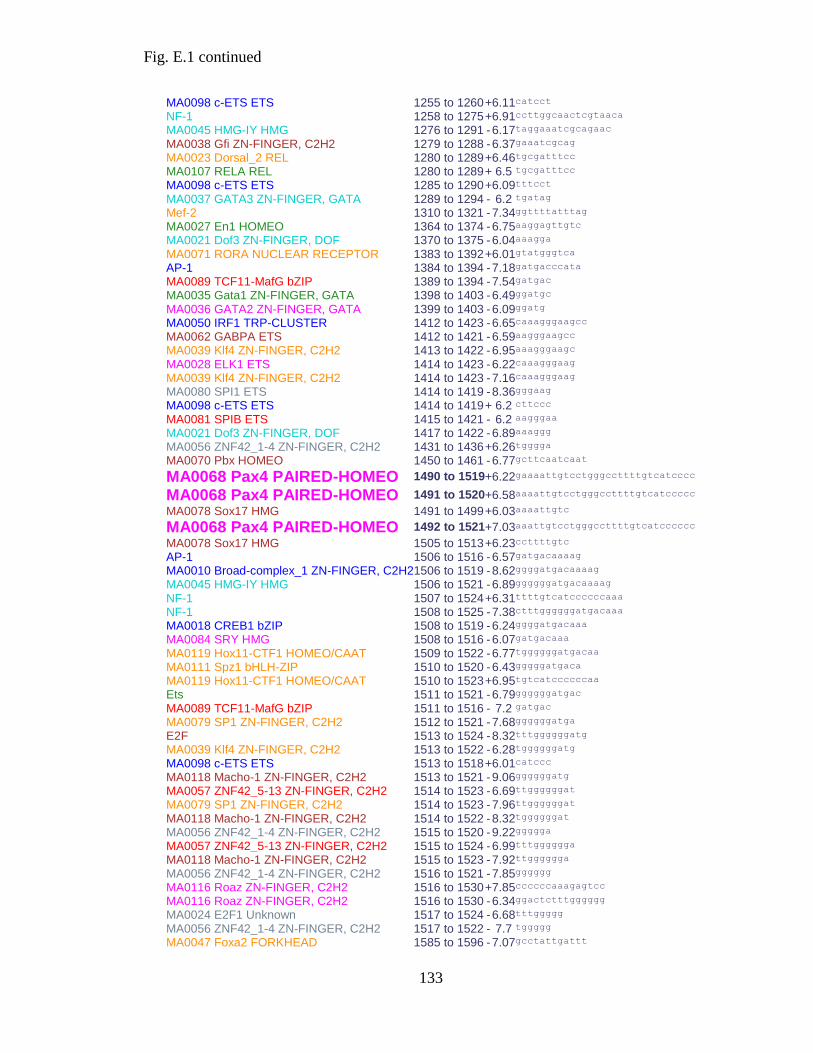
Fig. E.1 continued
133
MA0098 c-ETS ETS 1255 to 1260 + 6.11 catcct
NF-1 1258 to 1275 + 6.91 ccttggcaactcgtaaca
MA0045 HMG-IY HMG 1276 to 1291 - 6.17 taggaaatcgcagaac
MA0038 Gfi ZN-FINGER, C2H2 1279 to 1288 - 6.37 gaaatcgcag
MA0023 Dorsal_2 REL 1280 to 1289 + 6.46 tgcgatttcc
MA0107 RELA REL 1280 to 1289 + 6.5 tgcgatttcc
MA0098 c-ETS ETS 1285 to 1290 + 6.09 tttcct
MA0037 GATA3 ZN-FINGER, GATA 1289 to 1294 - 6.2 tgatag
Mef-2 1310 to 1321 - 7.34 ggttttatttag
MA0027 En1 HOMEO 1364 to 1374 - 6.75 aaggagttgtc
MA0021 Dof3 ZN-FINGER, DOF 1370 to 1375 - 6.04 aaagga
MA0071 RORA NUCLEAR RECEPTOR 1383 to 1392 + 6.01 gtatgggtca
AP-1 1384 to 1394 - 7.18 gatgacccata
MA0089 TCF11-MafG bZIP 1389 to 1394 - 7.54 gatgac
MA0035 Gata1 ZN-FINGER, GATA 1398 to 1403 - 6.49 ggatgc
MA0036 GATA2 ZN-FINGER, GATA 1399 to 1403 - 6.09 ggatg
MA0050 IRF1 TRP-CLUSTER 1412 to 1423 - 6.65 caaagggaagcc
MA0062 GABPA ETS 1412 to 1421 - 6.59 aagggaagcc
MA0039 Klf4 ZN-FINGER, C2H2 1413 to 1422 - 6.95 aaagggaagc
MA0028 ELK1 ETS 1414 to 1423 - 6.22 caaagggaag
MA0039 Klf4 ZN-FINGER, C2H2 1414 to 1423 - 7.16 caaagggaag
MA0080 SPI1 ETS 1414 to 1419 - 8.36 gggaag
MA0098 c-ETS ETS 1414 to 1419 + 6.2 cttccc
MA0081 SPIB ETS 1415 to 1421 - 6.2 aagggaa
MA0021 Dof3 ZN-FINGER, DOF 1417 to 1422 - 6.89 aaaggg
MA0056 ZNF42_1-4 ZN-FINGER, C2H2 1431 to 1436 + 6.26 tgggga
MA0070 Pbx HOMEO 1450 to 1461 - 6.77 gcttcaatcaat
MA0068 Pax4 PAIRED-HOMEO 1490 to 1519 + 6.22 gaaaattgtcctgggccttttgtcatcccc
MA0068 Pax4 PAIRED-HOMEO 1491 to 1520 + 6.58 aaaattgtcctgggccttttgtcatccccc
MA0078 Sox17 HMG 1491 to 1499 + 6.03 aaaattgtc
MA0068 Pax4 PAIRED-HOMEO 1492 to 1521 + 7.03 aaattgtcctgggccttttgtcatcccccc
MA0078 Sox17 HMG 1505 to 1513 + 6.23 ccttttgtc
AP-1 1506 to 1516 - 6.57 gatgacaaaag
MA0010 Broad-complex_1 ZN-FINGER, C2H2 1506 to 1519 - 8.62 ggggatgacaaaag
MA0045 HMG-IY HMG 1506 to 1521 - 6.89 ggggggatgacaaaag
NF-1 1507 to 1524 + 6.31 ttttgtcatccccccaaa
NF-1 1508 to 1525 - 7.38 ctttggggggatgacaaa
MA0018 CREB1 bZIP 1508 to 1519 - 6.24 ggggatgacaaa
MA0084 SRY HMG 1508 to 1516 - 6.07 gatgacaaa
MA0119 Hox11-CTF1 HOMEO/CAAT 1509 to 1522 - 6.77 tggggggatgacaa
MA0111 Spz1 bHLH-ZIP 1510 to 1520 - 6.43 gggggatgaca
MA0119 Hox11-CTF1 HOMEO/CAAT 1510 to 1523 + 6.95 tgtcatccccccaa
Ets 1511 to 1521 - 6.79 ggggggatgac
MA0089 TCF11-MafG bZIP 1511 to 1516 - 7.2 gatgac
MA0079 SP1 ZN-FINGER, C2H2 1512 to 1521 - 7.68 ggggggatga
E2F 1513 to 1524 - 8.32 tttggggggatg
MA0039 Klf4 ZN-FINGER, C2H2 1513 to 1522 - 6.28 tggggggatg
MA0098 c-ETS ETS 1513 to 1518 + 6.01 catccc
MA0118 Macho-1 ZN-FINGER, C2H2 1513 to 1521 - 9.06 ggggggatg
MA0057 ZNF42_5-13 ZN-FINGER, C2H2 1514 to 1523 - 6.69 ttggggggat
MA0079 SP1 ZN-FINGER, C2H2 1514 to 1523 - 7.96 ttggggggat
MA0118 Macho-1 ZN-FINGER, C2H2 1514 to 1522 - 8.32 tggggggat
MA0056 ZNF42_1-4 ZN-FINGER, C2H2 1515 to 1520 - 9.22 ggggga
MA0057 ZNF42_5-13 ZN-FINGER, C2H2 1515 to 1524 - 6.99 tttgggggga
MA0118 Macho-1 ZN-FINGER, C2H2 1515 to 1523 - 7.92 ttgggggga
MA0056 ZNF42_1-4 ZN-FINGER, C2H2 1516 to 1521 - 7.85 gggggg
MA0116 Roaz ZN-FINGER, C2H2 1516 to 1530 + 7.85 ccccccaaagagtcc
MA0116 Roaz ZN-FINGER, C2H2 1516 to 1530 - 6.34 ggactctttgggggg
MA0024 E2F1 Unknown 1517 to 1524 - 6.68 tttggggg
MA0056 ZNF42_1-4 ZN-FINGER, C2H2 1517 to 1522 - 7.7 tggggg
MA0047 Foxa2 FORKHEAD 1585 to 1596 - 7.07 gcctattgattt

Fig. E.1 continued
134
MA0077 SOX9 HMG 1586 to 1594 + 6.82 aatcaatag
MA0056 ZNF42_1-4 ZN-FINGER, C2H2 1601 to 1606 + 6.29 tgggga
Mef-2 1646 to 1657 + 7.06 gggtattttaat
Tef 1667 to 1678 + 9.99 cacattccttcg
MA0090 TEAD TEA 1667 to 1678 + 10.1 cacattccttcg
MA0045 HMG-IY HMG 1677 to 1692 + 6.72 cgtcgaaggggaacat
MA0066 PPARG NUCLEAR RECEPTOR 1680 to 1699 - 6.07 ccaggtcatgttccccttcg
MA0120 ID1 ZN-FINGER, C2H2 1680 to 1691 - 6.07 tgttccccttcg
MA0057 ZNF42_5-13 ZN-FINGER, C2H2 1681 to 1690 + 6.4 gaaggggaac
MA0066 PPARG NUCLEAR RECEPTOR 1681 to 1700 + 7.97 gaaggggaacatgacctggt
MA0112 ESR1 NUCLEAR 1681 to 1698 + 6.92 gaaggggaacatgacctg
MA0113 NR3C1 NUCLEAR 1682 to 1699 + 6.92 aaggggaacatgacctgg
ERE 1683 to 1696 + 8.14 aggggaacatgacc
MA0056 ZNF42_1-4 ZN-FINGER, C2H2 1683 to 1688 + 6.44 agggga
MA0081 SPIB ETS 1683 to 1689 + 6.84 aggggaa
MA0111 Spz1 bHLH-ZIP 1683 to 1693 + 6.93 aggggaacatg
ERE 1684 to 1697 - 6.66 aggtcatgttcccc
MA0080 SPI1 ETS 1685 to 1690 + 6.34 gggaac
MA0106 TP53 P53 1685 to 1704 + 11 gggaacatgacctggtatgt
MA0089 TCF11-MafG bZIP 1690 to 1695 + 6.77 catgac
MA0071 RORA NUCLEAR RECEPTOR 1692 to 1701 - 8.31 taccaggtca
MA0092 HAND1-TCF3 bHLH 1693 to 1702 + 6.23 gacctggtat
Tef 1694 to 1705 - 6.97 cacataccaggt
MA0090 TEAD TEA 1694 to 1705 - 6.89 cacataccaggt

Fig. E.1 continued
135
B >Cluster-buster output for region 6
Motif Position Strand Score Sequence MA0073 RREB1 ZN-FINGER, C2H2 2039 to 2058 - 13.4 acccacaacacccccccccc
MA0079 SP1 ZN-FINGER, C2H2 2040 to 2049 + 7.67 gggggggggt
MA0079 SP1 ZN-FINGER, C2H2 2042 to 2051 + 6.26 gggggggtgt
ERE 2082 to 2095 + 6.59 tatacaccatgccc
MA0074 RXR-VDR NUCLEAR RECEPTOR 2082 to 2096 - 8.16 agggcatggtgtata
MA0017 NR2F1 NUCLEAR RECEPTOR 2084 to 2097 + 6.33 tacaccatgccctt
MA0114 HNF4 NUCLEAR 2084 to 2096 - 8.18 agggcatggtgta
Sp1 2086 to 2098 - 7.05 aaagggcatggtg
MA0078 Sox17 HMG 2086 to 2094 - 6.67 ggcatggtg
MA0111 Spz1 bHLH-ZIP 2086 to 2096 - 6.78 agggcatggtg
MA0079 SP1 ZN-FINGER, C2H2 2087 to 2096 - 10.3 agggcatggt
MA0095 YY1 ZN-FINGER, C2H2 2087 to 2092 + 6.64 accatg
MA0039 Klf4 ZN-FINGER, C2H2 2088 to 2097 - 6.93 aagggcatgg
MA0021 Dof3 ZN-FINGER, DOF 2093 to 2098 - 7.05 aaaggg

Fig. E.1 continued
136
C >Cluster-buster output for region 19
Motif Position Strand Score Sequence MA0022 Dorsal_1 REL 2692 to 2703 - 9.67 tggggtttcccc
MA0061 NF-kappaB REL 2692 to 2701 + 6.67 ggggaaaccc
MA0105 NFKB1 REL 2692 to 2702 + 9.39 ggggaaacccc
MA0105 NFKB1 REL 2692 to 2702 - 10.1 ggggtttcccc
MA0023 Dorsal_2 REL 2693 to 2702 - 9.95 ggggtttccc
MA0061 NF-kappaB REL 2693 to 2702 + 8.09 gggaaacccc
MA0061 NF-kappaB REL 2693 to 2702 - 10.1 ggggtttccc
MA0101 REL 2693 to 2702 - 6.41 ggggtttccc
MA0105 NFKB1 REL 2693 to 2703 + 7.52 gggaaacccca
MA0105 NFKB1 REL 2693 to 2703 - 7.98 tggggtttccc
MA0107 RELA REL 2693 to 2702 - 8.06 ggggtttccc
MA0023 Dorsal_2 REL 2694 to 2703 - 7.43 tggggtttcc
MA0101 REL 2694 to 2703 - 9.28 tggggtttcc
MA0107 RELA REL 2694 to 2703 - 9.75 tggggtttcc
MA0095 YY1 ZN-FINGER, C2H2 2722 to 2727 - 6.6 gccatc
MA0092 HAND1-TCF3 bHLH 2733 to 2742 + 6.17 tggctggctt
MA0020 Dof2 ZN-FINGER, DOF 2738 to 2743 - 6.39 aaagcc
MA0021 Dof3 ZN-FINGER, DOF 2738 to 2743 - 6.06 aaagcc
Ets 2751 to 2761 - 7.25 ttcaggaaatg
MA0026 E74A ETS 2753 to 2759 - 6.52 caggaaa
MA0081 SPIB ETS 2754 to 2760 - 6.44 tcaggaa
MA0044 HMG-1 HMG 2770 to 2778 + 6.56 gttgtgatc
NF-1 2772 to 2789 - 7.11 ttttggccgaggatcaca
SRF 2782 to 2794 + 6.35 ggccaaaaatgac
MA0051 IRF2 TRP-CLUSTER 2801 to 2818 - 6.58 gcaaggcgaaacgatgaa
MA0004 Arnt bHLH 2819 to 2824 + 6.42 aacgtg
MA0029 Evi1 ZN-FINGER, C2H2 2830 to 2843 + 10.8 gagaaaagataaaa
GATA 2833 to 2845 + 6.12 aaaagataaaaaa
MA0010 Broad-complex_1 ZN-FINGER, C2H2 2838 to 2851 + 9.46 ataaaaaacaagtg
MA0044 HMG-1 HMG 2841 to 2849 - 6.14 cttgttttt
MA0012 Broad-complex_3 ZN-FINGER, C2H2 2842 to 2852 + 6.14 aaaacaagtgg
MA0016 CFI-USP NUCLEAR RECEPTOR 2849 to 2858 + 6.8 gtggtcacca
MA0110 ATHB5 HOMEO-ZIP 2867 to 2875 + 6.06 cgatgattg
MA0051 IRF2 TRP-CLUSTER 2879 to 2896 - 6.74 agaaatcgaaagtctcac
MA0050 IRF1 TRP-CLUSTER 2884 to 2895 - 9.2 gaaatcgaaagt
MA0082 SQUA MADS 2885 to 2898 - 7.14 acagaaatcgaaag
MA0076 ELK4 ETS 2908 to 2916 + 6.37 actggaagt
MA0058 MAX bHLH-ZIP 2918 to 2927 - 9.35 aatcacgtga
MA0093 USF1 bHLH-ZIP 2918 to 2924 - 8.49 cacgtga
MA0004 Arnt bHLH 2919 to 2924 + 8.17 cacgtg
MA0004 Arnt bHLH 2919 to 2924 - 8.17 cacgtg
MA0093 USF1 bHLH-ZIP 2919 to 2925 + 8.36 cacgtga
MA0104 Mycn bHLH-ZIP 2919 to 2924 + 8.25 cacgtg
MA0104 Mycn bHLH-ZIP 2919 to 2924 - 8.25 cacgtg
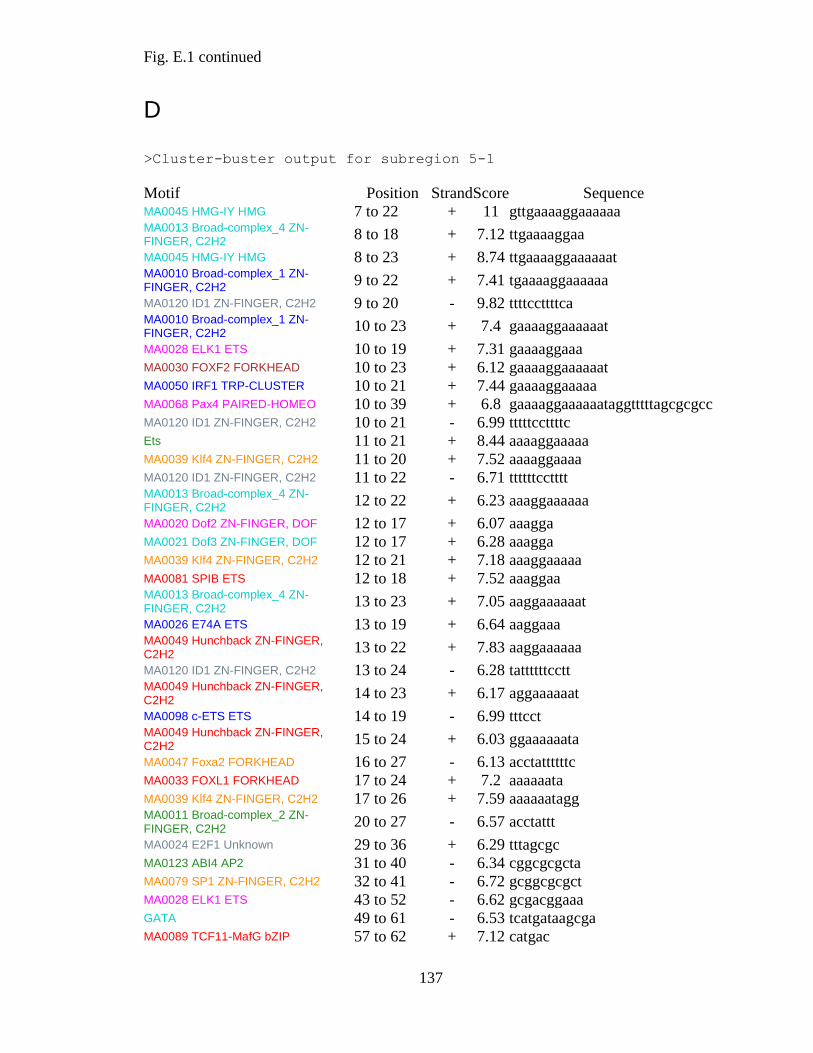
Fig. E.1 continued
137
D
>Cluster-buster output for subregion 5-1
Motif Position Strand Score Sequence MA0045 HMG-IY HMG 7 to 22 + 11 gttgaaaaggaaaaaa MA0013 Broad-complex_4 ZN-FINGER, C2H2
8 to 18 + 7.12 ttgaaaaggaa
MA0045 HMG-IY HMG 8 to 23 + 8.74 ttgaaaaggaaaaaat MA0010 Broad-complex_1 ZN-FINGER, C2H2
9 to 22 + 7.41 tgaaaaggaaaaaa
MA0120 ID1 ZN-FINGER, C2H2 9 to 20 - 9.82 ttttccttttca MA0010 Broad-complex_1 ZN-FINGER, C2H2
10 to 23 + 7.4 gaaaaggaaaaaat
MA0028 ELK1 ETS 10 to 19 + 7.31 gaaaaggaaa MA0030 FOXF2 FORKHEAD 10 to 23 + 6.12 gaaaaggaaaaaat MA0050 IRF1 TRP-CLUSTER 10 to 21 + 7.44 gaaaaggaaaaa MA0068 Pax4 PAIRED-HOMEO 10 to 39 + 6.8 gaaaaggaaaaaataggtttttagcgcgcc MA0120 ID1 ZN-FINGER, C2H2 10 to 21 - 6.99 tttttccttttc Ets 11 to 21 + 8.44 aaaaggaaaaa MA0039 Klf4 ZN-FINGER, C2H2 11 to 20 + 7.52 aaaaggaaaa MA0120 ID1 ZN-FINGER, C2H2 11 to 22 - 6.71 ttttttcctttt MA0013 Broad-complex_4 ZN-FINGER, C2H2
12 to 22 + 6.23 aaaggaaaaaa
MA0020 Dof2 ZN-FINGER, DOF 12 to 17 + 6.07 aaagga MA0021 Dof3 ZN-FINGER, DOF 12 to 17 + 6.28 aaagga MA0039 Klf4 ZN-FINGER, C2H2 12 to 21 + 7.18 aaaggaaaaa MA0081 SPIB ETS 12 to 18 + 7.52 aaaggaa MA0013 Broad-complex_4 ZN-FINGER, C2H2
13 to 23 + 7.05 aaggaaaaaat
MA0026 E74A ETS 13 to 19 + 6.64 aaggaaa MA0049 Hunchback ZN-FINGER, C2H2
13 to 22 + 7.83 aaggaaaaaa
MA0120 ID1 ZN-FINGER, C2H2 13 to 24 - 6.28 tattttttcctt MA0049 Hunchback ZN-FINGER, C2H2
14 to 23 + 6.17 aggaaaaaat
MA0098 c-ETS ETS 14 to 19 - 6.99 tttcct MA0049 Hunchback ZN-FINGER, C2H2
15 to 24 + 6.03 ggaaaaaata
MA0047 Foxa2 FORKHEAD 16 to 27 - 6.13 acctattttttc MA0033 FOXL1 FORKHEAD 17 to 24 + 7.2 aaaaaata MA0039 Klf4 ZN-FINGER, C2H2 17 to 26 + 7.59 aaaaaatagg MA0011 Broad-complex_2 ZN-FINGER, C2H2
20 to 27 - 6.57 acctattt
MA0024 E2F1 Unknown 29 to 36 + 6.29 tttagcgc MA0123 ABI4 AP2 31 to 40 - 6.34 cggcgcgcta MA0079 SP1 ZN-FINGER, C2H2 32 to 41 - 6.72 gcggcgcgct MA0028 ELK1 ETS 43 to 52 - 6.62 gcgacggaaa GATA 49 to 61 - 6.53 tcatgataagcga MA0089 TCF11-MafG bZIP 57 to 62 + 7.12 catgac

Fig. E.1 continued
138
MA0077 SOX9 HMG 68 to 76 - 8.25 aaacaatgg MA0040 Foxq1 FORKHEAD 69 to 79 + 8.68 cattgtttatg MA0030 FOXF2 FORKHEAD 70 to 83 - 8.31 cacacataaacaat MA0084 SRY HMG 70 to 78 - 6.38 ataaacaat MA0087 Sox5 HMG 70 to 76 - 6.58 aaacaat MA0021 Dof3 ZN-FINGER, DOF 102 to 107 - 6.02 aaagtg CCAAT 124 to 139 + 6.32 gttgaccaattacact MA0060 NF-Y CAAT-BOX 124 to 139 + 6.57 gttgaccaattacact MA0068 Pax4 PAIRED-HOMEO 127 to 156 + 6.02 gaccaattacactcaataatgacggcgcgc MA0075 Prrx2 HOMEO 131 to 135 + 7 aatta MA0122 Bapx1 HOMEO 134 to 142 - 7.27 ttgagtgta MA0110 ATHB5 HOMEO-ZIP 140 to 148 - 8.13 tcattattg MA0008 Athb-1 HOMEO-ZIP 141 to 148 - 6.71 tcattatt MA0089 TCF11-MafG bZIP 144 to 149 + 6.88 aatgac MA0123 ABI4 AP2 149 to 158 + 6.08 cggcgcgcat MA0006 Arnt-Ahr bHLH 170 to 175 + 6.54 tgcgtg MA0067 Pax2 PAIRED 171 to 178 - 6.66 agtcacgc MA0043 HLF bZIP 191 to 202 - 6.81 cgttacacaaag MA0025 NFIL3 bZIP 193 to 203 + 6.22 ttgtgtaacgc CCAAT 202 to 217 - 10.6 ttcagccaatcaccgc MA0060 NF-Y CAAT-BOX 202 to 217 - 10.8 ttcagccaatcaccgc MA0038 Gfi ZN-FINGER, C2H2 203 to 212 - 7.86 ccaatcaccg MA0041 Foxd3 FORKHEAD 216 to 227 - 8.81 aaatgttaattt MA0047 Foxa2 FORKHEAD 216 to 227 - 6.42 aaatgttaattt MA0040 Foxq1 FORKHEAD 217 to 227 - 6.03 aaatgttaatt MA0075 Prrx2 HOMEO 217 to 221 + 6.46 aatta MA0003 TFAP2A AP2 229 to 237 + 7.03 gcccagggg NF-1 230 to 247 - 6.21 atttggcgcgcccctggg MA0003 TFAP2A AP2 230 to 238 - 6.91 gcccctggg E2F 235 to 246 - 7.83 tttggcgcgccc MA0024 E2F1 Unknown 239 to 246 - 10.1 tttggcgc MA0082 SQUA MADS 242 to 255 + 7.04 ccaaatataaaact E2F 256 to 267 + 6.48 ttcggcgcgcgc MA0024 E2F1 Unknown 256 to 263 + 6.29 ttcggcgc MA0123 ABI4 AP2 258 to 267 + 7.39 cggcgcgcgc MA0017 NR2F1 NUCLEAR RECEPTOR
305 to 318 - 6.11 tgaactgcgccctg
MA0114 HNF4 NUCLEAR 306 to 318 + 6.5 agggcgcagttca MA0049 Hunchback ZN-FINGER, C2H2
321 to 330 + 6.62 tcaaaaaaag
MA0082 SQUA MADS 321 to 334 + 7.5 tcaaaaaaagtaca MA0013 Broad-complex_4 ZN-FINGER, C2H2
337 to 347 - 6.17 atgtaaacaaa
MA0084 SRY HMG 337 to 345 - 6.32 gtaaacaaa MA0031 FOXD1 FORKHEAD 338 to 345 - 8.11 gtaaacaa MA0003 TFAP2A AP2 353 to 361 - 6.47 gccccgacg TATA 355 to 369 - 6.78 gtacaaaagccccga MA0108 TBP TATA-box 355 to 369 - 6.81 gtacaaaagccccga

Fig. E.1 continued
139
MA0020 Dof2 ZN-FINGER, DOF 359 to 364 - 6.12 aaagcc MA0078 Sox17 HMG 381 to 389 + 6.58 gctattgtg MA0008 Athb-1 HOMEO-ZIP 403 to 410 + 7.36 caatcatt MA0110 ATHB5 HOMEO-ZIP 403 to 411 - 7.22 taatgattg MA0114 HNF4 NUCLEAR 415 to 427 - 6.33 gcgggagagtgca MA0079 SP1 ZN-FINGER, C2H2 418 to 427 - 6.18 gcgggagagt MA0039 Klf4 ZN-FINGER, C2H2 419 to 428 - 6.33 tgcgggagag MA0062 GABPA ETS 419 to 428 - 6.1 tgcgggagag MA0024 E2F1 Unknown 420 to 427 + 6.89 tctcccgc TATA 423 to 437 - 8.76 gcatataggtgcggg MA0108 TBP TATA-box 423 to 437 - 8.79 gcatataggtgcggg MA0103 deltaEF1 ZN-FINGER, C2H2 427 to 432 + 7.36 caccta MA0015 CF2-II ZN-FINGER, C2H2 430 to 439 + 6.91 ctatatgcag GATA 442 to 454 + 6.04 aagtgataaaaat MA0091 TAL1-TCF3 bHLH 493 to 504 - 8 tgaacatctttt MA0121 ARR10 TRP-CLUSTER 504 to 511 - 6.11 agattctt MA0057 ZNF42_5-13 ZN-FINGER, C2H2
546 to 555 + 7.83 ttaggggcgg
MA0068 Pax4 PAIRED-HOMEO 546 to 575 - 8.91 gaaaagtagaacttcaccccccgcccctaa Sp1 547 to 559 + 15.3 taggggcgggggg MA0039 Klf4 ZN-FINGER, C2H2 547 to 556 + 8.63 taggggcggg MA0079 SP1 ZN-FINGER, C2H2 547 to 556 + 6.54 taggggcggg MA0118 Macho-1 ZN-FINGER, C2H2 547 to 555 + 7.12 taggggcgg Sp1 548 to 560 + 7.21 aggggcggggggt E2F 548 to 559 + 7.38 aggggcgggggg MA0039 Klf4 ZN-FINGER, C2H2 548 to 557 + 7.36 aggggcgggg MA0068 Pax4 PAIRED-HOMEO 548 to 577 - 7.56 aagaaaagtagaacttcaccccccgcccct MA0079 SP1 ZN-FINGER, C2H2 548 to 557 + 6.73 aggggcgggg MA0111 Spz1 bHLH-ZIP 548 to 558 + 6.45 aggggcggggg MA0123 ABI4 AP2 548 to 557 - 8.94 ccccgcccct Sp1 549 to 561 + 6.27 ggggcggggggtg MA0068 Pax4 PAIRED-HOMEO 549 to 578 - 13 gaagaaaagtagaacttcaccccccgcccc MA0074 RXR-VDR NUCLEAR RECEPTOR
549 to 563 + 6.69 ggggcggggggtgaa
MA0079 SP1 ZN-FINGER, C2H2 549 to 558 + 11.5 ggggcggggg MA0114 HNF4 NUCLEAR 549 to 561 + 6.84 ggggcggggggtg MA0118 Macho-1 ZN-FINGER, C2H2 549 to 557 + 7.68 ggggcgggg Myf 550 to 561 + 6.33 gggcggggggtg MA0007 Ar NUCLEAR RECEPTOR 550 to 571 - 6.67 agtagaacttcaccccccgccc MA0079 SP1 ZN-FINGER, C2H2 550 to 559 + 7.55 gggcgggggg MA0114 HNF4 NUCLEAR 550 to 562 + 6.02 gggcggggggtga MA0057 ZNF42_5-13 ZN-FINGER, C2H2
551 to 560 + 8.59 ggcggggggt
MA0079 SP1 ZN-FINGER, C2H2 551 to 560 + 9.1 ggcggggggt MA0123 ABI4 AP2 552 to 561 - 7.83 caccccccgc MA0056 ZNF42_1-4 ZN-FINGER, C2H2
553 to 558 + 7.56 cggggg
MA0057 ZNF42_5-13 ZN-FINGER, C2H2
553 to 562 + 6.98 cggggggtga

Fig. E.1 continued
140
MA0079 SP1 ZN-FINGER, C2H2 553 to 562 + 8.68 cggggggtga MA0113 NR3C1 NUCLEAR 553 to 570 + 6.7 cggggggtgaagttctac MA0118 Macho-1 ZN-FINGER, C2H2 553 to 561 + 10.3 cggggggtg MA0056 ZNF42_1-4 ZN-FINGER, C2H2
554 to 559 + 7.06 gggggg
MA0057 ZNF42_5-13 ZN-FINGER, C2H2
554 to 563 + 6.57 ggggggtgaa
MA0079 SP1 ZN-FINGER, C2H2 554 to 563 + 7.82 ggggggtgaa MA0118 Macho-1 ZN-FINGER, C2H2 554 to 562 + 7.6 ggggggtga MA0018 CREB1 bZIP 555 to 566 + 6.61 gggggtgaagtt MA0016 CFI-USP NUCLEAR RECEPTOR
556 to 565 + 7.56 ggggtgaagt
MA0114 HNF4 NUCLEAR 556 to 568 + 6.45 ggggtgaagttct MA0046 TCF1 HOMEO 623 to 636 - 6.16 agttaaatatttta GATA 652 to 664 + 6.27 tgtagataaagaa MA0049 Hunchback ZN-FINGER, C2H2
655 to 664 + 6.16 agataaagaa
MA0020 Dof2 ZN-FINGER, DOF 659 to 664 + 6.44 aaagaa MA0053 MNB1A ZN-FINGER, DOF 659 to 663 + 6.16 aaaga MA0075 Prrx2 HOMEO 663 to 667 + 6.21 aatta MA0019 Chop-cEBP bZIP 690 to 701 + 6.08 acatgcaaacct Mef-2 698 to 709 + 7.1 acctatttttat MA0052 MEF2A MADS 700 to 709 + 6.36 ctatttttat MA0073 RREB1 ZN-FINGER, C2H2 709 to 728 - 6.7 ctccccccccccccctcaaa MA0057 ZNF42_5-13 ZN-FINGER, C2H2
711 to 720 + 7.55 tgaggggggg
MA0068 Pax4 PAIRED-HOMEO 711 to 740 - 7.97 gaatcgagacagctccccccccccccctca Sp1 712 to 724 + 6.59 gaggggggggggg Sp1 713 to 725 + 7.34 agggggggggggg Sp1 714 to 726 + 7.49 ggggggggggggg MA0079 SP1 ZN-FINGER, C2H2 714 to 723 + 6.47 gggggggggg Sp1 715 to 727 + 6.11 gggggggggggga MA0068 Pax4 PAIRED-HOMEO 715 to 744 - 8.31 aactgaatcgagacagctcccccccccccc MA0079 SP1 ZN-FINGER, C2H2 715 to 724 + 6.49 gggggggggg MA0079 SP1 ZN-FINGER, C2H2 716 to 725 + 6.49 gggggggggg Sp1 717 to 729 + 6.39 ggggggggggagc MA0079 SP1 ZN-FINGER, C2H2 717 to 726 + 6.49 gggggggggg Sp1 718 to 730 + 6.7 gggggggggagct MA0079 SP1 ZN-FINGER, C2H2 718 to 727 + 8.19 ggggggggga MA0056 ZNF42_1-4 ZN-FINGER, C2H2
722 to 727 + 6.74 ggggga
MA0014 Pax5 PAIRED 729 to 748 - 6.04 tgctaactgaatcgagacag MA0114 HNF4 NUCLEAR 745 to 757 - 6.61 tggacaaagtgct MA0021 Dof3 ZN-FINGER, DOF 747 to 752 - 6.66 aaagtg MA0078 Sox17 HMG 747 to 755 + 6.03 cactttgtc SRF 754 to 766 - 7.23 tgccaaggatgga MA0095 YY1 ZN-FINGER, C2H2 754 to 759 + 6.33 tccatc MA0035 Gata1 ZN-FINGER, GATA 755 to 760 - 6.53 ggatgg MA0098 c-ETS ETS 756 to 761 + 6.11 catcct

Fig. E.1 continued
141
NF-1 759 to 776 + 6.91 ccttggcaactcgtaaca MA0045 HMG-IY HMG 777 to 792 - 6.17 taggaaatcgcagaac MA0038 Gfi ZN-FINGER, C2H2 780 to 789 - 6.37 gaaatcgcag MA0023 Dorsal_2 REL 781 to 790 + 6.46 tgcgatttcc MA0107 RELA REL 781 to 790 + 6.5 tgcgatttcc MA0098 c-ETS ETS 786 to 791 + 6.09 tttcct MA0037 GATA3 ZN-FINGER, GATA 790 to 795 - 6.2 tgatag Mef-2 811 to 822 - 7.34 ggttttatttag MA0027 En1 HOMEO 865 to 875 - 6.75 aaggagttgtc MA0021 Dof3 ZN-FINGER, DOF 871 to 876 - 6.04 aaagga MA0071 RORA NUCLEAR RECEPTOR
884 to 893 + 6.01 gtatgggtca
AP-1 885 to 895 - 7.18 gatgacccata MA0089 TCF11-MafG bZIP 890 to 895 - 7.54 gatgac MA0035 Gata1 ZN-FINGER, GATA 899 to 904 - 6.49 ggatgc MA0036 GATA2 ZN-FINGER, GATA 900 to 904 - 6.09 ggatg MA0050 IRF1 TRP-CLUSTER 913 to 924 - 6.65 caaagggaagcc MA0062 GABPA ETS 913 to 922 - 6.59 aagggaagcc MA0039 Klf4 ZN-FINGER, C2H2 914 to 923 - 6.95 aaagggaagc MA0028 ELK1 ETS 915 to 924 - 6.22 caaagggaag MA0039 Klf4 ZN-FINGER, C2H2 915 to 924 - 7.16 caaagggaag MA0080 SPI1 ETS 915 to 920 - 8.36 gggaag MA0098 c-ETS ETS 915 to 920 + 6.2 cttccc MA0081 SPIB ETS 916 to 922 - 6.2 aagggaa MA0021 Dof3 ZN-FINGER, DOF 918 to 923 - 6.89 aaaggg MA0056 ZNF42_1-4 ZN-FINGER, C2H2
932 to 937 + 6.26 tgggga
MA0070 Pbx HOMEO 951 to 962 - 6.77 gcttcaatcaat MA0068 Pax4 PAIRED-HOMEO 991 to 1020 + 6.22 gaaaattgtcctgggccttttgtcatcccc MA0068 Pax4 PAIRED-HOMEO 992 to 1021 + 6.58 aaaattgtcctgggccttttgtcatccccc MA0078 Sox17 HMG 992 to 1000 + 6.03 aaaattgtc MA0068 Pax4 PAIRED-HOMEO 993 to 1022 + 7.03 aaattgtcctgggccttttgtcatcccccc
MA0078 Sox17 HMG 1006 to
1014 + 6.23 ccttttgtc
AP-1 1007 to
1017 - 6.57 gatgacaaaag
MA0010 Broad-complex_1 ZN-FINGER, C2H2
1007 to
1020 - 8.62 ggggatgacaaaag
MA0045 HMG-IY HMG 1007 to
1022 - 6.89 ggggggatgacaaaag
NF-1 1008 to
1025 + 6.31 ttttgtcatccccccaaa
NF-1 1009 to
1026 - 7.38 ctttggggggatgacaaa
MA0018 CREB1 bZIP 1009 to
1020 - 6.24 ggggatgacaaa
MA0084 SRY HMG 1009 to - 6.07 gatgacaaa
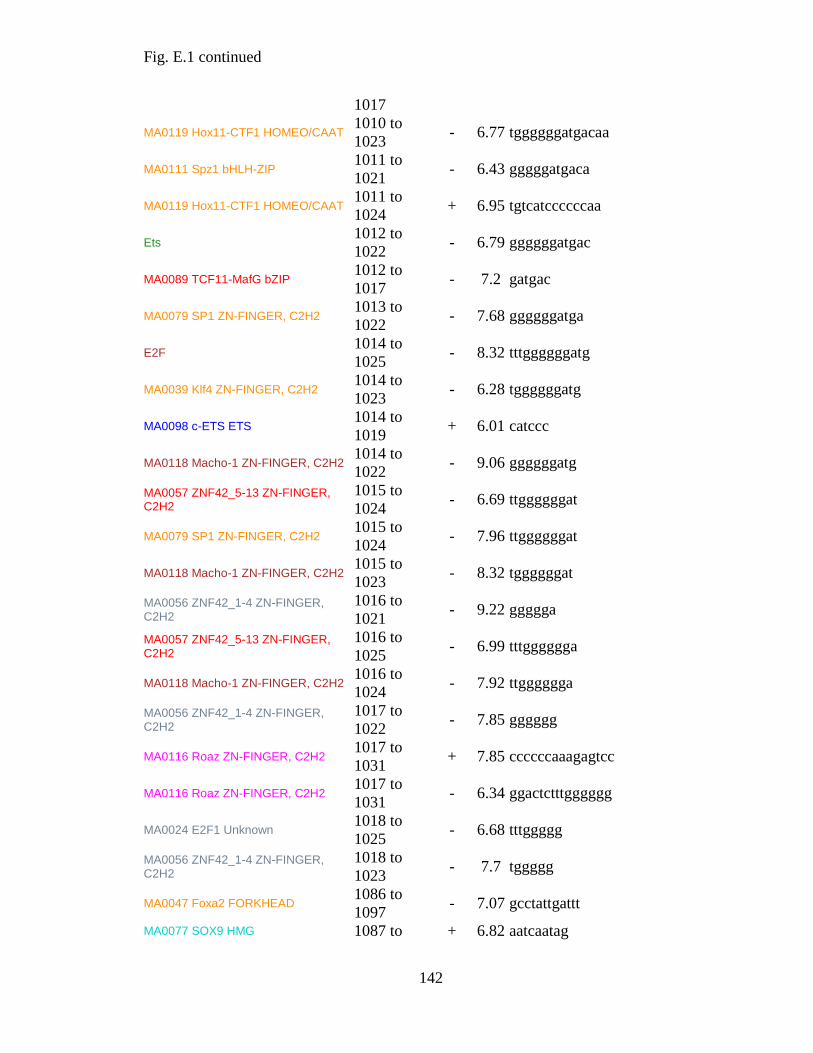
Fig. E.1 continued
142
1017
MA0119 Hox11-CTF1 HOMEO/CAAT 1010 to
1023 - 6.77 tggggggatgacaa
MA0111 Spz1 bHLH-ZIP 1011 to
1021 - 6.43 gggggatgaca
MA0119 Hox11-CTF1 HOMEO/CAAT 1011 to
1024 + 6.95 tgtcatccccccaa
Ets 1012 to
1022 - 6.79 ggggggatgac
MA0089 TCF11-MafG bZIP 1012 to
1017 - 7.2 gatgac
MA0079 SP1 ZN-FINGER, C2H2 1013 to
1022 - 7.68 ggggggatga
E2F 1014 to
1025 - 8.32 tttggggggatg
MA0039 Klf4 ZN-FINGER, C2H2 1014 to
1023 - 6.28 tggggggatg
MA0098 c-ETS ETS 1014 to
1019 + 6.01 catccc
MA0118 Macho-1 ZN-FINGER, C2H2 1014 to
1022 - 9.06 ggggggatg
MA0057 ZNF42_5-13 ZN-FINGER, C2H2
1015 to
1024 - 6.69 ttggggggat
MA0079 SP1 ZN-FINGER, C2H2 1015 to
1024 - 7.96 ttggggggat
MA0118 Macho-1 ZN-FINGER, C2H2 1015 to
1023 - 8.32 tggggggat
MA0056 ZNF42_1-4 ZN-FINGER, C2H2
1016 to
1021 - 9.22 ggggga
MA0057 ZNF42_5-13 ZN-FINGER, C2H2
1016 to
1025 - 6.99 tttgggggga
MA0118 Macho-1 ZN-FINGER, C2H2 1016 to
1024 - 7.92 ttgggggga
MA0056 ZNF42_1-4 ZN-FINGER, C2H2
1017 to
1022 - 7.85 gggggg
MA0116 Roaz ZN-FINGER, C2H2 1017 to
1031 + 7.85 ccccccaaagagtcc
MA0116 Roaz ZN-FINGER, C2H2 1017 to
1031 - 6.34 ggactctttgggggg
MA0024 E2F1 Unknown 1018 to
1025 - 6.68 tttggggg
MA0056 ZNF42_1-4 ZN-FINGER, C2H2
1018 to
1023 - 7.7 tggggg
MA0047 Foxa2 FORKHEAD 1086 to
1097 - 7.07 gcctattgattt
MA0077 SOX9 HMG 1087 to + 6.82 aatcaatag
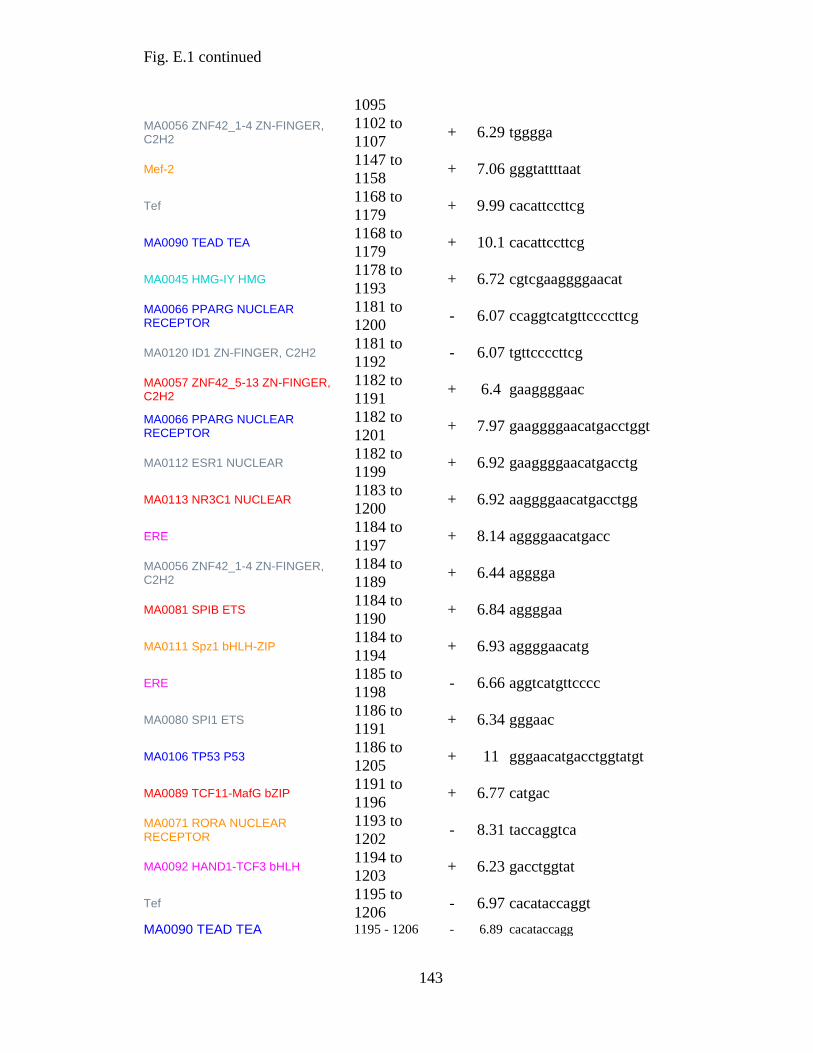
Fig. E.1 continued
143
1095
MA0056 ZNF42_1-4 ZN-FINGER, C2H2
1102 to
1107 + 6.29 tgggga
Mef-2 1147 to
1158 + 7.06 gggtattttaat
Tef 1168 to
1179 + 9.99 cacattccttcg
MA0090 TEAD TEA 1168 to
1179 + 10.1 cacattccttcg
MA0045 HMG-IY HMG 1178 to
1193 + 6.72 cgtcgaaggggaacat
MA0066 PPARG NUCLEAR RECEPTOR
1181 to
1200 - 6.07 ccaggtcatgttccccttcg
MA0120 ID1 ZN-FINGER, C2H2 1181 to
1192 - 6.07 tgttccccttcg
MA0057 ZNF42_5-13 ZN-FINGER, C2H2
1182 to
1191 + 6.4 gaaggggaac
MA0066 PPARG NUCLEAR RECEPTOR
1182 to
1201 + 7.97 gaaggggaacatgacctggt
MA0112 ESR1 NUCLEAR 1182 to
1199 + 6.92 gaaggggaacatgacctg
MA0113 NR3C1 NUCLEAR 1183 to
1200 + 6.92 aaggggaacatgacctgg
ERE 1184 to
1197 + 8.14 aggggaacatgacc
MA0056 ZNF42_1-4 ZN-FINGER, C2H2
1184 to
1189 + 6.44 agggga
MA0081 SPIB ETS 1184 to
1190 + 6.84 aggggaa
MA0111 Spz1 bHLH-ZIP 1184 to
1194 + 6.93 aggggaacatg
ERE 1185 to
1198 - 6.66 aggtcatgttcccc
MA0080 SPI1 ETS 1186 to
1191 + 6.34 gggaac
MA0106 TP53 P53 1186 to
1205 + 11 gggaacatgacctggtatgt
MA0089 TCF11-MafG bZIP 1191 to
1196 + 6.77 catgac
MA0071 RORA NUCLEAR RECEPTOR
1193 to
1202 - 8.31 taccaggtca
MA0092 HAND1-TCF3 bHLH 1194 to
1203 + 6.23 gacctggtat
Tef 1195 to
1206 - 6.97 cacataccaggt
MA0090 TEAD TEA 1195 - 1206 - 6.89 cacataccagg

Appendix F: G-test to determine statistical significance of number of binding sites for each indicated transcription factor in each discussed regulatory region
Notes:
1. "Non_versions" of each transcription factor binding site are calculated because at least 1 degree of freedom is needed to determine if a G value is significant. Deg of freedom = N - 1, where N = number of each transcription factor binding site + its non_version.
2. If the value of either observed or predicted number of binding sites was zero, the number zero was not used in calculations, since the G value would then be undefined. Instead, a very small number, approaching zero, was used, e.g. 10^-100.
3. To achieve the most accurate values for G, the expected number of binding sites for each transription factor were not rounded up or down to the nearest whole number.
4. The p value cutoffs for statistically significant differences are shown only for p values of 0.10 and lower. G tests yielding p values of >0.10 were considered to yield non-significant results.
4. Sometimes, it could be determined without calculations that the difference between observed and expected values of transcription factors bindings sites was not significant, for example, if both values were the same number, or could be rounded to the same number.
It was also sometimes able to be determined, based on comparison to preceeding calculations in this file, if a p value was <0.001.
6. Abbreviation: rc = reverse complement
Calculations for significance
Expected frequencies
How often both orientations are predicted to occur in each region and subregion (click on each cell to determime formula used to obain each value)
2 2_2 4 4_1 4_2 5 5_1 6 6_1 17 19 19_1
Otx TAATCC TAATCT plus reverse complements 2.39689 0.31521 1.39546 0.4885 0.25942 1.60379 1.01358 1.83805 1.29655 1.4236 3.11002 0.99176
Gatae (C/T)GATA(A/G) plus reverse complemement 10.1541 1.27622 5.90635 2.13804 1.05332 6.80313 4.25044 8.13051 5.64469 6.3208 13.2553 4.23741
Bra (A/G)(A/T)(A/T)NTN(A/G)CAC(C/T)T plus rev comp 0.37038 0.04373 0.21532 0.07898 0.03638 0.24835 0.15391 0.30084 0.20826 0.23397 0.48516 0.15528
Foxa (A/G)(A/C)(A/C)T(G/A)TT(A/G/T)(A/T)TT(T/C) + rc 0.31748 0.0238 0.18333 0.08423 0.02065 0.21496 0.12187 0.34168 0.21495 0.27149 0.4347 0.14157
Gatac (T/G/A)(T/A)(G/C)AGACT(T/A)AGC(T/G) +rc 0.00516 0.00083 0.00301 0.00093 0.00067 0.00343 0.00227 0.00335 0.00251 0.00256 0.00653 0.00206
Su(H) (C/G)(G/A)TG(A/G)GA(A/T/G) + rc 1.93846 0.35424 1.13389 0.33977 0.28258 1.28825 0.86687 1.22506 0.92214 0.93522 2.43858 0.76831
Runx (C/T)G(C/T)GGTN +rc 3.87634 0.82113 2.27201 0.63811 0.64553 2.56864 1.77576 2.26166 1.74762 1.71667 4.81279 1.50863
TCF ACAAAG + rc 2.39689 0.31521 1.39546 0.4885 0.25942 1.60379 1.01358 1.83805 1.29655 1.4236 3.11002 0.99176
GC percentage 38.19 44.51 38.28 35.33 43.91 38.06 39.26 34.53 35.75 34.26 37.6 37.37
G or C proportion 0.19095 0.22255 0.1914 0.17665 0.21955 0.1903 0.1963 0.17265 0.17875 0.1713 0.188 0.18685
A or T proportion 0.30905 0.27745 0.3086 0.32335 0.28045 0.3097 0.3037 0.32735 0.32125 0.3287 0.312 0.31315
Sequence length(bp) 3603 537 2100 716 435 2407 1546 2685 1905 2078 4643 1477
Observed frequencies 2 2_2 4 4_1 4_2 5 5_1 6 6_1 17 19 19_1 #bp/site (for excel calcs)
Otx TAATCC TAATCT plus reverse complements 8 0 2 0 0 6 3 3 2 0 5 1 6 otx
Gatae (C/T)GATA(A/G) plus reverse complemement 12 3 3 2 2 6 5 7 4 5 4 2 6 gatae
Bra (A/G)(A/T)(A/T)NTN(A/G)CAC(C/T)T plus rev comp 0 0 0 0 0 1 0 1 1 0 0 0 12 bra
Foxa (A/G)(A/C)(A/C)T(G/A)TT(A/G/T)(A/T)TT(T/C) + rc 0 0 0 0 0 3 3 0 0 0 0 0 12 foxa
Gatac (T/G/A)(T/A)(G/C)AGACT(T/A)AGC(T/G) +rc 14 2 13 5 3 16 11 9 9 6 20 8 13 gatac
Su(H) (C/G)(G/A)TG(A/G)GA(A/T/G) + rc 1 0 0 0 0 0 0 0 0 1 0 0 8 su(H)
Runx (C/T)G(C/T)GGTN +rc 2 0 2 1 1 2 2 4 4 2 4 0 6 Runx
TCF ACAAAG + rc 2 1 2 2 0 6 6 5 5 1 7 1 6 TCF
G test calculations to determine if observed numbers of each potential binding site in each region is significant. (For each region, G values for both each transcription factor binding site of interest, plus its non-version, were calculated, as shown in the columns designated "G."
These values were summed, and the resultant "Sum of G's" calculated in each case was compared to P values in the table below that starts at line 179. From this result, a level of statistical significance could be determined in each case).
Reg 2 Observed Expected G Observed Expected G Observed Expected G Observed Expected G Observed Expected G Observed Expected G Observed Expected G Site Expected
Otx 8 2.39689 19.2843 Gatae 12 10.1540705 4.00877 Bra 1E-133 0.37038 -6E-131 Foxa 0 0.31748 Gatac 14 0.00516 221.374 Su(H) 1 1.93846 -1.32378 Runx 2 3.87634 -2.64698 Otx 2.39689
Non Otx 592.5 598.103 -11.1536 Non Gatae 588.5 590.34593 -3.68608 Non Bra 300.25 299.88 0.74122 NonGatac 263.154 277.149 -27.2708 NonSu(H) 449.375 448.437 1.87888 NonRunx 598.5 596.624 3.75858 Gatae 10.1541
Sum of G's 8.13073 Sum of G's 0.32269 Sum of G's 0.74122 Sum of G's 194.103 Sum of G's 0.55509 Sum of G's 1.1116 Bra 0.37038
Foxa 0.15874
P<0.01 Not significant Not significant Not significant P<0.001 Not significant in either tail. Not significant. Gatac 0.00516
Su(H) 1.93846
Observed Expected G Runx 3.87634
TCF 2 2.39689 -0.7241 TCF 2.39689
NonTCF 598.5 598.103 0.79405
Sum of G's 0.06994
Not significant
Reg 2_2 Observed Expected G Observed Expected G Observed Expected G Observed Expected G Observed Expected G Observed Expected G Observed Expected G Site Expected
Otx 1E-114 0.31521 -5E-112 Gatae 3 1.27622156 5.12825 Bra 0 0.04373 FoxA 0 0.0238 Gatac 2 0.00083 31.1406 Su(H) 0 0.35424 Runx 1E-111 0.82113 -5E-109 Otx 0.31521
Non Otx 89.5 89.1848 0.63153 Non Gatae 86.5 88.2237784 -3.41365 NonGatac 39.3077 41.3069 -3.89998 NonSu(H) NonRunx 89.5 88.6789 1.64984 Gatae 1.27622
Sum of G's 0.63153 Sum of G's 1.7146 Sum of G's 27.2406 Sum of G's 1.64984 Bra 0.04373
Not significant either tail. Not significant Not significant Not significant P<0.001 Not significant Not significant in either tail. Foxa 0.0119
Gatac 0.00083
Su(H) 0.35424
Runx 0.82113
Observed Expected G TCF 0.31521
TCF 1 0.31521 2.30904
NonTCF 88.5 89.1848 -1.36431
Sum of G's 0.94473
Not significant
Reg 4 Observed Expected G Observed Expected G Observed Expected G Observed Expected G Observed Expected G Observed Expected G Observed Expected G Site Expected
Otx 2 1.39546 1.4397 Gatae 3 5.90634754 -4.06449 Bra 0 0.21532 FoxA 0 0.18333 Gatac 13 0.09167 128.818 Su(H) 1E-97 1.13389 -4.5E-95 Runx 2 2.27201 -0.51008 Otx 1.39546
NonOtx 348 348.605 -1.20803 NonGatae 347 344.093652 5.83717 NonBra NonGatac 148.538 161.447 -24.7559 262.5 261.366 2.27269 NonRunx 348 347.728 0.54424 Gatae 5.90635
Sum of G's 0.23166 Sum of G's 1.77268 Sum of G's Sum of G's 104.062 Sum of G's 2.27269 Sum of G's 0.03416 Bra 0.21532
Not significant Not significant in either tail Not significant Not significant P<0.001 Not significant Not significant in either tail Foxa 0.09167
Observed Expected G Gatac 0.09167
TCF 2 1.39546 1.4397 Su(H) 1.13389
NonTCF 348 348.605 -1.20803 Runx 2.27201
Sum of G's 0.23166 TCF 1.39546
Not significant
Reg 4_1 Observed Expected G Observed Expected G Observed Expected G Observed Expected G Observed Expected G Observed Expected G Observed Expected G Site Expected
Otx 1E-101 0.4885 -5E-99 Gatae 2 2.13803723 -0.26696 Bra 0 0.07898 FoxA 0 0.08423 Gatac 5 0.00093 85.9273 Su(H) 0 0.33977 Runx 1 0.63811 Otx 0.4885

NonOtx 119.33333 118.845 0.979 NonGatae 117.333 117.195296 0.27624 NonBra NonGatac 49.0769 55.076 -11.3196 Gatae 2.13804
Sum of G's 0.979 Sum of G's 0.00927 Sum of G's 74.6077 Bra 0.07898
Not significant Not significant Not significant Not significant p<0.001 Not significant Not significant Foxa 0.04211
Gatac 0.00093
Observed Expected G Su(H) 0.33977
TCF 2 0.4885 5.63828 Runx 0.63811
NonTCF 117.33333 118.845 -3.0037 TCF 0.4885
2.63458
Not significant
Observed Expected G Observed Expected G Observed Expected G Observed Expected G Observed Expected G Observed Expected G Site Expected
Observed Expected G Gatae 2 1.05331686 2.56481 Bra 0 0.03638 FoxA 0 0.02065 Gatac 3 0.00067 50.4045 Su(H) 0 0.28258 Runx 1 0.64553 Otx 0.25942
Reg 4_2 0 0.25942 NonGatae 70.5 71.4466831 -1.88077 NonGatac 30.4615 33.4609 -5.72139 NonSu(H) Gatae 1.05332
Otx 0.68405 44.6831 Bra 0.03638
Not significant Not significant Not significant Not significant P<0.001 Not significant. Not significant. Foxa 0.01032
Gatac 0.00067
Observed Expected G Su(H) 0.28258
TCF 0 0.25942 Runx 0.64553
Not significant TCF 0.25942
Observed Expected G G tests checked, ok
Reg 5 Observed Expected G Observed Expected G Observed Expected G Observed Expected G Observed Expected G Observed Expected G Site Expected
Otx 6 1.60379 15.8327 Gatae 6 6.80312576 -1.50747 Bra 1 0.24835 2.78585 FoxA 3 0.21496 15.8155 Gatac 16 0.00343 Su(H) 1E-82 1.28825 -3.8E-80 Runx 2 2.56864 -1.00092 Otx 1.60379
NonOtx 395.16667 399.563 -8.74386 NonGatae 395.167 394.363541 1.60789 199.583 200.335 -1.50048 NonFoxA 197.583 200.368 -5.53119 NonSu(H) 300.875 299.587 2.58202 NonRunx 399.167 398.598 1.1381 Gatae 6.80313
Sum of G's 7.08879 0.10041 1.28537 10.2843 2.58202 0.13717 Bra 0.24835
p<0.01 Not significant. Not significant. p<0.01 p<0.001 Not significant. Not signficant. Foxa 0.10748
Gatac 0.00343
Observed Expected G Su(H) 1.28825
TCF 6 1.60379 15.8327 Runx 2.56864
NonTCF 395.16667 399.563 -8.74386 TCF 1.60379
Sum of G's 7.08879
p<0.01
Reg5_1 Observed Expected G Observed Expected G Observed Expected G Observed Expected G Observed Expected G Observed Expected G Observed Expected G Site Expected
Otx 3 1.01358 6.51073 Gatae 5 4.25044273 1.62415 Bra 0 0.15391 FoxA 3 0.12187 19.2207 Gatac 11 0.00227 186.657 Su(H) 1E-160 0.86687 -7E-158 Runx 2 1.77576 0.47567 Otx 1.01358
NonOtx 254.66667 256.653 -3.95742 NonGatae 252.667 253.416224 -1.4969 NonFoxA 125.833 128.711 -5.69142 NonGatac 107.923 118.921 -20.9455 193.25 192.383 1.73764 NonRunx 255.667 255.891 -0.44828 Gatae 4.25044
Sum of G's 2.5533 Sum of G's 0.12725 13.5293 165.711 1.73764 0.02739 Bra 0.15391
Not significant Not significant Not significant p<0.001 p<0.001 Not significant Not significant Foxa 0.06093
Gatac 0.00227
Observed Expected G Su(H) 0.86687
TCF 6 1.01358 21.3392 Runx 1.77576
NonTCF 251.66667 256.653 -9.87532 TCF 1.01358
11.4639
p<0.001
Reg6 Observed Expected G Observed Expected G Observed Expected G Observed Expected G Observed Expected G Observed Expected G Observed Expected G Site Expected
Otx 3 1.83805 2.93945 Gatae 7 8.13051233 -2.09599 Bra 1 0.30084 2.40234 FoxA 0 0.34168 Gatac 9 0.00335 Su(H) 1E-186 1.22506 -9E-184 Runx 4 2.26166 4.56158 Otx 1.83805
444.5 445.662 -2.32087 NonGatae 440.5 439.369488 2.26393 NonBra 222.75 223.449 -1.39613 NonSu(H) 335.625 334.4 2.45461 NonRunx 443.5 445.238 -3.46989 Gatae 8.13051
Sum of G's 0.61858 Sum of G's 0.16794 Sum of G's 1.00621 Sum of G's 2.45461 Sum of G's 1.09169 Bra 0.30084
Not significant. Not significant. Not significant Not significant p<0.001 Not significant. Not significant Foxa 0.17084
Gatac 0.00335
Observed Expected G Su(H) 1.22506
TCF 5 1.83805 10.0073 Runx 2.26166
NonTCF 442.5 445.662 -6.30142 TCF 1.83805
Sum of G's 3.70592
p<0.10
Reg 6_1 Observed Expected G Observed Expected G Observed Expected G Observed Expected G Observed Expected G Observed Expected G Observed Expected G Site Expected
Otx 2 1.29655 1.73376 Gatae 4 5.64469452 -2.75537 Bra 1 0.20826 3.13795 FoxA 0 0.21495 Gatac 9 0.00251 147.321 Su(H) 1E-191 0.92214 -9E-189 Runx 4 1.74762 6.62433 Otx 1.29655
Non Otx 315.5 316.203 -1.40533 Non Gatae 313.5 311.855305 3.29805 NonBra 157.75 158.542 -1.57952 NonGatac 137.538 146.536 -17.4309 NonSu(H) 238.125 237.203 1.84785 NonRunx 313.5 315.752 -4.48866 Gatae 5.64469
Sum of G's 0.32843 Sum of G's 0.54267 Sum of G's 1.55843 Sum of G's 129.891 Sum of G's 1.84785 Sum of G's 2.13567 Bra 0.20826
Not significant. Not significant. Not significant Not significant p<0.001 Not significant Not significant Foxa 0.10748
Observed Expected G Gatac 0.00251
TCF 5 1.29655 13.4973 Su(H) 0.92214
NonTCF 312.5 316.203 -7.36335 Runx 1.74762
Sum of G's 6.13395 TCF 1.29655
p<0.025
Reg 17 Observed Expected G Observed Expected G Observed Expected G Observed Expected G Observed Expected G Observed Expected G Observed Expected G Site Expected
Otx 1E-258 1.4236 -1E-255 Gatae 5 6.32079962 -2.34408 Bra 0 0.23397 FoxA 0 0.27149 Gatac 6 0.00256 93.1009 Su(H) 1 0.93522 Runx 2 1.71667 0.61104 Otx 1.4236
NonOtx 346.33333 344.91 2.85308 NonGatae 341.333 340.012534 2.64672 NonGatac 153.846 159.844 -11.767 NonRunx 344.333 344.617 -0.56642 Gatae 6.3208
Sum of G's 2.85308 Sum of G's 0.30265 Sum of G's 81.3339 Sum of G's 0.04462 Bra 0.23397
p<0.10 Not significant. Not significant. Not significant. p<0.001 Not significant. Not significant. Foxa 0.13574
Gatac 0.00256
TCF Observed Expected G Su(H) 0.93522

1 1.4236 Runx 1.71667
TCF 1.4236
Not significant.
Reg19 Observed Expected G Observed Expected G Observed Expected G Observed Expected G Observed Expected G Observed Expected G Observed Expected G Site Expected
Otx 5 3.11002 4.7481 Gatae 4 13.2553231 -9.58484 Bra 0 0.48516 FoxA 0 0.4347 Gatac 20 0.00653 Su(H) 1E-215 2.43858 -1E-212 Runx 4 4.81279 -1.47986 Otx 3.11002
NonOtx 768.83333 770.723 -3.77533 NonGatae 769.833 760.57801 18.6228 NonSu(H) 580.375 577.936 4.88744 NonRunx 769.833 769.021 1.62644 Gatae 13.2553
Sum of G's 0.97277 Sum of G's 9.03798 Sum of G's 4.88744 Sum of G's 0.14658 Bra 0.48516
Not significant p<0.01 Not significant Not significant p<0.001 p<0.05 Not significant. Foxa 0.21735
Gatac 0.00653
Observed Expected G Su(H) 2.43858
TCF 7 3.11002 11.3579 Runx 4.81279
NonTCF 766.83333 770.723 -7.7603 TCF 3.11002
Sum of G's 3.59765
p<0.10
Reg19_1 Observed Expected G Observed Expected G Observed Expected G Observed Expected G Observed Expected G Observed Expected G Observed Expected G Site Expected
Otx 1 0.99176 Gatae 2 4.23741354 -3.00322 Bra 0 0.15528 FoxA 0 0.14157 Gatac 8 0.00206 Su(H) 1E-216 0.76831 -1E-213 Runx 1E-185 1.50863 -9E-183 Otx 0.99176
NonGatae 244.167 241.929253 4.49546 NonSu(H) 184.625 183.857 1.53982 NonRunx 246.167 244.658 3.02654 Gatae 4.23741
Sum of G's 1.49223 Sum of G's 1.53982 Sum of G's 3.02654 Bra 0.15528
Not significant Not significant Not significant Not significant P<0.001 Not significant p<0.10 Foxa 0.07079
Gatac 0.00206
Observed Expected G Su(H) 0.76831
TCF 1 0.99176 Runx 1.50863
Not significant TCF 0.99176
P value tables
Upper-tail critical values of chi-square distribution with ν degrees of freedom Taken from http://www.itl.nist.gov/div898/handbook/eda/section3/eda3674.htm
Probability less than the critical value
ν 0.90 0.95 0.975 0.99 0.999
1 2.706 3.841 5.024 6.635 10.828
2 4.605 5.991 7.378 9.210 13.816
3 6.251 7.815 9.348 11.345 16.266
4 7.779 9.488 11.143 13.277 18.467
5 9.236 11.070 12.833 15.086 20.515
6 10.645 12.592 14.449 16.812 22.458
7 12.017 14.067 16.013 18.475 24.322
8 13.362 15.507 17.535 20.090 26.125
9 14.684 16.919 19.023 21.666 27.877
10 15.987 18.307 20.483 23.209 29.588
11 17.275 19.675 21.920 24.725 31.264
12 18.549 21.026 23.337 26.217 32.910
13 19.812 22.362 24.736 27.688 34.528
14 21.064 23.685 26.119 29.141 36.123
15 22.307 24.996 27.488 30.578 37.697
16 23.542 26.296 28.845 32.000 39.252
17 24.769 27.587 30.191 33.409 40.790
18 25.989 28.869 31.526 34.805 42.312
19 27.204 30.144 32.852 36.191 43.820
20 28.412 31.410 34.170 37.566 45.315
21 29.615 32.671 35.479 38.932 46.797
22 30.813 33.924 36.781 40.289 48.268
23 32.007 35.172 38.076 41.638 49.728
24 33.196 36.415 39.364 42.980 51.179
25 34.382 37.652 40.646 44.314 52.620
26 35.563 38.885 41.923 45.642 54.052
27 36.741 40.113 43.195 46.963 55.476
28 37.916 41.337 44.461 48.278 56.892
29 39.087 42.557 45.722 49.588 58.301
30 40.256 43.773 46.979 50.892 59.703
31 41.422 44.985 48.232 52.191 61.098
32 42.585 46.194 49.480 53.486 62.487
33 43.745 47.400 50.725 54.776 63.870
34 44.903 48.602 51.966 56.061 65.247
35 46.059 49.802 53.203 57.342 66.619

36 47.212 50.998 54.437 58.619 67.985
37 48.363 52.192 55.668 59.893 69.347
38 49.513 53.384 56.896 61.162 70.703
39 50.660 54.572 58.120 62.428 72.055
40 51.805 55.758 59.342 63.691 73.402
41 52.949 56.942 60.561 64.950 74.745
42 54.090 58.124 61.777 66.206 76.084
43 55.230 59.304 62.990 67.459 77.419
44 56.369 60.481 64.201 68.710 78.750
45 57.505 61.656 65.410 69.957 80.077
46 58.641 62.830 66.617 71.201 81.400
47 59.774 64.001 67.821 72.443 82.720
48 60.907 65.171 69.023 73.683 84.037
49 62.038 66.339 70.222 74.919 85.351
50 63.167 67.505 71.420 76.154 86.661
51 64.295 68.669 72.616 77.386 87.968
52 65.422 69.832 73.810 78.616 89.272
53 66.548 70.993 75.002 79.843 90.573
54 67.673 72.153 76.192 81.069 91.872
55 68.796 73.311 77.380 82.292 93.168
56 69.919 74.468 78.567 83.513 94.461
57 71.040 75.624 79.752 84.733 95.751
58 72.160 76.778 80.936 85.950 97.039
59 73.279 77.931 82.117 87.166 98.324
60 74.397 79.082 83.298 88.379 99.607
61 75.514 80.232 84.476 89.591 100.888
62 76.630 81.381 85.654 90.802 102.166
63 77.745 82.529 86.830 92.010 103.442
64 78.860 83.675 88.004 93.217 104.716
65 79.973 84.821 89.177 94.422 105.988
66 81.085 85.965 90.349 95.626 107.258
67 82.197 87.108 91.519 96.828 108.526
68 83.308 88.250 92.689 98.028 109.791
69 84.418 89.391 93.856 99.228 111.055
70 85.527 90.531 95.023 100.425 112.317
71 86.635 91.670 96.189 101.621 113.577
72 87.743 92.808 97.353 102.816 114.835
73 88.850 93.945 98.516 104.010 116.092
74 89.956 95.081 99.678 105.202 117.346
75 91.061 96.217 100.839 106.393 118.599
76 92.166 97.351 101.999 107.583 119.850
77 93.270 98.484 103.158 108.771 121.100
78 94.374 99.617 104.316 109.958 122.348
79 95.476 100.749 105.473 111.144 123.594
80 96.578 101.879 106.629 112.329 124.839
81 97.680 103.010 107.783 113.512 126.083
82 98.780 104.139 108.937 114.695 127.324
83 99.880 105.267 110.090 115.876 128.565
84 100.980 106.395 111.242 117.057 129.804
85 102.079 107.522 112.393 118.236 131.041
86 103.177 108.648 113.544 119.414 132.277
87 104.275 109.773 114.693 120.591 133.512
88 105.372 110.898 115.841 121.767 134.746
89 106.469 112.022 116.989 122.942 135.978
90 107.565 113.145 118.136 124.116 137.208
91 108.661 114.268 119.282 125.289 138.438
92 109.756 115.390 120.427 126.462 139.666
93 110.850 116.511 121.571 127.633 140.893
94 111.944 117.632 122.715 128.803 142.119
95 113.038 118.752 123.858 129.973 143.344
96 114.131 119.871 125.000 131.141 144.567
97 115.223 120.990 126.141 132.309 145.789
98 116.315 122.108 127.282 133.476 147.010
99 117.407 123.225 128.422 134.642 148.230
100 118.498 124.342 129.561 135.807 149.449
100 118.498 124.342 129.561 135.807 149.449
Lower-tail critical values of chi-square distribution with ν degrees of freedom

Probability less than the critical value
ν 0.10 0.05 0.025 0.01 0.001
1. .016 .004 .001 .000 .000
2. .211 .103 .051 .020 .002
3. .584 .352 .216 .115 .024
4. 1.064 .711 .484 .297 .091
5. 1.610 1.145 .831 .554 .210
6. 2.204 1.635 1.237 .872 .381
7. 2.833 2.167 1.690 1.239 .598
8. 3.490 2.733 2.180 1.646 .857
9. 4.168 3.325 2.700 2.088 1.152
10. 4.865 3.940 3.247 2.558 1.479
11. 5.578 4.575 3.816 3.053 1.834
12. 6.304 5.226 4.404 3.571 2.214
13. 7.042 5.892 5.009 4.107 2.617
14. 7.790 6.571 5.629 4.660 3.041
15. 8.547 7.261 6.262 5.229 3.483
16. 9.312 7.962 6.908 5.812 3.942
17. 10.085 8.672 7.564 6.408 4.416
18. 10.865 9.390 8.231 7.015 4.905
19. 11.651 10.117 8.907 7.633 5.407
20. 12.443 10.851 9.591 8.260 5.921
21. 13.240 11.591 10.283 8.897 6.447
22. 14.041 12.338 10.982 9.542 6.983
23. 14.848 13.091 11.689 10.196 7.529
24. 15.659 13.848 12.401 10.856 8.085
25. 16.473 14.611 13.120 11.524 8.649
26. 17.292 15.379 13.844 12.198 9.222
27. 18.114 16.151 14.573 12.879 9.803
28. 18.939 16.928 15.308 13.565 10.391
29. 19.768 17.708 16.047 14.256 10.986
30. 20.599 18.493 16.791 14.953 11.588
31. 21.434 19.281 17.539 15.655 12.196
32. 22.271 20.072 18.291 16.362 12.811
33. 23.110 20.867 19.047 17.074 13.431
34. 23.952 21.664 19.806 17.789 14.057
35. 24.797 22.465 20.569 18.509 14.688
36. 25.643 23.269 21.336 19.233 15.324
37. 26.492 24.075 22.106 19.960 15.965
38. 27.343 24.884 22.878 20.691 16.611
39. 28.196 25.695 23.654 21.426 17.262
40. 29.051 26.509 24.433 22.164 17.916
41. 29.907 27.326 25.215 22.906 18.575
42. 30.765 28.144 25.999 23.650 19.239
43. 31.625 28.965 26.785 24.398 19.906
44. 32.487 29.787 27.575 25.148 20.576
45. 33.350 30.612 28.366 25.901 21.251
46. 34.215 31.439 29.160 26.657 21.929
47. 35.081 32.268 29.956 27.416 22.610
48. 35.949 33.098 30.755 28.177 23.295
49. 36.818 33.930 31.555 28.941 23.983
50. 37.689 34.764 32.357 29.707 24.674
51. 38.560 35.600 33.162 30.475 25.368
52. 39.433 36.437 33.968 31.246 26.065
53. 40.308 37.276 34.776 32.018 26.765
54. 41.183 38.116 35.586 32.793 27.468
55. 42.060 38.958 36.398 33.570 28.173
56. 42.937 39.801 37.212 34.350 28.881
57. 43.816 40.646 38.027 35.131 29.592
58. 44.696 41.492 38.844 35.913 30.305
59. 45.577 42.339 39.662 36.698 31.020
60. 46.459 43.188 40.482 37.485 31.738
61. 47.342 44.038 41.303 38.273 32.459
62. 48.226 44.889 42.126 39.063 33.181

63. 49.111 45.741 42.950 39.855 33.906
64. 49.996 46.595 43.776 40.649 34.633
65. 50.883 47.450 44.603 41.444 35.362
66. 51.770 48.305 45.431 42.240 36.093
67. 52.659 49.162 46.261 43.038 36.826
68. 53.548 50.020 47.092 43.838 37.561
69. 54.438 50.879 47.924 44.639 38.298
70. 55.329 51.739 48.758 45.442 39.036
71. 56.221 52.600 49.592 46.246 39.777
72. 57.113 53.462 50.428 47.051 40.519
73. 58.006 54.325 51.265 47.858 41.264
74. 58.900 55.189 52.103 48.666 42.010
75. 59.795 56.054 52.942 49.475 42.757
76. 60.690 56.920 53.782 50.286 43.507
77. 61.586 57.786 54.623 51.097 44.258
78. 62.483 58.654 55.466 51.910 45.010
79. 63.380 59.522 56.309 52.725 45.764
80. 64.278 60.391 57.153 53.540 46.520
81. 65.176 61.261 57.998 54.357 47.277
82. 66.076 62.132 58.845 55.174 48.036
83. 66.976 63.004 59.692 55.993 48.796
84. 67.876 63.876 60.540 56.813 49.557
85. 68.777 64.749 61.389 57.634 50.320
86. 69.679 65.623 62.239 58.456 51.085
87. 70.581 66.498 63.089 59.279 51.850
88. 71.484 67.373 63.941 60.103 52.617
89. 72.387 68.249 64.793 60.928 53.386
90. 73.291 69.126 65.647 61.754 54.155
91. 74.196 70.003 66.501 62.581 54.926
92. 75.100 70.882 67.356 63.409 55.698
93. 76.006 71.760 68.211 64.238 56.472
94. 76.912 72.640 69.068 65.068 57.246
95. 77.818 73.520 69.925 65.898 58.022
96. 78.725 74.401 70.783 66.730 58.799
97. 79.633 75.282 71.642 67.562 59.577
98. 80.541 76.164 72.501 68.396 60.356
99. 81.449 77.046 73.361 69.230 61.137
100. 82.358 77.929 74.222 70.065 61.918
144
BIOGRAPHY OF THE AUTHOR
Christopher M. McCarty was born in Bangor, Maine and graduated from Bangor
High School in 1993. He obtained a Bachelor of Science in Biology at the University of
Maine in 1997, and a Master of Science in Biochemistry in 2000, also from the
University of Maine. His thesis focused on characterizing mutations in the G protein
alpha subunit, Galpha2 in Dictyostelium discoideum in the lab of Dr. Robert Gundersen.
After obtaining his M.S. degree, he spent time as an adjunct instructor of chemistry and
biology lecture and lab courses at local colleges in Bangor. Following this, he worked as
a research assistant in the lab of Dr. Qing Yin Zheng at the Jackson Laboratory, where he
gained experience assisting in the characterization of mice with mutations in genes
controlling hearing and balance. He then applied for and was accepted into the Ph.D.
program in Biomedical Science in the University of Maine’s Graduate School of
Biomedical Sciences and Engineering (GSBSE). He and his advisor Dr. James Coffman
published a paper that is described in Chapter 2 of this dissertation: C.M. McCarty, J.A.
Coffman, Developmental cis-regulatory analysis of the cyclin D gene in the sea urchin
Strongylocentrotus purpuratus, Biochem Biophys Res Commun 440 (2013) 413-418. He
is a candidate for Doctor of Philosophy degree in Biomedical Sciences with a
concentration in Cell and Molecular Biology from the University of Maine in August
2014.