Development of the MILENA gasification technology for … · gasification technology for the...
206
Development of the MILENA gasification technology for the production of Bio-SNG C.M. van der Meijden Proefschrift ter verkrijging van de graad van doctor aan de Technische Universiteit Eindhoven ECN-B--10-016 December 2010
Transcript of Development of the MILENA gasification technology for … · gasification technology for the...

Development of the MILENA gasification technology for the
production of Bio-SNG
C.M. van der Meijden
Proefschrift ter verkrijging van de graad van doctor aan de Technische Universiteit Eindhoven
ECN-B--10-016 December 2010

Development of
the MILENA
gasification technology
for the production of Bio-SNG
PROEFSCHRIFT
ter verkrijging van de graad van doctor aan de
Technische Universiteit Eindhoven, op gezag van de
rector magnificus, prof.dr.ir. C.J. van Duijn voor een
commissie aangewezen door het College voor
Promoties in het openbaar te verdedigen op
maandag 6 december 2010 om 16.00 uur
door
Christiaan Martinus van der Meijden
geboren te Den Helder
Dit proefschrift is goedgekeurd door de promotor:
prof.dr. H.J. Veringa
Copromotor:
dr. L.P.L.M. Rabou
A catalogue record is available from the Eindhoven University of Technology
Library.
ISBN: 978-90-386-2363-4
Cover photography by Jasper Lensselink

Contents
Summary
1 Introduction 1
1.1 Sustainable Energy 1
1.2 Biomass Energy 2
1.3 Biomass gasification 3
1.4 Bio-SNG as renewable fuel 3
1.5 CO2 balance of Bio-SNG 4
1.6 Bio-SNG development at ECN 5
1.7 Objective of the MILENA development 6
1.8 Objective of this thesis 7
1.9 References 8
2 Background on Biomass gasification 11
2.1 Biomass gasification technologies 11
2.2 Fluidized bed gasification 15
2.3 Tar 17
2.4 Agglomeration 23
2.5 Indirect gasification 25
2.6 MILENA gasification process 26
2.7 Gasifier Efficiency 29
2.8 References 32
3 Bio-SNG 35
3.1 Application of (Bio)-SNG 35
3.2 Bio-SNG Production routes 36
3.3 Historical Background 38
3.4 Centralized versus Decentralized production 40
3.5 Bio-SNG as transport fuel 42

3.6 Concluding remarks 44
3.7 References 45
4 Selection of optimal gasification route for SNG production 47
4.1 Introduction 47
4.2 Process configurations 49
4.2.1 Fuel pretreatment 53
4.2.2 Gasifiers 54
4.2.3 Gas cooling and gas cleaning 58
4.2.4 Cl and Sulphur removal 59
4.2.5 Methanation 60
4.2.6 SNG upgrading 61
4.2.7 Steam system 62
4.2.8 Electricity consumption 62
4.3 Results 62
4.4 Concluding remarks 68
4.5 References 68
5 MILENA model 71
5.1 Fluidized Bed biomass gasification models 71
5.2 MILENA pseudo-equilibrium model 72
5.2.1 Model layout 73
5.2.2 MILENA gasifier 75
5.2.3 Gas composition 78
5.2.4 Carbon Conversion 78
5.2.5 Char and tar composition 80
5.3 Use of the model 81
5.4 References 82
6 MILENA gasification technology 85
6.1 Development 85
6.2 Design considerations 87
6.3 Description of cold-flow setup 100

6.4 Lab-scale installation 105
6.4.1 Gasifier 107
6.4.2 Flue gas cooling and dust removal 111
6.4.3 Producer gas cooling and dust removal 111
6.4.4 Producer gas cleaning 112
6.4.5 Methanation 113
6.5 Pilot plant 114
6.5.1 Biomass feeding system 116
6.5.2 Gasifier 117
6.5.3 Flue gas cooling and dust removal 122
6.5.4 Producer gas cooling and dust removal 123
6.5.5 Producer gas cleaning 123
6.5.6 Boiler 124
6.5.7 Construction and commissioning 125
6.6 The alternatives 126
6.7 References 127
7 Experiments 131
7.1 Introduction 131
7.2 Fuels and bed materials used in MILENA tests 133
7.3 Hydrodynamics 135
7.4 Carbon conversion in gasifier riser 140
7.5 Hydrocarbon yields 146
7.6 Tars 153
7.7 Heat balance 159
7.8 Cold Gas Efficiency 160
7.9 Modified MILENA model 161
7.10 Distribution of trace elements and pollutants 164
7.11 Flue gas quality 167
7.12 Behavior of olivine as bed material 168
7.13 Agglomeration 170

7.14 Alternative fuels 174
7.15 Upgrading of the gas into Bio-SNG 177
7.16 Discussion and concluding remarks 178
7.17 References 179
8 Conclusions and outlook 183
8.1 Conclusions 183
8.2 Short term outlook 185
8.3 Long term outlook 187
Dankwoord (Dutch)
Curriculum Vitae
List of publications

Summary
Development of the MILENA gasification technology for the production of
Bio-SNG
The production of Substitute Natural Gas from biomass (Bio-SNG) is an attractive
option to reduce CO2 emissions and replace declining fossil natural gas reserves.
The Energy research Center of the Netherlands (ECN) is working on the
development of the MILENA gasification technology that is ideally suited to
convert a wide range of biomass fuels into a gas that can be upgraded into Bio-
SNG.
Production of a synthetic natural gas that can be readily injected into the
existing natural gas infrastructure is a major challenge to make a big step into
bringing renewable energy to the public. To achieve such a goal it is necessary to
produce an SNG with similar properties as natural gas and also at a price that
makes it competitive with current and future prices.
This goal is translated into some major scientific and technological
challenges. The process, in which the gasification step is a major one, should have
the highest possible thermodynamic efficiency, meaning that most of the calorific
value of the input biomass is retained in the product gas. Next to this the quality of
the gas should be such that it can be effectively cleaned to allow for a long lasting
high efficiency SNG synthesis. This requirement is translated into the goal of
making a product gas with minimum non convertible components like nitrogen and
H2O and CO2. The inherent production of tar like components should be such that
these can be beneficially re-used in the process or be converted to components
adding to the amount and quality of the SNG.
On top of this the major technical challenge is that the design of the process
should be such that it can be up scaled into a process with capacities of well over
several hundreds of Megawatts input.

The gasification process fulfilling these technical and scientific challenges is
designed to produce a medium calorific value gas (approximately 16 MJ Nm-3 on
dry basis) with a high content of hydrocarbons like methane and ethylene.
The available knowledge from an existing 500 kWth biomass gasifier was
used to make the first design of the MILENA gasifier. On the basis of this the final
MILENA gasification process has been established which is best described as an
Indirect or Allothermal fluidized bed gasifier. One of the major advantages of
Indirect gasifiers is the near 100% conversion of the fuel into a combustible gas
and latent heat. The residual ash is virtually carbon free (< 1 wt.% C), which means
that the loss in heating value of the remains including the ash is close to zero. The
overall efficiency of the MILENA gasifier is relatively high, compared to the
alternatives, because of the complete fuel conversion and the relatively low amount
of steam required in the process.
The objective of the development described in this thesis was to design an
up-scalable biomass gasification process with a high cold gas efficiency (> 80% for
dry wood) producing a gas which is suitable to be converted into Bio-SNG with a
higher overall efficiency than the alternative biomass gasification processes. The
nitrogen content of the producer gas should be below 3 vol.%, to prevent dilution
of the Bio-SNG.
Verified relations to calculate the gas composition, compound and energy
balances are required for the design of a commercial scale demonstration plant
which is scheduled for construction in 2011. Reliable relations for carbon
conversion and hydrocarbon yields in an indirectly heated riser gasifier as function
of temperature were not available from literature. Data from an extensive test
program was used to produce and verify the required relations. The models to
describe the process were designed by the author of this thesis. The relations for
hydrocarbon yield can also be used for comparable biomass gasification processes
(e.g. BFB and CFB gasification), but experimental verification is recommended.
An introduction into Bio-SNG is given and the MILENA development for
Bio-SNG production is given in Chapter 1.
In Chapter 2 the biomass gasification process in fluidized bed reactors and
the typical problems related to biomass fluidized bed gasification are described.
In Chapter 3 background information is given on the production and usage of
Bio-SNG.
Chapter 4 presents an analysis of the obtainable Bio-SNG process efficiency
using three different, more or less suitable, gasification technologies and associated
gas cleaning and methanation equipment. These technologies are: 1) Entrained
Flow, 2) Circulating Fluidized Bed (CFB) and 3) Indirect gasification. Overall
efficiency to SNG is highest for Indirect gasification. The net overall efficiencies
on an LHV basis, including electricity consumption and pretreatment, but
excluding transport of biomass, are 54% for Entrained Flow, 58% for CFB and
67% for Indirect gasification. Because of the significant differences in overall
efficiencies to SNG for the different gasifiers, ECN has selected the Indirect
gasification as the preferred technology for the production of SNG.
A pseudo-equilibrium model is made to describe the MILENA gasification
process. This MILENA model was used to design the lab-scale and pilot-scale
installations. The model is described in Chapter 5.
In 2004 the 30 kWth lab-scale MILENA gasifier was built. After successful
operation of the MILENA lab-scale gasifier for some years it was, at the end of
2006, decided to start the realization of a pilot-scale gasifier. Construction started
in 2007 and the 800 kWth pilot plant was taken into operation in 2008. First tests
with the complete system (gasifier and gas cleaning) were done in 2009. The
MILENA process and the lab-scale and pilot-scale installation are described in
Chapter 6.
An extensive test program was done in the lab-scale and pilot-scale
MILENA installations. Different fuels, such as clean wood, demolition wood,
sewage sludge and lignite were tested. Test results were used to verify the
MILENA model. Tests with demolition wood were done to produce data for the
engineering of a MILENA demonstration plant. Results of the lab-scale and pilot-
scale tests using different fuels are described in Chapter 7.


Chapter 1
1 Introduction
1.1 Sustainable Energy
Energy is one of the essential ingredients of modern society. Nowadays energy
comes for the greater part from fossil fuels like oil, natural gas and coal. The
proven fossil oil and natural gas reserves are declining in North America and
Europe [1]. According a study of the Energy Research Centre of the Netherlands
(ECN) the global production of oil might decline within 30 years [2]. According to
the International Energy Agency (IEA) the consumption of primary energy is
expected to increase by 1.6% per year. By 2030 consumption is expected to have
risen by just over 45% compared to 2006 [3].
On top of the problem of securing the supply, the combustion of fossil fuels
produces CO2, which contributes to global warming. CO2 emissions from fossil
fuels can, to some extent, be countered by sequestration of CO2. This CO2
sequestration, however, lowers overall efficiency significantly, resulting in a higher
consumption of fossil fuels per unit of energy delivered and consequently a faster
decline of fossil fuels reserves.
Sustainable alternatives like wind, solar or biomass energy are required to
replace the declining production of fossil fuels without increasing the amount of
CO2 in the atmosphere.

Chapter 1
2
1.2 Biomass Energy
Biomass energy is expected to make a major contribution to the replacement of
fossil fuels. The future world-wide available amount of biomass for energy is
estimated to be 200 to 500 EJ per year, based on an evaluation of availability
studies [4]. Word wide oil consumption was 161 EJ (82.5 million barrels of oil per
day) in 2005 [1].
Biomass is considered a CO2 neutral fuel, as the amount of CO2 released on
burning biomass equals the amount taken from the atmosphere during growth of
the biomass. Fuels like hydrogen, methane, Fischer Tropsch (FT) diesel and
methanol produced from biomass have the potential to become a CO2 negative fuel,
because part of the biomass carbon is separated as CO2 during the production
process and can be sequestrated. This might be an attractive option for reducing the
level of greenhouse gases in the atmosphere.
Biomass for the production of energy is controversial for several reasons.
Corn is used on a large scale to produce ethanol to replace fossil gasoline. Palm oil
is used to produce biodiesel. This resulted in the fuel versus food discussion. Large
areas of rainforest have been cut down in Malaysia to create space for palm oil
production. On top of this, some production processes for Bio-fuels require a large
(fossil) energy input for logistic reasons and to upgrade the fuel to an acceptable
quality. A well know example is the distillation of the water ethanol mixture to
produce fuel quality ethanol. Some fast growing biomasses require nitrogen
fertilizers, which are normally produced from natural gas. This has a negative
effect on the overall CO2 balance of the Bio-fuel. To deal with these issues
Sustainability Criteria were introduced. These criteria include issues like the
greenhouse gas balance, competition with food, biodiversity and local
environmental issues. Woody biomass performs very well on these criteria,
especially when the wood is converted into a low carbon fuel like methane.

Introduction
3
1.3 Biomass gasification
The term gasification applies to processes which convert solid or liquid fuels into a
combustible gas at high temperature. The heat required for the heating of the fuel
and the endothermic gasification is supplied by the combustion of part of the fuel
(Direct gasification) or comes from an external source (Indirect or Allothermal
gasification). The MILENA gasifier described in this thesis belongs to this latter
category. Background information on biomass gasification is given in Chapter 2.
1.4 Bio-SNG as renewable fuel
Natural gas plays an important role as an energy source world wide. According to
the Energy Information Administration of the U.S. Government natural gas
consumption in 2003 was one-quarter of the world primary energy consumption
and is expected to rise by 2.4 percent per year [5].
Natural gas is a relatively clean primary energy carrier and is therefore often
the fuel of choice in many regions of the world. The share of natural gas in the
world energy consumption is expected to rise.
In the Netherlands natural gas contributes nearly 50% of the primary energy
supply as it is by far the most popular fuel for heating of buildings.
Replacing part of natural gas by a Substitute Natural Gas (SNG) or Synthetic
Natural Gas, produced out of a sustainable primary energy source, with the same
properties as natural gas makes the implementation of sustainable energy easy as
natural gas grids are widely spread in the Netherlands and in many other countries.
Sustainable electricity has become popular in recent years. In 2005 7 percent
of the consumers in the Netherlands used sustainable electricity. The number
reduced to 5% in 2007. This was a consequence of the fact that the subsidies for
production of electricity out of biomass became less available. Presently the
majority of the growth in renewable electricity generation is due to wind power.
The majority of the electricity out of biomass is from co-combustion in coal fired
plants.

Chapter 1
4
Replacing heat produced from fossil fuel with sustainable heat on a household scale
is more challenging than replacing fossil electricity with sustainable electricity.
Direct local combustion of biomass can be attractive from an efficiency point of
view but local biomass boilers (on household scale) would require extensive and
expensive flue gas treatment equipment to keep emissions at an acceptable level
(compared to emissions from large power plants or the presently used local natural
gas fired boilers). Decentralized biomass fired boilers or combined heat and power
plants require a district heating network. In most cities district heating network is
not present and the installation of such a network is expensive.
A Substitute Natural Gas can be produced from biomass with a high
efficiency and with low emissions from the SNG plant (comparable with modern
power plants). Biomass transport can be limited to the central SNG plants, which
would be located next to harbors.
Bio-SNG is the obvious choice for sustainable heating of houses in the
Netherlands and in many other countries. It is likely that in the near future
conventional house heating boilers will be replaced by natural gas fired Micro
Combined Heat and Power plants (Micro-CHP), which increases overall energetic
efficiency compared to local heat production and decentralized electricity
production. The production process of Bio-SNG via gasification is described in
chapter 3.
1.5 CO2 balance of Bio-SNG
Biomass (wood) with 20 wt.% of moisture has, by approximation, the composition
of C6H12.5O5.75. In theory biomass can be converted directly into a mixture of CH4
and CO2 by the following exothermic reaction:
C6H12.5O5.75 → 3.12 CH4 + 2.88 CO2 (1.1)

Introduction
5
After removal of CO2 the Bio-SNG can be injected into the gas grid. This
means that almost half of the carbon (on mol basis) in the fuel is separated as pure
CO2 and is available for CO2 sequestration. This makes the production of SNG
carbon negative. Figure 1-1 shows an indicative overall CO2 balance, including
emissions from harvesting and transport, for a Bio-SNG production facility based
on the MILENA indirect gasifier as described is this thesis.
Harvesting, transport,
pre-treatment
Gasification + upgrading
Bio-SNG consumers
CO2 balance
CO2 250
Bio-fuel Bio-SNG
CO2 sequestration
Photosynthesis
CO2 30
CO2 50
CO2 100
100 CO2
wood
CO2 70
Fossil oil
Figure 1-1: Indicative CO2 balance for Bio-SNG system based on MILENA gasification.
1.6 Bio-SNG development at ECN
The Energy research Centre of the Netherlands (ECN) became interested in the
production of Bio-SNG out of biomass already in the nineties. The original interest
in SNG was based on the possibility to use biomass to store sustainable hydrogen
coupled to sustainable carbon from biomass. This was achieved by the
hydrogasification process. Several studies and some experimental work were done
on the hydrogasification process [6]. The hydrogasification process uses hydrogen
as gasification agent in a pressurized reactor operating around 30 bara and 800°C,

Chapter 1
6
where no external heat or oxygen supply is required. Hydrogen reacts exothermally
with the carbon in the biomass to form methane. The hydrogasification
development was not continued, because it became clear that the availability of a
surplus of sustainable hydrogen was not likely for the near future. As a second
option the production of SNG using more conventional gasification processes for
the production of SNG gained interest.
ECN did the first SNG production tests using a steam-oxygen blown lab-
scale gasifier in 2003. These first results were promising and led to the continuation
of the research program. Indirect gasification was identified as most suitable
gasification technology for the production of SNG [7]. Indirect gasification
technology was by that time already in development. Further research concentrated
on the production of SNG from gas coming from the ECN MILENA gasifier.
1.7 Objective of the MILENA development
The objective of the MILENA SNG development at ECN is to develop an
economically viable and up scalable process for the production of Bio-SNG from
cellulosic biomass and to bring this development to the market. The design of the
gasifier is made such that it should be up scalable to at least 100 MWth.
The MILENA producer gas should contain a high concentration of CH4 (>12
vol% on dry basis), because this has a positive effect on overall efficiency to SNG.
The N2 content in the producer gas should be below 3 vol% (dry basis), because N2
dilutes the final Bio-SNG.
The technology will focus on woody biomass to start with, because
experiences at ECN and elsewhere (the FICFB gasifier in Güssing) have shown
that woody biomass is an ideal fuel for an indirect gasifier. Figure 1-2 shows the
foreseen scale-up steps and demonstration trajectory.
The demonstration of the technology is done with commercial partners, as
they are essential for the implementation after a successful demonstration. One of
the demonstration steps is a 10 MWth MILENA gasifier in combination with

Introduction
7
OLGA gas cleaning and a gas engine. The 10 MWth Combined Heat and Power
(CHP) demo is considered to be a crucial intermediate step towards commercial
Bio-Methane plants. The CHP demo, however, is also considered to be a
demonstration of a commercial size CHP unit and therefore serves two goals. After
a successful CHP demonstration, further scale-up to a 50 MWth Methane
demonstration unit is foreseen.
YEAR 2009 2010 2011 2012 2013 2014 2015 2016 2017
CONSTRUCTION + DEMONSTRATION
CHP DEMO PILOT TESTS COMMERCIAL OPERATION
LAB-SCALE TESTS PILOTCONSTRUCTION + DEMONSTRATION
SNG DEMO COMMERCIAL OPERATION
2018
Designdata
10-15 MWth
0.01 MW 50 MWth
1
2
1 MWth
Figure 1-2: Foreseen scale up and demonstration trajectory for MILENA technology.
The development focuses on high overall energetic efficiency, because biomass is
seen as a valuable primary energy source. The aim is to have a net overall energetic
efficiency from fresh woody biomass to SNG of more than 70% (LHV basis).
1.8 Objective of this thesis
This thesis has two main objectives:
1) Quantify the differences in overall efficiency from wood to Bio-SNG with
other biomass gasification processes to prove that the overall efficiency from
wood to Bio-SNG is significantly higher than for other biomass gasification
processes that will be commercially available within ten years.
2) Generate verified relations that are required to calculate the gas composition,
the mass balance and the energy balance for an indirectly heated biomass
riser gasifier like the MILENA.

Chapter 1
8
The comparison on overall efficiency basis of indirect gasifiers with alternatives
like Entrained Flow and Circulating Fluidized bed gasifiers is described in chapter
4.
The empirical relations used in the model to predict hydrocarbon yields and
carbon conversion are based on a wide range of experiments described in chapter 7.
1.9 References
1. BP, 2006. BP Statistical Review of World Energy 2006, available at
www.bp.com.
2. Lako, P., Kets, A., 2005. Resources and future avilability of energy sources; a
quick scan, Petten, the Netherlands, ECN, ECN-C--05-020.
3. IEA, 2008. World Energy Outlook 2008, International Energy Agency, Paris,
France, ISBN 978-92-64-04560-6.
4. Dornburg, V., Faaij, A., Verweij, P., Langeveld, H., van de Ven, G., Wester,
F., et al., 2007. Biomass Assessment: Global biomass potentials and their links
to food, water, biodiversity, energy demand and economy, main report
(climate change scientific assessment and policy analysis), the Netherlands
Environmental Assessment Agency (MNP), Bilthoven, The Netherlands
5. EIA (Energy Information Administration), 2006. International Energy
Outlook 2006, Washington, DC, U.S. Department of Energy, DOE/EIA-
0484(2006).
6. Mozaffarian, M., Bracht, M., den Uil, H., van der Woude, R., 1999. Hydrogen
conversion in substitute natural gas by biomass hydrogasification, Petten, the
Netherlands, ECN, ECN-RX--99-016.
7. Mozaffarian, H., Zwart, R.W.R., Boerrigter, H., Deurwaarder, E., Kersten,
S.R.A., 2004. Green gas as SNG (synthetic natural gas); a renewable fuel
with conventional quality. In: Science in Thermal and Chemical Conversion,

Introduction
9
30 August - 02 September 2004, Vancouver, Canada; also available at
www.ecn.nl as report ECN-RX-04-085.

Chapter 1
10

Chapter 2
2 Background on Biomass gasification
Abstract
This chapter describes the biomass gasification process in fluidized bed reactors
and the typical problems (tars and agglomeration of bed material) related to
biomass fluidized bed gasification. Indirect gasifiers and the MILENA process are
described in more detail.
A clear definition of Cold Gas Efficiency (CGE) is given, because the
recycle of char and tar flows creates several options to define this efficiency.
2.1 Biomass gasification technologies
Gasification processes have been in use since the 1800s. The first application was
the production of town gas from coal. From the 1920s gasification was used to
produce synthetic chemicals. Most well known is the production of Fischer
Tropsch oil out of synthesis gas in Germany to run the military machinery during
the Second World War and, more recently in South Africa.
Nowadays, commercial coal gasifiers are in operation on a scale over 1 GWth
[1]. The number of gasifiers based on biomass as a fuel is still limited. The
technology of gasification to liquid and gaseous fuels on the basis of biomass as

Chapter 2
12
feedstock will get a new boost as it opens the road to produce a green alternative to
fossil fuel based energy carriers
The term gasification is applied to processes which convert solid or liquid
fuels into a combustible gas at high temperature. The heat required for the heating
of the fuel and to energize the endothermic gasification reactions is supplied by the
combustion of part of the fuel (Direct gasification) or is supplied from an external
source (Indirect or Allothermal gasification).
Gasifiers can be divided into high temperature gasifiers (typical 1300 -
1500°C) which produce a syngas and medium temperature gasifiers (typical 850°C)
which produce a producer gas. Syngas contains almost no hydrocarbons like
methane. Gas coming from medium temperature gasifiers contains on energy basis
up to 50% of hydrocarbons (mainly CH4, C2H4 and C6H6). The producer gas from
medium temperature gasifiers also contains some tars. Tars are heavy
hydrocarbons, which can cause fouling problems when the gas is cooled. Producer
gas also contains several other pollutants like H2S, COS, thiophenes, NH3, HCl,
HCN and dust which need to be removed before application of the gas.
For processes like the synthesis of Fischer Tropsch Diesel or methanol the
presence of large quantities of hydrocarbons is unwanted, because only CO and H2
(and probably C2H4 in the case of Fischer Tropsch synthesis) are converted into the
desired product. Next to the fouling due to heavy hydrocarbons, the other
hydrocarbons have negative effects on the downstream catalytic process due to the
risk of deactivation. For the production of SNG the presence of hydrocarbons is an
advantage, because most of the hydrocarbons are present as CH4 and the other
hydrocarbons can be converted into methane with a higher efficiency than the
conversion of syngas into CH4.
The most common type of gasifier for the production of syngas is the
Entrained Flow (EF) gasifier. EF gasifiers operating on coal are commercially
available from large companies like Shell, General Electric and Siemens. The
typical scale is over 500 MWth. The gasifiers are always operated at high pressure
(typically 30 bar), because the syngas is needed at high pressure while the

Background on Biomass Gasification
13
compression of a solid requires less energy than the compression of a gas. Feeding
pulverized coal at elevated pressures using lock hopper systems is proven
technology, which is not the case for biomass. The solid fuel (mostly coal) is
pulverized and pneumatically fed into the Entrained Flow gasifiers. N2 is normally
used as feeding gas. O2 (diluted with steam) is mostly used as gasification agent.
The gasifier is always operated above the ash melting temperature to keep the ash
in the liquid phase in the gasifier. The syngas produced by the gasifier is quenched
with cooled syngas to solidify the ash.
A well known example of an Entrained Flow gasifier is the Shell gasifier in
Buggenum, where the produced syngas is fired in a combined cycle to produce 253
MW of electricity. The fuel for this plant is normally coal, but co-gasification with
up to 30 mass% of biomass has been demonstrated [2].
Entrained Flow gasifiers can in principle be used to gasify biomass if the
particles are milled. However, milling of biomass particles is energy intensive and
the pneumatic feeding of those particles can be problematic. Torrefaction is a
biomass pretreatment step under development to reduce the required milling energy
and to increase the energy density of the biomass to make a.o. the transport more
economic [3]. Another pretreatment option is the production of bio-oil by the flash
pyrolysis process. Bio-oil as a liquid can easily be fed into a gasifier using a high
pressure pump [4]. The disadvantage of both pretreatment steps is the energy loss
caused by the thermal conversion of the fresh biomass into a more manageable
fuel. The overall efficiency (including electricity consumption) of both
pretreatment methods is still not known, as both processes are still under
development and data from commercial scale demonstration units are not yet
available. There are no known demonstrations of EF gasifiers using only biomass
or pre-treated biomass as a fuel. There is a strong interest from industry in using
this coal derived gasification technology for biomass.
The medium temperature gasifiers can be divided in fixed bed gasifiers and
fluidized bed gasifiers. The fixed bed gasifiers can be separated in Downdraft and

Chapter 2
14
Updraft gasifiers. Both are in use for biomass gasification as well. Figure 2-1
depicts the basic operating principles of typical Updraft and Downdraft gasifiers.
Oxidation
Drying
Oxidation
Pyrolysis
Producer Gas
Biomass
Reduction
Air
Air Air
Producer Gas
Drying
Pyrolysis
Reduction
Biomass
Updraft Gasifier
Downdraft Gasfier
Figure 2-1: Schematic comparison of Updraft and Downdraft Gasification
Downdraft gasifiers are widely in use for small scale CHP generation. The
typical size of a gasifier is between 100 and 1000 kWth input. The fuel is normally
dry wood. The gas is mostly used to fuel a gas engine. The advantage of this
technology is that the produced gas is rather clean (low tar and dust content) and
the technology is relatively simple. The gasifiers require a well defined dry fuel for
continuous and reliable operation. The carbon content of the ash coming from the
bottom of the gasifiers normally is relatively high (>10 wt.%), because the fuel
conversion in the gasification section is not complete. The Downdraft technology is
not well suited for scaling up. One of the reasons is that scale up requires an
increase in bed diameter. A large bed diameter increases the risk of channeling in
the bed and leads to inhomogeneous supply of oxygen to the gasification zone. If a
channel in the bed occurs, a larger than average part of the gas goes through such a
channel and not through the char bed. The char bed should help to reduce the tar

Background on Biomass Gasification
15
concentration in the gas, but if the gas ‘escapes’ through the hole the tar
concentration increases and downstream equipment gets fouled.
Updraft gasifiers are better suited for scale up and less sensitive regarding
moisture content and geometry of the fuel, but produce a lot of tar. If tar removal
technology is applied the gas can be fired in a gas engine. Tar is normally removed
in combination with water. This water stream requires extensive cleaning before it
can be disposed in a sewer system. The overall efficiency of the Updraft process
can be high because of the complete conversion of the fuel and the low outlet
temperature of the gasifier. The tar removal and water clean up make the process
complex and too expensive for small scale (< 1 MWth). A successful example of an
Updraft gasifier is the Harboøre plant in Denmark [5].
Updraft and Downdraft Fixed Bed biomass gasifiers are operated in ‘dry’
mode. This means that the ash in the gasifiers is not a molten state. This is achieved
by keeping the operating temperature below the melting temperature of the ash.
Both types of gasifiers use air as gasification agent. For the production of SNG the
air needs to be replaced by oxygen, as the nitrogen in the gas dilutes the final
product. Replacing air by oxygen, however, is not an option, because this would
result in a local increase in temperature, which increases the risk of ash melting.
Fixed Bed gasifiers are not seen as an option for Bio-SNG production because of
the inability of this type of biomass gasifier to produce a nitrogen free gas.
Fluidized Bed gasifiers, as described in the next paragraph, can be operated
in such way that they produce a nitrogen free or nitrogen poor gas and the
technology is suitable to be scaled up to several hundreds of MW.
2.2 Fluidized bed gasification
Fluidized Bed gasifiers can be divided into three main categories: Bubbling
Fluidized Bed (BFB), Circulating Fluidized Bed (CFB) and Indirect or Allothermal
twin bed concepts. All Fluidized Bed gasifiers use a bed material. That can be
ordinary sand, the ash from the fuel or a catalytically active bed material like
Chapter 2
16
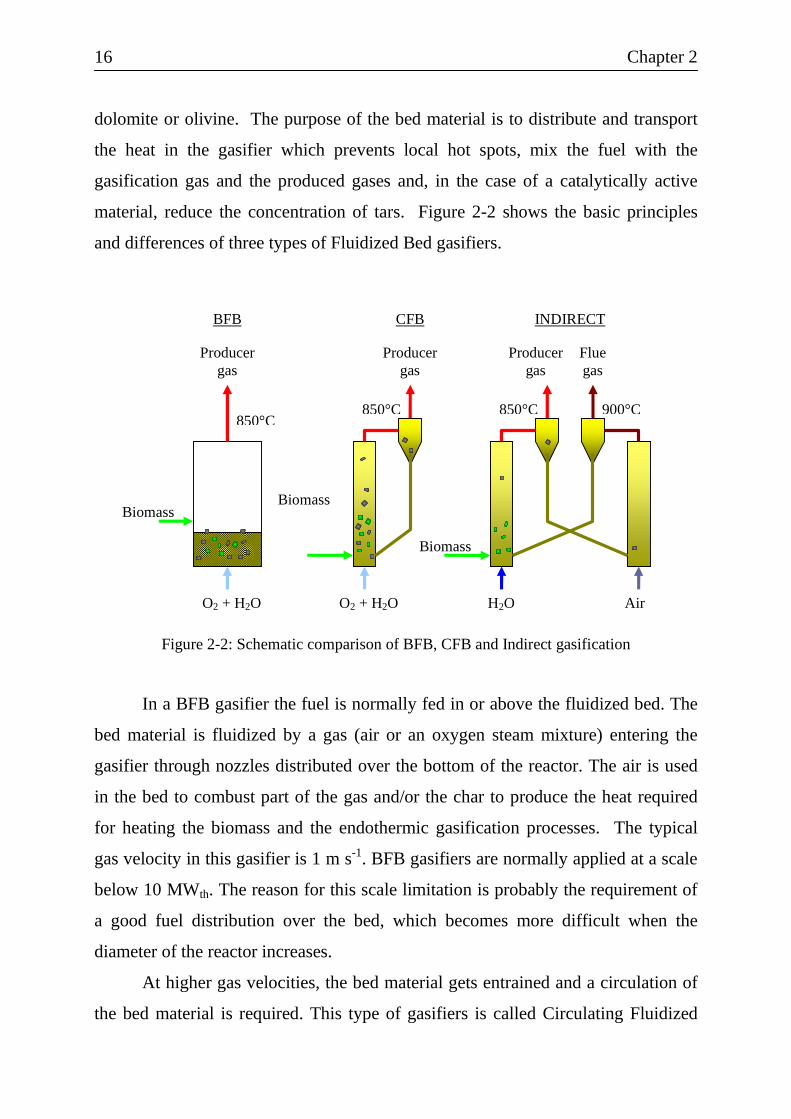
dolomite or olivine. The purpose of the bed material is to distribute and transport
the heat in the gasifier which prevents local hot spots, mix the fuel with the
gasification gas and the produced gases and, in the case of a catalytically active
material, reduce the concentration of tars. Figure 2-2 shows the basic principles
and differences of three types of Fluidized Bed gasifiers.
O2 + H2O
Biomass
O2 + H2O
Biomass
Biomass
Air H2O
Producer gas
Producer gas
Producer gas
Flue gas
BFB CFB INDIRECT
850°C 850°C 850°C 900°C
Figure 2-2: Schematic comparison of BFB, CFB and Indirect gasification
In a BFB gasifier the fuel is normally fed in or above the fluidized bed. The
bed material is fluidized by a gas (air or an oxygen steam mixture) entering the
gasifier through nozzles distributed over the bottom of the reactor. The air is used
in the bed to combust part of the gas and/or the char to produce the heat required
for heating the biomass and the endothermic gasification processes. The typical
gas velocity in this gasifier is 1 m s-1. BFB gasifiers are normally applied at a scale
below 10 MWth. The reason for this scale limitation is probably the requirement of
a good fuel distribution over the bed, which becomes more difficult when the
diameter of the reactor increases.
At higher gas velocities, the bed material gets entrained and a circulation of
the bed material is required. This type of gasifiers is called Circulating Fluidized

Background on Biomass Gasification
17
Bed (CFB) gasifiers. Typical velocity in the gasifier is normally between 3 and 10
m s-1. The entrained bed material and the, not completely, converted fuel particles
(char) are removed from the produced gas by a cyclone or another separation
device. The particles are normally returned to the bottom of the gasifier via a non-
mechanical valve. This ‘non-mechanical’ valve can be a stand pipe which also
serves the function of preventing gas leakage from the bottom of the riser into the
solids outlet of the cyclone. Foster Wheeler has successfully demonstrated this type
of gasifier on a commercial scale in Lahti in Finland and Ruien in Belgium.
Separating the gasification of the biomass and the combustion of the
remaining char leads to the Indirect or Allothermal gasification process as shown in
the right part of figure 2-2. The biomass fed to the ‘gasifier’ is converted into a gas
and char (pyrolysis). The heat required for the heating of the biomass comes from
the combustion reactor. This heat is transported by the circulating bed material.
Char and bed material are separated from the gas by a solid gas separation device
(e.g. a cyclone). The produced gas exits the gasifier to the gas cleaning. The char
and bed material are fed to the combustion reactor. The char is combusted to
produce the required heat for the gasification reactor. The heated bed material is
returned to the gasifier reactor again. Indirect gasification will be explained in more
detail in paragraph 2.5.
2.3 Tar
All biomass gasifiers which produce a gas containing methane (e.g. Fluidized Bed
gasifiers) produce tar as well [6]. The syngas from gasifiers operating above
≈1200°C, like Entrained Flow gasifiers, contains almost no methane and tar.
Tar is a complex mixture of (poly-aromatic) hydrocarbons which varies in
amount and composition. Tar consists largely of aromatic compounds [7]. The
general definition is "hydrocarbons with molecular weight higher than benzene".
The tar properties are influenced by gasifier operating conditions as
temperature, residence time, etc. and the presence of a catalyst like olivine or

Chapter 2
18
dolomite. Tars can cause fouling of downstream equipment and produce polluted
condensation water. Therefore, the type and concentration of tars in producer gas
are major issues in operating biomass gasification plants. Figure 2-3 shows an
example of tar related problems in downstream equipment. The picture to the left
shows a demister behind a scrubber fouled with tar and dust. The right one shows
water from a wet scrubber fouled with tar and dust.
Figure 2-3: Examples of tar fouling problems
Several classification systems for tars are in use. Evans and Milne defined
tars based on the formation conditions [7]. Primary tars are formed by
decomposition of the building blocks of biomass and contain oxygen in significant
amounts. Secondary and tertiary tars are formed by destruction of primary tar
compounds and recombination of fragments.
The amount or concentration of tars is often not the most important
parameter in running a biomass gasification plant. The type of tars in combination
with the concentration is of higher relevance. ECN has set up a tar classification
system based on the physical tar properties like water solubility and dew point of
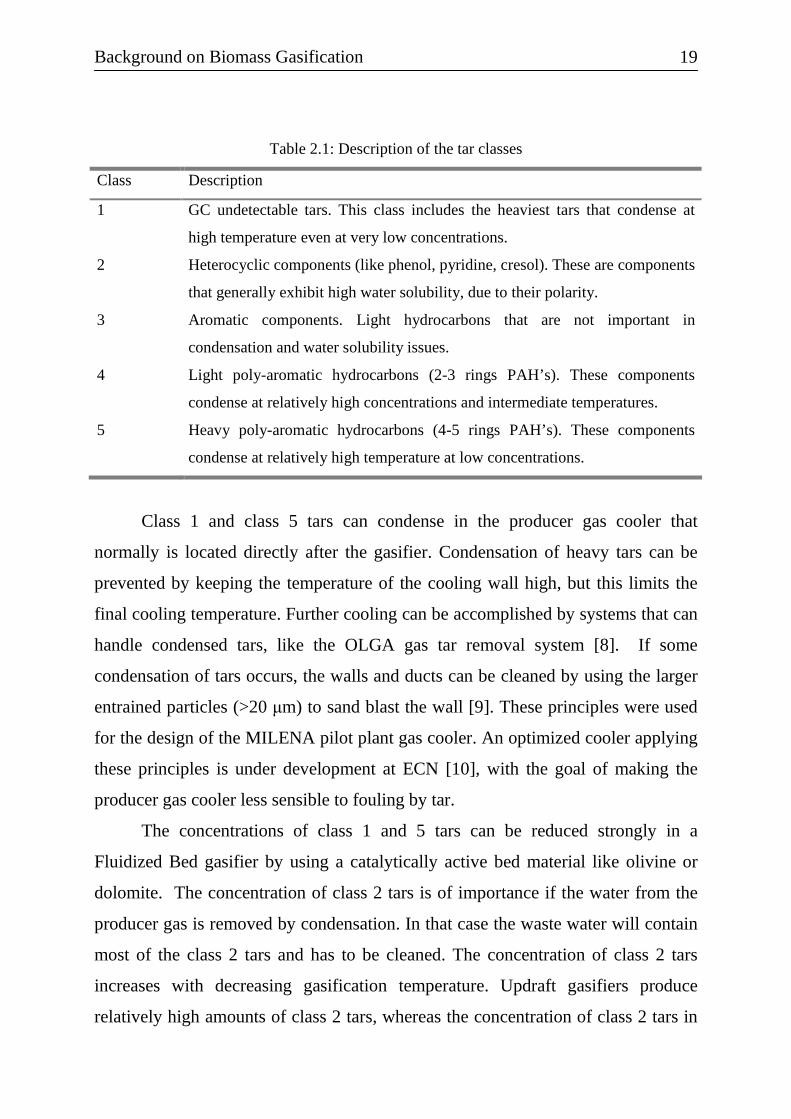
the tar components. Table 2.1 gives a description of the five tar classes in the
classification system with the focus on the tar properties.
Background on Biomass Gasification
19
Table 2.1: Description of the tar classes
Class Description
1 GC undetectable tars. This class includes the heaviest tars that condense at
high temperature even at very low concentrations.
2 Heterocyclic components (like phenol, pyridine, cresol). These are components
that generally exhibit high water solubility, due to their polarity.
3 Aromatic components. Light hydrocarbons that are not important in
condensation and water solubility issues.
4 Light poly-aromatic hydrocarbons (2-3 rings PAH’s). These components
condense at relatively high concentrations and intermediate temperatures.
5 Heavy poly-aromatic hydrocarbons (4-5 rings PAH’s). These components
condense at relatively high temperature at low concentrations.
Class 1 and class 5 tars can condense in the producer gas cooler that
normally is located directly after the gasifier. Condensation of heavy tars can be
prevented by keeping the temperature of the cooling wall high, but this limits the
final cooling temperature. Further cooling can be accomplished by systems that can
handle condensed tars, like the OLGA gas tar removal system [8]. If some
condensation of tars occurs, the walls and ducts can be cleaned by using the larger
entrained particles (>20 µm) to sand blast the wall [9]. These principles were used
for the design of the MILENA pilot plant gas cooler. An optimized cooler applying
these principles is under development at ECN [10], with the goal of making the
producer gas cooler less sensible to fouling by tar.
The concentrations of class 1 and 5 tars can be reduced strongly in a
Fluidized Bed gasifier by using a catalytically active bed material like olivine or
dolomite. The concentration of class 2 tars is of importance if the water from the
producer gas is removed by condensation. In that case the waste water will contain
most of the class 2 tars and has to be cleaned. The concentration of class 2 tars
increases with decreasing gasification temperature. Updraft gasifiers produce
relatively high amounts of class 2 tars, whereas the concentration of class 2 tars in

Chapter 2
20
the gas from a Fluidized Bed gasifier is lower but strongly temperature dependent.
In the case of Fluidized Bed gasifiers the concentration of class 2 tars can be
significantly reduced by using a catalytically active bed material.
Reported measured tar concentrations are hard to compare for different
installations because the tar measurement method is often not clear. To solve this
problem a standard tar measurement method (the Tar Protocol) has been developed.
A draft version of this tar measurement standard and background information can
be found at the website www.tarweb.net. ECN uses the Solid Phase Adsorption
(SPA) method to measure the tar concentration behind Fluidized Bed gasifiers like
in the case of the MILENA gasifier. The results using this method agree with the
Tar Protocol for compounds from phenol to pyrene [11]. The concentrations of
heavier tar molecules are relatively low if the gasification temperature in a
Fluidized Bed gasifier is above 800°C [12]. The SPA method was selected because
the sampling of the tars is relatively simple.
The tar dew point is more relevant than the tar concentration. The tar dew
point is the highest temperature of the gas at which condensation of tar components
occurs. The tar dew point can be calculated from the gas composition or directly be
measured. The ECN website www.thersites.nl provides a useful tool to calculate
the tar dew point. Direct measurement of the tar dew point is possible with devices
like the tar dew point analyzer [13].
The tar concentration and the tar dew point can be reduced in a Fluidized
Bed gasifier by using a catalytically active bed material like olivine and dolomite as
the most common catalytic bed materials. Especially olivine has become of interest
because of the success of the FICFB gasifier in Güssing where it is used as the
standard bed material. The reduction of the tar concentration in the gasifier is in
literature described as a “primary measure”. A “secondary measure” is defined as a
measure taken downstream the gasifier like thermal cracking, catalytic cracking or
scrubbing.
Thermal cracking reduces the cold gas efficiency because the gas needs to be
heated up to above 1200°C. Normally air or oxygen is added to the gas to increase

Background on Biomass Gasification
21
the temperature by combustion of part of the produced gas. Under these conditions
also methane is broken down, which has a negative impact on the calorific value of
the gas. Thermal tar cracking is often applied in combination with a chemical
quench. In this case the latent heat in the gas is used to gasify the char which
remains after pyrolysis. A classical Downdraft gasifier is a good example of the
combination of thermal tar cracking and a chemical quench using char. Another
example is the Carbo-V process [14].
Much research is done on catalytic tar cracking directly downstream the
gasifier. Catalytic tar cracking has the advantage that the temperature of the gas
does not need to be increased too much which has a positive influence on the Cold
Gas Efficiency (CGE). The catalysts that are used, mostly nickel based, are
sensitive to the pollutants in producer gas (e.g. sulphur and dust). Several projects
were done to demonstrate that it is possible to operate a catalytic tar cracker on raw
producer gas [15], but so far catalytic tar crackers were not successful in
commercial operation. Deactivation of the (expensive) catalyst is still a major
problem.
Catalytic tar cracking can be an interesting option if a cheap catalyst can be
applied, because replacement of the deactivated catalyst becomes less expensive.
Char from biomass is such a catalyst. Several tests at ECN and other institutes
showed that under the right process conditions char can reduce the tar
concentration to some extent. Experiments at ECN showed that a concentration of
fine char particles of 1500 mg Nm-3, a gas residence time of 1.5 to 3.5 s and a
temperature above 800°C were sufficient to reduce the concentration of heavy tars
by 80 - 90% [16]. The settling chamber in the MILENA gasifier, at that time called
the STAR gasifier, was originally intended to create a zone with a high char
concentration. Hydrodynamic testing showed that it was not possible to reach the
required char concentration in the MILENA settling chamber. A new design of a
stand alone reactor was made to achieve the required high char concentration and
sufficient contact time. This reactor was called the TREC (Tar REduction by Char)
reactor [17] and was constructed and tested in the EU project “Green Fuel Cell”

Chapter 2
22
[18]. The TREC reactor is a kind of granular bed type. The TREC reactor removes
fly ash and char from producer gas which flows in radial direction through the bed.
The char that is collected between granules acts as catalyst for tar cracking. The
effectiveness of TREC can be enhanced by a catalytically active loading. The
TREC reactor can reduce the tar dew point from 350°C down to 170°C, but this is
not sufficient for most applications (e.g. gas engines). The TREC reactor was also
tested with a (inexpensive) catalytically active bed material (olivine), that resulted
in a tar dew point below 100°. The TREC reactor is possibly an attractive option
for tar removal in the MILENA SNG system. The TREC development will
probably be continued in the future.
ECN has selected tar removal technology as a secondary measure for further
tar reduction. Several wet tar removal systems were developed and tested [6, 19].
The Updraft gasifier in Harboøre successfully applies a wet electrostatic
precipitator (ESP). Because of the positive experiences in Harboøre, tests have
been done at ECN to check whether such a system was also applicable in
combination with Fluidized Bed gasifiers. The system using a wet ESP was able to
reduce the tar dew point to a sufficiently low level such that the gas can be
combusted in a gas engine. The tar (and dust) ended up in the water system and the
cleaning of the water appeared to be problematic and expensive [6]. ECN decided
to switch to an oil based tar removal system named OLGA. The OLGA tar removal
system is operated at a temperature above the water dew point to prevent the
mixing of water and tar. The tar can be removed from the producer gas down to a
tar dew point temperature below 0°C. Water soluble components (class 2 tars) are
almost completely removed. Water is condensed out of the gas downstream OLGA.
Water is condensed from the gas at a temperature above the tar dew point, such that
condensation of tars in the water is prevented. A small amount of benzene in the
gas will dissolve in the condensed water. The benzene can be removed from the
water by active carbon before disposure.
The tar concentration and the tar dew point in the gas produced in the
MILENA gasifier are reduced by a combination of primary and secondary

Background on Biomass Gasification
23
measures. Olivine is often used for the first reduction of the tar dew point. This
already simplifies the gas cooling. The tar dew point is further reduced by removal
of the tars in the OLGA gas cleaning system. The removed tars can be recycled to
the gasifier, preferably to the combustion zone.
2.4 Agglomeration
One of the major operational problems in Fluidized Bed combustors and gasifiers is
agglomeration of the bed material. Bed agglomeration can result in de-fluidization
of the bed which normally leads to local temperature deviations. This can result in
local melting and will finally lead to a complete shutdown of the installation.
Agglomeration is caused by melting of the inorganic components in the fuel.
Especially biomass fuels contain inorganic components which can cause bed
agglomeration. The most well known inorganic component to cause agglomeration
is potassium (K). Potassium and silicon can form a low melting potassium silicate
eutectic. Silicon is normally present in large quantities from the (silica) sand often
used as bed material and/or sand present in the biomass.
Two different types of agglomeration were identified during gasification and
combustion tests in the ECN Fluidized Bed facilities [20]. Figure 2-4 shows the
basic difference between type I and type II agglomeration.

Chapter 2
24
Inorganic components in gas phase
Type I, Coating-induced
bed particle
Sintering of coated particles
Coated bed particle
bed particle
Sticky / molten ash particles
Molten ash between bed particles
Type II, melt-induced
Figure 2-4: Basic principles for type I and type II bed agglomeration
Coating induced agglomeration is a result of the interaction between
inorganic components in the gas phase (e.g. potassium) and the bed material (e.g.
silicon). The coating formed can be sticky and cause agglomeration of the
particles. The typical coating layer thickness is between 2 and 20 µm. The tendency
to agglomerate increases with increased coating layer thickness. Type I
agglomeration can be suppressed by preventing the formation of a ‘thick’ coating.
This can be realized by replacing part of the bed material during operation.
Replacing the bed material with a more ‘inert‘ bed material is not always an option,
because many biomass (waste) streams contain large quantities of silica sand.
Melt induced agglomeration is observed when a fuel is gasified with a low
ash melt temperature, like grass, or when unstable operation of the gasifier has led
to temperature excursions. Preventing melt induced agglomeration is possible by
keeping the operating temperature of the fluidized bed well below the ash melting
point and by preventing local hot spots. Local hot spots are best prevented by stable
operation and a high bed material to char/fuel ratio.

Background on Biomass Gasification
25
2.5 Indirect gasification
The MILENA gasifier is an Indirect or Allothermal gasifier. The conversion of the
fuel is being done in two separate reactors. For this reason this type of reactor is
sometimes called a Twin Bed gasifier. The first reactor is called the gasifier (left
reactor in Figure 2-2) and the second reactor is called the combustor. The processes
in the gasifier are endothermic and the processes in the combustor are exothermic.
In the ‘gasifier’ reactor the biomass is pyrolysed or degasified by hot bed material
coming from the second reactor. The typical gasification temperature is 850°C. The
gasifier is normally fluidized by steam and the gas produced by the gasification
process. The producer gas and the solids are separated, after which the producer gas
is led to a gas cooler. The solids (bed material and char) are returned to the
combustor reactor. The char is combusted to heat up the bed material up to a
temperature of typically 930°C. The heated bed material is sent back to the
gasifier.
The main advantages of Indirect gasification over Direct gasification
processes like BFB and CFB gasification is the higher heating value of the
produced gas and the complete conversion of the fuel. The heating value of the gas
produced in an Indirect gasifier is higher than the heating value of the gas produced
from an air blown Direct gasifier, because the air used in a Direct gasifier dilutes
the producer gas with N2 and CO2. Indirect gasification is a high temperature
pyrolysis process, so no air or oxygen is required. The nitrogen content in the
producer gas from an Indirect gasifier can be kept below 5 vol.%. The small
amount of nitrogen in the gas originates from the nitrogen purge for the feeding
screw and a small amount of air/flue gas in-leak from the combustor into the
gasifier. The nitrogen content can be lowered by using CO2 as a purge gas or by
minimizing the leakage between combustor and gasifier.
The conversion of biomass in a Direct gasifier like a BFB or CFB gasifier is
not complete, because the gasification of the char that remains after the
devolatization of the biomass is a slow process at the typical operating temperature.

Chapter 2
26
The residence time in a BFB or CFB is far from sufficient to gasify all the char
[21]. An acceptable conversion can only be achieved by subsequent combustion of
the char as it is done in an Indirect gasifier so that the total process conversion is
complete.
Well known examples of Indirect gasifiers are the FICFB gasifier developed
by the Vienna University of Technology [22] and the SilvaGas process developed
at Battelle’s Columbus Laboratories [23]. The FICFB process was successfully
demonstrated in Güssing (Austria) on an 8 MWth scale [24]. A second commercial
FICFB gasifier was built in Oberwart (Austria) and several others are under
construction. The FICFB gasification technology was also selected for the Bio-
SNG demonstration project in Gothenburg called GoBiGas. The SilvaGas process
was demonstrated in Vermont (US) [23], but this demonstration was cancelled after
a relatively short period. Unfortunately the process data are insufficiently
documented. The SilvaGas process is continued by Biomass Gas & Electric.
Several large commercial projects are under construction in the U.S. The ECN
OLGA tar removal technology, delivered by Dahlman will be used for gas cleaning
in these initiatives.
2.6 MILENA gasification process
The Energy research Center of the Netherlands developed CFB gasification
technology for approximately 12 years [21]. The experience gained with modifying
and operating a 500 kWth pilot plant led to the development of the Indirect
MILENA gasifier. The gasifier contains separate sections for gasification and
combustion. The gasification section consists of three parts: gasifier riser, settling
chamber and downcomer. The combustion section consists of only one part. The
red arrows in Figure 2-5 represent the circulating bed material. The processes in the
gasification section will be explained first.

Background on Biomass Gasification
27
Steam
Biomass
Circulating bed material
Biomass particle
Char particle
1
2
3
4
5
6
1 – Riser 2 – Settling chamber 3 – Downcomers (number depending on scale) 4 – Bubbling Fluidized Bed combustor 5 – Freeboard 6 – Sand transport zone
Producer gas (CO, CO2, H2, H2O, CH4, C2H4, C6H6, etc.)
± 850°C
Pre-heated combustion air 300 - 500°C
Tar + dust from gas cleaning
Flue gas
± 850°C
Secondary air
Secondary air
Figure 2-5: Simplified scheme of MILENA gasification process.
Biomass (e.g. wood) is fed into the gasifier riser. A small amount of
superheated steam is added from below to create a linear gas velocity of
approximately 0.5 m s-1 in the bottom part of the riser gasifier. Steam can be
replaced by air if nitrogen dilution of the producer gas is not a problem (e.g. if the
gas is fired in a gas engine). Hot bed material (typically 925°C sand or olivine of
0.2 – 0.3 mm) enters the gasifier riser from the combustor through a hole in the
gasifier riser (opposite of the biomass feeding point). The typical bed material
circulation rate on a mass basis is 40 times the amount of biomass fed to the
gasifier riser. The bed material heats the biomass to 850°C in the gasification
section. The heated biomass particles degasify and are partially converted into gas.
The volume created by the gas from the biomass results in a vertical velocity
increase over the length of the gasifier riser to approximately 6 m s-1. It will
ultimately create a “turbulent fluidization” regime in the gasifier riser and carry-
Chapter 2
28
over of the bed material together with the degasified biomass particles (char). The
vertical velocity of the gas is reduced in the settling chamber, causing the larger
solids (bed material and char) to separate from the gas and fall down into the
downcomer. The producer gas leaves the reactor from the top and is sent to the
cooling and gas cleaning section. The typical residence time of the gas is several
seconds.
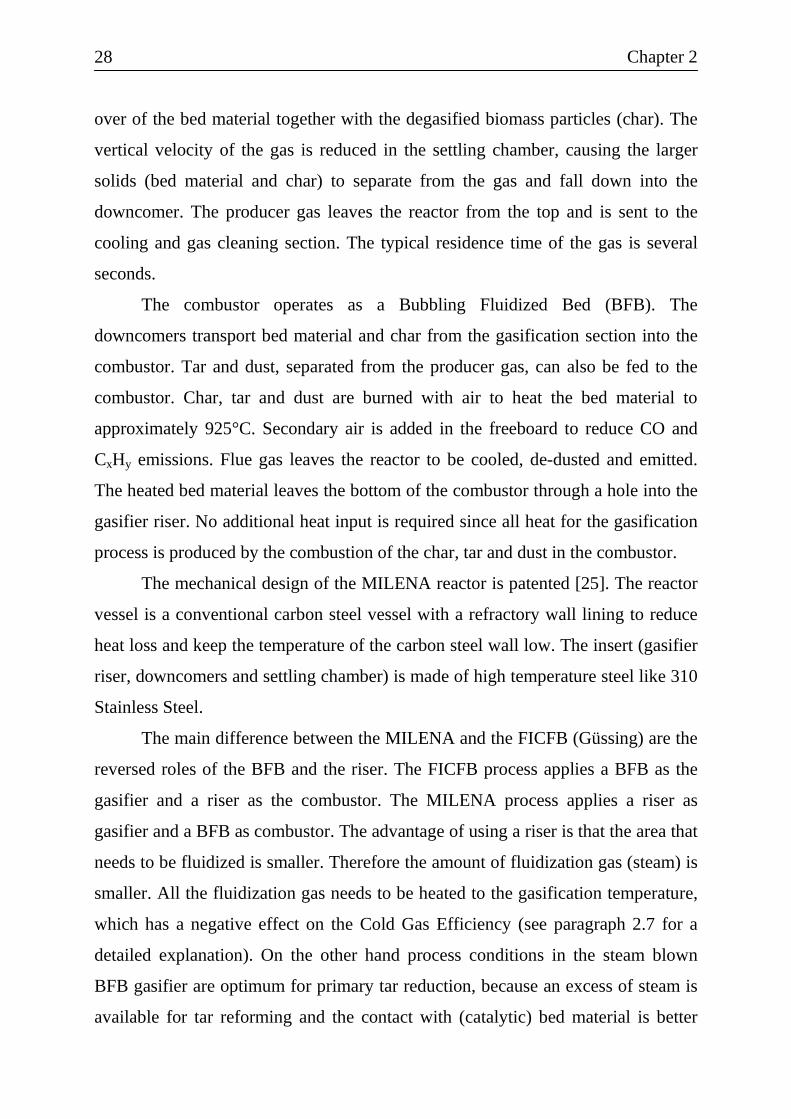
The combustor operates as a Bubbling Fluidized Bed (BFB). The
downcomers transport bed material and char from the gasification section into the
combustor. Tar and dust, separated from the producer gas, can also be fed to the
combustor. Char, tar and dust are burned with air to heat the bed material to
approximately 925°C. Secondary air is added in the freeboard to reduce CO and
CxHy emissions. Flue gas leaves the reactor to be cooled, de-dusted and emitted.
The heated bed material leaves the bottom of the combustor through a hole into the
gasifier riser. No additional heat input is required since all heat for the gasification
process is produced by the combustion of the char, tar and dust in the combustor.
The mechanical design of the MILENA reactor is patented [25]. The reactor
vessel is a conventional carbon steel vessel with a refractory wall lining to reduce
heat loss and keep the temperature of the carbon steel wall low. The insert (gasifier
riser, downcomers and settling chamber) is made of high temperature steel like 310
Stainless Steel.
The main difference between the MILENA and the FICFB (Güssing) are the
reversed roles of the BFB and the riser. The FICFB process applies a BFB as the
gasifier and a riser as the combustor. The MILENA process applies a riser as
gasifier and a BFB as combustor. The advantage of using a riser is that the area that
needs to be fluidized is smaller. Therefore the amount of fluidization gas (steam) is
smaller. All the fluidization gas needs to be heated to the gasification temperature,
which has a negative effect on the Cold Gas Efficiency (see paragraph 2.7 for a
detailed explanation). On the other hand process conditions in the steam blown
BFB gasifier are optimum for primary tar reduction, because an excess of steam is
available for tar reforming and the contact with (catalytic) bed material is better

Background on Biomass Gasification
29
than in a riser. Tests at ECN have shown that the tar dew point can be around
100°C when biomass is gasified in a steam blown BFB using (Austrian) Olivine as
a bed material. This agrees with reported results from the Güssing gasifier.
The SilvaGas or Battelle gasifier is more similar to the MILENA process.
Cold Gas efficiency and gas compositions are similar when both processes are
operated under similar process conditions. One major difference is the use of a
settling chamber in the MILENA process instead of a cyclone to separate the char
and bed material from the producer gas. The settling chamber was selected to
create a zone with a high gas residence time in an environment with a lot of dust
(char/fine bed material), because these conditions are advantageous for tar
reduction. The settling chamber makes an integrated design of gasifier riser, solids
removal (the settling chamber) and combustor possible and more logical. By
placing all the key components in one vessel, pressurized operation becomes easier.
The SilvaGas applies two riser reactors, one for gasification of the biomass and one
for combustion of the char. The MILENA process uses a BFB for the char
combustion. The BFB was selected because the bed material/char ratio is higher in
a BFB than in a riser. Char particles are surrounded by more sand particles during
the combustion process. The bed material acts a heat carrier, and cools the burning
char particle which prevents local hot spots. Local hot spots are a cause for
agglomeration (type II, melt-induced). The relatively high bed material/char ratio is
expected to help preventing agglomeration problems.
2.7 Gasifier Efficiency
The efficiency of a gasifier is generally expressed as Cold Gas Efficiency (CGE).
CGE is defined as the chemical energy of the gas at room temperature divided by
the chemical energy of the biomass input. This definition leaves room for a several
different interpretations. The calorific value of biomass and the produced gas can
be defined on Lower Heating Value (LHV) basis or on Higher Heating Value
(HHV) basis. The LHV of a fuel excludes the condensation heat of the water in the

Chapter 2
30
flue gas after combustion, the HHV includes the heat of condensation. When
calculating the CGE both the heating value of the biomass and the gas should be
calculated on the same basis. The chemical energy in the cleaned gas is normally
lower than the chemical energy in the raw gas leaving the gasifier, due to tars and
NH3 in the untreated gas. Both can contribute significantly to the heating value of
the gas. When comparing CGE’s it should be made clear whether the heating value
of the cleaned gas or the raw gas is used. The CGE reported in this thesis is always
defined using the heating value of the cleaned gas. Both LHV and HHV are given,
to make the given efficiencies comparable with other publications.
The calculation of efficiencies based on LHV can give remarkable results,
because the heating value of a solid fuel is corrected for the heat required to
evaporate the water from the fuel (Equation 2.1).
LHV a.r. = LHVdry ·(1-w/100) -2.442·w/100 (2.1)
Where: w = mass% of moisture in the biomass on as received (a.r.) basis and
the heating value is expressed in MJ kg-1.
This definition results in negative Lower Heating Values (LHV) if the
biomass is wet enough. Figure 2-6 shows the calculated heating values of dry wood
with different moisture contents and the calculated CGE’s on LHV and HHV basis
for a MILENA type gasifier with integrated dryer. The biomass is dried to 15
mass% of moisture. The drying is not limited by the availability of heat produced
by the gasifier system As can be seen from the figure the lower heating value of
wood becomes negative above 88 mass% of moisture.

Background on Biomass Gasification
31
-2
0
2
4
6
8
10
12
14
16
18
0 10 20 30 40 50 60 70 80 90 100
Moisture content wood [wt% a.r.]
Hea
ting
Val
ue w
ood
[MJ
kg-1
a.r
.]
75
80
85
90
95
100
105
110
115
120
125
Col
d G
as E
ffici
ency
(C
GE
) [%
]
LHV woodHHV woodCGE LHVCGE HHV
Figure 2-6: Heating value wood and calculated CGE as function of moisture content fuel.
When relatively wet biomass is gasified and waste heat or non evaporative
drying is applied to dry the biomass, the CGE (on LHV basis) can be increased
significantly to values eventually higher than 100%. Obviously, when comparing
efficiencies for biomass installations on LHV basis the moisture content of the fuel
is an important factor.
The CGE of a gasification system is determined by the losses. These losses
are latent heat of the produced gases minus the heat of the fluidization gas, heat
loss, tar loss and char loss. The heat loss of commercially sized gasifiers (>10
MW th input) is normally below 1% if no active wall cooling is applied. Most
Fluidized Bed gasifiers do not use reactor wall cooling, but cooling is common for
high temperature Entrained Flow (EF) gasifiers. Tar is normally recycled to the
gasifier, which reduces the loss. The latent heat of the producer gas is influenced
by the amount of gasification or fluidization gas fed to the gasifier. The char loss is
determined by the fuel or carbon conversion.

Chapter 2
32
2.8 References
1. Higman, C., van de Burgt, M., 2008. Gasification, Second Edition, Elsevier,
ISBN 978-0-7506-8528-3.
2. Zuideveld, P., de Graaf, J., 2003. Overview of Shell global solutions'
worldwide gasification developments. In: Gasification Technologies, October
12-15, 2003, San Francisco.
3. Bergman, P.C.A., Boersma, A.R., Kiel, J.H.A., Prins, M.J., Ptasinski, K.J.,
Janssen, F.J.J.G., 2005. Torrefaction for entrained flow gasification of
biomass, Petten, The Netherlands, ECN, ECN-C--05-067.
4. Boerrigter, H., van der Drift, A., 2005. Biomass pre-treatment for biomass-to-
liquids (BtL) plants, Petten, The Netherlands, ECN, ECN-CX-05-087.
5. Teislev, B., 2002. Wood-chips gasifier combined heat and power. VDI
Berichte 2.
6. Rabou, L.P.L.M., Zwart, R.W.R., Vreugdenhil, B.J., Bos, A., 2009. Tar in
Biomass Producer Gas, the Energy research Centre of The Netherlands
(ECN) Experience: An Enduring Challenge. Energy and Fuels 23.
7. Milne, T.A., Evans, R.J., Abatzoglou, N., 1998. Biomass gasifier tars, Their
nature, formation and conversion, Colorado, National Renewable Energy
Laboratory, NREL, NREL/TP-570-25357.
8. Boerrigter, H., van Paasen, S.V.B., Bergman, P.C.A., Könemann, J.W.,
Emmen, R., Wijnands, A., 2005. OLGA tar removal technology, Petten, The
Netherlands, ECN, ECN-C--05-009.
9. van der Drift, A., Pels, J.R., 2004. Product gas cooling and ash removal in
biomass gasification, ECN, Petten, The Netherlands, ECN-report: ECN-C-04-
077.
10. van der Meijden, C.M., Batenburg, R., 2009. Gaskoeler. Application number
NL2003917.
11. Neeft, J.P.A., van Paasen, S.V.B., Knoef, H., Buffinga, G.J., Zielke, U.,
Sjostrom, K., et al., 2002. Tar Guideline. A Standard Method For
Measurement Of Tars Aand Particles In Biomass Producer Gases. In: 12th

Background on Biomass Gasification
33
European Conference on Biomass for Energy, Industry and Climate
Protection, 17-21 June 2002, Amsterdam, The Netherlands.
12. van Paasen, S.V.B., Bergman, P.C.A., Neeft, J.P.A., Kiel, J.H.A., 2002.
Primary measures for tar reduction. In: 12th European Conference on Biomass
for Energy, Industry and Climate Protection, 17-21 June 2002, Amsterdam,
The Netherlands.
13. van Paasen, S.V.B., Boerrigter, H., Kuipers, J., Struijk, F., Stokes, A.M.V.,
2005. On line tar dew point measurements. In: 14th European Biomass
Conference & Exhibition, 17-21 October 2005, Paris, France.
14. Vogels, J., Rudloff, M., 2005. 30 MW CARBO-V® Biomass gasifier for
municipal CHP: The CHP project of the city of Aachen. In: 14th European
Biomass Conference, 17-21 October 2005, Paris, France.
15. Ising, M., Unger, C., Heinz, A., Althaus, W., 2002. Cogeneration from
Biomass gasification by producer gas-driven block heat and power plants. In:
12th European Conference on Biomass for Energy, Industry and Climate
Protection, 17-21 June 2002, Amsterdam, The Netherlands.
16. van Paasen, S.B.V., van der Drift, A., van der Meijden, C.M., 2001. STAR fase
1 : teerverwijdering met char, proof-of-principle, ECN-CX--01-011.
17. van der Meijden, C.M., van der Drift, A., van Paasen, S.B.V., Carbo, M.C.,
2007. Biogas purification apparatus, contains bed comprising carbon
particles and base particles of a material other than carbon. Patent
NL1030189C.
18. Broust, F., Girard, P., Koch, T., van der Drift, A., rouge, S., 2005. From
biomass to electricity through integrated gasification/SOFC system: Green
Fuel Cell. In: 14th European Biomass Conference, 17-21 October 2005, Paris,
France.
19. van der Meijden, C.M., Rabou, L.P.L.M., Brenneisen, L.M., Wubbe, R., 2002.
GASREIP, GASREIniging en Prime mover design, fase B, The Netherlands,
ECN, ECN-CX--02-041.

Chapter 2
34
20. Visser, H.J.M., van Lith, S., Kiel, J.H.A., 2003. Biomass ash- bed material
interactions leading to agglomeration in FBC. In: 17th International
Conference on Fluidized Bed Combustion, May 18-21, Jacksonville, Florida.
21. van der Drift, A., van der Meijden, C.M., Strating-Ytsma, S.D., 2002. Ways to
increase the carbon conversion of a CFB-gasifier. In: The 12th European
Conference on Biomass for Energy, 17-21 June 2002, Amsterdam, the
Netherlands.
22. Proell, T., Rauch, R., Aichernig, C., Hofbauer, H., 2007. Fluidized bed steam
gasification of solid biomass - Performance characteristics of an 8 MWth
combined heat and power plant. International Journal of Chemical Reactor
Engineering 5 (ISSN: 1542-6580).
23. Paisley, M.A., Overend, R.P., 2002. Verification of the Performance of Future
Energy Resources' SilvaGas® Biomass Gasifier -- Operating Experience in
the Vermont Gasifier. In: Pittsburg Coal Conference, 2003.
24. Hofbauer, H., Rauch, R., Loeffler, G., Kaiser, S., Fercher, E., Tremmel, H.,
2002. Six years experience with the FICFB-Gasification process. In: 12th
European Conference on Biomass for Energy, Industry and Climate
Protection, 17-21 June 2002, Amsterdam, The Netherlands.
25. van der Meijden, C.M., van der Drift, A., 2007. Device for producing a
product gas from biomass. Patent WO2007061301.
Chapter 3
3 Bio-SNG
Abstract
The application and production options of Bio-SNG are described in this chapter.
Bio-SNG can directly replace fossil natural gas, because the composition is similar.
The application of natural gas as transport fuel has been increasing rapidly in recent
years. This creates the possibility to apply Bio-SNG in the transport fuel market as
well. It is argued in this chapter that Bio-SNG is as more attractive transport fuel
than alternatives (like FT diesel) that are under development at the moment.
3.1 Application of (Bio)-SNG
Natural gas is a convenient and environmentally friendly fuel used all over the
world for a wide range of applications. The most relevant applications are:
• Large scale Electricity production in Combined Cycles.
• Decentralized Combined Heat and Power production (CHP).
• Transportation, 10 million cars use Compressed Natural Gas (CNG).
• Chemical industry, as a feedstock for many chemicals.

Chapter 3
36
SNG can directly replace fossil natural gas in al these applications if the
composition of the produced SNG complies with the specifications put forward.
Limits are normally set for Heating Value, Wobbe index, concentrations of
impurities and condensables. Exact specifications and certification for gas grid
injection of Bio-SNG are still topic of discussion. For some countries specifications
are available for the injection of upgraded biogas [1].
SNG produced via gasification mainly consists of CH4, together with some
CO2, N2 and H2. The H2 concentration has a strong influence on the calculated
Wobbe index. CO2 and N2 lower the heating value and Wobbe index whereas CO2,
together with water can also condense in the high pressure gas grid.
The composition of natural gas varies. The main component of natural gas is
always CH4. Some alkanes (mostly C2H6 and C3H8) are also present in the gas.
Because of the presence of the alkanes the heating value of the gas mixture can be
higher than the heating value of pure CH4. SNG does not contain alkanes and
therefore it can be difficult to meet the specifications for Wobbe index and Heating
Value. A possible solution is mixing in Liquid Propane Gas (LPG). LPG is a
relatively cheap and widely available fuel.
Table 7.11 (Chapter 7) gives the expected gas Bio-SNG for the MILENA
SNG system.
3.2 Bio-SNG Production routes
There are two main options to produce SNG from biomass:
1. Anaerobic digestion (biological conversion at low temperature).
2. Gasification (thermo chemical conversion at high temperature).
Anaerobic digestion is a process carried out by bacteria. The bacteria grow
by converting organic matter into biogas (mainly CH4 and CO2). Biogas production
is a proven technology. In 2007 more than 3500 anaerobic digesters were in
operation in Germany [2].

Bio-SNG
37
Most of the present biogas production comes from landfills and waste water
treatment plants. The biogas production from landfills is in decline, due to the ban
on depositing organic material, whereas the number of dedicated co-digestion
plants using manure and food wastes is increasing. Biogas can be used in a gas
engine after relatively simple cleaning of the gas. After CO2 removal, gas cleaning
and compression the gas can be injected in the grid. The relatively small scale of
anaerobic digestion facilities makes upgrading of the gas expensive. In 2007 three
anaerobic digestion plants were in operation in Sweden which injected the
produced SNG in the gas grid [3].
Gasification of biomass is less limited by biomass supply as in the case of
digestion, because a wider range of biomass fuels are suitable to be used as
feedstock and the amounts available of these feedstocks are larger.
The estimated potential for biogas in the Netherlands is estimated to be 50-
60 PJ or 2 to 3% replacement of fossil natural gas [4]. Additional production of
Bio-SNG via gasification is required to replace a significant amount of present day
use of natural gas. Anaerobic digestion can speed-up the introduction of Bio-SNG.
Figure 3-1 depicts the Bio-SNG implementation in time. Both contributions of
anaerobic digestion and gasification are foreseen [5].
Figure 3-1: Foreseen implementation trajectory of Bio-SNG.

Chapter 3
38
3.3 Historical Background
Coal gas can be seen as the predecessor of SNG. Gas produced from coal was
produced in London for public street lighting in the beginning of the 19th century.
Main combustible components were CO, H2 and hydrocarbons. The main problems
with coal gas were: its toxicity (CO) and the cleaning of the gas (tar). Figure 3-2
shows a picture of a coal gas production and storage facility.
Figure 3-2: Coal gas production facility in the Netherlands in 1911.
The use of coal came to an end when relatively cheap and safe natural gas
became available.
Due to the oil crisis of the seventies, governments started to realize that
dependence of (foreign) oil and in a lesser extent natural gas was an unwanted
situation. Projects were started to develop alternatives. One of those alternatives
was the production of SNG from lignite coal. In the United States several large
scale demonstrations were realized. Most of these demonstrations were not
successful. One important reason for the failure of many projects was probably the
drop in oil prices, which made these facilities uneconomic. The Great Plains

Bio-SNG
39
Synfuels plant in North Dakota survived the period of low oil prices and is still
producing SNG from lignite coal [6]. The plant has a scale of 3 GWth (lignite) input
and produces, besides SNG, electricity and many valuable chemicals like
ammonium sulfate, phenol, benzene and toluene. The CO2 that is removed during
the SNG production process is used for Enhanced Oil Recovery (EOR). This
decreases the CO2 emissions from the plant and gives financial benefits. Figure 3-3
shows the Great Plains Synfuels plant in North Dakota.
Figure 3-3: Pictures of Great Plains Synfuels plant.
The Great Plains Synfuels plant operates a Lurgi dry bottom fixed bed coal
gasification technology with an oxygen/steam mixture as gasification agent. In total
14 of such gasifiers are in use. The tar loaded hot gas is cooled and quenched with
water which removes part of the tar. A Rectisol unit is used for further purification
of the gas. The tar is separated from the liquid streams and upgraded into saleable
products.
The rise in oil and natural gas prices has resulted in a renewed interest in
SNG from lignite and resulted into several new projects where lignite again is the
feedstock.
Biogas was already produced at the end of the 19th century to supply gas for
street lightning. Nowadays biogas is mostly used in gas engines to produce heat
and electricity. In many cases heat is not required at the location of the digestion
facility and injection of the gas in the (local) gas grid would be more beneficial.
Because the gas grid is normally used to transport natural gas the biogas should
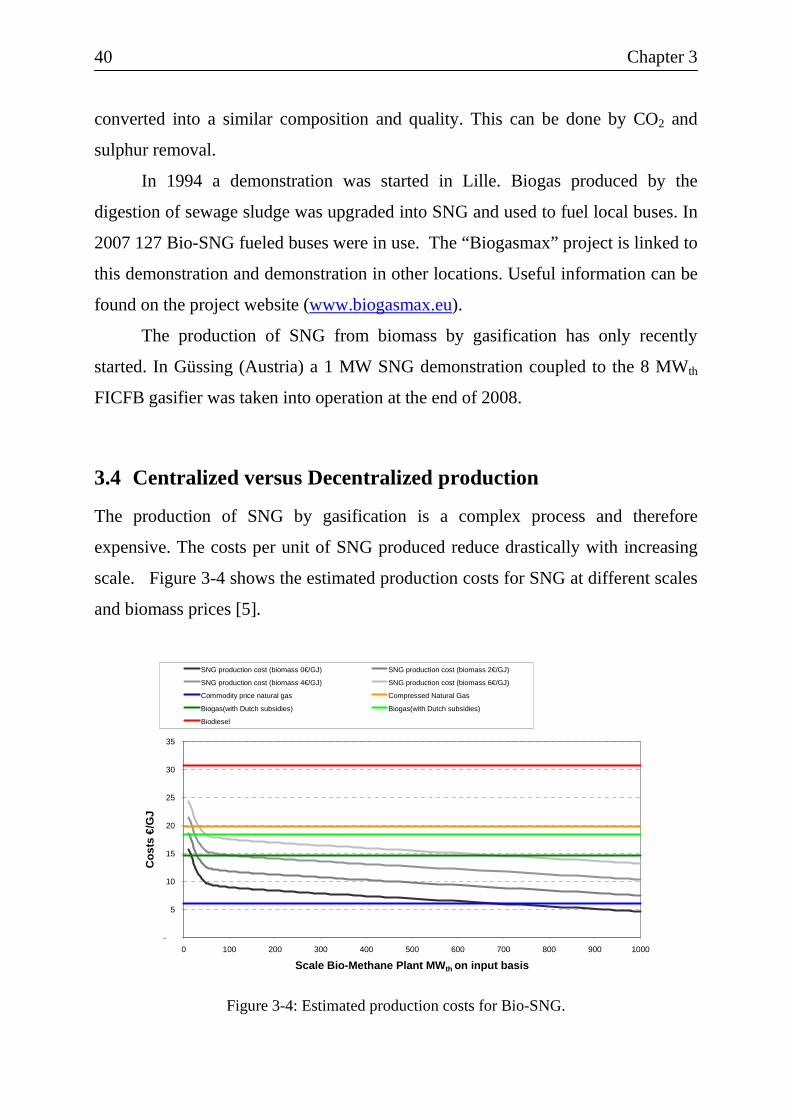
Chapter 3
40
converted into a similar composition and quality. This can be done by CO2 and
sulphur removal.
In 1994 a demonstration was started in Lille. Biogas produced by the
digestion of sewage sludge was upgraded into SNG and used to fuel local buses. In
2007 127 Bio-SNG fueled buses were in use. The “Biogasmax” project is linked to
this demonstration and demonstration in other locations. Useful information can be
found on the project website (www.biogasmax.eu).
The production of SNG from biomass by gasification has only recently
started. In Güssing (Austria) a 1 MW SNG demonstration coupled to the 8 MWth
FICFB gasifier was taken into operation at the end of 2008.
3.4 Centralized versus Decentralized production
The production of SNG by gasification is a complex process and therefore
expensive. The costs per unit of SNG produced reduce drastically with increasing
scale. Figure 3-4 shows the estimated production costs for SNG at different scales
and biomass prices [5].
-
5
10
15
20
25
30
35
0 100 200 300 400 500 600 700 800 900 1000
Scale Bio-Methane Plant MW th on input basis
Cos
ts €
/GJ
SNG production cost (biomass 0€/GJ) SNG production cost (biomass 2€/GJ)
SNG production cost (biomass 4€/GJ) SNG production cost (biomass 6€/GJ)
Commodity price natural gas Compressed Natural Gas
Biogas(with Dutch subsidies) Biogas(with Dutch subsidies)
Biodiesel
Figure 3-4: Estimated production costs for Bio-SNG.

Bio-SNG
41
The available amount of biomass is normally limited in a certain region. To
limit transport (thus costs) of biomass the size of a Bio-SNG plant should be
restricted. A good size indication is probably set by a paper mill. Paper mills have
developed over time to a size that equals several hundreds of MWth of biomass
input. A scale between 50 and 500 MWth is probably realistic for local biomass as
feedstock. If biomass is imported from overseas a larger scale is beneficial.
In many areas where natural gas is consumed as a primary energy source the
amount of available biomass is insufficient to fully replace fossil natural gas by
Bio-SNG. This makes import of biomass or Bio-SNG necessary. Transport of the
raw material is inefficient as biomass has a low energy density. Several
densification processes are available (pelletisation or pyrolysis) or under
development (torrefaction in combination with pelletisation) to reduce the transport
cost. The disadvantage of these pretreatment processes is the energy consumption
required for the densification in addition to investments in local pretreatment
plants.
Bio-SNG can be produced where the biomass is available in sufficiently
large quantities and can be transported using existing gas grids or as Liquid Natural
Gas (LNG) if the production facility is close to a harbor. Figure 3-5 depicts an
overview of the existing European gas grid for gas transport. As can be seen from
the figure the gas grid is widely spread throughout Europe, with the exception of
large parts of Scandinavia.

Chapter 3
42
Figure 3-5: Overview of European gas grid.
3.5 Bio-SNG as transport fuel
Compressed Natural Gas (CNG) is becoming more and more important as a
transport fuel. In 2010 more than 10 million cars were fueled by CNG according to
the International Association for Natural Gas Vehicles (www.iangv.org). This
number is rapidly increasing. All major European car suppliers have one or more
CNG models commercially available. Cities like Haarlem, Grenoble, Lille and
many others use CNG as a fuel for their public transportation. Municipal refuse
collection trucks use CNG or LNG in Madrid, Los Angeles and many other cities
around the world.
CNG is a relatively clean transport fuel. The emissions of CO2, particles and
sulphur are significantly lower than for other conventional fossil fuels. Noise
production can be significantly lower, which is of special importance in urban
areas.
Compressing Bio-SNG to 250 bar makes the fuel suitable to be used as Bio-
CNG, which is primarily used in passenger cars. Liquefied Natural Gas is often
Bio-SNG
43
used in heavy trucks and buses, but they can also use CNG. Bio-LNG can be
produced from Bio-SNG by cooling it to approximately −163 °C.
Bio-CNG produced by digestion of digestible feedstocks, landfill gas and
sewage gas is already demonstrated at several locations. A good example is the
Biogasmax project (www.biogasmax.eu). Bio-CNG produced by gasification of
non-digestible feedstocks like wood is being demonstrated in Güssing, Austria.
The disadvantage of any gaseous transport fuel is the energy needed for
compressing the gas to the required pressure for storage in gas cylinders
(approximately 250 bar). The compression of 30 bar SNG to 300 bar CNG
consumes approximately 0.014 kWe kWCH4-1
. The overall efficiency of the
conversion of biomass to Bio-CNG at 300 bar is 2%-point lower than overall
efficiency from biomass to Bio-SNG at 30 bar. The estimated overall efficiency
from woody biomass to Bio-SNG at 30 bar is 70% (LHV bases), so overall
efficiency to Bio-CNG would be 68%. A popular alternative Bio-Fuel is Fischer
Tropsch (FT) Diesel produced out of syngas made by gasification of biomass in
high temperature oxygen blown Entrained Flow (EF) gasifiers. An average overall
net efficiency from biomass to Fischer Tropsch Diesel is less than 50% [7]. The
difference in efficiency for producing Bio-FT Diesel and Bio-CNG is at least 18 %-
point. The lower efficiency for Bio-FT is a.o. due to inherent energy losses in the
conversion chain of biomass to FT products.
In a recent European study [8] different fuels were compared regarding well-
to-wheels energy efficiencies. Part of this comparison is the tank-to-wheels energy
use which is relevant for comparing Bio-CNG with Bio-FT diesel. Conclusion of
this study was that technical improvements will bring the energetic performance of
CNG close to diesel in the near future (2010+) and hybridization is particularly
favorable for CNG. Overall “wood”-to-wheels efficiency will be higher for Bio-
CNG than for Bio-FT.
An important driver for the development of Biofuels in the European Union
is the Bio-Fuel directive 2003/30/EC. In 2010 5.75% of the road transport fuels
have to be replaced by Bio-Fuels. Both diesel and gasoline have their own

Chapter 3
44
replacement obligation. CNG is taken to the diesel category, so Bio-CNG counts as
Bio-fuel for the replacement of CNG and Diesel.
Fossil based gasoline is mostly replaced by ethanol produced from corn or
wheat and fossil diesel is mostly replaced by Bio-Diesel produced from rape seed.
Both Biofuels are produced from glucose based biomass and are seen as “first
generation” Biofuels. Biofuels produced from non-food cellulosic material like
wood are seen as “second generation” Biofuels. To promote the development of
“second generation” Biofuels the European Commission has proposed to make
“second generation” Biofuels accountable for twice the amount of fossil fuel they
replace to achieve the European targets [9]. This double counting would give Bio-
SNG a significant advantage over “first generation” Biofuels.
3.6 Concluding remarks
The production of gas/SNG from coal and biomass is not new. The availability of
cheap fossil natural gas during most of the 20th century prevented the breakthrough
of Bio-SNG technology. The urgent need to reduce fossil CO2 emissions and to
replace declining fossil fuels reserves has renewed interest in Bio-SNG technology.
Production of Bio-SNG via anaerobic digestion is an attractive option to
convert digestible feedstocks like manure and food wastes, but additional
production of Bio-SNG via gasification is required to replace a significant amount
of present day use of natural gas.
The production costs for Bio-SNG are strongly influenced by scale. A scale
between 50 and 500 MWth is probably a realistic scale if local biomass is used. If
biomass is imported an even larger scale is beneficial.
For some countries the, like the Netherlands, the amount of biomass
available is insufficient to replace the present natural gas consumption, so that
import is required. In Europe an extensive natural gas transport grid is in place. The
areas with a high potential for energy crops production are mostly near a gas grid,
so import of Bio-SNG instead of (pelletized) wood is an option.

Bio-SNG
45
Bio-SNG (Bio-CNG) is an ideal transport fuel. The overall efficiency from
wood to fuel is significantly higher than for the alternative Fischer Tropsch Diesel.
The number of cars using CNG is growing rapidly. All these cars can be fuelled
with Bio-SNG as it becomes available.
3.7 References
1. Persson, M., Jönsson, O., Wellinger, A., 2006. Biogas upgrading to vehicle
fuel standards and grid injection, IEA Bioenergy, report from Task 37
(Energy from biogas and landfill gas).
2. Beurskens, LW.M., Mozaffarian, M., Lescot, D., Tuille, F.F.G., 2009. The
State of Renewable Energies in Europe, Petten, The Netherlands, ECN, ECN-
O--09-011.
3. Svensson, M., Held, J., 2008. The supply of BioMethane, a crucial factor in
Sweden for the NGV market expansion. In: 11th IANGV Conference &
Exhibition, 3-5 June, Rio de Janeiro, Brazil.
4. Wempe, J., Dumont, M., 2008. Let's give full gas; the role of green gas in the
Dutch energy management system (Vol gas vooruit; De rol van groen gas in
de Nederlandse energiehuishouding), Report made for Energy Transition
Platform "New Gas".
5. Boerrigter, H., Zwart, R.W.R., Deurwaarder, E., van der Meijden, C.M., van
Paasen, S.V.B., 2006. Production of Synthetic Natural Gas (SNG) from
biomass; development and operation of an integrated bio-SNG system; non-
confidential version, Petten, The Netherlands, ECN, ECN-E--06-018.
6. Dittus, M., Johnson, D., 2001. Dakota gasification company Great Plains
Synfuels Plant, the hidden value of lignite coal. In: Gasification Technology
Conference, 7-10 October 2001, San Francisco.
7. Biollaz, S., Stucki, S., 2004. Synthetic natural gas/biogas (bio-SNG) from
wood as transportation fuel - a comparison with FT liquids. In: The 2nd World

Chapter 3
46
Conference on Biomass for Energy, Industry, and Climate Protection, 10-14
May 2004, Rome, Italy.
8. JRC, 2008. Well-to Wheels analysis of future automotive fuels and
powertrains in the European context, version 2c, IEC/JRC
9. European Commission, 2008. Proposal for a directive of the European
Parlliamanet and the Council on the promotion of the use of energy from
renewable sources, 2008/0016 (COD).

Chapter 4
4 Selection of optimal gasification route for
SNG production
Abstract
The present chapter contains an analysis of the Bio-SNG process efficiency that
can be obtained using three different gasification technologies and associated gas
cleaning and methanation equipment. These technologies are: 1) Entrained Flow, 2)
Circulating Fluidized Bed and 3) Allothermal or Indirect gasification. It was
concluded that Indirect gasification results in the highest overall efficiency from
wood to Bio-SNG.
4.1 Introduction
Various biomass gasification technologies are suitable to produce a gas which can
be upgraded into Bio-SNG. A comparison of these technologies, using similar
boundary conditions is required to quantify the assumed higher overall efficiency
of Indirect gasification over the alternative biomass gasification processes. This
comparison was not available in public literature. This comparison is essential in
convincing industrial partners that it is worthwhile to select indirect gasification for
Bio-SNG production instead of more conventional gasification processes.

Chapter 4
48
The overall efficiency from wood to Bio-SNG was modeled using three
different gasification technologies and associated gas cleaning and methanation
equipment. These technologies are: 1) Entrained Flow, 2) Circulating Fluidized
Bed and 3) Allothermal or Indirect gasification. The aim of this work was to
identify the gasification route with the highest process efficiency from biomass to
SNG and to quantify the differences in overall efficiency. This study does not focus
on the MILENA gasifier as indirect gasifier, but an “average” Indirect gasifier is
assumed. Aspen Plus® was used as modeling tool. The heat and mass balances are
based on experimental data from literature and ECN experience. The three gasifier
types under consideration all deliver gas suitable for upgrading to SNG, but the
high temperature Entrained Flow gasifier (± 1300°C) produces a syngas containing
mostly CO, H2, CO2 and H2O while the medium temperature Indirect and CFB
gasifiers (±850°C) give a producer gas which, in addition to CO, H2, CO2 and H2O,
contains CH4, unsaturated and aromatic hydrocarbons like C2H4 and C6H6 and tar.
Pollutants like dust, sulphur and chloride need to be removed from the gas in all
cases. The medium temperature gasifiers also require tar removal. Figure 4-1 shows
the general process efficiencies for wood to SNG. A high amount of ‘instant SNG’
gives the highest efficiency to SNG, because the loss caused by the exothermic
synthesis of CO and H2 is minimized.
gasifier
wood
instant SNG *
H2, CO CH4 synthesis 75% efficiency
SNG
gas
CH4
* mainly CH4, but also olefins and aromatics
70 - 80%
52 - 72%
Figure 4-1: General process efficiencies for wood to SNG.
Syngas, as produced conventionally by oil or coal gasifiers, is seen as a more
common feedstock gas than producer gas because gas cleaning processes for
syngas applications are already commercially available. The gas cleaning processes
for producer gas are still under development.

Selection of optimal gasification route for SNG production
49
Both types of cleaned gases can be converted into a gas containing only CH4,
CO2, H2O and a small amount of Ar and N2. CO2 and H2O are easily removed from
the gas, leaving an SNG that can contain small amounts of N2 and Ar. The
maximum allowable concentration of non-combustible gases is site-specific.
In this study a model is made to calculate the overall efficiencies to SNG for
large scale systems of 1 GWth input on HHV basis, based on three different types of
gasifiers. The relatively large scale was selected because it matches the commercial
scale of Entrained Flow coal gasifiers and the production capacity of a small
natural gas field. Oxygen blown Entrained Flow gasification is compared to both
Indirect (or Allothermal) gasification and oxygen-blown Circulating Fluidized Bed
gasification at the same scale. The comparison is solely based on energetic
efficiency numbers. Economics and transport of biomass are not taken into account.
The goal of this comparison is to quantify the differences in overall process
efficiencies for the three different gasifiers. The results were used by ECN to select
to most promising gasification technology for SNG production.
Dry wood (moisture content = 15 wt.%) was selected as the fuel for this
study, as it can be readily used for all three different types of gasifiers. Wood
mixed with coal was gasified in the Shell Entrained Flow gasifier in Buggenum in
the Netherlands and wood is gasified in several Fluidized Bed gasifiers.
The next paragraph describes the system lay-out for each gasification
technology. Sub systems are described in detail in separate paragraphs. The final
paragraph presents results of the analysis.
4.2 Process configurations
In all cases the gas cleaning and gas upgrading steps are kept similar as much as
possible to allow a fair comparison of the overall efficiencies due to various types
of gasifiers. Operating pressures were selected on the basis of what is thought to be
commercially available in the near future. Figure 4-2 shows the process scheme for
the Entrained Flow SNG system.

Chapter 4
50
30 bara
ZnS
ZnS
Methanation Methanation
H2O CO2
MD steam
Waste heat
MD steam, superheated
SNG (+ H2) Air
Syngas Ash
NaCl Water150°C
E
Biomass
O2
CO2 600°C
1300°C
Ash Fly ash
T EF 250°C
250°C 160°C 280°C210°C
Figure 4-2: Scheme of EF SNG system.
Entrained Flow gasification requires an energy intensive pretreatment to
produce fine powder-like feedstock. Torrefaction [1] is selected, followed by
milling, because of the relatively low energy requirement. Dried biomass is fed into
the torrefaction reactor (T in Figure 4-2). The torrefied biomass is milled,
pressurized with CO2 and pneumatically fed into the Entrained Flow gasifier (EF in
Figure 4-2) which operates at 30 bar and 1300°C. Syngas leaving the gasifier is
first cooled by a gas quench down to 600°C and subsequently cooled in a heat
exchanger producing steam. Fly ashes are removed from the cooled gas by a filter.
Part of the gas is recycled to act as quench gas. Sulphur and chloride are removed
from the gas by adsorbents. The gas is moisturized and preheated prior to
conversion into methane. The heat produced in the methanation section is used for
steam generation. Water and carbon dioxide are removed from the gas prior to
injection into the natural gas grid.

Selection of optimal gasification route for SNG production
51
Figure 4-3 shows the CFB configuration. Wood chips are pressurized by a
lock hopper system and fed into the gasifier which operates at 10 bar and 850°C.
10 bara
850°C
400°C
160°C
ZnS
250°C 200°C
Methanation
150°C
30 bara
H2O CO2
LD steam,180°C
Waste heat
SNG (+ H2) Producer gas
Tar / Dust
NaCl Water150°C
E
Biomass CO2
CFB OC
OA
OS
10 bara
LD steam, 250°C
O2
Methanation ZnS
LD steam, 480°C
Figure 4-3: Scheme of CFB SNG system.
Producer gas leaving the gasifier is cooled down to 400°C. Most of the dust
(carbon containing ash) is removed from the producer gas by a cyclone. The
remaining dust and tar are dissolved in oil in the OLGA gas cleaning system.
Heavy tars are removed in the collector (OC in Figure 4-3) and light tars are
removed in the absorber (OA in Figure 4-3). Heavy tars and a small amount of ash
are recycled back to the gasifier. Light tars are removed from the oil with steam in
a stripper (OS in Figure 4-3). The steam/light tar mixture is preheated and sent back
to the gasifier. Prior to the sulphur and chloride removal by adsorbents the producer
gas is preheated to 250°C. The cleaned gas is then preheated, moisturized and
converted into methane in several methanation reactors. The heat produced is used
for steam generation. Water and CO2 are removed from the gas before the SNG is
compressed to 30 bar and injected into the natural gas grid.
Figure 4-4 shows the system based on the Indirect gasifier. Wood chips are
fed into the gasifier (MG in Figure 4-4) which operates at atmospheric pressure and
850°C.

Chapter 4
52
1 bara
900°C
400°C
ZnS
160°C
ZnS
250°C °
200°C
Methanation
30 bara
H2O CO2
100°C
LD steam, 180°C
MD steam, 275°C
Waste heat
MD steam, 480°C
SNG (+ H2) Air
Producer gas
Tar / Dust
NaCl Water
E E
LD steam, 480°C
Biomass CO2
MG
MC MA
OC OA
OS
7 bara
Ash
80°C
Methanation
280°C
Figure 4-4: Scheme of Indirect gasifier SNG system.
Producer gas leaving the gasifier is cooled down to 400°C. Most of the dust
(carbon containing ash) is removed from the producer gas by a cyclone. The
remaining dust and tar are dissolved in oil in the OLGA gas cleaning system (OC
and OA in Figure 4-4). Heavy tars and a small amount of ash are recycled back to
the combustion section of the Indirect gasifier. Light tars are removed from the oil
with air in a stripper (OS in Figure 4-4). The air/light tar mixture is preheated and
used as fuel enriched combustion air in the combustion section (MC in Figure 4-4)
of the Indirect gasifier. For the rest the SNG production steps are the same as in the
previous case. Air is added to the flue gas leaving the fluidized bed combustor (MC
in Figure 4-4) in the freeboard or afterburner section (MA in Figure 4-4) to reduce
CO and CxHy emissions. The flue gas is cooled and dedusted by a bag house filter
before it is sent to the stack. Heat is used for steam production.

Selection of optimal gasification route for SNG production
53
4.2.1 Fuel pretreatment
In case of Entrained Flow gasification a pretreatment step is required to be able to
feed the biomass into the gasifier. Torrefaction is seen as the most logical
pretreatment step for Entrained Flow gasification [1]. The energy required for
milling the fuel is significantly reduced and the fuel contains less H2O, which
improves the Cold Gas Efficiency. Torrefaction also reduces transportation and
storage costs for biomass [2]. For the Fluidized Bed gasifiers no such pretreatment
is required. Because the torrefaction process requires a relatively dry fuel to operate
without additional heat input, wood with 15% moisture was selected as the input
fuel for all three systems in this comparison. Integrating a dryer using low
temperature waste heat will increase efficiencies (on LHV basis) for all systems,
but drying is not considered in this study.
The energetic efficiency of the torrefaction process as estimated from data
published by ECN for dry wood [1, 3], was assumed to be 90% on HHV basis and
93% on LHV basis. The electricity consumption of the torrefaction process is
assumed to be 1% of the biomass input (on LHV basis). At the moment of writing
the ECN torrefaction pilot plant is under construction. More reliable data for
overall efficiency and electricity consumption of the process will be available in the
future. The moisture content of torrefied biomass varies between 1 and 6%
depending on the torrefaction conditions and the post-treatment [3]. For this study a
moisture content of 3.5% was assumed. The torrefied biomass particles fed into the
gasifier have to be relatively small to be completely converted into syngas. An
average particle size of 0.1 mm is assumed. The required milling electricity is
0.017 MWe MWth-1 input (LHV) [1].
Table 4.1 gives the composition of clean wood and torrefied wood used in
this study. Data have been taken from the Phyllis biomass database
(www.ecn.nl/phyllis/). The ash content of wood is estimated at 1%. The
composition of the torrefied wood is derived from ECN measurements.

Chapter 4
54
Table 4.1: Composition of wood used in analysis.
Clean wood Torrified wood
Moisture [wt.% a.r.] 15.0 3.5
Ash [wt.% d.b.] 1.0 1.1
C [wt.% d.a.f.] 50.7 56.1
H [wt.% d.a.f.] 6.1 5.7
O [wt.% d.a.f.] 42.8 37.9
N [wt.% d.a.f.] 0.3 0.3
S [wt.% d.a.f.] 0.06 0.06
Cl [wt.% d.a.f.] 0.05 0.05
LHV [MJ kg-1 d.a.f.] 18.8 20.8
HHV [MJ kg-1 d.a.f.] 20.1 22.0
The higher heating value (HHV) of biomass includes the condensation heat
of water from the moisture in the biomass and the water formed from hydrogen in
the biomass. The lower heating value (LHV) of biomass excludes the condensation
heat of the water formed from the hydrogen in the biomass and the moisture. It
should be noted that the heating values of wood can vary substantially [4] and have
a strong effect on calculated Cold Gas Efficiencies of the gasifiers. The heating
values and compositions for clean wood given in Table 4.1 are an average of
approximately 200 samples of different types of wood, so the inaccuracy in the
heating value is negligible. The number of representative samples for torrefied
wood is still low, so the heating value can be inaccurate.
4.2.2 Gasifiers
The Shell type high temperature slagging Entrained Flow gasifier was selected
because this is the only commercial high temperature gasifier where solid biomass
has been gasified so far (co-fired with coal) [5]. It uses oxygen as gasification
agent, containing only 1% of nitrogen to minimize the amount of nitrogen in the

Selection of optimal gasification route for SNG production
55
syngas. The inert gas (CO2) requirement for pneumatic feeding was calculated to be
0.006 m3 kg-1 biomass. This is based on a void fraction of 0.75 required for dense
phase transport and a particle density of 500 kg m-3. It is assumed that the amount
of water present in the fuel is sufficient to prevent the formation of soot in the
gasifier so no external steam has to be added to the gasifier. The slag flowing down
the reactor wall is kept liquid by controlling the mineral composition [6]. To
maintain the right composition and the right amount of slag to cover the membrane
wall of the reactor, a flux material is added. The amount of flux added is assumed
to be 8 wt.% of the biomass. The typical operating temperature of an Entrained
Flow gasifier is between 1300 and 1500°C. At lower temperatures the fuel is not
converted completely and the viscosity of the ash can become too high. Higher
temperatures decrease the Cold Gas Efficiency (CGE). The temperature selected is
a trade-off between fuel conversion and CGE. As the biomass is more reactive than
coal, a gasification temperature of 1300°C was selected [6]. The assumed carbon
conversion at this temperature is 99.5%. Heat loss through the membrane wall of
the gasifier vessel is assumed to be 2% of the thermal input (LHV basis) [7]. 1% of
the heat is used to produce medium pressure steam; the remaining 1% is seen as an
overall heat loss.
Conventional Circulating Fluidized Bed biomass gasifiers use air as the
gasification medium. This dilutes the producer gas with nitrogen, which will end up
in the SNG and cannot be easily removed. To prevent this nitrogen dilution oxygen
has to be used as gasification medium. Replacing air by oxygen will increase the
chance of local hot spots in the fluidized bed resulting in an increased risk of
agglomeration of the bed material which is a major problem in operating Fluidized
Bed gasifiers [8]. To reduce the risk of agglomeration the oxygen is diluted with
steam. The selected steam to oxygen ratio is 1 (kg kg-1) [9]. It should be noticed,
however, that this assumption has a major impact on overall efficiency. VTT in
Finland has built a pressurized steam/oxygen blown CFB biomass gasifier, but at
this moment no experimental results are available in the public domain. ECN has
previously done some experiments with atmospheric steam/oxygen blown CFB

Chapter 4
56
gasification where the steam to oxygen ratio was taken similarly to the ratio
assumed in this study.
A heat loss of 1% from the reactor was assumed as for the EF gasifier. For
this study a carbon conversion of 90% is assumed. This assumption is based on
published data [10] and practical experience from the ECN CFB gasifier BIVKIN
[11].
The system for the Indirect gasifier is based on the ECN MILENA
technology [12, 13]. The basic working principles of the MILENA gasifier are
similar to the SilvaGas [14] Indirect gasifier. Biomass is fed into a riser where a
small amount of superheated steam is added (5wt.% of the biomass input). Hot bed
material (typically sand) enters the riser from the combustor through a hole in the
riser, which is located under the biomass feeding point. The bed material heats the
biomass to typically 850°C. The heated fuel particles degasify and create a vertical
linear velocity of approximately 6 m s-1, leading to a “turbulent fluidization”
regime in the riser and a carry-over of the bed material together with the degasified
biomass particles (char). The vertical velocity of the gas is reduced in the settling
chamber, causing the larger solids (bed material and char) to separate from the gas
and to fall down into the downcomer. The producer gas leaves the reactor from the
top and is sent to the cooling and gas cleaning section. The char is burned in the
Bubbling Fluidized Bed, were it heats the bed material to approximately 925°C.
The heated bed material leaves the Bubbling Fluidized Bed from the bottom and is
sent to the riser again. Measurement in the lab-scale Indirect gasifier, MILENA,
have shown that the nitrogen content in the producer gas can be as low as 1 vol.%
(in dry gas) by purging the feeding system with CO2 and minimizing the flue gas
leaking from the combustor to the gasifier. A leakage of flue gas from combustor to
gasifier of 1% is calculated from the measured nitrogen concentration in the
producer gas.
The carbon conversion (CC) in the Indirect gasifier was calculated using the
following relation:

Selection of optimal gasification route for SNG production
57
CC(%) = 65 + 0.15 * (T-760) T in °C (4.1)
This relation is an estimate based on experimental results from the ECN
MILENA lab-scale gasifier using wood particles between 0.3 and 3 mm and
conversion data published for the Battelle/Silvagas Indirect gasifier [14]. Again a
gasifier heat loss of 1% was assumed.
The gasifier exit gas compositions for all cases were calculated using
empirical relations and assuming an offset temperature for water gas shift
equilibrium. Table 4.2 shows the relations used for the two Fluidized Bed gasifiers
and the Entrained Flow gasifier.
Table 4.2: Relations used to calculate gasifier outlet gas composition.
Component Fluidized Bed Entrained Flow
CH4 [kg kg-1 fuel d.a.f.] 0.0873-0.082•ER 0
C2H2 [mol mol-1 CH4] 0.02 0
C2H4 [mol mol-1 CH4] 0.32 0
C2H6 [mol mol-1 CH4] 0.02 0
C6H6 [mol mol-1 CH4] 0.08 0
C7H8 [mol mol-1 CH4] 0.01 0
NH3 [mol] 0.5 • N in fuel 0
H2S [mol] 0.9 • S in fuel 0.9 • S in fuel
COS [mol] 0.1 • S in fuel 0.1 • S in fuel
The ER (equivalence ratio) is defined as the amount of oxygen fed into the
gasifier divided by the amount of oxygen required for stoichiometric combustion of
the biomass. The relation given in the table and used in the model for the yield of
methane as function of ER was published by Maniatis [15]. These relations
correspond well with ECN measurements from Bubbling Fluidized Bed,
Circulating Fluidized Bed and Indirect gasification between 800 and 900°C at
atmospheric pressure and wood as fuel. For Indirect gasification an ER of 0 was

Chapter 4
58
used in the calculation. The relations for the higher hydrocarbons are determined
from experiments in the ECN lab-scale MILENA gasifier [13]. The influence of
pressure on the formation of hydrocarbons in Fluidized Bed biomass gasifiers is not
known yet, therefore the same relations as for atmospheric operation were used.
The tar concentration in the raw producer gas is 30 g Nm-3 dry for both Fluidized
Bed gasifiers. This figure is relatively high because no catalytically active bed
material, like olivine, is used in the gasifier to reduce the tar concentration and tar
from the gas cleaning section is returned to the gasifier in the case of CFB
gasification. The water gas shift equilibrium is set at 1200°C for the fluidized bed
gasifiers and at operating temperature for the EF gasifier.
Chloride (as HCl) and NH3 leaving the gasifiers have minor influence on the
overall energy balance and are therefore neglected.
4.2.3 Gas cooling and gas cleaning
Syngas from the Entrained Flow gasifier is cooled down to 600°C by quenching
with its own cooled gas of 250°C. A gas quench is chosen to prevent salt
condensation and deposition on the downstream heat exchangers. The gas is cooled
further by a conventional heat exchanger. The heat is used to produce steam.
Producer gas leaving the CFB or Indirect gasifier is cooled down to 400°C.
This temperature is selected to stay above the dew point of the tar in the gas. The
heat is used to preheat the air to the Indirect gasifier and/or to superheat steam. In
the Indirect gasifier the fly ashes removed by a cyclone from the producer gas are
sent back to the combustor, where the carbon in the ash is converted into flue gas.
The completely converted ashes are blown out of the combustor and are collected
in a bag-house filter. The carbon containing ashes from the CFB gasifier are
disposed. Tar and remaining dust are removed by the OLGA gas cleaning
technology [16]. The OLGA gas cleaning system consists of three stages. In the
first stage, the collector (OC in Figure 4-3 and Figure 4-4), heavy tars are
condensed from the gas by contacting the gas with cooled scrubbing oil. Most of

Selection of optimal gasification route for SNG production
59
the fine dust that passes through the upstream cyclone is also removed with the
scrubbing liquid. Dust and heavy tar are separated from the oil and returned to the
gasifier. In the Indirect gasifier the heavy tar is used as fuel for the combustor. In
the second stage, the absorber (OA in Figure 4-3 and Figure 4-4), light tar
components are dissolved in the oil. The absorber is operated above the water dew
point to prevent condensation of water. Producer gas exiting the OLGA absorber is
free of condensable tars. The oil from the absorber is sent to the third stage of the
OLGA system, the stripper (OS in Figure 4-3 and Figure 4-4). The stripper is either
operated with air at 180°C (Indirect gasifier) or with steam at 210°C (CFB
gasifier). The air or steam leaving the stripper contains some oil, that can be partly
regained in a condenser if air is used to operate the stripper. The oil consumption of
the OLGA system is 0.1 g Nm-3 for the stripper operated on air (Indirect gasifier)
and 1 g Nm-3 for the stripper operated on steam (CFB). The oil consumption is only
a fraction of the thermal input of the plant and is therefore neglected in the overall
heat balance. More information on the OLGA can be found in paragraph 6.6.4.
4.2.4 Cl and Sulphur removal
Clean biomass like wood contains low amounts of sulphur and chloride. A 1 GWth
gasifier fed with clean wood produces 2500 kg day-1 of sulphur. Typically 90% of
the sulphur converts into H2S and 10% into COS. Other organic sulphur
compounds are neglected in this study. Measured HCl concentrations in raw
producer gas are low (<5 ppm). The Cl concentration in wood is low already and
most of the chloride is removed from the gas together with the ash. The maximum
allowable sulphur inlet concentration for the different methanation catalysts is not
known yet. An acceptable inlet concentration of 100 ppb is assumed for this study.
A ZnO sorbent is selected for the bulk sulphur removal. This sorbent can remove
H2S and COS. Non regenerative processes are commercially available and
regenerative processes are under development. The removal principle is based on
the following equilibrium:

Chapter 4
60
ZnO + H2S ↔ ZnS + H2O (4.2)
In this case the majority of H2S is removed at 250°C. A guard bed removes
the remaining H2S at a slightly lower temperature (160°C). The same guard bed
reactor is used to remove HCl. In the case of Fluidized Bed gasification other
organic sulphur compounds are present in the producer gas as well. It is assumed
that these components are converted to H2S and removed by the ZnO sorbent. ECN
is testing different sorbents/catalysts for this goal. Ammonia removal is not
included in the analysis.
4.2.5 Methanation
CO and H2 in the cleaned gas are converted into CH4 by the following strongly
exothermic reactions:
CO + 3 H2 ↔ CH4 + H2O ∆H°298 = -206 kJ mol-1 (4.3)
CO2 + 4H2 ↔ CH4 + 2H2O ∆H°298 = -165 kJ mol-1 (4.4)
The generated heat is used to produce steam. In the case of Fluidized Bed
gasification a major problem is the formation of soot in the methanation reactors
which deactivates the catalyst and blocks the system. The presence of higher
hydrocarbons in the producer gas seems to enhance the formation of soot on the
methanation catalysts [17]. The required boundary conditions to prevent the
formation of soot on the methanation catalyst are not well known yet, but, in
theory, it can be suppressed by adding steam prior to the methanation. Table 4.3
shows the resulting steam to dry gas ratios for the three different configurations on
the basis of Aspen Plus® calculations.

Selection of optimal gasification route for SNG production
61
Table 4.3: Required steam to dry gas ratios to prevent soot formation
Gasifier Operating pressure
methanation unit [bar] Final methanation temperature [°C]
Steam to dry gas ratio [mol mol-1]
EF 30 280 1.4
CFB O2/Steam 10 280 1.4
Indirect 7 280 1.5
The steam gas mixture is preheated to 350°C before it enters the first
methanation reactor.
4.2.6 SNG upgrading
The SNG upgrading step is similar for the different systems, therefore this step is
not modeled in detail. Gas leaving the last methanation reactor is cooled and water
is condensed out of the gas which is then compressed to 30 bar (if required).
Different CO2 removal technologies are commercially available: PSA
(Pressure Swing Adsorption), Physical absorption (e.g. Selexol process) or
membrane gas separation (UOP Separex membrane). In this study CO2 is assumed
to be removed for 98%. The energy consumption for CO2 removal is calculated
from the required pumping energy for the solvent in a Selexol unit [18]. The CH4
loss is assumed to be 1%. The CO2 rich gas is sequestrated in empty gas fields,
which means that the overall process becomes CO2 negative. The required
compression energy is not included in the calculated overall efficiency.
The Swiss national standard for unlimited gas injection limits the hydrogen
concentration in SNG to 5 vol.% [19]. This value was used in this study as the
maximum allowable hydrogen concentration in the final SNG. The H2
concentration can be kept below this concentration by choosing the appropriate
operating conditions (temperature and pressure) of the last methanation reactor.
Although additional H2 removal is not required, selective oxidation could be
applied if necessary.
Chapter 4
62
4.2.7 Steam system
All heat above 200°C is used within the system to generate steam or preheat
combustion air. The remaining low temperature heat is sufficient for heating all
feed water to 150°C. Most of the heat is used to produce low pressure (10 bar) and
medium pressure (60 bar) steam of which a significant part is mixed into the
producer gas before the methanation unit to prevent soot formation. The remaining
steam is sent to medium and low pressure steam turbines. An isentropic efficiency
of 80% and a mechanical efficiency of 98% are assumed for the steam turbines.
4.2.8 Electricity consumption
An overall electricity consumption of 1.5% of biomass input to the gasifier (HHV
basis) is assumed. Major electricity consumers like the air separation unit and the
different gas compressors, are not included in this figure and calculated separately.
An isentropic efficiency of 80% and a mechanical efficiency of 98% are assumed
for the gas compressors. The cryogenic air separation unit consumes 0.4 kWhe Nm-
3 oxygen [20].
4.3 Results
The performance of a gasifier is given by its Cold Gas Efficiency (CGE), which is
defined here by the heating value of the dry, cold producer gas after gas cleaning
divided by the heating value of the biomass or torrefied biomass to the gasifier. The
CGE on HHV basis is defined as the higher heating value of the dry and cleaned
gas divided by the higher heating value of the biomass. The CGE on LHV (lower
heating value) basis is defined as the lower heating value of the dry and cleaned gas
(thus excluding condensation heat of water in the gas produced when the gas is
combusted) divided by the lower heating value of the biomass. Figure 4-5 shows
the calculated Cold Gas Efficiencies for the different gasifiers.

Selection of optimal gasification route for SNG production
63
77.4
74.9
81.1
75.9
73.7
80.0
70
75
80
85
EF Torrefied wood 30 bar CFB oxygen 10 bar Allothermal 1 bar
Col
d ga
s ef
ficie
ncy
(CG
E)
[%]
LHVHHV
Figure 4-5: Cold Gas Efficiencies for the three different biomass gasifiers.
It should be noted that the cold gas efficiency presented for Entrained Flow
gasification (EF) does not include the efficiency from wood to torrefied wood.
Torrefaction gives a loss of approximately 10% on HHV basis and 7% on LHV
basis. The torrefaction process is still under development. The efficiencies assumed
for torrefaction are based on preliminary data. Figure 4-6 visualizes the different
losses on Cold Gas Efficiency for the three gasifiers.

Chapter 4
64
-10
-5
0
5
10
15
20
25
30
35
40
EF Torrefaction 30 bar CFB oxygen 10 bar Allothermal 1 bar
Loss
in C
old
Gas
Effi
cien
cy [L
HV
%]
Latent heat combustor Pre heating air / oxygen / steam
Latent heat producer gas / syngas Heat from reactor vessel
Carbon loss
Figure 4-6: Visualization of losses in Cold Gas efficiency (CGE).
The main loss in cold gas efficiency for the Entrained Flow gasifier is due to
the latent heat in the syngas. The gasifier exit temperature of the Entrained Flow
gasifier is ±450°C higher than the exit temperatures of the two Fluidized Bed
gasifiers. The main losses for the CFB gasifier are due to the unconverted carbon in
the ash and the latent heat in the producer gas. The Indirect gasifier has the highest
cold gas efficiency, because the losses are reduced to a minimum. The combined
latent heat in flue gas and producer gas is the highest, but is compensated by
preheating the combustion air. Table 4.4 gives the gas compositions for the three
gasifiers after tar removal.
Table 4.4: Gasifier wet gas compositions (after tar removal, if applicable).
EF Torrefied wood 30 bar
CFB oxygen 10 bar
Indirect 1 bar
CO [mol%] 49.8 18.7 25.9
H2 [mol%] 18.6 14.4 21.3

Selection of optimal gasification route for SNG production
65
CO2 [mol%] 14.7 19.8 12.0
O2 [mol%] 0.0 0.0 0.0
H2O [mol%] 16.5 39.2 24.8
CH4 [mol%] 0.0 5.1 10.3
N2 + Ar [mol%] 0.3 0.4 0.9
C2H2 [mol%] 0.0 0.1 0.3
C2H4 [mol%] 0.0 1.7 3.4
C2H6 [mol%] 0.0 0.1 0.2
C6H6 [mol%] 0.0 0.3 0.6
C7H8 [mol%] 0.0 0.0 0.1
H2S [ppm] 195 200 314
COS [ppm] 22 22 35
NH3 [ppm] 0 1471 2308
The concentrations of methane and other hydrocarbons in the gas from the
Indirect gasifier are higher than those in the gas from the CFB gasifier, because the
water concentration is lower and no methane is burned. As can be seen in Table 4.2
the yield of hydrocarbons is a function of the air to fuel ratio (ER). A typical ER for
an oxygen – steam blown CFB is 0.25. The air to fuel ratio in an Indirect gasifier is
near zero, giving the maximum yield in hydrocarbons. A high initial concentration
of methane and other hydrocarbons has a positive influence on overall efficiency to
SNG.
The overall efficiencies to SNG are calculated on a net and gross basis.
Gross efficiency does not take into account the electricity production or
consumption of the system. To calculate the net efficiency the electricity consumed
(or produced) is assumed to be produced by converting SNG into electricity with an
efficiency of 60% for electricity generation. Figure 4-7 shows the calculated overall
efficiencies of biomass to SNG at 30 bar. As can be seen from the figure the gross
efficiencies to SNG are relatively low for Entrained Flow gasification. The net

Chapter 4
66
efficiency is higher, because the system produces electricity. The other two systems
consume electricity. The reason for the net electricity production in the EF based
system is the significantly higher production of steam in both the syngas cooler and
the methanation unit. The overall efficiencies are higher on HHV basis than on
LHV basis. It is caused by the conversion of CO into CH4 in the methanation
reactors. The lower and higher heating values of CO are equal, while the higher
heating value of CH4 is higher than the lower heating value.
52.7
63.5
70.3
53.2
64.1
70.9
54.3
58.1
66.8
54.7
59.2
67.8
50
55
60
65
70
75
EF Torrefaction 30 bar CFB oxygen 10 bar Allothermal 1 bar
Effi
cien
cy to
SN
G [%
]
LHV (gross)HHV (gross)LHV (net)HHV (net)
Figure 4-7: Gross efficiency to SNG and net efficiency to SNG and electricity.
Gross and net overall efficiencies on LHV and HHV basis are highest for the
Indirect atmospheric gasifier. These high values are due to the low losses, both heat
and unconverted carbon, and the fact that the gas from the gasifier already contains
a significant amount of hydrocarbons. These hydrocarbons, as indicated in Table
4.4, amount to a 55% contribution to the calorific value of the producer gas.
Hydrocarbons are converted into methane with a relatively high efficiency
compared to the conversion of syngas into methane. The gas after the methanation
reactors in all three systems contains approximately 60 mol% of water. All the
condensation heat of this water (approximately 20% of the thermal input) is not

Selection of optimal gasification route for SNG production
67
used in the defined systems. If a biomass dryer is integrated in the system this low
temperature heat can be used to dry the biomass. Integrating the drying step will
increase overall efficiency for all defined systems. Another possible improvement
of the systems efficiency is reduction of the amount of steam required in the
different methanation steps to prevent formation of soot. The amount of steam
required is now based on thermodynamic equilibrium calculations.
The Indirect gasifier is operated at atmospheric pressure, because pressurized
operation of an Indirect gasifier is not yet demonstrated. In principle it is possible
to operate an Indirect gasifier at elevated pressures which will further increase the
overall efficiency. The methane yield is possibly increased by pressure. This will
have a positive effect on overall efficiency to SNG.
Table 4.5 shows the calculated concentrations of the major components in
the produced SNG after water and CO2 removal. As can be seen the calculated
heating values are similar. The amount of H2 is lower in the case of EF gasification,
because the methanation pressure is higher. The concentration of CO is below 0.1
mol% in all cases. The gas composition can be influenced by changing the level of
CO2 removal.
Table 4.5: SNG gas compositions.
EF Torrefied wood 30 bar
CFB oxygen 10 bar
Indirect 1 bar
CH4 [mol%] 90.5 89.9 90.7
H2 [mol%] 2.5 3.9 4.1
CO2 [mol%] 5.1 3.3 1.8
N2 + Ar [mol%] 1.7 2.4 3.0
LHV [MJ m-3] 33.5 32.8 33.3
HHV [MJ m-3] 37.2 36.4 37.0
From a technical point of view the gas should be suitable to replace fossil
natural gas, but exact specifications for injection in the natural gas grid are not yet
clear and may vary per country.

Chapter 4
68
4.4 Concluding remarks
Overall efficiency to SNG is highest for Indirect gasification. The net overall
efficiencies on LHV basis, including electricity consumption and pretreatment but
excluding transport of biomass are 54% for Entrained Flow, 58% for CFB and 67%
for Indirect gasification.
Because of the significant differences in overall efficiencies to SNG for the
different gasifiers, ECN decided to select the Indirect gasification as the preferred
technology for the production of SNG.
In a recent study a comparison was made between a MILENA based SNG
system and a SNG system based on the FICFB gasification technology combined
with the PSI methanation technology [21]. The differences between the two
concepts have been quantified and estimated to be 6 %abs on overall efficiency from
wood to Bio-SNG in favor of the MILENA concept. The main reason for this
difference is the relatively large amount of steam that is required for the FICFB
process.
4.5 References
1. Bergman, P.C.A., Boersma, A.R., Kiel, J.H.A., Wilberink, R.W.A.,
Bodenstaff.H., Heere, P.G.T., 2003. Torrefaction for entrained flow
gasification of biomass (Torrefactie ten behoeve van entrained-flow
vergassing van biomassa), Petten, the Netherlands, ECN ,ECN-C-05-067.
2. Zwart, R.W.R., Boerrigter, H., van der Drift, A., 2006. The impact of biomass
pre-treatment on the feasibility of overseas biomass conversion to Fischer-
Tropsch products. Energy and Fuels 20.
3. Bergman, P.C.A., 2005. Combined torrefaction and pelletisation, the TOP
process, Petten, the Netherlands, ECN, ECN-C-05-073.
Selection of optimal gasification route for SNG production
69
4. Buratti, C., Costarelli, I., Crisostomi, L., Fantozzi, F., 2005. The Biomass
Centre Laboratory for Biomass Characterization.
5. Kanaar, M., van Dongen, A., 2006. Co-gasification at the Buggenum IGCC
Power Plant. In: DGMK-Fachtagung "Energetische Nutzung von Biomassen",
24. bis 26. April 2006 in Velen (Deutschland).
6. van der Drift, A., Boerrigter, H., Coda, B., Cieplik, M.K., Hemmes, K., 2004.
Entrained flow gasification of biomass; ash behaviour, feeding issues, and
system analyses, ECN, Petten, The Netherlands, ECN-C-04-039.
7. Higman, C., Burgt, M.v.d., 2008. Gasification, Second Edition, Elsevier,
ISBN 978-0-7506-8528-3.
8. Visser, H.J.M., van Lith, S., Kiel, J.H.A., 2002. Agglomeration due to biomass
ash-bed material interactions in fluidised bed reactors. In: 12th European
Conference on Biomass for Energy, 17-21 June 2002, Amsterdam, the
Netherlands.
9. Hannula, I., Kurkela, E., 2010. A parametric modelling study for pressurised
steam/O2-blown fluidised-bed gasification of wood with catalytic reforming.
10. van der Drift, A., de Kant, H.F., Rajani, J.B., 2000. Commercialisation
BIVKIN-based gasification technology, non-confidential version, Petten, the
Netherlands, ECN, ECN-C-00-080.
11. van der Drift, A., van der Meijden, C.M., Strating, S.D., 2002. Hogere
koolstofconversie in CFB-biomassavergassers, ECN, Petten, the Netherlands,
ECN-C-03-053.
12. van der Drift, A., van der Meijden, C.M., Boerrigter, H., 2005. MILENA
gasification technology for high efficient SNG production from biomass. In:
14th European Biomass Conference & Exhibition, 17-21 October 2005, Paris,
France.
13. van der Meijden, C.M., van der Drift, A., Vreugdenhil, B.J., 2007.
Experimental results from the allothermal biomass gasifier Milena. In: 15th
European Biomass Conference, 7-11 May 2007, Berlin, Germany.

Chapter 4
70
14. Paisley, M.A., Feldmann, H.F., Appelbaum, H.R., 1984. Development of a
high throughput gasifier to reduce a medium btu gas from wood.
15. Maniatis, K., Vassilatos, V., Kyritsis, S., 1994. Design of a pilot plant
fluidized bed gasifier. Advances in thermochemical biomass conversion 1.
16. Boerrigter, H., van Paasen, S.V.B., Bergman, P.C.A., Könemann, J.W.,
Emmen, R., Wijnands, A., 2005. OLGA tar removal technology, Petten, The
Netherlands, ECN, ECN-C--05-009.
17. Czekaj, I., Loviat, F., Raimondi, F., Wambach, J., Biollaz, S., 2007.
Deactivation Process of Ni/Al2O3 Catalyst during Methanation by Biomass-
derived Synthesis Gas. In: EUROPACAT VIII, Catalyst deactivation,
regeneration and recycling Session, Turku Fair Centre, Turku/Åbo,
Finland, August 26-31, 2007.
18. Ruben, E.S., Berkenpas, M.B., Frey, H.C., Chen, C., McCoy, S., Zaremsky,
C.J., 2007. Development and application of optimal design capability for coal
gasification systems, DE-AC21-92MC29094.
19. Persson, M., Jönsson, O., Wellinger, A., 2006. Biogas upgrading to vehicle
fuel standards and grid injection, IEA Bioenergy, report from Task 37
(Energy from biogas and landfill gas).
20. van Ree, R., 1992. Luchtscheidingstechnieken, Een inventarisatie van
technieken om 'zuivere' zuurstof te produceren voor de verbranding van
poederkool in een CO2(g)/O2(g)-atmosfeer, The Netherlands, ECN, ECN-I--
92-025.
21. van der Drift, A., Zwart, R.W.R., Vreugdenhil, B.J., Bleijendaal, L.P.J., 2010.
Comparing the options to produce SNG from biomass. In: 18th European
Biomass Conference and Exhibition, 3-7 May 2010, Lyon, France.

Chapter 5
5 MILENA model
Abstract
A pseudo-equilibrium model was made to calculate the gas composition and the
mass and energy balance. The essential empirical relations were obtained from
literature and experiments in CFB and BFB gasifiers. These relations were updated
using data from the lab-scale and pilot scale gasifiers. The MILENA model is
described in this chapter. The relations obtained from experimental work in the
MILENA are described in chapter 7.
5.1 Fluidized Bed biomass gasification models
The objective of a biomass gasification model is to predict gas composition, gas
flow and reactor temperature at specified process conditions. These data are
required to dimension the gasification reactor and the connected gas cleaning
equipment. Several models for Fluidized Bed gasification are described in literature
[1, 2]. Many of these models are based on theories about fluidization
hydrodynamics, coupled with kinetic schemes for the heterogeneous and
homogeneous processes occurring inside the gasifier such as drying, pyrolysis, tar
cracking and char gasification. These models are in general very complex and only
include the main gas compounds. This makes practical application difficult.

Chapter 5
72
More simplistic models (excluding hydrodynamics and kinetic schemes) are
often used to describe an integrated gasification system. These models are mostly
based on chemical equilibrium. Aspen Plus® is generally used as modeling tool.
The assumption of chemical equilibrium works very well if high temperature
gasification, like Entrained Flow gasification, is to be described. For Fluidized Bed
gasification this method is not applicable, because a major part of the combustible
compounds is present in the gas as hydrocarbons. At chemical equilibrium the
presence of hydrocarbons is negligible at typical operating conditions of Fluidized
Bed gasifiers.
A commonly used method to apply the equilibrium calculation is to define a
negative offset temperature for the equilibrium temperature of the methanation
reaction. By doing this it is possible to fit the main gas composition (CO, CO2, H2,
H2O and CH4) to measured values. The higher hydrocarbons are not included, but
their impact is not large as CH4 represents the major part of the hydrocarbons. This
method is only applicable at the temperature and pressure at which the offset
temperature could be fitted to the experimental data.
The method selected by ECN for modeling the MILENA process and other
Fluidized Bed processes is a combination of chemical equilibrium for the CO shift
reaction and empirical relations for the yield of hydrocarbons. This model is best
described as a pseudo-equilibrium model. VTT uses a similar approach [3, 4].
CFD analysis was used to predict gas flow patterns in the MILENA settling
chamber. A more detailed model of the gasifier riser was made to predict the char
conversion of different biomass particles in the gasifier riser [5]. A summary of the
results is given in paragraph 6.2.
5.2 MILENA pseudo-equilibrium model
The first step in the design process of the gasifier is the calculation of the mass and
energy balances. Aspen Plus® has been used in the past to model Fluidized Bed
gasification, but because of the many empirical relations that are required the use of

MILENA model
73
Excel is more convenient. The Excel model made for this purpose solves the
component- and energy balances. The model is an adaptation of a model made for
the CFB gasifier BIVKIN, which is extensively verified using data from lab-scale,
pilot-scale and commercial scale Fluidized Bed gasifiers.
5.2.1 Model layout
Figure 5-1 shows the basic layout of the Excel model. The model includes the
conversion of the producer gas into Bio-SNG. This makes it possible to see the
effect of gasifier process parameter variations on overall efficiency to SNG. The
model is divided into different process blocks (e.g. drying, gasification, char
combustion, etc.). The energy and component balances are solved for each process
step where the individual process blocks produce outputs which act as inputs for
the next step. For example: the gasifier produces char. The amount and
composition of the char is an input variable for the combustion step. The
temperature of the exiting gases and solids results from the energy balance over the
block describing the combustion.
The Gasifier and Combustor block are described in more detail, because
these are the essential blocks to describe an Indirect Gasifier.

Chapter 5
74
SNG CO2 H2O
Com
bust
or
Gas
ifier
W
Pos
t co
mbu
stio
n
F
C
Ash Ash
A
T
C C
Tar
cra
cker
F
O
Gas
cle
anin
g
Pre
-ref
orm
er
Met
hana
tion
T
P
C C C
P
P
P P
W
F F
Ash
Ash
B
Drying B
A
A Air C Char I Inerts (N2) P Producer gas W Water B Biomass F Flue gas O Oxygen T Tar Heat
A
A
Figure 5-1: Basic layout of the integrated MILENA thermodynamic model
The Drying block simulates a simple single pass rotary air drum dryer in
which heated air is used to dry the biomass. The outlet air temperature is set at a
fixed value (typically 20°C) above the water dew point of the air exiting the dryer.
The block is used to calculate the influence of integrating a dryer when relatively
wet biomass is foreseen as fuel. The integration of a dryer can increase the overall
efficiency on LHV basis significantly.
The Gasifier block converts the solid fuel into a combustible gas containing
also pollutants like fly-ash, tar, chloride and sulphur.
The Tar cracker block can be used to describe a thermal or a catalytic tar
cracker/reformer. Oxygen is normally added to keep the process at the required
operating temperature.
A simple Gas cleaning block is integrated into the overall model to calculate
the amount of light and heavy tars that are removed and become available as fuel
for the combustor. The NH3 concentration after the gas cleaning system can be
entered. Ammonia has a relatively high heating value, so the removal rate has a
significant influence on the heat balance. Ammonia is not returned to the gasifier.
The water removal rate is calculated from the specified water dew point. The Cold
MILENA model
75
Gas Efficiency (CGE) is calculated in the Gas cleaning block, because the removal
or recycle of tars, BTX and NH3 influences the CGE. The raw gas from the
MILENA is normally not directly usable (with the exception of direct firing in a
boiler), so defining the CGE after cleaning the gas is more logical.
Upgrading of the gas is described by the Pre-reformer and Methanation
block. Both reactors are normally at chemical equilibrium. Steam can be added to
prevent soot formation. The outlet of the Methanation block is used to calculate the
overall efficiency from wood to Bio-SNG.
A separate calculation block is used in the model to check the hydrodynamic
behavior of the bed material and char particles.
5.2.2 MILENA gasifier
The MILENA gasifier is described by the combination of the Gasifier block and the
Combustor block. Figure 5-2 shows the two blocks and their connections in more
detail. Biomass (B) is fed into the gasifier with some inert gas (I) to purge the
feeding screw. Air (A) or steam is added to the bottom of the gasifier as
fluidization agent. The biomass is converted in producer gas (P) and char (C). The
tars are included in the producer gas (P). Most of the char is separated from the
producer gas and falls down in the combustor. The remaining char leaves the
gasifier as fine dust.
Some of the producer gas (P) leaks into the combustor. The red arrows
represent the heat that is transferred from the combustor to the gasifier by the
circulating bed material. Some air (A) or Flue gas (F) can leak from the combustor
into the gasifier. Oxygen (O) can be transported from the combustor to the gasifier
by the circulating bed material.
Air (A) is added to the combustor to convert the char in flue gas. Light tars
(T2) and heavy tars (T1) from the OLGA gas cleaning are combusted as well. The
flue gas (F) and the remaining ash leave the combustor bed. The small red arrow
represents the heat loss from the reactor.

Chapter 5
76
A
F
O
Com
bust
or
Gas
ifier
A + T2 W
I
C
Ash
C + T1
F C
P
B
A Air C Char I Inerts (N2) P Producer gas W Water B Biomass F Flue gas O Oxygen T Tar Heat
P
A
Figure 5-2: MILENA gasifier and combustor blocks.
The Gasifier block calculates the gas composition using empirical relations
for the hydrocarbons. The concentrations of CO, CO2, H2 and H2O are results of the
component balances and the water gas shift equilibrium. The method of calculating
the gas composition and the carbon conversion is explained in more detail below.
The net heat input into the gasifier is calculated from the temperature
difference between combustor and gasifier and the circulation rate of the bed
material. This circulation rate of the bed material is used as an input parameter. The
higher the circulation rate, the lower the temperature difference between combustor
and gasifier. The circulation rate is normally set at 40 times the amount of biomass
fed to the gasifier, which results in a typical temperature difference between
combustor and gasifier of 70°C when an inert bed material like sand is used.
The main purpose of the Combustor block is to calculate the amount of heat
that is available to the Gasifier block. The majority of the fuel for the Combustor
block is the char which is produced in the Gasifier. Separation efficiency for char in
the settling chamber must be specified. The typical value is 90%, leaving 10% of
the char to be entrained with the producer gas leaving the gasifier. This residual

MILENA model
77
char is collected after the producer gas cooler and recycled to the Combustor. The
Combustor is operated at a low air to fuel ratio (typical lambda value of 1.1). The
lambda value can be entered as a set point value so that the combustion air flow can
be calculated. The combustion air temperature is an input value. Preheating has a
strong positive effect on CGE, so, in theory, this temperature should be as high as
possible, but for reasons of practical integration, normally the pre-heat temperature
is limited to 320 – 400°C. The char composition influences the concentration of
pollutants like HCl and SOx in the flue gas.
The assumed char composition and distribution of pollutants over the
producer gas and char are explained in more detail below. The NOx concentration
in the flue gas is not calculated, but taken as an input value. Part of the fuel (char)
bound nitrogen is converted into NOx, but no (empirical) relations are known for
their concentrations. The concentration of CO and unburned hydrocarbons in the
flue gas is taken to be zero in the model. In practice these concentrations are very
low (<< 0.1 vol.%) and have a negligible effect on the overall balance.
The flue gases from the BFB section of the combustor are post combusted in
the freeboard of the MILENA to reduce emissions of CO and CxHy. The typical O2
concentration in the flue gas of the MILENA combustor outlet is between 4 and 6
vol.%. The Post combustion block is used to simulate this section (see Figure 5-1).
In the model the concentrations of CO and CxHy are already zero in the gas exit of
the Combustion block, so the Post combustion block calculates only the drop in
flue gas temperature due to dilution of the flue gas with air.
Optionally, gas exchange between the Combustor block and Gasifier block
can be integrated into the model. Flue gas can leak from the Combustor into the
gasifier. The typical leakage is set to 0.8% of the total flue gas flow in the
Combustor block. This value was obtained from measurements. Producer gas can
leak via the downcomers into the combustor, where it acts as additional fuel.
During normal operation this leakage is very small and therefore neglected. It was
observed that some bed materials (e.g. olivine) can transport oxygen from the
combustor to the gasifier. This is caused by oxidation and reduction of, for
Chapter 5
78
example, iron. In the model this is simulated by an oxygen flow from the
Combustor block into the Gasifier block.
5.2.3 Gas composition
The gas composition of a gas produced in a Fluidized Bed gasifier at 850°C is not
at chemical equilibrium, except for the water gas shift reaction if a catalytic bed
material is used. The concentrations of hydrocarbons are significantly higher than
calculated using the equilibrium approach. Empirical relations are used to estimate
the yield of hydrocarbons. A similar approach was selected by VTT [3]. The
equations used by ECN are given table 4.2. The relation to predict the CH4 yield as
function of the Equivalence Ratio (ER) is obtained from literature [6]. This relation
is verified with data from various ECN Fluidized Bed gasifiers and appears to be
reliable. ER is defined as the amount of oxygen fed into the gasifier divided by the
amount of oxygen required for stoichiometric combustion of the biomass.
The yield of higher hydrocarbons is a fraction of the methane yield. The
fractions are obtained from measurements originally done in the CFB gasifier
BIVKIN, but later are adapted using data from the lab-scale and pilot-scale
MILENA gasifiers. The work described in this thesis resulted in updated relations
for the hydrocarbon yield. The updated relations can be found in chapter 7.
It must be noticed that the relation used for CH4 does not include
temperature. Measurements have shown that the influence of temperature on
methane yield is small at the typical operating window of Fluidized Bed gasifiers
(770 – 880°C).
5.2.4 Carbon Conversion
Equation 5.1 defines the carbon conversion. The carbon in the tar is included in
Cproducer_gas.
MILENA model
79
fuel
additivesgasfeedgasproducergasc C
CCC −−= __
,ς (5.1)
C is defined as mass flow of carbon in the different streams. Cadditives is
introduced in the relation to compensate for the carbon released by calcination
reactions. Dolomite, for example, undergoes calcination at typical gasifier
conditions releasing CO2. The calcination reactions are endothermic which has to
be taken into account in the heat balance.
Equation 5.2 shows the relation used to calculate the carbon conversion. The
residence time of a biomass/char particle is relatively short, so gasification
reactions of the char with steam or CO2 can be neglected.
ςc,gas = X + Y*(T-760); T in °C. (5.2)
The original carbon conversion relation was based on data published by
Battelle [7] for the gasification of different wood particles/chips. The obtained
values for X and Y were: X = 55 and Y =0.11/°C, but it is not clear whether the
carbon conversion definition used for the conversion by Battelle also includes tar in
the producer gas. The carbon conversion definition used in the MILENA model
includes tar, because tar is in the gas phase at the operating temperature of the
gasifier. Because the residence time in the MILENA riser plus settling chamber is
longer than in the Battelle riser, a higher carbon conversion is assumed. The
following values are estimated and used for the basic design of the MILENA
reactor: X=65 and Y = 0.15/°C.
More recent data found in literature for the Battelle / SilvaGas gasifier result
in the values: X = 56 and Y = 0.126/°C [8] and X = 58 and Y = 0.16/°C [9].
Especially the latter values are close to the assumptions originally made for the
MILENA design. The assumed relations are shown and compared to measured
carbon conversions for the lab-scale installation and pilot plant in chapter 7 (Figure

Chapter 5
80
7-6). The relation is modified based on experimental data from the MILENA pilot
plant (see Chapter 7).
VTT has published a relation for carbon conversion in Fluidized Bed
biomass gasifiers [3, 4], but this relation is fitted to experimental data generated
with an air or steam/oxygen blown gasifier and is therefore not applicable to the
MILENA gasifier.
5.2.5 Char and tar composition
In earlier versions of the MILENA model it was assumed that the char leaving the
gasifier was pure carbon and (inert) ash. The content of other elements was
neglected. From measurements and literature [10] it was found that, especially, the
oxygen content can be significant. Analyses of char produced in the ECN CFB
gasifier are used to set a standard composition of char. Table 5.1 shows the
measured compositions (wood was used as fuel). The average composition is used
in the MILENA model.
Table 5.1: Char composition used in MILENA model
BIVKIN BIVKIN Average
Date 20-11-1997 17-12-2002 -
C [wt.% daf] 90 95 92
H [wt.% daf] 1 1 1
O [wt.% daf] 9 3 6
Experimental data from the pilot plant are used to update the composition.
The updated composition values can be found in Chapter 7.
The sulphur content in the gas is calculated by assuming that all sulphur in
the fuel that is not converted into H2S or COS remains in the char. The same is

MILENA model
81
done for chloride. The nitrogen content in the char is assumed to be 1/3 of the
nitrogen in the fuel.
The composition of the tar leaving the MILENA lab-scale gasifier, operated
at a gasification temperature of approximately 800°C and fed with beech wood
(Rettenmaier Rauchergold, type HBK 750/2000) was measured during the
December 2006 test campaign. During these tests the bed material in the gasifier
was olivine. Six samples were taken and analyzed used the SPA method [11]. The
variations in composition of the different samples are small. The average tar
concentration was 28 g Nm-3 dry. Part of the tar components (22 wt.%) cannot be
identified. Table 5.2 shows the tar composition used in the model.
Table 5.2: Tar composition used in MILENA model
C [wt.%] 94.2
H [wt.%] 5.8
O [wt.%] -
5.3 Use of the model
The MILENA model is used to dimension the lab-scale, pilot-scale and
demonstration-scale MILENA reactors. The model is used to specify the required
operating conditions for the different tests. The model is also used to calculate
deviation from CO shift equilibrium, the carbon conversion, and solids circulation
rate from test data.
Figure 7-19 shows the first page of the MILENA Excel model. The fuel
composition is the first required input. It is also the input parameter that is
responsible for most of the uncertainty in the results. In practice the specified
fuel/biomass composition and heating values are often uncertain. This is checked
by using empirical relations to calculate the heating value from the composition
[12]. Normally the calculated value should be within 3% of the measured heating
value.

Chapter 5
82
The deviation from CO shift equilibrium is defined as the difference between
the calculated CO shift equilibrium temperature and the actual temperature at the
gasifier riser outlet. When a catalytically active bed material like olivine is used the
CO shift reactions are normally close to equilibrium. The typical deviation is
normally between 0 and +400°C. Deviations outside this range are indications for
errors or a catalytically inactive bed material.
Carbon conversion is estimated from the compound balance by fitting the
calculated producer gas CO, producer gas CO2, flue gas O2 and flue gas CO2
concentrations to measured values. The sum of the square of the differences
between calculated and measured gas concentrations is minimized to get the most
reliable results. All other measured values (e.g. flue flow, fuel composition, gas
flows, CH4 concentration, etc.) are put in the model as constants.
The bottom part of the Gasifier block in the model shows the heat balance
over the Gasifier block. The heating value on HHV basis is used to solve the
balance. The heat balance on LHV balance is only used to check for deviations.
The solids circulation rate is calculated from the combined heat balance of the
Gasifier and Combustor block.
5.4 References
1. Nikoo, M.B., Mahinpey, N., 2008. Simulation of biomass gasification in
fluidized bed reactor using Aspen Plus. Biomass & Bioenergy
2. Gomez-Barea, A., Leckner, B., 2010. Modeling of biomass gasification in
fluidized bed. Progress in Energy and Combustion Science
3. Hannula, I., Kurkela, E., 2010. A semi-empirical model for pressurised air-
blown fluidised-bed gasification of biomass. Bioresource Technology 101
4. Hannula, I., Kurkela, E., 2010. A parametric modelling study for pressurised
steam/O2-blown fluidised-bed gasification of wood with catalytic reforming.
5. Horstink, M., 2010. Modeling the Residence Time of Fuel Particles in the
MILENA Gasification Reactor, Confidential

MILENA model
83
6. Maniatis, K., Vassilatos, V., Kyritsis, S., 1994. Design of a pilot plant
fluidized bed gasifier. Advances in thermochemical biomass conversion 1
7. Feldmann, H.F., 1987. Low inlet gas velocity high throughput biomass
gasifier. Patent WO 87/01719.
8. Paisley, M.A., Litt, R.D., Creamer, K.S., 0 AD. Gasification of refuse-derived
fuel in a high throughput gasification system.
9. Paisley, M.A., Feldmann, H.F., Appelbaum, H.R., 1984. Development of a
high throughput gasifier to produce a medium btu gas from wood.
10. Zanzi, R., Sjöström, K., Björnborn, E., 1992. Properties of wood char (Ed. D.
O. Hall).
11. Brage, C., Yu Qizhuang, Sjostrom, K., 2007. A New Method for the Analysis
of Heavy Tar in Raw Producer Gases from Biomass Gasifiers. In: 15th
European Biomass Conference & Exhibition, 7-11 May 2007, Berlin,
Germany.
12. Bayer, H., Schaller, W., 2002. Calculation of the upper heating value of
biomass. In: 12th European Conference on Biomass for Energy, Industry and
Climate Protection, 17-21 June 2002, Amsterdam, The Netherlands.

Chapter 5
84

Chapter 6
6 MILENA gasification technology
Abstract
In this chapter the MILENA gasification technology and the MILENA lab-scale
and pilot scale plants are described in more detail. A historical overview of the
development is given in the first paragraph. The different design considerations are
described to explain the benefits of the MILENA concept against the CFB concept
which was originally used by ECN for biomass gasification. This chapter ends with
a comparison of the MILENA concept with other Indirect biomass gasification
processes (SilvaGas and FICFB).
6.1 Development
ECN started the development of Fluidized Bed gasification in 1996 with the
realization of the air blown BIVKIN CFB gasifier [1]. Tests done during the first
years of operation showed some limitations of the CFB concept. The carbon
conversion was limited to approximately 90% for dry wood [2], resulting in a
reduced overall efficiency. The residual fly ash therefore contained a high amount
of carbon (typical 50%), making it difficult to dispose this as a waste stream. The
BIVKIN gasifier is of the air blown type, so the producer gas is diluted with
nitrogen up to a concentration of 50 vol.% on dry basis, resulting into relatively

Chapter 6
86
low heating values of less than 7 MJ Nm-3 of the dry gas on LHV basis. When wet
fuels were gasified the heating value was even lower. The relatively low heating
value made it hard to achieve stable combustion of the gas and made it also
unfeasible to upgrade the gas into Bio-SNG. A limited test program was done with
an oxygen steam mixture as gasification agent to prevent the nitrogen dilution and
increase the heating value of the produced gas. The results were somewhat
disappointing, the heating value of the gas increased, but the carbon conversion
decreased and problems with bed agglomeration occurred. ECN did not continue
steam/oxygen blown CFB gasification, but others like VTT were more successful
and continue the development of steam/oxygen blown CFB gasification [3].
Battelle’s Columbus Laboratories had been working on the development of
Indirect gasification since the late 1970's and reported positive results generated
with a 10 ton/day pilot plant using a variety of biomass fuels [4]. The results
reported by Battelle and the experience with the ECN CFB gasifier resulted in the
first design of an ECN indirect gasifier. The concept was originally called STAR.
The STAR cold flow test rig was adapted and used for the further
development of the MILENA process. The settling chamber is still part of the
concept, because even a limited tar reduction can be beneficial, especially in
preventing tar fouling in the producer gas cooler. The successful development of
the OLGA tar removal technology at ECN made it possible to allow the relatively
high tar content in the gas.
In 2003 it was decided to build a second lab-scale Fluidized Bed gasifier at
ECN, because the existing lab-scale gasifier was frequently overbooked. At that
moment Indirect gasification was identified as a promising option for the
production of Bio-SNG [5]. Therefore a lab-scale concept allowing both Indirect
and Direct gasification was adopted. The gasifier was named the “Multipurpose
Integrated Lab-unit for Explorative and iNnovative Achievements in biomass
gasification” or MILENA. By means of a metal insert the gasifier could be
transferred from a Bubbling Fluidized Bed (BFB) gasifier into an Indirect gasifier.
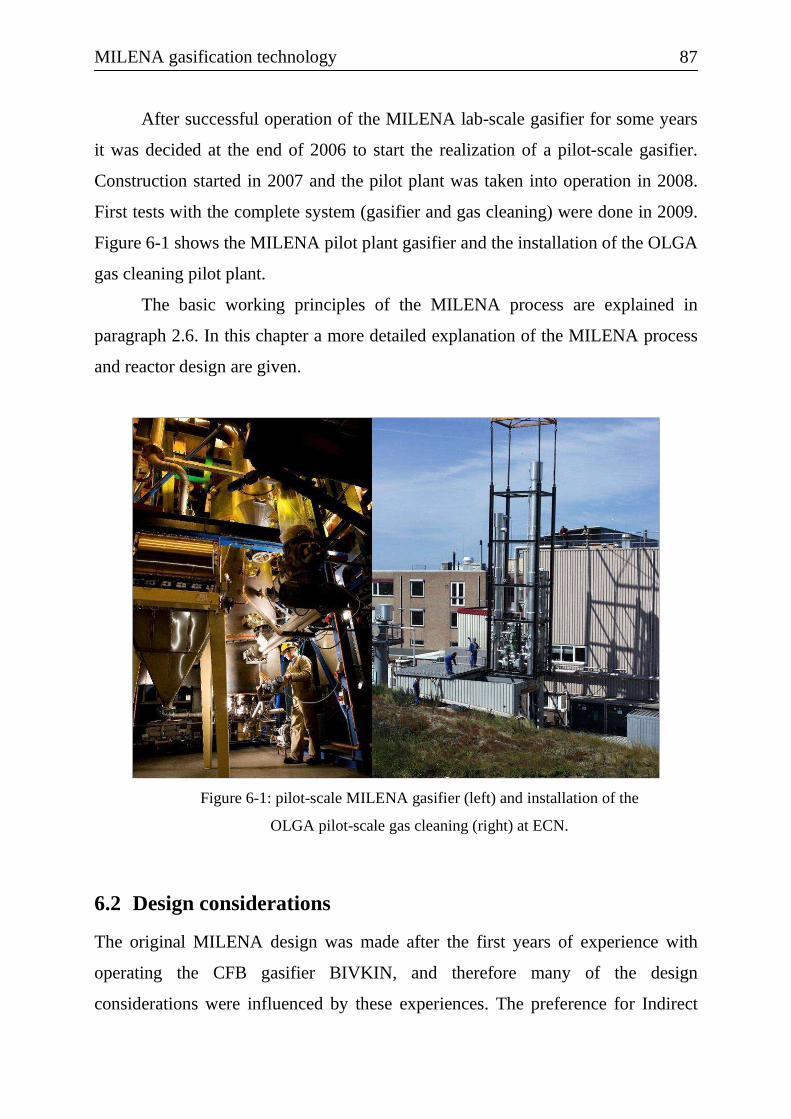
MILENA gasification technology
87
After successful operation of the MILENA lab-scale gasifier for some years
it was decided at the end of 2006 to start the realization of a pilot-scale gasifier.
Construction started in 2007 and the pilot plant was taken into operation in 2008.
First tests with the complete system (gasifier and gas cleaning) were done in 2009.
Figure 6-1 shows the MILENA pilot plant gasifier and the installation of the OLGA
gas cleaning pilot plant.
The basic working principles of the MILENA process are explained in
paragraph 2.6. In this chapter a more detailed explanation of the MILENA process
and reactor design are given.
Figure 6-1: pilot-scale MILENA gasifier (left) and installation of the
OLGA pilot-scale gas cleaning (right) at ECN.
6.2 Design considerations
The original MILENA design was made after the first years of experience with
operating the CFB gasifier BIVKIN, and therefore many of the design
considerations were influenced by these experiences. The preference for Indirect

Chapter 6
88
gasification over Direct gasification was primarily based on the increase in heating
value of the gas and the increase in overall carbon conversion. The following
design considerations resulted in the present MILENA design.
Integrated reactor:
The process was designed to be accommodated in a single reactor vessel. The
original main reasons for doing this were a lack of space and the requirement to
limit the heat loss from the gasifier. The desire to limit horizontal transport of
solids and problems with expansion joints in the ECN CFB gasifier made the
design of an integrated concept more logical. An integrated reactor design is more
suitable for pressurized operation. In the ECN CFB gasifier (BIVKIN) the
circulating solids were transported from the circulation cyclone via the sealpot (a
fluidized bed acting as a non mechanical valve) and a pipe for further downward
flow into the riser. Because of the horizontal distance between the sealpot and the
riser the transport pipe was relatively long which gave some operational problems.
The effective flow diameter of the pipe sometimes decreased because of
agglomerated bed particles sticking to the wall of the pipe. The designs for the
commercial plants that were based on the BIVKIN design were made with an
increased angle for this pipe. The MILENA design was made such that horizontal
transport of the circulating bed material would not be an issue at all. The horizontal
transport (outside the BFB) is limited to the wall thickness of the riser pipe.
When two high temperature reactors are connected to each other, differences
in thermal expansion need to be compensated. This was mostly done by metal
expansion joints which allow differential expansion. In the ECN CFB gasifier this
was a major problem during the first years of testing. The expansion joints broke
frequently and replacement was expensive. After modification the remaining
thermal stresses were still relatively high and resulted in deformation and small
leakages in the sand recirculation system. The MILENA design has no expansion
joints and stresses due to thermal expansion are minimized by an integrated design.
This design allowed the metal insert (the riser, settling chamber and downcomers)

MILENA gasification technology
89
to expand more than the refractory lined reactor. The insert is only connected at the
top of the reactor and can freely move at the bottom part of the reactor. This design
feature is patented [6].
An important characteristic of the lab-scale MILENA design is the ability to
remove the insert (the riser, downcomer and settling chamber). Without the insert
the installation can be used as conventional BFB gasifier or combustor. This made
the MILENA reactor multifunctional, which is important for research purposes.
An integrated reactor design is more suitable for pressurized operation,
because all the parts are placed in a single pressurized vessel. The insert is not
exposed to additional mechanical stresses at pressurized operation. It is expected
that pressurized operation (e.g. 3- 7 bar) of the MILENA will become important for
large scale Bio-SNG production.
Steel insert:
The selection of a steel insert was logical for the lab-scale and pilot plant
installation because alternatives (refractory) are not practical at these scales. The
ECN Engineering and Service department made a short survey and selected the
steel grade 253MA for the lab-scale installation. This same grade was also used in
the pilot plant. Extensive thermal stress analysis using the finite element method
showed that a metal insert was a good solution for the larger scale installations as
well. The steel insert is seen as a part that needs replacement after a certain period
of operation time and is therefore made in such a way that it can easily be removed
from the reactor.
A re-evaluation after some years of operational experience with the lab-scale
and pilot-scale installation revealed that better alloys (higher creep strength at
elevated temperatures and better corrosion resistance) are available at acceptable
prices. These alloys will be used for future testing with the aim to increase the
lifespan of the insert. The goal is to create an insert with a lifespan of several years.
BFB combustor & Riser gasifier:

Chapter 6
90
The primary reason for selecting a BFB combustor was the idea that the
temperature of a char particle during combustion needs to be limited as much as
possible to reduce the risk of bed agglomeration. A BFB is better suited for this
purpose than a riser because the bed density is higher, so more bed particles can
absorb the heat from the burning char particles. The selection of a BFB as
combustor automatically results in the selection of a riser for the gasifier, because
vertical transport of the bed material is required.
The selection of a riser reactor for the gasification process has a positive
effect on Cold Gas Efficiency compared to a BFB, because less dilution gas is
introduced into the gasifier. Fluidization gas is required to fluidize the bottom part
of the riser, not to create the velocity required for vertical transport of the bed
material. The amount of required fluidization gas is mainly influenced by reactor
area and this is much smaller for a riser than a BFB reactor. The velocity in the
riser required for vertical transport of the bed material originates from the fact that
the gas produced during the devolatilization of the biomass adds to the transport
gas flow in the riser.
Number of biomass feeding points:
The number of biomass feeding points is set by the area of the riser were the
biomass is introduced. An important characteristic of risers is that they require less
feeding points than Bubbling Fluidized Beds, as the relatively smaller area and the
increased height of the reactor give a homogeneous radial mixing. The design of
the MILENA gasification concept is such that feeding from two opposite feeding
points is both possible and practical.
An overview of atmospheric CFB combustion boilers given in [7] gives a
largest bed area of 22.5 m2 per feeding point with an average bed area of 5.3 m2 per
feeding point. CFB combustion processes are more sensitive to fuel distribution
than gasification processes, because a local variation in air to fuel ratio can result in
a high concentration of CO and unburned hydrocarbons. Assuming an area/feeding
point ratio of 20 m2 per feeding point, the MILENA technology can be scaled up to

MILENA gasification technology
91
900 MWth under atmospheric conditions using only one feeding point. From a
practical point of view two fuel feeding points are more logical, because biomass
feeding systems can be relatively unreliable. By using two feedings systems at a
design capacity of 70% of the total biomass flow the availability of the plant will
increase drastically, because the operation of the gasifier can continue if one
feeding line fails. The pilot plant is equipped with one feeding system, due to
physical space limitations. The foreseen 10 MWth demonstration plant will be
equipped with two feeding systems.
Bed material:
Sand was selected as the design bed material for both the lab-scale and the pilot
plant. This type of bed material was already in use by ECN in a lab-scale Fluidized
Bed gasifier. This type of bed material shows no catalytic activity towards tar
reduction or the water gas shift reaction. The gas cleaning technology (OLGA)
foreseen can handle the high tar load.
The bed material properties influence the dimensioning of the reactor. Table
6.1 shows the main bed material properties and calculated values for minimum
fluidization velocity and terminal velocity [8] for typical MILENA process
conditions.
Table 6.1: Hydrodynamic bed material properties at atmospheric operating conditions.
Bed material [-] Sand Olivine
Average particle diameter [mm] 0.3 0.3
Particle density [kg m-3] 2600 3200
Bulk density [kg m-3] 1500 1700
Particle sphericity (ψp) [-] 0.8 0.7
Gas pressure [bar] 1 1
Min. fluidization velocity (umf) in flue gas at 900°C [m s-1] 0.05 0.05
Linear gas velocity BFB combustor bed/umf [-] 10 10

Chapter 6
92
Min. fluidization velocity (umf ) in producer gas at 850°C [m s-1] 0.06 0.06
Terminal velocity (ut) in producer gas at 850°C [m s-1] 2.2 2.4
Linear gas velocity riser - Terminal velocity particle (ug - ut) [m s-1] 3.8 3.6
Later tests in the lab-scale installation were done using olivine as bed
material. The hydrodynamic properties are given in the right hand column. The
hydrodynamic properties are close to the properties of the design bed material
(sand) if the same size bed material is used. Olivine is catalytically active. It
reduces the tar content of the producer gas and promotes the water gas shift
reaction. A reduction in tar concentration in the producer gas was required to
prevent clogging in the piping between the MILENA and OLGA at lab-scale. The
pilot plant was also operated with olivine to reduce the risk of fouling problems in
the producer gas cooler. The aim is to replace the olivine again by sand because
this type of bed material is less expensive and the tests done so far have shown that
the loss of bed material is lower when sand is used instead of olivine. The aim to
reduce bed material loss is to some extent conflicting, because some dust in the
producer gas is desired to prevent fouling problems in the gas cooler. The bed
material particles that are blown out of the gasifier are relatively large (> 20 µm)
and dense (typical 2600 kg m-3) compared to the biomass char/ash particles which
are entrained. These large particles sand blast the wall of the producer gas cooler
and thereby prevent fouling.
Biomass residence time:
The MILENA concept is based on (almost) complete devolatilization of the
particles before the remaining char is used in the combustor to generate the heat of
the process. A simplified model was made to estimate the conversion and residence
time of different fuel particles [9]. The required biomass residence time influences
the dimensions of the riser.
The residence time of a biomass particle needs to be sufficient for almost
complete devolatilization. The required residence time strongly depends on the
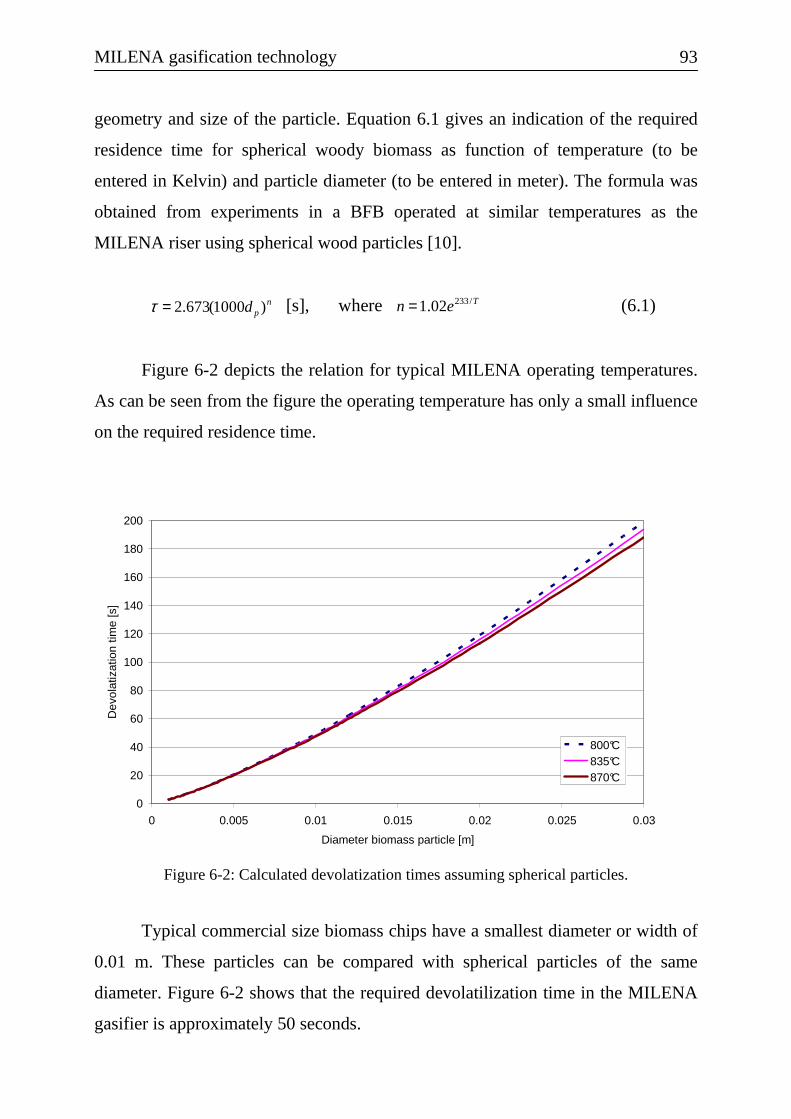
MILENA gasification technology
93
geometry and size of the particle. Equation 6.1 gives an indication of the required
residence time for spherical woody biomass as function of temperature (to be
entered in Kelvin) and particle diameter (to be entered in meter). The formula was
obtained from experiments in a BFB operated at similar temperatures as the
MILENA riser using spherical wood particles [10].
[s], where Ten /23302.1= (6.1)
Figure 6-2 depicts the relation for typical MILENA operating temperatures.
As can be seen from the figure the operating temperature has only a small influence
on the required residence time.
0
20
40
60
80
100
120
140
160
180
200
0 0.005 0.01 0.015 0.02 0.025 0.03
Diameter biomass particle [m]
Dev
olat
izat
ion
time
[s]
800°C835°C870°C
Figure 6-2: Calculated devolatization times assuming spherical particles.
Typical commercial size biomass chips have a smallest diameter or width of
0.01 m. These particles can be compared with spherical particles of the same
diameter. Figure 6-2 shows that the required devolatilization time in the MILENA
gasifier is approximately 50 seconds.
npd )1000(673.2=τ
Chapter 6
94
The devolatilization of the biomass particles takes place in the riser and the
settling chamber. The riser is divided in two zones: a dense zone and a lean zone. A
biomass particle starts its devolatilization in the dense zone of the riser. In this zone
the conditions are similar to a highly expanded stationary Bubbling Fluidized Bed
[11]. In the dense zone the biomass will rise with the same velocity as the bubbles
in the Fluidized Bed [12]. In the lean zone the biomass particles will rise with the
difference in linear gas velocity (ug) and terminal velocity of the biomass particle
(ut).
The terminal velocity of a particle is the result from the equilibrium between
gravity, buoyancy and drag forces. The gravity forces on a particle will reduce in
time because of loss of mass. The buoyancy forces on a particle are mainly
determined by the location in the riser. The density of the surrounding gas-bed
material mixture reduces with height, thereby decreasing the buoyancy force.
Therefore the terminal velocity of a biomass particle will decrease over time and
will decrease when the particle is in a higher location in the riser. When the
terminal velocity of the char particle has decreased below the linear gas velocity the
particle will be blown out of the riser.
Figure 6-3 shows an example of results from modeling work done by Martin
Horstink for the MILENA pilot plant using wood pellets as fuel [9]. The results
show that the particle is close to complete devolatilization when it leaves the riser.

MILENA gasification technology
95
Figure 6-3: Example of fuel particle height profile in the pilot-scale.
Riser dimensions:
The riser diameter is determined by the terminal velocity (ut) of the bed material
and the calculated volume flow of the producer gas. The design gas velocity is the
calculated terminal velocity plus a chosen off-set velocity. Table 6.1 shows the
design values.
The required height of the riser is set by the required time for devolatilization
of the biomass particles. The combined residence time of the biomass particles in
the riser and the settling chamber needs to be sufficient to convert the biomass into
gas and char. Background information on the biomass residence time is given in the
previous section.
Settling chamber:
A settling chamber was selected instead of a cyclone for gas solid separation
because a settling chamber increases the residence time of the producer gas and the

Chapter 6
96
contact time of the gas and the solids (char + bed material). An increased residence
time has a positive effect on fuel conversion and possibly on tar conversion.
The disadvantage of a settling chamber over a cyclone is the lower collection
efficiency of small particles (<0.1 mm). Small particles will be blown out of the
gasifier and are collected by the cyclone that is normally placed before the gas
cleaning. They are recycled to the combustor. The BFB combustor is designed such
that the small particles will leave the system with the flue gas. A positive side
effect of the low removal efficiency of a settling chamber for small particles is the
increased dust load of the gas going through the producer gas cooler. The coarser
particles in the gas (> 20 µm) are used to sand blast the cooler, thereby preventing
fouling problems.
Downcomers:
In general a downcomer (or dipleg or standpipe) is used to transport solids against a
pressure gradient, e.g. in a CFB where solids are transported from a low-pressure
region (outlet cyclone) to a high-pressure region (bottom of the riser). In the
MILENA gasifier the downcomer is used to transport solids between the settling
chamber and the BFB combustor. To minimize gas leakages between combustor
and settling chamber the downcomer is sealed in the fluidized bed. To prevent
(large) bubbles from the fluidized bed entering the downcomer, the end of the
downcomer is protected by a plate. From observations during cold flow tests we
learned that the solids normally move down in moving bed or fluidized bed flow.
Both flow regimes are acceptable for stable operation of the gasifier. The gas
pressure at the outlet of the downcomer is during normal operation approximately
10 mbar higher than the inlet pressure (the pressure in the settling chamber). This
results in an upwards flow of flue gas from the combustor relative to the
downwards moving bed of bed material.
The diameter of the downcomer is set by the velocity of the bed material
flowing down through the downcomer. A moving bed kind of flow was assumed.
The design velocity is 0.1 m s-1 and the design solid circulation rate is 6000 kg h-1

MILENA gasification technology
97
for the pilot plant. The downward velocity of the bed material is, in general, higher
then the upward flow (relative to the bed material) of flue gas, resulting in a net
downwards moving gas flow. A relatively small amount of producer gas leaks into
the combustor bed at normal operation. The amount is influenced by the pressure
difference over the downcomer.
The number of downcomers is set by the required fuel (char) distribution in
the bed and the mechanical design of the ‘insert’. A symmetrical design reduces
mechanical stresses. A local increase in fuel (char) concentration in the bubbling
fluidized bed can result in emissions of CO and unburned hydrocarbons. Large
scale MILENA gasifiers will benefit from multiple downcomers. The lab-scale
installation is equipped with one downcomer. The pilot plant was equipped with
two downcomers, but this was later reduced to one, because the concept of
‘multiple’ downcomers was proven and is not required at the relatively small scale
of the pilot plant (or 10 MWth demo plant.)
Combustor:
The combustor diameter is determined by the minimum fluidization velocity of the
bed particles and the calculated volume flow of flue gas. The design velocity is 10
umf for the pilot plant. A higher ratio would result in a smaller reactor, but it would
increase the loss of bed material.
The downcomer pipe must be submerged in the fluidized bed. Otherwise flue
gas will leak into the settling chamber. A depth of 0.3 m was selected for the pilot
plant to have an operational margin. The distance between the outlet of the
downcomer and the top of the fluidization nozzles is 0.6 m. The total bed height
from the top of the air nozzles to the top of the fluidized bed is 0.9 m for the pilot
plant. The typical pressure drop gradient over a fluidized bed of sand is 10 kPa m-1.
The typical pressure drop over the fluidized bed of the pilot plant is approximately
9 kPa.
As a rule of thumb the pressure drop over the air nozzles must be
approximately 1/3 of the pressure drop over the bed, to guarantee a good

Chapter 6
98
distribution of the air [8]. This results in typical exit velocities of approximately 40
– 60 m s-1.
For the lab-scale installation a plate with small holes was used for air
distribution. This is a typical solution for lab-scale fluidized beds, but is not
applicable for commercial size installations because the required discharge of
solids from the bed is not possible if a plate is used. Moreover, the holes are
sensitive to plugging. The design of the air nozzles for the pilot-scale installation
was copied from the BIVKIN gasifier. Several pipes with small holes were
distributed over the fluidization area.
Height of Combustor Freeboard :
The height of the freeboard is defined as the height difference between the top of
the fluidized bed and the flue gas exit. The freeboard above the fluidized bed serves
two goals:
1. Post combustion chamber to reduce emissions of CO and CxHy. Secondary
air is injected for this purpose.
2. Transport disengaging zone for the entrained solids (bed material) to
minimize the loss of bed material.
The gas residence time in the freeboard is several seconds, which is more than
sufficient for complete combustion of the gases at the typical freeboard conditions.
The gas phase residence time requirements therefore do not set the limit for the
required freeboard height. The freeboard height is defined by the required transport
disengaging height (TDH). Solids are thrown from the bed by bursting bubbles
rising from the bottom to the top of the bed. The solids thrown up into the
freeboard contain the whole spectrum of particle sizes present in the bed. The
larger particles (bed material) should fall back in the bed and the smaller particles
(fly ash) are allowed to leave the bed. The TDH is defined as the height at which
entrainment does not change appreciably. Several empirical relations are available
to estimate the required transport disengaging height. The required height is mainly

MILENA gasification technology
99
influenced by the minimum fluidization velocity of the smallest particles which are
required to fall back in the bed and the linear gas velocity in the fluidized bed and
freeboard. The size of the bubbles in the bed also influences the required TDH. The
bubble size is influenced by the combustion air distribution design. For the design
of the MILENA reactor the relations found by Amitin and Horio [13] were used to
estimate the height. The estimated TDH for the MILENA pilot is ≈ 2.3 m, but this
height could not be realized in practice due to height limitations in the building.
Bed material circulation rate:
The gasification/pyrolysis reactions in the riser are endothermic. The required heat
is produced in the combustion reactor. The circulating bed material transfers the
heat from the combustor to the riser. The required circulation rate of the bed
material follows from the energy balance. The holes in the riser set the circulation
rate. The circulation rate is influenced by the pressure difference over these holes.
The pressure difference is normally controlled at a constant value. The diameter of
the sand circulation holes is the main design parameter in setting the solids
circulation rate (Gs). The diameter is empirically determined from cold flow tests
and CFB gasifier tests. The solids circulation through the hole(s) is approximately
300 kg m-2 s-1.
Table 6.2 summarizes the basic design data of the pilot plant and the lab-
scale installation.
Table 6.2: Basic design data MILENA lab-scale & pilot plant.
Lab-scale Pilot plant
Thermal input (HHV basis) [kW] 30 800
Biomass mass flow [kg h-1] 5 - 6 160
Steam to gasifier [kg h-1] 0.1 - 2 19
Riser diameter [m] 0.036 0.2
Combustor (fluidized bed) diameter [m] 0.25 0.8
Fluidized bed height [m] 0.4 0.6

Chapter 6
100
Overall reactor height [m] 2 8
Number of downcomers [-] 1 2
Combustor temperature [°C] 925 925
Operating pressure [bara] 1.1 1.1
Heat loss [kW] 0 ~30
Estimated circulation rate bed material [kg h-1] 150 6300
Producer gas volume flow wet [Nm3 h-1] 6 174
Tar and BTX to combustor [kW] 0 55
HHV gas wet basis excl. tar [MJ Nm-3] 13 13
HHV gas dry basis excl. tar [MJ Nm-3] 18 18
6.3 Description of cold-flow setup
The main goal of the cold flow model was to establish insight into the
hydrodynamics (circulation of bed material) of the MILENA reactor. The cold flow
model was basically used to visualize the hydrodynamics, but also tests were done
to determine the solids recirculation rate. Figure 6-4 depicts the hydrodynamic
principles of the MILENA process.
producer gas
flue gas
combustion air
fuel
riser
BFB combustor
steam
sand & char settling chamber
downcomer
sand transport zone (5)
1
7
2
4
restriction (6)
3
1
6 1
5
P
3
4
producer gas
flue gas
H
Figure 6-4: Schematic representation of solids circulation in MILENA gasifier.
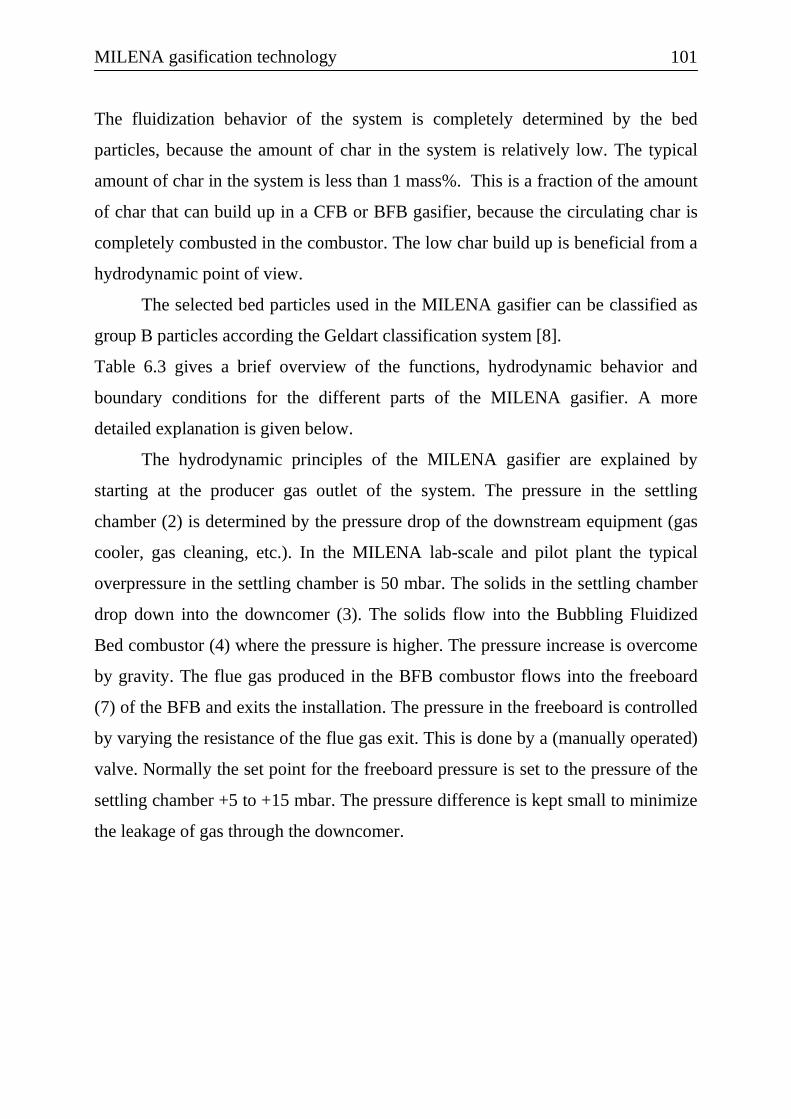
MILENA gasification technology
101
The fluidization behavior of the system is completely determined by the bed
particles, because the amount of char in the system is relatively low. The typical
amount of char in the system is less than 1 mass%. This is a fraction of the amount
of char that can build up in a CFB or BFB gasifier, because the circulating char is
completely combusted in the combustor. The low char build up is beneficial from a
hydrodynamic point of view.
The selected bed particles used in the MILENA gasifier can be classified as
group B particles according the Geldart classification system [8].
Table 6.3 gives a brief overview of the functions, hydrodynamic behavior and
boundary conditions for the different parts of the MILENA gasifier. A more
detailed explanation is given below.
The hydrodynamic principles of the MILENA gasifier are explained by
starting at the producer gas outlet of the system. The pressure in the settling
chamber (2) is determined by the pressure drop of the downstream equipment (gas
cooler, gas cleaning, etc.). In the MILENA lab-scale and pilot plant the typical
overpressure in the settling chamber is 50 mbar. The solids in the settling chamber
drop down into the downcomer (3). The solids flow into the Bubbling Fluidized
Bed combustor (4) where the pressure is higher. The pressure increase is overcome
by gravity. The flue gas produced in the BFB combustor flows into the freeboard
(7) of the BFB and exits the installation. The pressure in the freeboard is controlled
by varying the resistance of the flue gas exit. This is done by a (manually operated)
valve. Normally the set point for the freeboard pressure is set to the pressure of the
settling chamber +5 to +15 mbar. The pressure difference is kept small to minimize
the leakage of gas through the downcomer.

Chapter 6
102
Table 6.3: Overview of functions, preferred modes of operations and boundary conditions.
Part Function Preferred mode of
hydrodynamic operation
Boundary conditions
Riser (1)
Solids transport.
Mixing gas and solids.
Heating of biomass (drying and pyrolysis)
Fast fluidized bed
Solids transport not restricted by riser throughput.
Velocity > ut
Settling chamber (2)
Separating char and bed material from
producer gas.
Further degasification of biomass.
- Velocities far below terminal
velocities of bed particles.
Downcomer (3)
Solids transport.
Gas barrier between combustor and settling
chamber.
Moving bed
Bubbling fluidized bed
Solids transport capacity not limiting solids circulation.
No/limited gas transport from combustor to settling chamber → downward velocity of solids higher than upward velocity of
gas.
Combustor (4)
Combustion of char
Heating of circulating sand
Separating ash
Bubbling fluidized bed
Stoichiometric air-fuel ratio approx. 1.
Superficial gas velocities > 3 umf and <ut
Transport - zone (5)
Transporting sand from combustor to
opening in riser (restriction).
Moving bed
Restriction (6)
Restricting circulation rate.
Moving bed Solids circulation capacity between 30 - 80 times the
biomass throughput.
Freeboard (7)
Disengagement of bed material
- Superficial gas velocity < Ut
Height > TDH
Under normal operating conditions the gas pressure at the bottom end of the
downcomer is slightly higher than the pressure in the settling chamber, resulting in

MILENA gasification technology
103
an upwards gas flow relative to the solids. The solid particles in the downcomer
move down with a vertical velocity of approximately 0.1 m s-1. The net gas flow
through the downcomer is minimized by controlling the pressure in the freeboard.
A small downward gas flow from the settling chamber into the combustor is
preferred, to prevent dilution of the producer with nitrogen from the flue gas.
The solids in the BFB (4) move downward into the sand transport-zone (5)
by gravity. The gas pressure is highest just above the nozzles where the combustion
air is injected. The gas pressure decreases again in the direction of the restriction
(6). Sand moves from the transport zone through a restriction/hole (6) into the riser.
The opening controls the sand circulation flow. Tests were done in the cold-flow to
determine the required diameter of the opening to obtain a sand circulation rate of
approximately 40 times the biomass input on mass basis. The mass ratio of 40 is
required to have a relatively low temperature difference of approximately 60°C
between combustor and gasifier. A lower circulation rate increases the temperature
difference between combustor and riser which has a negative influence on the Cold
Gas Efficiency. The pilot plant was used to verify the selected restrictions.
The riser is operated in the fast fluidization regime. This type of operation
results in a typical low solids density compared to a fluidized bed, leading to a
relatively low pressure drop. The difference in pressure between the riser and the
BFB combustor is the driving force for the solids circulation. The superficial
velocity in the riser (Ur) is defined as the volume flow of gas created by the
gasification of biomass plus the amount of steam added divided by the area of the
riser. The bulk of the gas volume is due to the degasification of the biomass.
The cold flow model is made of glass to be able to visualize the
hydrodynamic process. Figure 6-5 depicts the cold-flow setup and shows the main
dimensions. A pre-design of a lab-scale MILENA reactor was made before the cold
flow model was designed. The size of the cold flow setup is similar to the lab-scale
setup which was constructed several years later.

Chapter 6
104
1 - Riser (D =40 mm) 2 - Settling chamber (D = 288 mm) 3 - Downcomer (D = 30 mm) 4 - BFB combustor (D = 238 mm) 5 - Sand transport zone 6 - Restriction (D = 10 – 20 mm) 7 - Freeboard (D = 250 mm) 8 - Downcomer plug A - Air simulating biomass B - Riser fluidization air C - BFB Fluidization air D - Combustor exit E - Collected lost solids F - Gasifier exit G - Collected lost solids - Circulating bed material
1
2
3
4
7
5
8
6
A
B
C
D
F
E
G
Figure 6-5: MILENA Cold Flow Set-up.
The solids circulation rate is influenced by the diameter of the hole in the
riser (the restriction). Several tests were done to establish an applicable relation for
the design of the lab-scale MILENA and further scale up. The bottom part of the
riser was made exchangeable to vary the dimensions of the hole. Three different
sizes were tested to see how this influences the solids circulation rate. The solids
circulation rate was measured by closing the inlet of the downcomer and measuring
the increase in height of the solids in the funnel.

MILENA gasification technology
105
Most Cold Flow experiments were done using quartz sand and olivine. The
main properties of these bed materials are given in Table 6.1. The size distribution
of olivine varied to some extent. This material was ordered from different
suppliers, but also batches from the same supplier varied sometimes. The diameter
of the fluidized bed was chosen such that operation at approximately 5 - 8 * umf is
possible. The riser was dimensioned to operate approximately 3 m s-1 above the
terminal velocity of the average bed material particles. The minimum vertical
velocity in the settling chamber was 0.1 m s-1. This is low enough to separate char
particles with a diameter of more than 0.2 mm from the gas.
6.4 Lab-scale installation
The design of the lab-scale MILENA configuration was based on a preliminary
design made for the pilot plant and the cold flow model. The cold flow was used to
measure the bed material circulation rate for different configurations and
dimensions. The original design capacity of the installation was 5 kg h-1 of wood,
because this was the limit for lab-scale installations at that time. Installations with
capacities above this scale required elaborate safety measures, which would
increase the costs. A smaller scale was seen as less realistic from hydrodynamics
point of view.
The main dimensions of the lab-scale installation compared to the pilot plant
are given in Table 6.2.
The lab-scale gasifier is coupled to a lab-scale gas cleaning installation and a
methanation unit. The entire system operates at atmospheric pressure. Figure 6-6
shows a simplified scheme of the integrated lab-scale setup (including gas cleaning
and methanation units).

Chapter 6
106
Biomass
Air
White ash
OLGA S + Cl Conversion and removal
Dust filter
Pre-reformer
Methanation
Burner
Flue gas
Air Natural gas
Steam
Steam
Natural gas
ash
Air
Figure 6-6: Basic layout of MILENA lab-scale installation.
Most of the gas cleaning equipment (hot gas filters and OLGA tar removal)
was originally designed to be used with the lab-scale Fluidized Bed gasifier WOB
[14]. The typical producer gas flow from this gasifier was 1 – 2 Nm3 h-1. The
producer gas flow from the MILENA is 6 – 7 Nm3 h-1, only part of the gas
produced can be used in the gas cleaning system. Most of the gas is directly
combusted in a burner. A high temperature valve in front of the burner regulates the
gas split between the burner and the gas cleaning system. Because of the small
scale, the heat loss from the pipes is relatively high and electrical heating is
required to keep the temperature of the gas above the tar dew point. The dust is
removed from the gas by high temperature porous candle filters. Typical operating
temperature is between 400 and 450°C. Metal and ceramic filters were both applied
successfully. The filters were cleaned off-line. The removal of dust using high
temperature gas filters is seen as a lab-scale solution. In the pilot plant the coarse
dust particles are removed by a cyclone and the fine dust particles are removed in
the OLGA unit. This solution is more economic, but less practical at lab-scale. The
dust-free gas is sent to the OLGA unit for tar removal. The OLGA technology is
based on scrubbing the producer gas with oil [15].

MILENA gasification technology
107
The cleaned gas is sent to the chloride and sulphur conversion and removal
unit. Higher hydrocarbons like C6H6 are converted into CO, CO2, H2, H2O and CH4
in a catalytic reactor (the pre-reformer in Figure 6-6). After this process step the gas
is ready to be compressed and converted into Bio-SNG in commercial processes. In
the lab-scale installation commercial catalysts are used at atmospheric pressure to
convert the gas into CH4, CO2 and H2O. The gas flow through the reactors is
regulated by a small booster. A steam generator is installed to increase the moisture
content of the gas before the catalytic processes. Steam is required to prevent soot
formation. The different process steps will be explained in more detail in the next
paragraphs.
Figure 6-7 shows the MILENA lab-scale gasifier (left) and the OLGA tar
removal system (right). The two bunkers on the left are used to feed the fuel (small
wood particles) to the gasifier.
Figure 6-7: Photos of lab-scale MILENA (left) and OLGA (right) installation.
6.4.1 Gasifier
Figure 6-8 shows a scheme of the lab-scale gasifier. The MILENA lab-scale
gasifier installation has been used for more than 2000 hours.
The feeding system is the most sensitive part of the complete installation.
Most problems with the gasifier were a direct or indirect result of problems with
the feeding system. The biomass is fed into the gasifier from one of the two fuel
bunkers. The bunkers are also used to control the feed rate by changing the rotation

Chapter 6
108
frequency of the discharge screw. Several discharge screws are available for
different types of fuels. The feeding bunkers are calibrated before a test by
measuring the weight loss of the bunkers over a certain time at a set rotation
frequency. After a test the weight loss of the bunkers is measured again to check
the correct fuel flow. N2 was used as a purge gas during the first experiments. This
was later changed into CO2 to minimize the nitrogen dilution of the producer gas.
The fuel bunkers are directly coupled to the gasifier and are operated at the
same pressure as the riser. A small N2 purge flow is used to keep producer gas out
of the feeding bunkers. For refueling the feeding bunker is stopped while the other
feeding bunker is started. The valve at the bunker outlet is closed. The lid is opened
and fresh biomass is added. The flanges of the lid are carefully cleaned and closed.
The pressure in the bunker is increased to operating pressure by adding nitrogen
after which the feeding bunker is ready to be taken into operation again. Switching
of the feeding bunkers is done automatically after a certain running time. The
filling of the bunkers is done manually. This was also automated, but the feeding
system appeared not reliable enough for duration tests. The two bunkers can
operate for approximately 10 hours before an operator refills both bunkers. This
procedure was developed over time and proved to be reliable enough for running
duration tests of typically 100 – 200 hours.
Because of the small size of the feeding screw the size of the biomass
particles is limited to several millimeters. The most left sample shown in Figure 7.1
(Chapter 7) gives an impression of the physical dimensions of the biomass particles
used for tests in the lab-scale installation.
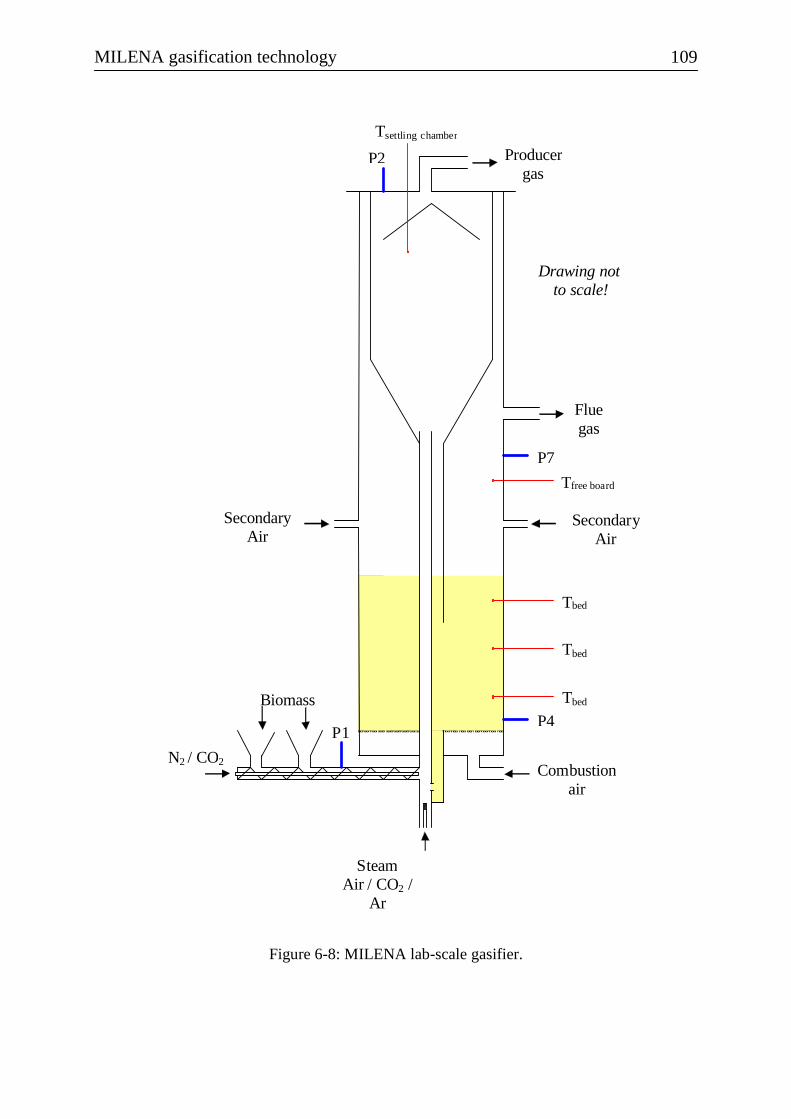
MILENA gasification technology
109
Steam Air / CO2 /
Ar
N2 / CO2 Combustion
air
Flue gas
Drawing not to scale!
Producer gas
P1
Biomass
Tsettling chamber
P4
P7
P2
Tbed
Tbed
Tbed
Tfree board
Secondary Air
Secondary Air
Figure 6-8: MILENA lab-scale gasifier.

Chapter 6
110
The feeding screw transports the fuel into the riser. The feeding screw is not
cooled, some drying and pyrolysis may occur in the feeding screw, which so far did
not lead to operational problems. A thermocouple on the outside of the screw is
used to monitor gas leakage from the gasifier into the feeding system. A gas
leakage through the feeding screw results in an increase of the screw temperature.
A small leakage in the feeding system is a very common problem, which needs to
be solved directly to prevent wetting of the fuel due to condensation of water
coming from the producer gas. The moisture on the fuel can make the fuel sticky,
which gives feeding problems.
The lab-scale MILENA gasifier was built in 2004. All engineering and
construction were done by the Engineering & Service department of ECN. The lab-
scale reactor vessel and insert are made of stainless steel (grade 253MA). This type
of steel can withstand temperatures of up to 1100°C and is available in the required
pipe sizes. Heat loss from the process is compensated for by high temperature
electrical trace heating. The heat loss is reduced by external insulation.
The operating pressure is limited to 0.4 bar overpressure, to stay below the
0.5 bar overpressure limit set in the Pressure Equipment Directive (PED 97/23/EC).
A higher pressure would significantly increase the costs, because of the required
safety measures.
The riser is fluidized with steam. The amount of fluidization steam can be
varied between 0.1 and 2 kg h-1. The amount of steam required to fluidize the riser
is low (0.1 kg h-1), but additional steam is used to increase the water content of the
producer gas because the biomass used for lab-scale experiments is relatively dry
(10 wt.% moisture), whereas the fuel foreseen for commercial applications contains
more moisture (25 wt.%).
The temperature of the riser and the reactor will differ, especially during
heating. The riser can move freely through the bottom of the reactor while gas
leakage is minimized by a seal. This construction minimizes mechanical stresses

MILENA gasification technology
111
due to differences in expansion. This solution makes it possible to use a steel
construction at temperatures at which the strength of the material is relatively low.
6.4.2 Flue gas cooling and dust removal
Flue gas from the combustion section is partially cooled by heat loss.
Approximately 90% of the dust/fly ash is removed by a cyclone. Most of the
smaller particles (e.g. aerosols of salts) will probably stay in the gas. The
temperature of the cyclone is not controlled or measured. Because of the simple
layout of the flue gas treatment line the collected ash samples are not representative
for commercial scale installations. Pilot scale tests are required to produce ash
samples under more realistic conditions. The flue gas composition is measured
before the gas is sent to the stack.
6.4.3 Producer gas cooling and dust removal
A cyclone located directly after the gasifier is used to remove approximately 90%
of the carbon containing dust from the producer gas. In order to be able to make the
carbon balance over the gasifier, the carbon content of the collected ash is
measured. The cyclone was not always present in the system layout, because the
cyclone caused operational problems. The relatively large flanges of the cyclone
caused local cold spots, resulting in fouling problems (tar condensation). Most of
the duration tests were done without cyclone to prevent fouling problems in the gas
tubes. The amount of lost carbon had to be estimated from previous tests under
similar operating conditions.
Cooling of gas is achieved by heat loss. The relatively small flow and large
wall area of the piping result in a relatively high heat loss, this makes a separate gas
cooler unnecessary. The wall temperature of the tubes is temperature controlled by
electrical trace-heating. The typical wall temperature of the tubes with the tar
loaded gas is kept at 450°C. Keeping all the parts of the piping at this temperature
Chapter 6
112
proved to be very important. Defective trace-heating and mistakes in the layout of
the piping resulted in blockages by tar and dust leading to many shutdowns of the
system.
Approximately 2/3 of the producer gas is sent directly to the flare. The
remaining gas is sent to the gas cleaning test rig. The gas cleaning test rig was
designed for a smaller capacity gasifier.
6.4.4 Producer gas cleaning
In the producer gas cleaning section the main impurities in the gas are
removed and converted to meet the stringent demands of the methanation catalysts.
Tars are removed by the OLGA tar removal unit. Chloride and sulphur are removed
by adsorbents.
The OLGA tar removal technology is based on scrubbing the producer gas
with oil [15]. The tars are removed in two stages (only one shown in Figure 6-6). In
the first stage (collector column) the producer gas is cooled and the condensed tars
are collected. A bleed stream of the oil–tar mixture is available for use as fuel in the
combustor of the MILENA gasifier. In the lab-scale installation this tar-fuel is
simulated by methane, because feeding oil/tar in low quantities (typically 100 – 200
grams h-1) proved to be very cumbersome. In the second stage (absorber column)
the light tars are removed from the producer gas. The scrubbing oil from the second
stage is regenerated in a stripper. The stripper uses air to strip the light tars from the
oil. The air containing light tars can be used as combustion air in the MILENA
combustor. In the present system layout, the air is used as combustion air in the
flare for combusting the cleaned gas. The temperature in the OLGA gas cleaning is
kept above the dew point of the water in the gas (typically 74°C) to prevent
condensation of water.
The typical concentration of sulphur compounds in the gas is between 100
and 200 ppm for clean wood as a fuel. Most of the sulphur is present in the gas as

MILENA gasification technology
113
H2S, but also as COS and thiophenes. Sulphur needs to be removed from the gas to
a concentration below 1 ppm.
A fixed bed reactor filled with hydrodesulphurization (HDS) catalysts
converting the thiophenes in H2S. Hydrodesulphurization is a well known process
in the oil industry, but the producer gas conditions are very different. The
conversion of thiophenes in the producer gas was major research topic during
several years, but is not a topic in this thesis. Results from this research are not
publicly available. It was decided to keep this part of the system confidential to
protect the IP position of ECN. H2S, COS and HCl are removed from the gas by
commercially available sorbents (e.g. ZnO).
The producer gas pressure is slightly increased by a blower in order to
compensate for the pressure losses over the downstream reactors. At the moment
the pressure is kept below 400 mbar for safety reasons. This pressure will probably
be increased in the future.
Conventional methanation processes were not developed to handle
hydrocarbons like C2H2, C2H4 and C6H6. Therefore these hydrocarbons are
converted into a mixture of CO, CO2, H2, H2O and CH4 in an adiabatic catalytic
reactor operating at approximately 550°C (the pre-reformer). Steam is added to
prevent soot formation on the catalyst surface.
6.4.5 Methanation
The methanation test rig consists of three fixed bed reactors placed in series. The
reactors are filled with commercial catalysts and operated at atmospheric pressure.
The methanation reactions are exothermic. The reactors are operated adiabatically.
The gas is cooled between each reactor to lower the methanation temperature. The
last reactor is operated at a typical temperature of 270°C.
The produced gas consists of CH4, CO2, H2O and a low concentration of H2.
To bring the gas on specification the H2O and CO2 need to be removed as it is
being done in conventional processes.
Chapter 6
114
The methanation of the clean producer gas is not seen as a new development
for this purpose. The test rig is used to see whether the gas is clean enough and to
demonstrate the concept. On a commercial scale the methanation will be done at
increased pressure (e.g. 20 bar), because pressure favors the equilibrium toward
CH4 and the end product is mostly required at elevated pressures.
6.5 Pilot plant
The MILENA plant replaced the old ECN CFB gasifier BIVKIN. The existing
infrastructure, feeding system, producer gas cooler and gas cleaning were re-used
for the MILENA pilot plant. Figure 6-9 shows the basic layout of the pilot plant.
Three different fuel bunkers are available for feeding the different biomass
feedstocks. This makes it possible to use fuel mixtures (e.g. sewage sludge with
wood) or to switch from one fuel to another. Nitrogen is used as purge gas.
The gasifier has a flue gas outlet and a producer gas outlet. The flue gas is
cooled down to approximately 200°C. Part of the heat is used to pre-heat the
combustion air up to a value of typically 340°C. Dust is removed from the flue gas
by a conventional bag-house filter. An isokinetic sampling point is installed after
the bag-house filter for emission measurements. Samples from the bag-house filter
solids outlet are taken on a regular basis to monitor the fly-ash quality. The carbon
content of these ashes is always low (<1 wt.%), this indicates that the overall fuel
conversion is complete.
The producer gas is cooled in a double tube cooler. The heat is used to pre-
heat air. The preheated air is used as combustion air in the boiler. The cooled
producer gas is sent to the gas cleaning test rig which is located outside the
building. A cyclone removes most of the dust (ash, carbon and lost bed material)
from the gas.
The producer gas at a temperature between 350 and 400°C, containing some
small dust particles (typical 1 – 2 g Nm-3), is cooled and cleaned in the OLGA gas
cleaning test rig. Tar is removed from the gas. The heavy tars, containing some

MILENA gasification technology
115
small dust particles are returned to the combustor section of the MILENA. During
the first tests the tar recycle system was not operational and the recycle of heavy
tars was simulated by adding natural gas to the bottom of the fluidized bed
combustor. The light tars are sent to the boiler.
Biomass
Flue gas
Steam / air
Tar + dust
White ash
Burner
Boiler
OLGA
Flue gas
Wet Scrubbing
MILENA
Water
Air
air + air from OLGA stripper
Water quench
Figure 6-9: Basic layout of pilot plant
The producer gas exits the OLGA at a temperature of 80 – 90°C. The gas is
further cooled in the wet scrubbing system down to approximately 35°C (strongly
depending on ambient conditions). Most of the water in the gas is condensed out.
The pressure of the gas is increased by a booster to approximately 75 mbar.
This pressure was required in the past to operate the gas engine on the gas from the
previous BIVKIN gasifier. The gas engine is removed because this is not a topic of
research anymore. Gas engines can be operated on producer gas if the calorific
value is high enough and the tar dew point is low enough [16]. During the test with
the previous gasifier the gas was also used in a gas turbine to prove that the gas is
clean enough for this application as well [17].
The clean and nearly dry prodcuer gas is fired in a boiler. The heat is used to
heat up water. At the exit of the boiler an isokinetic sampling point is installed for
emission measurements.
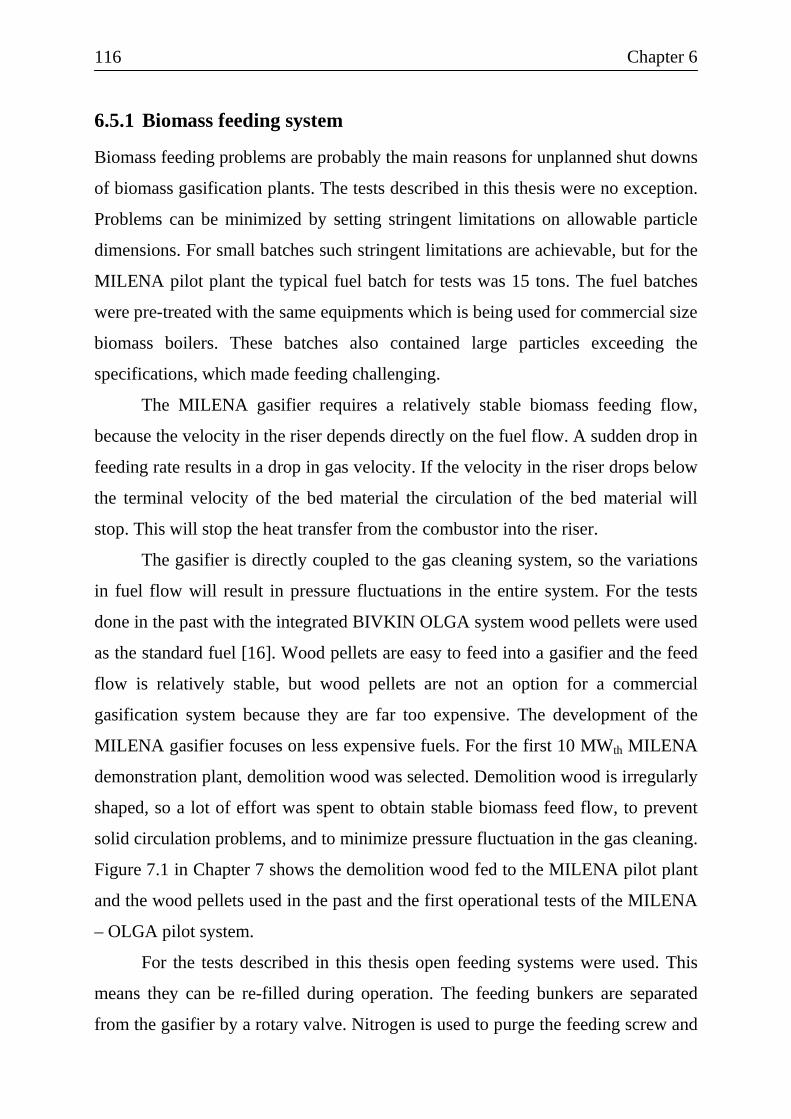
Chapter 6
116
6.5.1 Biomass feeding system
Biomass feeding problems are probably the main reasons for unplanned shut downs
of biomass gasification plants. The tests described in this thesis were no exception.
Problems can be minimized by setting stringent limitations on allowable particle
dimensions. For small batches such stringent limitations are achievable, but for the
MILENA pilot plant the typical fuel batch for tests was 15 tons. The fuel batches
were pre-treated with the same equipments which is being used for commercial size
biomass boilers. These batches also contained large particles exceeding the
specifications, which made feeding challenging.
The MILENA gasifier requires a relatively stable biomass feeding flow,
because the velocity in the riser depends directly on the fuel flow. A sudden drop in
feeding rate results in a drop in gas velocity. If the velocity in the riser drops below
the terminal velocity of the bed material the circulation of the bed material will
stop. This will stop the heat transfer from the combustor into the riser.
The gasifier is directly coupled to the gas cleaning system, so the variations
in fuel flow will result in pressure fluctuations in the entire system. For the tests
done in the past with the integrated BIVKIN OLGA system wood pellets were used
as the standard fuel [16]. Wood pellets are easy to feed into a gasifier and the feed
flow is relatively stable, but wood pellets are not an option for a commercial
gasification system because they are far too expensive. The development of the
MILENA gasifier focuses on less expensive fuels. For the first 10 MWth MILENA
demonstration plant, demolition wood was selected. Demolition wood is irregularly
shaped, so a lot of effort was spent to obtain stable biomass feed flow, to prevent
solid circulation problems, and to minimize pressure fluctuation in the gas cleaning.
Figure 7.1 in Chapter 7 shows the demolition wood fed to the MILENA pilot plant
and the wood pellets used in the past and the first operational tests of the MILENA
– OLGA pilot system.
For the tests described in this thesis open feeding systems were used. This
means they can be re-filled during operation. The feeding bunkers are separated
from the gasifier by a rotary valve. Nitrogen is used to purge the feeding screw and

MILENA gasification technology
117
the rotary valve. Some of the nitrogen will end up in the gasifier and some will be
lost in the rotary valve. The weight of the feeding bunkers is registered by load
cells, which makes it possible to determine the exact fuel flow during the tests.
The gas leakage from the feeding screw is determined by the pressure in the
feeding screw and the wear of the rotary valve. Leakage of producer gas is
minimized by using purge gas (nitrogen). The gas leakage is monitored by
temperature measurement. If the temperature of the feeding screw increases, the
leakage from the gasifier into the rotary valve is increased and measures need to be
taken to solve or reduce the leakage. Gas leakage in the feeding system is a major
issue. The rotary valve requires a lot of maintenance to keep the leaking rate at an
acceptable level.
6.5.2 Gasifier
The design for the MILENA gasification technology was originally done at a scale
of 10 MWth. The original foreseen application of the technology was producing gas
for a gas engine. 10 MWth biomass input is seen as attractive commercial scale.
The pilot plant design is a downscaling of the 10 MWth design.
The MILENA pilot plant replaced the 500 kWth CFB gasifier BIVKIN [16].
The BIVKIN gasifier was connected to a producer gas cooler, OLGA tar removal
system, wet scrubbers for NH3, HCl and water removal, a gas engine and a boiler.
The gas cleaning system and the producer gas cooler are dimensioned on volume
flow basis. Because the producer gas cooler and the gas cleaning system had to be
used for the MILENA gasifier as well, the volume flow was fixed. The volume
flow from the BIVKIN gasifier was approximately 190 Nm3 h-1. The design
volume flow for the MILENA was chosen to be 10% lower, to reduce the required
biomass input and heat output from the boiler. Because of the increase in heating
value of the gas from the MILENA gasifier compared to the BIVKIN gasifier, the
thermal input increased from 500 kWth to 800 kWth, which corresponds with a fuel
flow of 158 kg h-1 in case of dry wood.
Chapter 6
118
The design pressure of the reactor vessel is 0.4 bar overpressure. The design
pressure was chosen to be below the 0.5 bar overpressure limit set in the Pressure
Equipment Directive (PED 97/23/EC) to prevent additional costs for safety checks.
The reactor concept is in principle suited for pressurized operation of up to
approximately 7 bar, but this would increase cost because of the additional safety
measures required for pressurized vessels filled with a high temperature toxic and
inflammable gas.
Figure 6-10 shows the basic concept of the MILENA pilot reactor. The
drawing is not to scale, but Table 6.2 gives the basic dimensions of the reactor.
The inside of the outer reactor wall is refractory lined to reduce heat loss and
keep the reactor wall at an acceptably low temperature. The inner layer is made of
an attrition resistant material, which is suitable for typical fluidized bed conditions.
The outer layer has good insulation properties. Refractory lining is very common
for commercial scale gasifiers and is also foreseen to be used for further scale up.
The reactor wall is externally insulated with a thin layer of insulation wool to
further reduce the heat loss.
Start-up procedure:
The refractory lining requires a gradual heating of the reactor vessel (50 °C h-1).
This is accomplished by natural gas burners that are placed in the secondary air
ports above the fluidized bed combustor. The burners are positioned such that the
flames point downwards to the top of the fluidized bed. The flue gas exiting the
combustion section passes through a heat-exchanger which preheats the
fluidization/combustion air. When the bed temperature is high enough (T>650°C),
natural gas is fed to the bottom of the fluidized bed to realize a further increase of
the bed temperature. The heat transfer to the metal insert is relatively high, so no
special measures are required to heat up the insert.
The installation is normally kept in natural gas combustion mode over night.
The typical operating temperature is between 800 and 900°C, such that the
refractory stays at a constant temperature. The installation is further heated in

MILENA gasification technology
119
biomass combustion mode. A large air flow (typically 140 Nm3 h-1) and a small
biomass flow are added to the riser (typically 12 kg h-1) to start circulation of bed
material and produce hot flue gas for heating the producer gas cooler and the
piping. After one or two hours of biomass combustion the installation is switched
to gasification mode by decreasing the amount of air to the riser and increasing the
fuel flow. The produced gas is ignited in the boiler.
Temperature measurement:
Type K thermocouples are used for all temperature measurements. The most
relevant temperature is the gasification temperature. In most gasifiers this
temperature is measured at several locations in the riser. Due to the mechanical
construction of the MILENA reactor, it is not possible to place thermocouples in
the riser. Therefore, the gasification temperature is measured at the outlet of the
riser in the settling chamber (Tsettling chamber). The process temperature normally
decreases with height in a riser reactor that is used for gasification processes,
because the process is endothermic and the heat is supplied to the process at the
bottom of the reactor. The average gasification temperature is between the
combustion bed temperature and the settling chamber temperature.
The temperature in the fluidized bed combustor is measured by several
thermocouples, evenly distributed over the height of the bed. During normal
operation the measured differences in temperature are small (<20°C). Large
temperature deviations are an indication of fluidization problems, which are
normally caused by bed agglomeration. The upper thermocouple is used as an
indication of the bed height. Fast variations in temperature indicate that the bed
height has dropped below the location of the specific thermocouple.
Pressure measurement:
Pressure measurement points are numbered as shown in Figure 6-10. The pressure
difference between the freeboard (P7) and the settling chamber (P2) is the most
relevant pressure control parameter. During normal operation this pressure

Chapter 6
120
difference is kept close to -15 and +15 mbar by variation of the opening position of
a valve in the flue gas line (see paragraph 6.3 for more information about this
control parameter).
Flow measurement:
The amount of combustion air is measured with relatively accurate devices,
because the combustion air flow is one of the main parameters in the overall
balance over the gasifier. In the lab-scale installation a mass flow meter is used
with a typical accuracy of 1% at the typical operating range. In the pilot plant a
mass flow meter with a typical accuracy of 2% at the typical operating range is
used.

MILENA gasification technology
121
P1
P2
P7
P5
P4 N2
Steam Air
Natural- gas / tar
Secondary Air
Flue gas
Producer gas
Tair
Tbed
Tbed
Tbed
Tflue gas
Tsettling chamber
Pre-heated combustion
air
Drawing not to scale!
Bottom ash
Biomass
Figure 6-10: MILENA pilot-scale reactor

Chapter 6
122
6.5.3 Flue gas cooling and dust removal
The flue gas is cooled to approximately 500°C in the first cooler (single tube
cooler). The heat is used to pre-heat the combustion air for the combustor. A
second air cooled heat exchanger was installed to reduce the flue gas temperature
from approximately 500°C down to the bag-house filter inlet temperature, but the
cooling capacity of this cooler was insufficient. A water quench was installed
between the first and second cooler to control the bag-house filter inlet temperature
between 160 and 200°C. This water quench cooler was the source of many
operational problems, because the water droplets were not completely evaporated
when they hit the wall of the cooler. The liquid water on the wall mixed with the
dust, resulting in serious fouling of the piping. The pressure drop over the cooler
increased to values of some 100 mbar when demolition wood was used as fuel. The
water quench cooler is not a component planned for commercial plants, so it was
decided to replace the water quench and the second cooler by a conventional cooler
(fire tube) in the second quarter of 2010. This new cooler worked without problems
and the problems with a high pressure drop were solved. The operating temperature
of the bag-house filter was lowered to 120 – 150°C, because of the higher cooling
capacity of the new fire tube cooler.
The pressure difference between the settling chamber and the freeboard in
the combustor is controlled by a valve that is located upstream of the bag-house
filter (not shown in Figure 6-9). The normal control set point is between -15 and
+15 mbar, a value obtained by manually closing the valve for about 50%. In case of
fouling problems in the flue gas duct the valve is completely opened and the
pressure difference can not be regulated anymore. The pressure difference between
the settling chamber and the freeboard in the combustor can drop to approximately
-60 mbar. This influences the solid circulation rate and the flue gas leakage rate
between combustor and riser.

MILENA gasification technology
123
6.5.4 Producer gas cooling and dust removal
The producer gas is cooled in a double pipe cooler that was used in the past to cool
the producer gas from the BIVKIN CFB gasifier [18]. The producer gas flows
through the center tube, the cooling medium (air) flows through the outer tube in
parallel flow. Parallel flow was selected to keep the wall temperature (of the
cooler) high enough (>350°C) to prevent problematic condensation of tars on the
wall of the cooler. The relatively large dust particles (>20 µm) effectively remove
some of the condensed heavy tars from the wall of the cooler. The producer gas
outlet temperature from the cooler is approximately 400°C.
The preheated air is used as combustion air in the boiler. The cooled
producer gas is sent to the gas cleaning test rig which is located outside the
building. The heat loss in the relatively long pipe between the gasifier building and
the gas cleaning building is high. It is partially compensated by electrical trace-
heating of the last part of the pipes. A cyclone is used to remove most of the dust
(ash, carbon and lost bed material) from the gas. The typical operating temperature
of the cyclone is 350 – 400°C. A cyclone removes only part of the dust, so the
remaining dust removal has to be done in the OLGA gas cleaning. This is a major
difference with the lab-scale installation where all the dust is removed before the
OLGA.
6.5.5 Producer gas cleaning
The pilot-scale producer gas cleaning test rig consists of the OLGA tar removal
system and a wet scrubber. The ECN gas cleaning installation was developed after
several less successful tests with different kind of tar and dust removal technologies
[19].
The OLGA consists of two washing/scrubbing columns (collector +
absorber) and an oil regenerating column (stripper). The first scrubbing column
cools the producer gas with oil from approximately 400°C to 80 – 90°C. Heavy tars
and dust are captured in the oil. A wet Electro Static Precipitator is installed
Chapter 6
124
downstream the first column to collect the aerosols that were not removed in the
first column. The mixture of tar and dust can be used as a fuel in the MILENA
combustor or gasifier. In the first tests this was simulated by firing natural gas in
the combustor. In the second OLGA column the light tars (e.g. naphthalene) are
absorbed. The absorption column is operated above the water dew point
temperature of the gas, to prevent condensation of water in the oil. The typical
water dew point temperature of the MILENA gas is 65 - 75°C at atmospheric
pressure. The light tars are removed from the scrubbing oil in a stripper column
using preheated air. The air containing light tars is used as combustion air in the
boiler.
The gas is further cooled with water in the wet scrubbing system to
approximately 35°C (partly depending on ambient conditions). Most of the water in
the gas is condensed out. The water scrubber also removes most of the HCl in the
producer gas and part of the NH3. The typical water content of the producer gas
after the wet scrubbing system is 7 vol.%.
6.5.6 Boiler
The producer gas is combusted in a boiler during start-up and normal operation.
During start-up the gas cleaning is bypassed. The tar loaded gas is sent directly to
the burner of the boiler. The burner was originally designed to combust the
producer gas from the ECN CFB gasifier BIVKIN [20]. The burner design was
modified to handle the higher calorific gas with higher tar content from MILENA.
Although the burner in the boiler was especially designed to handle the gas with
tar, it is still sensitive to fouling if operated too long on gas with high tar content.
Fouling of the burner is prevented as much as possible by taking the gas cleaning in
operation as fast as possible.

MILENA gasification technology
125
6.5.7 Construction and commissioning
The engineering of the MILENA pilot plant started in 2005. Financing was
approved at the end of 2006. The detailed engineering was done by the Engineering
and Services department of ECN in the beginning of 2007. The construction of the
reactor vessel was done by HoSt BV, together with Klaas Zijlstra Metaalbewerking
BV. The reactor vessel was delivered to ECN by the end of November 2007. Figure
6-11 shows the different reactor segments when they arrived at ECN.
Figure 6-11: Arrival of the MILENA reactor segments at ECN.
The construction and connection of the installation to the existing
infrastructure was finished by the end of April 2008. Pressure testing and the
required fixing of leakages caused some delays.
The commissioning of a biomass gasification pilot plant is almost always
problematic. The commissioning of MILENA was no exception. Commissioning of
the pilot plant started in the summer of 2008. The first tests showed numerous
problems. Measures taken to compensate for thermal expansion were not

Chapter 6
126
incorporated in the design correctly. This resulted in mechanical failure of the
metal insert. It took almost a year to solve most of the problems and to adapt the
existing gas cleaning for the MILENA producer gas. The integrated system was
taken into operation in the summer of 2009 using wood pellets as a fuel.
6.6 The alternatives
Alternative Indirect gasification concepts under development or demonstration are
the SilvaGas process and the FICFB process. Both processes are described in
chapter 2. In spite of the fact that Indirect gasification was not new ECN decided
to start/continue the development of the MILENA gasifier, because of the
advantages over the alternatives.
The FICFB process was not known at the start of the MILENA development,
but became very well known in the beginning of the millennium because of the
very successful demonstration of this technology in the city of Güssing in Austria
[21]. This successful demonstration made it possible to continue the development
of the MILENA process, because the Güssing plant showed that successful
operation of an Indirect gasifier was possible. This reduced the many doubts that
Indirect gasification would not be a viable concept.
The FICFB gasifier requires a relatively large amount of steam to gasify the
biomass. This results into a low tar content, but creates an efficiency loss, because
the steam is heated up to process temperature. Typical steam to biomass ratios for
the FICFB gasifier are in the range between 0.7 and 1.1 [22] compared to
approximately 0.1 for the MILENA gasifier. The increased efficiency of the
MILENA process over the FICFB process is the main driver for the development of
the MILENA technology [23].
The SilvaGas process is very similar to the MILENA process. The main
difference is the mechanical construction of the reactor and the integration of the
process in one vessel. The SilvaGas process was demonstrated in the United Stated
[4], but this demonstration was not seen as very successful. The produced gas was

MILENA gasification technology
127
directly fired in a wood fired boiler, where it replaced wood. So operating the
gasifier was not beneficial. The demonstration plant was shutdown after a few
years. The unsuccessful demonstration of the SilvaGas process was used as an
argument in the past not to develop an alternative Indirect gasification process, it
was seen as too complex. This changed after the successful demonstration of the
FICFB process. Because the SilvaGas process never reached the stage of a
successful demonstration or commercial plant it was never seen as a reason to stop
the development of the MILENA process. Nowadays several initiatives are
underway to demonstrate the SilvaGas Technology in combination with the OLGA
gas cleaning technology. The producer gas will be used in a gas turbine. The
experience of operating the MILENA pilot plant in combination with the OLGA
gas cleaning is very advantageous for the large scale commercial projects based on
the SilvaGas technology, because the raw gas composition is similar.
6.7 References
1. van der Drift, A., de Kant, H.F., Rajani, J.B., 2000. Commercialisation
BIVKIN-based gasification technology, non-confidential version, Petten, ECN,
ECN-C-00-080.
2. van der Drift, A., van der Meijden, C.M., Strating, S.D., 2002. Hogere
koolstofconversie in CFB-biomassavergassers, ECN, Petten, ECN-C-03-053.
3. Hannula, I., 2009. Hydrogen production via thermal gasification of biomass in
near-to-medium term, VTT, VTT working papers 131.
4. Paisley, M.A., Overend, R.P., 2002. Verification of the Performance of Future
Energy Resources' SilvaGas® Biomass Gasifier -- Operating Experience in
the Vermont Gasifier. Pittsburgh coal conference 2002, University of
Pittsburgh, Pittsburgh, PA.
5. Mozaffarian, H., Zwart, R.W.R., Boerrigter, H., Deurwaarder, E.P., 2004.
Biomass and waste-related SNG production technologies technical, economic

Chapter 6
128
and ecological feasibility. In: The 2nd World Conference on Biomass for
Energy, Industry, and Climate Protection, 10-14 May 2004, Rome, Italy.
6. van der Meijden, C.M., van der Drift, A.: Device for producing a product gas
from biomass. Patent WO2007061301 issued 2007.
7. Basu, P., 2006. Combustion and Gasification in Fluidized Beds, CRC Press,
Bacon Raton, 485 p.
8. Kunii, D., Levenspiel, O., 1991. Fluidization Engineering, Butterworth
Heinemann, Stoneham
9. Horstink, M., 2010. Modeling the Residence Time of Fuel Particles in the
MILENA Gasification Reactor
10. Rapagnà, S., Mazziotti di Celso, G., 2008. Devolatilization of wood particles
in a hot fluidized bed: Product yields and conversion rates
11. Loffler, G., Kaiser, S., Bosch, K., Hofbauer, H., 2003. Hydrodynamics of a
dual fluidized-bed gasifier. Part I: simulation of a riser with gas injection and
diffuser. Chemical Engineering Science 58.
12. Cooke, R.B., Goodson, M.J., Hayhurst, A.N., 2003. The Combustion of Solid
Wastes as Studied in a Fluidized Bed. Process Safety and Environmental
Protection 81 (3).
13. Geldart, D., 1986. Gas fluidization technology, John Wiley and Sons Inc.,
New York, OSTI ID: 6808024.
14. van Paasen, S.V.B., Bergman, P.C.A., Neeft, J.P.A., Kiel, J.H.A., 2002.
Primary measures for tar reduction. In: 12th European Conference on Biomass
for Energy, Industry and Climate Protection, 17-21 June 2002, Amsterdam,
The Netherlands.
15. Boerrigter, H., van Paasen, S.V.B., Bergman, P.C.A., Könemann, J.W.,
Emmen, R., Wijnands, A., 2005. OLGA tar removal technology, ECN, Petten,
The Netherlands, ECN-C--05-009.
16. Verhoeff, F., Rabou, L.P.L.M., van Paasen, S.B.V., Emmen, R., Buwalda,
R.A., Klein Teeselink, H., 2007. 700 hours duration test with integral 500kW

MILENA gasification technology
129
biomass gasification system. In: Proceedings 15th European Biomass
Conference, Berlin, Germany, 7-11 May 2007.
17. Rabou, L.P.L.M., Grift, J.M., Conradie, R.E., Fransen, S., 2008. Micro Gas
Turbine Operation with Biomass Producer Gas and Mixtures of Biomass
Producer Gas and Natural Gas. Energy and Fuels 22 (3).
18. van der Drift, A., Pels, J.R., 2004. Product gas cooling and ash removal in
biomass gasification, ECN, Petten, The Netherlands, ECN-report: ECN-C-04-
077.
19. Rabou, L.P.L.M., Zwart, R.W.R., Vreugdenhil, B.J., Bos, A., 2009. Tar in
Biomass Producer Gas, the Energy research Centre of The Netherlands
(ECN) Experience: An Enduring Challenge. Energy and Fuels 23.
20. Verhoeff, F., van der Meijden, C.M., Ratering, H., Kant, H.F., Bos, H., 2004.
Branderonderzoek ten behoeve van de verbranding van laag calorisch
ammoniakrijk biomassa stookgas, Petten, ECN, Petten, the Netherlands, ECN-
C--0-4104.
21. Rauch, R., 2006. Fluidised bed gasification and synthetic biofuels, the
Güssing plant. In: European conference on biorefinery research, 19 and 20
October 2006, Helsinki, Finland.
22. Hofbauer, H., Rauch, R., Loeffler, G., Kaiser, S., Fercher, E., Tremmel, H.,
2002. Six years experience with the FICFB-Gasification process. In: 12th
European Conference on Biomass for Energy, Industry and Climate
Protection, 17-21 June 2002, Amsterdam, The Netherlands.
23. van der Drift, A., Zwart, R.W.R., Vreugdenhil, B.J., Bleijendaal, L.P.J., 2010.
Comparing the options to produce SNG from biomass. In: 18th European
Biomass Conference and Exhibition, 3-7 May 2010, Lyon, France.

Chapter 6
130

Chapter 7
7 Experiments
Abstract
The test results from lab-scale and pilot scale experiments in the MILENA gasifiers
are presented in this chapter. Different types of woody fuels were used in the tests.
The test data was used to produce and verify the relations that are required to
describe an indirectly heated biomass riser gasifier like the MILENA. The relations
were used to calculate the Cold Gas Efficiency and the overall efficiency to Bio-
SNG of a commercial size MILENA gasifier.
In the last paragraphs the more practical issues like agglomeration and fuel
flexibility, are described.
7.1 Introduction
The main goal of the experimental work done in the cold-flow, lab-scale and pilot-
scale installations described in the previous chapter was to generate and verify the
required relations for the MILENA Excel model as described in chapter 5, since
they were not available in literature. he second goal was to show that the
technology can operate for a prolonged time using a “commercial” fuel without
operational problems. Clean wood chips were originally seen as a “commercial”
fuel, but this was later changed to demolition wood.
Chapter 7
132
Many of the lab-scale tests were done in combination with the methanation
test rig. The standard fuel was beech wood. The main aim of these tests was to test
the lifespan of the different catalysts in the gas pretreatment test rig. The
performance data of the gas pretreatment catalysts are still confidential and are not
part of this thesis.
The most relevant relations for the MILENA model are the carbon
conversion as a function of temperature for different particle sizes of woody
biomass and the yield of hydrocarbons. Data were generated at different process
conditions, different bed materials (olivine and sand) and using different particle
sizes of woody biomass. Some experiments were done with alternative fuels like
sewage sludge and lignite coal. Data from the experiment with the non woody fuels
were excluded from the data set used to generate the relations.
The test program executed in the pilot plant was aimed at generating
engineering data for the 10 MWth MILENA Bio-CHP demonstration plant to be
built in Alkmaar. The selected fuel is demolition wood (B-wood), so most tests
were done using demolition wood.
The MILENA gasifier was designed to use steam as a fluidization agent for
the riser, because the N2 in air dilutes the producer gas. This is not acceptable if the
gas is going to be upgraded into Bio-SNG, for which the N2 concentration is
critical. For gas engine application dilution of the gas with some N2 is allowed. In a
commercial scale plant air is cheaper than steam, so many of the tests done to
generate data for the foreseen Bio-CHP demonstration plant were done with air
instead of steam.
The MILENA gasification tests described in this chapter were done at
atmospheric pressure. Pressurized gasification would be beneficial if the desired
end-product is Bio-SNG, which must be injected in the gas grid at elevated
pressures and the methanation reactions are favored by an increased pressure.
Future development of the MILENA technology will also include pressurized
operation.

Experiments
133
In the first paragraphs of this chapter the results of the experimental work
relevant for the MILENA model are described. In the last paragraphs the more
practical issues, like agglomeration and fuel flexibility, are described.
7.2 Fuels and bed materials used in MILENA tests
Most of the tests done in the lab-scale and pilot-scale MILENA were done
with woody fuels. Figure 7-1 depicts the fuels used. The diameter of the wood
pellets is 6 mm.
Figure 7-1: Beech wood, wood pellets and demolition wood as tested in MILENA gasifiers.
Table 7.1 shows the measured compositions of the main fuels used in the MILENA
lab-scale and pilot-scale gasifiers. The demolition wood used was of the so called
‘B’ quality. This means that it includes painted waste wood and particle board. It
must be noted that the composition of the demolition wood varied strongly during
the tests, some batches contained large amounts of particle board material and
others contained significantly more gypsum board material than average. Some
batches contained very large particles (length > 10 cm), which gave rise to feeding
problems. The MILENA pilot-scale feeding system can handle particles with a
maximum length of approximately 25 mm. The additional size reduction resulted in
a high dust content of the fuel, especially when a large fraction of particle board
material was present in the fuel. Pretreatment of the feed is one of the most
problematic issues in lab-scale and pilot-scale biomass gasification research.
Luckily this gets less important at commercial scale.

Chapter 7
134
Because of the unstable feeding and the inhomogeneous composition of the
demolition wood, many of the test results were too unreliable to be included in this
chapter.
A limited number of tests were done with alternative fuels like sewage
sludge, grass and lignite coal. Results from these tests are described in paragraph
7.14.
Table 7.1: Average fuel compositions
Beech wood Wood pellets Demolition wood B
Moisture [wt.% a.r.] 10.1 8.3 19.0
Ash [wt.% d.b.] 1.0 0.3 2.7
C [wt.% d.a.f.] 49.2 48.2 50.2
H [wt.% d.a.f.] 6.1 6.4 6.1
O [wt.% d.a.f.] 44.5 45.2 41.6
N [wt.% d.a.f.] 0.2 0.1 1.9
S [wt.% d.a.f.] 0.017 0.009 0.10
Cl [wt.% d.a.f.] 0.005 0.012 0.12
LHV [MJ kg-1 d.a.f.] 18.2 18.5 18.9
HHV [MJ kg-1 d.a.f.] 19.5 19.9 20.2
All duration tests in the lab-scale installation were done using beech wood as fuel.
The total number of lab-scale operating hours with beech woods exceeds 1500
hours.
Quartz sand (sieve fraction 0.1 – 0.4 mm) was used as a standard bed
material in the lab-scale MILENA gasifier during the first years of operation and
for the first tests of the MILENA pilot-scale plant. Quartz sand shows no or no
significant catalytic activity in tar cracking, but it was selected as bed material
because of its wide availability and its high resistance to attrition. Some wood
fractions can contain a lot of sand. Tests in the ECN CFB pilot plant (BIVKIN
installation) showed that no external addition of bed material is required if these
fractions are used. When these fractions are used the bed inventory will be replaced
by the sand in the fuel automatically.
Olivine is a well known catalytic bed material for reducing the tar
concentration in a fluidized bed gasifier [1, 2]. It was observed that the origin of the

Experiments
135
olivine catalyst has an influence on its catalytic activity. The first tests with olivine
as bed material in the lab-scale MILENA gasifier were done with olivine from
Norway. Later on this bed material was replaced by olivine from Austria ordered
from Magnolithe GmbH, because Austrian olivine showed more activity for tar
cracking. This was changed to Norwegian olivine for the pilot plant in 2010 again,
because of the better quality (less dust) and better availability.
7.3 Hydrodynamics
The hydrodynamical behavior of the MILENA reactor determines the temperature
difference between combustor and gasifier riser, the gas exchange between the
combustor and gasifier riser and the loss of char from the system.
Solids circulation rate:
The gasifier riser is preferably operated at a high temperature, because the carbon
conversion and the conversion of tar into producer gas increases with increasing
temperature. This has a positive effect on the overall efficiency. The combustor is
preferably operated at low temperature, because this reduces the risk of bed
agglomeration. The heat produced in the combustor is transported by the
circulating bed material. To transport the heat a positive temperature difference
between combustor and gasifier riser is required, although a small temperature
difference gives the highest gasifier riser temperature and the lowest combustor
temperature. The solids circulation rate determines the temperature difference
between combustor and riser. The solids circulation rate is “controlled” by the size
of the sand circulation holes in the riser (see chapter 6.2) and the pressure
difference over these holes. Figure 7-2 shows the calculated temperature difference
for a commercial size MILENA gasifier using wood with 25 wt.% moisture for
different solid circulation rates. The MILENA model that is described in chapter 5
was used to simulate the different conditions. The ‘old’ relations for hydrocarbons

Chapter 7
136
yield and carbon conversion were used. The right hand y-axis shows the calculated
Cold Gas Efficiency (CGE).
850
875
900
925
950
975
1000
20 30 40 50 60 70 80 90 100
Relative solids circulation rate [-]
Tem
pera
ture
[°C
]
70
75
80
CG
E c
lean
gas
[%]
Tgasifier
Tcombustor
CGE clean gas
Figure 7-2: Effect of relative solids circulation rate (defined as mass flow solids
per mass flow biomass on a.r. basis) on reactor temperatures and CGE.
As can be seen from the figure the solids circulation rate has an influence on the
temperature in the fluidized bed combustor and CGE. The MILENA gasifier was
originally designed for a solids circulation rate of 40. From the figure it can be
concluded that a relative circulation rate above 50 is recommended to limit the
combustor temperature and to increase the CGE.
Figure 7-3 shows the measured temperature differences between the riser
outlet and the fluidized bed of the combustor. Data from the lab-scale installation
have not been used, because the heat balance over the lab-scale installation is
unreliable due to the electrical heating of the installation and a relatively high heat
transfer from the combustor to the riser through the metal wall of the riser. As can
be seen from the figure the temperature difference varies. This is partially caused
by variation in pressure between the sand transport zone and the riser. Pressure
control appeared to be difficult when demolition wood was used as fuel and the
MILENA outlet was connected to the gas cleaning test rig. Automation of the

Experiments
137
pressure control was only implemented in the second half of 2010. Another reason
for the variation in temperature difference was the observed mechanical
deformation of the riser. This resulted in an additional opening for the sand to flow
from the combustor into the riser. This is probably the reason for the small
temperature difference during the demolition wood tests.
The temperature difference decreases with an increase in Equivalence Ratio
(ER). ER is defined as the amount of oxygen fed into the gasifier divided by the
amount of oxygen required for stoichiometric combustion of the biomass. ER
varies because of oxygen transport from the combustor to the gasifier riser by
circulating bed material (see paragraph 7.12) and switching between air and steam
as gasification agent for the gasifier riser. The temperature difference decreases
because the riser gasifier temperature is increased by the partial combustion of
producer gas when air or oxygen is added.
From the measurements it can be concluded that the circulation rate is in the
correct range. Further testing is required to produce more accurate and reliable
empirical relations for the circulation rate as function of pressure difference
between the sand transport zone and the riser inlet.
0
25
50
75
100
125
150
0.00 0.02 0.04 0.06 0.08 0.10 0.12 0.14 0.16 0.18 0.20
ER [-]
Tem
pera
ture
diff
eren
ce c
ombu
stor
- r
iser
[°C
] Pilot plant - Beech wood - olivine
Pilot plant- wood pellets - sand
Pilot plant - wood pellets - olivine
Pilot plant - demolition wood - olivine
Figure 7-3: Measured temperature differences between combustor and
riser as function of Equivalence Ratio (ER)

Chapter 7
138
Gas exchange:
The free space between the circulating bed particles, filled with gas, will move with
the gas from the gasifier riser to the combustor and from the combustor to the
gasifier riser. This will lead to some gas exchange between the two reactors. If the
producer gas is going to be upgraded into Bio-SNG the leakage of flue gas into the
producer gas should be limited, because the N2 in the flue gas will end up in the
Bio-SNG. If the N2 concentration in the Bio-SNG is too high, the specifications for
heating value can-not be met.
The producer gas from the gasifier riser moves with the bed material from
the settling chamber through the downcomers into the combustor. The pressure in
the settling chamber is at normal operating conditions, approximately 10 mbar
higher than the pressure in the freeboard of the combustor. The pressure at the
outlet of the downcomer is under these conditions higher than the pressure in the
settling chamber, because the depth of the exit of the downcomers in the fluidized
bed is approximately 30 cm. Every cm of bed height gives a pressure drop of
approximately 1 mbar. This results in a positive pressure difference of
approximately 20 mbar between downcomer exit and settling chamber. This
pressure difference results in an upwards gas flow relative to the downwards
moving solids. This velocity of the upwards gas flow is lower than the velocity of
the downwards moving solids and results into a net gas flow through the
downcomer from the settling chamber into the combustor. See also chapter 6.3 for
a more detailed explanation. The net gas exchange through the downcomer is small
and is calculated to be approximately 0.8% of the producer gas production. The
effect on the overall balance is small. Experiments have shown that the amount of
producer gas leaking from the settling chamber into the combustor can be increased
by increasing the pressure in the settling chamber or reducing the pressure in the
combustor. The impact of the gas leakage under normal operating conditions is
small.

Experiments
139
More relevant is the leakage of flue gas from combustor into the bottom of
the riser, mainly because of the resulting N2 dilution of the producer gas. Several
experiments were done to determine the leakage of flue gas into the riser. In the
past N2 was used as an inert purge gas, so part of the N2 in the gas came from the
purge gas. More recently CO2 was used as purge gas to minimize the N2 dilution
and to determine how much N2 came from the flue gas. The experiments showed
that the N2 in the producer gas can be limited to 1 – 3 vol.% if clean wood is used
as fuel. This is seen as low enough for upgrading the gas into Bio-SNG. The typical
value for flue gas leakage from combustor to gasifier riser is 1% of the amount of
flue gas produced in the combustor bed. This value is used in the up-dated
MILENA model.
Collection efficiency settling chamber:
The main purpose of the settling chamber is to separate the solids from the gas. The
solids entering the settling chamber can be divided into char and bed material. The
bed material particles have a relatively high density of approximately 3000 kg m-3
and therefore are easily separated from the gas. The char particles can be very fine
and have a relatively low density. The average measured bulk density of the
particles blown out of the settling chamber is 250 kg m-3. Because of the lower
density the separation efficiency for the char particles will be lower than for the
circulating bed material. The collection efficiency for the char particles is relevant
for the mass and heat balance over the MILENA gasifier.
The collection efficiency for char particles is of course strongly influenced
by the particle size of the char, and therewith the size of the biomass particles being
used as fuel. The tests with demolition wood as a fuel were seen as the most
realistic for further scaling up. These tests therefore were used to calculate the
collection efficiency.
The collection efficiency of the settling chamber in the pilot plant for char
particles is calculated from the amount of char in the cyclone ashes collected by the
cyclone in front of the OLGA gas cleaning. A collection efficiency of 90% for the

Chapter 7
140
cyclone was assumed. Approximately 10% of the char particles that are blown out
of the MILENA settling chamber end up in the OLGA gas cleaning. These particles
will be returned with the tar in commercial scale installations. The collecting
efficiency of the MILENA settling chamber varied between 75 and 90%. The
strong variation in the collection efficiency was probably caused by the
inhomogeneous particle size distribution of the fuel and the fact that some batches
contained a lot of dust. The remaining char that is collected by the cyclone will in
the future be returned to the combustor.
7.4 Carbon conversion in gasifier riser
Carbon conversion is an important parameter in the Excel model made for the
MILENA gasifier. Because Carbon conversion is mainly influenced by the gasifier
riser temperature, a temperature dependent relation is used in the model (Equation
7.1). Carbon conversion increases at higher temperatures, resulting in a lower char
yield. A lower char yield results in a lower heat production in the combustion
section giving a lower temperature in the combustor and the gasifier riser. The
temperature dependency of the carbon conversion results into an equilibrium
temperature at which the amount of char produced equals the amount of char
required to sustain the process temperature. The equilibrium temperature should be
between limits posed at the higher end by ash melting and at the lower end by tar
composition and tar concentration requirements. The tar content and composition
can change significantly at relatively low gasification temperatures (<750°C). This
can lead to problems in the equipment downstream which is normally designed for
a specific type of tar. Equation 5.1 in chapter 5 shows the definition of Carbon
conversion used in this thesis.
Assumed carbon conversion relation:
SilvaGas did several gasification tests in a pilot plant (PRU in Columbus)
and a commercial plant (Vermont) to determine the carbon conversion at different
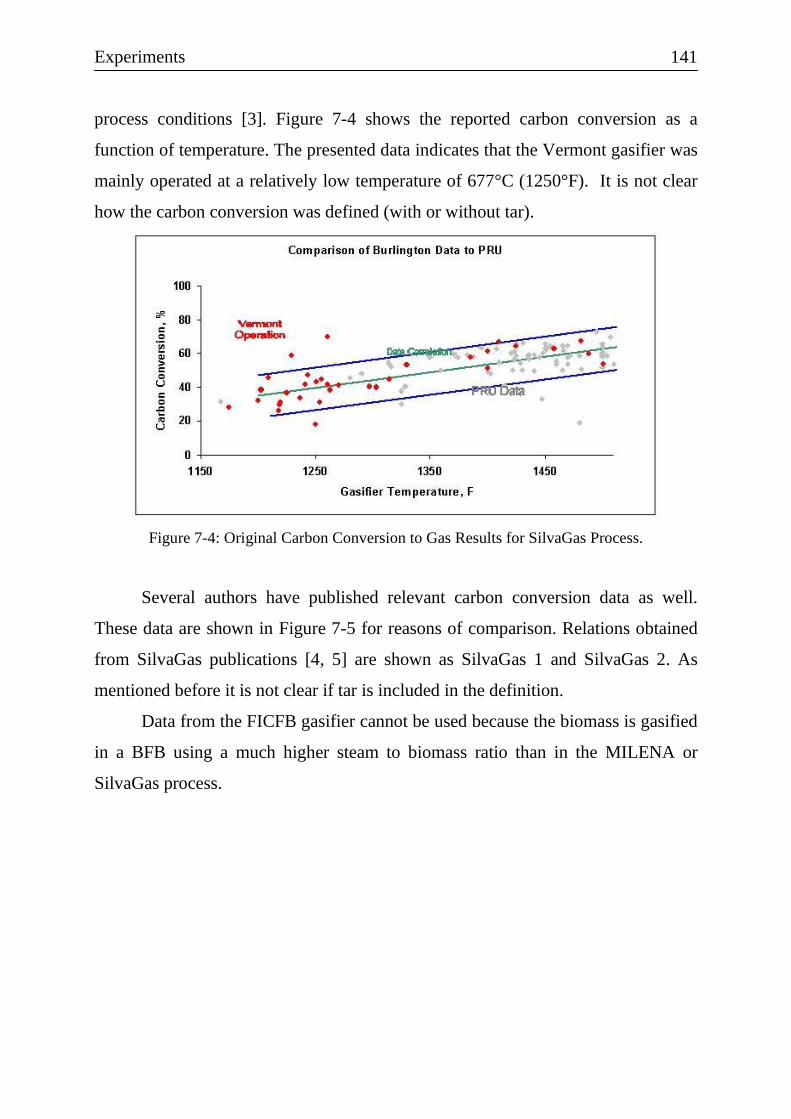
Experiments
141
process conditions [3]. Figure 7-4 shows the reported carbon conversion as a
function of temperature. The presented data indicates that the Vermont gasifier was
mainly operated at a relatively low temperature of 677°C (1250°F). It is not clear
how the carbon conversion was defined (with or without tar).
Figure 7-4: Original Carbon Conversion to Gas Results for SilvaGas Process.
Several authors have published relevant carbon conversion data as well.
These data are shown in Figure 7-5 for reasons of comparison. Relations obtained
from SilvaGas publications [4, 5] are shown as SilvaGas 1 and SilvaGas 2. As
mentioned before it is not clear if tar is included in the definition.
Data from the FICFB gasifier cannot be used because the biomass is gasified
in a BFB using a much higher steam to biomass ratio than in the MILENA or
SilvaGas process.

Chapter 7
142
60
65
70
75
80
85
90
95
100
750 800 850 900 950 1000
Gasifier temperature [°C]
C in
pro
duce
r ga
s (in
cl. t
ar)
/ C in
fuel
[%]
SilvaGas 1
SilvaGas 2
Milena 'old'
VTT ER 0.28 - 0.43
Figure 7-5: Carbon Conversion data from literature
The data published by VTT were for air/oxygen blown gasification [6] and are
therefore less relevant than the other data. The reported carbon conversion is higher
than for the indirect gasifiers, which is logical because part of the available oxygen
will be used to directly combust the carbon in the fluidized bed gasifier. The
measurements show a small increase in conversion by increased gasification
temperature.
The MILENA ‘old’ relation showed in Figure 7-5 was estimated from the
SilvaGas data and from tests with the ECN CFB BIVKIN gasifier. The MILENA
‘old’ relation was used to design the lab-scale and pilot-scale gasifiers.
Carbon conversion measured in MILENA reactor:
The carbon conversion in the riser and the settling chamber cannot be measured
directly. The char leaving the gasifier riser is separated from the producer gas in the
settling chamber. Approximately 80 - 90% is sent directly to the combustor. The
remaining 10 - 20% leaves the MILENA gasifier riser with the producer gas and
for approximately 90% it is collected by a cyclone. It will be returned to the
combustor in commercial scale installations. The amount of char sent to the

Experiments
143
combustor is calculated indirectly from the C and O balance over the combustor.
The amount of C and O leaving the combustor as flue gas is calculated from the
measured dry flue gas composition (concentration of CO2 and O2) and the amount
of flue gas. This amount of flue gas is calculated from the nitrogen balance over the
combustor, assuming that all nitrogen entering the combustor comes from the
combustion air. The amount of combustion air is measured.
Figure 7-6 shows the calculated carbon conversion for a wide range of
experiments in the lab-scale and pilot-scale installation using different woody
biomass fuels. The carbon conversion determined for pilot-scale experiments is
lower than for lab-scale experiments. An experiment was done with the same size
fuel (beech wood) as used in the lab-scale MILENA. Also this test resulted in a
lower conversion for the pilot plant. A higher carbon conversion in the pilot plant
was expected, because residence time of the biomass/char in the riser and the
settling chamber is longer. The lower carbon conversion is probably due to leakage
of fuel from the feeding system into the combustor. This problem will be solved in
future tests.
The graph also shows the relation used to design the MILENA process and
the ‘new’ relation based on the experiments described in this thesis. It must be
noted that the carbon conversions calculated from measurements in the pilot-scale
installation can be too low due to leakage of biomass from the feeding system in
the combustor.
The data for carbon conversion measured for the MILENA gasifier are
significantly higher than what was presented by SilvaGas. This difference is
probably due to the higher residence time of the biomass/char particles in the
MILENA settling chamber.

Chapter 7
144
60
65
70
75
80
85
90
95
750 770 790 810 830 850 870 890
Gasifier temperature [°C]
Car
bon
conv
ersi
on [%
]
Lab-scale - beech wood - sandLab-scale - beech wood - olivinePilot plant - wood pellets - sandPilot plant - wood pellets - olivinePilot plant - beech wood - olivinePilot plant - demolition wood - olivinePrelimenary design point demo plantMilena 'old' 65+0.15*(T-760)Milena 'new' 79+0.04*(T-760)
Figure 7-6: Measured carbon conversions in MILENA lab-scale and pilot plant.
Equation 7.1 shows the relation for carbon conversion that is going to be used in
the updated MILENA model. At the typical MILENA process conditions the
difference with the previous relation are small.
ςc,gas = 79 + 0.04*(T-760); T in °C. (7.1)
The MILENA process temperature is self controlled. If the gasification
temperature drops, the amount of char/fuel to the combustor increases, leading to
an increase in temperature. The equilibrium temperature is between 800 and 880°C,
depending on the moisture content of the fuel. The fact that the carbon conversion
is less temperature dependent than assumed in the past might make additional
process control necessary. The idea is to control the gasification and combustion
temperature by splitting the recycle of tar between gasifier riser and combustor. A
recycle of tar to the gasifier riser will decrease the gasification and combustion
temperatures. This has a positive effect on Cold Gas Efficiency, but the
Experiments
145
concentration of tar in the producer gas will increase. Tests are planned to measure
the effect of tar recycling to the gasifier riser on tar composition and concentration.
Char composition:
The char entering the combustor is mainly carbon, but the oxygen and hydrogen
content cannot be neglected. The left column of Table 5.1 shows the char
composition that was found in literature. These data were obtained from drop tube
measurements at temperatures between 750 and 900°C [7].
The second column shows the char composition which was previously used
in the MILENA model. The composition was an average of the literature data and
the measured composition of the collected cyclone ashes from the ECN CFB
gasifier BIVKIN.
Experiments were done in the MILENA pilot reactor to generate more
reliable data. Demolition wood was used as fuel. It is not practical to collect the
char particles that fall down in the settling chamber and fuel the combustor. The
smaller particles that are blown out of the settling chamber are collected by a
cyclone. These particles were sampled and analyzed. It is assumed that the
composition of the fine char particles is similar to that of the larger particles. The
third column in Table 5.1 shows the measured char composition.
The right hand column shows the average values of the previously used data
and the data obtained from MILENA pilot measurements. These values are used in
the updated MILENA model. Nitrogen is not included in the standard char
composition, because the concentration is strongly fuel dependent. The nitrogen
content in the char is assumed to be 30% of the nitrogen in the fuel.
Table 7.2: Char composition used in MILENA model
Literature
Previously
used in
model
MILENA pilot
measurements
Updated
Model
Fuel Hardwood - Demolition -

Chapter 7
146
Wood
C [wt.% daf] 85.2 92.6 89.7 91.1
H [wt.% daf] 2.5 1.0 1.1 1.1
O [wt.% daf] 12.3 6.4 9.2 7.8
7.5 Hydrocarbon yields
The yield of hydrocarbons is an essential parameter in the MILENA Excel model
and influences the overall system efficiency. For electricity generation by gas
engines or gas turbines and for the production of Bio-SNG, a high hydrocarbon
yield is beneficial. For syngas application a low hydrocarbon yield is required,
preferably close to zero.
Methane is the hydrocarbon that is present in the gas in the highest
concentration. It was observed from data generated in the ECN CFB gasifier that
methane yield is influenced by Equivalence Ratio (ER). In literature [8] a relation
was found that agreed with ECN measurement. This relation is used in the
MILENA model and was verified with data from MILENA experiments. Figure
7-7 shows the measured and theoretical yield of CH4 as a function of ER. The line
shown in the figure represents the theoretical CH4 yield line. The right hand y-axis
gives the methane yield on mol fraction basis.
The variation in ER is achieved by varying the amount of fluidization air to
the gasifier riser. During steam gasification no air is sent to the gasifier riser.
Another reason for variations in ER is the variation in the amount of oxygen
transported by the bed material from the combustor to the riser (see 7.12).

Experiments
147
0.00
0.01
0.02
0.03
0.04
0.05
0.06
0.07
0.08
0.09
0.10
0 0.02 0.04 0.06 0.08 0.1 0.12 0.14 0.16 0.18 0.2
ER [-]
CH
4 [k
g kg
-1 fu
el d
.a.f.
]
0
0.02
0.04
0.06
0.08
0.1
0.12
0.14
C in
CH
4 / C
in in
fuel
[-]
Lab-scale - beech wood - sandLab-scale - beech wood - olivinePilot plant - Beech wood - olivinePilot plant- wood pellets - sandPilot plant - wood pellets - olivinePilot plant - demolition wood - olivine0.0873-0.082•ER
Figure 7-7: CH4 yield in the MILENA gasifiers as function of ER.
As can be seen from the figure the CH4 yield decreases with an increase in
ER. An increase in ER from 0 to 0.1 gives a reduction in CH4 yield of
approximately 10%, so the oxygen or air that is added results in combustion of the
fuel compounds present in the producer gas. It is uncertain to what extent the char
is combusted as well. This empirical relation was obtained from literature [8]. The
MILENA data points obtained from the lab-scale and pilot-scale MILENA are in
accordance with the relation obtained from literature. Hence, there is no need to
update the relation used in the MILENA model.
At typical operating temperatures of the MILENA gasifier the theoretical
concentration of CH4 and higher hydrocarbons should be close to zero, if the gas is
at chemical equilibrium. At typical operating temperatures of fluidized bed
gasifiers (850°C) the CH4 concentration is always far higher than the theoretical
equilibrium concentration. For Entrained Flow gasifiers, which are operated at
approximately 1300°C the reported CH4 concentration is close to the chemical
equilibrium concentration (< 1vol.%). So it was expected that an increase in
temperature would lead to a lower CH4 yield. In the MILENA model this was
solved by using a correction factor for the CH4 yield. Figure 7-8 shows the

Chapter 7
148
correction factor that needs to be applied to the relation for CH4 production as
function of temperature. The figure shows no decline in CH4 yield at increased
gasification temperatures, but some tendency to increase. The correction factor
varies between 0.9 and 1.1. No correction is applied in the MILENA model.
0.60
0.70
0.80
0.90
1.00
1.10
1.20
750 770 790 810 830 850 870 890
Gasifier temperature [°C]
Cor
rect
ion
fact
or fo
r C
H4
yiel
d [-
]
0.08
0.09
0.10
0.11
0.12
0.13
0.14
0.15
C in
CH
4 / C
in in
fuel
[-]
Lab-scale - beech wood - sand
Lab-scale - beech wood - olivine
Pilot plant - Beech wood - olivine
Pilot plant- wood pellets - sand
Pilot plant - wood pellets - olivine
Pilot plant - demolition wood - olivine
Figure 7-8: Correction for CH4 yield as function of temperature.
It can be concluded that the original relation used to calculate the CH4 yield
is valid for the MILENA gasifier operated at ‘standard’ operating conditions
(gasification temperature between 770 and 880°C and atmospheric pressure) using
woody fuels and sand or olivine as bed material. No modifications to the MILENA
model were required.
For the yield of higher hydrocarbons no relations were available from
literature. From experiments done in the ECN CFB BIVKIN gasifier it was
observed that the concentration of higher hydrocarbons is a fraction of the CH4
concentration. Data produced with the ECN CFB gasifier were originally used in
the MILENA model. Experimental data produced with the MILENA gasifiers were
used to verify the relations.

Experiments
149
On energy basis the cleaned MILENA producer gas contains approximately
16% of ethylene (C2H4). Ethylene from fossil origin is widely used in industry, so
replacing fossil ethylene by bio-ethylene can have an interesting market potential.
Figure 7-9 shows the relative ethylene yields at different temperatures. The lab-
scale measurements show no significant effect of temperature on ethylene
production. The pilot-scale measurements show a decline in ethylene yield when
temperature is increased. The solid line shows the theoretical relation.
Measurement data are close to the theoretical line, so the original relation needs no
modification.
0.00
0.10
0.20
0.30
0.40
0.50
0.60
750 770 790 810 830 850 870 890
Gasifier temperature [°C]
C2H
4 /
CH
4 [m
ol m
ol-1
]
Lab-scale - beech wood - sandLab-scale - beech wood - olivinePilot plant - Beech wood - olivinePilot plant- wood pellets - sandPilot plant - wood pellets - olivinePilot plant - demolition wood - olivineMILENA Excel Model
Figure 7-9: C2H4 yield relative to CH4 as function of temperature.
The acetylene (C2H2) concentration is of minor importance to the mass and
energy balance, but acetylene is a known soot precursor in downstream catalytic
processes, so a reduction in concentration can be beneficial.
Figure 7-10 shows the measured acetylene yields. The solid line shows the
theoretical relation. Acetylene is a relatively unstable molecule, and a decrease in
concentration was expected at increased temperatures, whereas the measurements
in Figure 7-10 do not show this. The lab-scale data show a higher yield. The pilot
data are close to the fraction that was used in the model. Because the pilot-scale

Chapter 7
150
data are seen as more important, the fraction used in the MILENA excel model was
not changed.
0.00
0.01
0.02
0.03
0.04
0.05
0.06
0.07
0.08
0.09
0.10
750 770 790 810 830 850 870 890
Gasifier temperature [°C]
C2H
2 /
CH
4 [m
ol m
ol-1
]
Lab-scale - beech wood - sandLab-scale - beech wood - olivinePilot plant - Beech wood - olivinePilot plant- wood pellets - sandPilot plant - wood pellets - olivinePilot plant - demolition wood - olivineMILENA Excel Model
Figure 7-10: C2H2 yield relative to CH4 as function of temperature.
The relative yield of ethane (C2H6) is also of minor importance because of its
relatively low concentration, but the ethane concentration shows a remarkable trend
(see Figure 7-11). The relative ethane yield clearly decreases when the gasification
temperature is increased. Possibly ethane is cracked into ethylene and hydrogen.

Experiments
151
0.00
0.01
0.02
0.03
0.04
0.05
0.06
0.07
0.08
0.09
0.10
750 770 790 810 830 850 870 890
Gasifier temperature [°C]
C2H
6 /
CH
4 [m
ol m
ol-1
]Lab-scale - beech wood - sandLab-scale - beech wood - olivinePilot plant - Beech wood - olivinePilot plant- wood pellets - sandPilot plant - wood pellets - olivinePilot plant - demolition wood - olivineMILENA Excel Model
Figure 7-11: C2H6 yield relative to CH4 as function of temperature.
The relation for ethane production was not changed in the MILENA model,
because of the negligible influence on the component balance at typical operating
temperatures.
Figure 7-12 shows the relative benzene (C6H6) yield. There is no significant
difference in benzene yield between the fuels or bed materials. A small increase in
benzene yield at increased temperatures can be observed. Benzene is a tar cracking
product, so an increase is to be expected. However temperature dependency was
neglected, the relation in the MILENA model was not changed.

Chapter 7
152
0.00
0.02
0.04
0.06
0.08
0.10
0.12
750 770 790 810 830 850 870 890
Gasifier temperature [°C]
C6H
6 /
CH
4 [m
ol m
ol-1
]
Lab-scale - beech wood - sandLab-scale - beech wood - olivinePilot plant - Beech wood - olivinePilot plant- wood pellets - sandPilot plant - wood pellets - olivinePilot plant - demolition wood - olivineMILENA Excel Model
Figure 7-12: C6H6 yield relative to CH4 as function of temperature.
Figure 7-13 shows the relative toluene (C7H8) yield. A decrease in toluene
yield at increased temperatures was observed. The relation for toluene production
was changed accordingly.
0.00
0.01
0.02
0.03
0.04
750 770 790 810 830 850 870 890
Gasifier temperature [°C]
C7H
8 /
CH
4 [m
ol m
ol-1
]
Lab-scale - beech wood - sandLab-scale - beech wood - olivinePilot plant - Beech wood - olivinePilot plant- wood pellets - sandPilot plant - wood pellets - olivinePilot plant - demolition wood - olivineMILENA Excel Model oldMILENA Excel model new
Figure 7-13: C7H8 yield relative to CH4 as function of temperature.
Table 7.3 shows the relations for the yield in hydrocarbons which were used
in the past and the modified relations based on measurements in the MILENA

Experiments
153
gasifiers. Propylene (C3H6) is present in the producer gas in low concentrations,
but was not included in the previous model.
Table 7.3: Relations used to calculate gasifier outlet gas composition at atmospheric pressure.
Yield
Previously used
in
Model
MILENA measurements
Updated
MILENA Model
CH4 [kg kg-1 fuel d.a.f.] 0.0873-0.082•ER - 0.0873-0.082•ER
C2H2 [mol mol-1 CH4] 0.02 0.03 0.02
C2H4 [mol mol-1 CH4] 0.32 0.33 0.32
C2H6 [mol mol-1 CH4] 0.02 0.337 – 0.0004 • T 0.02
C6H6 [mol mol-1 CH4] 0.08 0.08 0.08
C7H8 [mol mol-1 CH4] 0.01 0.093-0.0001 • T 0.093-0.0001 • T
C3H6 [mol mol-1 CH4] - 0.008 0.008
The temperature value used in the temperature correction for toluene yield
must be entered in °C.
7.6 Tars
The operation and the design of the MILENA gasifier are not optimized to
minimize the tar content in the producer gas. A tar removal or tar reforming device
is required to make the gas suitable for gas engine operation or Bio-SNG
production. This means that the tar yield is less relevant than for gasifiers designed
to produce no or low amounts of tar (e.g. the FICFB process). The OLGA tar
removal technology is used in the MILENA lab-scale and pilot plant. The OLGA
technology is also going to be applied in the demonstration plant. Tar production
data are required to design the OLGA tar removal system. Especially the
concentration of naphthalene is of relevance, because this compound is present in
the gas in the highest quantity. Benzene and toluene are not included in the tar

Chapter 7
154
definition used in this thesis, as they are considered to be a valuable fuel for most
applications.
For the design of the producer gas cooler it is required to know the tar dew-
point. The cooler should be designed in such a way that wall temperatures are kept
above the tar dew point. The tar dew point can be measured or can be calculated
from the composition of the tar. The ECN website www.thersites.nl provides a
useful tool to calculate the tar dew point. In general the calculated tar dew point of
the raw gas from the MILENA is above 250°C. The relations used to calculate the
dew point are only valid below 250°C. The wall of the cooler is kept above 400°C
to prevent tar condensation.
Figure 7.14 shows an example of the compounds present in the MILENA
producer gas. Naphthalene is by far the most common compound in the tar.
0
1000
2000
3000
4000
5000
6000
7000
8000
9000
m/p
-Xyle
ne
Pheno
l
Inde
ne
Napht
halen
e
Isoqu
inolin
e
1-m
ethy
lnaph
thale
ne
Ethyn
yl Nap
htha
lene
Acena
phth
ene
Phena
nthr
ene
Fluora
nthe
ne
Benzo
(a)a
nthr
acen
e
Benzo
(b)fl
uora
nthe
ne
Benzo
(e)p
yren
e
Peryle
ne
Dibenz
(a,h
)ant
hrac
ene
Coron
ene
Unkno
wns-1
Unkno
wns-3
Unkno
wns-5
Tar
con
cent
ratio
n [m
g nm
-3 d
ry]
Figure 7.14: MILENA average tar composition for demolition wood and olivine.
The composition of the tar is also of relevance for the MILENA Excel
model, because it influences the element and energy balances. Table 5.2 shows the
measured compositions and the data used in the model. The composition shown in
the most left hand column was used until the middle of 2010. The right hand

Experiments
155
column shows the average measured composition from lab-scale and pilot-scale
tests. The average value was used in the modified MILENA model from July 2010.
Table 7.4: Tar composition on mass fraction basis
Previously
used in
model
MILENA
lab-scale
measurements
MILENA
pilot
measurements
Updated
MILENA
Model
Fuel
- Clean
wood
Demolition
Wood
-
C [wt.%] 94.2 93.4 92.9 93.2
H [wt.%] 5.8 6.1 6 6.1
O [wt.%] - 0.5 0.9 0.7
N [wt.%] - - 0.1 -
The heating value of the tar is 38.1 MJ kg-1 on LHV basis and 39.4 MJ kg-1
on HHV basis.
Figure 7-15 shows the measured tar concentration as a function of
temperature. The Solid Phase Adsorption (SPA) method was applied to measure
the tar concentration [9]. The SPA method is useful for compounds from phenol to
pyrene. Class 1 tars (7- and higher ring compounds) are not included, because they
cannot be measured with the SPA method and the contribution to the total amount
of tar is negligible.
Only experiments done with steam/dry biomass ratios below 0.5 are shown
(this also includes experiments with air to the gasifier riser instead of steam). This
is because one of the essential differences between MILENA and the FICFB
concept is the low steam/dry biomass ratio. The steam versus dry biomass ratio for
a typical commercial scale MILENA gasifier is 0.4. The amount of water in the
biomass is included in the steam fraction of the ratio. Steam has a positive effect on
the reduction in tar concentration, but the steam vs. dry biomass ratio is kept low to
keep the energetic efficiency high.

Chapter 7
156
During the tests different batches of olivine were used (from Austria and
Norway). The Austrian batch seems more catalytically active. The gas composition
is normally closer to CO shift equilibrium composition. It was also observed that it
takes time (> 40 hours) to activate the bed material. Figure 7-22 shows an example
for this activation. The H2 concentration increases over time, probably due to an
increased CO shift activity of the bed material. In the measurement data presented
in this paragraph no difference was made between the types of olivine or the time
the bed material was used in the reactor.
Figure 7-15 shows a decline in total tar concentration (excluding benzene
and toluene) when the gasification temperature is increased.
0
10000
20000
30000
40000
50000
60000
70000
750 770 790 810 830 850 870 890
Temperature [°C]
Tar
con
cent
ratio
n [m
g nm
-3 d
ry N
2 fr
ee]
Lab-scale - beech wood - sand
Lab-scale - beech wood - olivine
Pilot plant - beech wood - olivine
Pilot plant - wood pellets - sand
Pilot plant - wood pellets - olivine
Pilot plant - demolition wood - olivine
Figure 7-15: Total tar concentration as function of temperature.
Figure 7-16 shows the decline in class 2 tars (heterocyclic components) at
increasing temperature; OH groups disappear with increasing temperatures. This
agrees with measurements reported by others [10]. There is no clear difference
between sand and olivine as bed material.

Experiments
157
0
1000
2000
3000
4000
5000
6000
7000
8000
750 770 790 810 830 850 870 890
Temperature [°C]
Tar
con
cent
ratio
n [m
g nm
-3 d
ry N
2 fr
ee]
Lab-scale - beech wood - sand
Lab-scale - beech wood - olivine
Pilot plant - beech wood - olivine
Pilot plant - wood pellets - sand
Pilot plant - wood pellets - olivine
Pilot plant - demolition wood - olivine
Figure 7-16: Concentration of class 2 tars as function of temperature.
The pilot plant and lab-scale installation seem to produce similar quantities
of class 2 tars, despite the longer gas residence time in the pilot plant. The
difference in fuel does not significantly influence the class 2 tar yield.
Class 3 tars are light aromatic hydrocarbons which are not important in
condensation and water solubility issues. The concentration of class 3 tars
(excluding Benzene and Toluene) is relatively low compared to the other classes.
Roughly 50 mass% of the class 4 tars (light poly-aromatic tars), is made up
by naphthalene, also called white tar because of its color. Figure 7-17 shows the
fraction of naphthalene in the total amount of tar produced. This graph clearly
shows the relative increase of naphthalene at an increased temperature probably
from the breakdown of heavy polyaromatic compounds.

Chapter 7
158
0%
5%
10%
15%
20%
25%
30%
35%
40%
750 770 790 810 830 850 870 890
Temperature [°C]
Per
cent
age
Nap
htha
lene
in to
tal t
ar [-
]
Lab-scale - beech wood - sand
Lab-scale - beech wood - olivine
Pilot plant - beech wood - olivine
Pilot plant - wood pellets - sand
Pilot plant - wood pellets - olivine
Pilot plant - demolition wood - olivine
Figure 7-17: Mass fraction of Naphthalene in total tar as function of temperature
Class 5 tars (heavy aromatic hydrocarbons) are of relevance, because they
determine the tar dew point of the gas. Figure 7-18 shows the measured
concentration of class 5 tars. Finding the right operation conditions to reduce the
amount of class 5 tars is of interest, because class 5 tars can cause fouling in the
producer gas cooler that is required before the tar removal. Tar condensation is
normally prevented by keeping the cooler wall temperature above the tar dew point.
Figure 7-15 shows no clear trend regarding reduction of class 5 tars.

Experiments
159
0
1000
2000
3000
4000
5000
6000
7000
8000
750 770 790 810 830 850 870 890
Temperature [°C]
Tar
con
cent
ratio
n [m
g nm
-3 d
ry N
2 fr
ee] Lab-scale - beech wood - sand
Lab-scale - beech wood - olivine
Pilot plant - beech wood - olivine
Pilot plant - wood pellets - sand
Pilot plant - wood pellets - olivine
Pilot plant - demolition wood - olivine
Figure 7-18: Concentration of class 5 tars as function of temperature.
7.7 Heat balance
The pilot-scale MILENA gasifier was designed for 800 kWth biomass input,
but most of the time it is operated at lower loads, because the cooling capacity in
the gas cleaning test rig is limited.
Table 7.5 shows a typical heat balance for the MILENA pilot-scale
installation (without gas cleaning). The heat balance shown is for a test using clean
wood pellets as fuel and sand as bed material. The biomass input was 83% of the
design capacity.
Table 7.5: MILENA pilot plant, typical heat balance
In HHV [kW] Out HHV [kW] Latent heat air 21 Latent heat producer gas 61 Biomass 667 Condensation heat water 23 Condensation heat water 10 Chemical energy producer gas 515 BTX + tar recycle 0 Latent heat flue gas 52 Natural gas 55 Condensation heat water in flue gas 7 Heat loss 20 Carbon/char to cyclone 11 Chemical energy in tar 61 Latent heat ash 0

Chapter 7
160
Sum 754 750
Natural gas is fired in the combustor to thermally simulate the recycle of tars
and hydrocarbons (some benzene and toluene) which are normally removed from
the gas by the OLGA gas cleaning system.
The heat loss of the installation is around 15 kW, but was assumed to be
higher for this case because the refractory was not thoroughly heated before the
start of the tests.
The latent heat in the flue gas or producer gas is used to pre-heat the
combustion air. Pre-heating of combustion air increased the combustor and gasifier
riser temperature. A higher gasification temperature results in a higher carbon
conversion, thus a higher production of chemical energy in the producer gas.
The heat balance accuracy for a good test is normally within 5%, when a
well defined fuel like wood pellets is used.
7.8 Cold Gas Efficiency
The calculated Cold Gas Efficiency (CGE) for the pilot plant on LHV basis is
defined as the calorific value of the tar free gas from the OLGA gas cleaning
divided by the heating value of the biomass entering the gasifier (no integration of
biomass dryer). It varies between 79% and 82% for clean wood with a moisture
content of between 25 and 10% respectively. This definition includes the ammonia
in the gas. Combustion air was preheated up to 400°C and a recycle of tar and
carbon containing cyclone ash was assumed. An increase in cold gas efficiency is
possible by integrating a biomass dryer, recycling tar to the gasifier riser instead of
to the combustor or an increase in combustion air pre-heat temperature. Sufficient
heat is available from the producer gas cooler and the flue gas cooler to supply the
heat for the air pre-heating.
The calculated CGE for the pilot plant does not differ much from that of a
commercial scale installation using the same fuel, because the main difference is

Experiments
161
the heat loss, which reduces with increasing scales. The heat loss of the pilot plant
is already very modest (approximately 2% of the thermal biomass input), so this
has not a large influence on the resulting CGE.
The tests with demolition wood B showed a relatively high content of
ammonia in the producer gas. The corresponding heating value was approximately
1% of the total heating value of the producer gas. Therefore, removing the NH3 (as
is required for most gas engine applications), has a significant and negative effect
on the CGE. In principle NH3 is a suitable fuel for gas engines but it will lead to an
increase in NOx production [11].
7.9 Modified MILENA model
The relations obtained from the experiments for carbon conversion as described in
paragraph 7.4 and for hydrocarbon yields as described in paragraph 7.5 were
implemented in the up-dated MILENA model. The model was applied to calculate
a standard case using clean wood with a moisture content of 25 wt.% (a.r.). The
composition of the wood pellets as given in Table 7.1 was used. This case
represents the desired operating conditions for Bio-SNG production.
The OLGA tar removal is part of the model, because the effect on the energy
and material balances of the recycle streams (tars and carbon containing dust) from
the OLGA cannot be neglected.
Steam is used as fluidization agent, to minimize the dilution of the producer
gas with nitrogen. CO2 is used as ‘inert’ purge gas. Olivine is used as bed material,
transport of oxygen from the combustor to the gasifier riser is included (assumed to
be 0.1 mass% of the circulating bed material).
The gasifier riser output using the modified relation is shown in Figure 7-19.
The combustor output is shown in Figure 7-20.
A combustion air pre-heat temperature of 320°C was assumed. Tars and dust
from the gas cleaning are returned to the MILENA combustor and gasifier riser.

Chapter 7
162
The Cold Gas Efficiency based on the cleaned gas, defined as described in
paragraph 2.7 is approximately 78% on LHV basis. This is calculated in an
additional worksheet, which is used to describe the gas cleaning (not shown).
The concentrations of pollutants like NH3, H2S and COS are relatively low,
because the concentrations of S and N in the used wood pellets are relatively low.

Experiments
163
Project: Titel: Spreadsheet Gasification -> see tab toelichtingTest: file: VERGAS20.XLSDatum: 20-aug-10 versie: 12-jul-10 See Thesis MILENA RM 34065Tijd: tot door: C.M. v.d. Meijden (4582)
Input data in blue and bold letters with borderSpreadsheet is for atmospheric installations only. Verifierd for fluidized bed BM gasifiers @ 780 - 880°CPseudo-equilibrium , empirical relations for CxHy yields!
Fuel Select fuel in vergas12_Phyllis_data.xls ID: 9004 Witte Labee pellets (2243, 2244 & 2245)Witte Labee pellets (2243, 2244 & 2245)
moisture [wt%] 25.0 25volatile [wt% dry] 0.00 Fuel flowash [wt% dry] 0.32 Mass flow (wet) 2717.7 2717.7 kg/hC [wt% daf] 48.25 Mass flow (dry) 2038.3 kg/hH [wt% daf] 6.37 Mass flow (DAF) 2031.7 kg/hO [wt% daf] 45.23 Thermal input 11247 kW (HHV)N [wt% daf] 0.13 10000 kW (LHV)S [wt% daf] 0.01Cl [wt% daf] 0.01 ER 0.04 (excl. Tar & BTX)F [wt% daf] 0.00 0Br [wt% daf] 0.00 0 CaCO3 / MgCO3 0.0 kg/uur
100.00 0.00
LHV [kJ/kg daf] 18536 13246 [kJ/kg a.r.]HHV [kJ/kg daf] 19929Gasification air [nm3/h] [nm3/h] [°C] Additional [kg/h] [nm3/h] [°C]Primairy air 0.0 0.0 150 Steam 135.9 163 150Secundairy air N2 (100%) 15.0 12 15Additional air 15 Recirculation gas 0.0 0Totall / average 0 0 CO2 supply 21.5 11 15
O2 supply 0.0 0.0 15Moisture content air 0 [vol% nat] O2 content (rest N2) 100 %
[kg/h] [%]Air / flue gas leak from comb. 27.9 Water recycle to gasifier 0.0 0O2 from combustor 76.1 Tar recycle to gasifier 17.5 30Velocity bottom riser 0.4 [m/s] BTX recycle to gasfier 0.0 0
Product gas nat droog meting dr.CO [vol%] 17.1 27.3 according C & O balans
H2 [vol%] 18.3 29.2 according shift equilibrium
CO2 [vol%] 13.9 22.2 according C & O balance
O2 [vol%] 0.0 0.0H2O [vol%] 37.3 - according H balance Maniatis corr. FactorCH4 [vol%] 8.1 12.9 Maniatis * 1.00 1
N2 [vol%] 1.2 1.8Ar [vol%] 0.01 0.01C2H2 [vol%] 0.2 0.3 CH4*.025
C2H4 [vol%] 2.7 4.2 CH4*.33 CO shift C2H6 [vol%] 0.2 0.3 CH4*.022 Kp 0.39C3H6 [vol%] 0.06 0.10 CH4*.008
C6H6 [vol%] 0.7 1.1 CH4*.083 Temp [°C] 1200 1200C7H8 [vol%] 0.0 0.075 CH4*(.093-0.0001*T)
H2S [Vppm] 27 42 60% of S in fuel
COS [Vppm] 3 4 6% of S in fuel
NH3 [Vppm] 718 1145 50% of (N in fuel - N in char)
HCl [Vppm] 11 17 20% of Cl in fuel
HF [Vppm] 0 0 of F in fuel
Tar [mg/nm3 nat] 20000 31892 20000 mg/mn3 wet 19981
Flow (incl. tar) [nm3/h] 2943 1846[kg/h] 2868 1954 Linear gas velocity[m3/h] 12330 7732 [°C]
Temp. in reactor 871C_conversion [%] 83.4 Milena new Area reactor 0.48 [m2]Onburned (C,H,O,N) [kg/h] 179.4 Velocity 7.17 [m/s]Inert (cyclone ash + dust) [kg/h] 6.6 Milena new Desired velocity 7 [m/s]
Ash (+char + CaO + MgO) kg/h] 186.0 Milena oldUBC (unburned in ash) [wt%} 96 83.4 Heating value (excl. tar, incl H2S& NH3)
wet dryError in C balance [%] 0.0Error in H balance [%] 0.0 HHV [kJ/nm3] 10783 17195Error in N balance [%] 0.0 [kJ/kg] 11067 16245Error in O balance [%] 0.0 LHV [kJ/nm3] 9938 15847Error in ash_inert balance [%] 0.0 [kJ/kg] 10199 14971 Heat balance (ref = 0 °C)
In [kg/h] LHV [kW] HHV [kW] Out [kg/h] LHV [kW] HHV [kW] [%] LHV br.Latent heat 22 22 Latent heat product gas 1337.7 1337.7 13.4Fuel 10000 11247 Qcond. Water - 620 -Qcond. Water - 93 Product gas (excl. Tar) 8125 8816 81.2Recircution gas (comb. heat) 0 0 Heat loss 0.0 0.0 0.0Heat supply from combustor (indirect) 1512 1512 Carbon loss 1591 1603 15.9Tar recycle 186 192 Tar loss 623 645 6.2BTX recycle 0 0 Latent heat ash & char 44.7 44.7 0.4 RECYCLE OF WATER / TAR / BTX TO COMBUSTOR Carbonisation reactions 0 0 0.0
Sum in 2868.6 11720 13067 Sum out 3054.0 11721.4 13066.8 117.2
[%] LHV [%] HHV Difference -1.5 0.0Cold gas efficiency (excl. tar) 78.0 75.5 Relative difference 0.0 0.0 [%]
Thesis Example clean wood
Figure 7-19: MILENA Excel model input and output for gasifier riser.

Chapter 7
164
Project: Titel: Spreadsheet vergassing -> COMBUSTORTest: file: VERGAS20.XLSDatum: 20-aug-10 versie: 12-jul-10Tijd: tot door: C.M. v.d. Meijden (4582)
Composition char from gasifier [kg/h] [nm3/h] [nm3/h] [°C]Combustion air 3623.7 2802.6 320
as [wt% dry] 3.54 Moisture content air 1 [vol% nat]C [wt% dry] 87.31 Lambda 1.30 1.3H [wt% dry] 1.05O [wt% dry] 7.48 kg/h nm3/h [°C]N [wt% dry] 0.47 Steam 0 0.0 400S [wt% dry] 0.03Cl [wt% dry] 0.11F [wt% dry] 0.00 Temp. char from gasifier 871 871 [°C]Br [wt% dry] 0.00
Ash / char from gasifier Cyclone coll. effieciency Flow [kg/h] 186.032 (incl. as) Cyclone ash 99.99999 99.99999Char loss [kg/h] 0.000 [kg/h] [%]
Water recycle to combustor 0.0 0Conversion char 100.0 wt% Tar recycle to combustor 40.9 70
BTX recycle to combustor 20.4 100CH4 supply 0 [mn3/h]
Flue gas: Nat Droog Producer gas (incl. tar) from gasif. to comb. 0.8 [%]O2 2.1 2.2 Flue gas from combustor to gasif. 1.00 [%]CO2 15.1 15.7 Air transport from combustor to gasifier [mn3/h]N2 77.8 81.1 O2 transport from combustor to gasifier 76.1 [mn3/h]Ar 0.9 1.0 CO2 tranport from combustor to gasifier [mn3/h]H2O 4.0 -NO [Vppm] 96 100 100 19% of N in char
NO2 [Vppm] 10 10 10 2% of N in char
SO2 [Vppm] 16 17 99% of S in char
HCl [Vppm] 46 48 99% of Cl in char
Flow to after burner [nm3/h] 2757 2647 Conditions combustor outlet Flow to after burner [kg/h] 3734 3680 Temperature 921 [°C]
Area reactor 7.04 [m2]Error in C balance [%] 0.0 Velocity 0.48 [m/s]Error in H balance [%] 0.0Error in N balance [%] 0.0 Ash_organic [kg/h] 0.001Error in O balance [%] 0.0 As_inert [kg/h] 6.590Error in ash_inert balance[%] 0.0 UBC [wt%] 0.009
[kg/h] LHV [kW] HHV [kW] Uit [kg/h] LHV [kW] HHV [kW] [%] LHV br.Latent heat 376 376 Latent heat flue gas 1086 1086Fuel 1591 1603 Qcond. Water - 63Qcond. Water 0 21 Heat loss 100 100Tar 433 448 Carbon loss 0 0BTX 230 239 Heat supply to gasif. 1512 1512 3.5CH4 0 0 Latent heat ash + char 1 1Product gas from gasif. 70 75
Sum in 3772 2699 2763 Sum out 3772.1 2700 2763
Difference -0.2 -0.1Relative difference 0.0 0.0 [%]
Thesis Example clean wood
Figure 7-20: MILENA Excel model input and output for combustor.
7.10 Distribution of trace elements and pollutants
All biomass fuel contains many different trace elements. The most relevant are
chloride, sulphur and nitrogen. These elements end up in the producer gas, flue gas
and ash. The distribution of these elements influences the heat and mass balance.
Especially the effect of nitrogen can be significant. Emission limits and
specifications of downstream equipment (e.g. a gas engine) impose restrictions on
these elements in the gas.

Experiments
165
Some types of biomass fuels (e.g. demolition wood) are polluted with
stones, glass, nails, etc. These pollutants can have a negative impact on the
hydrodynamic behaviour of the gasifier and need to be discharged from the system.
Fuel bound nitrogen, sulphur and chloride:
Table 7.6 shows an indicative distribution of fuel bound Cl, S and N between
producer gas and flue gas. The distribution is derived from a collection of
measurement data for clean wood and demolition wood. The values should be
considered as indicative. They are intended to give an impression of the distribution
only.
Table 7.6: Indicative distribution of the fuel bound elements N, S and Cl to gaseous
compounds and ash.
N S Cl compound fraction [%] compound fraction [%] compound fraction [%] NH3 50 H2S 60 HCl 20 HCN 10 COS 6 N2 30 Thiophenes 6 Tar 0,2 Tar - Char 10 Char 23 Char 60 Fly-ash - Fly-ash 5 Fly-ash 20
The hydrogen cyanide (HCN) concentration in the producer gas was only
measured twice during a test with demolition wood B. The average concentration
was 4245 ppmV on dry basis. This was far higher then expected. The batch of
demolition wood used during the test contained a relatively large fraction of
particle board. The binders used in the particle board are probably the source of the
high HCN concentration. Earlier tests in the ECN CFB gasifier BIVKIN using a
mixture of chicken manure and wood showed a HCN yield that was approximately
lower by a factor of 10. The HCN measurements will be repeated in the future to
check whether the relatively high HCN concentration is representative for
demolition wood B.

Chapter 7
166
Thiophenes are always found in the gas in relatively low concentrations, but
this sulphur containing compound is hard to remove with technologies commonly
applied to remove H2S. Therefore the concentration is relevant if the equipment
placed downstream (e.g. catalysts) is sensitive to sulphur.
The amount of HCl in the gas is strongly influenced by the composition of
the bed material and the ash of the biomass, because chloride reacts with several
(ash) compounds at typical MILENA process conditions.
Bed pollutants:
Large pollutants in the fuel like glass, stones, nails and screws end up in the riser
and are discharged from the system by a screw system. The mixture of bed material
and pollutants is sieved to regain the bed material. Figure 7-21 shows an example
of the bottom ash discharge from the MILENA riser after sieving (> 0.7 mm). The
discharge is a mixture of bed material and large particles. Most of these particles
are molten glass particles covered with a layer of bed material (olivine).
Figure 7-21: Typical example of ash particles discharged from riser.
The size of the bed pollutant particles was larger than expected. According to
the fuel specification, particles above 25 mm should not be present in the fuel, but
in practice this appeared hard to achieve. The large particles were the cause for

Experiments
167
several problems with the ash discharge system. This system was modified twice,
to be able to discharge the bed pollutants.
7.11 Flue gas quality
The flue gas leaving the MILENA is normally sent to a stack after cooling and dust
removal and has to meet the local emission standards. If a clean fuel is gasified the
standards normally include NOx, SOx and dust emissions. The cleaned producer gas
normally is put in the same category as natural gas or biogas. Therefore, after
combustion of the producer gas, the typical emission limits for natural gas or
biogas have to be fulfilled.
Table 7.7 gives an indication of the emissions from the lab-scale installation
and the pilot plant when clean wood is used as fuel. The emissions of CO strongly
depend on the air to fuel ratio. The concentration rises sharply when the O2 content
in the flue gas drops below 2 percent. The limits in the first column are given as an
example. Local emission limits for biomass plants vary strongly.
Table 7.7: Measured flue gas emissions
Limits Lab-scale Pilot plant
O2 [vol.% dry] 11 4.2 5
CO2 [vol.% dry] - 13.4 13
CO [mg Nm-3 @ 11 vol.% O2 dry] 50 ± 30 <10
NOx [mg/Nm -3 @ 11 vol.% O2
dry] 70 ± 120 ± 70
In the pilot-scale installation a bag-house filter is used at a temperature
between 100 and 200°C. The concentration of dust is low enough to meet the
emission limits.

Chapter 7
168
7.12 Behavior of olivine as bed material
According to literature [1] olivine needs pretreatment before it is active in tar
cracking. In the MILENA this is done by keeping the olivine at 800°C for at least
12 hours in an oxidizing environment. However, according to literature higher
temperatures are favorable [12]. The iron in the olivine precipitates at the surface of
the particle because of this activation. Figure 7-22 gives a good impression for the
time required to activate the catalyst. The figure depicts the measured
concentrations of the main compounds during a MILENA lab-scale test using small
beech wood particles. The test was done in November 2008. The test was started
with fresh olivine from Austria. The H2 and CO2 concentrations increase over time.
The CO concentration decreases, even after 95 hours of continuous operation when
the gas composition was still changing. The change in gas composition is a result of
the more active catalyst. After 100 hours the gas composition is close to the
theoretical CO shift equilibrium. Similar behavior was observed during other lab-
scale tests using olivine.
0
5
10
15
20
25
30
35
40
0 10 20 30 40 50 60 70 80 90 100
Time [hours]
Gas
con
cent
ratio
n [v
ol%
dry
]
CH4COCO2H2
Figure 7-22: MILENA lab-scale duration test gas composition.
The influence of the type of bed material and operating conditions on tar
production are described in paragraph 7.6.

Experiments
169
Transport of oxygen from combustor to gasifier riser.
After the first tests with olivine it was noticed that the balance for oxygen over the
gasifier riser and the combustor was incorrect. Further analysis of the results
showed that transport of oxygen from the combustor to the gasifier riser was the
most logical explanation. The iron in the bed material oxidizes in the combustor
and reduces in the gasifier riser. This results in a net transport of oxygen from
combustor to gasifier riser. These findings agreed with data in literature [2, 13],
but exact figures or relations to quantify the amount of oxygen transported were not
given in literature.
From the different tests the amount of oxygen transported by the olivine was
calculated to be equivalent to an ER of 0 – 0.1 at typical MILENA solid circulation
rates as described in paragraph 7.3. This equals to 0 - 0.3 mass% of oxygen added
to the riser per kg of the circulating bed material. Figure 7-7 shows the methane
yield as function of ER. The ER varies from 0 to 0.2. Part of the oxygen came from
the circulating bed material and the other part was added as air. Oxygen transport
was observed in the lab-scale installation with Austrian olivine and Norwegian
olivine, but the amount varied strongly. During the pilot-scale experiments (mainly
using demolition wood and Norwegian olivine), the amount of oxygen transport
was much lower. It is not clear what causes the differences in the amount of oxygen
transport. Further research is required to determine the influence of the oxygen
transport.
For the design of the MILENA 10 MWth demonstration plant the amount of
oxygen transported was assumed to be 0.1 mass% of the circulating bed material
for the case where olivine is used as bed material.
Consumption of olivine:
A major drawback of the use of olivine is the consumption of this bed material.
Olivine is more sensitive to attrition than sand. The developers of the FICFB

Chapter 7
170
Gasifier in Güssing have put a lot of effort in minimizing the consumption of
olivine.
The first tests in the pilot plant with olivine showed an excessive los in bed
material. This was caused by the large fraction of fines in the fresh Austrian
olivine. For this reason it was decided to change to Norwegian olivine, which was
available without fines. After the switch in bed material the loss in bed material
from the combustor was reduced to an acceptable level of approximately 2 kg h-1.
A further reduction is expected from an increase in height of the freeboard as it is
planned for the demonstration plant. The height in the freeboard of the pilot plant
was restricted by the building were it is placed and was lower than theoretically
required (see chapter 6).
7.13 Agglomeration
One of the major operational problems in fluidized bed combustors and gasifiers is
agglomeration of the bed material. Bed agglomeration can result in de-fluidization
of the bed which normally leads to local temperature deviations. This can result in
local melting and will finally lead to a complete shutdown of the installation.
Agglomeration can be divided into type I and type II agglomeration. Type I
agglomeration is best described as deposition induced agglomeration and type II as
melt induced agglomeration (see chapter 2.4). Inorganic alkali components from
the fuel, mainly potassium (K) and sodium (Na), are the most likely source for type
I agglomeration. Type II agglomeration was often observed after tests in the ECN
CFB gasifier BIVKIN. The main reason for this type of agglomeration in the CFB
gasifier was probably the high char content in the reactor. Because of the limited
fuel conversion in a CFB reactor the remaining char tends to accumulate in the
reactor. Figure 7-23 gives an impression of the amount of char accumulated in the
ECN CFB BIVKIN gasifier when wood pellets were used as fuel. This sample was
taken from the sand circulation system after cooling down of the reactor. The
operation was shut down without going into combustion mode. The large particles

Experiments
171
are all char particles from wood pellets. As can be seen from the picture the volume
of char is relatively high compared to the volume of bed material (the small 0.5 mm
particles). The high char/bed material ratio increases the chance of local hot spots
at locations where air is added. Local hot spots will result in local ash melt which
will result in type II agglomeration. Char accumulated was reduced in the ECN
CFB gasifier by milling the wood pellets.
Figure 7-23: Circulating bed material from ECN CFB gasifier BIVKIN after test using wood
pellets as fuel. Sand of 0.4 – 0.6 mm was used as original bed material.
The design of the MILENA prevents char accumulation and local hot spot.
Because the char is completely combusted in the BFB combustor. Type II
agglomeration, caused by excessive accumulation of char is therefore prevented.
Another causes for type II agglomeration can be melting of fine ash particles
which are in the biomass or melting of glass particles. Glass particles are a very
common pollutant in demolition wood. Tests with demolition wood (B-wood) were
done to investigate the behavior of the glass particles in the MILENA gasifier.
Figure 7-24 shows a picture of the bottom-ash discharged from the riser.
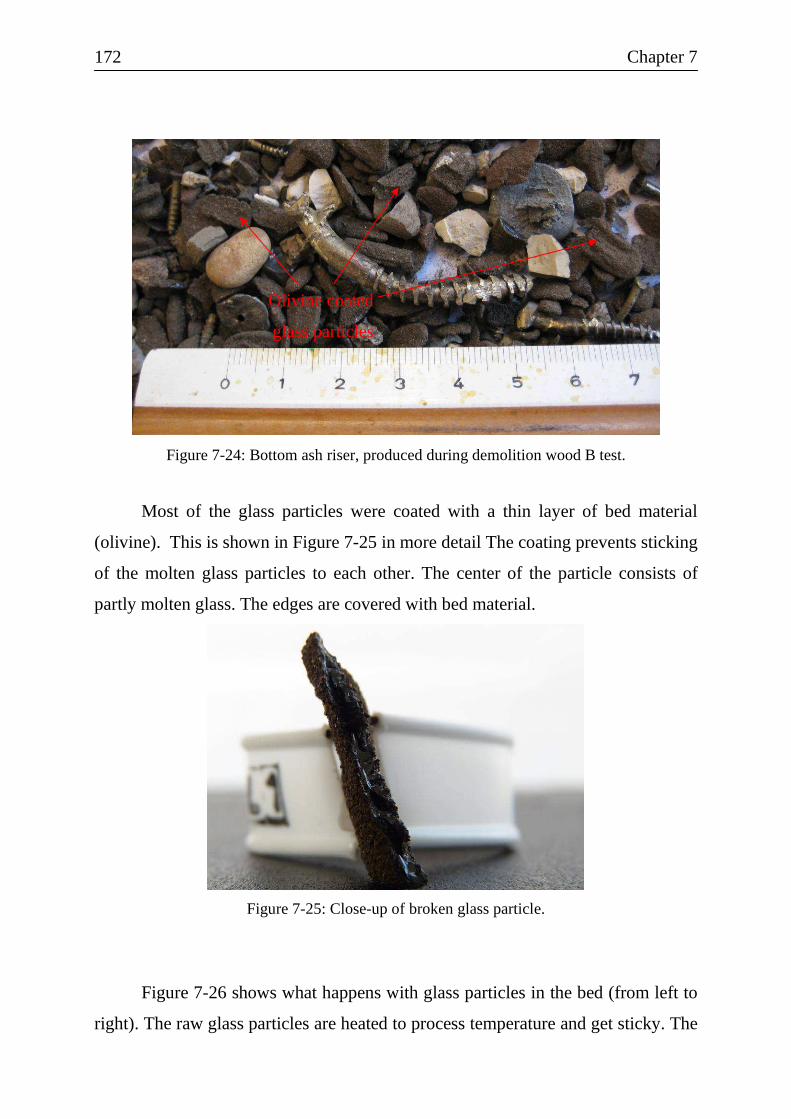
Chapter 7
172
Figure 7-24: Bottom ash riser, produced during demolition wood B test.
Most of the glass particles were coated with a thin layer of bed material
(olivine). This is shown in Figure 7-25 in more detail The coating prevents sticking
of the molten glass particles to each other. The center of the particle consists of
partly molten glass. The edges are covered with bed material.
Figure 7-25: Close-up of broken glass particle.
Figure 7-26 shows what happens with glass particles in the bed (from left to
right). The raw glass particles are heated to process temperature and get sticky. The
Olivine coated
glass particles

Experiments
173
bed particles stick on the glass surface until the particles are completely covered
with bed particles.
Figure 7-26: Various stages of bed material covering of glass particles.
During one demolition wood gasification test part of the fuel was screwed
directly into the combustor/sand transport zone of the MILENA reactor, because of
a mechanical failure of the riser reactor. After this test type II agglomerates where
found in the reactor, but the phenomenon was not observed during normal
operation.
Fast growing biomass crops like grass have a relatively high content of
potassium and silicon. Even without an interaction with the bed material the ash
from the biomass can form a melt at normal operating temperature, resulting in
type II agglomeration. Several tests were done at relatively low gasification
temperatures to see if the MILENA gasifier is suitable for such fuels. A summary
of the results is given in Table 7.8.
Table 7.8: Agglomeration results.
Fuel Test duration Tgasfier Bed material Agglomeration [-] [hours] [°C] [-] [-] Beech wood > 1500 800 - 870 sand/olivine No Wood pellets (clean wood) ≈ 20 800 - 870 sand/olivine No Demolition wood ≈ 50 800 - 870 olivine No/Possibly Wood sewage sludge mixtures ≈ 20 800 - 870 olivine No Sewage sludge < 10 ≈ 800 olivine Yes Wood lignite mixtures ≈ 20 850 olivine No Grass < 5 648 – 700 sand Yes Digestate pig manure + corn < 5 649 – 700 sand Yes

Chapter 7
174
Straw ≈ 10 650 - 700 sand No
Type II agglomerates were found after tests with demolition wood B in the
pilot plant. During that test the ash discharge system became blocked. Glass
particles accumulated in the reactor.
7.14 Alternative fuels
One of the attractive features of fluidized bed gasifiers is fuel flexibility. The
development of the MILENA gasifier is focused on using woody fuels, because this
type of fuel is widely available and the other indirect gasifiers (FICFB and
SilvaGas) reported successful results using woody fuels. Other (biomass) fuels are
suitable as well, at least in theory.
A limited test program was done using alternative fuels to get an impression
for the suitability for gasification in the MILENA reactor. All tests described in this
paragraph were done in the lab-scale installation.
Torrefied beech wood particles were tested once in the lab-scale MILENA.
The fuel behaved similarly as dry wood.
Grass was tested in the lab-scale MILENA several times at different
temperatures. At normal gasification temperatures (800 – 850°C) the bed material
(quartz sand) agglomerated. The reactor wall clearly suffered from corrosion,
probably due to the high chloride content of the used grass. Further lab-scale tests
are planned at lower gasification temperatures (650 – 700°) to prevent these
agglomeration problems.
A mixture of sewage sludge granules and clean wood was tested successfully
in the lab-scale installation. Pure sewage sludge resulted in bed agglomeration.
Lignite/wood mixtures were tested more extensive. The results are described
below.
Lignite/wood mixture:

Experiments
175
Lignite is the type of coal that has most similarities with wood. It has a high content
of volatile matter which makes it suitable for conversion in the MILENA reactor.
The global reserves of lignite coal are enormous, but the fuel has a bad reputation
because the mining of the fuel destroys local landscapes and many of the (older)
power stations firing lignite do not meet present day emission standards.
Co-gasification of wood and lignite in the MILENA for the production of
SNG can be attractive, because the production of SNG from biomass can be CO2
negative if complete CO2 sequestration is done. It was calculated that up to 35
weight percent of wood can be replaced with lignite without a net fossil CO2
emission [14].
Because of the lower volatiles content compared to wood the yield of char is
higher than the char yield for wood. This will result in excess heat production in the
combustor. To limit this heat production a mixture of wood and lignite was used
during lab-scale tests. Table 7.9 shows the fuel composition of the beech wood and
lignite used during the tests.
Table 7.9: Composition of beech wood and lignite in the tests.
Beech wood chips Lignite
C [wt. % a.r.] 45.7 55.0
H [wt. % a.r.] 5.5 3.9
O [wt. % a.r.] 38.6 25.1
N [wt. % a.r.] 0.27 0.61
S [wt. % a.r.] 0.054 0.260
Cl [wt. % a.r.] 0.045 0.013
Ash [wt. % dry] 0.9 3.8
Water [wt. % a.r.] 9.0 13.4
Volatiles [wt. dry] 82 49.2

Chapter 7
176
Table 7.10 shows the measured gas composition for beech wood and a mixture of
beech wood and lignite. The tests were done with Austrian olivine as bed material.
Table 7.10: Measured gas composition for beech wood and beech wood/lignite mixture
Percentage of lignite [wt. %] 0 55
CO [vol.% dr.] 37.2 23.3
H2 [vol.% dr.] 21.2 36.2
CO2 [vol.% dr.] 18.9 22.6
CH4 [vol.% dr.] 12.1 8.2
C2H2 [vol.% dr.] 0.4 0.2
C2H4 [vol.% dr.] 4.6 2.9
C2H6 [vol.% dr.] 0.4 0.2
C6H6 [Vppm dr.] 8290 6787
C7H8 [Vppm dr.] 1332 1009
N2 [vol.% dr.] 4.4 4.4
Class 2 tars [mg Nm-3] 4842 1674
Class 3 tars (excl. toluene) [mg Nm-3] 580 241
Class 4 tars (2 & 3 ring) [mg Nm-3] 13801 9157
Class 5 tars (4 & 5 ring) [mg Nm-3] 2666 1745
Unknown tars [mg Nm-3] 8450 3271
Total tar (excl. toluene) [mg Nm-3] 30340 16088
The gas quality improved with respect to the amount of tars, if the
wood/lignite mixture is compared to pure wood. The most relevant parameter in the
design of a commercial unit is the carbon conversion of the fuel mixture, because
this strongly influences the heat balance. If too much heat is produced, external
cooling of the MILENA combustor is required. From the tests it was observed that
the carbon conversion declines when lignite is gasified. This was to be expected
because the volatile content of lignite is lower than the volatile content of biomass.
The lab-scale tests showed that co-gasification of wood lignite mixtures is
possible. A positive surprise was the lower tar concentration. Further testing on lab

Experiments
177
and pilot-scale is required to explain the reduced tar concentration and to produce
more reliable data required for scale up of the process.
7.15 Upgrading of the gas into Bio-SNG
Research on upgrading of the MILENA producer gas into Bio-SNG is an ongoing
activity at ECN. A lot of experimental work is done on removing trace levels of
pollutants before the catalytic conversion of the gas into CH4. The experiences from
this experimental work are used to predict to final Bio-SNG gas composition.
The output of the updated MILENA model as described in paragraph 7.9 was
used to calculate the gas composition of Bio-SNG after methanation and upgrading.
The calculated overall efficiency excludes electricity consumption and electricity
production from excess heat.
The producer gas after the OLGA gas cleaning is further cleaned (complete
removal of S and Cl) and the hydrocarbons are converted at atmospheric pressure
into CH4, CO, CO2, H2 and H2O. Water is added to prevent formation of soot. CO2
and water are partially removed from the gas and the gas is compressed to typical
methanation pressures (e.g. 40 bar). Conventional methanation processes are used
to convert the gas to Bio-SNG. After water removal the gas is ready for gas grid
injection. Table 7.11 shows the calculation results.
Table 7.11: Final Bio-SNG composition
CO [vol.%] 0.0 H2 [vol.%] 1.2 CO2 [vol.%] 0.4 O2 [vol.%] 0.0 CH4 [vol.%] 93.4 N2 [vol.%] 4.6 LHV [MJ nm-3] 33.7 HHV [MJ nm-3] 37.4 Overall efficiency (LHV) basis [%] 68.3
The overall efficiency on LHV basis can be increased to over 70% by
integrating a dryer that uses low temperature waste heat from the process.
Chapter 7
178
7.16 Discussion and concluding remarks
Oxygen transport from the combustor to the riser is still not well understood. The
behavior of the MILENA gasifier when olivine is used is not predictable at the
moment. Luckily the overall effect of oxygen transport on the mass and heat
balance and the gas composition is relatively low. For the basic engineering of the
MILENA demonstration plant this uncertainty was taken into account by making
different cases: one with sand as bed material (no oxygen transport) and one with
an ‘active’ olivine.
The carbon conversion as function of temperature was determined from
experiments in the lab-scale installation and pilot plant. It must be noticed that
during some of the experiments done in the pilot plant, fuel might have leaked into
the combustor. This results in a lower calculated carbon conversion. New
experiments are scheduled to verify this.
The main aim of the MILENA development was to arrive at a reliable
biomass gasification technology that can be scaled up to over 100 MW and to
produce a gas that can be upgraded to Bio-SNG with a high overall efficiency. The
experiments done in the lab-scale installation and pilot plant have shown that the
MILENA concept is capable of doing that. The design was made is such a way that
the scale up is relatively easy and pressurized operation is possible. Experiments
have shown that the process operates as expected on woody fuels. Experimental
data were used to modify the MILENA model. The modifications were modest.
The model is usable to predict the gas composition and the heat balance for the
MILENA gasifiers operated between 770 and 880°C and atmospheric pressure
using woody fuel. The model / relations can be used for comparable biomass
fluidized bed gasifiers as well (e.g. BFB and CFB gasifiers), but experimental
verification is recommended. The updated model shows that an overall efficiency
of 68% can be achieved from wood with 25 wt.% moisture to SNG. The efficiency
can be increased by integrating a dryer that uses waste heat.
Accumulation of char results in (type II) agglomeration. Accumulation of
char can be prevented by combustion of the char as is done in the MILENA

Experiments
179
concept. Lab-scale and pilot-scale experiments have shown that agglomeration is
not an issue in the MILENA reactor when clean woody fuels are used. Several tests
with other fuels have shown that agglomeration can be an issue. Further tests are
scheduled to identify the suitable fuels and operating conditions for the MILENA
reactor.
Olivine is the standard catalytic bed material used to reduce the tar yield of
fluidized bed biomass gasifiers. It was observed that different batches of olivine
behave differently. The results in tar reduction in the MILENA are disappointing.
This is probably due to the relatively short contact times between the catalytic bed
material in the riser reactor and the producer gas compared to BFB reactors which
are normally used in combination with olivine. It was observed that catalytic
activity of olivine increased over time, but this was only observed in the lab-scale
installation using clean wood. Better pretreatment/activation (higher calcination
temperature) of the olivine will probably lead to better results. The origin of the
olivine also influences the tar concentration in the producer gas, but this was not
subject of the work described in this thesis. The behavior of olivine (and of other
catalytic bed materials) will be a topic of future research.
Because of the relatively high tar content of the MILENA producer gas
additional tar conversion or removal processes are required to make the gas suitable
for gas engine operation or Bio-SNG production. The OLGA tar removal
technology has been used successfully by ECN to remove the tars to an acceptable
level.
7.17 References
1. Devi, L., 2005. Catalytic removal of biomass tars; Olivine as prospective in-
bed catalyst for fluidized-bed biomass gasifiers. Thesis, Technical University
of Eindhoven, 140 p.

Chapter 7
180
2. Rauch, R., Bosch, K., Hofbauer, H., Swierczynski, D., Courson, C.,
Kiennemann, A., 2004. Comparison of different olivines for biomass steam
gasification.
3. Paisley, M.A., Overend, R.P., 2002. Verification of the Performance of Future
Energy Resources' SilvaGas® Biomass Gasifier -- Operating Experience in
the Vermont Gasifier. In: Pittsburg Coal Conference, 2003.
4. Feldmann, H.F.: Low inlet gas velocity high throughput biomass gasifier.
Patent WO 87/01719 issued 1987.
5. Paisley, M.A., Litt, R.D., Creamer, K.S., 0 AD. Gasification of refuse-derived
fuel in a high throughput gasification system. Energy for Biomass and Waste
Xiv, January 1990, Florida, United States.
6. Hannula, I., Kurkela, E., 2010. A semi-empirical model for pressurised air-
blown fluidised-bed gasification of biomass. Bioresource Technology 101
7. Zanzi, R., Sjöström, K., Björnborn, E., 1992. Properties of wood char (Ed. D.
O. Hall).
8. Maniatis, K., Vassilatos, V., Kyritsis, S., 1994. Design of a pilot plant
fluidized bed gasifier. Advances in thermochemical biomass conversion 1
9. Neeft, J.P.A., van Paasen, S.V.B., Knoef, H., Buffinga, G.J., Zielke, U.,
Sjostrom, K., et al., 2002. Tar Guideline. A Standard Method For
Measurement Of Tars and Particles In Biomass Producer Gases. In: 12th
European Conference on Biomass for Energy, Industry and Climate
Protection, 17-21 June 2002, Amsterdam, The Netherlands.
10. van Paasen, S.V.B., Bergman, P.C.A., Neeft, J.P.A., Kiel, J.H.A., 2002.
Primary measures for tar reduction. In: 12th European Conference on Biomass
for Energy, Industry and Climate Protection, 17-21 June 2002, Amsterdam,
The Netherlands.
11. Herdin, G., 2007. Impact of NH3 in Biogases on the NOx emissions of gas
engines. In: ASME Internal Combustion Engine Spring Technical Conference,
March 13-16, 2007, Pueblo, Colorado, USA.

Experiments
181
12. Swierczynski, D., Courson, C., Bedel, L., Kiennemann, A., Vilminot, S.,
2006. Oxidation Reduction Behavior of Iron-Bearing Olivines (FexMg1-
x)2SiO4 Used as Catalysts for Biomass Gasification. Chem. Mater. 18
13. Pecho, J., Sturzenegger, M., 1999. Elucidation of the function of olivin in
biomass gasification.
14. Vreugdenhil, B.J., van der Drift, A., van der Meijden, C.M., 2009. Co
Gasification of biomass and lignite in the indirect gasifier Milena. In:
Pittsburgh Coal Conference, Pittsburgh, USA, 20-23 september 2009.

Chapter 7
182
Chapter 8
8 Conclusions and outlook
8.1 Conclusions
Tests in the lab-scale and pilot-scale MILENA gasifiers have shown that the
MILENA technology is suitable for conversion of woody biomass into a
combustible gas with high efficiency. The residual ash is virtually carbon free (< 1
wt.% C), which means that the loss in heating value of the residues including the
ash is close to zero. The yield of hydrocarbons (CH4, C2H4 and C6H6) is relatively
high, which has a positive effect on overall efficiency if the gas is used for power
generation or production of Bio-SNG. The CH4 concentration in the producer gas is
higher than the target concentration of 12 vol.% when steam is used as gasification
agent in the riser.
Measurements have shown that the gas exchange between combustor and
riser gasifier can be below 1%, limiting the N2 content in the producer gas to 1 – 3
vol%.
The Cold Gas Efficiency (CGE) on LHV basis, defined as the energy content
of the cleaned gas (free of tars) divided by the energy content of the biomass
entering the gasifier varies between 79% for clean wood with 25 wt.% moisture
and 82% for wood with 10wt.% moisture. A further increase in cold gas efficiency
is possible by integrating a biomass dryer, recycling tar to the gasification reactor,

Chapter 8
184
instead of the combustion reactor, or an increase in combustion air pre-heat
temperature.
The scale up from the 30 kWth lab-scale to the 800 kWth pilot-scale
installation was without major problems for the process related issues. The gas
composition and heat balance were up to the expectations. All major problems were
related to mechanical failures. Solving the problems related with thermal stresses
took most of the time. They are still topic of an ongoing optimization program.
Fuel and bottom ash handling is the other major challenge.
In several duration tests clean wood was used as fuel and quartz sand or
olivine as bed material. Agglomeration of the bed material was not observed to be a
problem. Demolition wood contains several pollutants which can cause bed
agglomeration, but the first 50 hours of tests, using a relatively poor quality of
demolition wood with a lot of plywood, particle board and glass pieces, showed
that bed agglomeration can be prevented. A longer duration tests (1000 hours) is
scheduled for the end of 2010 to prove that the MILENA gasifier can run for a
prolonged period using a relatively difficult fuel (demolition wood B).
The tar content of the MILENA producer gas is relatively high (20 – 40
gram nm-3 dry). The use of a catalytically active bed material like olivine has only a
modest effect on the tar concentration. This is probably due to the relatively short
contact time between the gas and the catalyst compared to Bubbling Fluidized Bed
reactors and the low steam to biomass ratio. The origin of the olivine also
influences the tar concentration in the producer gas, but this was not subject of the
work described in this thesis and requires more research. Tar removal technology
like the OLGA is required to clean the gas before it can be used in gas engines or
upgraded into Bio-SNG.
During tests with olivine as bed material, transport of oxygen from the
combustor to the gasifier was observed. This is caused by oxidation and reduction
of the iron in the olivine (chemical looping). The amount of oxygen transported
varied strongly. More research is required to determine what parameters influence
the transport of oxygen.
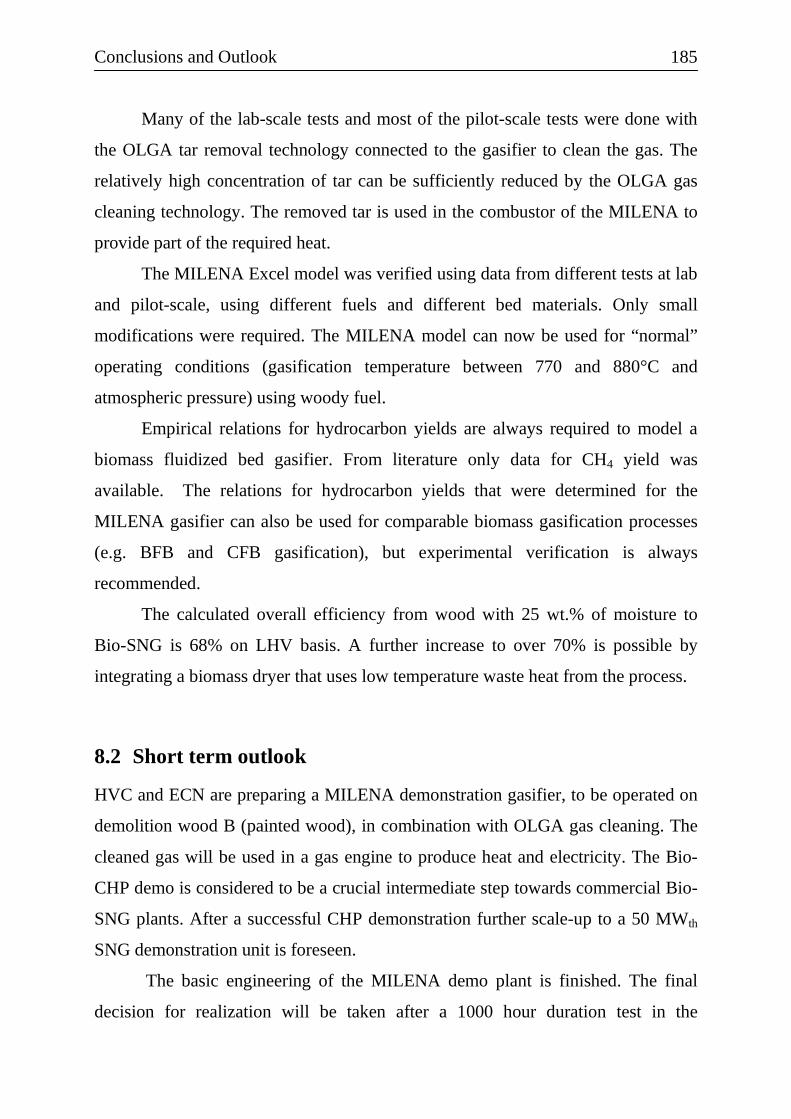
Conclusions and Outlook
185
Many of the lab-scale tests and most of the pilot-scale tests were done with
the OLGA tar removal technology connected to the gasifier to clean the gas. The
relatively high concentration of tar can be sufficiently reduced by the OLGA gas
cleaning technology. The removed tar is used in the combustor of the MILENA to
provide part of the required heat.
The MILENA Excel model was verified using data from different tests at lab
and pilot-scale, using different fuels and different bed materials. Only small
modifications were required. The MILENA model can now be used for “normal”
operating conditions (gasification temperature between 770 and 880°C and
atmospheric pressure) using woody fuel.
Empirical relations for hydrocarbon yields are always required to model a
biomass fluidized bed gasifier. From literature only data for CH4 yield was
available. The relations for hydrocarbon yields that were determined for the
MILENA gasifier can also be used for comparable biomass gasification processes
(e.g. BFB and CFB gasification), but experimental verification is always
recommended.
The calculated overall efficiency from wood with 25 wt.% of moisture to
Bio-SNG is 68% on LHV basis. A further increase to over 70% is possible by
integrating a biomass dryer that uses low temperature waste heat from the process.
8.2 Short term outlook
HVC and ECN are preparing a MILENA demonstration gasifier, to be operated on
demolition wood B (painted wood), in combination with OLGA gas cleaning. The
cleaned gas will be used in a gas engine to produce heat and electricity. The Bio-
CHP demo is considered to be a crucial intermediate step towards commercial Bio-
SNG plants. After a successful CHP demonstration further scale-up to a 50 MWth
SNG demonstration unit is foreseen.
The basic engineering of the MILENA demo plant is finished. The final
decision for realization will be taken after a 1000 hour duration test in the

Chapter 8
186
MILENA and OLGA pilot-scale installation at ECN, using demolition wood as a
fuel. The demo plant will be built in Alkmaar next to the waste incinerator and the
biomass combustion plant of the HVC group.
Several suppliers of major parts of the MILENA gasifier were consulted to
make an accurate cost estimate for a commercial scale MILENA reactor. This cost
estimate has shown that a Bio-CHP configuration based on the MILENA
technology is economically viable if the Dutch subsidy on sustainable electricity
(SDE) is available for this demonstration plant. The MILENA demonstration was
designed for a net electrical output of approximately 3 – 3.5 MWe. Residual heat
will be used in the local heat grid. The demonstration plant is not optimized to
electrical efficiency, because residual heat can be used.
Special attention was given to the steel insert which separates the
gasification and combustion zone. The steel insert is exposed to high temperatures
(approximately 900°C) under oxidizing and reducing conditions. A thermo-
mechanical analysis was made using finite element software to check whether the
structure could support the mechanical stresses for a prolonged period of time.
Several suppliers were consulted. Different commercial materials were offered that
are expected to be enough corrosion resistant under the operating conditions. Now
the expected lifetime of the insert is more than a year. The mechanical design is
made such that replacement of the insert is easy. One of the aims of the
demonstration project is to test what lifetime can be achieved.
Figure 8-1 shows the integrated demo-plant with the fuel bunkers, MILENA
gasifier, OLGA gas cleaning, start-up flare, gas engines and containers to test the
upgrading of the gas into Bio-SNG.
Conclusions and Outlook
187
Figure 8-1: MILENA demo plant
After a successful demonstration period the MILENA Bio-CHP technology
will be ready for commercial application. The next phase will be a commercial
scale (50 MWth) MILENA Bio-SNG demonstration.
8.3 Long term outlook
At the moment large scale biomass combustion plants (> 20 MWe) have the highest
efficiency to electricity (approximately 30%), but in practice use of the residual
heat is difficult, because of the large scale. Small scale combustion plants have a
higher overall efficiency (electrical + thermal), because their capacity is normally
based on the local heat demand. Electrical efficiencies for small scale (<5 MWe)
biomass boilers are in general low with typical electrical efficiency between 10 and
25% on LHV basis.
Gasification offers the option to use gas engines for Combined Heat and
Power production (CHP). The advantage of a gas engine is the high electrical
efficiency, even at a small scale (< 5 MWe). Power production is normally the
economical driver for a Bio-CHP installation, so a high electrical efficiency is
beneficial.

Chapter 8
188
The electrical efficiency of Bio-CHP’s using gasification technology can
vary significantly. The efficiency is strongly influenced by the type of biomass,
water content of the biomass, scale of the installation, type of gasifier, type of gas
engine, level of integration and emission limits. Figure 8-2 shows the calculated net
electrical efficiencies for MILENA based Bio-CHP’s. The fuel is demolition wood
with 20% moisture. The scale is based on the selection of two 2 MWe gas engines
Residual heat is used for district heating.
20
30
40
50
60
70
80
GE GE + ORC GE + ORC + Dryer
Effi
cien
cy L
HV
bas
is [%
]
Thermal EfficiencyElectrical Efficiency
Figure 8-2: Calculated efficiencies of MILENA Bio-CHP configurations
The left column shows the efficiency assuming the producer gas is fired in a
gas engine (GE). Adding an Organic Rankine Cycle (ORC) increases the electrical
efficiency significantly. A further increase can be achieved by integrating a
biomass dryer. The right column shows the calculated efficiencies assuming wood
with 40% moisture is dried to 20%. The MILENA gas engine (+ORC)
combinations offers a significantly higher efficiency than combustion based
processes at a typical scale of 3 – 10 MWe. For large scale applications a gas

Conclusions and Outlook
189
turbine in combination with a steam cycle needs to replace the gas engines, to
further increase overall efficiency and reduce specific investment costs.
The production of Bio-SNG from woody biomass is the major driver for the
development of the MILENA technology at ECN. The comparison of different
biomass gasifiers in chapter 4 has shown the overall efficiency from wood to Bio-
SNG will be significantly higher if an Indirect gasifier like the MILENA gasifier is
used. The net overall efficiencies on LHV basis, including electricity consumption
and pretreatment but excluding transport of biomass are 54% for Entrained Flow,
58% for CFB and 67% for Indirect gasification. Efficiency can be further increased
by integration of a biomass dryer using waste heat from the process and by
increasing the operating pressure of the gasifier.
Pressurized gasification can reduce or prevent energy consumption by a
producer gas compressor. The investment cost of a large installation can also be
reduced by pressurization because equipment will be smaller. A possible side
effect is an increased yield of methane/other hydrocarbons at elevated pressure.
Tests are required to verify this.
ECN plans to extend its work on MILENA pressurized gasification. The
reactor concept is designed in such way that pressurization to a pressure between 3
and 7 bar is relatively simple, because the process takes place in one vessel.
The general interest is Bio-SNG is increasing. Several large utility
companies are studying the option to produce Bio-SNG from woody biomass. A 20
MW th demonstration using the FICFB gasification technology is prepared in
Goteborg. The HVC ECN consortium plans to demonstrate a 50 MWth SNG plant
based on the MILENA gasification technology in 2015. Experimental work will
focus on testing the required catalysts as well as final gas conditioning steps that
are required for upgrading the gas into Bio-SNG.

9 Dankwoord (Dutch)
Vanaf deze plek wil ik iedereen bedanken die heeft bijgedragen aan de
ontwikkeling van de MILENA vergasser en de realisatie van dit boekje.
Bijzondere dank gaat uit naar mijn promotor, Hubert Veringa, voor zijn
ongelooflijke snelle correcties van mijn teksten en mijn co-promotor Luc Rabou.
De ontwikkeling van de MILENA vergasser is een lang proces geweest waar
bijzonder veel collega’s bij betrokken waren. Mijn dank gaat uit naar Bram,
Berend, Robin en Luc voor de ondersteuning bij het onderzoeksprogramma en het
aangeven van de juiste richting als ik de verkeerde kant dreigde op te gaan.
De realisatie van de lab-schaal en pilot-schaal MILENA installaties is
mogelijk geworden door de inzet van de Engineeringafdeling van ECN, met
bijzondere bijdragen van Frans, Ronald, Marcel, Nicolas, Ruud en Marco.
Hiervoor mijn dank.
Geen biomassa proefinstallatie komt in bedrijf zonder de inzet van een team
gedreven technici die alle ontwerpfouten van de ‘uitvinder’ weer mogen corrigeren.
Voor al deze correcties, het meedenken bij het oplossen van problemen en alle
nachtdiensten wil ik Jan, Marco, Herman, Dennis, Edwin, Johan, Ruud, Lucas en
Stefan bedanken.
ECN, HVC en Agentschap NL wil ik bedanken voor de financiering van de
MILENA ontwikkeling.
Ten slotte wil ik Ursela, Jeroen en Marcel bedanken voor de het accepteren
dat ik even wat minder tijd voor ze had en mijn ouders voor het veelvuldig spelen
voor oppas. Voor iedereen die zijn naam hier mist: ik ben je misschien vergeten,
maar toch bedankt voor alles!
Op naar de volgende MILENA!

10 Curriculum Vitae
Christiaan van der Meijden was born on November 21st, 1969 in Den Helder, The
Netherlands. In the beginning of 1994 he finished his study Mechanical
Engineering (BSc) at the Polytechnic of Alkmaar.
After his study he worked for two years as a commissioning and testing
engineer for Stork Boilers in Hengelo.
From 1996 to 1999 Christiaan worked for the ECN Biomass Operator group
as assistant group leader and from 2000 to 2004 as group leader. He was directly
involved in the development of biomass gasification (Circulating Fluidized Bed)
and gas cleaning equipment. The experiences gained with operating and modifying
the pilot-scale gasification facilities resulted in the first (patented) designs for an
allothermal gasification concept with an integrated tar reduction zone in 1998 (the
STAR reactor). This concept was later adapted to the present MILENA design.
In 2004 he became a project leader in the group SNG and Syngas and
became responsible for the development of the new MILENA biomass gasification
technology. This has led to the realization of a lab-scale MILENA gasifier in 2004
and an 800 kWth pilot plant in 2008.
At present Christiaan is the project leader of the experimental program in the
MILENA pilot gasifier and is responsible for the engineering of the 10 MWth
MILENA demonstration plant.

11 List of publications
Journal papers
van der Meijden, C. M., Veringa, H. J., Rabou, L. P. L., 2009. The production of
synthetic natural gas (SNG): A comparison of three wood gasification systems for
energy balance and overall efficiency. Biomass and Bioenergy 34, Available from:
http://dx.doi.org/10.1016/j.biombioe.2009.11.001 .
van der Meijden, C. M., Veringa, H. J., Vreugdenhil, B. J., van der Drift, A., 2009.
Bioenergy II: Scale-up of the Milena biomass gasification process. International
Journal of Chemical Reactor Engineering 7, A53
Related publications
van der Meijden, C. M., Neeft, J. P. A., and van der Ploeg, F. B., 2001. Roterende
Deeltjes Scheider (RDS) voor reiniging van biomassa stookgassen. ECN, ECN-C--
01-118. Available from:
http://www.wtb.tue.nl/woc/ptc/rps/downloads/NL/Meijden2001.pdf.
van der Meijden, C. M., Rabou, L. P. L. M., Brenneisen, L. M., and Wubbe, R., 1-
5-2002. GASREIP, GASREIniging en Prime mover design, fase B. ECN, The
Netherlands, ECN-CX--02-041.
van der Meijden, C. M., Olivier, Q., Hanse, J., de Graaf, M., Bos, A., and Visser,
H. J. M., 2003. Wervelbedverbranding van diermeel ten behoeve van
energieopwekking. ECN, The Netherlands, ECN-C--03-011. Available from:
www.ecn.nl/docs/library/report/2003/c03011.pdf.

List of publications
193
van der Meijden, C. M., van der Drift, A., Vreugdenhil, B. J., 2007. Experimental
results from the allothermal biomass gasifier Milena. 15th European Biomass
Conference, 7-11 May 2007, Berlin, Germany.
van der Meijden, C. M., Veringa, H. J., van der Drift, A., Vreugdenhil, B. J., 2008.
The 800 KWth Allothermal Biomass Gasifier MILENA. 16th European Biomass
Conference, 2-6 June 2008, Valencia, Spain.
van der Meijden, C. M., Veringa, H. J., Vreugdenhil, B. J., van der Drift, A., Zwart,
R. W. R., Rabou, L. P. L. M., 2008. Production of Bio-Methane by gasification.
NGV 2008, Rio de Janeiro, Brazil.
van der Meijden, C. M., Veringa, H. J., Vreugdenhil, B. J., van der Drift, A., Zwart,
R. W. R., 2008. Production of Bio-CNG by gasification. Pittsburgh Coal
Conference 2008.
Vreugdenhil, B. J., van der Drift, A., van der Meijden, C. M., 2009. Co
Gasification of biomass and lignite in the indirect gasifier Milena. Pittsburgh Coal
Conference, Pittsburgh, USA, 20-23 september 2009.
van der Meijden, C. M., Veringa, H. J., Bergman, P. C. A, van der Drift, A.,
Vreugdenhil, B. J., 2009. Scale-up of the MILENA biomass gasification technology.
17th European Biomass Conference, 29 June - 3 July 2009, Hamburg, Germany.
van der Meijden, C. M., Bergman, P. C. A, van der Drift, A., Vreugdenhil, B. J.,
2010. Preparation for a 10 MWth Bio-CHP demonstration based on the MILENA
gasification technology. 18th European Biomass Conference, 3 - 7 May 2010, Lyon,
France

List of publications
194
Patents
van der Drift, A.; van der Meijden, C. M. (2002) METHOD AND DEVICE FOR
GASIFYING BIOMASS, patent number WO0233030.
van der Meijden, C. M.; van der Drift, A. (2007) DEVICE FOR PRODUCING A
PRODUCT GAS FROM BIOMASS, patent number WO2007061301.
van der Meijden, C. M.; van der Drift, A.; van Paasen, S. B. V. & Carbo, M. C.
(2007) Biogas purification apparatus, contains bed comprising carbon particles and
base particles of a material other than carbon, patent number NL1030189C.
van der Meijden, C. M.; van der Drift, A. (2007) Inrichting voor het vervaardigen
van een productgas uit biomassa, patent number NL20051029979.
van der Meijden, C. M.; Rabou, L.P.L.M.. (2009) Werkwijze en systeem voor het
vervaardigen van een brandbaar gas uit een brandstof, application number
NL2002756.
van der Meijden, C.M., Batenburg, R. (2009), Gaskoeler, application number
NL2003917.