DEVELOPMENT OF AN ENERGY MODEL IN SYSTEM MODELING …
161
DEVELOPMENT OF AN ENERGY MODEL IN SYSTEM MODELING LANGUAGE FOR FUTURE AUTOMATED RESIDENTIAL BUILDING APPLICATIONS By MUTONDO PAUL MATENDA Thesis submitted in fulfilment of the requirements for the degree Master of Technology: Electrical Engineering in the Faculty of Engineering at the Cape Peninsula University of Technology Supervisor: Dr W. Fritz Co-supervisor: Dr A. Raji Bellville November 2014 CPUT copyright information The dissertation/thesis may not be published either in part (in scholarly, scientific or technical journals), or as a whole (as a monograph), unless permission has been obtained from the University.
Transcript of DEVELOPMENT OF AN ENERGY MODEL IN SYSTEM MODELING …

DEVELOPMENT OF AN ENERGY MODEL IN SYSTEM MODELING LANGUAGE FOR FUTURE AUTOMATED RESIDENTIAL BUILDING APPLICATIONS By MUTONDO PAUL MATENDA Thesis submitted in fulfilment of the requirements for the degree Master of Technology: Electrical Engineering in the Faculty of Engineering at the Cape Peninsula University of Technology Supervisor: Dr W. Fritz Co-supervisor: Dr A. Raji Bellville November 2014
CPUT copyright information The dissertation/thesis may not be published either in part (in scholarly, scientific or technical journals), or as a whole (as a monograph), unless permission has been obtained from the University.

ii
DECLARATION
I, Mutondo Paul Matenda, declare that the contents of this dissertation/thesis represent my own unaided work, and that the dissertation/thesis has not previously been submitted for academic examination towards any qualification. Furthermore, it represents my own opinions and not necessarily those of the Cape Peninsula University of Technology.
Signed Date

iii
ABSTRACT
Today the building energy modeling industry is facing a number of challenges, the advanced
programs or methods developed for building energy modeling, are very technical and
complex to be used, especially for earlier designs, and the easy programs or methods are
not accurate. Moreover, more than a hundred programs developed for energy modeling,
have been used in the same building, but most of the time the results differed by about 30%.
That is why this thesis has developed a new building energy model in System Modeling
Language (SysML), in order to meet, at the same time, the accuracy and the simplicity to be
used for future and existing buildings. In this thesis, SysML has been used to develop an
energy model and to set up an automation system to the existing building. SysML can do
more than simulations, but this thesis is limited to only the simulations steps by using easy
applications of SysML and fewer diagrams which could develop in a complete building
energy model. SysML is the extension of Unified modeling Language (UML), which uses
fewer diagrams than UML. SysML is simple, open and more flexible to be used in any
Engineering System. The previous chapter describes SysML and gives the overview and the
platform of SysML.
The simulations of SysML in this project have been developed through Enterprise Architect
and Mat lab software. The inputs used to simulate the program are the parameters of the
existing building chosen for modeling that is a student residential building complex located in
Stellenbosch, Western Cape in South Africa. Automation system program used in this thesis
was based on the norms and building standards of South Africa, renewable energy and the
requirements of the buildings’ occupants, in order to meet energy efficiency and safety of the
occupants. Concerning automation system, this thesis have described the main components
in the previous chapters, and enumerated some most widely used standards bus. In the
modelling phase, only the states of automation system have been described through
SysMLs’ activities diagrams without calibrating automation systems’ components.
In the complex residential building, lighting and HVACs systems are the large consumers of
electrical energy. That is why this thesis brought more light on these systems by enumerating
them and giving their strengths and weaknesses, in order to allow architects and building
engineers to make adequate selections of lighting and HVAC systems. Regarding HVAC
system, this thesis did not size and select the HVAC system equipment, the thesis has
determined only the peak loads, and described the daily, monthly and yearly behaviour of the
loads. The methods used in this thesis to develop the energy model for cooling and heating
loads is Cooling Load Different Temperature (CLTD) method, because this method is simple,
well known, common and widely used.

iv
The aim of this thesis was to predict the loads of the building without automation system, and
the same building with automation and solar hot water system, in order to compare them and
to get an accurate and useful conclusion.
The objective of this thesis is to develop an easy energy model program in System Modeling
language, which can be used for building energy model, and to set up an automation system
and solar hot water system to the existing building to optimize energy consumption and
energy management, in order to meet energy efficiency. This thesis did not complete the
cost-pay back analysis and the investment cost of the automation system and solar hot water
system.

v
ACKNOWLEDGEMENTS
I wish to thank:
My Lord for giving me the strength, and assiduity to achieve my target. My parents Mutondo Nsase and Kitenge Leontine for so many sacrifices and efforts
made throughout my childhood and my studies. My darling Katanga Nathalie for sharing with me the big challenges of life. My sons Narcisse Mwimbi and Ryan Lusanga who have agreed to sympathise with
me as loyal sons. My family for their support and encouragement especially Alain Mutondo, Sylvie
Mutondo and Fiston Mutondo My supervisor and co-supervisor Dr Wilfred Fritz and Dr Atanda Raji for their
guidance and teaching me throughout this project with patience and understanding. My fellow students for great office in which to talk and share ideas and
encouragements: Doudou Luta, , Martial Giraneza, Papy Lukasha, Akim My friends Attie, Brenda, Lemmer, Alitta and Belly Mr Mutombo Kilaketa, Mr Marc Mbayo for their support and encouragements
If you have received funding from the NRF, include the following: The financial assistance of the National Research Foundation towards this research is acknowledged. Opinions expressed in this thesis and the conclusions arrived at, are those of the author, and are not necessarily to be attributed to the National Research Foundation.

vi
DEDICATION
This thesis is dedicated to my Lord, to Narcisse Mwimbi and Ryan Lusanga

vii
TABLE OF CONTENTS DECLARATION ........................................................................................................................................ ii ABSTRACT ............................................................................................................................................. iii ACKNOWLEDGEMENTS ........................................................................................................................ v DEDICATION .......................................................................................................................................... vi TABLE OF CONTENTS ......................................................................................................................... vii LIST OF FIGURES .................................................................................................................................. ix LIST OF TABLES ................................................................................................................................... xii APPENDICES ........................................................................................................................................ xii
Appendix A: SysML diagram developed for building energy modelling ............................................. xii Appendix B: Roadmap of System Modeling Language. ..................................................................... xii
GLOSSARY ........................................................................................................................................... xiii CHAPTER ONE........................................................................................................................................1 GENERALITY ...........................................................................................................................................1
1.1 Introduction ...................................................................................................................................1 1.2 Statement of the problem ............................................................................................................1 1.3 Hypotheses ................................................................................................................................2 1.4 Research aim and objective .......................................................................................................2 1.5 Delimitation ...............................................................................................................................3 1.6 Significance of the research .......................................................................................................3
CHAPTER TWO .......................................................................................................................................4 LITERATURE REVIEW ............................................................................................................................4
2.1 Introduction ..................................................................................................................................4 2.2 Electrical energy ........................................................................................................................4
2.2.1 Definition of electrical energy .................................................................................................4 2.2.2 Main cause of electrical energy consumption in the residential building ...............................4
2.3 Lighting system .........................................................................................................................5 2.3.1 Different kind of electrical lamps ............................................................................................6 2.3.2 Light measurement system ....................................................................................................9 2.3.3 Tubular day lighting ............................................................................................................. 12
2.4 Heating ventilation and air condition System (HVAC system) ................................................ 13 2.4.1 Definition of Air conditioning .............................................................................................. 13 2.4.2 Aims of Air conditioning....................................................................................................... 13 2.4.3 HVAC Principle of functioning ............................................................................................. 13 2.4.4 Type of HVACs ................................................................................................................... 14 2.4.5 Heat pump .......................................................................................................................... 22 2.4.6 Solar air conditioner .............................................................................................................. 32
2.5 Building automation system ................................................................................................... 34 2.5.1 Introduction ........................................................................................................................ 34 2.5.2 Definition of building Automation ....................................................................................... 34 2.5.3 Utilities ................................................................................................................................. 34 2.5.4 Structure of building automation and control network ......................................................... 35 2.5.5 Energy management functions ........................................................................................... 36 2.5.6 Main components and devices of building automation system .......................................... 38 2.5.7 Standardized bus systems and Networks in building automation systems ........................ 39
CHAPTER THREE ................................................................................................................................ 45 BUILDING ENERGY MODELING AND SYSTEM MODELING LANGUAGE ....................................... 45
3.1 Models and simulations .......................................................................................................... 45 3.2 System Modelling Language (SysML) .................................................................................... 45
3.2.1 Definition of system modeling language ............................................................................. 45 3.2.2 System Modeling Language diagrams.................................................................................. 46 3.2.3 Advantages of system modeling language ......................................................................... 52
3.3 Building Energy modelling software ....................................................................................... 53 3.3.1 Department Of Energy 2 (DOE2) .......................................................................................... 55 3.3.2 The transient systems simulation (TRNSYS) ..................................................................... 55 3.3.3 Energy Plus ......................................................................................................................... 55 3.3.4 SUNREL .............................................................................................................................. 56 3.3.5 HOT 2000 ............................................................................................................................ 56
CHAPTER FOUR .................................................................................................................................. 58 BUILDING INFORMATION ................................................................................................................... 58
4.1 Building location ..................................................................................................................... 58 4.2 Overview on the building’s South Africa norms and codes .................................................... 58
4.2.1 Building envelope and South Africa norms ........................................................................ 60

viii
4.2.2 Climate and weather data ................................................................................................... 62 4.3 Building presentation ................................................................................................................ 63 4.4 Building systems structure ..................................................................................................... 66
4.4.1 Building energy End Uses and structure of automation system in the building ................. 66 4.4.2 Electrical plugs loads ......................................................................................................... 69
CHAPTER FIVE .................................................................................................................................... 71 BUILDING ENERGY MODELING AND SIMULATIONS ....................................................................... 71
5.1 Building and systems structure ............................................................................................... 71 5.1.1 Residential building End Uses ........................................................................................... 80
5.2 Behaviour of Building’s system ............................................................................................... 94 5.3 Heating and cooling loads calculation and simulations ....................................................... 101
5.3.1 Cooling loads ................................................................................................................... 101 5.3.2 Heating load ..................................................................................................................... 120
5.4 Lighting system load simulations ......................................................................................... 127 5.6 Building loads, automated building versus no-automated building ...................................... 134
CHAPTER SIX..................................................................................................................................... 139 CONCLUSION AND DISCUSSION .................................................................................................... 139
6.1 Introduction ............................................................................................................................ 139 6.2 Aims and objectives .............................................................................................................. 139 6.3 Discussion ............................................................................................................................. 140
REFFERENCES .................................................................................................................................. 141 APPENDICES ..................................................................................................................................... 143
APPENDIX A: SysML diagrams developed for building energy modeling ...................................... 143 APPENDIX B: Roadmap of System Modeling Language ................................................................ 145

ix
LIST OF FIGURES
Figure 2.1: Construction of a compact Fluorescent Lamp
Figure 2.2: Fluorescent Lamp Circular and U shaped Lamp.
Figure 2.3: The Standard Fluorescent Lamp.
Figure 2.4: Efficiency of Light sources lumen/watt excluding ballast Lasses.
Figure 2.5: Self Contained wall unit
Figure 2.6: Overview of Variable Air Volume System.
Figure 2.7: Overview of the reversibility of the refrigeration system, heating and
cooling
Figure 2.8: Schematic of a Flooded Type and shell-and tube evaporator.
Figure 2.9: The Hierarchy structure in the building automatic.
Figure 2.10: A Ventilation system displayed on a Control Computer deponent
Figure 2.11: Optimum start/stop
Figure 2.12: Limit Peak Lead.
Figure 2.13: Horizontal and vertical Communications in building automation model
Figure 2.14: Building Control with KNX integrated system, Lower Cabling cost
Figure 2.15: Full mesh Topology on left side and Partial mesh topology on right
side
Figure 2.16: Star Topology.
Figure 2.17: Tree Topology.
Figure 3.1: System ML and UML relationship.
Figure 3.2: System Modeling Language diagrams.
Figure 3.3: Types Property-alternative representation.
Figure 3.4: Partial meta-model for the Internal Block Diagram.
Figure 3.5: Partial meta-model of the Package Diagram.
Figure 3.6: Partial meta-model of the parametric diagram.
Figure 3.7: Partial meta-model of the state Machine Diagram
Figure 3.8: Partial meta-model of the activity diagram.
Figure 3.9: Partial meta-model and Graphical representation of aliments Use Case
Diagram
Figure 4.1 Climatic zone of South Africa
Figure 4.2 Building energy End Uses for residential building
Figure 4.3 Structure of automation system in the residential building
Figure 5.1: Block definition Diagram for the overall residential building.
Figure 5.2: Requirement diagram for residential in South-Africa that describes
the structures of building requirements.

x
Figure 5.3: Requirements diagram for building structures that definition the main
requirement of energy efficiency.
Figure 5.4: Domain Model for residential building
Figure 5.5: Block Definition Diagram for building structure.
Figure 5.6: Block Definition Diagram of Energy and Use in residential building.
Figure 5.7: Internal Block Diagram of Energy and Use.
Figure 5.8: Requirements diagram of automation system.
Figure 5.9: Blocks Definition Diagram of automation system structure.
Figure 5.10: Internal Block Diagram of automation system and connectors
describes the flow of items in the system.
Figure 5.11: Requirement diagram of lighting system that describes main
requirement perform lighting System.
Figure 5.12: Block Definition Diagram of lighting system that describes the main
elements of lighting system.
Figure 5.13: Block Definition Diagram describing main parts of hot water system
Figure 5.14: Requirement Diagram of that water system that describe the main
requirements to hot water system.
Figure 5.15: Internal Block Diagram of that water system describing energy and
mothers flow .
Figure 5.16: Requirement Diagram of HVAC system, enumerating main
requirements to which HVAC shall comply.
Figure 5.18 Block definition diagram of HVAC system that describes the main
components of HVAC system.
Figure 5.19: Internal Block Diagram of HVAC system that depicts the structure
of HVAC system and Items flow.
Figure 5.20 Activity diagram of energy and items flow into the building with
Connectors describing items and matter flow.
Figure 5.21 Activity diagram of hot water system working according to
automation system.
Figure 5.22 Activity diagram of that water system working according to
automation system.
Figure 5.23 Activity of automation system describing the automation’ s program
Based on the main requirements energy efficiency.
Figure 5.24 Different steps to right-size and sleet HVA C system.
Figure 5.25 BDD diagram that describes total coding load.
Figure 5.26 Block Definition diagram total external coding load a solar heat gain.
Figure 5.27 Internal Block Definition expresses heat flow to the conditioned
spaces that farm coding load.

xi
Figure 5.28 Block Definition Diagram of internal coding load.
Figure 5.29 Block Definition Diagram showing constraint blocks for internal coding
load.
Figure 5.30 Block Definition Diagram showing constraints
Figure 5.31 Parametric model for simulating total cooling loads for the building.
Figure 5.32 Solar heat gains through fenestration or windows cooling
simulation.
Figure 5.33 Solar heat gains through external walls daily cooling load of
external walls.
Figure 5.34 Total external cooling loads that is the sum of heat gains through
roof, floor and total gains through external walls and fenestration.
Figure 5.35 Peak total daily coding load of the building simulation’ s result.
Figure 5.36 Block Definition Diagram of total peak heating load.
Figure 5.37 Block Definition Diagram of total head losses through external walls and
doors.
Figure 5.38 Total heat losses through windows.
Figure 5.39 Internal Block Definition describing heat losses through the building
envelope.
Figure 5.40 Total daily heating load during the sunny day in winter season.
Figure 5.41 Total daily heating load in June and July.
Figure 5.42 BDD describing constraint blocks of lighting system.
Figure 5.43 Daily loads of outdoor lights connected to the day light detectors.
Figure 5.44 Daily loads of outdoor lights for no-automated building using
incandescent lamps.
Figure 5.45 Daily loads of indoor lights for automated building using CFLS
lamps.
Figure 5.46 Daily total loads for indoor and outdoor lights non-automated
building.
Figure 5.47 Total daily lighting system loads of automated building.
Figure 5.48 Describing constraint blocks of hot water system.
Figure 5.49 Daily loads of no-automated building in winter season.
Figure 5.50 Daily loads of automated building in the weekend day of winter.
Figure 5.51 Daily load of automated building in the weekdays of winter season.
Figure 5.52 Daily load of no-automated building in summer season.
Figure 5.53 Daily load of automated building in summer.
Figure 5.54 Yearly energy consumption of no-automated building
Figure 5.55 Yearly energy consumption of automated building.

xii
LIST OF TABLES Table 4.1 Minimum Total R-Value of roof assemblies
Table 4.2 Metal sheeting roof assemblies
Table 4.3 Worse-case Whale Gazing Aliment preferment
Table 4.4 Location of South Africa big towns and provinces in such zone
Table 4.5 Building information
Table 4.6 Building size and form
Table 4.7 Overview of yearly average energy consumption by daily appliances in the
residential building
Table 5.1 Series of Data base used as input in the figure 5.31 for cooling load
simulations
Table 5.2 Description of lighting systems’ characteristics, and the ratio of working per
hour to no automated building
Table 5.3 Describes lighting system characteristics, and ratio of operating to
automated building using compact fluorescent lamps
Table 5.4 Daily and monthly energy consumptions of automated building versus no-
automated building
APPENDICES Appendix A: SysML diagram developed for building energy modelling Appendix B: Roadmap of System Modeling Language.

xiii
GLOSSARY Terms/Acronyms/Abbreviations Definition/Explanation AC
AS
ASHREA
ARCNET
AvYEC
BACNET
BDD
BL
BLAST
Bld
CFC
CFL
CLF
CLTD
CENELEC
DC
DDC
DOP
DME
DOE
DPW
DX
EF
ETC
FPC
GBCSA
GHG
GLS
GWP
HCFC
HVAC
Alternating current
Automation System
American Society of Refrigeration and Air Conditioning
Engineering
Attached Resource Computer Network
Average Yearly energy Consumed by each appliance
Building automation and control network
Block Definition Diagram
Back line
Building Load Analysis and System Thermodynamic
Building
Chlorofluorocarbon
Compact Fluorescent Lamp
Cooling Load Factor
Cooling Load Temperature Difference
European Comity of Electro technique Normalisation
Direct Current
Direct Digital Control
Daily Operating Period
Department of Mineral and Energy
Department of Energy
Department of Power and Water
Direct Expansion
Energy Efficiency
Evacuated Tube Collector
Flat Plat Collector
Green Building Council of South Africa
Green House Gas
General Light Service
Global Warming Potential
Hydro-chlorofluorocarbon
Heating Ventilation and Air Conditioning

xiv
HWS
IBD
IBM
IEC
IEEE
INCOSE
ISO/IEC
IPCC
KNX
KNXPL
KNXRF
KNXTP
LAN
LED
LON
LTMS
MEC
ML
MOP
NBR
NFRC
NHBRC
NL
NREL
ODP
OMG
PB
PE
PP
PVC
R-VALUE
SABS
SANS
SGW
SHGC
SHWS
SUNREL
SYSML
Hot Water System
Internal Block Definition
International Business Machines
International Electro technical Commission
Institute of Electrical and Electronics Engineering
International Council on System Engineering
International Standard Organization
Intergovernmental Panel Climate Change
Konnex ( European Standard Bus)
Konnex Power Line
Konnex Radio Frequency
Konnex Twisted Pair
Local Area Network
Light Emitted Diode
Long Term Mitigation Scenarios
Matrix Laboratory
Monthly Energy Consumption
Main Line
Monthly Operating Period
National Building Regulation
National Frame
National Home Building Regulation Council
Node Line
National Renewable energy laboratory
Ozone Depletion Potential
Object Management Group
Polybutane
Polyethylene
Polypropylene
Polyvinyl Chlorides
Thermal Resistance Coefficient
South Africa Building Standard
South Africa National Standard
Solar Geyser system
Solar Heat Gain Coefficient
Solar Hot Water System
Hourly Building Energy Simulation Program
System Modeling Language

xv
TRNSYS
TV
UML
U-VALUE
VAV
WR
YOP
YEC
Transient System Simulation
Television
Unified Modeling Language
Thermal Transmittance Coefficient
Variable Air Volume
Wattage ratio
Yearly Operating Period
Yearly energy Consumed by each appliance

1
CHAPTER ONE GENERALITY
1.1 Introduction
Today the world is facing serious problems, among others, global warming and climate
change caused by greenhouse gas emission (GHG emission). This is the reason why
developed countries organized meetings called the “Kyoto protocol” with the objective to
reduce the GHG emission(Ziuku & Meyer, 2012). The congregation of Kyoto protocol
declared that electrical energy consumption in both developed and developing countries is
one of the major causes of GHG emission.
The increasing worldwide human population and the improving living standard of people,
together with a high demand of comfort level, the energy consumption of residential
buildings is increasing rapidly. As result, in South Africa, the power supply network is
running out of balance between energy generation and demand. Furthermore, the South
African electrical energy is responsible for GHG emission as well. The Kyoto protocol
concerned South Africa as well (Rodney & Milford,2009). South Africa has ratified the
United Nations Framework Convention on Climate Change (UNFCCC) and its Kyoto
protocol and plays a proactive role in the climate negotiations.
That is why South Africa is studying the potential strategies for possible mitigation of
South Africa’s GHG emission. The target was to launch Long Term Mitigation Scenarios
(LTMS) that would provide a formal analysis from which the South African government
could shape a strong climate policy. With such a strong climate policy, South African
negotiators would adhere to, and procure a position in the UNFCCC and its Kyoto
protocol.
The Intergovernmental panel on climate change (IPCC) declared that the building sector
plays an important role in the GHG emission. Energy is mainly consumed during the use
of heating, cooling, ventilation, lighting, appliances, etc… (Milford, 2009). Energy
Efficiency is one of the major emission reduction potentials identified in the LTMS. That is
why energy efficiency is one of the core targets of South Africa’s climate Policy.
1.2 Statement of the problem
In South Africa, the inefficiency of energy consumption in building sectors does not only
affect climate change, but the power supply networks as well. The poor efficiency of
energy in building sectors is caused by:

2
a) Poor design and construction planning by the architect:
The poor design does not take in account solar orientation to enable natural ventilation
and day light instead of using electrical devices.
b)The uncontrolled and untimely use of electrical appliances
Electrical devices are “on” when they are not needed (i.e. outdoor lights left “on” during
the day, geysers are left on when there is no one at home, etc).
c) Bad insulation of building skin (wall, windows, doors, ceiling, floor etc…):
The bad insulation of building skins creates heat leakage during the heating process and
solar heat infiltration during the cooling process.
d) The over sizing of HVAC systems:
In a study conducted bya utility company in Colorado,(Jones, 2001), it was found that the
HVAC equipment was over-sized between 145% and 322%. The result is an
overconsumption of energy.
e)The wrong choice of HVAC and Lighting systems:
Some buildings are using devices with poor efficiency (i.e. the use of incandescent lamp
instead of CFL(s) or LED(S)
1.3 Hypotheses
What do we need to rectify overconsumption problems?
Set up an artificial control on the building?
Make a good design for future buildings?
Make sure that Building skins have tight thermal insulation?
Calculate accurate heating and cooling loads that would help to size adequate
HVAC systems.
Select very efficient HVAC and lighting system
1.4 Research aim and objective
The objective of this work is the development of an automated building energy model
software tool with the new modeling language SysML, to model heating and cooling
loads, to predict the energy performance, to enhance the energy efficiency and to
forecast the yearly building energy consumption. This tool will serve as an energy
modeling program to other users. The users will define the building through series of
inputs.

3
So far several building energy models have been developed, but an ideal model has not
yet been found because of the complexity of the system and the software tools used for
modeling. SysML is capable of demystifying the system and to lead to successful models
because of its flexibility, reliability and compatibility.
The targets of this work are to calculate heating and cooling loads accurately, to set up
an artificial control system, to select efficiency HVAC and lighting systems and to
calculate the yearly energy consumption in the building.
This energy model tool will be an excellent tool for energy efficiency. This may help in
the LTMS to promote South Africa’s climate change policy.
1.5 Delimitation
This work is based on the residential building energy consumption of a building in South
Africa in Western Cape more precisely in Stellenbosch. The building used as sample in
this work, as well as our research, is consequently, in position, dependent due to
influence through factors such as the climatic condition and weather in Stellenbosch
area. The building will be related to the South African norms of residential building
construction.
Furthermore it should be noted that our building is supplied with electrical energy for
domestic applications according to South Africa National Standards (SANS) and code for
energy supply for domestic applications category and IEC Standard.
1.6 Significance of the research
This energy modeling software is a vital step in building energy modeling, since up to the
present software energy modeling is very complex. As a result, they lead users to
multiple errors and inaccurate results. In summary, such a model brings enormous
benefits for:
1 Nature and humanity since energy consumption has become an alarming
concern with regard to pollution and climate change.
2 The energy supplier (ESKOM), who recently implemented a campaign called
“49m”to reduce energy consumption by the users as much as possible.
3 The occupants of the model building, since the user’s energy consumption will be
minimized.

4
CHAPTER TWO LITERATURE REVIEW
2.1 Introduction
Electrical energy is the main foundation of the innovation and perfection of actual
technology, and it is generally a type of energy the most widely used. Electrical energy is
in higher demand than any other type of energy, and it is indeed one of the major tools in
all sectors and places, including residential areas.
Electrical energy is also the backbone of a country’s economy, because it drives the all
sectors of industries, from the medical sector to manufacturing of sport, educational and
any industrial fields.
Therefore research in electrical engineering generally focuses on the perfection and the
enhancement of flexibility and reliability of electricity generation, transmission,
distribution, consumption and all related sub-categories of the field. Furthermore
electrical energy is one of the main causes of GHG emission.
This research project focuses on energy consumption in a residential building. The
analysis of the consumption of energy in this residential building will be taken as a basic
for the development of a model for the perfection of energy in residential buildings.
2.2 Electrical energy
2.2.1 Definition of electrical energy
According to (Simpson, 2003), “the electrical energy is from a motion of metal free
electron on the peripheral layer of an atom when the electric charge is applied across
length that metal”. Electrical energy is not visible to the naked eye, but its effects reveal
its existence in phenomena such as: electrical shock, the running of electrical motor or
heat generation through electrical resistance.
Electrical energy results from transformation of different forms of energy, such as:
mechanical energy, solar energy, thermal energy, chemical energy and so forth.
2.2.2 Main cause of electrical energy consumption in the residential building
The electrical energy is part and parcel of our life. The need and the demand for energy
are increasing at breath taking speed all over the world (Merz et al., 2009). Because of
its flexibility and other advantages amongst other, the electrical energy is generally the
most used and the most consumed energy for domestic applications. Electrical energy
transforms itself very easily into other forms of energy which are useful to humanity in all

5
areas despite some losses. In a residential building, for instance, electrical energy is
very useful and indeed a prerequisite for many kinds of domestic applications, which
make the residents’ daily life more comfortable and more efficient. Domestic applications
are divided in two categories, first category contains small and medium consumers of
energy and the second category contains big consumers of energy that cause the over
consumption of energy (Merz, et al., 2009),.
2.2.2.1 First category devices
The first category groups appliances that occupants use for making life easy,
comfortable and more pleasing according to their desires. Appliances are an integral part
of every household, from a simple electric clock to the washing machine and hair dryer.
They perform some household functions such as:
1) Cooking facilities (stove, microwave, toaster, kettle, frying pans coffee maker, blender,
and so on
2) Entertainment (television, radio, tape recorder, TV games etc.)
3) Cleaning and ironing (vacuum cleaner, washing machine, dish washer etc.)
4) Cool drinks, water, and storing perishable foods (refrigerators, freezers)
2.2.2.2 Second category devices
The second category groups the indoor environment control devices that perform the
environmental quality, lighting, hot water system, transportation system and security
system such as (lights, HVAC system, motorized gate, and elevator or escalator).
2.3 Lighting system
The light is one of the biggest consumers of electrical energy in residential buildings. The
light is very indispensable part of our lives, light is life. Most of information we receive
about our surrounding is provided by our eyes. We live in a visual world (America,
1993).The most important sense organ in the human body is the eye, handling almost
80% of all incoming information. The light is the mainstay of eye and eyesight. Without
the light, the visual perception will be virtually impossible. Insufficient light or darkness
gives rise to a sense of insecurity and fear. Lack of eye sight loses vital bearing. Artificial
light during the night, gives us a sense of security, makes our surrounding very
comfortable, and we feel safe and it helps us to see the world around us.
We would like to briefly highlight the history of light. CIRCA 300000 years ago, man
started to make fire as a source of warmth and light. The fire has enabled people to live
in caves where the rays of the sun never penetrated (Simpson, 2003). An admirable

6
artwork in Altamira cave pushes back some 15,000 years, the use of artificial light. The
light of campfires, oil and tallow lamps and light of kindling torches thoroughly has
improved the standard of prehistoric man (licht.wissen, 2012).
Around 260 BC, Light has been used of outdoors applications. The Pharos of
Alexandrian was built, in the city of Antioch, there were light in the streets. Aimé Argand
is the one who has invented in 1783 the liquid- fuel lamps with a central burner. And thus
some years later Dutchman Jan Pieter M. did the big improvement that could extract gas
from coal for street lamps (Wissen, 2010).
The enormous event of electrical light came out in 1879, with Thomas A Edison’s
reinvention and technological application of the incandescent lamps invented 25 years
earlier by the German Clock- maker Johenn Heinrich Goebel (licht.wissen, 2012). Today
we have an enormous expansion in lighting.
2.3.1 Different kind of electrical lamps
The electrical light has passed through different stages from the incandescent lamps,
over different forms, to fluorescent lamps; recently we have as outcome new devices at
competitive, efficient and minimizing environment impact lights. Earlier, light has been
used just for lighting, so in the present day; light is used for many utilities in different
fields such as: aesthetic, entertainment, security services, in medicine for surgery, and
so on. For that reason several kinds of appropriate light have been invented, to achieve
their roles in their appropriate fields. Some of them are: laser lamp, arc lamps, X ray
light, UV light, Infrared light, LED and so forth. Regarding our work, we will be focused
only on light for lighting. Concerning lighting, there are several lamps that are used, in
this work we will point out in detail some lamps, the most recently widely used for
residential lighting.
2.3.1.1 Incandescent lamp
The incandescent lamp is a thermal radiator, generating light by resistance heating. This
lamp consists of a filament mounted either in a vacuum, or in an inert gas, which does
not chemically react with the filament (Simpson, 2003). Earlier the carbon was used as a
filament in electric lamps; now the tungsten is used as the filament material, because it
has a low vapour pressure and has a high melting point (Simpson, 2003). The light is
generated by the flow of electric current through the tungsten filament and using the (I2R)
heating effect to raise the filament temperature sufficiently to produce incandescent
(Simpson, 2003). In addition to the incandescent lamp you have the main electric light

7
source. But this presents more weaknesses such as: poor luminous, low efficiency,
short cycle of life and luminous flux is influenced by the level of the supply voltage.
Figure 2.1 Construction of a compact fluorescent lamp (Simpson, 2003)
2.3.1.2 Fluorescent Lamp (FL)
The fluorescent lamp is the most familiar of the large class lamp referred to as discharge
lamp. In these lamps, light is created by an electrical discharge within a gas or vapour.
The fluorescent lamps are produced in different forms. Among these form, we have:
circular and U shaped lamps, miniature fluorescent lamps (Figure2.2), straight tubular
lamps and so forth.
Figure2.2 Fluorescent lamps circular and U shaped lamp (Simpson, 2003)
In the family of fluorescent lamps, the straight tubular lamp is the most commonly used.
They are produced in different lengths. And their lengths, thicknesses and diameters are
standardized according to nominal power. For the straight tubular; the electrodes are
placed at each end of the tube (Figure 2.3). In alternating current circuit, there is an
alternation between the cathode and anode from each electrode. The electrode that

8
emits electrons is named as cathodes. There are two types of cathodes, the hot
cathodes and the cold cathodes. For the normal hot cathode fluorescent lamp, each
electrode is a tungsten filament of special construction created with Alkaline Earth
Oxides. When the temperature rises to 1, 1000 Celsius, the cathode emits copious
electrons. An anode can attract these electrons creating a current between an anode
and cathode, (Alex, 1998), with gas filling the tube. This gas is compounded with the
mercury vapour with the addition of Argon or a mixture of inert gas to excite the initial
discharge.
When the fluorescent lamp is supplied by AC current, connected to either end, an arc is
produced along the length of the tube, and the mercury vapour ionizes. There is an
electromagnetic radiation produced by the combination of the ionization and excitation of
the mercury atoms. The fluorescence is the light emitted while the radiation is present,
phosphorescence is the light which continues to be emitted after the radiation removed
(Simpson, 2003).
Figure 2.3 the standard fluorescent lamp (Simpson, 2003)
2.3.1.3 Compact Fluorescent Lamps (CFL)
The CFL has the same characteristics as FL. The CFL lamps were introduced with idea
of replacing General Lighting Service lamps (GLS). The CFL are much more efficient
compared to incandescent lamps and they have a long life cycle. Figure 2.1 shows the
construction of CFL.
2.3.1.4 Lamp Emitted Diode (LED)
In an LED, a solid state crystal is indeed to emit light by passing an electric current
through it. The type of crystals used has two sections or regions with a surplus of
electrons (n-type semiconductor) and a sector with a deficit of electrons (p-type

9
semiconductor). When a direct voltage is applied, electrons flow across the junction
between the two regions producing light in the process. The white LEDs can be created
by additive color mixing or by luminescence conversion (licht.wissen, 2012). LEDs are
probably the most cost effective energy saving products compared to other lights that is
why it is called the light of the future (Figure 2.4). LEDs are tiny and extremely efficient;
they are revolutionizing the world of light. They are the light of the future and they are
conquering the realm of general lighting (licht.wissen, 2012).
Figure 2.4 Efficiency of light sources lumen/watt excluding ballast losses (Wissen, 2010)
2.3.2 Light measurement system
Light is a kind of energy. Light is nature’s way of transmission in through the vacuum.
Light moves very rapidly and does not have a fixed velocity. In a wide space, the speed
of light is 300,000 Km per second or 186,382 miles per second. In the same way that we
need objective methods of measuring electrical quantities, there is a need for the
objective measurement of light (Simpson, 2003). Different techniques are applied to
measure light. In fact the measurement can still be based on the MKS system, but it is
necessary to introduce one or more fundamental unit, and the SI system uses the
Candela as its unit of measurement (Simpson, 2003).
Light is a physical phenomenon. According to the physics experiments over the past 100
years, light has a duel nature. Isaac Newton proposed that light exist as a corpuscles
(Simpson, 2003), with unit of energy (quanta), and is flashed in a straight line from its
source. And Christian Huygens, suggest that light must have a wave nature (Simpson,

10
2003), and moves in a similar way with sound. Today the properties of light are based on
both concepts. Light is a visible part of electromagnetic radiation, which made up of
oscillating quanta of energy (licht.wissen, 2012). (licht.wissen, 2012), mention that light
is a portion of the various electromagnetic, flying through space. This declaration of
James Chark Maxwell, that light is a form of electromagnetic radiation, boost up to wave
theory, and the problem of the other disappeared. On the other side Einstein, Planck and
others demonstrated the photo –electric effect, where the light hits on certain substances
could produce an electric current to run, so that the light is definitely energy. (Simpson,
2003), declares that, new version was proposed as the quantum theory of radiation,
because it requires that energy only travels as a quantum of light. Today the physics put
together theories, the wave and the quantum. The magnitude of the wave increases
when its fronts overlap in phase with each other. When the wave’s fronts are out of
phase, however, they cancel each other.
The length of the wave is given by:
Where: wl is the wave length, h is Planck’s constant (6626/ 10-34joule second), m is the
mass of the particle and u is the velocity.
(Simpson, 2003), points out that when an electron moves from a high level to the lower
one, a photo is emitted, and that the same quantum of energy could be absorbed when
an electron jumps from a lower orbit to a higher one.
The energy of photo is defined as:
Where: E1 is the energy associated with the normal orbit, E2is the energy associated with
the excited orbit, H is the Planks constant and V is the frequency of the radiation emitted
as the electron moves from level 2 to level 1.
The equation demonstrated by Planck for each photon which carrying energy is given
as:
Where: Q denotes the photon, h denotes the Planck constant c is the speed, and wl is
the wave length.
Light measurement has been performed to verify the light installation design, to enable
the good choice of light and to facilitate the set-up of lighting that can be reliable to
application.

11
The luminance or photometric brightness is the measure of the amount of light emitted
from a surface in a particular direction (convulse). (licht.wissen, 2012)Revealed that the
Luminance indicate the brightness of an illuminated or luminous surface as perceived by
the human. The unit of Luminance is Candela per square meter (Cd/m2). And
(licht.wissen, 2012) developed the mathematical expression as:
Where: L is the luminance, Pref is the reflectance and Eill is the illuminance.
Where: n is the number of luminaires, Ar is the area of room, Z is the number of lamps
per luminaire, Ф is the luminance flux of a lamp, ŋb is the light output ratio, and WF is the
maintenance factor.
2.3.2.1 Behaviour of light
Nonetheless there are aspects of the behaviour of light which are of importance in
lighting control, and for which it is useful to have a basic understanding (Simpson, 2003).
Reflection
The light obeys to the law of reflection or specula reflection. Light reflecting off of a
polished or mirrored surface and respond to the low of reflection. The Angle of incidence
is equal to the Angle of reflection (Ryer, 1998). The specula reflectance depends with
the material. On the normal sheet of glass, the specula reflectance is from 7% and can
send out most light to 95% for a surface aluminized mirror. And the reflectance of
polished stainless steel and chromium plate play around 60% the rough surface and the
matt white painted surface are the main cause of diffuse reflection.
Refraction
The refraction Snell’s law (Ryer, 1998), when the light goes between dissimilar objects,
the rays bend and change the speed slightly.
Snell’s refraction law is expressed by:
)
This equation depends on two factors: the incident angle, and the refractive index.
(Simpson, 2003), explains that refraction expresses what goes on when the light goes
from one transparent medium to another, and expresses the refractive index (µ) by:

12
Where: is the angle of incidence and is the angle of refraction
Diffraction
The diffraction is a kind of wave phenomenon which is dependent on wavelength (Ryer,
1998), and it is expressed by:
Where:ϴ is the diffraction angle, wl is the wavelength of radiant energy and D is the
aperture diameter.
A diffraction established uses the interference of wave created by diffraction to take
apart light angularly by wave length (Ryer, 1998).
2.3.3 Tubular day lighting
Tubular day lighting systems are the technique used by means of some devices to
collect daylight from outside and transmitting it into the heart of the building(Callow &
Nottingham, 2003).
Today with the advanced technology, the duel nature of light (wave form and quantum)
and the proprieties of the light (reflection, refraction, diffraction and other proprieties), it is
possible to provide in the building, adequate, reliable and efficient light from day lighting.
Tubular day lighting systems are made up of the following four basic components:
polycarbonate clear dome, aluminium roof flashing, high- reflective light transfer tube
with adjustable option, and domed diffuser or troffer with flat or pyramidal lens. Other
parts are available such as curb and cap options, troffer and dimmers. The reliability,
efficiency and the performance of tubular day lighting systems are related directly to the
availability of the sunshine and skylight, and indirectly to an area’s climatic conditions.
That is why geographic area and weather data are the hinge parameters during the
process of tubular day lighting system’s installation. Because of the availability of the sun
and skylight, these systems are adequate to the building in use during the day such as:
shops, workshops, schools, offices on forth. Tubular day lighting systems may be used
in the residential building as an auxiliary lighting system.
The geographic area and climatic parameters of South Africa are very compatible to
Tubular day lighting systems. (Manyuchi, 2008)(Hordeski, 2001)Solar levels in South
Africa are amongst the highest in the world. The average daily solar radiation varies
between 4.5 and 7kWh/m2, even in winter, and some parts of the country receive more
than 6 kWh/m2per day. Therefore tubular day lighting systems will contribute a lot to

13
energy efficiency and renewable energy. Setting up such a system in South Africa, will
be more profitable, because huge portion of energy consumed by lighting systems will
be saved by tubular day lighting system.
That is the global overview of lighting system that we have wanted to explain, the
following point we explained about heating ventilating and air conditioning system
(HVAC system).
2.4 Heating ventilation and air condition System (HVAC system)
Human beings live in a hostile environment accordingly to the weather, season of the
year and geographical locality. To make the environment comfortable, several kinds of
Heating Ventilating Air Conditioning (HVAC) equipment has been invented (Hordeski,
2001) .
2.4.1 Definition of Air conditioning
The air conditioner primarily provides and maintains an artificial and comfortable
environment for the occupants within a building or an enclosed premise. The comfort
parameters are generally temperature, humidity, and air motion.
Heating Ventilating Air Conditioning Systems comprise a large use of energy in today’s
buildings (Jones, 2001) and (Engineers, 2000). It is estimated HVAC System consume
about 35% of the total energy used in buildings (Kharagpur, 2008) and (ASHRAE, 2014).
2.4.2 Aims of Air conditioning
(Engineers, 2000), the aims of air conditioning system are to produce an environment
which is comfortable to the majority of the occupants in the building such as: circulate
the air to dilute the CO2 level and meet the oxygen needs of the occupants, the dilution
of the odours present to a socially acceptable level, the minimizing the increase in air
temperature in the presence of excessive sensible heat gain and the control the humidity
to limit condensation.
2.4.3 HVAC Principle of functioning
The HVAC system functioning is based on thermodynamic principles and laws which
deal with the relations among heat, work and properties of system (temperature,
Pressure and Volume) which are in equilibrium. The HVAC system deals with heat and
mass transfer, fluid mechanic, expansion of gases and quantity of motion. Refrigeration
and HVAC system both are working on thermodynamic cycle that is categorized into gas
cycles and vapour cycles (Kharagpur, 2008) (Rona, 2004).

14
Vapour cycles can be subdivided into vapour compression system, vapour absorption
system, vapour jet system, and so on.
Vapour Compression systems and Vapour absorption refrigeration systems are the most
commonly used in refrigeration and HVAC systems. The HVAC system can work in
close loop and in open loop that means the system is in contact with the atmosphere.
2.4.3.1 Heat transfer
Generally heat transfer takes place in three different modes: conduction, convection and
radiation(Winterbone & Turan, 1996).
Conduction: when the transfer occurs through a substance without any motion of
the substance, then mode of heat transfer is called conduction” according to
(Ahmadul Ameen, 2006), and that is given by:
Convection: according to (Ahmadul Ameen, 2006), If it transfer through a substance due to the movement of the substance, then it is called convection heat transfer.
Radiation : heat transfer through radiation is a form of electromagnetic waves, or
is the thermal radiation emitted by a body.
2.4.3.2 Fluid mechanic
The flow of gas is part of fluid mechanic based on three law fundamentals.
Conservation of mass of fluid
The mass of a motion fluid is the same at every point and the formula is stated as
follows:
.
And that imply:
Where: A is the section of the pipe in which the fluid flows, m is the mass of the fluid, is
the density and v is the velocity of the flowing fluid.
2.4.4 Type of HVACs
There are several types of electrical HVAC systems; we can enumerate some of them by
giving their strengths and weaknesses (Rishel et al., 2006):
15
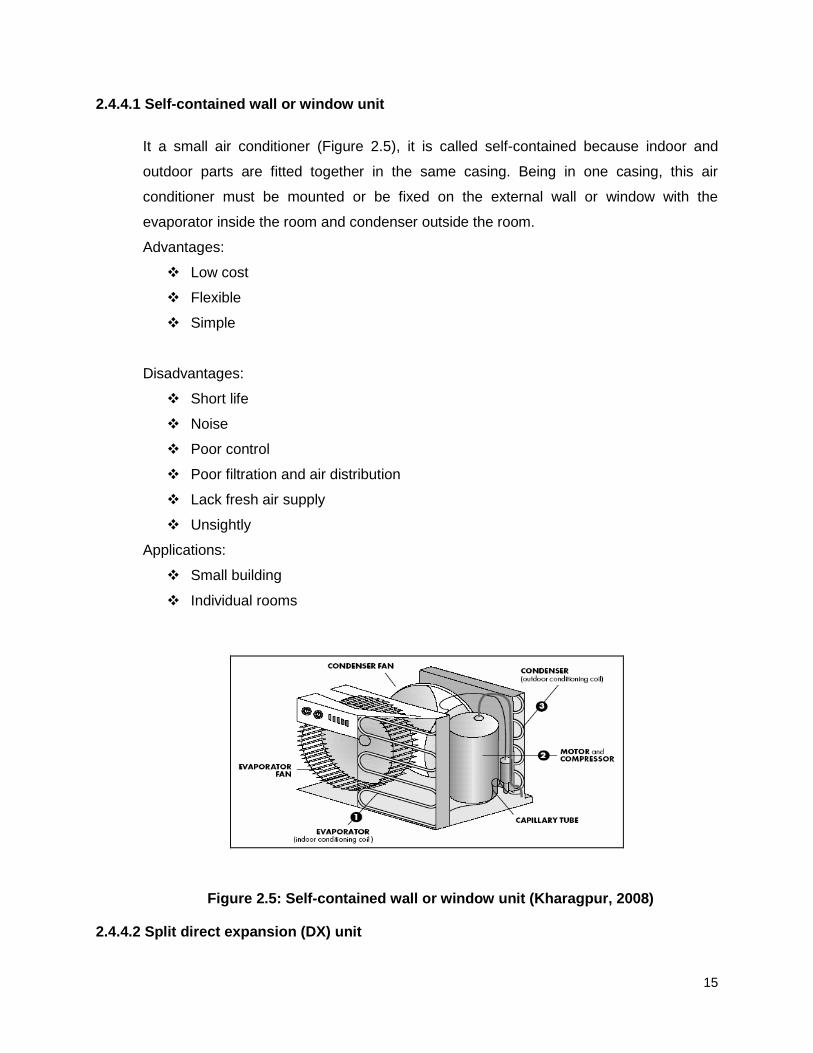
2.4.4.1 Self-contained wall or window unit
It a small air conditioner (Figure 2.5), it is called self-contained because indoor and
outdoor parts are fitted together in the same casing. Being in one casing, this air
conditioner must be mounted or be fixed on the external wall or window with the
evaporator inside the room and condenser outside the room.
Advantages:
Low cost
Flexible
Simple
Disadvantages:
Short life
Noise
Poor control
Poor filtration and air distribution
Lack fresh air supply
Unsightly
Applications:
Small building
Individual rooms
Figure 2.5: Self-contained wall or window unit (Kharagpur, 2008)
2.4.4.2 Split direct expansion (DX) unit

16
The DX unit is composed of two blocks or units, outdoor units air cooled (condenser unit)
and indoor unit (fan, coil unit). The compressor can be either part, but is often on the
outdoor units. There are two sort of split air conditioner. Split type unit ducted one indoor
unit fixed in the ceiling; this system is using ducts to cool the areas. The second one is
split type unit cassette, on this one the indoor unit is fixed in the ceiling and cooling takes
place through the grille.
Advantages:
Indoor unit need not be on outside wall
Indoor unit can be fixed to the ceiling
Silencers can be used for indoor units
The control is improved with multiple refrigerant circuits
Disadvantages:
Restriction on length of refrigerant piping between indoor and outdoor unit.
Fresh air supply is limited due to the different levels between indoor and outdoor
units
Applications:
Small shop
Computer rooms
Individual area.
2.4.4.3 Split system reversible heat pump
The split system direct expansion, this system uses valves to change the function of
condensing and evaporating coils to be reversed. This type of split air conditioned has
the same advantage, disadvantages and applications as Spit direct expansion (DX) unit
described above.
2.4.4.4 Water cooled unit
This is a self-contained indoor unit consisting of evaporator, compressor, cooled
condenser with separate outdoor cooling tower.
Advantages:
Flexibility in location for outdoor and indoor units.
Better to control the air cooled units.
Disadvantages:
Maintenance of cooling water circuit is required.

17
Cooling water treatment advisable.
Applications:
Small zone
Computer room
2.4.4.5 Glycol cooled unit.
This type of HVAC is a self-contained indoor unit that consists of evaporator, compressor
and glycol cooled condenser with remote and air heat exchanger. This unit uses glycol
water instead of water. The glycol water mixture is used in this system to prevent
freezing.
Advantages:
No water in the system
No freezing problem
Disadvantages:
Need to control if the glycol is still in the system.
Applications:
Computer rooms
2.4.4.6 Fan coil units
Fan coil units is used for one or more areas, the system makes running chilled or hot
water from the central unit to individual units in room or zone which is cooled or heated.
There are two sorts of fan coil units
Two pipe system: in this system one pair of pipes are used for chilled water in the
summer season and the other one used for hot water in the winter season. This
unit is good for continental climate and not good for temperate climate.
Four pipes system: in this system, pipes for chilled water are separated from the
pipe for hot water. Although this unit is more expensive compared to the two pipe
system it is more flexible and more controllable. Some rooms can be cooled
while others are heated.
Advantages:
Flexible
Straight forward design

18
Good control
Disadvantages:
High cost
Applications:
Office, hotel bedrooms, luxury housing, schools
2.4.4.7 Heat recovery unit
The Heat recovery unit HVAC system is a self-contained refrigeration and heat pump,
room units reject heat to water circulating throughout building when cooling and taking
the heat from the water when heating. When the system is working as a cooler the heat
is rejected by the unit and when the system is working as a heater, the heat is supplied
by the unit.
Advantages:
Energy conservation
Particularity in temperature climates
Disadvantages:
Unite is larger than fan coil units
Applications:
Office
school
2.4.4.8 Induction system
This system is a central air plant; it delivers conditioned air through high-velocity ducting
to induction unit in the room. Water from a central plant is also supplied to the induction
units. The air conditioned or primary air supplied to the unit induces room, or secondary
air through the unit. This induced secondary air passes over the water coil and thus
heated and cooled.
Two pipes changeover system: one pair of pipes used for chilled water in
summer and one for hot water in winter. Not suitable for temperate climate.
Two pipes non changeover system: one pair of pipes for chilled water only, with
heating by primary air only.
Four pipes system: separate pair of pipes for chilled water and hot water. Lower
running cost and better control than two pipes no changeover system.

19
Advantages:
Space saving through use of high velocity and small diameter
Individual room control
Very suitable for modular building layout
Central air plant need handling only part of air treated.
Particularly applicable to perimeter zones of large buildings
Suitable for large heat loads with small air volumes.
Disadvantages:
High investment cost
Installation and operation are all more complex than fan coil system
Individual units cannot be turned off
Applications:
Offices
Schools
hospital
2.4.4.9 All air Constant Volume reheat system
For this system, central or local plant with cooler sized for latent heat cooling load and
reheater to balance for sensible heat load and for winter heating. Reheated can be
remote from cooler, several reheaters can be used with one cooler to give a degree of
local control. The humidifier can be incorporated with preheater to give complete control
of discharge air temperature and humidity.
Advantages:
Simple
Free cooling available for low outdoor temperatures
Several reheat zones can be used to improve control
Good air distribution possible because diffusers handles constant volumes.
Independent control of volume
Disadvantages:
Waste of energy by reheating
Expansive in both investment and running cost
Large volumes of air to be treated in central plant.
Recirculation system necessary

20
Applications:
Industrial
Houses
Apartments
Shopping mall
cinemas
2.4.4.10 Duel duct system
In dual duct system, a central plant delivers two streams of air through two sets of
ducting to mixing boxes in the various rooms. The two streams are at different
temperatures.
Advantages:
Cooling and heating available simultaneously
Free cooling available at low outdoor temperature
Individual room central zoning not necessary
Flexible operations
Disadvantages:
Use more space for two sections of supply air ducting
More air has to be treated in the central plant
Recirculation system is necessary
Expensive in both capital and running cost
Applications:
Hospitals
Publics rooms
Schools
Hotels
2.4.4.11 High velocity air system
Similar to all system but operate with high air velocities in supply ducts. Outlet boxes
incorporate sound attenuations. And recirculation system is usually at low velocity
Single duct: this unit saves space and zone central can be used. This system
requires large volume of air to be treated in central plant. This system also
requires high fan pressure and fan power.

21
Dual ducts: similar to low velocity dual duct but with sound attenuation
incorporated in outlet boxes, this unit is very flexible in operation compared to the
single duct and can handle larger air volumes than single duct.
2.4.4.12 Variable Air Volume system (VAV)
An all air system in which local central is obtained by varying volume discharged at each
diffuser or group of diffusers in response to the dictates of a local thermostat. Capacity of
the supply and extract fan is reduced as total system variable requirement and part
loads. The fan is controlled by: variable speed, variable blade pitch, variable inlet guide
naves, and disc throttle on fan outlet. Figure 2.6 depicts the overview of VAV system.
Advantages:
Efficient part load operations.
Individual room or area control.
Unoccupied area must be closed off with damper.
Disadvantages:
Special provision needed for heating.
Extra central needed to maintain minimum fresh air.
Complexity of control.
Cannot provide full control of humidity.
Expensive investment cost.
Applications:
Hospitals
Hotels
Schools
Small shops

22
Figure 2.6 Overview of Variable Air Volume system (Honeywell, 1997)
2.4.5 Heat pump
For the HVACs system, the heat pump presents more advantages compared to other
HVACs enumerated above. The heat pump is a device that takes heat from one zone
(lowest temperature) called the source to another zone (highest temperature) called sink.
The heat pump operation is based on vapour compressor refrigeration system with
reversing valve (Rona, 2004). The reversing valve enables reversibility of refrigeration
flow. Once the cycle of refrigerant is reversed automatically the condenser and
evaporator roles will be switched. Then the system can heat and cool when needed.
2.4.5.1 Heat pump components basic components
The heat pump is a closed loop in which the refrigerant flows through the main
components such; compressor, evaporator, condenser and expansion valve.

23
Figure 2.7 Overview of the vapour compression refrigeration system and P,
Psia diagram
Condenser
The condenser, is often called the heat exchanger, cools the pressurized gas until it
condenses into high pressure, moderate liquid (Guptan, 2003). (IIT KHARAGPUR
2008), Condenser and evaporator are basically heat exchangers in which the refrigerant
undergoes a phase change (Figure 4.7). Next to the compressor the proper design and
selection of condenser and evaporator is very important for satisfactory performance for
any refrigeration system.
Evaporator
An evaporator is an element in which the gas vaporizes itself and takes a quantity of
heat from the worm zone. According to (IIT KHARAGPUR 2008) the evaporator, like a
condenser, is a heat exchanger. In an evaporator the refrigerant boils or evaporates and
in doing so absorb heat from the substance being refrigerated. (commission, 2013), the
evaporator moves heat from the air inside a building using coil. The evaporator
comprises tubing and shell where liquid and gases pass the mass flows rate in the
evaporator tube.
Concerning the liquid flowing in the shell is given by:

24
Nu=
Normally evaporators are designed to operate in nucleate pool boiling regime as the
heat transfer coefficient obtained in the regime are stable and are very high. Various
studies show that in nucleate pool boiling region, the heat transfer coefficient is
proportional to the 2 or 3 power of temperature difference between the surface and the
boiling fluid, i.e.
Figure 2.8 Schematic of a flooded type and shell-and-tube evaporator (Kharagpur,
2008)
Expansion device
An expansion device is another basic component of a refrigeration system with basic
functions such as:
Reduce pressure from condenser pressure to evaporator pressure
Regulate the refrigerant flow from the high pressure liquid line to evaporator.
There are several types of expansion devices, concerning our window air conditioner,
the capillary tube are used in packaged air conditioner.
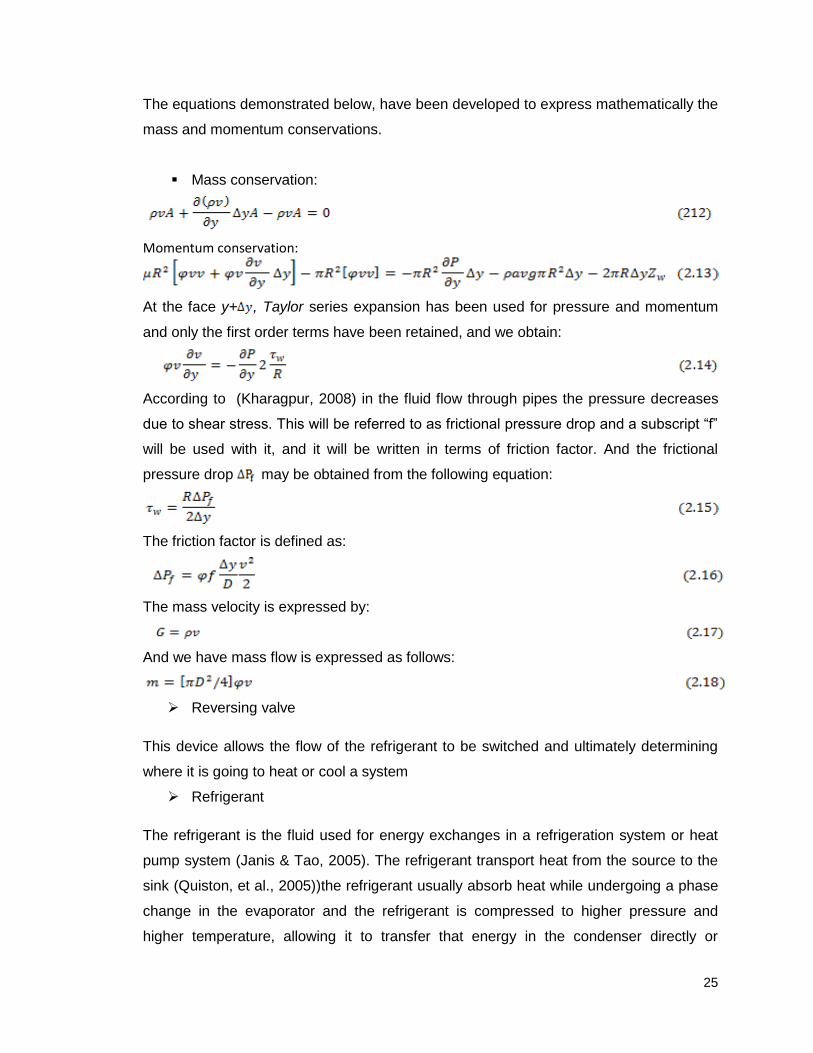
The functioning of capillary tube is based on fluid mechanic (mass, energy and pressure
conservation). (Ahmadul, 2006) explains, in the capillary tube, the pressure drops
because of the friction and acceleration of the refrigerant through the narrow passage.
25
The equations demonstrated below, have been developed to express mathematically the
mass and momentum conservations.
Mass conservation:
Momentum conservation:
At the face y+ , Taylor series expansion has been used for pressure and momentum
and only the first order terms have been retained, and we obtain:
According to (Kharagpur, 2008) in the fluid flow through pipes the pressure decreases
due to shear stress. This will be referred to as frictional pressure drop and a subscript “f”
will be used with it, and it will be written in terms of friction factor. And the frictional
pressure drop may be obtained from the following equation:
The friction factor is defined as:
The mass velocity is expressed by:
And we have mass flow is expressed as follows:
Reversing valve
This device allows the flow of the refrigerant to be switched and ultimately determining
where it is going to heat or cool a system
Refrigerant
The refrigerant is the fluid used for energy exchanges in a refrigeration system or heat
pump system (Janis & Tao, 2005). The refrigerant transport heat from the source to the
sink (Quiston, et al., 2005))the refrigerant usually absorb heat while undergoing a phase
change in the evaporator and the refrigerant is compressed to higher pressure and
higher temperature, allowing it to transfer that energy in the condenser directly or

26
indirectly to the atmosphere. The selection of refrigerant is based on many factors and
properties such as; thermodynamic characteristics (high latent enthalpy of vaporization,
low freezing temperature, positive evaporating pressure), physical and chemical
characteristics (high dielectric straight of vapour, good heat transfer characteristic
satisfactory oil solubility and viscosity), and environment friendly (Ozone Depletion
Potential and Global warming Potential).
In the HVAC system refrigerant, there are four classes of elements or compounds:
Halocarbon, Hydrocarbon, Organic and Inorganic (Hordeski, 2001). The halocarbon is
called the popular classes of refrigerant because they were been used since for half a
century were introduced by Du Pont Company with trade name “Freon”.
There are also several groups of refrigerant such as:
Chlorofluorocarbon (CFC), these include R11, R12, R113 and R115, this group
contain Chlorine that have high ODP. For that reason in 1995, the USA has
banned the production of CFC and refrigerating devises using this refrigerant.
Hydro fluorocarbon (HCFC) is another group that regroup R22, R123, R124, R
141a, R141b, these refrigerants contain also Chlorine, yet with the presence of
Hydrogen, the ODP becomes weak. In 2004, the USA has restricted the
production of this refrigerant.
Hydro fluorocarbon; with R125, R 134 and R152a, this group does not contain
Chlorine, and is friendly to ODP on the other hand with high (GHP).
Compressor
A compressor is the most important and often the more expensive component. The
function of a compressor in a vapour compression refrigeration system, its function is to
continuously draw the refrigerant vapour from the evaporator so that a low pressure and
a low temperature can be maintained in the evaporator at the level that the refrigerant
can boil by extracting heat from the refrigerated space. The compressor then has to
raise the pressure of the refrigeration level at which it can condense by rejecting the
cooling medium in the condenser, declared (Kharagpur, 2008)
There are several types of compressors used in refrigeration and HVAC system, These
compressors are classified in several ways; based on the working principle such as;
positive displacement type, rotor-dynamic type, reciprocating type, rotary type, orbital
type, acoustic compressor, radial and axial compressors. Based on arrangement of

27
compressor motor or external drive such as; hermetic or sealed compressor, open type,
and semi-hermetic (semi-sealed) type.
Reciprocating compressor
(Jones, 2005) explains that, the reciprocating compressor is the workhorse of the
refrigeration and HVAC industry, The reciprocating compressor is the most widely used
compressor with coding capacities ranging from a few watt to hundreds of Kilowatt with
high speed 3000 to 3600 rpm.
The reciprocating compressor consist of a cylinder with a piston moving up and down or
back and forward, with suction and discharge valves to reach suction and compression
cycle of the refrigerant vapour (Figure 4.13). The inlet side of the compressor is
connected to out of the evaporator in t mean time the outlet of the compressor is
connected to condenser inlet. The pressure difference between the cylinders and the
inlet or outlet manifold respectively lead the opening and the closing of the suction and
the discharge valves. (Kharagpur, 2008), the inlet pressure is equal to or slightly less to
the evaporator. Similarly the pressure in the outlet manifold is equal to or slightly greater
than the condenser pressure.
The performance of the reciprocating compressor is based on the mass flow rate (m),
the power consumption of the compressor (Wc), the temperature of the refrigerant at
compression exit (Tc) and the performance under part load conditions.
For reciprocating compressor, the ratio of volumetric flow rate of refrigerant ( ) is given
by:
Where: m and V are the mass flow rate of refrigerant (Kg/s) and compressor
displacement rate (m3/s) respectively, and v is the specific volume (m3/kg) of the
refrigerant at the compressor inlet.
The power input is given by:
(2.20)
For the isentropic process Pvk=constant, hence the specific work (Wid) of compressor
can be obtained by integration, and it can be shown to be equal to:

28
(2.21)
In the above equation, k is the index of isentropic compression. The approximate volume
of it can be obtained from the value of the pressure and the specific volume at the
suction and discharge state as
The work of compression for the ideal compressor can also be obtained by applying
energy balance across the compressor:
The above equation can also be obtained by the thermodynamic relations:
The above expression is valid only for reversible, adiabatic compression.
2.4.5.2 Auxiliary components (air handling)
Fan
The fan is one of the crucial devices in the HVAC system. The fan keeps air moving in
the space through the duct. (Janis & Tao, 2005), A fan is a mechanical device that
moves air used in the HVAC system to ventilate or to transport heat or cooling.
All fans consist of rotating impeller blade these can be forward-curved, backward curves
or radial. For the HVAC system, the fan is mounted in the enclosure unit called housing.
Generally the fan is driven by an electrical motor or an engine. In the HVAC system, the
fan is often driven by an electrical motor (Janis & Tao, 2005). The fan and the motor can
be fixed in the same unit or can be fixed separately externally. The coupling between
motor and fan wheels can be direct (direct-drive) or can be coupled by belt and pulleys
called sheaves. (Janis & Tao, 2005), in direct-drive, the fan runs at the same speed with
the motor in a non-adjustable way. The sheaves and the belt control the speed and the
performance by proper selection of the sheaves diameter. The performance of a fan or
function of capacity is represented by graphs and showing the pressure, efficiency and
power (Quiston, et al., 2005).
According to (Janis & Tao, 2005), The performance of the fan is measured by the
following characteristics: volume of air supplied per unit time or capacity normally

29
in(cfm), pressure or system pressure at the design point normally in( psi), power input,
horsepower(HP),mechanical and static efficient in percentage, and others factors such
as; acoustic, efficiency, relative cost and physical size.
(Quiston, et al., 2005) states that there are several simple relations between fan
capacity, pressure, speed, and power, which are referred to as the fan laws.
The first fan laws are the most useful and are given as: the capacity is directly
proportional to the fan speed, the pressure (static, total, or velocity) is proportional to the
square of the fan speed, the power required is proportional to the cube of the fan speed,
The second law is defined as: the pressure and the power are proportional to the density
of the air at constant speed and capacity, the speed capacity and the power are
inversely proportional to the square root of the density and the pressure constant
(Janis & Tao, 2005), reveal some formulas these have been developed to determine air
flow rate, pressure required and fan power:
Where: TP is total pressure developed, SP is the static pressure that is the pressure
exerted, and VP is the velocity pressure that is the pressure created by the air velocity.
The power required at the rated flow and the pressure at the sea level is expressed as:
Or
Where: AHP is the power at the rated flow and pressure at sea level, EHP is the
electrical power at the selected motor efficiency in KW, PE is the mechanical efficiency
of the selected motor per unit in percentage and ME is the motor efficiency of the
selected motor per unit in percentage.
Duct
Ductwork is part of the air handling system and includes the supply, return, outside air,
relief air and exhaust air duct, explained (Janis & Tao, 2005). The supplied air flow in the
duct system is classified as low pressure/velocity, medium pressure/velocity and high
pressure/velocity. The low velocity is used when the small air flow and large quantities
are required. Low pressure velocities use less power for distribution, reduce frictions and

30
air noise although it occupies big space. The high velocity enhances the conservation of
the space and duct material.
The sheet of galvanized steel, aluminium or stainless steel is widely used for fabricating
ducts. Sometimes non-metallic material is used. Ducts are fabricated in shape of
rectangular, round, and flat oval. The rectangular shape is the most often used for low
velocity armed with insulation material to the interior of the duct this method offers an
acoustic absorption as well as thermal insulation. Round or flat oval ducts are used for
medium and high velocities duct work. In this case they usually apply external insulation.
And a sound absorber may be installed just downstream of the fan. The terminal units
are used to throttle the air to a low velocity and attenuate the noise.
Piping system
The HVAC system is based on the conduction of heat by fluid flow. Among these fluids
there is air, water, steam, refrigerant and so forth. For that reason piping system is used
to transport the fluid from one component to another. The flow of fluid in a piping system
depends on factors such as properties relating to the fluidity (viscosity, and specific
gravity), phase (liquid, vapor or gas) and physical states (temperature, pressure and
velocity) (Janis & Tao, 2005).
To pass up pressure losses produced by friction and harmful noise, the piping system
should be large enough. The piping system does not consist of only pipes. Besides
pipes, there are others components such as: valves, coupling, air controller, oil
controller, oil separator and so on.
Pipe
Pipes are tubular material designed to transport fluid energy from one element to
another device. In the HVAC system, pipes are fabricated in different materials such as:
galvanized steel, copper, cast iron and so forth. To prevent corrosion, non-metallic
materials are used such as: fibre glass, plastic, or the special material (stainless steel
and aluminium).
The plastic or fibre glass pipes: Polyvinyl chlorides (PVC), Polybutane (PB),
Polypropylene (PP), and Polyethylene (PE) are economical alternative to metal, but they
are very fragile and exposed to water hummer.
Soldering, brazing, welding, screwing, solvent-welding and mechanical coupling are
different methods used to join pipes. The mechanical coupling presents more

31
advantages compared to other methods. Mechanical coupling is less expensive, flexible
to relieve stresses and thermal expansion.
Valve
Valves are devices installed in the piping system, the valve serve to put “on or off” the
flow of the fluid manually or automatically. In other words, valves serve to control the
flow of the fluid in the hydraulic and pneumatic systems.
Valves are used for multiple functions, they may be used to isolate components and
portions of systems, to adjust the flow through the system in proper amount to save load,
to modulate the flow of fluid through head transfer devices in response to fluctuating
load, to avoid unacceptable light system pressure at light load conditions, to bypass the
fluid, to reverse the systems and other applications.
There are several types of valves that are made in various designs and various materials
and types of construction. Each has specific working characteristic especially in fluid
control systems
Fitting and accessories.
To perform the functioning in the piping systems, many fitting and accessories are
required such as: piping fitting elbows, tees, flanges, coupling union, strainer, pressure
and temperature taps and others.
Air cleaning systems
The use of air cleaning systems is to clean the air that we breathe. There are two
methods used in those systems, the humid system and the dry system. In the humid
system, the air is cleaned by passing through a liquid curtain through the spray. In the
dry cleaning system, air is cleaned by passing through cleaning devices. The common
device widely used to clean air in the dry cleaning method is the air filter. The air filter is
based on certain characteristics such as: efficiency, resistance to air flow, duct holding
and life cycle cost of the system.
Air Devices
Air devices are used for supplying air and removing air from space. Air devices such as
grilles, registers, and diffusers are among the parts of HVAC systems that are visible to
the occupants of the building (Janis & Tao, 2005). Normally grilles and registers are
equipped with vanes for directing air flow. They can be fixed in the ceilings, in the walls

32
or floors as aesthetic or decorative way. The diffusers are often installed in the ceiling
fixed with louvers, slots or vanes.
2.4.6 Solar air conditioner
“Air conditioner is one of the consumers of electricity in many parts of the world today
“explains (Nathan Rona, 2004:9). It is for that reason; many researches on solar air
conditioner are made to overcome the problem. Solar air conditioning system might be a
way to reduce the demand for electricity.
The solar air conditioning systems can be divided into two groups of systems: solar
autonomous system and solar assisted systems. In a solar autonomous system “all”
energy used by the air conditioning system is solar energy. The word all is in between
quotation marks because often systems called solar autonomous still use grid-provided
electricity to drive fans and pump (Nathan, 2004:97).
Two measures of interested in solar-autonomous systems are COPsol and SPLsol.
COPsol gives the momentary performance of the entire system and is defined as:
Where: Qo,sol is heat removed (by using of solar energy) from conditioned space, Ica
is solar radiation, and A is solar collector area.
.
Where: is solar collector efficiency, and PE is a primary energy
2.4.6.1Solar energy
The sun is the main source of all energies, including solar energy. Regarding our
system, the solar energy will be collected to supply the system,(Krauter, 2006). Solar
energy collection, as the name suggest is to collect energy provided from the sun to
transform this energy into something useable, electricity, heat or both, (Nathan, 2004).
The efficiency of a solar collector is defined as:
or

33
Where E is a collected energy measured (W), Ic is a solar radiation (W/m2) and Ac is a
solar collector aperture area measured in (m2).
There are three groups of solar air conditioning systems according to power supply to
the system, among them there are:
Photovoltaic cells or a solar cell air conditioning which the solar radiation is transformed
directly into electricity to supply the air conditioning system, The solar thermal collector
air conditioning system that converts the sun’s radiant energy into heat energy, and the
system using both. The solar air conditioning is also divided in two types of systems:
solar autonomous system and solar assisted. According to the power supply to the
system, the photovoltaic cell air conditioning has more advantage compare with others,
but the biggest inconvenience is, the system costs much more than others and requires
others devices such as convector, accumulator and so on. Regarding the choice we
suggest to choose the solar collector air conditioning.
2.4.6.2 Solar collector air conditioning components
Comparing the solar collector air conditioning system to electrical air conditioning
system, there is a similarity in terms of some based elements composed modelled above
such as condenser, evaporator, and expansion device. The solar collector air
conditioning system is using vapour absorption refrigeration systems, the compression is
replaced by the generator, and this one completes others components such as: solar
thermal collector, thermal pump, rectifier, absorber, regenerator and other components.
The solar thermal collector converts the sun’s radiant energy into heat energy. The basic
principle solar thermal collector is that, when solar radiant strikes a surface, part of it is
absorbed, thereby increasing the temperature of the surface, explains (Nathan Rona
2004:66). There are various types of solar thermal collectors such as: flat plat thermal
collector, Evacuated Tube Collector (ETC), parabolic dish collector and central receiver’s
collector. In the thermal heat pump air conditioning system, heat from the solar collector
is used directly to remove heat from the conditioned space.
The generator is like a heat exchanger, it produce refrigerant vapour by heating
refrigerant-rich solution with a heating medium. The generator is a shell and tube, type
heat exchanger where the heating medium flows through the shell side in an upward
cross flow configuration and refrigerant vapour is generated from the solution that flows
downward inside the vertical tubes.
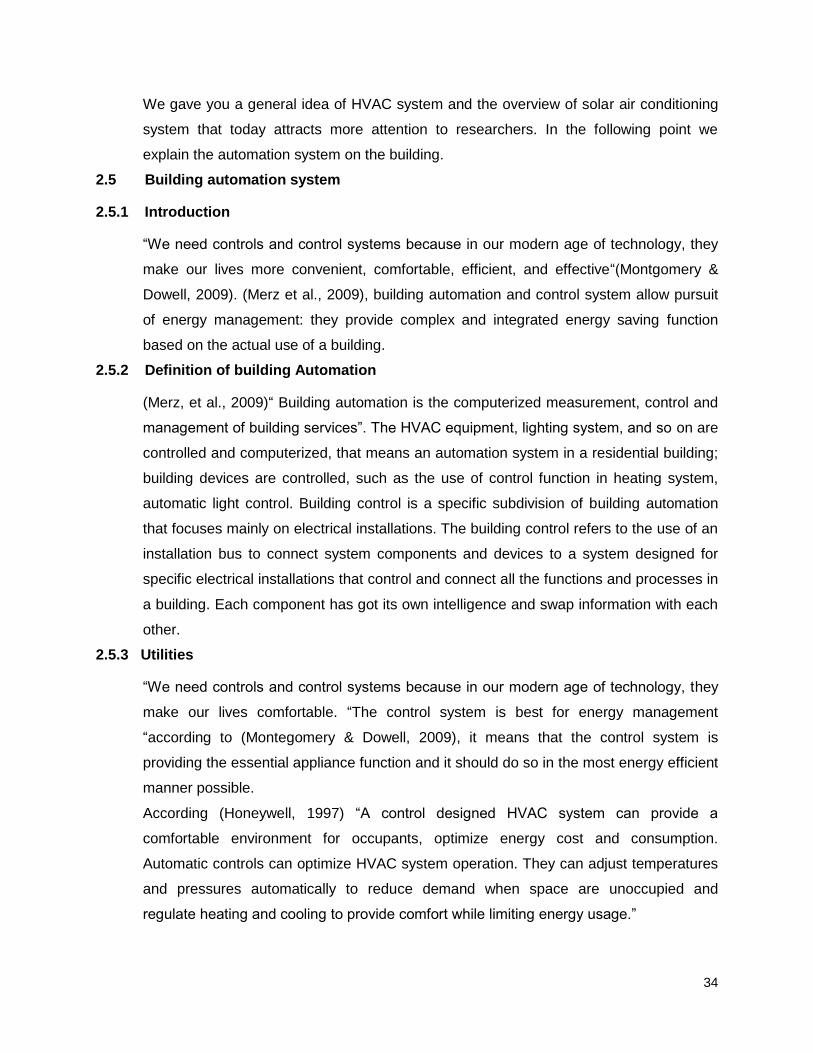
34
We gave you a general idea of HVAC system and the overview of solar air conditioning
system that today attracts more attention to researchers. In the following point we
explain the automation system on the building.
2.5 Building automation system
2.5.1 Introduction
“We need controls and control systems because in our modern age of technology, they
make our lives more convenient, comfortable, efficient, and effective“(Montgomery &
Dowell, 2009). (Merz et al., 2009), building automation and control system allow pursuit
of energy management: they provide complex and integrated energy saving function
based on the actual use of a building.
2.5.2 Definition of building Automation
(Merz, et al., 2009)“ Building automation is the computerized measurement, control and
management of building services”. The HVAC equipment, lighting system, and so on are
controlled and computerized, that means an automation system in a residential building;
building devices are controlled, such as the use of control function in heating system,
automatic light control. Building control is a specific subdivision of building automation
that focuses mainly on electrical installations. The building control refers to the use of an
installation bus to connect system components and devices to a system designed for
specific electrical installations that control and connect all the functions and processes in
a building. Each component has got its own intelligence and swap information with each
other.
2.5.3 Utilities
“We need controls and control systems because in our modern age of technology, they
make our lives comfortable. “The control system is best for energy management
“according to (Montegomery & Dowell, 2009), it means that the control system is
providing the essential appliance function and it should do so in the most energy efficient
manner possible.
According (Honeywell, 1997) “A control designed HVAC system can provide a
comfortable environment for occupants, optimize energy cost and consumption.
Automatic controls can optimize HVAC system operation. They can adjust temperatures
and pressures automatically to reduce demand when space are unoccupied and
regulate heating and cooling to provide comfort while limiting energy usage.”

35
(Simpson, 2003) Stated that “lighting control can make a big contribution to energy
saving”. It should be possible to program its operations so that it uses energy in the most
efficient manner. Briefly the automation system will mitigate the energy consumption in
the building.
Normally in the residential building, automation system presents many utilities such as:
the use of control functions in heating systems for optimal regulation of consumption, fire
and combustion controller, room temperature regulators (thermostats), automatic
lighting, cost effectiveness/ saving energy, comfort and convenience, and security.
2.5.4 Structure of building automation and control network
Generally the hierarchical structure of building automation is structured with 5 levels
such as the management level that is the top of the structure, following respectively by
primary control functions, control and regulation, operational system interface and
closing up with assemblies forming the base of the structure(Figure 2.9)
(Merz, et al., 2009), the management level consists of control computer that runs all the
necessary building management programs including logging all events, archiving all
measured readings, and graphically displaying the status of the operational system.
The primary control function and control and regulation level are composed of Direct
Digital Controller (DDC), that is connected to sensors and actuators via wires (twisted
pair). One wire serves to send messages and the other one serves to transmit sensors
signals. The DDC control and regulate the systems.
Figure 2.19The hierarchy structure in the building automations

36
Operational system interface is incorporated in the microcontroller. This device is used
for HVAC control, to regulate the controlled zone temperature by comparing the set
temperature with the controlled zone temperature reading, and then transfers the output
signal via bus to the heater’s in-built electrical actuator.
The assemblies’ level regroups sensors and actuators, valves and other devices.
2.5.5 Energy management functions
Energy management is one of the main objectives of building automation that leads the
systems in building to operate efficiently. The energy management is the operation that
control and manage carefully the use of energy in the building to avoid overconsumption
and misuse of energy in the building.
, energy management most commonly used in Building Automation are:
Payback period
The role of this function is to calculate the reduced building’s operating cost by the
automation system and to predict to period that the investment cost will be covered with
the energy saved by the automation system.
Figure 2.10: A ventilation system displayed on a control computer (Guptan, 2003)
Optimum start/stop

37
Optimum start/stop is an advanced function used at the management level. Optimum
start/stop switches the system on and off according to the users schedules
(Montegomery & Dowell, 2009). Optimum start/stop program on the other hand is self-
regulating and uses outside/inside temperatures and uses the thermal characteristics of
the building to calculate the optimum times to start and to stop the system(Figure 2.19)
Duty cycling
Duty cycling is a function normally relevant to oversized installations. Duty cycling runs
large loads intermittently. In other words, duty cycling shuts down large loads for laps of
time, to avoid the overconsumption.
Figure 2.11: Optimum start/stop (Merz, Hansemann, & Hubner, 2009)
Limiting peak demand
Limiting peak demand program records the amount of electricity consumed over 15
minute periods, then calculate the energy demand for this period (Merz et al, 2009). If
the demand is running faster than the set value of time, the program will switch off
selected large loads for a laps of time till the demand will be running to the conformed
set time. In other words, the load must run up in the same phase with the agreed value
of time. If the demand exceeds the agreed value of time, the program will shut off
selected large loads (Figure 2.12)

38
Figure 2.12: Limit peak load (Merz, Hansemann, & Hubner, 2009).
2.5.6 Main components and devices of building automation system
A control system consists of three basic elements such as a sensor, a controller and a
controlled device. The sensor samples some variable values and send the information of
these values to the controller. The controller compares these values to the set point
value. If the sampled value and the set point are not identical, the controller will act on
the controlled device to adjust these two values.
2.5.6.1 Sensors
The sensors are the hinge device for control system that measure the controlled variable
and send the information to the controller. Without sensor there is no control system.
Sensors are also used for monitoring purposes to keep the operator informed about
elements in the system that indicate proper or improper information ( (CIBSE,
2000).Sensors are categorized in several functions such as sensing element,
transducer, transmitter, active device, passive device and so on.
In the Building automation system, the most commonly used sensors for lighting, HVAC
systems and security applications are: temperature sensors, humidity sensors, pressure
sensors, velocity/flow sensors, airs quality sensors, presence detector, day lighting
detectors, and fire and combustion detectors and forth.
2.5.6.2 Actuators
An actuator is an execution device that acts on output system to stabilize the system by
providing adequate output. (CIBSE, 2000), An actuator responds to the output signal
from a controller and provides the mechanical action to operate the final device, which is
typically a valve or damper in HVAC systems.

39
2.5.6.3 Controller
The Controller serves to get information from the sensor and compare that information
with the set point values. If these two values are not identical that means there are some
disturbances in the system, and the controller will command the actuators to regulate the
system.
2.5.6.4 Direct device controller (DDC)
A DDC is a control operated digital microprocessor. (Montegomery & Dowell, 2009), in a
DDC system, all the inputs and outputs remain: however, they are not processed in the
controllers, but all logic control is carried out in the computer, based on instructions
called the “logic control”. In DDC, all control functions and logic are executed in software.
2.5.7 Standardized bus systems and Networks in building automation systems
In the building automation systems, devices communicate with each other. In the other
words, devices from the same level (Horizontal) transfer information with each other, and
devices from different levels (Vertical) transfer information with each other that allows
performing the automated functions at various levels (Figure 2.13). Sometimes
interference problems occur in the communication system between devices, due to the
transmission of many messages at the same time. In the medium sized administrative
building alone, more than a thousand messages are transferred between the automation
stations of various systems and control computer.
To overcome these problems, the bus system has been established as efficient and
economical solutions. (Merz et al 2009), Recent years, the demand of building
automation system has been increased considerably. That is why several bus systems
from different manufacturers have been injected on the market.
The bus system from different manufacturers on the market came up against the big
problem that is the lack of interoperability. The only way out was that one of the
manufacturers would have to reveal its protocols to others called “open protocol”. Due to
the increasingly complex nature of these systems, the demand for European open
protocol bus systems has risen grammatically (Merz, Hansemann, & Hubner, 2009).
Amongst these many bus systems and networks on the market, only some of them have
been standardized by European Standardization and they are denoted by the letter ENV,
and EN symbolizes European Standard and ISO/IEC. The bus system and networks

40
widely used in the building automation system are: LON technology, KONNEX, BAT/bus,
and EHS bus system. So far BAC net is the only protocol used for data communication
at the management level (Merz et al, 2009).
Figure 2.13: horizontal and vertical communications in building automation model (Merz et
al 2009)
2.5.7.1 Standard bus system
There is several standardized bus systems used in building automation control
communication system. In this work we will focus on some of them such as: KONNEX
(KNX), LON and BACnet).
KONNEX (KNX)
The conventional building installation technology came up against serious predicaments
such as complexity, huge effort and cost of planning, requiring a vast amount of wiring
that lead to fire risk, tough maintenance and so forth. KNX provides the way out from
these predicaments although it requires high investment cost.
(Merz, Hansemann, & Hubner, 2009), KNX is an industrial bus system used in building
control system that enables exchange of message between control devices and connect
devices such as sensors, actuators, controllers, operating thermals and monitors at
lower cabling cost by simplifying the system (Figure 2.14).
KNX is from the European Installation Bus (EIB) that uses diversity of transmission
media such as twisted pair cable (KNX.TB), Power live (KNX.PL) and Radio Frequency
(KNX.RF).

41
In December 2003, KNX has been modified to the perfection by CENELEC as the
European Standard EN50090. And in 2006 a large section of the EN 50090 was
approved for inclusion in the ISO/IEC 14543 (Merz, Hansemann, & Hubner, 2009).
KNX installation requires various kinds of bus devices (Merz, Hansemann, & Hubner,
2009). KNX specialist manufacturers provide lists of products referred in the KNX
catalogue or KNX website. These products are classified in four main groups such as:
system components (power supply units, accumulator, lines couplers, backbone
couplers and so on), sensors, actuators and other devices such as logical component
and control panel.
Figure 2.14: Building control with KNX integrated system, lower cabling cost (CIBSE, 2000)
LONWORK (LON)
LONWORK is an open networking solution for building automation and networks that
was developed by the American Company echelon. Normally LONWORK is a bus
system standardized by ANSI/CEA-709.1-B and ISO/IEC DIS 14908 that allows the
communication between intelligent devices (Simpson, 2003).
LON can be used in both system such as centralized building automation and
decentralized building control component. In the centralized system, all sensors and

42
actuators are directly connected to a central control system whereas decentralized
building automation system, the control functions are in the system. Decentralized
building control is more developed compared to centralized building automation.
LONWORK comprises three groups of components such as: hardware component,
software applications and organizational structures. The basic LON components are:
Neuron chip that is the brain of LONWORK system, LON TALK Protocol that defines
how Neuron chips are programmed for different applications and how they communicate
with each other as nodes in the network, Transceivers is one of the main elements of
each network device, LON WORK Tools.
BACnet
BACnet (building Automation and Control Network) was developed by the ASHREA to
provide communication between devices and system in the building automation. BACnet
improves the interoperability between various automations and components from
different manufacturers in the building automation.
In BACnet, messages are transmitted in various ways such as local area network (LAN)
that is particularly the best way for transporting message, MS/TP that is very simple with
the lower cost however the transfer rate of message is very slow, LONTALK, Ethernet
the more expensive that has been introduced CIRCA 1970 and standardized as IEEE
8023 with the fastest data transfer compared to other protocols, ARCNET and so on.
2.5.7.2 Bus network Topology
The network topology is called media access control protocols and prevents the
transmitted signal from being disrupted if more than one device transmits data at the
same time over a field bus or network (CIBSE, 2000).
In Building automation control, there are some topology the most widely used such as:
Full mesh topology: all devices are connected with each other devices(Figure
2.15a)
Partial topology : only main devices are connected with each other (Figure
2.15b)
Three topology: that consists of many branches connected to the main line called
“backbone line”(Figure 2.17)
Star topology: in the star topology all devices are connected to one node called
“Hub” (Figure2.16)

43
To wrap up with this point, three topologies have been taken as a structure of
conventional building installation. According (Merz, Hansemann, & Hubner, 2009), three
topology has
Nodes (N) that are assigned to a line( L)
Several lines are connected with each other via the main line (ML) and form an
area( A)
Several areas are connected with each other via the back line( BL)
Figure 2.15: Full mesh topology on left side (a) and partial mesh topology on right side (b)
(Merz et all 2009)
Figure 2.16: Star topology (Merz et al 2009)

44
Figure 2.17 tree topology (Merz et al 2009)
With the new technology, full mesh topology is the most widely used in building
automation system because it allows all devices of the system to communicate with each
other.
As a conclusion for building automation system, we notice that building automation
system is the best way for energy management and efficiency, and provides comfort and
convenient indoor atmosphere.
In the second chapter, we did explain on the second category end use of electrical
energy, the following chapter we explained about building energy modeling and the new
modeling language (system modeling language) that we have to use for our model.

45
CHAPTER THREE BUILDING ENERGY MODELING AND SYSTEM MODELING LANGUAGE
3.1 Models and simulations
A model is a representation of our ideas on paper that helps us to understand and to
improve the concept, for this reason a model is used as backup for the conception. In
system engineering, a model is a crucial tool, a hinge for designing process and a
guideline to setup a system design. In other words, a model is a kind of language that
allows the designer to express his design to others. (Holt & Perry, 2008), defines a
model as a simplification of reality. In other words, a model is a simplified representation
of the system, in order to understand the system. A model can be represented in
different ways such as a mathematical model, textual models, physical/practical model,
and visual model.
Moreover, a simulation predicts the behaviour of the system. Model and simulation are
commonly used in all stages of the design process. This is particularly vital to the
success of the systems engineering project where the system under consideration is
complex and involves interactions between many interdisciplinary subsystems. Models
and simulations can be used to refine and optimize a system with respect to the decision
maker’s objectives (Moore & Paredis, 2009). According to (Holt & Perry, 2008), the
complexity of the system, misunderstanding and lack of communication issues are three
evils of engineering systems. In other words these three elements are the main causes
of project failure. So the model and simulation are the best way to eliminate these three
evils.
For the next point we are going to break down system modeling language and giving all
diagrams of system modeling language.
3.2 System Modelling Language (SysML)
3.2.1 Definition of system modeling language
SysML is a general purpose graphical modeling language for specifying, analysing,
designing, and verifying complex systems including hardware, software, personal
information and facilities (Holt & Perry, 2008). SysML is a visual modeling language that
provides semantics and notations. SysML is based on Unified Modeling Language
(UML). In other word SysML is the extension of UML.
A short description: UML is a general-purpose graphical modeling language aimed at
software engines which appeared in 1997 that is originally from the initiative between

46
OMG and INCOSE (OMG, 2003). UML is the strongest and the most used modeling
language in the past in System engineering compared to others modeling languages.
UML was used very successfully for system engineering activities in many application
domains for many years (Holt & Perry, 2008). UML is used to specify visual, modify and
to build necessary support for reliable development of object oriented software. With
UML modeling tools, it is possible to run automatically code.
UML consists of 13 types of diagrams that are divided in two groups such as behavioural
and structural. The structural diagram regroups six diagrams such as class diagram,
package diagram, composite structure diagram, object diagram, component diagram and
deployment diagram. The behavioural regroups seven diagrams such as state machine
diagram, activities diagram, use case diagram, timing diagram and interaction diagram.
To perform weaknesses of UML, several numbers of industries such as BAE, OOSE,
Motorola, Boeing, IBM, universities and INCOSE have been working up to give a reliable
shape to SysML. Now SysML can be used in any field of engineering system.
Figure 3.1 SysML and UML relationship
3.2.2 System Modeling Language diagrams
As we said above, SysML is an extension of UML. That is to say SysML uses most of
UML diagrams (figure 3.1). In fact SysML is not a new modeling language because most
of SysML diagrams are from UML. And we can say SysML is an innovation of UML, in
other words SysML improves some weaknesses of UML. (Holt & Perry, 2008)SysML
adds some new diagrams and constructs not found in UML: the parametric diagram, the
requirement diagram and flow specifications and item flows. SysML defines also new
types of associations (link of dependency stereotypes) such as derive, satisfy, verify and
refine.

47
SysML is constituted of nine types of diagrams, such as: structural diagrams,
behavioural diagrams, and requirement diagram (Figure 3.2). Whereas a structural
diagram regroups: Block Definition Diagram, Internal Block Definition, Package Diagram
and Parametric Diagram. Behavioural diagram regroups: Activity Diagram, Sequence
Diagram, State Machine Diagram and Use Case Diagram.
Figure 3.2: SysML diagrams
3.2.2.1 Bloc Definition diagram (BDD)
The BDD serves to show and to present all components of the system and their
relations. BDD is a kind of system’s black box that enumerates each elements of the
system through blocks. Blocks describe types of things that exist in the system and the
relationship brings to light the links that exist between blocks.
(Holt & Perry, 2008)BDD is made up of one or more “blocks”, zero or more
“relationships”, zero or more “interfaces”, zero or more port and zero or more Items flow.

48
Figure 3.3: Types of property- alternative representations
3.2.2.2 Internal Block Diagram (IBD)
The IBD is called the “white box” because this one describes and digs out the internal
structure of the system. IBD reveals the structure of the system’s heart and describes
how blocks are connected with each other. Normally IBD are used to model the internal
structure of blocks (hence the name) and can also be used to show how the system
elements are deployed (Holt & Perry, 2008).
IBD is composed with one or more “Part”, zero or more “Ports” (Standard port and Flow
port), zero or more connectors. A port enables to define an interaction point for a “Part”.
(Holt & Perry, 2008), a Part can be directly connected to zero or more Ports via building
connectors (Figure 3.4)
3.2.2.3 Package diagram
Package diagram allows structuring the model in everything. Package diagram identifies
diagrams and establishes links between packages. Other diagrams use packages as
well as package diagram.
Package diagram is made up with packages. And each package shows a collection of
diagram elements and implies some sort of ownership (Internet). Figure 3.5 shows a
meta-model of Package Diagram.

49
Figure 3.4: Partial meta-model of the Internal Block Diagram (Holt & Perry, 2008)
Figure 3.5: Partial meta-model for Package Diagram (Holt & Perry, 2008)
3.2.2.4 Parametric Diagram
Parametric diagram refines IBD and enabling to relate the reliability and effectiveness of
the system with constraint blocks. Constraints blocks are mathematical expression to
which the parameters are referred to system’s elements. According to (INCOSE, 2006),
constraints blocks allow for definition and use of networks of constraints that represent
rules that constrain the properties of a system or that define rules that the system must
conform to.
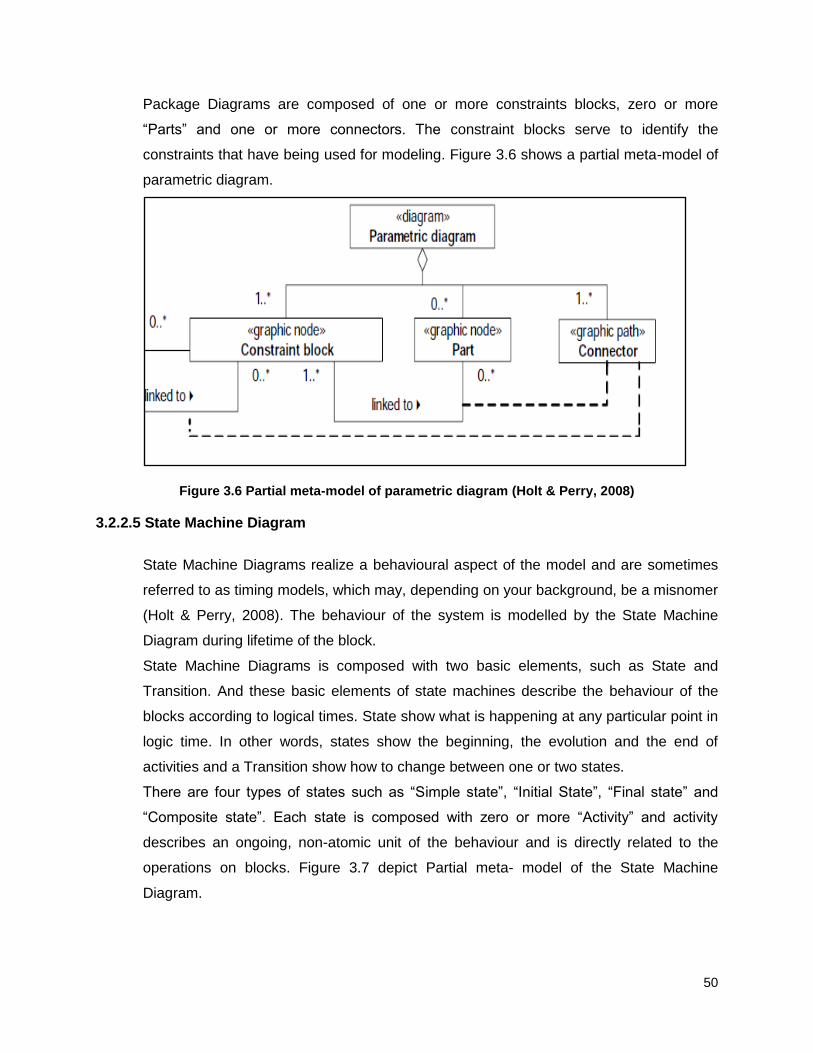
50
Package Diagrams are composed of one or more constraints blocks, zero or more
“Parts” and one or more connectors. The constraint blocks serve to identify the
constraints that have being used for modeling. Figure 3.6 shows a partial meta-model of
parametric diagram.
Figure 3.6 Partial meta-model of parametric diagram (Holt & Perry, 2008)
3.2.2.5 State Machine Diagram
State Machine Diagrams realize a behavioural aspect of the model and are sometimes
referred to as timing models, which may, depending on your background, be a misnomer
(Holt & Perry, 2008). The behaviour of the system is modelled by the State Machine
Diagram during lifetime of the block.
State Machine Diagrams is composed with two basic elements, such as State and
Transition. And these basic elements of state machines describe the behaviour of the
blocks according to logical times. State show what is happening at any particular point in
logic time. In other words, states show the beginning, the evolution and the end of
activities and a Transition show how to change between one or two states.
There are four types of states such as “Simple state”, “Initial State”, “Final state” and
“Composite state”. Each state is composed with zero or more “Activity” and activity
describes an ongoing, non-atomic unit of the behaviour and is directly related to the
operations on blocks. Figure 3.7 depict Partial meta- model of the State Machine
Diagram.
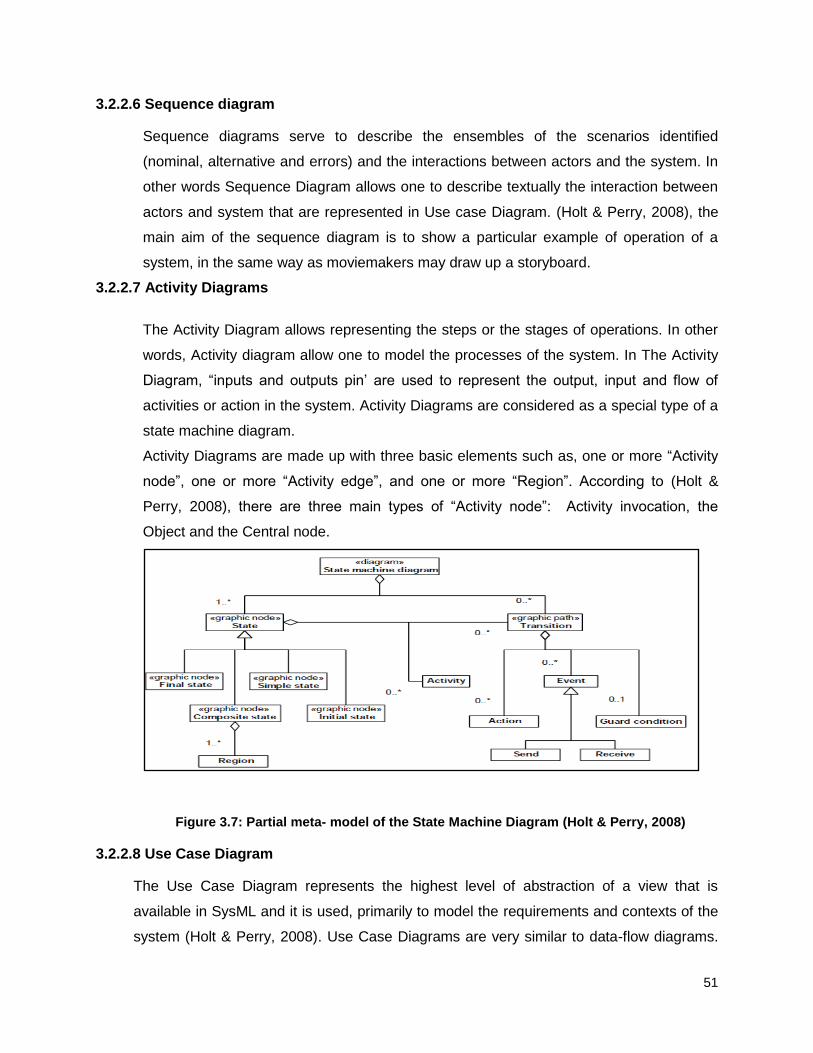
51
3.2.2.6 Sequence diagram
Sequence diagrams serve to describe the ensembles of the scenarios identified
(nominal, alternative and errors) and the interactions between actors and the system. In
other words Sequence Diagram allows one to describe textually the interaction between
actors and system that are represented in Use case Diagram. (Holt & Perry, 2008), the
main aim of the sequence diagram is to show a particular example of operation of a
system, in the same way as moviemakers may draw up a storyboard.
3.2.2.7 Activity Diagrams
The Activity Diagram allows representing the steps or the stages of operations. In other
words, Activity diagram allow one to model the processes of the system. In The Activity
Diagram, “inputs and outputs pin’ are used to represent the output, input and flow of
activities or action in the system. Activity Diagrams are considered as a special type of a
state machine diagram.
Activity Diagrams are made up with three basic elements such as, one or more “Activity
node”, one or more “Activity edge”, and one or more “Region”. According to (Holt &
Perry, 2008), there are three main types of “Activity node”: Activity invocation, the
Object and the Central node.
Figure 3.7: Partial meta- model of the State Machine Diagram (Holt & Perry, 2008)
3.2.2.8 Use Case Diagram
The Use Case Diagram represents the highest level of abstraction of a view that is
available in SysML and it is used, primarily to model the requirements and contexts of the
system (Holt & Perry, 2008). Use Case Diagrams are very similar to data-flow diagrams.

52
Use case (in use case diagram) and processes (in data flow diagram), both their symbols
look the same and are represented by ellipses.
Use Case Diagrams are made up with four basic elements such as: use case, actors,
associations and a system boundary. Where each use case denotes requirements of the
system, an association expresses a very high-level of relationships between two diagram
elements. Figure 3.8depicts the partial meta-model of Use Case Diagrams on the left
side and graphical representation of elements of Use Case Diagram on right side.
Figure 3.8: Partial meta-model of the Activity diagrams
3.2.2.9 Requirement Diagrams
SysML may be used in any field of System engineering. The Requirement Diagrams is
composed with three basic elements: requirements, relationships, and text cases. The
Requirements Diagrams are one of the most important Diagrams in SysML.
Requirement Diagrams are the unavoidable diagrams during the model process in
SysML. Requirements diagram are amongst the innovations of SysML.
Requirement Diagrams are used to describe the requirements of the system.
Requirement Diagrams are used, unsurprisingly to represent the system requirement
that can be related to each other and to the system elements via relationships.
3.2.3 Advantages of system modeling language
SysML presents more advantages compared to other modeling languages such as:
SysML is less complex than other modeling languages.

53
SysML is more flexible and reliable compared to other modeling languages.
SysML demystifies the complexity of the system.
Figure 3.9: Partial meta-model and Graphical representation of elements of Use Case
Diagram (Holt & Perry, 2008)
So far, SysML is the best modeling language and may be applied in any field of
engineering system. The following point, we are going to point out some software tools
of building energy modeling
3.3 Building Energy modelling software
An easy way to solve the energy equations related to a given building environment is to
use a building energy simulation tools. There are computer programs that can simulate a
building and its HVAC systems. The simulations will help us to calculate with accuracy
such as the heating and the cooling loads of the building, as well as the indoor (Preez &
Vameulen, 2011).
For the building energy performance simulation, several programs have been developed.
These energy simulations software tools run series of inputs to calculate heating and
cooling loads, the annual energy consumption and the energy cost for the year. The
54
building energy model forecasts the building energy efficient, and helps to have the
anticipated information that will enable to enhance the building energy efficiency.
For building energy software tools, directory currently list more than four hundred
software tools for evaluating energy efficiency, renewable energy, and sustainability in
the buildings with approximately one hundred and twenty tools just for whole building
energy simulation (Bhandari, 2012).
Amongst the building energy software tools, some have been developed and widely
used for building energy modeling such as: HAP, TRACE, DOE2, TRNSYS, SUNREL,
HOT 2000, energy plus, Blast, and so forth. These software tools were chosen as the
common instruments in the building modeling industry. These programs use different
ways to calculate yearly energy consumption, energy cost.
According to (NREL, 2012), there are four generic types of energy simulation software
tools: screening tools, Architectural Design Tools, Load Calculation and HVAC sizing
tools, and Economic Assessments tools.
Screening tools:
Screening Tools are designed to evaluate project viability during the earliest stages of
programming and often includes some economic analysis capability. They also tend to
be correlation, rather full hourly simulation.
Architectural Design Tools
The architectural design tools are intended to evaluate the relative importance of design
decisions such as building orientation, glazing, and day lighting.
Economic Assessment Tools
Economic Assessment Tools provides comprehensive economic analyses proposed the
building capital investment. The building life cycle cost and pay-back period are obtained
from the economic assessment tools.
Engineering Design Tools/ load Calculation and HVAC sizing
Engineering Design Tools/ load Calculation and HVAC sizing are designed primarily to
calculate the load, to size and to help to select the equipment such as boiler, furnace,
and chiller.

55
3.3.1 Department Of Energy 2 (DOE2)
(OROSA & Oliviera, 2011), DOE 2 is an advanced engineering software that was funded
primarily by the USA DOE to provide a free energy modeling software program. DOE2
was developed by James J Hirsch and associate Lowrence Berkeley National
Laboratory ( LBNL).
Many users’ interfaces have been created for use with the DOE2 engine, including
EQuest. DOE has been extensively validated by comparison with actual measurement
and calculation, so in consequence, DOE 2 is highly recommended by ASHRAE as a
complete energy tools simulation.
With DOE2, the HVAC system must be selected from a handful of traditional system.
Building Loads analysis and System Thermodynamics (BLAST) provides a simulation of
energy consumption, system performance and cost. Blast also computes hourly heating
and cooling loads. Data of building skin may be put from library.
The main advantage of this tool is that it does not consider humidity transfer through the
building skin and the light expertise level is required.
3.3.2 The transient systems simulation (TRNSYS)
The transient systems simulation TRNSYS program was developed by the solar energy
laboratory at the University of Wisconsin in 1975. This program models a building as a
series of elements enabling it to access library of pre-defined components or create their
own component. TRNSYS is a flexible simulation tool that can simulate the transient
performance of thermal energy system (DOE, 2006).
The TRNSYS library of component includes models for many different HVACs systems
for more packed HVAC system, enabling users to model for more systems than are
available in DOE2. Example components include different types of fan and pumps
(including variable speed drive, thermal storage walls, solar thermal collectors,
photovoltaic, heat recovery and much more).
This program requires more details for input. TRNSYS is able to compute indoor
temperature and relative humidity and allows the user to develop and to run the models
of other building component. The TRNSYS is easy to use, widely modeling capabilities
and more accurate than DOE2, although it is more complex than DOE2. TRNSY is very
expensive for that reason it is not more commonly used in industry.
3.3.3 Energy Plus

56
Energy Plus is a building simulation program that builds on the most popular futures and
capabilities of BLAST and DOE 2 (WBDG, 2011). The aim of Energy Plus was to
enhance the weaknesses of BLAST and DOE2. Two important goals were to create a
modular program to allow new systems to be added and to integrate heat from HVAC
system into the building loads calculations (OPEN, 2010).
One of the big advantages of Energy Compared to DOE2 and TRNSYS is that Energy
Plus models loads and system together. With Energy Plus during the load calculation,
the heat going from HVAC equipment is accounted. That can lead load calculation to
accuracy of simulation. Energy Plus contains more accurate models compared to other
programs, such as a slab and basement program to model heat transfer from the
ground. And the big weakness of Energy Plus is that, Energy Plus is more difficult to use
than TRNSYS and DOE2 it locks a GUI.
3.3.4 SUNREL
SUNREL was developed by the Renewable Energy Laboratory (NREL) to model bloods
on small building (OPEN, 2011). The newest version is based only on bloods calculation
with high (?) and it does not calculate energy consumption by the HVAC system
accuracy.
3.3.5 HOT 2000
Hot 2000 were developed by Natural Resources Canada to model energy consumption
of houses (NRC, 2000). HOT 2000 software uses bin method to predict the annual
energy consumption. Bin method is used only for small buildings and private houses not
for commercial building energy consumption. HOT 2000 is very easy to use but it
presents some problems with accuracy.
To wrap up, these software tools are the core of building energy modeling. Each
software tool has its own weaknesses and strengths. Today Energy Plus is the strongest
one, and the USA’s Department of Energy for Energy efficiency and Renewable Energy
is working hard to eliminate the imperfection of Energy plus and updating the new
version.
The second and third chapters were the frame work for literature review. In the following
chapter; we are going to give the overview and the geographic area of the building and
collecting building data that could enable us to make the model. In the fourth chapter we
are going to enumerate some of the main South African norms of building and energy

57
supply provided by South Africa National Standard (SANS), South Africa Building
Standard (SABS), and the national building regulation.

58
CHAPTER FOUR BUILDING INFORMATION
4.1 Building location
The building chosen for our model is the student residential building located in
Stellenbosch, Western Cape, South Africa. The position of the building is influenced by
factors such as the climatic condition and weather in Stellenbosch area. The building
construction and power supply complies with the South Africa norms and code of
construction and power supply elaborated by South Africa National Standard (SANS).
SANS established some codes that classified the group of building according to their
utilities and services. Residential buildings belong to the group E1 to E4, H1 to H5.
South Africa is one of the Sub-Saharan countries that is located in the Southern tip of
the African continent, and shares the border with Namibia, Zimbabwe and Mozambique.
South Africa is bordered by Atlantic Ocean on the West and by the Indian Ocean on the
East.
4.2 Overview on the building’s South Africa norms and codes
To support the Kyoto protocol, South Africa established the energy policy with objective
to: increase the access to affordable energy services, improving energy governance,
stimulating economic development, managing energy, and security supply.
In October 2008, SANS 204 for energy efficiency in the building was been published.
The Department of Mineral and Energy (DME), and Department of Housing gave some
directive of standards. The series of standard SANS 204 have been developed by South
Africa Building Standard (SABS), and inserted into the National Building Regulation
(NBR) to shape a frame for energy efficiency in the building.
In 2007, the Green Building Council of South Africa (GBCSA) launched the Green Star
that is based on assessment of the environmental, performance of the building on the
range of issues including energy, water, and material.
Earlier, the DME and Department of Power and Water (DPW) together gave the initiative
for retrofitting of the building that the objective was to improve the conservation of water
and electricity in public buildings. The DPW is split up into regional offices whereby Cape
Town and Johannesburg entered into the contract with private companies. On the other
hand the Department of Housing and National Home Building Registration Council

59
(NHBRC) together established measures of energy saving which have been
incorporated in the draft of National Norms and Standards. These measures are based
on the ceilings with insulation, internal and external plastering, plastic membrane under
floor, sealing the house at ground level and North-facing roof over long.
However, in the same optic of energy efficiency, some local initiatives were noticed such
as: Cape Town Solar Hot Water System (SHWS), with objective to install the SHWS to
10% of all private households and 10% of all municipal housing by the year 2010.
Johannesburg City Council is motivating and encouraging the designers of new buildings
to improve natural ventilations, SHWS, roof insulation, efficient lights, and timer sensors
on lights.
The SANS established some norms for power supply security and energy efficiency in
the residential buildings such as:
Residential building shall be supplied at standard voltages 230 V single phase
and 230/400V three phases with four wires, and the dead band range +- 10%.
Occupants should not have access to any “live” cables ( SANS 60529/IEC 60529)
Earth leakage protection shall be used as an additional protective measure.
Building installation must have disconnecting devices that will enable the
installation to be disconnected for maintenance, testing, fault detection and repair.
Building distribution board must be protected against corrosion and any point of a
distribution board shall not exceed a height of two meter above the floor or
walking level or out of reach of infant.
Bus bar, the current density of copper bus bars shall not exceed 2A/mm2 for
current 1600A. The size and the design of the bus bar system shall be
appropriate to the prospective short-circuit current that could occur at the supply
terminals of the distribution board.
Building Installation Standard Color Coding shall be respected, i.e. red, yellow,
and blue or L1, L2 and L3 shall be used to identify the phase bus bars,
green/yellow for the earthling, and black for the neutral bus bar.
Roof, walls and floor shall be constructed tightly and firmly to minimize air
leakage.
Solar water heating system shall comply with SANS 1307 and the Hot Water
System usage shall be minimized, the tank shall be installed with exposed pipes
to and from the hot water tank, these pipes must be insulated.

60
The HVAC shall comply with the relevant national legislation. The set point
temperature of the heating and cooling space shall range between 200 Celsius
and 240 Celsius.
4.2.1 Building envelope and South Africa norms
Building envelope is the physical separator between the indoor and exterior environment
of a building (Kadlubowski & Yates, 2009). As explained above the building envelope is
the biggest factor of heating and cooling loads, therefore several strategies have been
applied to improve the R-value that could decrease U-value. U-value is a measure of
the heat transmission through a building envelope (thermal transmittance), while R-value
is a thermal resistance of a component.
The South African energy police emphasized that the new norms established by SANS
and SABS for building envelope concerning U-value, R-value and solar heat gain
coefficient (SHGC). According to SANS, the building envelope and any opening such as
windows and doors in the external fabric shall be constructed to minimize air leakage.
Caulking or adding skirting, architraves, or cornices methods maybe applied for building
sealing.
In the optic to overcome the SHGC problems, SANS highlighted that the building
construction should be compact with the rooms that are most used and the major Areas
of glazing placed on the northern side of the building to allow solar heat to penetrate the
space during winter season.
In our work, we did point out some major recent norms and codes that SANS and SABS
established in 2011 regarding the building envelope, we are going to enumerate some of
them, such as:
Buildings shall use insulation glazing
The total U-values and Solar Heat Gain Coefficient (SHGC) shall be assessed for
the combined effect of the glass and frame. The measurement shall comply with
(NFRC).
A roof assembly shall achieve the minimum total R-value specified in table 4.1 for
the direction of heat flow according to the climate zone.
The metal sheeting type of roofing assembly construction shall achieve the
minimum total R-value as specified in table 4.2.
U-value and SHGC values, in accordance with table (4.3 worse-case glazing),
shall be used unless these values are supplied by the glazing manufactures as

61
verified in accordance with ASTMC 1199 and ISO 9050 for U-values, and given
in NFRC 100 for SHGC values.
Floor, the under floor heating system shall be insulated underneath the slab with
insulation that has a minimum R-value.
Non masonry wall shall achieve a minimum total R-value
All fenestration air infiltration shall be in accordance with SANS 613
A seal to restrict air leakage shall be fitted to each edge of an external door and
other opening components.
Table 4.1: Minimum total R-value of roof assemblies (SANS, 2011)
Table 4.2: metal sheeting roof assemblies (SANS, 2011)

62
Table 4.3 Worst-case whole glazing element performance values (SANS, 2011)
The following part will describe the weather for the Western Cape precisely Stellenbosch
where the building is located.
4.2.2 Climate and weather data
The climate in South Africa ranges from desert and semi-desert in the north-west of the
country to Sub-tropical in the eastern coastline. The rainy season for most of the country
is in the summer. In the Western Cape, rains come in the winter, and part of the Eastern
Cape, (Portfolio, 2014). Figure 4.1 depicts climatic zone map of South Africa and table
4.4 shows the locations of big towns and provinces in such zones.
Stellenbosch is located in Western Cape and is influenced by the Western Cape climatic
conditions. The Western Cape is located in (zone 4) as illustrated by table 4.4 which
means Stellenbosch is located in (Zone 4). The Western Cape is crossed by
Mediterranean climate. Summer season is warm and dry with high intensity of sunshine,
and the temperature ranges between 170C and 400C. Winter season is cold and wet; the
temperature ranges between 3 0C to 100C. Figure 4.2 describes the monthly weather
data of Western Cape.
South Africa is one of the countries that experience a huge amount sun shine. The sun
shines throughout the year, the peak intensity of the sun reaches 1KW and the average

63
solar radiation level ranges between 4,5 KW to 6KW/m2 per day. South Africa is in good
position to use solar energy as a renewable source of energy for others alternatives.
Figure 4.1:Climatic zones of South Africa (SANS, 2012)
Table 4.4 Location of South Africa big Towns and Provinces in such zone
4.3 Building presentation
In order to model the energy for our building we will describe the characteristics and give
details of the building that could enable us to make an accurate model. Table 4.5 and
4.6 demonstrate the building information that could be used as input for the model.
According to the SANS norms and code, this building belongs to the group H3 and is
influenced by zone 4 climatic conditions.

64
Table 4.5: Building information
Building information( data)
Type of building H3 ( Residential)
Building location and
outdoor conditions
Location Stellenbosch/W Cape
Climatic
zone
Zone 4
Latitude 33,90 South
Longitude 18.530 East
Elevation
Outdoor conditions
temperature
Cooling
temperature
400C db
330C wb
Heating
temperature
70C
Volumetric air flow rate 4m/s
Humidity ratio Wi=0.0093KgW/Kgda
Wo=0.0159KgW/Kgda
Indoor design conditions Indoor comfortable or
designed temperature and
relative humidity
Cooling 230C
50%RH
Heating 210C
30% RH
Building Envelope Windows with single
glass plat without internal
shading thickness 3m
U-value 5.7
R-value 0.173
SGHC 0.13
External walls U-value 0.52
R-value 1.9
Roof Assembly U-value 0.27
R-value 3.7
Ground-slabs U-value 1
R-value 1

65
Table 4.6: Building Size and form
Building size
External walls North 336m2
East 67.2m2
West 67.2m2
South 336m2
Windows 81m2
Roof area 312 m2
Floors area 312 m2
Building total walls area 709 m2
Building capacity 30 People/ two per apartment
Building form Rectangular
The U value and R value standards of the building envelop established by SANS, are
based on the climatic zone map illustrated by figure 4.1. According to SANS, in the
climatic zone 4 in which is located our building, wall shall achieve minimum R-value
1.9m2.K/W, a roof assembly 3.7, a floor minimum value of R required by SANS is 1, and
for the window with Timber/PV Cu/Aluminum framing U-value required is 5.6 W/m2K
single-clear and 3 W/m2.K double clear.
The indoor design conditions were normalized by ASHAREA, which are reliable,
comfortable, and convenient to the building occupant’s health. That is to say 230 Celsius
and 50% Relative Humidity for cooling in the summer season, and 210 Celsius and 30%
Relative Humidity for heating during the winter season.
Table 4.5 and 4.6 describe information of the building which could help as for the
modeling and simulation. According to the building information, our building complies
with SANS requirements regarding the building envelope and the energy supply.

66
4.4 Building systems structure
4.4.1 Building energy End Uses and structure of automation system in the building
Figure 4.2: Building energy end uses for residential building in South Africa
The block diagram Figure 4.3 describes the repartition of energy end uses in the building
from the energy supply, over the automation system (control system) to HVAC system,
lighting system, hot water system and daily appliances. The block building represents
residential building in which the energy is used. Block energy consumption represents
the total energy used in kilowatt-hours by the end users.
The block diagrams Figure 4.4 represents the hierarchy structure of automation system
for energy management in the building, in which all devices are connected with each
other through buses. Computer workstation (Human Interface Device) is placed on the
top that serves to program the building systems according the energy management, to
display graphically the behaviours and instability of the systems, to display and locate
faults, errors and failures that occur in the systems.
Direct Digital Controller (DDC) is used as controllers for energy end uses and normally
all the DDCs must be mounted in a control cabinet.
67
DDC1 serve to control and switching on/off lighting system by mean of actuators 1
according the information got from S1. S1 represent detectors that control the motions in
the control rooms and outdoor’s daylight/darkness.
DDC2 serves to control, to regulate HVAC system and to enable the whole system to
operate automatically. S2 represent sensors that measure the temperature in the control
rooms and send information to DDC2. DDC2 activates actuators, actuators 2 open and
close valves and ventilation flaps to reach the set- point temperature desired by the
users or shut on/off HVAC system when they are needed or not.
DDC3 serves to control hot water systems; it switches on/off electrical geyser (hot water
system) through actuators 3 at specific times and according to the availability of hot
water from the solar hot water system. S3 represent sensors that measure the
temperature of water from the electrical geyser tanks and solar geyser tanks to send the
message to DDC3.
DDC4 serves for energy management and security; it powers down the energy supply
through actuators when unsteadiness occurs in the systems or if there occurs unsecure
problems such as fire, smoke and others problems. S4 represent fire and smoke
detectors linked to alarms. DDCS 4 serves as well to shut down selected large loads if
the demand is about to exceed the set point peak load according the period.
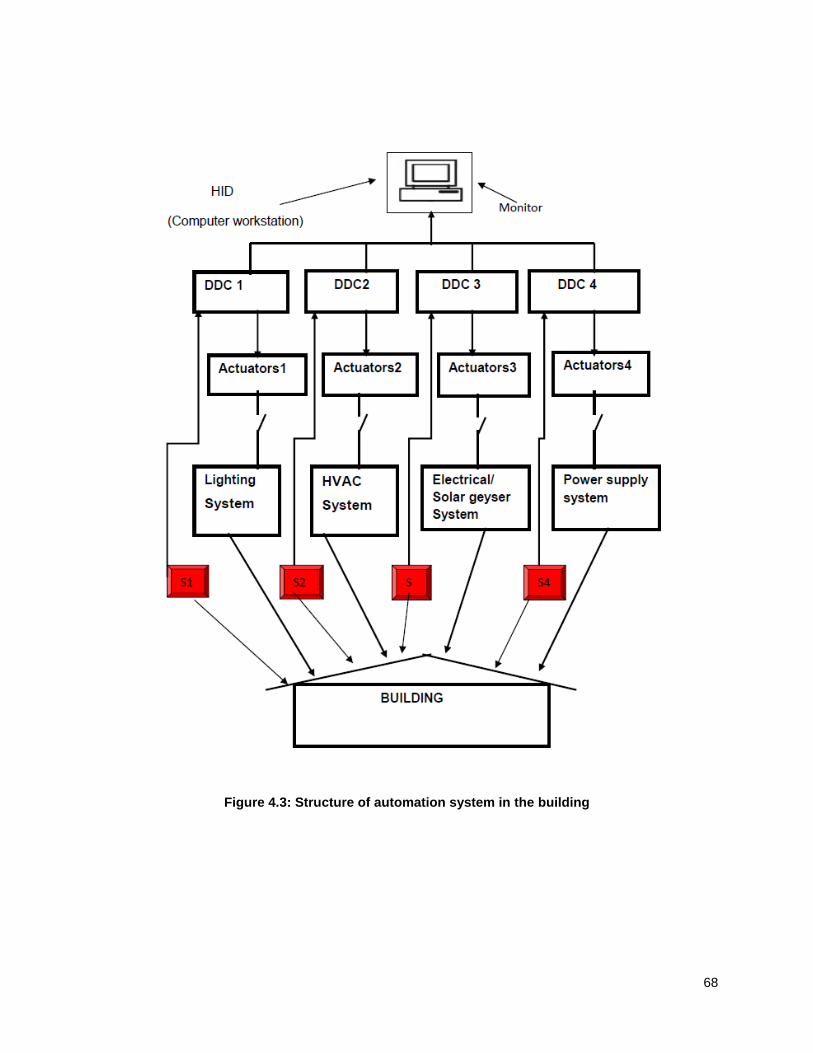
68
Figure 4.3: Structure of automation system in the building

69
4.4.2 Electrical plugs loads
In residential buildings, electrical plugs loads are set up for daily appliances such as:
cooking, washing, cleaning, and entertaining devices, refrigeration system and forth.
Those daily appliances are used intermittently as facilities to make the lives of building’s
occupants easy and more comfortable. These facilities are out of automation system
control and are used according to the schedules of building’s occupants. Some of
appliances such as: TV, oven, kettle, toaster, microwave and computer are used every
day intermittently for the shot duration. Other appliances such as: vacuum cleaner, floor
polisher, washing machine, tumble drier, frying pan and printer are used once a week
sometimes once in two weeks. Regarding the fridge, it is on twenty-four hours with an
automatic break of one to two hours.
According to the occupants of the building (students), during the weekdays they use
most of appliances in the morning from 06:00 to 09:00 and in the evening from 18:00 to
21:00, and during the weekends and public holidays from 07:00 to 09:00, from 11:00 to
14:00, and from 18:00 to 21:00. Regarding washing and cleaning appliances, these are
mostly used only during the weekends, especially on Saturdays.
Table 4.7 describes data of energy consumption for one apartment. Column one on the
left side enumerates appliances mostly used by most of residents in the building, the
second column denotes the wattage ratio (WR) measured in kilowatt for each appliance,
the third column expresses total daily operating period(DOP) of each appliance
measured per hour, the fourth column expresses total monthly operating period(MOP)
measured per hour, the fifth column presents the monthly total energy consumption for
each appliance(MEC) measured in kilowatt-hour, sixth column expresses total yearly
operating period(YOP) , seventh column denotes the nominal total energy consumed by
each appliances per year(YEC), and eighth column expresses the average total energy
consumed by each appliance per year(Av-YEC) measured per kilowatt-hour.
The values illustrated by the seventh column are called nominal, because some of those
values are not accurate compared to real life and our experimentations. These values
are obtained by calculations from the electrical power of appliance, while some
appliances are not using their maximal electrical power to work. Let us analyze the
fridge, the fridge uses maximal electrical power only if the load reaches the peak level,
but for residential applications, the fridge uses only the half or 2/3 of its maximal
electrical power, because fridge is not often filled completely. Moreover the fridge uses

70
the maximal power during summer and less power in winter, whereas the kettle, oven,
heater and geyser use maximal power in cold season and minimal power in hot season.
Table 4.7: Overview of yearly average energy consumption by daily appliances in the residential building
Appliances WR
in
[KW]
DOP
in
[h]
MOP in
[h]
MEC
in
[KWh]
YOP
in [h]
YEC in
[KWh]
AvYEC
[KWh]
Fridge 0.6 20 600 360 7200 4320 2160
TV 0.1 4 120 12 1440 144 100
Hi Fi 0.1 6 180 18 2160 216 180
Vacuum 0.6 _ 4 2.4 4.8 28.8 25
Floor Polisher 0.4 _ 4 1.6 48 19.2 16
Washing
machine
2 _ 8 16 96 192 150
Tumble drier 3 _ 8 24 96 288 250
Oven 3 4 120 360 1440 4320 4000
Microwave 1.5 0.5 15 22.5 180 270 250
Kettle 2 0.5 15 30 180 360 330
Toaster 1.1 0.2 6 6.6 72 79.2 70
Frying pan 1.5 0.5 15 22.5 180 270 250
Computer 0.2 6 180 36 2160 432 400
Total yearly energy consumption of all daily household
appliances for one apartment regrouping two occupants
10939.2 8181

71
CHAPTER FIVE BUILDING ENERGY MODELING AND SIMULATIONS
5.1 Building and systems structure
In South Africa, some residential buildings are made up of apartments commonly called
“flats” and most of these flats are made up of one, two or three bedrooms, kitchen and
sitting-room more often in mono-block, toilet and bathroom in mono-block as well.
Our building is composed of apartments (flats); each flat has two bedrooms, one kitchen,
one sitting-room and one bathroom. The building chosen for our model has 15 flats with
5 flats each on the ground floor, first floor and second floor.
Figure 5.1: Block Definition Diagram for the overall residential building
To simplify the model, we made a break down all of the flats in one block, and the
building will be considered as a simple box made-up with walls, roofs, ceiling, windows,
doors basements and floors.
Figure 5.1 is a block definition diagram (BDD) of the overall building structure that
illustrates the overview of the building structure. The BDD in Figure 5.1 describes the
building skin such as; (walls, windows, ceiling, doors, roof, basement and floors), the
building zones (toilet, sitting room, kitchen and bedrooms), and the building technology

72
or energy end uses in the building such as; lighting system, HVAC system, hot water
system, automation system and daily appliances. The number below each zone block
represents the amount of zones for the complete building.
Figure 5.2: Requirement diagram for residential building in South Africa that describe the structures of building requirements to meet energy efficiency
Figure 5.2 is the requirements diagram of residential building. This requirements
diagram enumerates the structure of requirements that our building shall comply with to
provide safety, security, comfort, and convenience to building’s occupants at low energy
consumption. This requirement diagram is based on the requirements of:
SANS, SABS and South Africa national energy supplier in order to respect the
South African norms and standards that are based on energy efficiency, safety,
security and convenience of the users of buildings.
The building’s occupants in order to satisfy their needs to be in a comfortable
environment.

73
Structure of the building to respect and satisfy the requirements of both SANS /
SABS and the occupants of the building.

74
Figure 5.3: Requirements diagram for building‘s structure that define the main requirement of energy efficiency

75
Figure 5.3 is the requirements diagram that defines the requirements enumerated by the
requirements diagram Figure 5.2, and describes the requirements of the building’s
structure. The first block child 02 and its derivatives blocks in the requirements diagram
define the requirement of SANS and SABS that the building shall comply with. We did
not enumerate all those SANS requirements in the requirement diagram because it is
long list consist of several pages. These norms and requirements can be obtained at
SABS standards division all versions.
According SANS and SABS, the building envelope shall comply with SANS norms to
protect the building against fire, combustion, accident and collapsing of the building.
Glazing of the building shall comply with all requirements of SANS 613, the building
envelope must satisfy all the requirements for compliance with fire protection SANS
101775, the building envelope shall be constructed compactly to minimize heat
invasion/leakage and comply with SANS to meet the minimum U-value and R-value
requirements to mitigate heating and cooling loads. Piping system and ducts of hot water
systems and HVAC systems shall be insulated to minimize heat evasion.
The second block child 01 with its derivative blocks on the right side in the requirements
diagram define the requirements of the building to make occupants’ lives more
comfortable and convenient by using low consumption of energy. These requirements
are the main requirements of the building such as: block 011 the building’s system must
provide hot water for bathing, dishes and cleaning by using solar geysers as the main
source of energy and electrical geyser as backup source, block 012 buildings system
must provide lighting by using CFL and LED bulb, block 013 the buildings system must
provide the indoor air quality and comfortable temperature in the controlled rooms of the
building by using heat pump, and block 014 ‘the building systems must be controlled by
automation system to enable energy management. These are in concise the main
requirements that the building must comply with to provide safety, security, convenience
and comfort to the occupants with low energy consumption. In the following point, we are
going to define and model the energy end use of the building.
Figure 54 is the domain model diagram that illustrates the structure of the model by
enumerating elements represented by blocks. Energy end use represents the energy
end use of the building that are controlled by automation system to provide comfort and

76
convenience to the occupants of building, at the same time automation system manages
energy provided by power supply. SANS/SABS establish rules and norms of the building
structure and energy end use, metering measures the energy consumed by energy end
use, solar geyser supplies hot water to the building, weather conditions exchange heat
with the building and supply solar geyser with solar heat energy and the building is hinge
of the modeling.

77
Figure 5.4: Domain Model

78
Figure 5.5: Block definition Diagram for building’s structure

79
Figure 5.6: Block Definition Diagram of Energy End Use in the residential building

80
5.1.1 Residential building End Uses
Energy End Uses of the building are systems that provide more desired services to the
building occupants per unit of energy, these systems transform unit of electrical energy
supplied by the source to other desired energies or works by the building’s occupants.
Energy End Uses is made-up and set-up for the building to satisfy the main
requirements of the building described in the requirement diagrams Figure 5.3. Figure
5.6 is Block definition Diagram that describes Energy End-Use of the building such as:
HVAC system, lighting system, Hot Water system, Automation system and appliances.
These are the devices that consume electrical energy in the residential building.
Figure 5.7: Internal Block Diagram of Energy end Uses
5.1.1.1 Automation system
The energy end use automation system facilitates the execution of the main
requirements for the control of the building’s systems to work adequately and for energy
management. Figure 5.8 is a requirement diagram of the automation system that defines
the functional requirements of the building’s systems to optimize energy management
and provide comfort, convenience and security to the building’s occupants as block
parent mentioned in the requirement diagram. These requirements are used as the input

81
of the automation system’s program, the building systems must work according to these
requirements.
The first block child defines kind of bulbs (lights) that lighting system must use to
mitigate the consumption of energy by the lighting system. CFL and LED are the more
efficient lights and very competitive to new technology. Buildings require at least 80% of
the total lights to use CFL and LED.
The second block child defines the requirements of energy management by the
automation system. The automation system must limit the peak energy demand to avoid
the overconsumption of energy. The automation system is required to shut down power
supply if the systems do not respect the main requirements of the systems such as: the
use of CFL or LED, the USE of heat pump for HVAC system, the use in parallel solar
geyser and electrical geyser. The automation system is required to shut down power
supply and activating alarms in case of fire and combustion.
The third block child defines that the automation system is required to control the hot
water system; the automation system must shut on/off electrical geyser according to the
scheduled time, and shut off the electrical geyser when the solar geyser can provide hot
water.
The fourth block child defines that the automation system is required to adjust the
temperature in the controlled rooms. The building occupants shall be able to control the
temperature. The requirements described in the diagram are main requirements for the
automation system.
Figure 5.9 is the Block Definition Diagram (BDD) of the automation system that
describes different components of automation system and the relation to it. In the block
definition diagram, block automation system is represented as block parent, and blocks
child represent automation systems parts, and related systems. Block child DDCs that
represents the DDCs of automation system, contains blocks child as well such:
detectors, actuators, transducers, sensors, timer and valves. The second block child is
workstation computer, and other blocks child represent the related if the automation
system such as: HVAC system, Power supply system, solar hot water system, lighting
system and electrical hot water system.
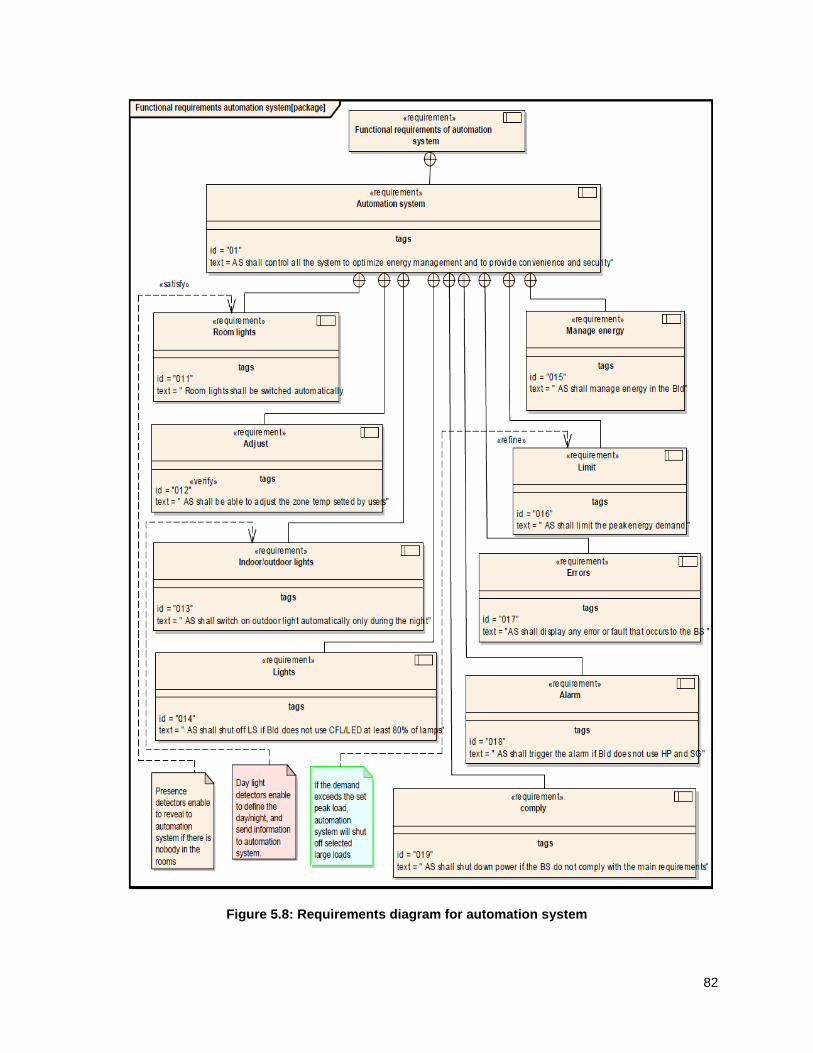
82
Figure 5.8: Requirements diagram for automation system

83
Figure 5.10 is the internal block diagram of automation system that describes the
automation system parts represented by blocks, and each block contains flow ports that
are connected to their related systems to allow the flow of energy, information, signals
and commands. Block controller regroups DDCs of the system, DDCs are the central
stations (Hub) of the automation system, and the automation system devices are
connected with each other through DDCs. Block controller is the decision element that
carries out the standards stored in the program. DDCs receive analogy information from
sensing elements, transform them to digital data and compare them with the standard
data programmed by the computer station. If there are some discrepancies, DDCs
energize and command the appropriate actuators to stabilize the concerned system.
Each building system has its own DDC which they are dealing with.
Figure 5.9: Block Definition Diagram automation system’s structure
Block sensing devices regroups sensors, transducers that collect data such as
temperature, humidity, motion, daylight, light level, motion, fire, smoke level or state
(such as on, off, open, closed and others) from the controlled zones and send them to
DDCs through buses.

84
Block acting devices regroups actuators and transducers that receive commands from
DDCs and act on slaves devices to perform the controlled devices. Slave devices may
consist of valves, switches, circuit breakers to control the flow of energy, water air, and
others matter. Block controlled devices regroups the systems of the building such as
lighting system, Heating ventilation and air condition system, hot water system, and
power supply that are controlled by automation system.
Figure 5.10: Internal Block Diagram of automation system and connectors describes the flow of items in the system
5.1.1.2 Lighting system
Lighting system in the residential building is required to work efficiently in a convenient
and secure way to reach our targets. That is why requirements were established, and
the building must comply with requirements.
Figure 5.11 is the requirement diagram of lighting system that describes the
requirements of lighting system. The block parent in the requirements diagram of lighting
system provides requirements, which enable the lighting system to operate adequately
and efficiently.

85
The first block child on the left side is the requirement emphasized previously by the
main building requirements diagram to optimize the consumption of energy by lighting
system.
The second block child and its derivative blocks on the left side in the requirement
diagram describe the requirement according to SANS and SABS which lighting system
must comply with. SANS 10400/10399-1 established some standards and norms for the
sake of building occupants. These norms are based on security, perfect light and other
good reasons. The first derivative block of SANS requirements “light switches shall be
horizontal aligned with door handles” is established to allowing disabled occupants to be
able to switch on/off lights manually. The second derivative block of SANS requirements
emphasizes the level of light illumination to perform the eyesight of occupants.
The third block child requires that lighting system must be controlled by automation
system. Indoor lights must be switched on/off manually or automatically to avoid
untimely use of lights, and outdoor lights must be on during the night and off during the
day, these states are controlled by day light detectors for outdoor lights and presence
detectors for indoor lights.
The fourth block child defines the main requirements “Lighting system shall provide
lighting to the indoor and outdoor of building” as we said in the previous chapter that
“light is an indispensable part of our lives, because the light is the mainstay of eye and
eyesight.
Figure 5.12 is the block definition diagram of lighting system that defines the main
components of lighting system and its relevant devices represented by blocks. Indoor
lights are made up with 75 LED or CFL lamps. Each lamp belongs to a zone and each
lamp has got its own switch. Presence detectors are installed in each controlled room.

86
Figure 5.11: Requirement diagram of lighting system that describes main requirements to perform lighting system

87
Figure 5.12: Block Definition Diagram of lighting system that describes the main elements of lighting system
5.1.1.3 Hot water system
Hot water system is an indispensable system to the residential building according to the
South African norms of residential building. Hot water system is required to residential
building for bathing, washing dishes, cleaning and washing clothes during cold season.
That is why the hot water system is one of the main requirements.
Hot water system is one of the big consumers of electrical energy in the residential
building; therefore some requirements are set up to meet energy efficiency. Figure 5.13
is the requirement block of hot water system that describes the main requirements to
mitigate the consumption of electrical energy by hot water system.
The first block child of parent block HWS requires that hot water must be available from
06.00 to 19.00, because the probability for need of hot water during this period could be
very high. The automation system must activate the hot water system during that period.
The next block child requires that a solar geyser must be installed to the building, and
the derivative block requires that the solar geyser will be the main source of hot water.
Setting up a solar geyser contributes a lot to the energy efficiency policy. If a solar
geyser is not able to supply hot water, the electrical geyser can take over. In that case
automation system will be shifting the state on/off of electrical geyser. That means once
the cylinder water starts getting cold and the temperature reaches set point value,
automation system will be shutting on the electrical geyser for two hours.

88
Figure 5.13: Requirements diagram for hot water system that describe the main requirements to hot water system
The following block child explains that temperature sensors are required for hot water
system, to collect the temperature of water in the cylinders of solar and electrical
geysers and send$ the information to automation system.
Figure 5.14 is the Block Definition Diagram (BDD) of hot water system describing main
parts of hot water system and its relation. Hot water system comprises; solar geyser and
electrical geyser, water supply system, temperature sensors, controller and timer. Solar
hot water system is made up of a piping system, cylinder (tank), and solar thermal

89
collectors. Electrical geyser is made up of a furnace cylinder, piping system, and power
supply.
Figure 5.14: Block Definition Diagram describing main parts of hot water system
Figure 5.15 is Internal Block Diagram (IBD) of water system describing items flow. The
block environment regroups source of energy such electrical energy, cold water and
solar energy. Block technology regroups collectors, sensors and cylinder for solar
geyser, and furnace/cylinder and temperature sensors for electrical geysers. The block
building regroups building hot water taps. Regarding solar geyser, weather condition is
the main source of energy that supplies solar radiations to the solar thermal collectors, at
the same time the water supply system provides cold water to the thermal collector;
thermal collectors transform solar radiations to heat energy, next collectors warm up
water supplied by water supply system, and supply hot water to the cylinder. Once water
is needed the cylinder supplies hot water to the taps.
Regarding electrical geyser, water supply system supplies cold water to the cylinder and
power supply supplies electrical energy to the furnace, next the furnace heats the water
and supplies the building taps with hot water as and when needed.
Temperature sensors collect the temperature of water in the cylinders of solar and
electrical geysers, and send the information to the DDC. If a solar geyser is operating,
DDC energizes actuators to close electrical geyser piping and open solar geyser piping.

90
If an electrical geyser is operating, DDC energizes actuators to close solar geyser piping
through valves and open electrical geyser piping.
5.1.1.4 Heating Ventilating and Air Conditioning system (HVAC)
To keep building’s occupants healthy, the indoor climatic conditions of the building are
required to be convenient and comfortable. That is why HVAC system is required for the
residential building. To prevent the overconsumption of energy, some requirements are
established to which HVAC system must comply.
Figure 5.15: Internal Block Diagram of hot water system describing energy and matter flow
Figure 5.16 is the requirements diagram enumerating main requirements to which HVAC
system shall comply to provide desired Indoor Air Quality (IAQ), safety and energy
efficiency objectives. The first block child, requires that HVAC system must comply with
SANS and SABS requirements. According to SANS and SABS, piping and ducts of
HVAC system shall be insulated to minimize heat evasion that could increase heating
load, and HVAC system shall be chosen and sized according to the heating and cooling
loads.

91
The following block child gives the standards temperature and relative humidity in the
hot and cold season that the HVAC system shall be able to provide in the way to keep
indoor climatic conditions comfortable and convenient.
The next block child requires that HVAC system shall be controlled by automation
system to provide the temperature that occupants want at the same time to enable the
energy management. The derivative block child requires that HVAC system shall use
only heat Pump to perform energy efficiency objective.
Figure 5.17 is the Block Definition diagram that depicts the structure of HVAC system
and its related system represented by blocks. HVAC is made up with heat pump that is
connected to the automation system. Heat pump is made up with evaporator,
condenser, refrigerant, compressor and expansion valve as main components, and air
handling system which is made up with dumper, air filter valves, ducts, and diffusers.
The related part or automation system is made up with transducer, DDC, actuators,
valves, timer, temperature sensors, and thermostat.
Figure 5.18 is the internal block diagram that depicts through blocks different elements
of HVAC system, its related system, and connectors that express the flow of information,
energy commands and others items. The connector between heat pump and power
supply is cabling that allow the flow of electrical energy supplied to heat pump.
The connectors between heat pump, air handling system, environment, and controlled
rooms are ducts through which air and heat flow. If heat is needed in the controlled
rooms, the heat pump absorbs heat from outdoor and supplies to the controlled rooms
through air handling system ducts.
The connectors between temperature sensors and DDC are buses that enable
temperature sensors to transfer information (temperature values) collected from the
controlled rooms and send them to DDC.
The connector between DDC and thermostat, are buses that transfer the message from
thermostat to DDC. The building’s occupants set the desired temperature in the
controlled rooms by mean of thermostats, and thermostats send analog signals to DDC.
The connectors between actuators and DDC are buses that allow DDC to energize
actuators. That means DDC compares data furnished by temperature sensors and
thermostats, if they do not match, DDC energize actuators to perform the system.
The connectors between actuators and valves enable actuators to act on valves,
switches to control the flow of air, heat, and electrical energy at the same time to control
and reverse the flow of refrigerant in the heat pump.

92
Figure 5.16: Requirements diagram of HVAC system enumerating main requirements to which HVAC shall comply

93
Figure 5.17: Block definition diagram of HVAC system that describes the main components of HVAC system
Figure 5.18: Internal Block Diagram of HVAC system that depicts the structure of HVAC
system and the items flows

94
The connecters between compressor, condenser, evaporator and expansion valve, are
piping in which the refrigerant flow. This system is reversible, that is to say, when the
refrigerant flows in one direction, the system supplies heat in the controlled zones
(heating), and when the direction of the refrigerant reverses, automatically the
evaporator and the condenser shift, and the system shifts as well to the cooling phase
by removing heat from the controlled zones.
5.2 Behaviour of Building’s system
Figure 5.19 is the diagram used that describes the building’s systems and their services
provided to the building occupant by means of electrical energy. Blocks child enumerate
the building’s devices or building’s energy end uses. Each energy end use and its task
are linked with each other, and services are linked to the automation system as
described in the diagram. The building occupant is the centre of each activity and task.
Figure 5.20 is the activity diagram of the building energy showing the flow process of
energy and items through blocks and connectors. In the environment block, energy grid
block represent the power supply that is the main source of building energy to supply the
building’s system with electrical energy. Weather conditions block represents the sunny
season in summer, when the intensity of solar radiations reaches the peak level and
solar radiation intrude into the building through the building envelope (solar heat gain), at
the same time solar radiation is supplied to the solar geyser through the collectors to
heat water. The Block atmosphere represents the outdoor atmosphere in the winter
season when the outdoor atmosphere absorbs heat from indoor atmosphere through the
building envelope (heat losses). The Building technology block regroups energy end
uses or building’s system that transform the input electrical energy to output services
desired by the building ‘occupants’.
Figure 5.21 is the activity diagram of the hot water system that is working according to
the automation system program; all systems are controlled by timers and sensors.
According to the building’s occupants hot water must be available from 5 am to 8 pm.
Later during the night around 7 pm, timers send signals to DDC to switch off electrical
geysers if they were on. Earlier in the morning around 4 am, timers send signal the DDC,
DDC switches on electrical geysers for each apartment during two hours from 4 am to 6
am.
From 7 am to 7 pm, sensors keep on measuring the water’s temperature of Solar
Geysers (SGW) and send data to DDC. DDC compares the set point temperature (650
Celsius) with the sampled temperature. If the sampled temperature is higher than set
95
point temperature, DDC switches off electrical geysers and solar geyser (SGW) starts
supplying hot water till the water’s temperature of SGW drops to less than the set point
temperature. When the temperature of solar geyser’s water becomes less then set point
temperature, DDC keep shifting on and off electrical geysers for each apartment till 7
pm. If the temperature of SGW is less than the set point temperature, DDC start shifting
on and off the electrical geysers till 7 pm. When the temperature of water becomes less
than set point, DDC switches on electrical geysers. At the same times sensors keep
measuring the temperature of solar geysers. If the temperature reaches set point
temperature, DDC switches on electrical geysers and the cycle continues.
Figure 5.22 is the activity diagram of lighting system that is made up with two branches,
that is to say indoor lights and outdoor lights connected to the automation system as
explained previously and described by structural diagrams. For indoor lights, presence
detectors keep controlling the rooms and send signals to DDC, if any controlled room is
occupied, DDC switches on lights of the occupied room, and if any controlled room is
unoccupied, DDC switches off lights of the unoccupied room. For outdoor lights, daylight
sensors send information to the DDC, if daylight is available, DDC switches off outdoor
lights, and if the daylight is not available, DDC switches on outdoor lights through
actuators.
Figure 5.23 is the activity diagram of automation system program based on the main
requirements of energy end uses in order to meet energy efficiency with these large
consumers of energy. The automation system controls through sensors and detectors if;
lighting system is using CFL or LED at least 80% of the all lights, Hot water system is
using solar geyser as the main source of hot water and if the system is using HP for
cooling and heating according to the program. If these requirements are satisfied that
means the system is steady and the system performs task continuously, if these
requirements are not respected, the system will trigger the alarm and displays the matter
to the monitor of the computer workstation by defining it.
To wrap up, point 5.2 was the overview of behavioural diagrams that defines the
behaviours of the building’s systems, energy flow and automation system. These activity
diagrams can be used through the software to generate codes of the system. The
following point is the heating and cooling loads calculation and simulations to predict
heating and cooling loads.

96
Figure 5.19: Use Case diagram that describe building’s energy end use with their services required by the building occupant

97
Figure 5.20: Activity diagram of energy and items flow into the building with connectors describing items and matter flow

98
Figure 5.21: Activity diagram of hot water system working according to automation system
Hot water taps

99
Figure 5.22 Activity diagram of automated lighting system

100
Figure 5.23: Activity diagram of automation system describing the automation’s program based on the main energy efficiency
requirements

101
5.3 Heating and cooling loads calculation and simulations
The selection of HVAC system goes through many steps in the designing process that is
based on the right-sizing of HVAC equipments. Right-sizing the HVAC system begins
with an accurate understanding of the heating and cooling loads on a space, and it is
selecting HVAC equipments and designing the air distribution system to meet the
accurate prediction of heating and cooling loads in the building (Burdick, 2011).
Heating and cooling loads are the amount of heat needed to be added or removed
respectively from the space to provide a comfortable temperature within a space.
Heating and cooling loads are the big factors are ones of the previous decisive steps
during the designing process. (Burdick, 2011), explains that heating and cooling loads
calculation result will have a direct impact on the first construction cost along with the
operating energy efficiency. Figure 5.24 describes different steps to collect the building
information for a successful selection of HVAC system.
Figure 5.24: Different steps to right-size HVAC System
5.3.1 Cooling loads
The peak cooling load is the peak amount of heat in the building, which must be
removed by the HVAC system to keep the comfortable indoor temperature, it comprises
sensible and latent heat gain. The cooling load is made up with external, internal and
ventilation loads, as internal block definition describes on Figure 5.27. The internal load
is the heat from electrical devices (lights, oven, toaster etc...) and people. The ventilation
load is the load from HVAC system.
Determine the weather conditions
Select HVAC system
Determine data of building’senvelope
Determine the building’s form, utility and size
Calculate heating and cooling loads

102
5.3.1.1 Empirical methods for estimating external cooling load
The external load is the heat intruded through the building envelope in the building from
the outdoor environment. That heat is from solar radiation that gets into the building
through the external walls, roof, door, floor and fenestration (windows). Different
empirical methods were used for estimating heating and cooling loads.
Empirical methods developed some equations for estimating the solar radiations that go
through the fenestration or transparent surface such as the glass for windows. According
to the empirical estimations, the amount of solar radiations passing through the
transparent surface is expressed as:
where Qsg is the heat passing through the material, A is the area of the surface exposed
to solar radiations, It is the total radiation incidence on the surface, N is the fraction of
absorbed radiation transferred to the indoor by conduction and convection, is the
transmittivity of glass for direct diffused and reflected radiations, is the absortivity of
glass for direct diffuse and reflected radiations. Under steady state condition, the fraction
of absorbed radiation transferred to indoor is expressed as:
Where U is the overall heat transfer coefficient and ho is the external heat transfer
coefficient. By combining equations 5.4 and 5.5, the heat passing through the glass is
expressed as:
For a single sheet clear window glass, the term in square brackets is called as Solar
Heat Gain Factor, (Kharagpur, 2008). To other buildings, the solar radiation incident on a
glazed window is considerably reduced by using external shading. The external shading
reduces the area of the window exposed to solar radiation, and thereby reducing the
heat transmission into the building. The most widely used for providing external shading

103
is the overhangs. Thus for the building with external shading, the solar radiation passing
through the fenestration is given by:
Where Aunshaded is the unshaded surface of the window, SC is the shading coefficient, x
and y are the width and the height respectively of the no shaded area of the window that
vary according to the solar geometry at any location at a particular instant. Thus x and y
are given by:
Where W is width of the inset window, H is the height of the inset window, d is the depth
of the inset window, is the altitude angle and α is the wall solar azimuth angle.
Previous equations were developed to calculate the solar radiation transmitted into the
building through the window glazing, the following equations are developed to calculate
solar radiation transmitted into the building through fabric heat gain. Fabric heat gain
includes sensible heat transfer through the wall, floor, roof etc…, but that does not
include radiation heat transfer through fenestration.
The fabric heat transfer is assumed to be steady if the indoor and outdoor conditions do
not vary with time. The fabric heat gain/loss is assumed to be one-dimensional if the
thickness of the building wall is small compared to the other two dimensions (Burdick,
2011).External wall is the big factor of fabric heat gain.
In general, there are two types of external walls, homogenous and non-homogenous
walls. Heat transfer rate per unit area Qin of homogenous wall under steady state is
expressed as:
Where qc/o, and qr/o are the convective and radiation transfer of heat to outer surface of
the wall from outside, and qc/I and qr,i are the convective and radiation transfers of heat to

104
the inner surface of the wall into inside. The liberalized radiation heat transfer rate per
unit area is expressed as:
W/m^2 (5.8)
Where To and Ti are the outdoor and indoor temperature, Tw,o and Tw,I are the outer and
inner surface temperature of the wall respectively, and ho and hi are the outer and inner
heat transfer coefficients or surface conductance. Using the resistance networking
methods, the surface conductance ho and hi are given as:
Where hc,I and hr,I are convective and radioactive inner heat transfer coefficients
respectively, and hc,o and hr,o are convective and radioactive outer heat transfer
coefficients respectively.
If the values of the surface temperature of the wall (Tw,I and Tw,o) are neglected or zero,
the steady state heat transfer rate per unit area of the wall is calculated by taking into
account only overall heat transfer, and the indoor and outdoor temperature. In this case
the heat transfer is given as:
The overall heat transfer coefficient is given by:
Where and are thickness and thermal conductivity of the wall respectively.
In South Africa, the walls of some buildings are non-homogenous, multi-layered and
non-isotropic. Non-homogenous wall, heat transfer implicates simultaneous heat transfer

105
by convection, radiation and conduction. As result, the heat transfer network Q is
comprises paths, parallel and series, and it is given as:
Where C is the thermal conductance, which values have been tabularized and
normalized by ASHRAE.
In South Africa, some buildings consists of air spaces between walls, it is used to
provide effective insulation against heat transfer. In such a case, the heat transfer rate
through the spaces is liable to its width, surface emissivity of the wall surface and the
temperature difference between the two surfaces. The heat transfer rate per unit area is
expressed as:
In order to reduce considerably the U-value, other buildings are built-up with composite
walls multilayered and non-homogenous material combining insulating material and air
spaces. In this case the heat transfer rate is mathematically expressed as:
Where total heat resistance is given as:
To wrap-up, these previous calculations are used to calculate the heat transfer through
the wall. In the same case of fabric heat transfer, regarding the floor, roof and the door,
the heat transfer is obtained by using the equations applied previously for homogenous
walls. Those methods used previously to calculate the heat transfer through the building
envelope are very complex and with the possibility of inaccurate values. To overcome
these problems, ASHARAE suggests other versatile and laconic methods for predicting
heating and cooling load with accuracy.

106
5.3.1.2 ASHAREA methods for estimation heating and cooling load
The methods suggested by ASHARAE for estimating cooling and heating load, are
mostly used for residential and commercial buildings. Thus for estimating cooling and
heating loads of large commercial and institutional building, more accurate methods
have been developed, but those methods are very expensive and consume time to
process.
For cooling load calculation, ASHARAE methods are using Solar Heat Gain Coefficient
(SHGC), Cooling Load Temperature Difference (CLTD) and Cooling Load Factor (CLF)
for standard building envelope. CLTD, SHGC and CLF are tabularized and found in
ASHAREA handbooks. ASHAREA methods classified cooling loads (QCOL) in three
categories such as: external cooling load (QEXT), internal cooling load (QINT), load from
infiltration and ventilation (QINF). Total cooling loads is given as:
(5.17)
External cooling load comprises solar heat gain through fenestration area (QFES),
conductive heat gain through fenestration area (QFE), conductive heat gain through
external walls area (QW), conductive heat gain through roof (QR), and conduction heat
transfer through floor area (QFL) as described by figure 5.26. Thus external cooling load
is given by:
Whereas solar heat gain through fenestration area (QFES) is expressed as:
Where Aunshaded is the unshaded area of window glasses, Ashaded is the shaded area of
the window glasses, SHGF is the solar heat gain factor, and SC is the solar coefficient.
Conductive heat gain through fenestration area (QFE), conductive heat gain through
walls (QW) and conductive heat gain through roof (QR) are given as:

107
Where Q represents conductive heat gain through the matter such as: window, roof, wall
as well, A represents the area of the matter, U represents the overall thermal
transmittance of the matter, and CLTD is the cooling load temperature different.
Conductive heat through floor area is expressed as:
Where A is the area of the floor, U is the overall heat transfer of floor, Tb is the adjacent
temperature and Ti is the indoor temperature. This is the overall external cooling load,
the next point expresses the internal cooling load.
Internal cooling load is the heat released by lights, appliances and the occupants divided
in sensible heat gain and latent heat gain. QINT is obtained by summing heat released by
lights, people and the appliances, as shown by block definition diagram Figure 5.28, and
it is mathematically expressed as:
Where QLIT is the heat released by lights, QPEOP are sensible and latent heats released
by people and, QAPPL is sensible and latent heats released by appliances. Lights release
sensible heat only. Sensible heat gain from lights is given as:
(5.23)
Where Input is the total light wattage obtained from the ratings of all fixtures installed,
Fuse is use factor defined as the ratio wattage in use possibly at design conditions
installation conditions. Occupants of the building as human beings release heat QPEOP in
the building which is divided in sensible heat gain (QSP) and latent heat gain (QLP) and it
is expressed as:
Whereas sensible and latent heat gain from people are expressed as:

108
(5.26)
Where n is number of people in the conditioned room, SHG is sensible heat gain from
people, LHG is latent heat gain from building’s occupants and CLF is cooling load factor
for people. Heat gain released by appliances is mathematically expressed as:
(5.27)
Figure 5.25: BDD diagram that describe total cooling load

109
Figure 5.26: BDD diagram total external cooling load or solar heat gain
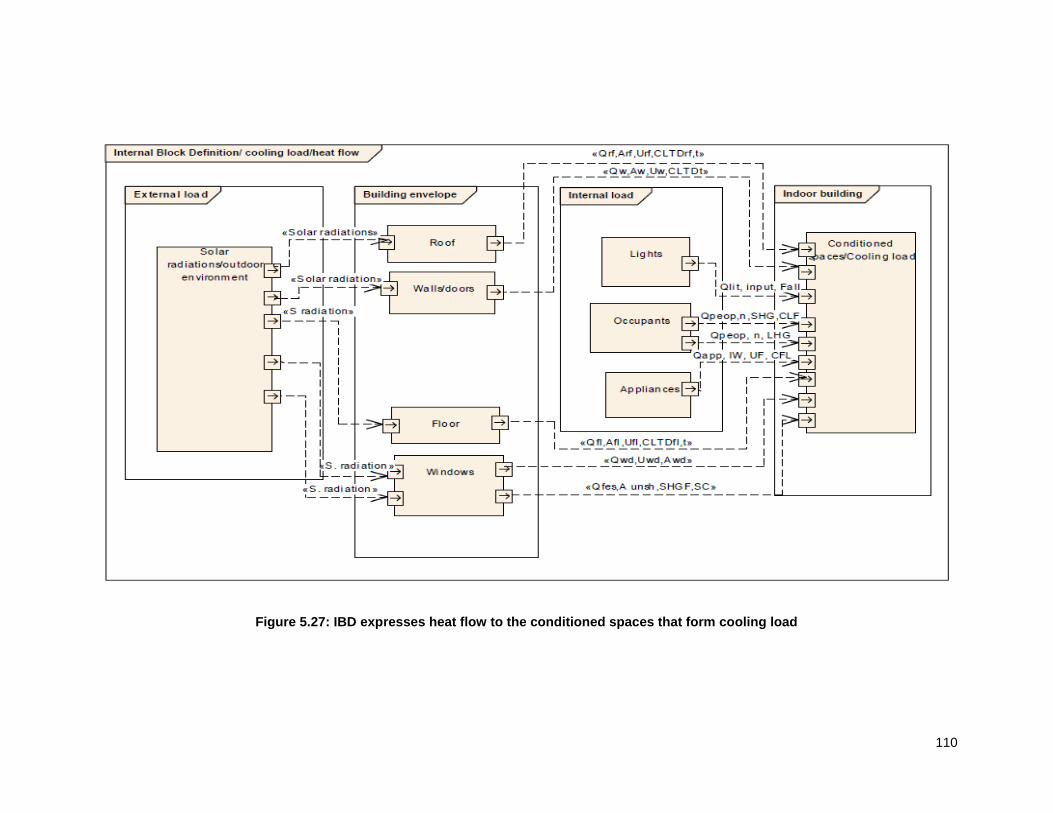
110
Figure 5.27: IBD expresses heat flow to the conditioned spaces that form cooling load

111
Figure 5.28: BDD diagram of internal cooling load

112
Figure 5.25 is a block definition diagram that defines constraints block of total
cooling load which is made up with external and internal loads. In this case
infiltration load is assumed insignificant. Figure 5.26 is a block definition diagram
defining constraints blocks of total external cooling load which is made up with solar
heat gain through external walls, roof, floor and windows. Figure 5.28 is a block
definition diagram that describes the constraint blocks of internal cooling load from
indoor lights, people and appliances.
Figure 5.29 and 5.30 are packages of block definition diagram of external and
internal loads respectively, which contain constraint blocks that defines expected
characteristics of the cooling load. Each constraint block enables to stock data and
the behavior of the systems through editor scripts. The top section of each shows
the attribute or data elements, and the lower section display the parameters of the
data.
In the package of bdd in the figure 5.29, the constraint blocks “walls cooling load
constraint block, window’s cooling load, roof cooling load, solar heat gain through
floor and cooling load of fenestration” store data (equations) of heat gain through
external walls, windows, roof, floor and solar heat infiltration respectively, in which
scripts (equation) are sampled from 5.26, and are edited in java language. The
constraints block “total Qext” stores equation of total external cooling load that sums
solar heat gain through external walls, roof, floor and fenestrations. Constraint
blocks CLTDs store data of CLTDs of walls, window, roof, and floor respectively in
function of the time. Scripts of CLTDs are edited in matrix form with times of the day
from 1hour to 24hours.
In the package bdd internal cooling load figure 5.30, Constraints blocks “People
cooling load, appliance cooling load and light cooling load” store data or equations
of heat generated by building’s occupants, appliances and lights respectively. The
equations of scripts are pickup from figure 5.28. Designation in lower section of
each constraint blocks are the parameters of the scripts edited in each constraint
block. Constraint block “Total internal load” the script is the summation of all internal
loads.
Figure 5.31 is the simulatable parametric model of peak cooling load that describes
the behavior of cooling load according to day time. Boundary property “input”
regroups input parameters which their data values and designation are described by
table 5.8. Boundary output regroups the output of the simulation in which, the

113
external cooling load (Qext), the Internal cooling load (Qint) and the main output
total cooling load (Qcool) are located. Input and output boundaries are linked by
connectors via constraint property blocks in which defined constraint blocks are
reloaded. Constraint property block receives the input data from input boundary,
operates according to the scripts (Code) of constraint blocks and plots the output.
Constraint property block is the main mechanism of the simulation which enables
simulations.
Blocks “wall, window, roof, floor and Qfes”, between input and output boundaries
are constraint properties in which the constraint blocks “walls cooling load constraint
block, window’s cooling load, roof cooling load, solar heat gain through floor and
cooling load of fenestration” are reloaded to simulate solar heat gain through the
building envelope.
Figure 5.29: BDD showing constraint blocks for external cooling load

114
Figure 5.30: BDD showing constraint blocks for internal cooling load

115
Figure 5.31: Parametric model for simulating total cooling loads for the building
n

116
Table 5.8: Series of Data base used as input in the Figure 5.31 for cooling load
simulation

117
Block constraint properties CLTDs in which the input are the time of the day and
output the variable CLTDs in function of day time that were tabularized by
ASHAREA. The blocks “Qpeop, Qlit, and Qappl” are constraint property blocks
which the simulation mechanisms are set up with equations of cooling load
generated by people, lights and appliances respectively. Q extconstraint property
block is the mechanism for simulating external load.
Table 5.8 describes the number of data collected from the building used as input for
simulations, which may be to set to the parametric model Figure 5.31, in order to
simulate cooling and heating loads. With that parametric model figure 5.31 it is
possible to simulate the load of each building’s element such external wall, roof,
floor, and windows cooling loads. Regarding building’s elements, for our
experimentations we did simulate only the external walls, windows and external
cooling loads. In the Figure shown below, are the results obtained from cooling load
simulations.
Figure 5.32: Solar heat gains through fenestration or windows cooling loads
simulation

118
Figure 5.33: Solar heat gains through external walls, daily cooling load of external
walls
According to the result got from simulation about total solar heat gains through
fenestration as shown in Figure 5.32. It is noticeable that the peak cooling load of
fenestration occurs almost at the same time with the peak intensity of solar
radiation at noon. That means, glazed surface transfers solar heat directly into the
building by conductive, convection and radiation. By analyzing the behavior of
windows face to solar radiation as sown in Figure 5.32, the glazed surface
transfers directly a big portion of solar heat into the building, reflects back small
portion and the glass absorbs the remaining portion which will be released into the
building later at sunset. Later around midnight when it is cold outside, the glass
absorbs heat from indoor and releases it outdoor. Windows contribute significantly
to the heating load; proper design of fenestration can reduce heat transfer, as
resulting in the decreasing of the cooling load.

119
Figure 5.34: Total external cooling load that is the sum of heat gains through roof, floor
and total heat gains through external walls and fenestration
Figure 5.35: Peak total daily cooling load of the building simulation’s result
Figure 5.34 is the result of simulation for total solar heat gains through external
walls and door. By analyzing the behaviour of the external walls concerning solar
heat gain transfer, the peak load does not occur at the same time with the peak
intensity of solar radiation. If the outdoor temperature is maximal at noon, the
indoor temperature reaches the peak sometime in the evening. That is due to the
time that heat takes to cross the compact bricks of the walls, that time is called
“time lag”.

120
Figure 5.34 is the total external cooling load, however, Figure 5.35 is the total daily
cooling load of the building that the lowest load occurs around 5am to 7am, and the
load reaches the peak around 6pm to 8pm. By analyzing total daily external load
and total cooling load obtained from simulations as shown in Figures 5.34 and
5.35 respectively, both loads are influenced by effect of time lag. According to the
results got from simulations of cooling load, the cooling load of the building is about
74 W/m2.
5.3.2 Heating load
The peak heating load is the sum of peak heat lost to the outdoor environment at
design outdoor and indoor conditions, which must be made up by the HVACs
system to provide comfortable indoor temperature and IAQ for occupants. The
total estimated heat loss is a combination of the sensible heat loss through
conduction, infiltration and ventilation loads, (Burdick, 2011). In this stage the
solar gain and the heat produced by internal devices are not taken into account,
because those two factors contribute to the reduction of heating loads. The losses
occur through building’s envelope such as; exposed walls, roof ceiling, basement
floors, windows, doors, attic new walls and bellow grade walls.
The heat loss that creates heating load is made up with heat transmission losses
through the confining building envelope and the infiltrations through cracks and
openings such as doors and windows.
5.3.2.1 The heat transmission
Heat transmission loss is the heat loss by conduction and convection transfer
through any surface of the building envelope (walls, windows, roof, ceiling and
basement floor) as described by internal block definition diagram heat
loss/heating load calculation Figure 5.39. The total heat loss is mathematically
given by:
Where Q is the heat transfer through wall, window, roof ceiling and floor, A is the
surface area U is heat transfer coefficient for any surface of the building envelope
, Ti is the indoor temperature and To is the outdoor temperature.

121
5.3.2.2 Infiltration loss
The heat loss due to infiltration is divided into sensible and latent losses. The
sensible loss is expressed as:
Where Qsb is the infiltration loss, V is volumetric air flow rate, Cpa specific heat
capacity of air at constant pressure. The latent loss is expressed as:
Where Qla, is latent loss, Vis volumetric air flow rate,Wi is the humidity ratio of
indoor air and Wo is the humidity ratio of outdoor air.
Normally heat loss due to infiltration is the entry into the building of uncontrolled
cold and dry wind through cracks in envelopes of the building, opened doors and
windows. That means the internal environment (hotter) exchanges the
temperature with the external environment (colder).
Total heat loss is the sum of total heat loss through the external walls, total heat
loss through windows, heat loss through the roof and heat loss through the floor.
Figure 5.36 is the bdd of total heat loss that expresses mathematically through
constraint blocks total heat loss or total heating load, where as figure 5.39 is the
internal block diagram of heat loss or heating load that explain through blocks and
connectors the heat flow from the HVAC system that provides heat into the
conditioned space of the building during the cold season, the heat escapes from
the inside of the building through the roof, floor, external walls and windows.
The total heat loss through external walls is the sum of conductive heat loss
through walls and doors, total sensible and latent heat loss through cracks and
opened doors. The constraint blocks in block definition diagram of heat loss
through external walls Figure 5.37, express mathematically the total heat loss
through external walls. Regarding heat loss through windows, it is made up with
conductive heat loss through windows, total sensible and latent heat loss through
opened windows, as described mathematically on bdd total heat loss through
windows as shown in Figure 5.38.

122
Figure 5.36: Block Definition Diagram of total heating loads

123
Figure 5.37: Block Definition Diagram of total heat loss through external walls and doors

124
Figure 5.38: Block Definition Diagram of heat loss through windows

125
Figure 5.39: Ibd describes heat loss through the building envelope

126
For heating load simulation, the same methods as cooling load simulations have been
used. That is to say the same parametric model has been used as cooling load simulation,
but the CLTDs have been replaced by the different temperature between the indoor
temperature and the outdoor temperature, in the input boundary the input data blocks of
cooling load have been replaced by the input data blocks of heating load, constraint
blocks of cooling load have been replaced by constraint blocks of heating load, which are
reloaded in the constraint property blocks of heating load’s parametric model. In the
output boundary, the cooling load output blocks have been replaced by output heating
load. Figures 5.40 and 5.41 shown below are the results of heating load simulations.
Figure 5.40: Total daily heating loads during of the sunny day in winter season
Figure 5.41: Total daily heating load in June and July
For heating load calculations, the internal loads are not taken into account.
Nevertheless the internal heat source contributes to the mitigation of heating load.
Heating loads calculations, heat losses through the building envelope are calculated
by using the same equations used in cooling load calculation processes for heat gain

127
through the building envelope. In such a case CLTD is replaced by design
temperature difference between the conditioned spaces and outdoor.
For heating load, simulations have been based on two days sampled from winter
season. Data of the first simulation have been sampled from the sunny day when
winter is not to heavy, and the data of the second simulation shown in Figure 5.41
have been sampled from worst case day when the temperature drops to the lowest
temperature of winter period especially in June and in July. In the sunny day, heating
load decreases as shown in Figure 5.40. For the sunny day, the decreasing of the
load is due to the solar heat gain; moreover the dip load occurs in the evening around
6pm to 7pm because of the time lag of solar heat gain. For a cloudy day in Figure
5.41 the load is higher during the night and lower during the day, because generally
in winter the outdoor temperature drops during the night. According to the simulation,
the average heating load of the building is about 110W/m2.;
5.4 Lighting system load simulations
As explained previously, lighting system contributes significantly to the building
energy consumption. After the investigation about lighting system to the building’s
occupants, we have noticed that most of building occupants are using incandescent
lamps for indoor lighting, which the wattage ranges between 75W to 100W, and some
of occupants fail to manage light utilization.
Figure 5.42 is the block definition diagram that describes constraint block which could
allow to calculate and to simulate lighting system loads. Table 5.9 describes the
attribute of no-automated building’s lighting system in which occupants are using
incandescent lamps. Tables 5.9 and 5.10 describe the characteristic of no-automated
and automated building’s lighting systems. In automated building only LEDs or CFLs
have been used, and the daily ratio of operating. Figures 5.43; 5.44; 5.45; 5.46; and
5.47, are the results of lighting system load’s simulations.

128
Figure 5.42: BDD describing constraint blocks of lighting system

129
Table 5.9: Description of lighting systems’ characteristics, and the ratio of working per
hour to no automated building
Time of the
day
Outdoor lights ratio of
operation in percentage
per hour
Indoor lights ratio of
operation in percentage
per hour
Number of lights: 30 Number of lights: 75
Wattage :40W Wattage: 75 W
1hour 100% 10%
2hour 100% 10%
3hour 100% 10%
4hour 100% 10%
5hour 100% 10%
6hour 100% 10%
7hour 0% 20%
8hour 0% 20%
9hour 0% 20%
10hour 0% 20%
11hour 0% 20%
12hour 0% 20%
13hour 0% 20%
14hour 0% 20%
15hour 0% 20%
16hour 0% 20%
17hour 0% 20%
18hour 100% 100%
19hour 100% 100%
20hour 100% 100%
21hour 100% 100%
22hour 100% 100%
23hour 100% 10%
24 hour 100% 10%

130
Table 5.10: Describes lighting system characteristics, and ratio of operating to
automated building using compact fluorescent lamps
Time of the
day
Outdoor lights ratio of
operation in percentage
per hour
Indoor lights ratio of
operation in percentage
per hour
Number of lights: 30 Number of lights: 150
Wattage :40W Wattage: 11 W
1hour 100% 10%
2hour 100% 10%
3hour 100% 10%
4hour 100% 10%
5hour 100% 10%
6hour 100% 10%
7hour 0% 0%
8hour 0% 0%
9hour 0% 0%
10hour 0% 0%
11hour 0% 0%
12hour 0% 0%
13hour 0% 0%
14hour 0% 0%
15hour 0% 0%
16hour 0% 0%
17hour 0% 0%
18hour 100% 100%
19hour 100% 100%
20hour 100% 100%
21hour 100% 100%
22hour 100% 100%
23hour 100% 10%
24 hour 100% 10%

131
Figure 5.43: Daily loads of outdoor lights connected to the daylight detectors
Figure 5.43 is the load of outdoor light of no-automated building, from 7am to 5pm
lights are off the load is nil, and from 6pm to 6am during the night lights are on the
load is maximal. The system is using Fluorescent Lamps of 40W. The outdoor light
sub-system is linked to the day light detectors.
Figure 5.44: Daily loads of indoor lights for no-automated building using incandescent
lamps
Figure 5.44 is the load of indoor lights of no-automated building using incandescent
lamps. By analyzing the shape of the curve, it is noticeable that the load is maximal
from 6pm to 10pm when occupants are seated, and working, from 11pm to 6am the
load is minimal because occupants are sleeping some of them switch off all
apartment lights. From 6am to 5pm the load raises a bite, because occupant wake up
and switch on some lights, in order to get ready to go out for their daily activities
(school and work). According to the investigation, most of the occupants forget to
switch off lights when they are rushing to go out. That is why the load is permanent.

132
Figure 5.45: Daily loads of indoor lights for of automated building using CLFs
lamps
Figure 5.45 is the load of indoor lights of the automated building using CFLs. The
indoor light is controlled by automation system. From 8am when the occupants leave
the building for their daily activities, automation system switch off all indoor lights and
the load becomes nil. We assume that everybody leaves the building during the day.
The load is maximal from 6pm to 10pm when everybody is back in the evening, and it
is assumed that during that time everybody is in the building. The peak loads of
indoor lights reaches 1650 W, however the peak load of no-automated building
reaches 5625 W.
Figure 5.46: Daily total loads of indoor and outdoor lights of non-automated
building
Figure 5.46 is the total light load of a no-automated building using incandescent
lamps for indoor lights and fluorescent lamps for outdoor. The load is maximal when

133
both sub-systems are on from 6pm to 10pm. Figure 5.47 is the total lighting system
load of automated building using CFLs lamps. By analysing the behaviour of both
buildings, that means automated and no-automated, we notice that at the maximal
load, the lighting’s system load of no-automated building, is three times lighting’s
system load of automated building.
Figure 5.47: Total daily lighting system load of automated building
5. 5 Hot water system load simulations
In the first chapter, we have emphasized that hot water system is one of the major
consumers in the residential building. This system must be switched off when hot
water is not need, in order to optimize energy consumption, but most people do not
switch off the geyser when not required. In general an electrical geyser has a
thermostat, which is a device which continuously keeps the water in the geyser at a
specific set point temperature. If the temperature drops below the set temperature,
thermostat activates the heater until the temperature reaches the set point.
The main causes fora drop in temperature is when hot water has been used and the
geyser fills up with cold water, when there is a heat leakage, and when the
temperature of surroundings is lower.
Normally bathing consumes more hot water than showering; bathing uses about 40
liters of water per person, moreover showering uses 25 liters of water per person.
According to the building occupants, they prefer to shower during the weekdays and
bathing during the weekend.

134
Figure 5.48: BDD describing constraint block of hot water system
In winter, electrical geyser of no-automated building consumes more electricity than in
summer. Due to the cold environment, the temperature of water takes more time to
rise to the set point, and the temperature of hot water drop fast. According to the
experimentations, electrical geyser shifts twelve times “on, off, on” and consumes
about 15 to 18 KWh per day for one apartment and 270 KWh per day for the whole
building. However in the automated building, electrical geyser is programmed to work
two times a day or four shifts a day, in the morning before the peak demand time, and
in the evening before the peak demand time. Thus electrical geyser in the automated
building consumes 4 to 6 KWh per day for an apartment and 90KWh per day for the
whole building.
In summer, electrical geyser of no-automated building consumes less energy
because of the hot atmosphere, water gets warm faster than in winter when the
geyser is switched on, and cools off slowly and gradually when the thermostat of the
geyser is shut off. Whereas in the automated building, automation system switches
on the geysers only in the morning, and solar geyser take over for the rest of the time.
Thus in summer, all geysers of no-automated building consume 120 to 135 KWh per
day, and automated building consumes 45 KWh per day.
5.6 Building loads, automated building versus no-automated building
In this stage, we are going to simulate the behavior of the total loads, for the same
building with automation system and solar hot water system, and without automation

135
system in the same weather conditions, in order to compare them. The figures below
are loads of the building obtained from simulations.
Figure 5.49 Daily loads for a no-automated building in winter season
Figure 5.50 Daily loads for automated building in the weekend day of winter
season.
Figure 5.49 is the daily load of the no-automated building in winter season, which the
peak demand occur in the morning from 6 am to 8am when occupants are busy
washing, cooking breakfast and using other facilities to get ready for the routine
activities, and in the evening between 6pm and 8mp. Furthermore large consumers of
energy such as lighting, hot water and HVAC system go “on”. Between 11pm to 4am
and 9am t0 4pm, the load is shifting because of the geysers loads. The permanent
load is due to the devices left “on” unintentionally and the fridges.
Figure 5.51: Daily load of automated building in the weekdays of winter season

136
Figure 5.52: Daily load of no-automated building in summer season
Figure 5.53: Daily load of automated building in summer season
Figure 5.50 is the daily load of the same building with automation system and solar hot
water system. After the peak demand when everybody leaves the building, the
automation system switches off all large consumers and the load drops to permanent
loads, it assumes that there is nobody to the building. Figure 5.51 is the load of
automated building in the weekend day; it assumes those occupants are at home
during the all day. By comparing the daily and monthly energies consumed by
automated building and no-automated building as shown in the table 5.11, the
automated building saves about 717 KWh per day and 23900 KWh per month
Figure 5.52 and 5.53 below, are the daily loads of no-automated and automated
buildings in summer respectively. The peaks loads reach 180000W or 180KW for no-
automated building, and 140000W or 140KW for an automation building. By analysing
the daily shapes of the curves, the energy demand in winter is higher than in summer
season. The energy demand in winter is impacted by the heating load and devices
with heaters.

137
Figure 5.54: Yearly energy consumption of no-automated building
Figure 5.55: Yearly energy consumption of automated building
Figure 5.54 and 5.55 are yearly energy consumption of automated building and no-
automated building respectively. The peak loads of both figures occur in June and
July. That period is the coldest period of the year and affects significantly the peak
demand of energy.
By analysing the results of yearly energy consumption for both buildings as shown in
figures 5.54 and 5.55. The shapes of curves for both figures vary according to the
seasons. That is to say in winter season the consumption is higher than in summer
season.

138
Table 5.4 Description of daily and monthly energy consumptions for automated
building versus no-automated building
Building state
Daily consumption per m
2
Monthly consumption per m
2
Yearly energy consumption per m
2
Yearly energy saving by the entire building
No-automated Building
1.447 KW 43.410 KW 520 KW _
Automated building
0.889 KW 26.670 KW 320 KW 62400KWh
Analysis of energy consumed by automated building versus a no-automated building.
According to the results obtained from simulations, it is obvious that the energy
consumed by no-automated building is much higher than the energy consumed by
automated building. Table 5.4 describes the daily, monthly and yearly energy
consumption for both buildings. The yearly energy consumption of no-automated
building is 162240 KWh and 99840 KWh for automated building. Therefore
automated building will be able to saving about 62400KWh per year.

139
CHAPTER SIX CONCLUSION AND DISCUSSION
6.1 Introduction
As the building energy modeling industry is facing a number of challenges such as
complexity of the advanced methods, lack of accuracy for early design and existing
buildings, this thesis has developed a new model in System Modeling Language
(SysML) to predict annual energy consumption, and determine peak loads, at the
same time set up automation system and solar hot water system to the existing
building in order to meet energy efficiency. To simplify the simulation processes of
cooling and heating loads in SysML, this thesis has opted for a Cooling Load
temperature Different (CLTD) method, because this method is very simple to use and
it is the most popular and widely used.
As SysML is a new modeling language that is very simple and can be used in
Engineering System to overcome modeling challenges. So then this thesis was
excited to deal with building energy modeling in SysML in order to overcome the
energy modeling challenges such as: inaccuracy of heating and cooling load and the
complexity of the system in the modeling processes.
6.2 Aims and objectives
To solve the challenges of inefficiency of energy consumption in the building that
affect climate change, the power supplier as well in South Africa. The project
objectives were to mitigate energy consumption for existing and future buildings by
developing a new energy model with aims:
To provide good designs for future building during the planning process by
targeting and breaking down the main causes of energy over-consumption
To select efficient devices for large consumers of energy
To set-up an automation system to the building for energy management and
to monitor if the building is using efficient devices, in order to meet at the
same time energy efficiency, convenient and comfort environment.
To calculate the accurate cooling and heating load, in order to right-size the
HVAC system.
To set-up to the building other alternatives of energy such as solar energy for
hot water system and lighting system in order to mitigate energy
consumption

140
6.3 Discussion
After analysis and investigation developed by this project, it was concluded that the
overconsumption was created by HVAC, lighting and hot water systems. Moreover,
the consumption of energy by HVAC system is impacted by heating and cooling
loads. The building envelope and building orientation have big impacts on heating
and cooling load for building. Improving R-values of building envelope, and a good
orientation will mitigate significantly heating and cooling loads. It is advised to use
heat pump for HVAC system, however hot water produced by heat pump can be used
for other purposes.
By analysing the results obtained from simulations, automated building is far more
efficient than the no-automated building, and it makes occupants’ life more
comfortable and convenient. The big weakness of automation system is that the
investment cost is very high, that is not affordable for common residential buildings;
however it can be covered in a competitive time or pay-back period.
Solar energy can be another alternative to back-up the power supplier energy using
solar equipment such as solar geyser, solar air conditioning system and tubular
daylighting system will contribute to the high level energy efficiency. South Africa is in
a good position to set up solar devices.
For building energy efficiency, the big targets are HVAC, Lighting and Hot water
systems. Once they are broken down, the building can reach energy efficiency.
Compact Fluorescent lamp for lighting systems and solar geysers for hot water
system contribute significantly to high level energy efficiency for complex buildings.

141
REFFERENCES
America, I.E.S. of N. 1993. Lighting Handbook: Reference & Application. Illuminating Engineering Society of North America.
CIBSE. (2000). Building control system. Woburn: CIBSE.
commission, c. e. (2013). www.consumerenergycenter.org. Retrieved June 12, 2013, from http://www.consumerenergycenter.org/home/heating_cooling/heating_cooling.html
Company, L. C. (1999). Engineering Cook book a handbook for the mechanical designer (2nd edition ed.). Springfield.
Dillon, B., & IBS. (2012, 07 31). Sizing a guide to properly sizing residential equipment. Retrieved 11 21, 2012, from ibsadvisorsill.com: httpP://www.ibsadvisorsllc.com/_libary/residential_sizing
E.Zambolan, & Padoven, A. (2009). Experimental daily energy performance of Flat Plat and Evacuated Tube Collector. Energy Sustainability.
Engineers, C.I. of B.S. 2000. Building Control Systems. Routledge. Friedenthal, S., Moore, A. & Steiner, R. 2014. A Practical Guide to SysML, Third Edition: The Systems
Modeling Language. 3 edition. Morgan Kaufmann.
Grondzik, W. & Furst, R. 2000. HVAC components and systems. Vital Signs Project. http://dualibra.com/wp-content/uploads/2011/06/hvac-big_opt.pdf 31 October 2014.
Guptan, G. W. (2003). HVAC Controls Operation and maitenance. Georgia: Fairmont.
Holt, J., & Perry, S. (2008). System Modeling Language for System Engineering. London.
Honeywell. (1997). Engineering Manual of Automatic Control for Commercial Buildings HVAC.
Hordeski, M. F. (2001). HVAC Control in the New Millenium. Georgia: Fairmont Press.
Janis, R. R., & Tao, W. K. (2005). Mechanical and Electrical system in Buildings (3th edition ed.). New jersey: Pearson.
Jones, W. (2005). Air Conditioning Engineering. Elsevier.
Kharagpur. (2008). Refrigeration and Air Conditioning System.
Kreith, F., & Goswami, D. Y. (2007). Hand bool of Energy Efficiency and Renewable Energy. CRC Press.
licht.wissen. (2012). www.licht.de. Retrieved march 06, 2013, from http://www.licht.de/fileadmin/shop-downloads/lichtwissen01_artificial_light.pdf
Loren, C. C. (1999). Engineering Cook Book.
Manyuchi, L. (2008). Design Guiidelines for Energy efficiency Buildings in Johannesburg. Joburg: CSIR.
Melki, S., & Hayek, M. (2009). Building Simulation Tools and their role in improvig Existing Building Design. IEEE. Lebanon: IEEE.

142
Merz, H., Hansemann, T., & Hubner, C. (2009). Building Automation communication system with EIB/KNX LON and BAcnet. berlin: Springer.
Milford, R. (2009). Greenhouse Gas Emission Baselines and Reduction Potentials from Buildings in South Africa. Sustainable United Nations.
Montegomery, R., & Dowell, R. M. (2009). Fundamentals of HVAC systems. bulington: Elsevier.
Moore, R. A., & Paredis, C. (2009). Model-Based Optimization of a Hydraulic Backhoe using Multi-Atribute Utility Theory. SAE World Congress. atlanta: MBES.
NREL. (2012, 03 8). NREL. Retrieved 06 22, 2013, from http://www.nrel.gov/buildings/energy.analysis.com
NRL. (2012). www.nrel.gov. Retrieved march 08, 2012, from http://www.nrel.gov/building/energy
Parise, G., & Martirano, L. (2009). Impact of Building Automation, control and building mamangement on energy performance of lighting system. Roma: IEEE.
Porges, F. (2001). HVAC Engineering's Hand Book . Wolburn: Elsevier.
Preez, K. D., & Vameulen, H. (2011). Development of an interactive, web, based energy usage applications for residential load. Power engineering. Berlin: IEEE.
Quiston, F. C., Parker, J. D., Spitler, J. D., & J, W. (2005). Heating Ventilatin Air Conditioning analysis and design (6th edition ed.). Jonh wisley and son.
Rajput, R. K. (2007). Engineering Thermodynamics. Doryaganz: LAXMI PuBLICATION.
Rishel, J. B. (2006). HVAC Pump Hand Book. Elsevier.
Ryer, A. (1998). Light Measurement Handbook . Newburyport: International light, Inc.
Simpson, R. S. (2003). Lighting control- Technology and Application.
Wang, Y. a. (2012). optimal control strategy for HVAC system in the building energy management . IEEE.
Wenfa, H., & Wu, T. (2011). assessment in the resident building and case sutdy. (pp. 4860-4866). beijing: IEEE.
Wissen, L. (2010). www.licht.de. Retrieved 4 12, 2012, from licht.wissen: http://www.all-about-light.org/en/publication
Yang, Y., Zhu, Q., Maosoumy, & Sangiovanni, A. (2012). Development of Building Automation and control system. IEEE. California: IEEE.
Zhan, H., Xia, X. .., & Zhang, J. (2009). A residentail energy and power conservation system utilizing an Optimization model. IEEE AFRICON (pp. 22-25). Nairobia: IEEE.

143
APPENDICES .
APPENDIX A: SysML diagrams developed for building energy modeling
Activity diagram of energies and items flow processes

144
Block Definition Diagram of Energy End Uses
Block Definition Diagram of structure of hot water system

145
APPENDIX B: Roadmap of System Modeling Language
Roadmap describing the four pillar of system modeling language

146