Development and Field Validation of a Large-Frame Gas Turbine ...
12
GE Energy Development and Field Validation of a Large-Frame Gas Turbine Power Train for Steel Mill Gases Robert M. Jones, GE Energy, Schenectady NY, USA Larry L. Thomas, GE Energy, Greenville SC, USA Sergey V. Koshevets, GE Energy,Moscow, Russia Robert T. Thatcher, GE Energy, Greenville SC, USA Joel M. Hall, GE Energy, Greenville SC, USA
-
Upload
duonghuong -
Category
Documents
-
view
220 -
download
1
Transcript of Development and Field Validation of a Large-Frame Gas Turbine ...
GE Energy
Development and Field Validation of a Large-Frame Gas Turbine Power Trainfor Steel Mill GasesRobert M. Jones, GE Energy, Schenectady NY, USA
Larry L. Thomas, GE Energy, Greenville SC, USA
Sergey V. Koshevets, GE Energy,Moscow, Russia
Robert T. Thatcher, GE Energy, Greenville SC, USA
Joel M. Hall, GE Energy, Greenville SC, USA
Copyright © 2011 by ASME 1
Proceedings of ASME Turbo Expo 2011: Power for Land, Sea and Air GT2011
June 6-10, 2011, Vancouver, BC, Canada
GT2011-45923
DEVELOPMENT AND FIELD VALIDATION OF A LARGE-FRAME GAS TURBINE POWER TRAIN FOR STEEL MILL GASES
Joel M. Hall GE Energy
Greenville SC, USA
Robert T. Thatcher GE Energy
Greenville SC, USA
Sergey V. Koshevets GE Energy
Moscow, Russia
Larry L. Thomas GE Energy
Greenville SC, USA
Robert M. Jones GE Energy
Schenectady NY, USA
ABSTRACT
As of September 2009, GE Energy (GE) has successfully
expanded its large-frame gas turbine product line to burn ultra-
low calorific steel mill gas fuel blends, especially mixtures of
Blast Furnace Gas (BFG) and Coke Oven Gas (COG). The
first two GE frame 9E Gas Turbines in China with this
capability have thus far accumulated more than 8000 hours
operating on BFG/COG blends. The China site comprises two
complete power trains, including GE 9E gas turbines,
generators, fuel cleaning equipment, and fuel gas compressors.
Since startup, combustion operating parameters have remained
within design limits, consistent with the extensive full-scale
lab testing GE conducted during the turbine’s design
development effort, and comparable to fleet experience on
natural gas fired GE gas turbines. Based on this accumulated
data set, especially the wide range of gas compositions tested
in the combustion lab, similar process gases such as corex and
finex gases, and air-blown synthetic gases are operable in this
system. The GE 9E platform targets the 50Hz market. For
60Hz applications, a 7EA BFG product is available.
NOMENCLATURE/ACRONYMNS BFG Blast Furnace Gas
COG Coke Oven Gas
CCS Carbon Capture and Sequestration
FFT Fast Fourier Transform
FGC Fuel-gas compressor
HRSG Heat Recovery Steam Generator (in bottoming cycle)
LBO Lean BlowOut, or combustor blowout
LDG Linz-Donawitz furnace Gas
LHV Lower Heating Value (kcal/Nm3)
MNQC Multi-Nozzle Quiet Combustor
MWI Modified Wobbe Index in English Engineering Units
(BTU scf-1
R-1
)
NCM Normal cubic meter at 0oC 1 atmosphere, also Nm
3
S1N First Stage turbine Nozzle (or stator)
S3B Third Stage turbine Bucket (or rotor)
S3N Third Stage turbine Nozzle
scf Standard Cubic Foot at 15oC (59
oF) and 1 atm
T3.90 Combustion exit temperature
INTRODUCTION With the tremendous growth of the steel industry in recent
years has also come a greater interest in increasing plant
productivity and improving plant environmental performance.
To help meet these goals, companies are exploring new ways
to improve plant efficiency and effectiveness.
Blast Furnace Gas (BFG) is produced as a steel making
byproduct during the combustion of coke in blast furnaces; it
can be recovered and used, mixed with Coke Oven Gas
(COG), another byproduct of manufacturing, as fuel for power
and steam generation. Since the 1990s, GE Energy (GE) has
worked with customers on ways to use BFG, to produce an
internal, low-cost power and steam supply. This power can
then either be sold or recycled back into the plant’s process.
At the same time, emissions can be reduced compared to
flaring the gas. Building on the fuel flexibility and reliability
of its 9E gas turbine [1-6], GE has developed an efficient,
proven and flexible integrated solution to utilize BFG and
COG for this industrial application.
The equipment configuration of GE’s solution includes
the 9E gas turbine, a generator and a fuel gas compressor, used
in combined cycle operation. This power train has been
developed to replace conventional boiler solutions in the steel-
mill industry by burning low-calorific, low-pressure, low-cost
fuel gases. It builds on considerable gas turbine experience in
steel mills (e.g. five 9E turbines in Italy and China and ten 6B
turbines in China) and syngas in refineries around the world.
GE’s fleet of gas turbines operating on steel mill gases
produces a total of approximately 1000 MW of power [4]. The
Copyright © 2011 by ASME 2
first two units of the new 9E BFG product were commissioned
in 2009 at one of the largest steel producers in China. The
system is flexible for syngas fuels with average Lower
Heating Values (LHV) ranging from 1050 to 1400 kcal/Nm3
with no additional pilot fuel required. Typical processes
resulting in fuels in this range include BFG, COG, (and
mixtures thereof), finex, corex and air-blown gasification of
coal and other feedstock. Natural gas or distillate oil #2 can be
used as startup/backup fuels.
OVERVIEW OF INDUSTRIAL PROCESS GASES Blast Furnace Gas (BFG), Coke Oven Gas (COG) and
Linz-Donawitz Furnace Gas (LDG) are off-gases (by-
products) from the various furnaces used in the refining
processes of industrial steel mills. Such furnaces require
tremendous energy input, typically from coal feedstock. In the
production of iron and steel, energy costs are a large fraction
of plant operating costs.
Initially in the process, COG is produced by pyrolysis of
bituminous coal in the coke oven. The function of the coke
oven is to produce coke for the blast furnace. This high-
temperature process extracts volatile components of the coal,
such as water, tar, and gaseous hydrogen. Hence, the by-
product gas contains high levels of H2, typically 40-70% by
volume, with some methane, and minimal inert content.
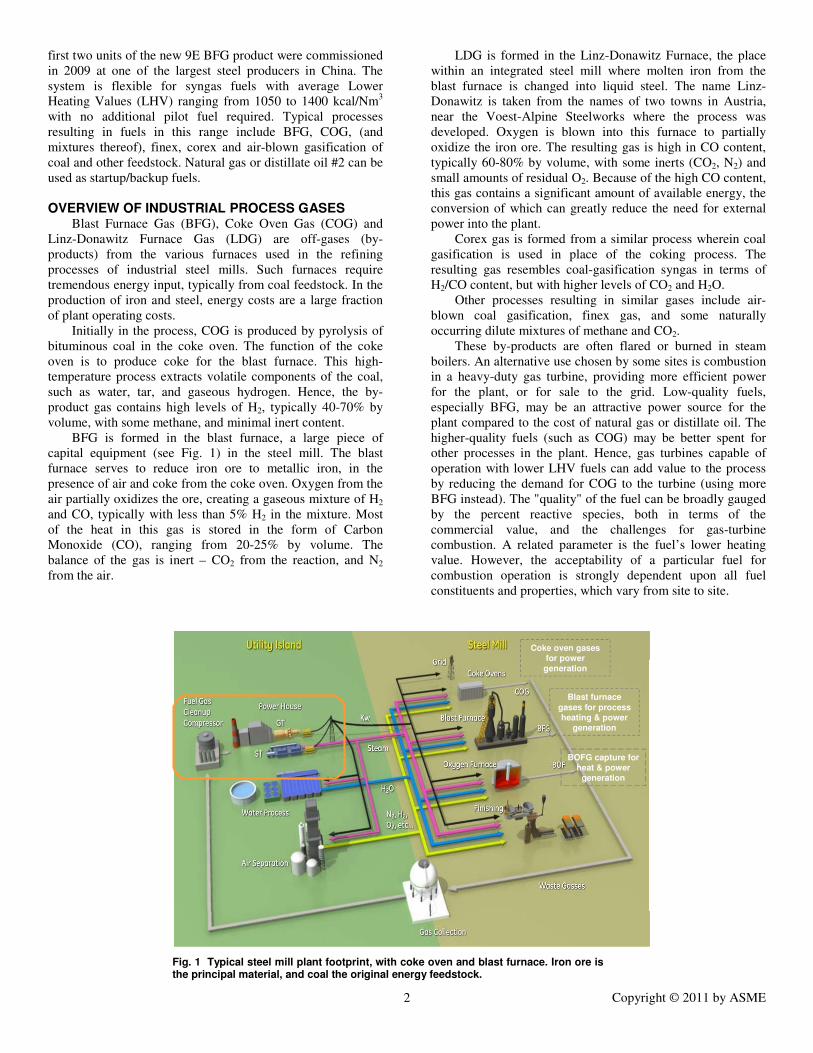
BFG is formed in the blast furnace, a large piece of
capital equipment (see Fig. 1) in the steel mill. The blast
furnace serves to reduce iron ore to metallic iron, in the
presence of air and coke from the coke oven. Oxygen from the
air partially oxidizes the ore, creating a gaseous mixture of H2
and CO, typically with less than 5% H2 in the mixture. Most
of the heat in this gas is stored in the form of Carbon
Monoxide (CO), ranging from 20-25% by volume. The
balance of the gas is inert – CO2 from the reaction, and N2
from the air.
LDG is formed in the Linz-Donawitz Furnace, the place
within an integrated steel mill where molten iron from the
blast furnace is changed into liquid steel. The name Linz-
Donawitz is taken from the names of two towns in Austria,
near the Voest-Alpine Steelworks where the process was
developed. Oxygen is blown into this furnace to partially
oxidize the iron ore. The resulting gas is high in CO content,
typically 60-80% by volume, with some inerts (CO2, N2) and
small amounts of residual O2. Because of the high CO content,
this gas contains a significant amount of available energy, the
conversion of which can greatly reduce the need for external
power into the plant.
Corex gas is formed from a similar process wherein coal
gasification is used in place of the coking process. The
resulting gas resembles coal-gasification syngas in terms of
H2/CO content, but with higher levels of CO2 and H2O.
Other processes resulting in similar gases include air-
blown coal gasification, finex gas, and some naturally
occurring dilute mixtures of methane and CO2.
These by-products are often flared or burned in steam
boilers. An alternative use chosen by some sites is combustion
in a heavy-duty gas turbine, providing more efficient power
for the plant, or for sale to the grid. Low-quality fuels,
especially BFG, may be an attractive power source for the
plant compared to the cost of natural gas or distillate oil. The
higher-quality fuels (such as COG) may be better spent for
other processes in the plant. Hence, gas turbines capable of
operation with lower LHV fuels can add value to the process
by reducing the demand for COG to the turbine (using more
BFG instead). The "quality" of the fuel can be broadly gauged
by the percent reactive species, both in terms of the
commercial value, and the challenges for gas-turbine
combustion. A related parameter is the fuel’s lower heating
value. However, the acceptability of a particular fuel for
combustion operation is strongly dependent upon all fuel
constituents and properties, which vary from site to site.
Fig. 1 Typical steel mill plant footprint, with coke oven and blast furnace. Iron ore is the principal material, and coal the original energy feedstock.
Coke oven gases for power
generation
Blast furnace
gases for process heating & power
generation
BOFG capture for heat & power
generation

Copyright © 2011 by ASME 3
Fig. 2 Steel mill site in Italy, with three GE 9E gas turbines fired on BFG/COG blends, operational since 1996
Fig. 3 Steel mill site in China, with two GE 9E gas turbines fired on Corex gas, operational since 2007
PREVIOUS GE EXPERIENCE WITH STEEL MILL GASES
GE has three 9E gas turbines operating on steel mill gases
in Italy (Fig. 2). Table 1 shows average gas compositions
Table 2 shows availability of these engines. The average LHV
when the three streams are blended together is approximately
1600 kcal/Nm3. The new BFG product introduced herein
targets 1050 kcal/Nm3 with upgraded combustion technology.
Table 1 Average gas compositions at the steel mill site in Italy
Table 2 Average availability at the steel mill site in Italy
NEW 9E BFG POWER TRAIN For the 9E BFG application, GE has leveraged the Gas
Turbine/Generator/Fuel Gas Compressor power train config-
uration originally developed in the 1990’s, and fielded first in
Italy and later in China, shown in Figs. 2 and 3, respectively.
The heart of the power train is the frame 9E gas turbine, GE’s
50-Hz industrial gas turbine workhorse with more than 430
operational units, 22 million operating hours, and typical
rating of 126MW on traditional fuels [5]. Gas turbine
modifications required to burn the ultra-low heating value fuel
are limited to a few changes. The combustion system is a
multi-nozzle quiet combustor (MNQC), a diffusion-flame
configuration derived from decades of syngas experience and
validated in GE’s combustion lab. Details of the combustion
development and validation are presented later. Modifications
to pass the large volume of fuel through the gas turbine
include an enlarged first-stage turbine nozzle (S1N). The gas
turbine also makes use of up-rated third-stage turbine nozzle
(S3N) and third-stage bucket (S3B) components that provide
superior performance in high-flow conditions. The S3N and
S3B airfoil design was previously enhanced to provide
improved turbine efficiency relative to the historical baseline.
The GE 9A5 generator is double-ended similar to the
configuration fielded previously (Fig. 3) with rotor thrust
modifications to handle the large compression loads associated
with compressing ultra-low heating value fuel.
Fig. 4 Power train sub-systems
BFG COG LDG
H2 2.5 60.3 1
CO 22.8 5 69.2
N2 53.5 4.5 14.9
CH4 0 25.3 0
CO2 21.2 1.3 14.6
CNH2N 0 3.6 0.3
LHV, kcal/Nm3
780±60 4500±290 2030±150
Site average fuel compositions (% volume dry)
Engine 1 Engine 2 Engine 3
94.2 93.9 91.7
Average % Availability since 1997
Copyright © 2011 by ASME 4
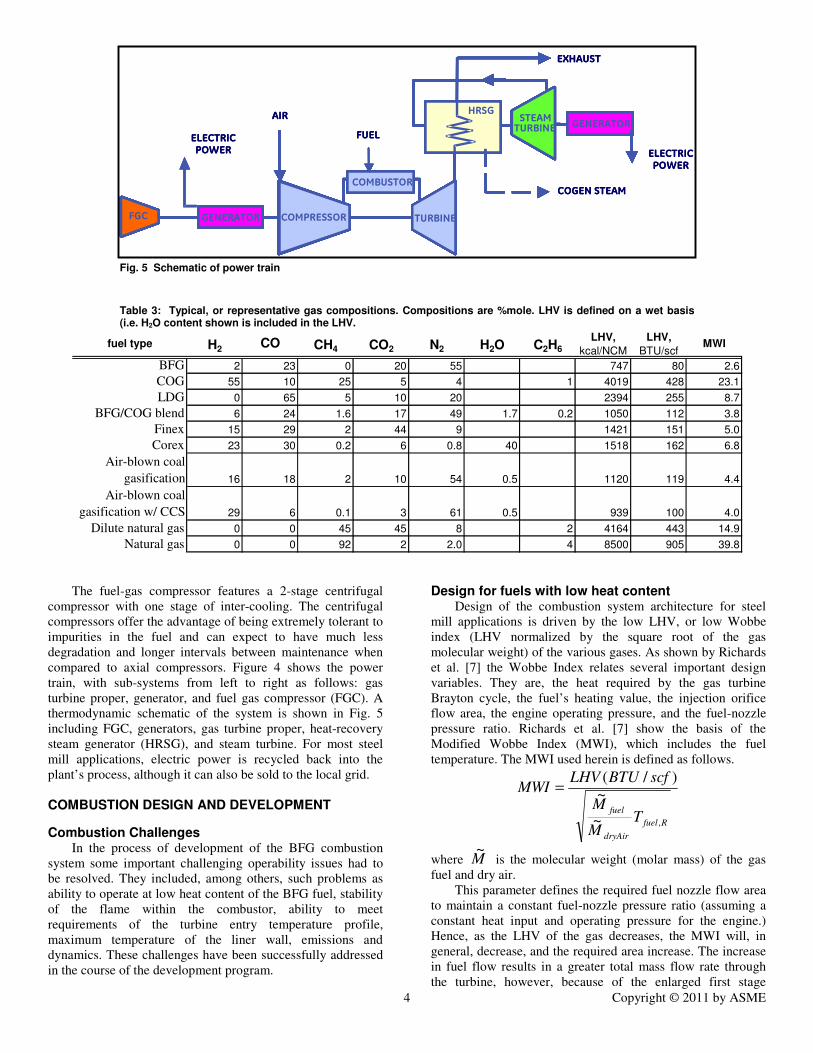
Fig. 5 Schematic of power train
Table 3: Typical, or representative gas compositions. Compositions are %mole. LHV is defined on a wet basis (i.e. H2O content shown is included in the LHV.
The fuel-gas compressor features a 2-stage centrifugal
compressor with one stage of inter-cooling. The centrifugal
compressors offer the advantage of being extremely tolerant to
impurities in the fuel and can expect to have much less
degradation and longer intervals between maintenance when
compared to axial compressors. Figure 4 shows the power
train, with sub-systems from left to right as follows: gas
turbine proper, generator, and fuel gas compressor (FGC). A
thermodynamic schematic of the system is shown in Fig. 5
including FGC, generators, gas turbine proper, heat-recovery
steam generator (HRSG), and steam turbine. For most steel
mill applications, electric power is recycled back into the
plant’s process, although it can also be sold to the local grid.
COMBUSTION DESIGN AND DEVELOPMENT
Combustion Challenges In the process of development of the BFG combustion
system some important challenging operability issues had to
be resolved. They included, among others, such problems as
ability to operate at low heat content of the BFG fuel, stability
of the flame within the combustor, ability to meet
requirements of the turbine entry temperature profile,
maximum temperature of the liner wall, emissions and
dynamics. These challenges have been successfully addressed
in the course of the development program.
Design for fuels with low heat content Design of the combustion system architecture for steel
mill applications is driven by the low LHV, or low Wobbe
index (LHV normalized by the square root of the gas
molecular weight) of the various gases. As shown by Richards
et al. [7] the Wobbe Index relates several important design
variables. They are, the heat required by the gas turbine
Brayton cycle, the fuel’s heating value, the injection orifice
flow area, the engine operating pressure, and the fuel-nozzle
pressure ratio. Richards et al. [7] show the basis of the
Modified Wobbe Index (MWI), which includes the fuel
temperature. The MWI used herein is defined as follows.
Rfuel
dryAir
fuelT
M
M
scfBTULHVMWI
,~
~)/(
=
where M~
is the molecular weight (molar mass) of the gas
fuel and dry air.
This parameter defines the required fuel nozzle flow area
to maintain a constant fuel-nozzle pressure ratio (assuming a
constant heat input and operating pressure for the engine.)
Hence, as the LHV of the gas decreases, the MWI will, in
general, decrease, and the required area increase. The increase
in fuel flow results in a greater total mass flow rate through
the turbine, however, because of the enlarged first stage
COMBUSTOR
COMPRESSOR TURBINEGENERATOR
HRSGSTEAM
TURBINE GENERATOR
FGC
COMBUSTOR
COMPRESSOR TURBINEGENERATOR
HRSGSTEAM
TURBINE GENERATOR
FGCFGC
ELECTRIC
POWER
COMBUSTOR
ELECTRIC
POWER
COMPRESSOR TURBINEGENERATOR
HRSGSTEAM
TURBINE GENERATOR
FGCFGC
COGEN STEAM
AIR
FUEL
COMBUSTOR
COMPRESSOR TURBINEGENERATOR
HRSG
EXHAUST
STEAM
TURBINEGENERATOR
FGCFGC
COMBUSTOR
COMPRESSOR TURBINEGENERATOR
HRSGSTEAM
TURBINE GENERATOR
FGCFGC
COMBUSTOR
COMPRESSOR TURBINEGENERATOR
HRSGSTEAM
TURBINE GENERATOR
FGCFGC
ELECTRIC
POWER
COMBUSTOR
ELECTRIC
POWER
COMPRESSOR TURBINEGENERATOR
HRSGSTEAM
TURBINE GENERATOR
FGCFGC
COGEN STEAM
AIR
FUEL
COMBUSTOR
COMPRESSOR TURBINEGENERATOR
HRSG
EXHAUST
STEAM
TURBINEGENERATOR
FGCFGC
fuel type H2CO CH4 CO2 N2 H2O C2H6
LHV,
kcal/NCM
LHV,
BTU/scfMWI
BFG 2 23 0 20 55 747 80 2.6
COG 55 10 25 5 4 1 4019 428 23.1
LDG 0 65 5 10 20 2394 255 8.7
BFG/COG blend 6 24 1.6 17 49 1.7 0.2 1050 112 3.8
Finex 15 29 2 44 9 1421 151 5.0
Corex 23 30 0.2 6 0.8 40 1518 162 6.8
Air-blown coal
gasification 16 18 2 10 54 0.5 1120 119 4.4
Air-blown coal
gasification w/ CCS 29 6 0.1 3 61 0.5 939 100 4.0
Dilute natural gas 0 0 45 45 8 2 4164 443 14.9
Natural gas 0 0 92 2 2.0 4 8500 905 39.8
Copyright © 2011 by ASME 5
turbine nozzle area (S1N) as discussed before, the equivalent
combustor air flow function, PTm /& , is consistent with GE
field experience on the 9E frame. Table 3 shows some typical,
or representative gas compositions for the various processes
discussed herein. Compositions are given as % by mole, or
volume. For the calculations in Table 3, a constant reference
fuel temperature of 400oF (205
oC) is assumed. Compositions
shown in Table 3 are typical of that process; the actual
composition will vary from site to site and from day to day at
a given site.
The high volumetric fuel flow required for the lower-
quality fuels causes a variety of challenges for the design of
the gas turbine combustion system. Perhaps most notable is
blowout, which can occur even at full-load conditions due to a
reduction in residence time compared to the low chemical
reactivity. Due to the cost of importing hydrocarbon backup
fuels such as natural gas, propane, distillate oil, etc. it is
desirable to operate without any such back-up fuel. This large
fuel volume creates large flames relative to combustion of
traditional high-calorie fuels in a similar burner. Such flame
can potentially lead to fuel and reaction near metal surfaces.
Hence, metal temperatures could exceed what would be
predicted for such traditional fuels based solely on the flame
temperature, as this temperature is relatively low. As a result,
cooling of the combustion liner has been improved to prevent
cracking and maintain metal temperatures consistent with 9E
experience. Reduced residence times and reaction rates, and
high initial CO concentrations, may lead to challenges in CO
burn-out. NOX on the other hand is often less of a concern for
similar reasons. In many cases nitrogen-bearing compounds in
the fuel, such as ammonia (NH3) are the leading source of
NOX emissions, as opposed to NOX formed by thermal
processes in the flame. For this reason, a diffusion-flame fuel
injection approach is used here rather than lean pre-mixed
combustion. These low-calorie fuels and the large fuel-nozzle
area lead to piping challenges in providing suitable purge
flows. Large volumetric flows of air are required for
qualification tests during production, typically an order of
magnitude greater than for natural gas applications.
Design for Flame Stability
The GE 9E BFG gas turbine power train includes a large
system as described previously. One of the key challenges to
fuel and operational flexibility with low-calorific process
gases lies in achieving stable and complete combustion.
Additionally, the reliability of the gas turbine requires that the
products of combustion be well suited for entrance into the
rotating machinery. This section outlines some of the design
processes used to modify the design of combustion hardware
for these requirements.
Static stability, in terms of flame-out, or lean blow-out
(LBO) is a primary concern in the design of a low-H2, low-
LHV combustion system. High volumetric flows of fuel lead
to reduced aerodynamic residence times, and low H2 content
and high inert content lead to reduced chemical reaction rates.
As summarized by Glassman [8], empirical correlations of
flame stability data can be generalized by a system Damköhler
(Da) number, expressed as the ratio between some
characteristic residence time scale and chemical time scale
The residence, or aerodynamics time scale is typically
associated with a recirculation zone and the characteristic
chemical time scale is typically associated with the time
required to ignite the unburned fuel/air mixture. The chemical
properties are governed primarily by the nature of the
industrial process; design variables pertinent to the
combustion system have a greater impact on the aerodynamic
residence time.
Reacting-flow computational fluid dynamics (CFD)
calculations have been used to design the primary combustion
zone to achieve the desired flame stability.
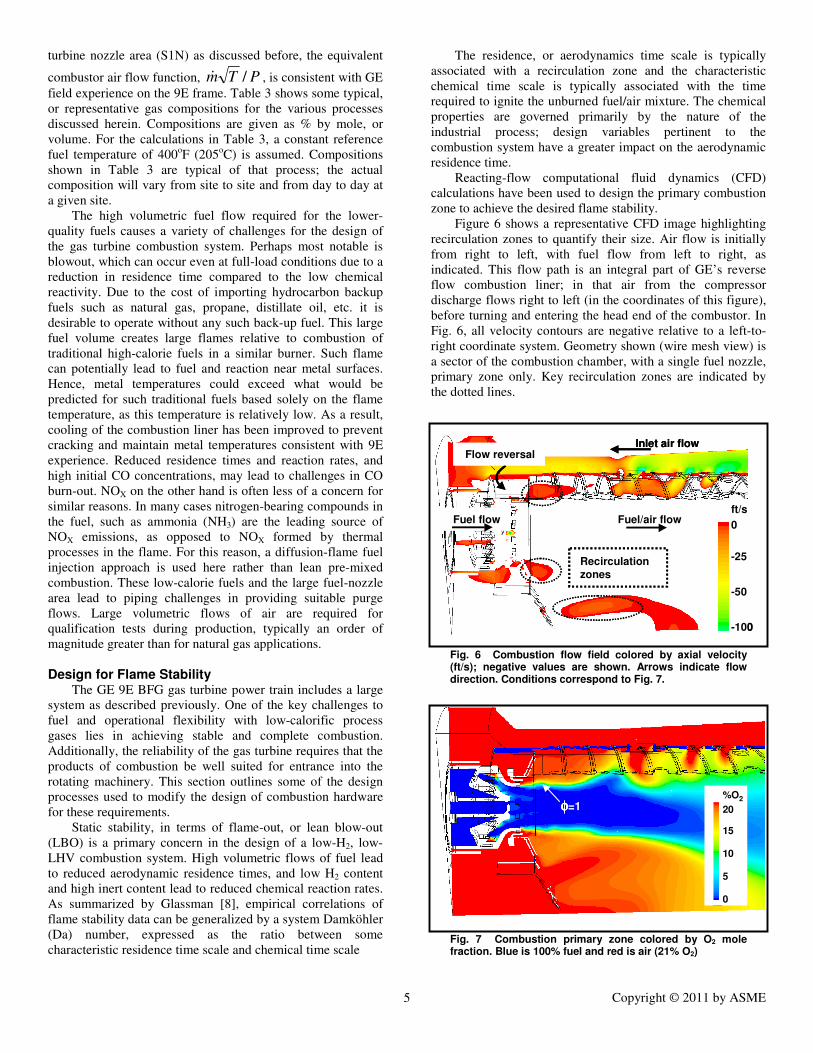
Figure 6 shows a representative CFD image highlighting
recirculation zones to quantify their size. Air flow is initially
from right to left, with fuel flow from left to right, as
indicated. This flow path is an integral part of GE’s reverse
flow combustion liner; in that air from the compressor
discharge flows right to left (in the coordinates of this figure),
before turning and entering the head end of the combustor. In
Fig. 6, all velocity contours are negative relative to a left-to-
right coordinate system. Geometry shown (wire mesh view) is
a sector of the combustion chamber, with a single fuel nozzle,
primary zone only. Key recirculation zones are indicated by
the dotted lines.
Fig. 6 Combustion flow field colored by axial velocity (ft/s); negative values are shown. Arrows indicate flow direction. Conditions correspond to Fig. 7.
Fig. 7 Combustion primary zone colored by O2 mole fraction. Blue is 100% fuel and red is air (21% O2)
Inlet air flow
Fuel flow
Recirculation
zones
Flow reversal
Fuel/air flowft/s
0
-25
-50
-100
Inlet air flow
Fuel flow
Recirculation
zones
Flow reversal
Fuel/air flow
Inlet air flow
Fuel flow
Recirculation
zones
Flow reversal
Fuel/air flow
Inlet air flow
Fuel flow
Recirculation
zones
Flow reversal
Fuel/air flowft/s
0
-25
-50
-100
%O2
20
15
10
5
0
φφφφ=1%O2
20
15
10
5
0
φφφφ=1
Copyright © 2011 by ASME 6
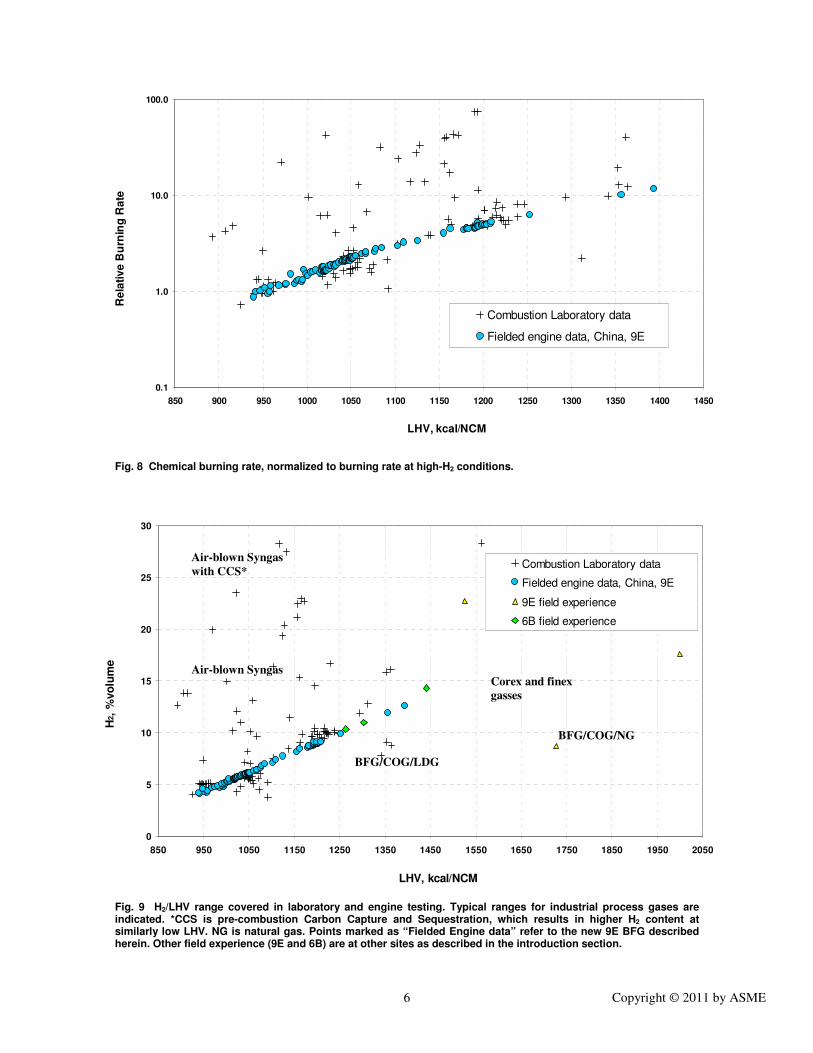
Fig. 8 Chemical burning rate, normalized to burning rate at high-H2 conditions.
Fig. 9 H2/LHV range covered in laboratory and engine testing. Typical ranges for industrial process gases are indicated. *CCS is pre-combustion Carbon Capture and Sequestration, which results in higher H2 content at similarly low LHV. NG is natural gas. Points marked as “Fielded Engine data” refer to the new 9E BFG described herein. Other field experience (9E and 6B) are at other sites as described in the introduction section.
BFG
0
5
10
15
20
25
30
850 950 1050 1150 1250 1350 1450 1550 1650 1750 1850 1950 2050
LHV, kcal/NCM
H2,
%vo
lum
e
Combustion Laboratory data
Fielded engine data, China, 9E
9E field experience
6B field experience
BFG/COG/LDG
Air-blown Syngas
Air-blown Syngas
with CCS*
BFG/COG/NG
Corex and finex
gasses
0.1
1.0
10.0
100.0
850 900 950 1000 1050 1100 1150 1200 1250 1300 1350 1400 1450
LHV, kcal/NCM
Re
lati
ve
Bu
rnin
g R
ate
Combustion Laboratory data
Fielded engine data, China, 9E
Copyright © 2011 by ASME 7
The CFD study used a steady Fluent version 6.3.26 and
double precision solver with a realizable k-epsilon turbulence
model and conjugate heat transfer enabled. No radiation
transfer was needed for this analysis because it focused on
aerodynamic features of the flow field and absolute
temperatures were not required. Species transport was
modeled with non-reacting mixing among 6 species.
Contours of O2 mole fraction, shown in Fig. 7, further
illustrate the flow field. In Fig. 7, blue shading indicates zero
O2 (pure fuel) and red indicates 21% O2 (pure air). For the
conditions analyzed, φ=1 occurs at 9.9% O2, where φ is the
fuel/air equivalence ratio. Co-location of the stoichiometric
contours with regions of low or negative velocity is a key
feature for flame stability, as this condition maximizes the
Damköhler number. This is based on two assumptions. The
first, that regions of negative axial velocity indicate
recirculation and increased residence time, and secondly, that,
for diffusion flames, temperatures and reaction rates tend to a
maximum at or near equivalence ratios of one.
Based on the recirculation zone size determined from
CFD and the Da number criteria defined by Glassman [8], a
static stability limit can be defined, above which stable
combustion of the low-LHV gas will be possible. The
remaining parameter then is the chemical time scale, taken
here as the chemical burning rate. This property is shown in
Fig. 8. For comparison, a wide range of stable Combustion
Laboratory data are shown, with recent engine data as well.
The same laboratory data points are shown in Figs. 8 and 9. In
Fig. 9 relative burning rate has been replaced with %H2, which
gives a suitable representation of chemical reactivity for
typical steel mill gases. This approach has the advantage of
being formulated in terms more readily obtained from a gas
analysis, and it can be seen that numerous steel mill gases lie
within the tested range.
Design for Turbine Entry Profile It is important to ensure that the proven reliability of the
GE 9E turbine is preserved, even as it operates with fuel flows
an order of magnitude greater than for natural gas or distillate
fuel oil. To this end, the combustion hardware was modified
during the development phase to produce a uniform
temperature profile at the turbine inlet (combustion outlet).
The initial design phase used the jet-penetration
correlations of Holdemann and Walker [9], to determine hole
placement, diameter, and count for injection of dilution air
within the combustion liner. Total dilution area was fixed to
minimize CO emissions and flame stability, based on the bulk-
average combustion temperature upstream of the dilution
injection plane. The axial location of the dilution air injection
plane was set by the same considerations.
In application of the two-dimensional (2-D) correlations
of Holdemann and Walker [9], the key parameter is the center-
line trajectory of the dilution-air jet, YCL. The equation of this
center-line penetration depth is as follows.
b
jjjj
CL eD
X
D
H
D
SJ
D
XY −
=
17.038.014.0
25.0539.0)(
where
−
=
5.3091.0
2J
S
H
H
Xb
X axial position within liner channel
S spacing between centerlines of adjacent orifices
Dj dilution-jet diameter
H duct height or liner diameter
J momentum ratio, jet to freestream
For a given combustor geometry, the primary design
variables are the jet diameter, Dj, and the count, which sets the
spacing, S.
The 2-D correlations of Holdemann and Walker [9] give
penetration profile of the jet centerline for a jet in cross flow,
discharging into a confined duct area. With options defined in
this manner, CFD predictions of exit temperature distribution
were used to complete definition of the dilution air injection
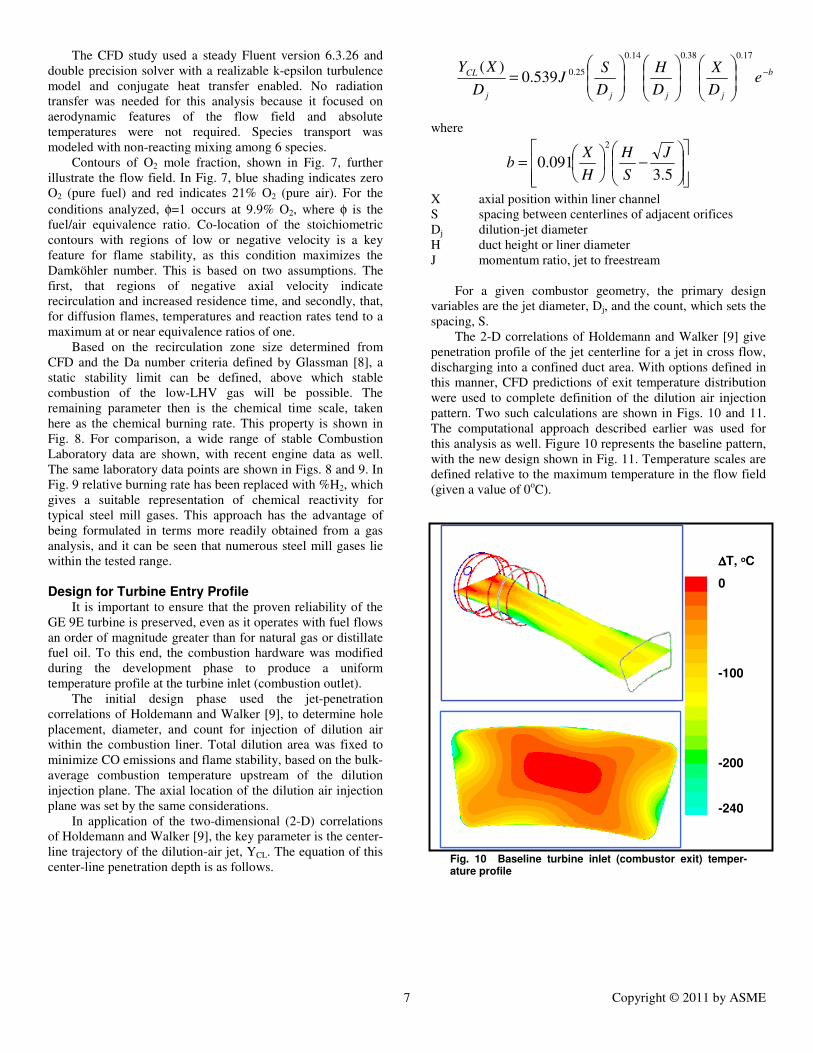
pattern. Two such calculations are shown in Figs. 10 and 11.
The computational approach described earlier was used for
this analysis as well. Figure 10 represents the baseline pattern,
with the new design shown in Fig. 11. Temperature scales are
defined relative to the maximum temperature in the flow field
(given a value of 0oC).
Fig. 10 Baseline turbine inlet (combustor exit) temper-ature profile
∆∆∆∆T, oC
0
-100
-200
-240
∆∆∆∆T, oC
0
-100
-200
-240
∆∆∆∆T, oC
0
-100
-200
-240
Copyright © 2011 by ASME 8
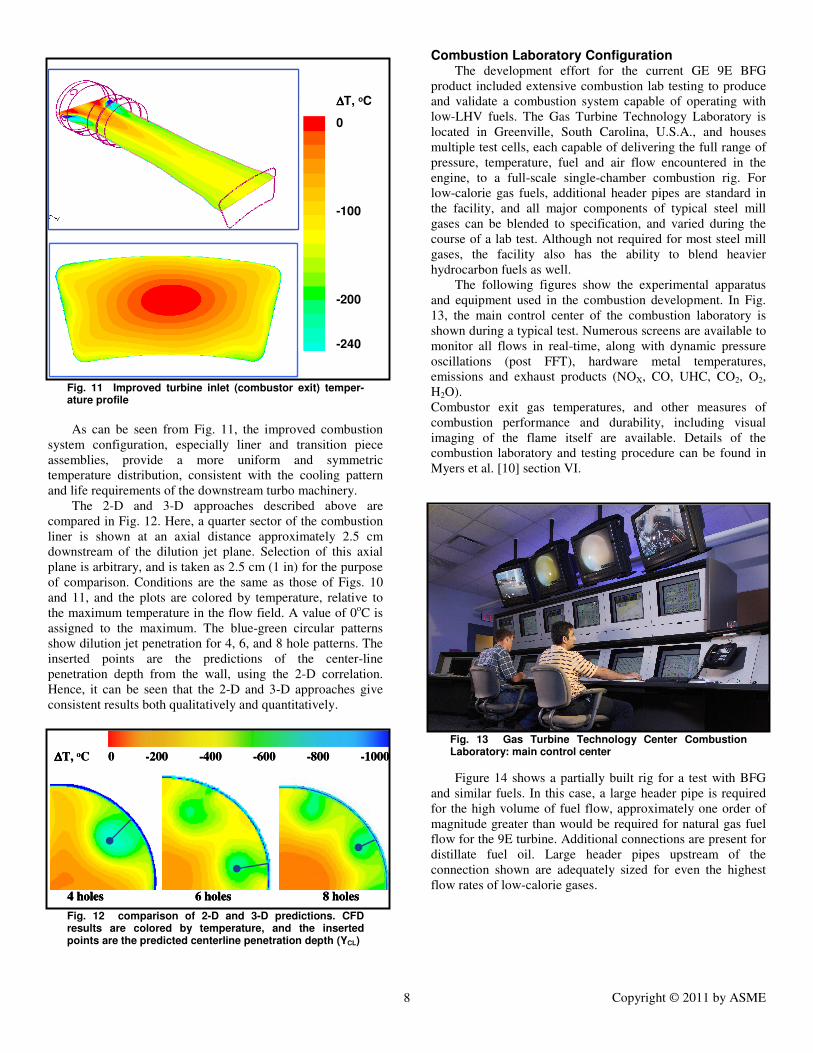
Fig. 11 Improved turbine inlet (combustor exit) temper-ature profile
As can be seen from Fig. 11, the improved combustion
system configuration, especially liner and transition piece
assemblies, provide a more uniform and symmetric
temperature distribution, consistent with the cooling pattern
and life requirements of the downstream turbo machinery.
The 2-D and 3-D approaches described above are
compared in Fig. 12. Here, a quarter sector of the combustion
liner is shown at an axial distance approximately 2.5 cm
downstream of the dilution jet plane. Selection of this axial
plane is arbitrary, and is taken as 2.5 cm (1 in) for the purpose
of comparison. Conditions are the same as those of Figs. 10
and 11, and the plots are colored by temperature, relative to
the maximum temperature in the flow field. A value of 0oC is
assigned to the maximum. The blue-green circular patterns
show dilution jet penetration for 4, 6, and 8 hole patterns. The
inserted points are the predictions of the center-line
penetration depth from the wall, using the 2-D correlation.
Hence, it can be seen that the 2-D and 3-D approaches give
consistent results both qualitatively and quantitatively.
Fig. 12 comparison of 2-D and 3-D predictions. CFD results are colored by temperature, and the inserted points are the predicted centerline penetration depth (YCL)
Combustion Laboratory Configuration The development effort for the current GE 9E BFG
product included extensive combustion lab testing to produce
and validate a combustion system capable of operating with
low-LHV fuels. The Gas Turbine Technology Laboratory is
located in Greenville, South Carolina, U.S.A., and houses
multiple test cells, each capable of delivering the full range of
pressure, temperature, fuel and air flow encountered in the
engine, to a full-scale single-chamber combustion rig. For
low-calorie gas fuels, additional header pipes are standard in
the facility, and all major components of typical steel mill
gases can be blended to specification, and varied during the
course of a lab test. Although not required for most steel mill
gases, the facility also has the ability to blend heavier
hydrocarbon fuels as well.
The following figures show the experimental apparatus
and equipment used in the combustion development. In Fig.
13, the main control center of the combustion laboratory is
shown during a typical test. Numerous screens are available to
monitor all flows in real-time, along with dynamic pressure
oscillations (post FFT), hardware metal temperatures,
emissions and exhaust products (NOX, CO, UHC, CO2, O2,
H2O).
Combustor exit gas temperatures, and other measures of
combustion performance and durability, including visual
imaging of the flame itself are available. Details of the
combustion laboratory and testing procedure can be found in
Myers et al. [10] section VI.
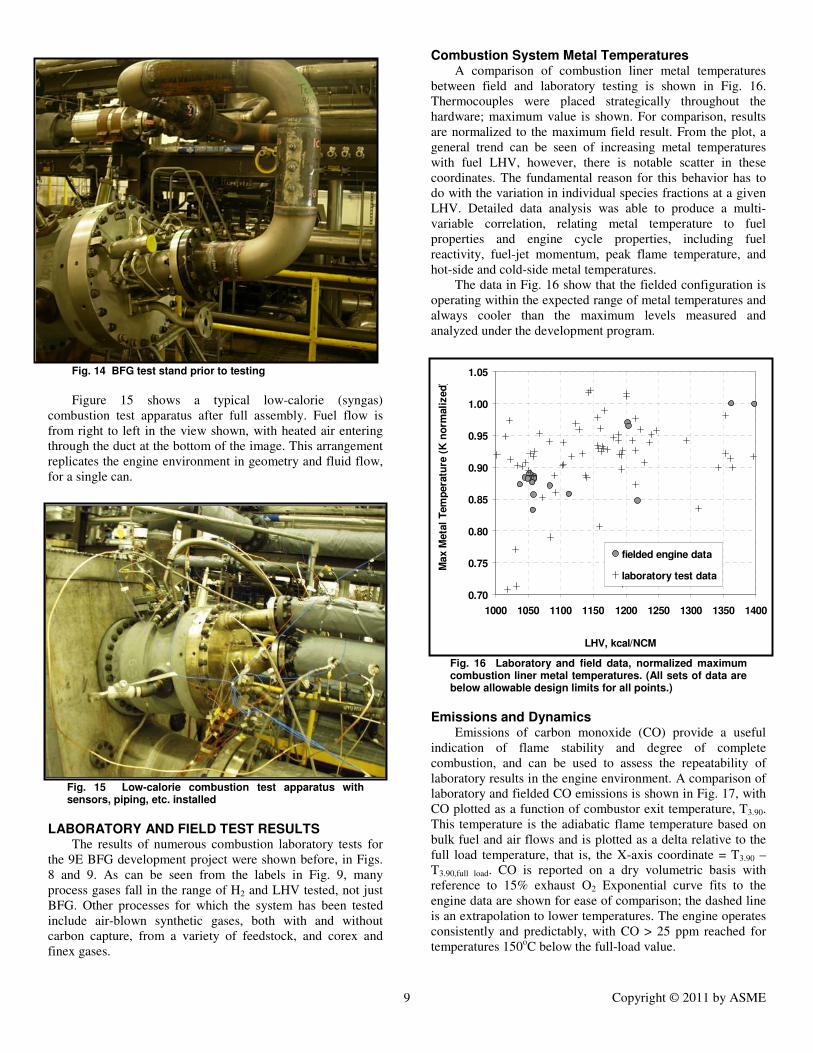
Fig. 13 Gas Turbine Technology Center Combustion Laboratory: main control center
Figure 14 shows a partially built rig for a test with BFG
and similar fuels. In this case, a large header pipe is required
for the high volume of fuel flow, approximately one order of
magnitude greater than would be required for natural gas fuel
flow for the 9E turbine. Additional connections are present for
distillate fuel oil. Large header pipes upstream of the
connection shown are adequately sized for even the highest
flow rates of low-calorie gases.
∆∆∆∆T, oC
0
-100
-200
-240
∆∆∆∆T, oC
0
-100
-200
-240
∆∆∆∆T, oC
0
-100
-200
-240
4 holes 6 holes 8 holes
∆∆∆∆T, oC 0 -200 -400 -600 -800 -1000
4 holes 6 holes 8 holes4 holes 6 holes 8 holes
∆∆∆∆T, oC 0 -200 -400 -600 -800 -1000
Copyright © 2011 by ASME 9
Fig. 14 BFG test stand prior to testing
Figure 15 shows a typical low-calorie (syngas)
combustion test apparatus after full assembly. Fuel flow is
from right to left in the view shown, with heated air entering
through the duct at the bottom of the image. This arrangement
replicates the engine environment in geometry and fluid flow,
for a single can.
Fig. 15 Low-calorie combustion test apparatus with sensors, piping, etc. installed
LABORATORY AND FIELD TEST RESULTS The results of numerous combustion laboratory tests for
the 9E BFG development project were shown before, in Figs.
8 and 9. As can be seen from the labels in Fig. 9, many
process gases fall in the range of H2 and LHV tested, not just
BFG. Other processes for which the system has been tested
include air-blown synthetic gases, both with and without
carbon capture, from a variety of feedstock, and corex and
finex gases.
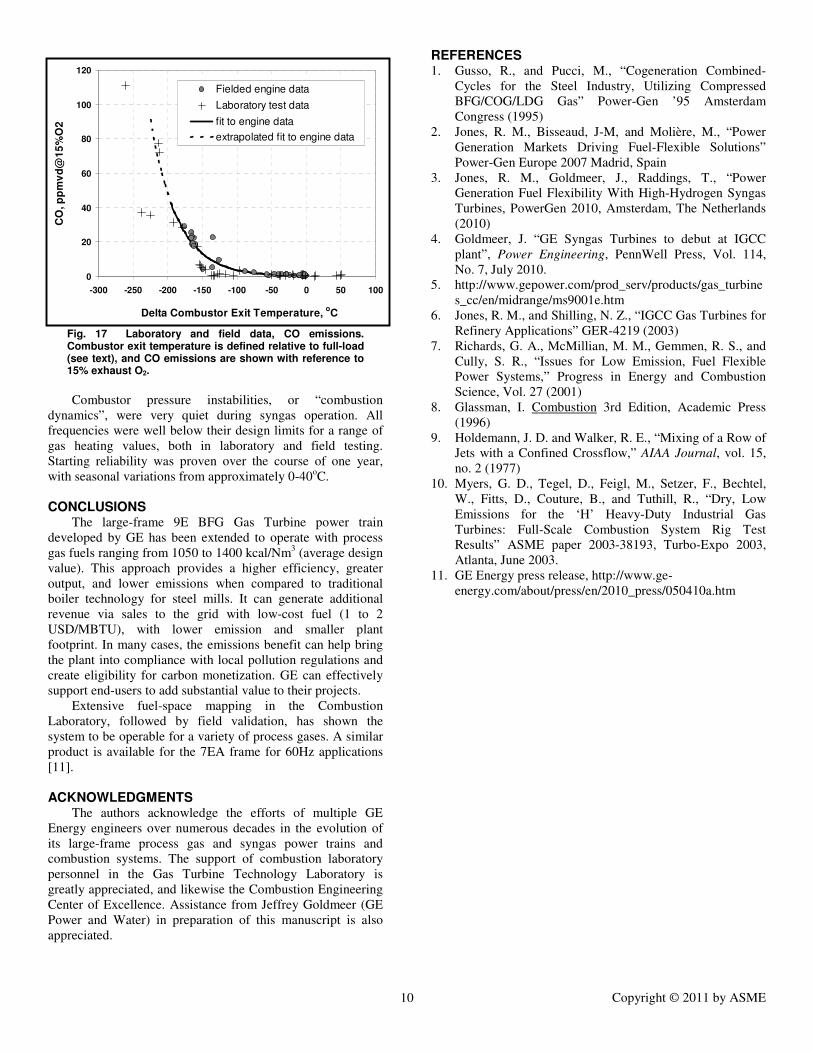
Combustion System Metal Temperatures A comparison of combustion liner metal temperatures
between field and laboratory testing is shown in Fig. 16.
Thermocouples were placed strategically throughout the
hardware; maximum value is shown. For comparison, results
are normalized to the maximum field result. From the plot, a
general trend can be seen of increasing metal temperatures
with fuel LHV, however, there is notable scatter in these
coordinates. The fundamental reason for this behavior has to
do with the variation in individual species fractions at a given
LHV. Detailed data analysis was able to produce a multi-
variable correlation, relating metal temperature to fuel
properties and engine cycle properties, including fuel
reactivity, fuel-jet momentum, peak flame temperature, and
hot-side and cold-side metal temperatures.
The data in Fig. 16 show that the fielded configuration is
operating within the expected range of metal temperatures and
always cooler than the maximum levels measured and
analyzed under the development program.
Fig. 16 Laboratory and field data, normalized maximum combustion liner metal temperatures. (All sets of data are below allowable design limits for all points.)
Emissions and Dynamics
Emissions of carbon monoxide (CO) provide a useful
indication of flame stability and degree of complete
combustion, and can be used to assess the repeatability of
laboratory results in the engine environment. A comparison of
laboratory and fielded CO emissions is shown in Fig. 17, with
CO plotted as a function of combustor exit temperature, T3.90.
This temperature is the adiabatic flame temperature based on
bulk fuel and air flows and is plotted as a delta relative to the
full load temperature, that is, the X-axis coordinate = T3.90 –
T3.90,full load. CO is reported on a dry volumetric basis with
reference to 15% exhaust O2 Exponential curve fits to the
engine data are shown for ease of comparison; the dashed line
is an extrapolation to lower temperatures. The engine operates
consistently and predictably, with CO > 25 ppm reached for
temperatures 150oC below the full-load value.
0.70
0.75
0.80
0.85
0.90
0.95
1.00
1.05
1000 1050 1100 1150 1200 1250 1300 1350 1400
LHV, kcal/NCM
Max M
eta
l T
em
pera
ture
(K
no
rmali
zed
)
fielded engine data
laboratory test data
Copyright © 2011 by ASME 10
Fig. 17 Laboratory and field data, CO emissions. Combustor exit temperature is defined relative to full-load (see text), and CO emissions are shown with reference to 15% exhaust O2.
Combustor pressure instabilities, or “combustion
dynamics”, were very quiet during syngas operation. All
frequencies were well below their design limits for a range of
gas heating values, both in laboratory and field testing.
Starting reliability was proven over the course of one year,
with seasonal variations from approximately 0-40oC.
CONCLUSIONS The large-frame 9E BFG Gas Turbine power train
developed by GE has been extended to operate with process
gas fuels ranging from 1050 to 1400 kcal/Nm3 (average design
value). This approach provides a higher efficiency, greater
output, and lower emissions when compared to traditional
boiler technology for steel mills. It can generate additional
revenue via sales to the grid with low-cost fuel (1 to 2
USD/MBTU), with lower emission and smaller plant
footprint. In many cases, the emissions benefit can help bring
the plant into compliance with local pollution regulations and
create eligibility for carbon monetization. GE can effectively
support end-users to add substantial value to their projects.
Extensive fuel-space mapping in the Combustion
Laboratory, followed by field validation, has shown the
system to be operable for a variety of process gases. A similar
product is available for the 7EA frame for 60Hz applications
[11].
ACKNOWLEDGMENTS The authors acknowledge the efforts of multiple GE
Energy engineers over numerous decades in the evolution of
its large-frame process gas and syngas power trains and
combustion systems. The support of combustion laboratory
personnel in the Gas Turbine Technology Laboratory is
greatly appreciated, and likewise the Combustion Engineering
Center of Excellence. Assistance from Jeffrey Goldmeer (GE
Power and Water) in preparation of this manuscript is also
appreciated.
REFERENCES 1. Gusso, R., and Pucci, M., “Cogeneration Combined-
Cycles for the Steel Industry, Utilizing Compressed
BFG/COG/LDG Gas” Power-Gen ’95 Amsterdam
Congress (1995)
2. Jones, R. M., Bisseaud, J-M, and Molière, M., “Power
Generation Markets Driving Fuel-Flexible Solutions”
Power-Gen Europe 2007 Madrid, Spain
3. Jones, R. M., Goldmeer, J., Raddings, T., “Power
Generation Fuel Flexibility With High-Hydrogen Syngas
Turbines, PowerGen 2010, Amsterdam, The Netherlands
(2010)
4. Goldmeer, J. “GE Syngas Turbines to debut at IGCC
plant”, Power Engineering, PennWell Press, Vol. 114,
No. 7, July 2010.
5. http://www.gepower.com/prod_serv/products/gas_turbine
s_cc/en/midrange/ms9001e.htm
6. Jones, R. M., and Shilling, N. Z., “IGCC Gas Turbines for
Refinery Applications” GER-4219 (2003)
7. Richards, G. A., McMillian, M. M., Gemmen, R. S., and
Cully, S. R., “Issues for Low Emission, Fuel Flexible
Power Systems,” Progress in Energy and Combustion
Science, Vol. 27 (2001)
8. Glassman, I. Combustion 3rd Edition, Academic Press
(1996)
9. Holdemann, J. D. and Walker, R. E., “Mixing of a Row of
Jets with a Confined Crossflow,” AIAA Journal, vol. 15,
no. 2 (1977)
10. Myers, G. D., Tegel, D., Feigl, M., Setzer, F., Bechtel,
W., Fitts, D., Couture, B., and Tuthill, R., “Dry, Low
Emissions for the ‘H’ Heavy-Duty Industrial Gas
Turbines: Full-Scale Combustion System Rig Test
Results” ASME paper 2003-38193, Turbo-Expo 2003,
Atlanta, June 2003.
11. GE Energy press release, http://www.ge-
energy.com/about/press/en/2010_press/050410a.htm
0
20
40
60
80
100
120
-300 -250 -200 -150 -100 -50 0 50 100
Delta Combustor Exit Temperature, oC
CO
, p
pm
vd
@1
5%
O2
Fielded engine data
Laboratory test data
fit to engine data
extrapolated fit to engine data

©2012 , General Electric Company. All rights reserved.
GEA19940 (05/2012)