Modeling and Validation of a Cross Flow Turbine using Free ...
7
Modeling and Validation of a Cross Flow Turbine using Free Vortex Models and an improved 2D Lift Model. R. Urbina, M.L. Peterson, and P.M. Bates Department of Mechanical Engineering University of Maine Orono, ME 04469 USA R.W. Kimball Department of Engineering Maine Maritime Academy Castine, ME 04420 Abstract-A number of numerical methods have been developed to predict the performance and aerodynamic loads of the Darrieus turbine. Prior work by Reference [1] using blade element methods (BEM) and free vortex methods (FVM) [2] has produced reasonable models that predict the hydrodynamic performance of the Darrieus turbine. The validated models reasonably estimate the performance at low solidities (Nc/R<<1), but lose accuracy at higher solidity ratios. Dynamic stall and flow curvature has been recognized by [2] [3] and [4] to be significant modeling parameters which have limited the accuracy of prior models. The current numerical model extends the predictions of the FVM model to a higher solidity ratio range. An improved model is presented for the condition of high angles of attack and for dynamic stall,. Experimental data on a series of two (Nc/R≈.9) and four (Nc/R≈1.8) blade configurations are presented as validation of the modified analytical vortex model. Tidal Energy has the potential to be an important source to diversify and provide affordable renewable power to people near coastal areas. However, some of the best tidal currents available are near sensitive areas for fish spawning and feeding. For this reason, any device that is to be designed for installation in this environment has to minimize impact on these fragile ecosystems. The Darrieus turbine offers an attractive alternative design because of these environmental considerations. High solidity turbines are of interest since they operate at lower tip speed ratios and allow for lower pressure gradients along the blade. These characteristics have the potential to reduce environmental impact on marine fauna, as the conditions of excessive mechanical strike, cavitations, shear and large pressure gradients are minimized while maintaining reasonable power coefficient values. In order to analyze the performance of the high solidity Darrieus turbine, the FVM model was chosen to model the turbine and wake with discrete vortex segments, which were then used to determine the induced velocities at the blade. Although the computational expense is greater than with other methods, like BEM models, FVM models can better predict the turbine performance at higher tip to flow speed ratios and higher rotor solidities. These methods also have the advantage of providing information of the wake profile and can be extended to provide information on the interaction of different devices. This project was funded by Ocean Renewable Power Company and the Maine Tidal Power Initiative, U.S. Department of Energy grant EE-000298 The lifting line FVM model requires the lift and drag curves to be prescribed for a given hydrofoil profile. Experimental data have shown that the dynamic stall contribution is higher than expected at low tip speed ratios for high solidity Darrieus turbines. Because of the complex nature of the problem, an empirical lift model based on theoretical foundation is used. An approximation of the known asymptotic limit values was used to account for the dynamic stall behavior. In order to validate the empirical lift model for the FVM, a set of experiments was conducted using NACA 63018 blades at different toe angles, tip speed ratios, and free stream velocities. Results will be shown for a numerical model of high solidity Darrieus type cross flow turbines which have been experimentally validated. High solidity rotors (1 < Nc/R < 2) were tested and modeled for conditions of blade dynamic stall and other effects. I. BACKGROUND Although the tidal-current power industry is still in its developmental stages, tidal- energy is regarded as one of the most promising new alternative energy resources. Tidal energy can help reduce the environmental carbon footprint and help meet future energy demands. According to the principle of operation, tidal current turbines can be mainly classified as either horizontal or vertical axis turbines [5]. There have been many attempts to model the vertical axis turbine. The existing models can mainly be classified using Navier-Stokes equation methods and potential-flow methods. Reynolds averaged Navier-Stokes (RANS) methods can predict the performance of turbines with high accuracy, if the meshes are fine enough, but the computational cost is higher than that associated with using simple potential flow methods. The potential-flow methods can be classified as blade element method, local circulation model and the vortex methods. The blade element method is used to predict the force on the blade of a turbine. The simplest hydrodynamic models of this type use streamtube theories. These models equate the rate of change in flow momentum in a streamtube R. Urbina, M.L. Peterson, and P.M. Bates Department of Mechanical Engineering University of Maine Orono, ME 04469 USA R.W. Kimball Department of Engineering Maine Maritime Academy Castine, ME 04420 978-1-4244-4333-8/10/$25.00 ©2010 IEEE
Transcript of Modeling and Validation of a Cross Flow Turbine using Free ...

Modeling and Validation of a Cross Flow Turbine using Free Vortex Models and an improved 2D Lift
Model. R. Urbina, M.L. Peterson, and P.M. Bates Department of Mechanical Engineering University of Maine Orono, ME 04469 USA
R.W. Kimball Department of Engineering Maine Maritime Academy Castine, ME 04420
Abstract-A number of numerical methods have been developed to predict the performance and aerodynamic loads of the Darrieus turbine. Prior work by Reference [1] using blade element methods (BEM) and free vortex methods (FVM) [2] has produced reasonable models that predict the hydrodynamic performance of the Darrieus turbine. The validated models reasonably estimate the performance at low solidities (Nc/R<<1), but lose accuracy at higher solidity ratios. Dynamic stall and flow curvature has been recognized by [2] [3] and [4] to be significant modeling parameters which have limited the accuracy of prior models. The current numerical model extends the predictions of the FVM model to a higher solidity ratio range. An improved model is presented for the condition of high angles of attack and for dynamic stall,. Experimental data on a series of two (Nc/R≈.9) and four (Nc/R≈1.8) blade configurations are presented as validation of the modified analytical vortex model.
Tidal Energy has the potential to be an important source to diversify and provide affordable renewable power to people near coastal areas. However, some of the best tidal currents available are near sensitive areas for fish spawning and feeding. For this reason, any device that is to be designed for installation in this environment has to minimize impact on these fragile ecosystems. The Darrieus turbine offers an attractive alternative design because of these environmental considerations. High solidity turbines are of interest since they operate at lower tip speed ratios and allow for lower pressure gradients along the blade. These characteristics have the potential to reduce environmental impact on marine fauna, as the conditions of excessive mechanical strike, cavitations, shear and large pressure gradients are minimized while maintaining reasonable power coefficient values.
In order to analyze the performance of the high solidity Darrieus turbine, the FVM model was chosen to model the turbine and wake with discrete vortex segments, which were then used to determine the induced velocities at the blade. Although the computational expense is greater than with other methods, like BEM models, FVM models can better predict the turbine performance at higher tip to flow speed ratios and higher rotor solidities. These methods also have the advantage of providing information of the wake profile and can be extended to provide information on the interaction of different devices.
This project was funded by Ocean Renewable Power Company and the Maine Tidal Power Initiative, U.S. Department of Energy grant EE-000298
The lifting line FVM model requires the lift and drag curves to be prescribed for a given hydrofoil profile. Experimental data have shown that the dynamic stall contribution is higher than expected at low tip speed ratios for high solidity Darrieus turbines. Because of the complex nature of the problem, an empirical lift model based on theoretical foundation is used. An approximation of the known asymptotic limit values was used to account for the dynamic stall behavior.
In order to validate the empirical lift model for the FVM, a set of experiments was conducted using NACA 63018 blades at different toe angles, tip speed ratios, and free stream velocities. Results will be shown for a numerical model of high solidity Darrieus type cross flow turbines which have been experimentally validated. High solidity rotors (1 < Nc/R < 2) were tested and modeled for conditions of blade dynamic stall and other effects.
I. BACKGROUND
Although the tidal-current power industry is still in its developmental stages, tidal- energy is regarded as one of the most promising new alternative energy resources. Tidal energy can help reduce the environmental carbon footprint and help meet future energy demands. According to the principle of operation, tidal current turbines can be mainly classified as either horizontal or vertical axis turbines [5].
There have been many attempts to model the vertical axis turbine. The existing models can mainly be classified using Navier-Stokes equation methods and potential-flow methods. Reynolds averaged Navier-Stokes (RANS) methods can predict the performance of turbines with high accuracy, if the meshes are fine enough, but the computational cost is higher than that associated with using simple potential flow methods.
The potential-flow methods can be classified as blade element method, local circulation model and the vortex methods. The blade element method is used to predict the force on the blade of a turbine. The simplest hydrodynamic models of this type use streamtube theories. These models equate the rate of change in flow momentum in a streamtube
R. Urbina, M.L. Peterson, and P.M. Bates Department of Mechanical Engineering University of Maine Orono, ME 04469 USA
R.W. Kimball Department of Engineering Maine Maritime Academy Castine, ME 04420
978-1-4244-4333-8/10/$25.00 ©2010 IEEE

to the forces on the rotor blades in that streamtube, using actuator disk theory. The various models represent the turbine as a single streamtube, multiple streamtubes [1], or double-multiple streamtube models (in which the upstream and downstream movement of the blade are differentiated) [6]. The most serious deficiency of the blade element method is that under conditions of large solidity and high tip to inflow speed ratios, the simple momentum considerations inherent in the model break down [2].
The vortex method, which is implemented and extended in this paper, is used to predict the power output and the wake of a turbine. Vortex methods are based upon vorticity equations and are used to perform detailed calculations of the induced velocity field. Vortex models can represent the blades as either lifting line or lifting surface and the wake of the turbine as either free or prescribed [6].
The local circulation model (LCM) is a combination of the blade element method and vortex models for a single streamtube. The LCM utilizes a momentum balance between the forces on the blades and the change in flow momentum as the blades pass through the rotor, and the vortex approach for the upstream and downstream flow differences.
Comparatively, the vortex method is more suitable for simulating a turbine as it provides information on the rotation of the turbine and the unsteady wake. Overall, the purpose of this study is to develop a cost-effective numerical method to simulate the behavior of a high solidity cross flow stand-alone turbine and to validate it with experimental data.
II. DYNAMIC STALL AND FLOW CURVATURE
Dynamic stall is a phenomenon that appears when a
Vertical Axis Wind Turbine (VAWT) is operated at low tip speed ratios. It is created when unsteady loads and flow separation release large vortices that influence the forces on the blade. Dynamic stall has a significant impact on the loading on the blades and consequently on the power output of the turbine [7]. VAWTs are also subject to cyclic forces so that the ability to accurately predict the forces on the blade is critical to accounting for fatigue in the design of the turbine.
The dynamic stall behavior of a VAWT turbine is similar to
blade pitching in large angles of attack. As the blade changes its angle of attack relative to the flow, dynamic stall occurs as a leading-edge vortex is shed from the blade. This produces an increase in lift, a negative pitching moment, and an increase in drag on the blade. The dynamic stall phenomenon has been reported to present limited sensitivity to many parameters [8].
Due to the fact that high solidity Darrieus turbines have relatively slow operational tip speed ratios, they operate at higher angles of attack that lead into the post stall area.
Modeling the VAWT is further complicated by the fact that the blade is also influenced by the wake of previous rotations and the variation in perceived velocity during its upstream and downstream movement.
Numerous numerical and analytical methods have been developed for the direct calculation of dynamic stall on an oscillating airfoil. This is an active area of research in classical fluid mechanics. Presently, these methods remain in research or pilot stages [9].
Different methodologies to compute the dynamic stall effect have been developed for helicopter and wind turbine applications. The Gormont dynamic stall model has been implemented for VAWTs by [2] [3] [10]. Another popular model used to account for dynamic stall is the Beddoes-Leishman (B-L) model. It provides an overall representation of the unsteady phenomenon. The B-L model is commonly used for helicopter blade aerodynamic modeling for Mach Numbers above 0.3. Reference [11] has given recommendations for extending its use for lower Mach number applications.
Flow curvature is an important phenomenon in cross flow turbine blade hydrodynamic efficiency and its proper consideration can improve performance calculations, even for lower blade to radius ratio (c/R) cross flow turbines. Its effect is even more noticeable on the hydrodynamics of higher blade to radius ratio (c/R) cross flow turbines. This phenomenon is caused by unusually large boundary-layer radial pressure gradients and virtually altered camber and incidence [4].
The cost of direct numerical simulation of such a system would make the computational cost very high, if implemented in current models. Simple approximations for these phenomena must therefore be considered.
III. ANALYTICAL MODEL
In order to develop the analytical model the following assumptions were made:
• The tidal turbine works as a stand-alone turbine. • The incoming flow is uniform. • The lift and drag coefficients on a blade element are
calculated by using semi-empirical curves.
As other requirements of the research conducted include, flow profile data, wake decay and pressure gradients before and after the turbine, a FVM model was chosen to be implemented.

IV. NUMERICAL MODEL
A modified FVM model was used. This mprevious work by Reference [2]. A simplified model is shown in Fig.1:
Figure1. Flowchart of a modified Free Vortex Metho
This model requires the input of the bl
calculate the induced velocities due to shevortex considered in this model is the Rankine
22),(
hhjiVP π
Γ×=
The induced velocity is the sum of the velo
all shed vortices and new vortices in thdomain.
The angle of attack is calculated from the The following is used to calculate relative velo
UWiUUUU BTR ()cos( θ −+++= ∞
where U∞ is the undisturbed free stream vdirection and U and W are the induced velocz directions, respectively. The induced velocivortices filaments that include both the blade
U∞θB
UT
U
W
model is based on flow chart of the
od (FVM) model
lade position, to ed vortices. The e vortex type
(1)
cities induced by he computational
relative velocity. ocity
kU BT )sinθ (2)
velocity in the x ities in the x and ities consider the bound and wake
vortices. The tangential speed of theUT.
The angle of attack can be obtaivelocity seen by the blade.
B
B
UUUU
−++=
∞
∞
θθα
cos)(sin)(tan
The lift and drag generated b
directly related to this angle of coefficients are interpolated fromcoefficient table. The bound vortexusing Kutta-Joukowski
21
lB cUC=Γ
Subsequently, the positions of t
calculated. The shed vortex strength
,()1,( NTiNTi BS Γ=−Γ
The tangential and normal forc
needed to calculate the power coefnormal forces can be expressed as:
21
tt cUCF ρ=
21
nn cUCF ρ=
The tangential and normal coeff
drag coefficients can be written as: sin
cos
The torque produced by a single b
21
⎠
⎞⎜⎜⎝
⎛=
∞
+
UU
CRcT R
te
Γn
Γn-Γn-1
UR
α
e blade element is given by
ned by solving the relative
TB
BB
UWW
+−+
θθ
sincos
. (3)
y the incoming flow are attack. The lift and drag
m the input lift and drag x strength is then calculated
2RU
. (4)
the new shed vortices are hs can be written as:
),()1 NTiBΓ−− . (5)
ces seen by the blade are fficient. The tangential and
2RU
(6.1)
2RU
. (6.2)
ficients in terms of lift and
cos (7.1)
sin (7.2)
blade can be written using:
2
⎟⎟⎠
⎞
. (8)
Γn-1-Γn-2 Γn-2-Γn-3
The sum of the non dimensional torque
coefficient.
In order to be able to validate the modnumerical outputs were compared wiexperimental data. Fig. 2 shows data (chord/Radius = 0.135) cross flow turbine at of 5.
Figure 2. Analytical result of the vortex trail for t
The vortex lifting line model is limited by
on post stall information for the lift and dragnot designed to model dynamic stall and information of the pressures along the blade.
This type of the hydrodynamic modelssection characteristic tables (lift and dragfunctions of angle of attack and Reynodetermine the blade loads and turbine pehydrofoil section data are usually derivdimensional, static wind tunnel tests or tstatic airfoil design codes. They are thenempirical, semi-empirical, or analytic methoestimate blade loads under three-dimensconditions. The greatest difficulty in obtpredictions is the determination of the approsection characteristics for the operating enviro
To represent the dynamic stall behavior a
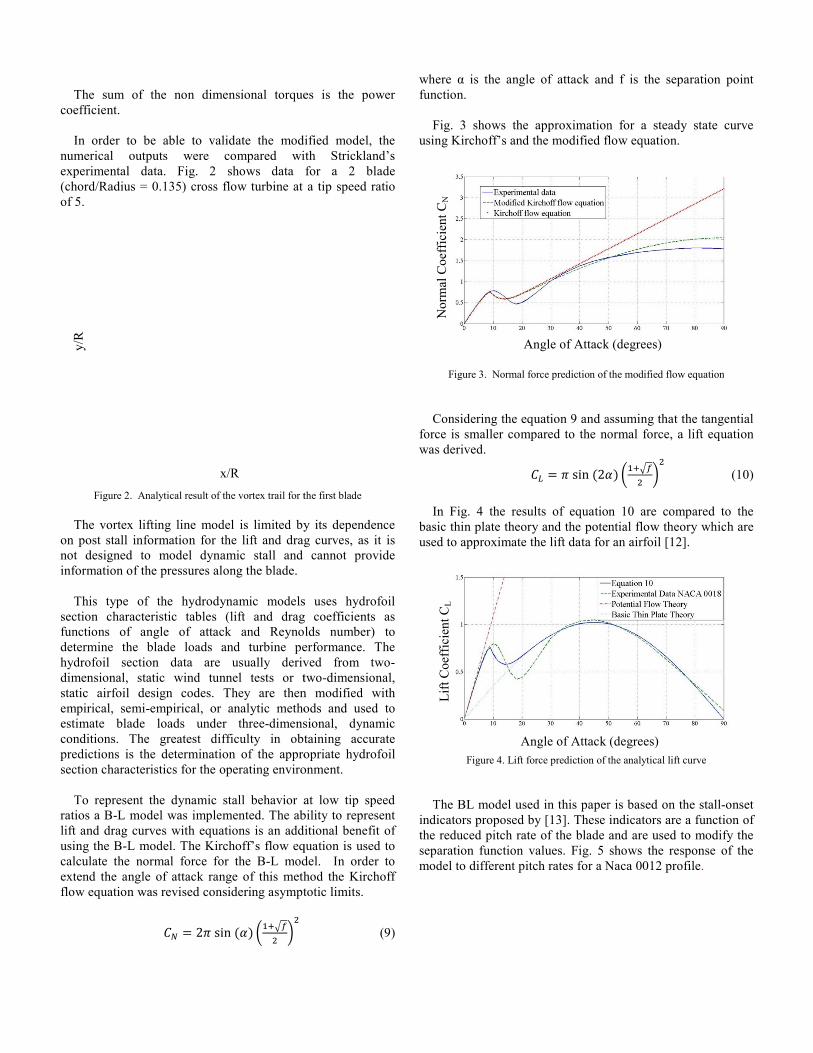
ratios a B-L model was implemented. The ablift and drag curves with equations is an addusing the B-L model. The Kirchoff’s flow eqcalculate the normal force for the B-L modextend the angle of attack range of this methflow equation was revised considering asympt
2 sin
x/R
y/R
es is the power
dified model, the ith Strickland’s for a 2 blade a tip speed ratio
the first blade
y its dependence g curves, as it is
cannot provide
s uses hydrofoil g coefficients as lds number) to erformance. The ved from two-two-dimensional, n modified with ods and used to sional, dynamic taining accurate opriate hydrofoil onment.
at low tip speed bility to represent ditional benefit of quation is used to del. In order to hod the Kirchoff totic limits.
(9)
where α is the angle of attack andfunction.
Fig. 3 shows the approximationusing Kirchoff’s and the modified fl
Figure 3. Normal force prediction of
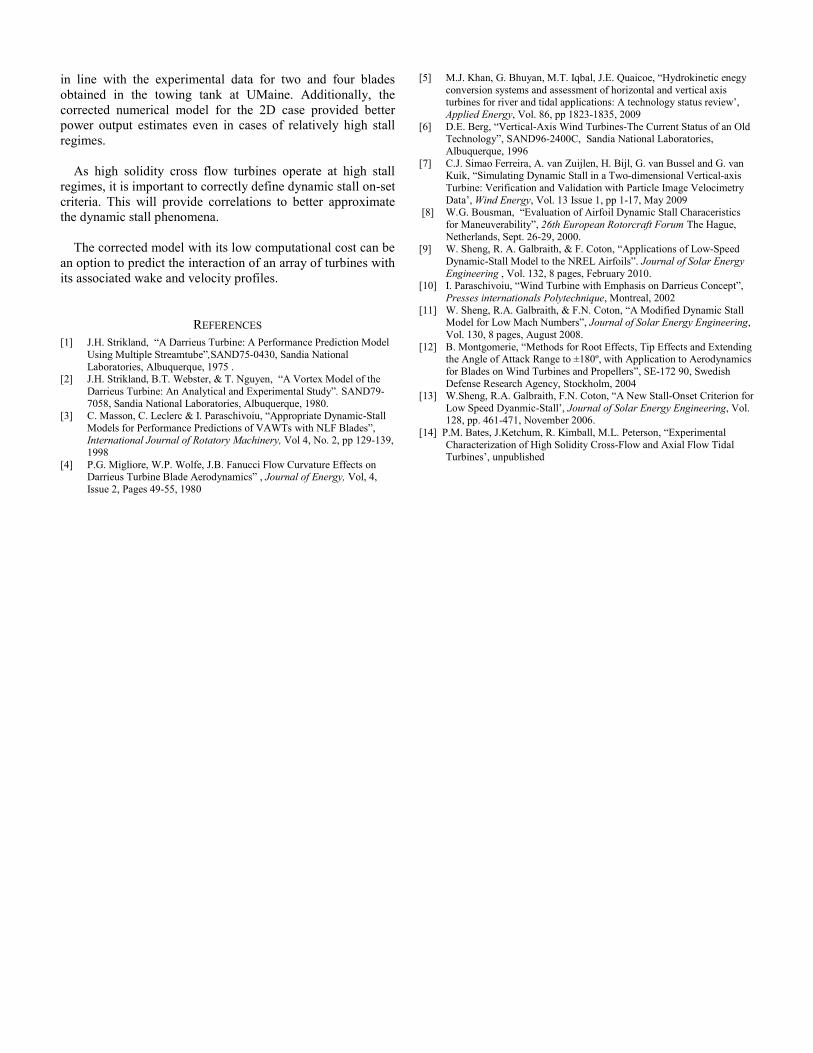
Considering the equation 9 and aforce is smaller compared to the nowas derived. sin 2
In Fig. 4 the results of equatiobasic thin plate theory and the potenused to approximate the lift data for
Figure 4. Lift force prediction of t
The BL model used in this paperindicators proposed by [13]. These the reduced pitch rate of the blade separation function values. Fig. 5 model to different pitch rates for a N
Nor
mal
Coe
ffic
ient
CN
Angle of Attack
Lift
Coe
ffic
ient
CL
Angle of Attack
d f is the separation point
n for a steady state curve flow equation.
the modified flow equation
assuming that the tangential ormal force, a lift equation
(10)
n 10 are compared to the ntial flow theory which are r an airfoil [12].
the analytical lift curve
r is based on the stall-onset indicators are a function of and are used to modify the shows the response of the
Naca 0012 profile.
k (degrees)
(degrees)

Figure 5. Modified B-L Lift curves for different redu
The separation point function used waexponential function proposed by Beddoes: 1 0.4 , 0.02 0.058 , The breakpoint of separation is modifiedpitch rate,
.
For this paper the stall-onset angle of attacdegrees, and the values for S1 and S2, wrespectively.
V. EXPERIMENTAL SET UP
In order to validate the numerical investigtidal current turbines with different bladgeometries were designed, built, and tested inat the University of Maine (UMaine). Theexperimental test was to produce a more accof a turbine in a free stream at high solidity rturbine was tested in two and four bladeResults for a four bladed turbine are present[14].
The experimental turbine diameter was set
foil section used for the blades had a NACAwith an ideal chord length of 0.0762m, of wedge was trimmed to 0.0694m to facilitate The length of the blades used was 0.762mspeed of the carriage during the test was turbine’s tip speed ratio (λ) varied from 0.25 t
Nor
mal
Coe
ffic
ient
CN
Angle of Attack (degre
uced frequencies
s the piecewise
(11.1)
. (11.2)
d by the reduced
(12)
ck used was 9.68 were 3.5 and 1,
ation, a series of de profiles and n the towing tank e purpose of the curate simulation rotor values. The e configurations. ted in this paper
t at 0.325m. The A 633-018 profile which the trailing
its manufacture. m. The maximum
2 m/s and the to 2.5.
Figure 6. Cross-flow test bed developed a
UMaine tow ta
An optical encoder was used toand angular position of the turbine. motor was used to measure the turbine.
Figure 7. 3D Model o
Power is transferred from the tu
chains and sprockets housed in a hytest bed where the power is dissipat
The end plate is designed to different turbine diameters, which eturbine solidity. Additionally, the ethat facilitate varying the angle of in 1 degree increments.
The power produced by the turupper assembly, Fig. 8 where a 1.7with a dual right angle 3:1 gear hethe power. .
es)
at the University of Maine in the ank.
o measure rotational speed A load cell mounted at the torque produced by the
of test bed.
urbine blades through dual ydrofoil shroud to the upper ed and measured.
be configured for three enables the changing of the nd plate has index patterns attack from +/- 10 degrees
rbine is transferred to the 75 kW servomotor coupled ead generates or dissipates

Figure 8. Upper test bed assembly.
Cross-flow turbines are unique because they are not self starting in all flow conditions. As the torque in a cross-flow turbine changes within a rotation of the turbine at different free stream velocities, a motor controller maintains the servo motor at a prescribed tip speed ratio. The motor is capable of switching between power production mode and power dissipation mode, where the electrical energy produced by the turbine is dumped to a resistor bank. The motor controller has an added benefit of enabling the acquisition of negative efficiency data to produce performance characterization at higher tip speed ratios.
VI. CROSS-FLOW EXPERIMENTAL RESULTS
For the analytical model validation, the power coefficient (as a function of λ) and the dimensionless torque (as a function of θ) were acquired and compared.
The acquired performance data was processed by bin-averaging the torque over multiple runs as a function of the turbine rotational position (θ). The analytical power coefficient was obtained using the method described in Ref [2]. In said method, the pattern of the power coefficient formed as the wake is developed after some revolutions is used to predict the final value. The non-dimensional torque for a straight four-bladed cross-flow turbine operating at different tip speed ratios with an inflow velocity of 0.762 m/s and 1.372 m/2 is shown in Fig. 9. The analytical model that does not take dynamic stall into account was shown to underpredict the power coefficient at low tip speed ratios. As was expected, the maximum power coefficient that was experimentally acquired at lower tip speed ratios than what was seen in lower solidity cross flow turbines. This difference can be attributed to the dynamic stall phenomena which produces higher normal and tangential forces when the blade pitches at relatively high angles of attack.
From the experimental data it was also apparent that the
turbine’s power output at different inflow speeds is relatively insensitive to changes in the Reynolds number. Dynamic stall has been reported to present this insensitivity to Reynolds
number, which has been attributed to a dominating effect on the loading of the dynamic stall [8]. This result needs further study.
Figure 9.The overall non dimensional coefficient of performance versus tip speed ratio for 0.762 and 1.372 m/s inflow velocities.
The torque curves of the experimental data was compared
against the curves of the analytical data of the model that take into account the dynamic stall and to that of the unmodified model represented in Fig.10 at a tip speed ratio of 0.5 at 1.372 m/s. The blue dotted line represents the experimental data. The proposed vortex model and the unmodified vortex model are represented by the green line and the red dashed line, respectively. At this tip speed ratio the dynamic stall phenomenon is quite apparent as the turbine was not expected to have large torque values. The steady increase in the angle of attack(as in a ramp-up test) is the result of operating the blade at low tip speed ratios.
Figure 10. Unsteady state non-dimensional torque versus turbine rotational
position.
VII. CONCLUSION
This paper mainly describes the implementation and validation of a vortex method model with dynamic stall correction for estimating the performance of a high solidity cross flow tidal-current turbine. The normal and tangential curves produced by the B-L model provided results that were
1.75 kW Servo motor
3:1 Dual right angle gear head.
Ball bearings allow gear head/ servo motor assembly free rotation.
Load cell holding gear head/servo motor assembly perpendicular to rotation.
Non
dim
ensi
onal
Tor
que
(T
1,2,
3,4
+ )
Rotational position θ (degrees)
Pow
er C
oeff
icie
nt (C
P)
Tip speed ratio (λ)
in line with the experimental data for two and four blades obtained in the towing tank at UMaine. Additionally, the corrected numerical model for the 2D case provided better power output estimates even in cases of relatively high stall regimes.
As high solidity cross flow turbines operate at high stall regimes, it is important to correctly define dynamic stall on-set criteria. This will provide correlations to better approximate the dynamic stall phenomena.
The corrected model with its low computational cost can be an option to predict the interaction of an array of turbines with its associated wake and velocity profiles.
REFERENCES [1] J.H. Strikland, “A Darrieus Turbine: A Performance Prediction Model
Using Multiple Streamtube”,SAND75-0430, Sandia National Laboratories, Albuquerque, 1975 .
[2] J.H. Strikland, B.T. Webster, & T. Nguyen, “A Vortex Model of the Darrieus Turbine: An Analytical and Experimental Study”. SAND79-7058, Sandia National Laboratories, Albuquerque, 1980.
[3] C. Masson, C. Leclerc & I. Paraschivoiu, “Appropriate Dynamic-Stall Models for Performance Predictions of VAWTs with NLF Blades”, International Journal of Rotatory Machinery, Vol 4, No. 2, pp 129-139, 1998
[4] P.G. Migliore, W.P. Wolfe, J.B. Fanucci Flow Curvature Effects on Darrieus Turbine Blade Aerodynamics” , Journal of Energy, Vol, 4, Issue 2, Pages 49-55, 1980
[5] M.J. Khan, G. Bhuyan, M.T. Iqbal, J.E. Quaicoe, “Hydrokinetic enegy conversion systems and assessment of horizontal and vertical axis turbines for river and tidal applications: A technology status review’, Applied Energy, Vol. 86, pp 1823-1835, 2009
[6] D.E. Berg, “Vertical-Axis Wind Turbines-The Current Status of an Old Technology”, SAND96-2400C, Sandia National Laboratories, Albuquerque, 1996
[7] C.J. Simao Ferreira, A. van Zuijlen, H. Bijl, G. van Bussel and G. van Kuik, “Simulating Dynamic Stall in a Two-dimensional Vertical-axis Turbine: Verification and Validation with Particle Image Velocimetry Data’, Wind Energy, Vol. 13 Issue 1, pp 1-17, May 2009
[8] W.G. Bousman, “Evaluation of Airfoil Dynamic Stall Characeristics for Maneuverability”, 26th European Rotorcraft Forum The Hague, Netherlands, Sept. 26-29, 2000.
[9] W. Sheng, R. A. Galbraith, & F. Coton, “Applications of Low-Speed Dynamic-Stall Model to the NREL Airfoils”. Journal of Solar Energy Engineering , Vol. 132, 8 pages, February 2010.
[10] I. Paraschivoiu, “Wind Turbine with Emphasis on Darrieus Concept”, Presses internationals Polytechnique, Montreal, 2002
[11] W. Sheng, R.A. Galbraith, & F.N. Coton, “A Modified Dynamic Stall Model for Low Mach Numbers”, Journal of Solar Energy Engineering, Vol. 130, 8 pages, August 2008.
[12] B. Montgomerie, “Methods for Root Effects, Tip Effects and Extending the Angle of Attack Range to ±180º, with Application to Aerodynamics for Blades on Wind Turbines and Propellers”, SE-172 90, Swedish Defense Research Agency, Stockholm, 2004
[13] W.Sheng, R.A. Galbraith, F.N. Coton, “A New Stall-Onset Criterion for Low Speed Dyanmic-Stall’, Journal of Solar Energy Engineering, Vol. 128, pp. 461-471, November 2006.
[14] P.M. Bates, J.Ketchum, R. Kimball, M.L. Peterson, “Experimental Characterization of High Solidity Cross-Flow and Axial Flow Tidal Turbines’, unpublished