Development and anlysis of a 20K SNP array for potato (Solanum tuberosum) an insight in the breeding...
15
1 3 Theor Appl Genet DOI 10.1007/s00122-015-2593-y ORIGINAL ARTICLE Development and analysis of a 20K SNP array for potato (Solanum tuberosum): an insight into the breeding history Peter G. Vos 1 · Jan G. A. M. L. Uitdewilligen 1 · Roeland E. Voorrips 1 · Richard G. F. Visser 1,2 · Herman J. van Eck 1,2 Received: 3 December 2014 / Accepted: 23 July 2015 © The Author(s) 2015. This article is published with open access at Springerlink.com of SNP markers linked to R-genes. In addition, when the genetic composition of modern cultivars was compared with cultivars released before 1945, it appears that 96 % of the genetic variants present in those ancestral cultivars remains polymorphic in modern cultivars. Hence, genetic erosion is almost absent in potato. Finally, we studied pop- ulation genetic processes shaping the genetic composition of the modern European potato including drift, selection and founder effects. This resulted in the identification of major founders contributing to contemporary germplasm. Introduction The genetic diversity of cultivated potato, as studied today, is easier to interpret with insights from the past events that have shaped the gene pool. These past events include (1) the amount of genetic variation that was brought from South America to Europe since the late 16th century (Hawkes and Francisco-Ortega 1993), (2) the loss of diversity dur- ing the late blight epidemics in the 19th century, and more recently (3) introductions of (wild) Latin American spe- cies contributing to pathogen resistance, and (4) the more focussed breeding for specific niche markets. These genetic interventions leave their traces and can be recognized using modern DNA tools. Moreover, the maintenance of the orig- inal named cultivars via clonal reproduction allows the his- torical analysis of the breeding process by comparing their genetic makeup with contemporary cultivars. A number of historic cultivars dating back to the 19th century are still widely grown, as progress in cultivar improvement is limited due to the low reproduction rate and complex autotetraploid inheritance (2n = 4x = 48). Examples of historic cultivars are Russet Burbank (1908), a Burbank (1876) mutant, the most important cultivar in Abstract Key message A 20K SNP array was developed and a comprehensive set of tetraploid cultivar was genotyped. This allowed us to identify footprints of the breed‑ ing history in contemporary breeding material such as identification of introgression segments, selection and founder signatures. Abstract A non-redundant subset of 15,138 previously identified SNPs and 4454 SNPs originating from the Sol- CAP project were combined into a 20k Infinium SNP array for genotyping a total of 569 potato genotypes. In this study we describe how this SNP array (encoded SolSTW array) was designed and analysed with fitTetra, software designed for autotetraploids. Genotypes from different countries and market segments, complemented with his- toric cultivars and important progenitors, were genotyped. This comprehensive set of genotypes combined with the deliberate inclusion of a large proportion of SNPs with a low minor allele frequency allowed us to distinguish genetic variation contributed by introgression breeding. This “new” (post 1945) genetic variation is located on spe- cific chromosomal regions and enables the identification Communicated by G. J. Bryan. Electronic supplementary material The online version of this article (doi:10.1007/s00122-015-2593-y) contains supplementary material, which is available to authorized users. * Herman J. van Eck [email protected] 1 Wageningen UR, Plant Breeding, P.O. Box 386, 6700 AJ Wageningen, The Netherlands 2 Centre for BioSystems Genomics, P.O. Box 98, 6700 AB Wageningen, The Netherlands
Transcript of Development and anlysis of a 20K SNP array for potato (Solanum tuberosum) an insight in the breeding...

1 3
Theor Appl GenetDOI 10.1007/s00122-015-2593-y
ORIGINAL ARTICLE
Development and analysis of a 20K SNP array for potato (Solanum tuberosum): an insight into the breeding history
Peter G. Vos1 · Jan G. A. M. L. Uitdewilligen1 · Roeland E. Voorrips1 · Richard G. F. Visser1,2 · Herman J. van Eck1,2
Received: 3 December 2014 / Accepted: 23 July 2015 © The Author(s) 2015. This article is published with open access at Springerlink.com
of SNP markers linked to R-genes. In addition, when the genetic composition of modern cultivars was compared with cultivars released before 1945, it appears that 96 % of the genetic variants present in those ancestral cultivars remains polymorphic in modern cultivars. Hence, genetic erosion is almost absent in potato. Finally, we studied pop-ulation genetic processes shaping the genetic composition of the modern European potato including drift, selection and founder effects. This resulted in the identification of major founders contributing to contemporary germplasm.
Introduction
The genetic diversity of cultivated potato, as studied today, is easier to interpret with insights from the past events that have shaped the gene pool. These past events include (1) the amount of genetic variation that was brought from South America to Europe since the late 16th century (Hawkes and Francisco-Ortega 1993), (2) the loss of diversity dur-ing the late blight epidemics in the 19th century, and more recently (3) introductions of (wild) Latin American spe-cies contributing to pathogen resistance, and (4) the more focussed breeding for specific niche markets. These genetic interventions leave their traces and can be recognized using modern DNA tools. Moreover, the maintenance of the orig-inal named cultivars via clonal reproduction allows the his-torical analysis of the breeding process by comparing their genetic makeup with contemporary cultivars.
A number of historic cultivars dating back to the 19th century are still widely grown, as progress in cultivar improvement is limited due to the low reproduction rate and complex autotetraploid inheritance (2n = 4x = 48). Examples of historic cultivars are Russet Burbank (1908), a Burbank (1876) mutant, the most important cultivar in
Abstract Key message A 20K SNP array was developed and a comprehensive set of tetraploid cultivar was genotyped. This allowed us to identify footprints of the breed‑ing history in contemporary breeding material such as identification of introgression segments, selection and founder signatures.Abstract A non-redundant subset of 15,138 previously identified SNPs and 4454 SNPs originating from the Sol-CAP project were combined into a 20k Infinium SNP array for genotyping a total of 569 potato genotypes. In this study we describe how this SNP array (encoded SolSTW array) was designed and analysed with fitTetra, software designed for autotetraploids. Genotypes from different countries and market segments, complemented with his-toric cultivars and important progenitors, were genotyped. This comprehensive set of genotypes combined with the deliberate inclusion of a large proportion of SNPs with a low minor allele frequency allowed us to distinguish genetic variation contributed by introgression breeding. This “new” (post 1945) genetic variation is located on spe-cific chromosomal regions and enables the identification
Communicated by G. J. Bryan.
Electronic supplementary material The online version of this article (doi:10.1007/s00122-015-2593-y) contains supplementary material, which is available to authorized users.
* Herman J. van Eck [email protected]
1 Wageningen UR, Plant Breeding, P.O. Box 386, 6700 AJ Wageningen, The Netherlands
2 Centre for BioSystems Genomics, P.O. Box 98, 6700 AB Wageningen, The Netherlands

Theor Appl Genet
1 3
the USA and Bintje (1910) ranking 1st in Belgium and 6th in the Netherlands in 2014. Throughout the 100 years of breeding hardly any increase in yield has been achieved (Douches et al. 1996), nevertheless major improvements have been made by introgression of resistance genes. Introgression breeding, practiced from the early 20th cen-tury onwards, focussed on late blight, cyst nematodes and viruses using S. demissum, S. stoloniferum, S. tuberosum Group Andigena clone CPC-1673 and S. vernei reviewed by Bradshaw and Ramsay (2005). This review describes the utilization of the Commonwealth Potato Collection (CPC) material, and similar work was performed in Ger-many and the Netherlands using other germplasm collec-tions, e.g. Braunschweig Genetic Resource Collection (BGRC). Markers have been developed for the vast major-ity of the important resistance genes. Recent genepool-wide validation studies that aim to predict the presence of multiple resistances are still being performed with single locus marker techniques (Lopez-Pardo et al. 2013; Sharma et al. 2014). Unfortunately, it will take an additional effort to convert gel-based markers into SNP assays suitable for highly parallel genotyping methods.
In contrast to breeding for resistance, marker-assisted breeding for yield and tuber quality traits is still in its infancy. Marker-assisted breeding for such traits with a quantitative and polygenic nature will require a much deeper understanding of the loci and the beneficial and deleterious alleles involved. Genomic selection however does not rely on such information, but for both strategies the implementa-tion of SNP arrays is urgent, to allow sufficient data collec-tion to improve breeding efficiency. One of the first exam-ples of highly parallel marker studies in potato made use of methods such as the Golden Gate assay (Anithakumari et al. 2010), the KASP SNP genotyping system (http://www.kbi-oscience.co.uk) (Lindhout et al. 2011) and more recently a SNP array with 8303 markers was developed (Felcher et al. 2012; Hamilton et al. 2011), which is currently widely used in potato research (Hirsch et al. 2013; Manrique-Carpintero et al. 2014; Prashar et al. 2014).
Such a SNP array requires a SNP discovery study, which is facilitated by next-generation sequencing. Dif-ferent approaches for SNP discovery are used such as (1) whole genome resequencing (Yamamoto et al. 2010), (2) transcriptome sequencing (Barbazuk et al. 2007; Hamilton et al. 2011, 2012; Trick et al. 2009) and (3) reduced repre-sentation sequencing based on restriction enzymes (Baird et al. 2008). These studies do not need any prior knowledge of a reference genome. The study of Uitdewilligen et al. (2013) used the potato reference genome (PGSC 2011) to perform a targeted resequencing of a subset of 800 genes (2.1 Mb) from the potato genome.
Many of these SNP discovery studies are based on a few genotypes, for example the parents of an important
mapping population (Bundock et al. 2009), one rice cul-tivar compared to the reference genome (Yamamoto et al. 2010), six potato cultivars (Hamilton et al. 2011) or four tomato cultivars combined with two wild relatives (Sim et al. 2012). Even the most commonly used array in Arabi-dopsis was based on the sequence of only 19 accessions (Kim et al. 2007). This could result in an ascertainment bias when this array is applied on a much wider or dif-ferent germplasm (Moragues et al. 2010; Thomson et al. 2012). In more recent studies larger SNP discovery panels are sequenced, for example in wheat (Wang et al. 2014). Also in potato a relatively large panel representative for the worldwide gene pool has been used for targeted rese-quencing (Uitdewilligen et al. 2013). These discovery stud-ies on a wider gene pool are more suitable for the develop-ment of large arrays and can be applied to a much wider germplasm.
In this paper we describe the design of a potato 20K SNP array using the two major discovery studies available in potato (Uitdewilligen et al. 2013; Hamilton et al. 2011). On this SNP array a large number of relatively rare vari-ants from Uitdewilligen et al. (2013) have been included. The array was used to genotype a comprehensive panel of 569 genotypes, which included many historically important cultivars and progenitors, from different origin and market niches. We describe the analysis of this array with fitTetra (Voorrips et al. 2011) and subsequently we explore the (changes in the) genetic composition of the potato genep-ool. This allowed us to (1) identify introgression segments of different origin, (2) study the impact of breeding on allele frequencies in modern germplasm.
Materials and methods
Development of SolSTW array
A 20K SNP array was developed predominantly using a subset of the DNA sequence variants as described by Uitdewilligen et al. (2013). Several design criteria were taken into consideration to minimize the risk of assay fail-ure due to flanking polymorphisms, and to maximize the ability to capture haplotypes across the diversity of potato germplasm.
According to the manufacturer’s instructions an Illumina SNP assay has to be free from flanking SNP over a region of preferably 60 bp at one side of the SNP to develop an optimal array. The SNPs selected from Uitdewilligen et al. (2013) were chosen to the following criteria (1) no InDels, tri- or quad- SNPs, (2) no InDels in flanking sequence, (3) only SNPs genotyped with a read depth ≥15× in at least 25 cultivars, (4) minimum flanking SNPs free distance is five nucleotide positions, (5) maximum flanking SNPs at

Theor Appl Genet
1 3
position 6–10 = 1, (6) maximum flanking SNPs at position 6–50 = 5 and (7) no Infinium type I assays. If both the left and right flanking sequences passed these criteria, then the side was chosen with the lowest number of SNPs in the first 10, or 25 or 50 bp.
Next to criteria on technical suitability of SNPs, we applied genetic criteria to reduce redundancy of SNPs whilst maximizing the inclusion of SNPs from different haplotypes. To this end the genotyping calls across 83 cul-tivars from Uitdewilligen et al. (2013) that were used to cluster SNPs with a Kendall tau test and correlated SNPs (r2 > 0.5) were considered as one cluster. As a next step the clusters were ordered per gene and subsequently two SNPs per cluster per gene were selected. For the clusters without two SNPs within a gene, one SNP per cluster was selected. Finally singletons were added which were geno-typed in at least 67 cultivars, had a maximum of 2 flank-ing SNPs within 25 bp and no flanking SNPs within 10 bp. In this way SNPs are selected over the full length of large introgression segments and we tried to achieve a uniform distribution of SNPs across the length of the genome and across the depth of haplotypes. We did not filter SNPs according to allele frequency as calculated by Uitdewilli-gen et al. (2013), because our designed SNP array should allow to monitor the potential increase and decrease of both abundant as well as rare alleles during specific breeding efforts for specific market niches. We did not exclude culti-var-unique SNPs, with the exception of the excessive num-ber of 2,688 unique variants observed in cultivar Vitelotte Noire alone. This resulted in the selection of 15,123 SNPs from Uitdewilligen et al. (2013). Furthermore, 37 chloro-plast markers were included (supplementary file 1).
Additionally, we included a subset of 4179 SNPs from the 8303 SolCAP array (Hamilton et al. 2011), which
were reported to us to perform well on European tetraploid germplasm (Data not shown). To further improve genome coverage we analysed which PGSC superscaffolds of the potato genome were not yet or insufficiently represented. This resulted in the selection of an additional 284 mark-ers from the 69,011 SolCAP SNPs discovered in Hamilton et al. (2011). Finally, we manually developed 124 SNPs in functional genes involved in morphological and disease resistance traits. In Fig. 1 a Venn diagram is shown of the number of SNPs in each class mentioned above. The fig-ure does not include 87 SNPs which have been found by both the SolCAP and our SNP discovery studies. This Venn diagram shows the attempted numbers of SNPs, but unfor-tunately, the total number of delivered SNPs was lower as shown in Table 1. To avoid any confusion this 20K SNP array is called the SolSTW array hereafter. It should be noted that Fig. 1 shows the attempted number of SNPs for the SolSTW array and the actual delivered number of SNPs for the SolCAP 8303 array. In supplementary file 1 addi-tional information is specified for all markers as well as assay sequences.
Plant materials
In this study we report about 639 DNA samples hybrid-ized on the SolSTW array, of which 569 were unique genotypes consisting of 537 tetraploids and 32 diploids. To analyse the reproducibility, 39 tetraploid and 5 diploid samples were replicated on the array using DNA isolated from plants obtained from different sources. Besides these replicates the DNA from a single DNA isolation of clone RH89-039-16 (26 times) was used as an internal standard. The tetraploid genotypes consisted of 192 genotypes of a representative subset of commercial potato germplasm
Fig. 1 SNP Resources. Venn diagram of SNPs used for development of the SolSTW array (Orange). SNPs origi-nated from the 8303 SolCAP array are indicated in purple, SNPs originated from Uitdewil-ligen et al. (2013) are indicated in blue and SNP from Hamilton et al. (2011) are indicated in green. This figure does not display 87 SNPs included in the SolSTW array, which have been described by both the SNP discovery studies (Uitdewilligen et al. 2013 and Hamilton et al. 2011) (color figure online)
Theor Appl Genet
1 3
available worldwide, selected for the study of (D’hoop et al. 2008) and complemented with a set of 173 advanced breeding lines from Dutch potato breeders described in D’hoop et al. 2011, 2014, respectively. An additional set of 171 genotypes was collected, consisting of 51 cultivars and 120 advanced breeding lines provided by Dr. Ronald Hutten (Wageningen UR Plant Breeding) and the company Meijer B.V. The names and additional information of the genotypes are provided in supplementary file 2.
Data collection: DNA
Leaf material was collected for DNA extraction using the Thermo Scientific KingFisher Flex. DNA concentra-tion was measured with the NanoDrop spectrophotometer and the DNA concentration was adjusted to ~50 ng µL−1 when possible. When DNA concentration was lower than 50 ng µL−1 the sample was still used up to a minimum of 25 ng µL−1 whilst for samples with lower concentrations a new DNA isolation was performed. For each 96-well plate the diploid genotype RH89-039-16 was included as a control. Infinium arrays were processed according to the manufacturer’s suggested protocol at ServiceXS, Leiden, the Netherlands.
Genotype calling with fitTetra
For the genotype calling, fitTetra (Voorrips et al. 2011) and Illumina GenomeStudio software (version 2010.3, Illumina, San Diego, CA) were used. Whilst the polyploid module of GenomeStudio requires manual determination of the position and boundaries of the five clusters for each marker separately, fitTetra can perform this task fully auto-mated. Therefore fitTetra was used to automatically score all markers. GenomeStudio was only used when the clus-tering of fitTetra resulted in inadequate genotype calling according to the criteria described below.
fitTetra first removes all data points with an overall R-value (overall intensity) below 0.2. Subsequently two default settings of fitTetra were adjusted (1) p.threshold was lowered from 0.99 to 0.95, which implies that there is 95 % confidence of a sample belonging to a cluster, result-ing in less missing calls as compared to the more strict 0.99
threshold. (2) The peak.threshold was increased from 0.85 to 0.99, which allows SNPs with a very low allele frequency (up to 99 % of all markers in 1 genotypic class) to be fitted by fitTetra. This was needed because the design of the array included a high number of low frequent SNPs. (3) the call.threshold was set to 0.60, resulting in the rejection of mark-ers with more than 40 % missing values. Diploid samples are analysed along with the tetraploids to allow verification of the correct recognition of the nulliplex (AAAA), duplex (AABB) or quadruplex (BBBB) clusters.
Simultaneous analysis of diploids and tetraploids may however compromise Hardy–Weinberg assumptions imple-mented in fitTetra and this may result in the rejection of markers that display deviations from Hardy–Weinberg equilibrium. Therefore two runs were performed, one with and one without the diploid samples. Genotype calls of both fitTetra runs were compared and inspected for markers having obvious genotyping errors such as (1) a heterozy-gous genotype call for the reference genome genotype DM; (2) diploid genotype calls assigned to simplex or triplex clusters and (3) deviating Mendelian segregation in a tetra-ploid mapping population from a matching project (anal-ysis of the tetraploid mapping population is beyond the scope of this paper). Markers showing one of these unex-pected results could be the result of a poor marker or a poor clustering by fitTetra. The poorly clustered markers along with the chloroplast markers were manually scored with GenomeStudio. Additionally SNP markers initially rejected by fitTetra were visually inspected using the graphical out-put of fitTetra (Fig. 2) to diagnose the correctness of the rejection. SNP markers, rejected by fitTetra, but allowed manual scoring were re-joined with the final dataset using GenomeStudio.
Genotype calling with fitTetra results in dosage scores (0, 1, 2, 3 or 4) which reflects the Infinium assay design by the manufacturer, which uses the A nucleotide as a refer-ence. Genotype calls were converted from the initial Illu-mina format into two derived datasets. The first dataset (used for association analysis) is based on the DM refer-ence genome, where the SNP alleles are indicated as REF (DM) and ALT (non-DM). SNP dosage values ranging from 0 to 4 reflects the observed number of non-DM SNP alleles. The second dataset (used for population genetic
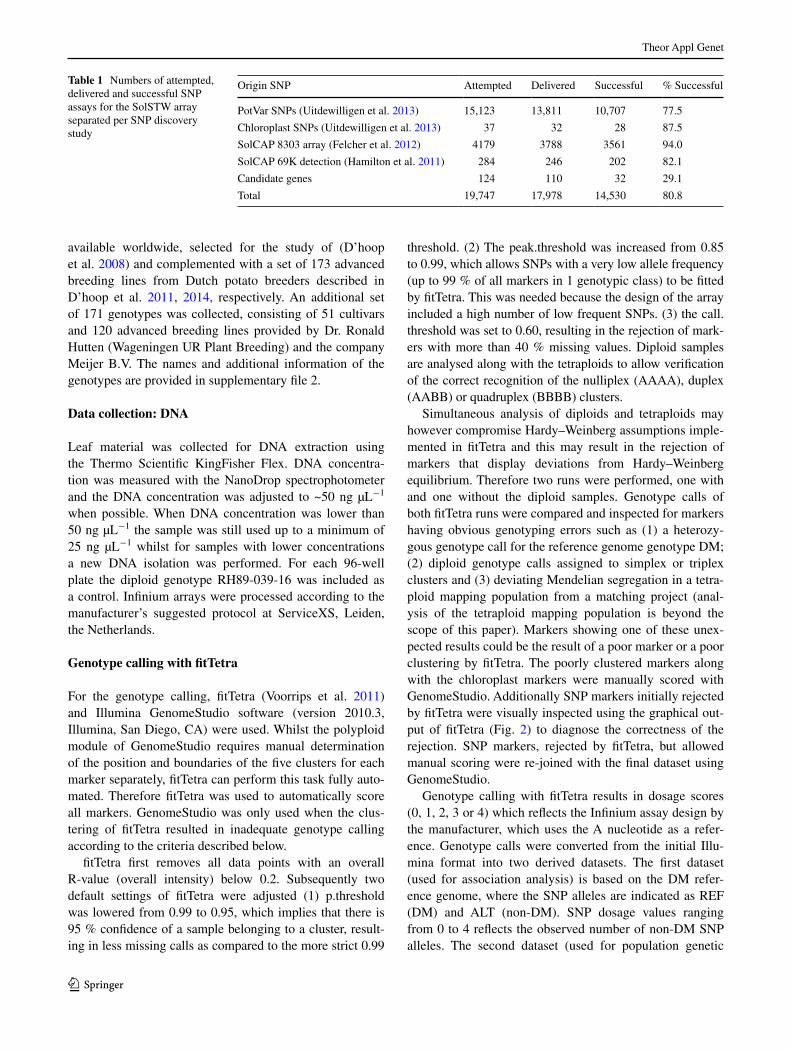
Table 1 Numbers of attempted, delivered and successful SNP assays for the SolSTW array separated per SNP discovery study
Origin SNP Attempted Delivered Successful % Successful
PotVar SNPs (Uitdewilligen et al. 2013) 15,123 13,811 10,707 77.5
Chloroplast SNPs (Uitdewilligen et al. 2013) 37 32 28 87.5
SolCAP 8303 array (Felcher et al. 2012) 4179 3788 3561 94.0
SolCAP 69K detection (Hamilton et al. 2011) 284 246 202 82.1
Candidate genes 124 110 32 29.1
Total 19,747 17,978 14,530 80.8

Theor Appl Genet
1 3
Fig. 2 GenomeStudio (left) and fitTetra (right) output. In panel a and b an ideal marker is visible, where five clusters are clearly distinguishable and the diploid samples (grey bars) cluster in the nulliplex, duplex and quadruplex clusters. In panel c and d a marker with a “cloud” of data points with overlap between clusters is vis-ible, in panel e and f a marker with >5 clusters is visible and in panel g and h a marker with the nulliplex cluster shifted to the right is visible. Grey bars in fitTetra output represent diploid samples, these should cluster in three groups as in a. Blue bars in the bottom of fitTetra output represent the dosage calls and red bars represent genotypes which are in-between clusters (color figure online)
0 0.20 0.40 0.60 0.80 1
Norm Theta
PotVar0001818
-0.20
0
0.20
0.40
0.60
0.80
1
1.20
1.40
1.60
1.80
2.00
2.20
Nor
mR
2288 87 0
0 0.20 0.40 0.60 0.80 1
Norm Theta
PotVar0039087
-0.20
0
0.20
0.40
0.60
0.80
1
1.20
1.40
1.60
1.80
2.00
2.20
2.40
Nor
mR
153 1628 501
0 0.20 0.40 0.60 0.80 1
Norm Theta
PotVar0079248
-0.20
0
0.20
0.40
0.60
0.80
1
1.20
1.40
1.60
1.80
2.00
Nor
mR
104 425 1490
0 0.20 0.40 0.60 0.80 1
Norm Theta
solcap_snp_c2_41745
-0.20
0
0.20
0.40
0.60
0.80
1
1.20
1.40
1.60
1.80
2.00
Nor
mR
458 1305 393
A B
C D
E F
G H

Theor Appl Genet
1 3
analysis; this study) is based on the population minor allele frequency (MAF), where the SNP alleles are indicated as MIN (minor allele) or MAJ (major allele). SNP dosage val-ues in this second dataset ranging from 0 to 4 reflect the observed dosage of the minor allele. This MAF dataset is more convenient, because none of the many haplotypes in the potato gene pool assumes a haplotype frequency exceeding 50 % (Uitdewilligen et al. 2013).
SNP dating to identify introgression breeding
In the second SNP dataset (MAF) the SNP dosage speci-fies the presence of specific SNP alleles. Subsequently we searched for the oldest cultivar that had this minor SNP allele. The age of a genotype is based on the year of mar-ket release as listed in the potato pedigree database (Van Berloo et al. 2007). For progenitors/unnamed genotypes the year of crossing plus 10 years was taken. In this way the genotype and the year of introduction of each SNP was estimated. SNPs polymorphic in one of the 48 cultivars released before 1945 are defined as “pre-1945” genetic var-iants. These SNP markers usually continue to be polymor-phic after 1945. SNPs being monomorphic before 1945 and polymorphic in one or more of the 489 genotypes released after 1945 are assumed to be the result of introgression breeding and are defined as “new” or “post-1945” variants. The year 1945 was chosen because in 1946 Craigs Bounty was released, which is the oldest cultivar in our dataset har-bouring wild species in its pedigree.
Analysis of changes in genetic composition of the potato gene pool
Changes in allele frequency were calculated to study the effect of breeding on the genetic composition of the gene pool. For this purpose the allele frequencies in the group of cultivars released before 1945 (N = 48) was compared with the allele frequency in cultivars released since 2005 (N = 81) and the allele frequency in the “starch” sub-pop-ulations (N = 59). Additionally the effect of allele dosage in important founders was compared with allele frequency changes. The subsets of genotypes are specified in supple-mentary file 2.
Results
Development of the SolSTW SNP array
The SolSTW SNP array combines SNPs from two dis-covery studies (Hamilton et al. 2011; Uitdewilligen et al. 2013). SNPs originating from Hamilton et al. (2011) were selected based on good performance in an earlier
experiment using the SolCAP SNP array (data not shown) without any additional selection criteria. In contrast, the large set of 129,156 SNPs originating from Uitdewilligen et al. (2013) required stringent selection criteria since only a small subset could be selected. The high SNP density in potato allowed us to narrow down the number of poten-tial SNP assays to 59,279 SNPs. Subsequently, redun-dancy amongst SNPs was reduced by clustering all SNPs according to SNP dosage as described by Uitdewilligen et al. (2013). This resulted in 7019 clusters and 5334 single SNPs (singletons). For around 5200 clusters, two or more SNP per cluster and gene were selected. Of the remaining approximately 1800 clusters, one SNP was selected and complemented with 2738 singletons, resulting in a total of 15,123 selected SNPs. SNPs originating from Uitdewil-ligen et al. (2013) will be referred to as PotVar SNPs. In Table 1 the attempted numbers of SNPs are shown.
Optimization of fitTetra with SolSTW array
Several runs were performed with fitTetra for genotype calling using the signal ratios obtained from the Infinium array. Over sequential runs, the programme settings were optimized and minor errors of the software were corrected. Two properties of the Infinium data initially resulted in erroneous clustering by the software. Firstly it appeared that the five clusters are not evenly distributed over the X-axis, as shown in Fig. 2a, b. In particular the three het-erozygous clusters are closer to each other and relatively far from the two homozygous clusters. Secondly, the signal of the homozygous clusters is biased and not exactly at 0 or at 1 as shown in Fig. 2g, h. These modifications of the software are processed in the publically available version of fitTetra since autumn 2013 (https://www.wageningenur.nl/en/show/Software-fitTetra.htm).
Analysis of the SolSTW array with optimized fitTetra software
The improved version of fitTetra was used for the genotype calling of the SolSTW array. The genotype calling was per-formed twice, once using all genotypes and a second run without the diploid genotypes. The genotype calling with-out the diploid samples was used for further analysis, as inclusion of the diploid samples resulted in an additional rejection of 1184 markers, due to deviation from a Hardy–Weinberg test by fitTetra. The analysis of the tetraploid samples resulted in 15,271 fitted and 2716 rejected mark-ers. Subsequently, a bi-parental tetraploid mapping popula-tion was used to identify SNPs where parental SNP dosage and offspring ratios were in disagreement. This is a puta-tive indicator of poor SNP performance, and visual inspec-tion of GenomeStudio output as shown in Fig. 2 resulted

Theor Appl Genet
1 3
in the rejection of another 378 SNPs. In addition 1832 markers with a call rate below 95 % in fitTetra were visu-ally inspected using GenomeStudio. The remainder of 6041 SNPs with good Mendelian fit and call rate >95 % were assumed to be good calls, and visual inspection was omit-ted. For the visual inspection fitTetra output was used as shown in Fig. 2b, d, f, h. In these figures diploid samples are illustrated with grey bars. The position on the X-axis of the diploids allows one to identify potentially poor mark-ers, when diploid samples are in simplex or triplex clusters. As shown in Fig. 2d, f the diploid samples do not cluster together in the nulliplex, duplex or quadruplex clusters and therefore markers like these were removed. This incorrect clustering of diploids was predominantly observed in mark-ers with more than 5 clusters as shown in Fig. 2e, f or mark-ers with “clouds” of data points as shown in Fig. 2c, d. For 1206 of the 1832 markers with >5 % missing calls, visual inspection resulted in the removal of the markers from the final dataset. For 626 markers, fitTetra produced false nega-tive genotype calls based on correct marker signal intensi-ties. Such markers were manually re-scored using Genom-eStudio. The 2716 rejected markers were visually inspected with fitTetra output as shown in Fig. 2, and scored manu-ally if the marker was mistakenly rejected. This resulted in the recovery of 843 markers. Of these 843 markers 689 had an allele frequency below 1 %, therefore these were cor-rectly rejected based on the peak.threshold setting in fitTetra of 0.99. The remaining 154 were mistakenly rejected for unknown reasons.
Reproducibility of genotype calls
As shown in Tables 1 and 2 the data collection with fitTetra and GenomeStudio resulted in a final dataset with a high number of 14,530 SNP markers. The genotype calls of the 39 replicated tetraploid samples showed a high concordance between replications. On average, only 3.3 calls (0.02 %) differed between the replicated samples of which 60 % are differences within the heterozygous clusters. Additionally for 74 (0.5 %) markers on average there was no call for either of the genotypes. The 26 replicates of the internal diploid control also showed highly concordant results. We observed seven markers with a deviating observation. In addition, we observed 66 markers with one or more missing calls, of which 50 % were caused by two of the twenty-eight replicates.
The percentage of missing calls was very low for the final dataset of 14,530 markers and 537 genotypes, with only an average of 95 missing calls per genotype and 3.5 missing calls per marker (0.65 %). For genotypes having wild species in their pedigree and not used in the SNP dis-covery panel of Uitdewilligen et al. (2013), the average number of missing values was much higher (184).
Analysis of factors influencing assay failure
Several possible factors that could cause assay failure have been examined. In Table 1 percentages of assay failure are shown based on the origin of the SNP assay. What is clearly visible is that the SolCAP SNPs originating from the 8303
Table 2 Summary of total number of SNPs
Numbers of SNP markers per chromosome separated per origin (PotVar, SolCAP) and SNP age (pre-, or post-1945). Manually developed markers are within the set of PotVar markersa St4.03ch00 lists marker that are located on unanchored scaffolds of the reference genome
Chromosome PotVar SolCAP Total % New
Pre-1945 Post-1945 Pre-1945 Post-1945
St4.03ch00a 42 7 45 1 95 131
St4.03ch01 902 478 405 17 1802 27.5
St4.03ch02 840 405 316 50 1611 28.1
St4.03ch03 662 307 293 45 1307 26.9
St4.03ch04 767 305 382 8 1462 21.4
St4.03ch05 830 254 214 24 1322 21.0
St4.03ch06 524 177 277 6 984 18.6
St4.03ch07 524 318 333 20 1195 282
St4.03ch08 485 154 334 4 977 16.2
St4.03ch09 535 206 302 9 1052 20.1
St4.03ch10 385 179 206 1 771 23.4
St4.03ch11 498 291 247 12 1048 28.8
St4.03ch12 479 185 190 22 876 23.6
Chloroplast 13 15 – – 28 53.6
Total 7486 3281 3544 219 14,530 24.1

Theor Appl Genet
1 3
array are most successful (94.0 %), because these SNPs were tested before with the Infinium platform. The non-pre-tested SNPs from Hamilton et al. and the SNPs originating from the SNP discovery study of Uitdewilligen et al. (2013) show a lower percentage of successful assays (82.5 and 77.5 %, respectively). However, when considering mark-ers in coding regions only, the assay failure rate of PotVar SNPs is much lower (11.4 %, Table 3). For SNPs that were manually developed the majority failed (70 %), this could be explained by the location in R-genes, which are mem-bers of a large highly variable gene family. In Table 3 per-centages of assay failure of 12,272 SNPs are shown based on their localization in coding or non-coding regions, as well as based on their chromosomal position on the pseu-domolecules (Sharma et al. 2013). The latter can be divided in euchromatin, pericentromeric heterochromatin and the border between the two. It is clear that SNPs localized in the pericentromeric heterochromatin are more likely to fail.
However, more significant is the low percentage of assay failure in coding regions compared to non-coding regions.
The high nucleotide diversity of potato implies that SNP assays may be frequently affected by flanking SNPs. There-fore we aimed to target SNPs without flanking SNPs for assays, this is however problematic in potato due to its high SNP density. Consequently for many (34.8 %) SNP assays (originating from Uitdewilligen et al. 2013) on this array, known flanking SNPs are present. In Fig. 3a the percentage of assay failure of these PotVar SNPs is shown as a func-tion of the distance of the flanking SNPs. This graph shows a trend where flanking SNP distance is correlated with assay failure. Additionally in Fig. 3b a correlation is shown between assay failure and the number of flanking SNPs. An increase in assay failure with more flanking SNPs can be observed. In addition the GC content was compared between successful and failed SNPs, however there was no significant relation between assay failure and GC content.
Allele frequencies
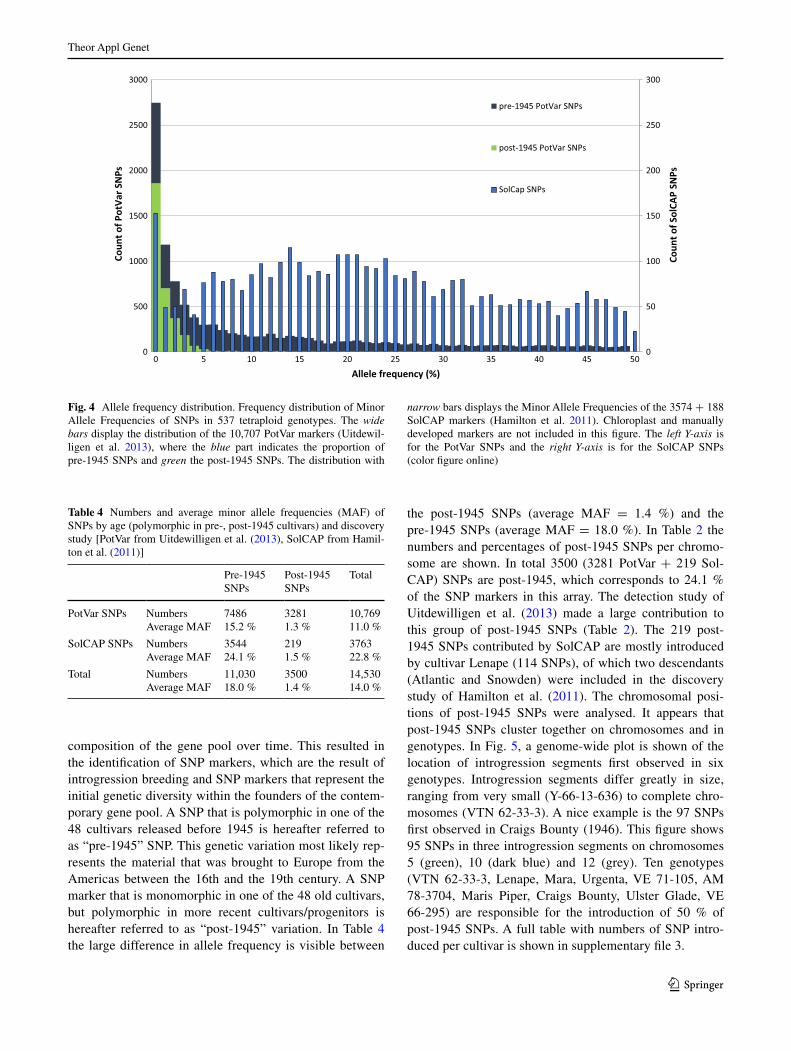
The allele frequency distribution of SNPs across the 537 genotypes is shown in Fig. 4. PotVar SNPs, shown in the distribution (wide bars, left Y-axis) and SolCAP SNPs (nar-row bars, right x-axis) differ greatly in allele frequency. PotVar SNPs are split in pre-1945 (dark blue) and post-1945 (green) SNPs. The average allele frequency of PotVar SNPs is 11 % and for SolCAP 22.7 %. This large differ-ence in allele frequencies, also shown in Table 4, is not sur-prising since we deliberately did not exclude SNPs with a low allele frequency, clearly these were selected against in the design of the SolCAP array.
Identification of pre‑1945 and post‑1945 variation
The comprehensive sampling of the gene pool of cul-tivated potato allowed the evaluation of changes of the
Table 3 Assay failure as a function of chromosomal positions for PotVar SNPs
Number and percentage of successful and failed SNPs separated based on position on the pseudomolecules (Euchromatin, heterochro-matin and border as defined by Sharma et al. 2013) and based on cod-ing and non-coding regions
Position on pseudomolecule
Coding/non-coding
Ok Failed Percentage
Euchromatin Coding 4348 538 11.0
Border Coding 313 46 12.8
Heterochromatin Coding 221 42 16.0
Total (coding) 4882 626 11.4
Euchromatin Non-coding 3828 1214 24.1
Border Non-coding 318 216 40.4
Heterochromatin Non-coding 449 739 62.2
Total (coding + non-coding)
9477 2795 22.8
Fig. 3 Assay failure as function of flanking SNPs. (Left panel) Per-centages of assay failure as function of the distance (in bp) of the first flanking SNP to the attempted SNP assay. (Right Panel) Percentage
of assay failure as a function of the total number of SNPs observed in 50 bp flanking region
Theor Appl Genet
1 3
composition of the gene pool over time. This resulted in the identification of SNP markers, which are the result of introgression breeding and SNP markers that represent the initial genetic diversity within the founders of the contem-porary gene pool. A SNP that is polymorphic in one of the 48 cultivars released before 1945 is hereafter referred to as “pre-1945” SNP. This genetic variation most likely rep-resents the material that was brought to Europe from the Americas between the 16th and the 19th century. A SNP marker that is monomorphic in one of the 48 old cultivars, but polymorphic in more recent cultivars/progenitors is hereafter referred to as “post-1945” variation. In Table 4 the large difference in allele frequency is visible between
the post-1945 SNPs (average MAF = 1.4 %) and the pre-1945 SNPs (average MAF = 18.0 %). In Table 2 the numbers and percentages of post-1945 SNPs per chromo-some are shown. In total 3500 (3281 PotVar + 219 Sol-CAP) SNPs are post-1945, which corresponds to 24.1 % of the SNP markers in this array. The detection study of Uitdewilligen et al. (2013) made a large contribution to this group of post-1945 SNPs (Table 2). The 219 post-1945 SNPs contributed by SolCAP are mostly introduced by cultivar Lenape (114 SNPs), of which two descendants (Atlantic and Snowden) were included in the discovery study of Hamilton et al. (2011). The chromosomal posi-tions of post-1945 SNPs were analysed. It appears that post-1945 SNPs cluster together on chromosomes and in genotypes. In Fig. 5, a genome-wide plot is shown of the location of introgression segments first observed in six genotypes. Introgression segments differ greatly in size, ranging from very small (Y-66-13-636) to complete chro-mosomes (VTN 62-33-3). A nice example is the 97 SNPs first observed in Craigs Bounty (1946). This figure shows 95 SNPs in three introgression segments on chromosomes 5 (green), 10 (dark blue) and 12 (grey). Ten genotypes (VTN 62-33-3, Lenape, Mara, Urgenta, VE 71-105, AM 78-3704, Maris Piper, Craigs Bounty, Ulster Glade, VE 66-295) are responsible for the introduction of 50 % of post-1945 SNPs. A full table with numbers of SNP intro-duced per cultivar is shown in supplementary file 3.
0
50
100
150
200
250
300
0
500
1000
1500
2000
2500
3000
0 5 10 15 20 25 30 35 40 45 50
Coun
t of
Sol
CAP
SNPs
Coun
t of
Pot
Var
SN
Ps
Allele frequency (%)
pre-1945 PotVar SNPs
post-1945 PotVar SNPs
SolCap SNPs
Fig. 4 Allele frequency distribution. Frequency distribution of Minor Allele Frequencies of SNPs in 537 tetraploid genotypes. The wide bars display the distribution of the 10,707 PotVar markers (Uitdewil-ligen et al. 2013), where the blue part indicates the proportion of pre-1945 SNPs and green the post-1945 SNPs. The distribution with
narrow bars displays the Minor Allele Frequencies of the 3574 + 188 SolCAP markers (Hamilton et al. 2011). Chloroplast and manually developed markers are not included in this figure. The left Y-axis is for the PotVar SNPs and the right Y-axis is for the SolCAP SNPs (color figure online)
Table 4 Numbers and average minor allele frequencies (MAF) of SNPs by age (polymorphic in pre-, post-1945 cultivars) and discovery study [PotVar from Uitdewilligen et al. (2013), SolCAP from Hamil-ton et al. (2011)]
Pre-1945 SNPs
Post-1945 SNPs
Total
PotVar SNPs NumbersAverage MAF
748615.2 %
32811.3 %
10,76911.0 %
SolCAP SNPs NumbersAverage MAF
354424.1 %
2191.5 %
376322.8 %
Total NumbersAverage MAF
11,03018.0 %
35001.4 %
14,53014.0 %

Theor Appl Genet
1 3
Processes that shape the genetic composition of the contemporary gene pool of potato
Several processes are shaping the contemporary gene pool of potato, such as the introduction of new genetic variants by introgression breeding. Introgressions cause the loss of existing variants by substitution. Selection will also influ-ence the allele frequency, including breeding for specific market niches (e.g. starch cultivars). In specific market niches, the limited gene pool is easily affected by random genetic drift (genetic erosion). These processes (introgres-sion/substitution, selection, drift) were studied by compar-ing SNP allele frequencies between two groups. Firstly, the pre-1945 cultivars were compared with the cultivars released after 2005. Also, the pre-1945 cultivars were com-pared against cultivars from the “starch” subpopulation.
For post-1945 SNPs significant increases of the allele fre-quency can be observed. In this study we analysed 246 cultivars that were released between 1946 and 2005. In this group, 108 cultivars contributed post-1945 SNPs, ranging from 1 to 447 post-1945 SNPs per cultivar (Sup-plementary file 2). From these 108 cultivars 39 are shown in Fig. 6 and arranged in the order of market introduction. These 39 cultivars are donors of those post-1945 SNPs that have attained the largest increase in allele frequency within the 242 cultivars released after 2005. The negative slope perceived in Fig. 6 indicates that introgression seg-ments introduced soon after 1945 could assume a higher allele frequency (up to 19 %) as compared to more recently introgressed haplotypes (up to 4 % increase). This suggests that a prolonged presence of a beneficial haplotype intro-gressed in the gene pool results in increasingly higher allele
Y 66-13-636 Ulster Glade Craigs Bounty AM 78-3704 Urgenta VTN 62-33-3
Fig. 5 Genomic position of newly introduced variation. Genome-wide plot of the coordinates of post-1945 SNPs on the DM reference genome where post-1945 SNP indicates the position of putative intro-
gression segments first observed in six cultivars. Each dot represents one SNP and it is visible that multiple cultivars can introduce differ-ent haplotypes in the same region
Crai
gs B
ount
y
Crai
gs A
llian
ce
'Urg
enta
'
Blac
k 12
56
Reaa
l
Tahi
Ults
ter
Gla
de
Cliv
ia Mar
is P
iper
Satu
rna
Ehud Pr
eval
ent
Lena
pe
Alc
mar
ia
VTN
62-
33-3
Mar
a
Ark
ula
VE 6
6-29
5
Elka
na
Prem
iere
VE 7
0-9 Ve
rba
W 7
2-22
-496
Bild
tsta
r
Agr
ia
AR
76-1
68-1
Nad
ine
AM
78-
3704
Folv
a AR
80-1
27-5
Ulm
e
Kart
el
AR
85-9
6-13
Kara
kter
Laur
a
Mer
cato
r
VR 9
2-50
1
VR 9
3-14
6
Biog
old
0
2
4
6
8
10
12
14
16
18
20
1946
1948
1951
1955
1956
1960
1961
1962
1963
1964
1965
1966
1967
1969
1972
1973
1975
1976
1978
1979
1980
1981
1982
1984
1985
1986
1987
1988
1989
1990
1991
1994
1995
1996
1998
1999
2002
2003
2004
Max
imum
alle
le fr
eque
ncy
reac
hed
in c
ulti
vars
rel
ease
d af
ter
2005
Year of introduction of post-1945 SNP
Fig. 6 Positive selection on newly introgressed SNPs. This figure shows the maximum allele frequency of post-1945 SNP reached in a panel of 244 genotypes released since 2005. The higher the bar the more frequent the SNP is observed in recent material, suggesting pos-
itive selection. The cultivar name above each bar indicates the first cultivar on the market showing a polymorphism and thus represents the founder genotype of the SNP

Theor Appl Genet
1 3
frequencies due to positive selection. Please note that a 4 % increase in allele frequency implies that almost 20 % of the cultivars carry this haplotype in simplex condition, whereas a 19 % increase implies that more than half of the cultivars are simplex or duplex and occasionally triplex.
In contrast, 50 % of all post-1945 SNPs remain below an allele frequency of 1 % and 549 SNPs were not polymor-phic anymore (nulliplex) in cultivars released after 2005. These 549 SNPs could be considered as lost, i.e. phased out soon after introduction. For the pre-1945 SNPs, 538 SNPs (4.9 %) were no longer polymorphic in contemporary culti-vars. These SNPs are also assumed to be lost during breed-ing. This may be due to selection, but random genetic drift is also plausible, because the initial allele frequency of these SNPs in old germplasm was already very low (1.4 % on average).
A comprehensive overview of the changes in allele fre-quency of all pre-1945 SNPs (in post-2005 and starch cul-tivars compared with old cultivars) is shown in Fig. 7. The largest column in the middle of the figure shows that the majority of the SNPs (6441 or 42 %) hardly changed in allele frequency during a century of potato breeding. Starch cultivars show somewhat larger fluctuations in allele fre-quencies, because of an emphasis on introgression breed-ing for nematode resistance along with founder effects (dis-cussed below). Figure 7 also suggests that larger numbers of SNPs have declined, as compared to the number of SNPs that show an increased allele frequency. This suggests that broadening of the genetic diversity by introgression since 1945 results in an overall net decrease of the frequency of
pre-1945 haplotypes. In addition to these allele substitu-tions, founder effects may also reinforce this fluctuation. In Fig. 8 the change in allele frequency in the “starch” sub-population is plotted against the allele dosage of an impor-tant progenitor (VTN 62-33-3). The figure clearly shows that a higher dosage of a SNP in an important founder contributes to the gain in allele frequency over time. The correlation between SNP dosage in a specific founder and allele frequency gain within the “starch” subpopulation was strongest for VTN 62-33-3 and AM 78-7804, two fre-quently used progenitors.
The processes underlying allele frequency changes over time: introgression, substitution, selection, drift and founder effects (frequent use of parents) are highly con-founded. Still we assume that SNP variants that show the greatest increase in frequency are linked to important alleles for agronomic performance and vice versa. The most striking observations are that (1) 95.1 % of the pre-1945 SNPs are still polymorphic after 50–150 years of breeding and (2) we do not observe any fixation of pre-1945 SNPs in cultivars released after 2005.
Discussion
Ascertainment bias
Here, we describe the development and evaluation of a SNP array for potato. Another SNP array named Sol-CAP is already widely used by the scientific community
140 32
2 618
1518
6404
1198
555
225
51
472
456 87
0
1693
4911
1055
721
382
471
0
1000
2000
3000
4000
5000
6000
7000
<-20% -20%-15% -15%-10% -10%-5% -5% +5% 5-10% 10-15% 15-20% >20%
SNP
coun
t
Allele frequency change relative to pre-1945 cultivars (%)
pre-1945 cultivars vs. post-2005 cultivars
pre-1945 cultivars vs. starch cultivars
Fig. 7 Allele frequency changes. Distribution of allele frequency change of all pre-1945 SNPs is shown. The dark grey bars represent the number of SNPs and their change in minor allele frequency as compared between a panel of older cultivars (market release before
1945) and a panel of new cultivars (market release after 2005). The light grey bars show the comparison between older cultivars and gen-otypes included in the subpopulation of starch cultivars

Theor Appl Genet
1 3
(Felcher et al. 2012; Hirsch et al. 2013; Lindqvist-Kreuze et al. 2014; Manrique-Carpintero et al. 2014; Prashar et al. 2014). We acknowledge the value of this array and reused 4179 SNPs with good assay performance. The other SNPs of this 20K SolSTW array were from a discovery panel of 83 tetraploids, comprising progenitors and cultivars across breeding history, geography and market niche (Uitdewilli-gen et al. 2013).
Genetic diversity is unequally distributed across the gene pool. Therefore, a systematic deviation of a SNP discov-ery panel relative to the set of interrogated individuals will result in an ascertainment bias. Where SolCAP retrieved SNPs predominantly from North American cultivars for the processing industry, the discovery panel of Uitdewilligen et al. (2013) contributed a relatively high number of SNPs typical for wild species introgression segments in progeni-tors. Although ascertainment bias is an important issue in the development and application of SNP arrays (Moragues et al. 2010; Thomson et al. 2012), it is difficult to quantify and difficult to avoid. A wider discovery study is in general better for SNP arrays intended for a wide range of applica-tions. In view of the progenitor clones included in the dis-covery panel this array will be valuable to identify SNPs associated with resistance to cyst nematodes and viruses, but the array will be blind for East European haplotypes conferring e.g. resistance to Wart pathotype 18.
Assay quality
In view of the high SNP density in potato (Uitdewilligen et al. 2013) a comprehensive SNP discovery panel also allows the identification of flanking SNPs that could neg-atively influence SNP assay quality. Unavoidably, 34.8 % of the markers have a known SNP flanking the SNP assay and Figs. 2 and 3 illustrate their impact on assay qual-ity. The analyses confirmed the negative effect of flank-ing SNPs, but also that their effect is proportional to the proximity and the amounts of flanking SNPs. Surpris-ingly, genomic position was a much stronger indicator for assay failure, where SNPs located outside exons or beyond gene-rich euchromatic regions were more likely to fail.
Data collection with fitTetra
In contrast to automated genotype calling in diploids, geno-type calling in tetraploids is not a trivial job. Standard soft-ware such as GenomeStudio can handle tetraploid data, but it cannot automatically cluster the fluorescent signal into the five potential clusters. Manual scoring of each marker separately will give the best results, however due to the increasing size of SNP arrays the workload of manual scor-ing is prohibitively high.
Several methods have been proposed to automatically score tetraploid data. Hackett et al. (2013) used an algo-rithm to cluster ratios based on the genotype call of the parents in a segregating population. In the paper of Hirsch et al. (2013) a custom cluster file was generated within GenomeStudio. Here, prior knowledge of the clusters per marker is needed, since every marker produces a slightly different distribution of the five clusters. Since this was the first time the array was analysed, such a custom cluster file is not available. Consequently, we used software specifi-cally designed for genotype calling of tetraploids, fitTetra (Voorrips et al. 2011) and were able to gain more experi-ence with this software. During the analysis of our data a number of improvements in the fitTetra software could be implemented, as described in the results. We recom-mended users to always download the latest software ver-sion from our website (https://www.wageningenur.nl/en/show/Software-fitTetra.htm). With fitTetra we were able to score the dosage for 80.5 % of the markers. This is rela-tively high compared to 45 % in Hirsch et al. (2013) and 38 % in Lindqvist-Kreuze et al. (2014). Furthermore, the clustering by fitTetra appeared to be more accurate than genotype calling by GenomeStudio. The 0.02 % difference between replicated samples reported in our study compares well with the 1.7 % difference in genotype calls reported before (Hirsch et al. 2013). Nevertheless, we show that fitTetra does not always assign the correct genotype call to
Fig. 8 Founder effect. The change of the Minor Allele Frequencies of pre-1945 SNPs within the subpopulation of starch cultivars com-pared with pre-1945 cultivars (Y-axis) as a function of the allele dos-age of the minor allele in one of the most important progenitor clones (VTN 62-33-3). Here evidence is provided that a founder effect (ini-tial allele dosage of a pre-1945 SNP) has a substantial impact, com-parable to selection of a post-1945 SNP

Theor Appl Genet
1 3
a cluster (Fig. 2g, h), or will erroneously cluster poor mark-ers (Fig. 2c, f). Inclusion of diploid samples and a tetra-ploid bi-parental mapping population were extremely help-ful to identify and discard poor SNP assays. Without these internal controls the quality of our dataset is expected to be much lower. An additional advantage of fitTetra is that the visual output of fitTetra is very helpful for identifying poor assays.
Dating of SNPs as a tool for reconstruction of the breeding history
A comprehensive sampling of genotypes of different ages has enabled us to assign a date to each SNP and to dif-ferentiate between “pre-1945” and “post-1945” genetic variants based on the year of market release. We observed that new genetic variants, cluster together in specific chro-mosomal regions and reside in specific genotypes (Fig. 5). For example, Craigs Bounty (released in 1946) is the old-est cultivar in our panel with introgressed chromosomal regions. In this cultivar, 97 SNPs are polymorphic, which were monomorphic in older pre-1945 cultivars. These post-1945 SNPs most likely descend from a (S. commer-sonii x S. demissum) × (S. maglia × S. edinense) hybrid six meiosis back in the pedigree (Van Berloo et al. 2007) and originate from the work of Salaman (1985). Craigs Bounty is one of the first cultivars with the R1 gene conferring late blight resistance from Solanum demis-sum on chromosome 5 (Toxopeus 1956). Therefore the SNPs on chromosome 5 are good candidates for tagging the haplotype containing the R1 gene. Subsequent link-ing of the pedigree to the first observation of CPC-1673 derived material (Maris Piper, 111 new SNPs) resulted in candidate SNPs on chromosome 5 tagging the H1 resistance haplotype conferring resistance to Globodera rostochiensis.
The post-1945 SNPs, introduced with the market release of cultivar Lenape are most likely descending from the Solanum chacoense grand-grandparent. Why S. chacoense was used is not clear, but Love et al. (1998) describe Lenape as a first cultivar with a higher amount of solids, however it is also a cultivar with high glycoalkaloid con-tent. Hence these SNPs could map nearby QTLs involved in dry matter content and/or glycoalkaloid content.
For most cultivars that contributed post-1945 SNPs the source of introgressions could be deduced from pedigree information. However, our data suggest that the cultivar Urgenta introduced 178 post-1945 SNPs. This does not match pedigree information describing Urgenta as a pure “S. tuberosum” cultivar. Along with the observation that Desiree, a daughter of Urgenta, does not contain any of the introgression segments, we conclude that this sample was named Urgenta erroneously.
Processes that shape the genetic composition of the contemporary gene pool of potato
Few of the newly introgressed SNP alleles show a consid-erable increase in allele frequency within a subset of recent material (Fig. 6). Especially SNPs near the H1 and R3a/R3b loci, reach an allele frequency of 15 and 10 %, respec-tively. This example of positive selection for SNPs flank-ing the H1 locus can be explained by the need for cultivars resistant to Globodera rostochiensis by potato growers. The increase in frequency of SNP alleles that belong to the R3a/R3b haplotype is not easily understood. This locus R3a/R3b was soon overcome by late blight and does not pro-vide a detectable level of field resistance to Phytophthora infestans. Nevertheless we observed that a large region (5 Mb) was retained in more recent material. This suggests that other beneficial alleles linked to these R-genes are introduced in the potato gene pool that caused a positive selection on alleles in this region, which might be inter-preted as linkage drag. In contrast, the majority of the post-1945 SNPs do not exceed an allele frequency higher than 1 %. Since this variation is not under positive selection we conclude that this variation is not adding anything to the potato genepool and it will be a matter of time that this var-iation gets extinct in the newly introduced cultivars.
It is often thought that breeding will decrease the amount of genetic variation over time, also described as genetic erosion. However, this assumed trend of declin-ing diversity is not supported by molecular data (van de Wouw et al. 2010). To our knowledge this is the first study that used dated SNPs to compare the loss of old polymorphisms with the influx of new diversity due to introgression. In agreement with van de Wouw et al. (2010), we observed an insignificant amount of genetic erosion in potato. The limited numbers of SNPs not being polymorphic anymore are most likely “lost” due to drift instead of selection against these SNP alleles. In fact the opposite is occurring. Whilst the majority of genetic variation that was present 100 years ago is still present in modern cultivars, new genetic variation introduced in the last decades caused an increase of genetic variation in the potato gene pool. The lack of fixation of beneficial alleles supports the hypothesis that breeders select highly heterozygous offspring, allowing optimal heterosis. The tetraploid nature of potato prevents efficient selection against non-beneficial alleles and the net result is that genetic erosion scarcely takes place. There are major shifts in allele frequencies also described by Hirsch et al. (2013), however only a limited set of SNPs show this pattern (Fig. 7). These more substantial changes in allele frequency can result from selection but can also be explained as a founder effect, where a higher allele dos-age for SNPs along with the frequent use of an important

Theor Appl Genet
1 3
progenitor has impact on the change of allele frequen-cies in breeding (Fig. 8). The joint effect of selection and founder effects may easily explain an allele frequency change up to 50 %.
Future applications
This SNP array has been available for a short time, which is due to manufacturer’s quality criteria for shelf life, amount of material synthesized and willingness to keep stocks. We do not regret this short availability and will not re-order the same array. Arguments to avoid repetitive use of the same array are the ever-changing gene pool and the ever-chang-ing ascertainment bias if the SNP discover panel is at odds with the QTL mapping panel. Finally, technology is evolv-ing at high speed. Sequencing costs are dropping and bioin-formatics tools become more user friendly to arrive at more cost-effective sequencing-based genotyping strategies. For future applications supplementary Table 1, attached to this publication, offers a lasting resource of SNP loci that have been demonstrated successful. As shown by Felcher et al. (2012) and here the initial success rate of a SNP assay ranges between 40 and 70 %. This publication confirms that a SNP assay, once sufficiently tested, has a very high probability of being good forever. Indeed, the inclusion of SNPs that were tested before with the SolCAP array were re-applied. For this group of SNPs a very high success rate was achieved of 94 %. Whenever there is a need to gener-ate fixed SNP arrays or KASP assays, it is recommended to tap from SNPs that have been demonstrated as successful before.
Author contribution statement
Conceived and designed the experiments: PGV, HJvE, JGAMLU. Performed the experiments: PGV. Analysed the data: REV, PGV. Wrote the manuscript: PGV, HJvE. Edited the manuscript: HJvE, REV, RGFV.
Acknowledgments We kindly acknowledge Wilbert van Workum and Marjolein Janssen from ServiceXS for their excellent service pro-vided in the array hybridization and data collection. The development of the array was financially supported by a grant from the Dutch tech-nology foundation STW (project WPB-7926). PGV is supported by a grant of CBSG (Centre for BioSystems Genomics) and by potato breeding companies Agrico Research B.V., Averis Seeds B.V., HZPC B.V., KWS POTATO B.V. and Meijer B.V. We also thank Dr. Ron-ald Hutten for making a set of genotypes available, and Dr. Christian Bachem for critically reading the manuscript to correct idiosyncratic language.
Compliance with ethical standards
Conflict of interest The authors declare they have no conflicts of interest.
Open Access This article is distributed under the terms of the Creative Commons Attribution 4.0 International License (http://crea-tivecommons.org/licenses/by/4.0/), which permits unrestricted use, distribution, and reproduction in any medium, provided you give appropriate credit to the original author(s) and the source, provide a link to the Creative Commons license, and indicate if changes were made.
References
Anithakumari A, Tang J, van Eck HJ, Visser RG, Leunissen JA, Vosman B, van der Linden CG (2010) A pipeline for high throughput detection and mapping of SNPs from EST databases. Mol Breed 26:65–75
Baird NA, Etter PD, Atwood TS, Currey MC, Shiver AL, Lewis ZA, Selker EU, Cresko WA, Johnson EA (2008) Rapid SNP discov-ery and genetic mapping using sequenced RAD markers. PLoS One 3(10):e3376
Barbazuk WB, Emrich SJ, Chen HD, Li L, Schnable PS (2007) SNP discovery via 454 transcriptome sequencing. Plant J 51:910–918
Bradshaw J, Ramsay G (2005) Utilisation of the commonwealth potato collection in potato breeding. Euphytica 146(1–2):9–19
Bundock PC, Eliott FG, Ablett G, Benson AD, Casu RE, Aitken KS, Henry RJ (2009) Targeted single nucleotide polymorphism (SNP) discovery in a highly polyploid plant species using 454 sequencing. Plant Biotechnol J 7:347–354
D’hoop B, Paulo MJ, Mank RA, van Eck HJ, van Eeuwijk FA (2008) Association mapping of quality traits in potato (Solanum tubero-sum L.). Euphytica 161:47–60
D’hoop B, Paulo MJ, Visser RGF, van Eck HJ, van Eeuwijk FA (2011) Phenotypic analyses of multi-environment data for two diverse tetraploid potato collections: comparing an academic panel with an industrial panel. Potato Res 54:157–181
D’hoop B, Keizer PC, Paulo MJ, Visser RGF, van Eeuwijk F, van Eck H (2014) Identification of agronomically important QTL in tetra-ploid potato cultivars using a marker–trait association analysis. Theor Appl Genet 127(3):731–748
Douches D, Maas D, Jastrzebski K, Chase R (1996) Assessment of potato breeding progress in the USA over the last century. Crop Sci 36:1544–1552
Felcher KJ, Coombs JJ, Massa AN, Hansey CN, Hamilton JP, Veil-leux RE, Buell CR, Douches DS (2012) Integration of two diploid potato linkage maps with the potato genome sequence. PLoS One 7:e36347
Hackett CA, McLean K, Bryan GJ (2013) Linkage analysis and QTL mapping using SNP dosage data in a tetraploid potato mapping population. PLoS One 8:e63939
Hamilton JP, Hansey CN, Whitty BR, Stoffel K, Massa AN, Van Dey-nze A, De Jong WS, Douches DS, Buell CR (2011) Single nucle-otide polymorphism discovery in elite north american potato germplasm. BMC Genom 12:302
Hamilton JP, Sim S-C, Stoffel K, Van Deynze A, Buell CR, Francis DM (2012) Single nucleotide polymorphism discovery in culti-vated tomato via sequencing by synthesis. Plant Genome 5:17–29
Hawkes JG, Francisco-Ortega J (1993) The early history of the potato in Europe. Euphytica 70:1–7
Hirsch CN, Hirsch CD, Felcher K, Coombs J, Zarka D, Van Deynze A, De Jong W, Veilleux RE, Jansky S, Bethke P (2013) Retrospective view of North American potato (Solanum tuberosum L.) breeding in the 20th and 21st centuries. Genes| Genomes| Genet 3:1003–1013
Kim S, Plagnol V, Hu TT, Toomajian C, Clark RM, Ossowski S, Ecker JR, Weigel D, Nordborg M (2007) Recombination and linkage disequilibrium in Arabidopsis thaliana. Nat Genet 39:1151–1155

Theor Appl Genet
1 3
Lindhout P, Meijer D, Schotte T, Hutten RB, Visser RGF, van Eck H (2011) Towards F1 hybrid seed potato breeding. Potato Res 54(4):301–312
Lindqvist-Kreuze H, Gastelo M, Perez W, Forbes GA, de Koeyer D, Bonierbale M (2014) Phenotypic stability and genome-wide association study of late blight resistance in potato genotypes adapted to the tropical highlands. Phytopathology 104:624–633
Lopez-Pardo R, Barandalla L, Ritter E, Ruiz de Galarreta JI (2013) Validation of molecular markers for pathogen resistance in potato. Plant Breed 132:246–251
Love SL, Pavek JJ, Thompson-Johns A, Bohl W (1998) Breeding pro-gress for potato chip quality in North American cultivars. Am J Potato Res 75:27–36
Manrique-Carpintero N, Tokuhisa J, Ginzberg I, Veilleux R (2014) Allelic variation in genes contributing to glycoalkaloid biosyn-thesis in a diploid interspecific population of potato. Theor Appl Genet 127(2):391–405
Moragues M, Comadran J, Waugh R, Milne I, Flavell A, Russell JR (2010) Effects of ascertainment bias and marker number on esti-mations of barley diversity from high-throughput SNP genotype data. Theor Appl Genet 120:1525–1534
PGSC—Potato Genome Sequencing Consortium (2011) Genome sequence and analysis of the tuber crop potato. Nature 475(7355):189–195
Prashar A, Hornyik C, Young V, McLean K, Sharma S, Dale MF, Bryan G (2014) Construction of a dense SNP map of a highly heterozygous diploid potato population and QTL analysis of tuber shape and eye depth. Theor Appl Genet 127:2159–2171
Salaman RN (1985) The history and social influence of the potato. Cambridge University Press, Cambridge
Sharma SK, Bolser D, de Boer J, Sønderkær M, Amoros W, Carboni MF, Amoros JM, de la Cruz G, Di Genova A, Douches DS, Egui-luz M, Guo X, Guzman F, Hackett CA, Hamilton JP, Li G, Li Y, Lozano R, Maass A, Marshall D, Martinez D, McLean K, Mejía N, Milne L, Munive S, Nagy I, Ponce O, Ramirez M, Simon R, Thomson SJ, Torres Y, Waugh R, Zhang Z, Huang S, Visser RGF, Bachem CWB, Sagredo B, Feingold SE, Orjeda G, Veilleux RE, Bonierbale M, Jacobs JME, Milbourne D, Mar-tin DMA, Bryan GJ (2013) Construction of reference chromo-some-scale pseudomolecules for potato: integrating the potato genome with genetic and physical maps. Genes| Genomes| Genet 3(11):2031–2047
Sharma R, Bhardwaj V, Dalamu D, Kaushik SK, Singh BP, Sharma S, Umamaheshwari R, Baswaraj R, Kumar V, Gebhardt C (2014)
Identification of elite potato genotypes possessing multiple dis-ease resistance genes through molecular approaches. Sci Hortic 179:204–211
Sim S-C, Durstewitz G, Plieske J, Wieseke R, Ganal MW, Van Dey-nze A, Hamilton JP, Buell CR, Causse M, Wijeratne S (2012) Development of a large SNP genotyping array and generation of high-density genetic maps in tomato. PLoS One 7:e40563
Thomson M, Zhao K, Wright M, McNally K, Rey J, Tung C-W, Reyn-olds A, Scheffler B, Eizenga G, McClung A, Kim H, Ismail A, de Ocampo M, Mojica C, Reveche MY, Dilla-Ermita C, Mauleon R, Leung H, Bustamante C, McCouch S (2012) High-through-put single nucleotide polymorphism genotyping for breeding applications in rice using the BeadXpress platform. Mol Breed 29(4):875–886
Toxopeus HJ (1956) Reflections on the origin of new physiologic races in Phytophthora infestans and the breeding for resistance in potatoes. Euphytica 5:221–237
Trick M, Long Y, Meng J, Bancroft I (2009) Single nucleotide poly-morphism (SNP) discovery in the polyploid Brassica napus using Solexa transcriptome sequencing. Plant Biotechnol J 7:334–346
Uitdewilligen JG, Wolters A-MA, Bjorn B, Borm TJ, Visser RG, van Eck HJ (2013) A next-generation sequencing method for gen-otyping-by-sequencing of highly heterozygous autotetraploid potato. PLoS One 8:e62355
Van Berloo R, Hutten R, Van Eck H, Visser RGF (2007) An online potato pedigree database resource. Potato Res 50:45–57
van de Wouw M, van Hintum T, Kik C, van Treuren R, Visser B (2010) Genetic diversity trends in twentieth century crop culti-vars: a meta analysis. Theor Appl Genet 120:1241–1252
Voorrips R, Gort G, Vosman B (2011) Genotype calling in tetraploid species from bi-allelic marker data using mixture models. BMC Bioinform 12:172
Wang S, Wong D, Forrest K, Allen A, Chao S, Huang BE, Macca-ferri M, Salvi S, Milner SG, Cattivelli L (2014) Characteriza-tion of polyploid wheat genomic diversity using a high density 90,000 single nucleotide polymorphism array. Plant Biotechnol J 12(6):787–796
Yamamoto T, Nagasaki H, Yonemaru J-i, Ebana K, Nakajima M, Shibaya T, Yano M (2010) Fine definition of the pedigree haplo-types of closely related rice cultivars by means of genome-wide discovery of single-nucleotide polymorphisms. BMC Genom 11(1):267