DETERMINATION OF HEAVY METALS IN MEAT, INTESTINE,...
8
DETERMINATION OF HEAVY METALS IN MEAT, INTESTINE, LIVER, EGGS, AND CHICKEN USING NEUTRON ACTIVATION ANALYSIS AND ATOMIC ABSORPTION SPECTROMETRY Surtipanti S*, Suwirma S*, Yumiarti S*, and Yune Mellawati* ABSTRACT DETERMINATION OF HEAVY METALS IN MEAT, INTESTINE, LIVER, EGGS, AND CHICKEN USING NEUTRON ACTIVATION ANALYSIS AND ATOMIC ABSORPTION SPECTROMETRY. The elements As, Cd, Co, Cr, Fe, Hg, Ni, Pb, Sb, Se and Zn in meat, intestine, and liver of cow and goat, as well as in broiler, local breed chicken and cggs have been determined using Neutron Activation Analysis and Atomic Absorption Spectrometry. Mercury was determined after being separated radiochemically. The results showed that concentration of the essential elements studied i.e. Cr, Cu, Fe, Zn, Co, and Ni were higher in liver and intestine than in the meat, but still in the normal range, while toxic elements As, Cd, and Pb were undetectable in all samples. ABSTRAK PENENTUAN LOGAM BERA T DALAM DAGING, USUS, HA TI, AYAM DAN TELOR, DENGAN ANALISIS AKTIV ASI NEUTRON DAN SPEKTROMETER SERAPAN ATOM. Penentuan logam As, Cd. Co. Cr. Cu. Fe. Hg. Ni. Sb. Se dan Zn dalam daging. hati dan usus kambing dan sapi. serta dalam ayam broiler. ayam kampung, dan telur telah dilakukan dengan menggunakan analisis aktivasi neutron instrumental dan spektrometer serapan atom. Hg ditentukan setelah dipisahkan secara radiokimia. Hasil analisis menunjukkan bahwa kadar logam esensial Co, Cr, Cu, Fe. Ni, dan Zn dalam contoh hati dan usus lebih tinggi daripada dalam daging, tetapi masih dalam batas normal, sedang logam berat beracun As, Cd, dan Pb tidak terdeteksi dalam semua contoh. INTRODUCTION Metallic elements are found in all living organisms where they play a variety of roles. They may be structural, components of control mechanisms, (e.g. in nerves and muscles), and above all, enzyme activator, or component of redox systems. Some metals are essential (Co, Cr, Cu, Fe, Ni, Zn), and others are non-essential (As, Cd, Hg, Pb). A deficiency in essential elements results in impairment of biological function, but when present in excess, essential elements may become toxic. Non-essential elements, when enter into the body, will cause toxic effects. The major route of entry of most elements into the body is through the diet. The source of metals in the environment are the combustion of fossil fuels, mining industries, waste disposal, and domestic sewage. Farming and forestry also contribute to the metal content in the environment because * Center for the Application of Isotopes Radiation, BAT AN
-
Upload
nguyendang -
Category
Documents
-
view
220 -
download
0
Transcript of DETERMINATION OF HEAVY METALS IN MEAT, INTESTINE,...

DETERMINATION OF HEAVY METALS IN MEAT,INTESTINE, LIVER, EGGS, AND CHICKEN USING
NEUTRON ACTIVATION ANALYSIS ANDATOMIC ABSORPTION SPECTROMETRY
Surtipanti S*, Suwirma S*, Yumiarti S*, and Yune Mellawati*
ABSTRACT
DETERMINATION OF HEAVY METALS IN MEAT, INTESTINE, LIVER,
EGGS, AND CHICKEN USING NEUTRON ACTIVATION ANALYSIS ANDATOMIC ABSORPTION SPECTROMETRY. The elements As, Cd, Co, Cr, Fe, Hg,Ni, Pb, Sb, Se and Zn in meat, intestine, and liver of cow and goat, as well as in broiler,local breed chicken and cggs have been determined using Neutron Activation Analysisand Atomic Absorption Spectrometry. Mercury was determined after being separatedradiochemically. The results showed that concentration of the essential elements studiedi.e. Cr, Cu, Fe, Zn, Co, and Ni were higher in liver and intestine than in the meat, butstill in the normal range, while toxic elements As, Cd, and Pb were undetectable in allsamples.
ABSTRAK
PENENTUAN LOGAM BERA T DALAM DAGING, USUS, HA TI, AYAM DANTELOR, DENGAN ANALISIS AKTIV ASI NEUTRON DAN SPEKTROMETER
SERAPAN ATOM. Penentuan logam As, Cd. Co. Cr. Cu. Fe. Hg. Ni. Sb. Se dan Zndalam daging. hati dan usus kambing dan sapi. serta dalam ayam broiler. ayam kampung,dan telur telah dilakukan dengan menggunakan analisis aktivasi neutron instrumental danspektrometer serapan atom. Hg ditentukan setelah dipisahkan secara radiokimia. Hasilanalisis menunjukkan bahwa kadar logam esensial Co, Cr, Cu, Fe. Ni, dan Zn dalam contohhati dan usus lebih tinggi daripada dalam daging, tetapi masih dalam batas normal, sedanglogam berat beracun As, Cd, dan Pb tidak terdeteksi dalam semua contoh.
INTRODUCTIONMetallic elements are found in all living organisms where they play
a variety of roles. They may be structural, components of controlmechanisms, (e.g. in nerves and muscles), and above all, enzyme activator,or component of redox systems. Some metals are essential (Co, Cr, Cu,Fe, Ni, Zn), and others are non-essential (As, Cd, Hg, Pb). A deficiencyin essential elements results in impairment of biological function, but whenpresent in excess, essential elements may become toxic. Non-essentialelements, when enter into the body, will cause toxic effects. The majorroute of entry of most elements into the body is through the diet. Thesource of metals in the environment are the combustion of fossil fuels,mining industries, waste disposal, and domestic sewage. Farming andforestry also contribute to the metal content in the environment because
*Center for the Application of Isotopes Radiation, BAT AN

of fertilizers and pesticide used [1]. Meat (lamb, beef), intestine, liver, eggs,and chicken are foodstuffs, in which the metals present are mainlyoriginated from the feed of the animals.
The objective of this investigation is to find out whether the level ofmetallic elements in meat, liver, intestine, eggs, broiler, and local breedchickens for human consumption have exceeded the maximum permissiblelevel specified by international rules.
The interesting elements to be analysed are As, Cd, Co, Cr, Cu, Fe,Hg, Ni, Pb, Sb, Se, and Zn. Cd, Cu, Ni, and Pb were determined by atomicabsorption spectrometry, others using neutron activation analysis. Mercury(Hg) was determined after being separated from selenium (Se)radiochemically [2-4]
MATERIALS AND METHOD
Samples and Standard PreparationThe samples analyzed in this study were meat (Iamb, beef), intestine,
eggs, broiler and local breed chicken. All samples were obtained from localmarket in Jakarta. Sixty three samples were collected, weighing of about1-2 kg each. The samples were brought to the laboratory in plastic bags,cleaned and washed with demineralized water, before cooking, they arecut in pieces with a stainless steel knife, and dried in an oven at 65°Cfor 48 hours discontinuously until constant weight is obtained. The moisturecontents of the samples are shown in Table 1. The dried samples werethen powdered. About 200-500 mg of dried samples were put inpolyethylene vials. The standard was prepared by dropping 5/-l1 aliquotof freshly prepared standard solution (1000 ppm) of each elements on filterpaper Whatman 42 [5]. The vials containing the samples, standard, andreference standards were put in aluminum container. The reference standardused was orchad leaves NBS SRM-1571 and fish flesh MA-A-2 (TA)obtained from lAEA.
Instrumental Neutron Activation Analysis (INAA)The containers containing samples and standards were irradiated for 36
hours in TRIGA MARK II REACTOR, at a flux of lOll n cm-2 sec-I.
After irradiation, the containers were cooled for 2 days for short half liferadionuclide and 2 weeks for long half life radionuclide. The samples andstandard were counted using a 4096 channels Nuclear Data 62 MultiChannel Analyser, provided with a high purity Germanium (Ge-Hp)detector. The system has a resolution 3.75 keY (FNHM) at 1332 keY of60Co. The counting time was 900 seconds. Nuclear data of the elementsSe, Hg, Cr, As, Sb, Zn, and Co can be seen in Table 2 [6].
2

Radiochemical SeparationThe irradiated samples were digested with HN03 in a distilling flask
and heated until white fumes evolved. For complete digestion of organicmaterials, 30% H202 was added. After cooling to room temperature, thesolution was diluted to 20 ml, the pH of the solution was 2-4. Into thesamples solution was added I mg of Hg as carrier, and 4 mlof 8x 10⁻⁴M Pb(DDC)2 solution, and then shaked for 10m inutes. Theorganic phase containing Hg (DDC)2 was separated and counted using aMulti Channel Analyzer at gamma ray energy of 279 keY for 203Hg.
Determination by Atomic Absorption SpectrometryAbout 5-10 g of dried samples were put in a distilling flask and digested
with a mixture of concentrated H2S04 and HN03 (1:3 v/v). A small amountof 30% H202 was added to eliminate nitrogen dioxides. The digestionprocess was continued until the solution became clear. The samples weretransferred into volumetric flask and diluted to 50 ml with demineralized
water. Lead, cadmium and copper were excited using oxygen acethyleneflame. The absorption of the elements were compared with the standardabsorption.
RESULTS AND DISCUSSION
The results of the determination of As. Cd, Co, Cr, Cu, Hg, N i, Pb.Sb. Se, and Zn in all samples are shown in Table 3. The accuracy of themethod of analysis used was compared to IAEA standard referencematerials orchad leaves SRM- 157 I and fish flesh MA-A-2(T A) (Table 4).
51 75 76The photo peaks of Cr at 320 keY, Se at 264 keY, As
at 559 keY, and 60Co at 1173 keY were used for the determination withoutany interference form other isotopes.
Hg was determined without any interference after being separated fromselenium by radiochemical separation. The photopeak of 203Hg wasdetermined at 279 keY.
The elements As, Cd, and Pb were undetectable, as their concentrationwere lower then the detection limit (Table 5) while Ni was found onlyin a few samples, i.e. in liver and intestine of cow and in local breedchicken. Other elements, i.e. Co, Cr, Cu, Fe, Hg, Sb, Se and Zn werefound in all samples.
The essential elements Co, Cr, Cu, Fe, and Zn were found higher inliver, intestine, and local breed chicken. These elements usually accumulatein liver, kidney, muscle, and other organ in the intestine, because, liverhas a function to transfer the elements to the whole body [7].
Chromium is also an essential trace element like Zn and Cu, its main
3

physiological role is a cofactor for insulin at the insulin responsive cellmembrane [7]. The concentration of Cr in various food is generally0.5 J-lg/g wet weight [1], while the concentration of Cr in the samplesanalyzed were 0.035-0.45 J-lg/g wet weight.
Copper, is mainly stored in liver, kidney and muscle molecular weightprotein and ceroplasmin, which is produced in the liver, and also functionas an oxidase. The concentration of Cu in food is generally 20-50 J-lg/gwet weight [8], while the concentration of Cu in the samples analyzedwere 0.09-26.85 J-lg/g wet weight.
Iron concentrations in kidney, liver, beef, ham, and eggs are generally30-150 mg/kg, wet weight [1], while the concentration of Fe in the samplesanalyzed were 5.33-37.24 J-lg/g wet weight.
Zinc is necessary for the function of various mammalian enzymes. Theconcentration of Zn in food is around 10-50 J-lg/g wet weight [8], whilethe concentration of Zn in samples analyzed were found to be0,86-27,64 J-lg/g wet weight.
Cobalt is required in the form of coba]t-cointaining vitamin B 12. Cois widely distributed in the animal organ in re]atively high concentration(0.10-0.25 J-lg/g) in liver, kidney, bone, spleen, and other glandular tissue[7]. The concentration of Co in the samples analyzed were still in the normalrange. The higher Co concentration in eggs and broiler probably originatedfrom the feed of the poultry.
Nickel has been proved to be essential for poultry, pig, and rat underexperimental conditions. Ni is poorly absorbed from ordinary diets [7].Absorbed Ni will be accumulated in liver, kidney and lung [1]. Data ofN i in foodstuffs are scarce.
Selenium is an essential element for sheep, cattle, and poultry.Deficiency of this element will cause a serious problem. The highestconcentration of Se in animal are found in liver, kidney, brain, and muscle.The concentration of Se in food products is influenced by its origin andprocessing. Se may be found in seafood, kidney, meat, and sometimes inrice and grain. The concentration of Se in the samples analyzed were lessthan 2 J-lg/g wet weight.
Antimony is considered as a non-essential element, and usually isdeposited in kidney and liver. Data on concentration of Sb in foodstuffsare scarce [1], the concentration of Sb in the samples analyzed were higherin liver and intestine than in meat.
CONCLUSION
The concentration of toxic and essential elements in samples analyzedwere lower than the respective MBC's. Therefore it can be concluded that
4

the samples analyzed are relatively not contaminated by the toxic andessential metallic elements. The concentration of Co, Cr, Cu, Hg, Sb, Se
and Zn were still in the natural normal range.
ACKNOWLEDGMENTS
The study is a part of the work supported by lAEA under ResearchContract No. 4494/R3/RB. The authors express their thanks to Dr. Haryoto,
Miss Tini Tjintarsih and staff of PPTN, Bandung for irradiating the samples.
They are also grateful to Mr(s). Suripto and Maryoto for their technicalassistance.
REFERENCES
I. FRIBERG, L., GUNNAR, F. NORDBERG and VELIMER, B.
"Handbook on Toxicology of Metals". ElsevierlNorthe Holland
Biomedical Press (1979).
2. HANI, N.M., W AI, CM., and WILLEM, S.H., "Dithiocarbamateextraction of trace amounts of selenium from biological samples for
neutron activation analysis", Journal of Nuclear Chemistry. 104 (1)
(1986) 19.
3. LO. J.M .. WEl, J.C, YANG, M.H .. and YEH. SJ., "Preconcentration
of mercury with lead diethyldithiocarbamat for neutron activation
analysis of biological and environmental samples", Journal of
Radioanalytical Chemistry, 71 (1-2) (1982) 57.
4. YUMIARTI, S., YUNE MELLAWATI, and SURTIPANTI, S.,
"Penentuan logam berat dan beracun dalam contoh ikan dengan analisis
pengaktifan neutron". Risalah Seminar Reaktor Nuklir danPenggunaannya, Bandung 26 - 27 Oktober (1988).
5. AHMAD, S.M., CHAUDHARY, M.S., MANN AN, A., and
QURESHU, I.H., "Determination of toxic elements in tea leaves by
instrumental neutron activation analysis", Journal of Radioanalytical
Chemistry, 78 (2) (1983) 375.
6. CROUTNAMEI, CE., "Applied Gamma Ray Spectrometry", Pergamon
Press (1970) 733.
7. IAEA, "Elemental Analysis of Biological Materials" (Technical Report
Series No. 197) IAEA Vienna (1980).
8. REILLY, C, "Metal Contamination of Food", Applied Science
Publisher, London (1980).
5
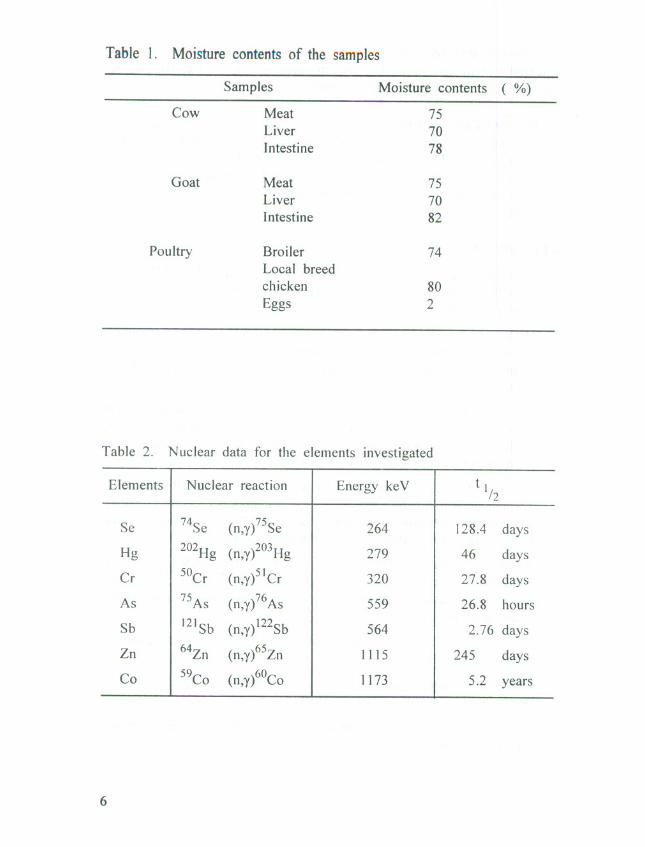
Table 1. Moisture contents of the samples
Samples
Moisture contents( %)
Cow
Meat 75Liver
70
Intestine78
Goat
Meat 75
Liver70
Intestine82
Poultry
Broiler 74
Local breed chicken80
Eggs
2
Table 2. Nuclear data for the elements investigated
ElementsNuclear reactionEnergy ke Vt I
/2
Se
74Se75264128.4days(n,y) Se
Hg
202H ( )203H 27946daysg n,y g
Cr
50Cr5132027.8days(n,y) Cr
As
75As7655926.8hours(n,y) As
Sb
121Sb(n,y)122Sb 5642.76 days
Zn
64Zn651115245days(n,y) Zn
Co
59Co6011735.2(n,y) Co years
6

-...J
Tab
el3.
Con
cent
ratio
nof
heav
ym
etal
sin
mea
t,in
test
ine
and
liver
ofco
w,
goat
,br
oile
r,lo
cal
bree
dch
icke
nan
deg
gs(u
g/g
wet
wei
ght)
Sam
ple
Co
Cr
CuFeJi
gNi
SbSe
InC
ow:
Mea
t0.
12±
003
0.16
±01
4O
A4
±03
37.
59±
4.70
0001
±0.
0005
ud0.
02±
0.01
0.09
±00
310
35±
2.53
Liv
er0.
13±
0.03
0.25
±0.
0810
.64
±6A
616
.64
±6A
60.
002
±0.
0006
0.16
±0.
130.
03±
0.01
0.09
±00
412
.83
±5.
88In
test
ine
0.10
±0.
040.
10±
0.06
0.25
±0.
0825
.82
±6.
140.
0004
±00
002
2.96
±1.
040.
04±
0.01
0.11
±0.
062.97
±1.
04G
oat:
Mea
tO
.IS
±0.
040.
08±
003
0.31
±0.
1823
.11
±5.
11ud
ud0.
03±
0.01
0.88
±0.
039.
81±
5A3
Liv
er0.
16±
0.04
0.13
±0.
0526
.85
±9.
7737
.24
±3.
290.
0012
±0.
0006
ud0.
53±
0.30
0.06
±0.
0212
.67
±6.
63In
test
ine
0.13
±0.
04O
A5
±0.
020.
27±
0.19
17.7
2±
1.58
0.00
10±
0.00
02ud
0.01
±00
00.
05±
0.0319
7±
OA
IPo
ultr
y.
Bro
iler
0.86
±0.
030.
04±
0.01
0.13
±0.
0753
3±
171
0.00
05±
0.00
02ud
0.10
±0.
060.
05±
0.03
0.86
±O
AO
Loc
albr
eed
chic
ken
0.12
±0.
020.
13±
003
0.17
±0.
0718
.84
±5.
300.
0006
±00
001
0.10
±0.
060.
01±
0.00
0.06
±0.
032.17
±0.
55E
ggs
0.71
±0.
090.
17±
0.06
1.02
±0.
5318
.82
±7.
800.
0080
±0.
0020
ud0.
06±
0.04
0.36
±0.
1727
.64
±10
.29
Ud
=un
dete
ctab
le
The
data
repr
esen
tav
erag
eof
5re
plic
atio
ns±
SD

Table 4. Result of analysis compared to certified value of biologicalsamples NBS. SRM 1571 (orchad leaves) and MA-A-2(TA) (Fish in f.lg/g)
Elements NBS SRM 1571
Certified
Result ofCertifiedResult ofvalue
analysisvalueanalysis
Se
0.090.11 ± 0.011.701.07 ± 0.17Hg
0.1550.21 ± 0.020.470.62 ± 0.02Cr
2.303.09 ± 0.131.301.44 ± 0.16As
14.0012.49 ± 4.972.602.46 ± 1.80Sb
- -0.0050.006 ± 0.0005Fe
260 ± 0.6300.00 ± 2054.0047.34 ± 15.72Pb
- -0.584 1.1 ± 0.10Cu
- -4.004 2.7 ± 0.25Co
- -0.080.05 ± 0.005Zn
25 ± 315.29 ± 4.2333.0025.02 ± 2.76Cd
- -0.0740.13 ± 0.01
* The elements were determined using AAS.
Table 5. Limit of detection (LOD)Elements LaD u / )
As 0.8Cd ~2Co 0.2Cu ~5Cr 0.1Fe 1.0
Hg 0.05Ni I~Pb 2.0Sb 0.1Se 0.1Zn 0.2
for the elements analysedMethod
N.AAA.A.S.NAA.AAS.NAA.N.A.A.NAA.A.A.S.A.A.S.NAA.NAA.NAA.
Table 6. The maximum permissible concentration of elements m
foodstuffs for human consumption*, in f.lg/g
ElementsAsCd
HgPb
SeCuSbZn
Food**II
0.03I - 5
220 - 50
I40 - 50
*Food in general excluding fish, vegetables and beverage
** Other similar legislation exists in many countinues also for baby foods animalfoodstuffs, gauge sludge for agricultural use, and air particulates
8