DETERMINATION OF e/m OF AN ELECTRON BY THOMSON’S …
11
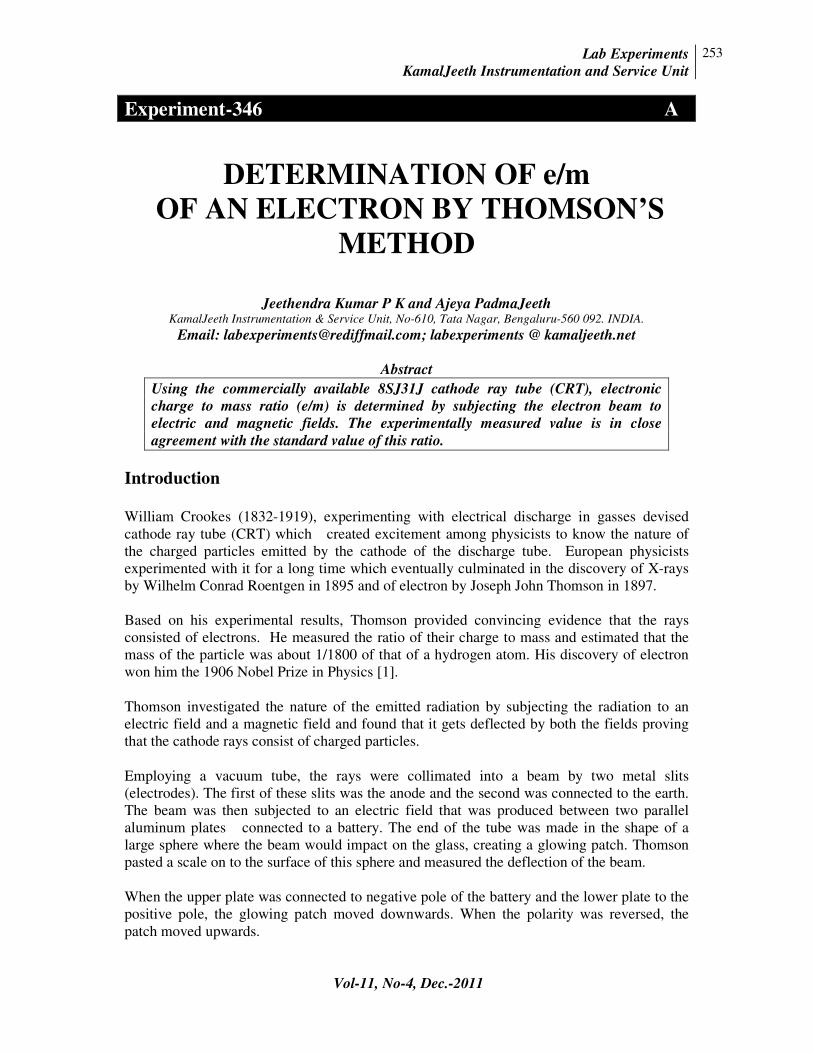
Lab Experiments KamalJeeth Instrumentation and Service Unit 253 Vol-11, No-4, Dec.-2011 Experiment-346 A DETERMINATION OF e/m OF AN ELECTRON BY THOMSON’S METHOD Jeethendra Kumar P K and Ajeya PadmaJeeth KamalJeeth Instrumentation & Service Unit, No-610, Tata Nagar, Bengaluru-560 092. INDIA. Email: [email protected]; labexperiments @ kamaljeeth.net Abstract Using the commercially available 8SJ31J cathode ray tube (CRT), electronic charge to mass ratio (e/m) is determined by subjecting the electron beam to electric and magnetic fields. The experimentally measured value is in close agreement with the standard value of this ratio. Introduction William Crookes (1832-1919), experimenting with electrical discharge in gasses devised cathode ray tube (CRT) which created excitement among physicists to know the nature of the charged particles emitted by the cathode of the discharge tube. European physicists experimented with it for a long time which eventually culminated in the discovery of X-rays by Wilhelm Conrad Roentgen in 1895 and of electron by Joseph John Thomson in 1897. Based on his experimental results, Thomson provided convincing evidence that the rays consisted of electrons. He measured the ratio of their charge to mass and estimated that the mass of the particle was about 1/1800 of that of a hydrogen atom. His discovery of electron won him the 1906 Nobel Prize in Physics [1]. Thomson investigated the nature of the emitted radiation by subjecting the radiation to an electric field and a magnetic field and found that it gets deflected by both the fields proving that the cathode rays consist of charged particles. Employing a vacuum tube, the rays were collimated into a beam by two metal slits (electrodes). The first of these slits was the anode and the second was connected to the earth. The beam was then subjected to an electric field that was produced between two parallel aluminum plates connected to a battery. The end of the tube was made in the shape of a large sphere where the beam would impact on the glass, creating a glowing patch. Thomson pasted a scale on to the surface of this sphere and measured the deflection of the beam. When the upper plate was connected to negative pole of the battery and the lower plate to the positive pole, the glowing patch moved downwards. When the polarity was reversed, the patch moved upwards.
Transcript of DETERMINATION OF e/m OF AN ELECTRON BY THOMSON’S …
Lab Experiments
KamalJeeth Instrumentation and Service Unit
253
Vol-11, No-4, Dec.-2011
Experiment-346 A
DETERMINATION OF e/m
OF AN ELECTRON BY THOMSON’S
METHOD
Jeethendra Kumar P K and Ajeya PadmaJeeth
KamalJeeth Instrumentation & Service Unit, No-610, Tata Nagar, Bengaluru-560 092. INDIA.
Email: [email protected]; labexperiments @ kamaljeeth.net
Abstract
Using the commercially available 8SJ31J cathode ray tube (CRT), electronic
charge to mass ratio (e/m) is determined by subjecting the electron beam to
electric and magnetic fields. The experimentally measured value is in close
agreement with the standard value of this ratio.
Introduction
William Crookes (1832-1919), experimenting with electrical discharge in gasses devised
cathode ray tube (CRT) which created excitement among physicists to know the nature of
the charged particles emitted by the cathode of the discharge tube. European physicists
experimented with it for a long time which eventually culminated in the discovery of X-rays
by Wilhelm Conrad Roentgen in 1895 and of electron by Joseph John Thomson in 1897.
Based on his experimental results, Thomson provided convincing evidence that the rays
consisted of electrons. He measured the ratio of their charge to mass and estimated that the
mass of the particle was about 1/1800 of that of a hydrogen atom. His discovery of electron
won him the 1906 Nobel Prize in Physics [1].
Thomson investigated the nature of the emitted radiation by subjecting the radiation to an
electric field and a magnetic field and found that it gets deflected by both the fields proving
that the cathode rays consist of charged particles.
Employing a vacuum tube, the rays were collimated into a beam by two metal slits
(electrodes). The first of these slits was the anode and the second was connected to the earth.
The beam was then subjected to an electric field that was produced between two parallel
aluminum plates connected to a battery. The end of the tube was made in the shape of a
large sphere where the beam would impact on the glass, creating a glowing patch. Thomson
pasted a scale on to the surface of this sphere and measured the deflection of the beam.
When the upper plate was connected to negative pole of the battery and the lower plate to the
positive pole, the glowing patch moved downwards. When the polarity was reversed, the
patch moved upwards.

Lab Experiments
KamalJeeth Instrumentation and Service Unit
254
Vol-11, No-4, Dec.-2011
In the present experiment we have used a commercially available CRT-8SJ31J with 70mm
diameter screen size to repeat the Thomson’s experiment and determine e/m of the charged
particles. The cathode ray tube used in this experiment is shown in Figure-1. The cathode ray
tube has three parts, namely the cathode assembly consisting of a filament which on heating
emits electrons, the anode which is kept at high potential accelerating the emitted electrons,
and the grid which focuses the electron beam. The screen is coated with a fluorescent
material which glows when the electrons impinge on it. There are two deflection anodes; the
first is the X-plate and the second consists of a pair of two Y-plates, P and Q. By applying an
electric- and/or a magnetic- field to this pair of plates, the direction of movement of electron
beam can be altered.
Figure-1: Cathode ray tube 8SJ31J
Theory If an electric field, E, is applied between the two plates perpendicular to the direction of
electron beam passing through the space between the plates, the force acting on an electron in
the upward direction of motion is given by [2,3]
F =eE …1
where F is the force acting on an electron,
e is the electronic charge =1.6x10⁻¹⁹
Coulomb, and
E is the applied electric field.
Because of the applied electric field, electrons travel in a semicircular path and strike the
screen at the point M1. By reversing the polarity of the voltage applied to the plate, electrons
can be moved in the downward direction in a semicircular path as shown in Figure-2.
Figure-2: Deflection of electron beam by an electric filed
- - -
+ +++
- -
+
-
+
L L
M1
M2
Screen-S Screen-SScreen-S
Deflecting plates Deflecting platesDeflecting plates
P PP
+ ++
--
+
- -
+
-
+
-

Lab Experiments
KamalJeeth Instrumentation and Service Unit
255
Vol-11, No-4, Dec.-2011
Instead of electric field if we apply a magnetic field perpendicular to the direction of electron
flow, similar deflection of the beam takes place by reversing the magnetic field in which case
also the direction of the beam gets reversed similar to the deflection caused by the electric
field. If r is the radius of the semicircular path traversed by an electron in the magnetic field,
the force acting on the electron is given by
Bev = ���
� …2
where B is the applied magnetic field,
v is the velocity of the electron at the point where it enters the magnetic field,
and r is the radius of the circular path traversed by the electron.
From Equation-2, e/m is given by
�
� =
�
�� …3
In order to determine the ratio e/m, one needs to know the value of the magnetic field
applied, the velocity of the electron, and radius of semicircular path traced by the electron.
Determination of electron velocity (v)
With the application of electric field, the electron beam moves to position M1 as shown in
Figure-2. Now the magnetic field is applied so that the beam deflects back to its original
position at O. When the magnetic force is equal to the electric force, the beam comes back to
its original position. Hence one can write
Bev = eE
v = �
�
�
� =
�
��� …4
Thus the electron velocity is equal to the ratio of the two applied fields which is known.
Hence v can be determined.
Determination of radius (r) of the semicircular path traced by the electron
beam
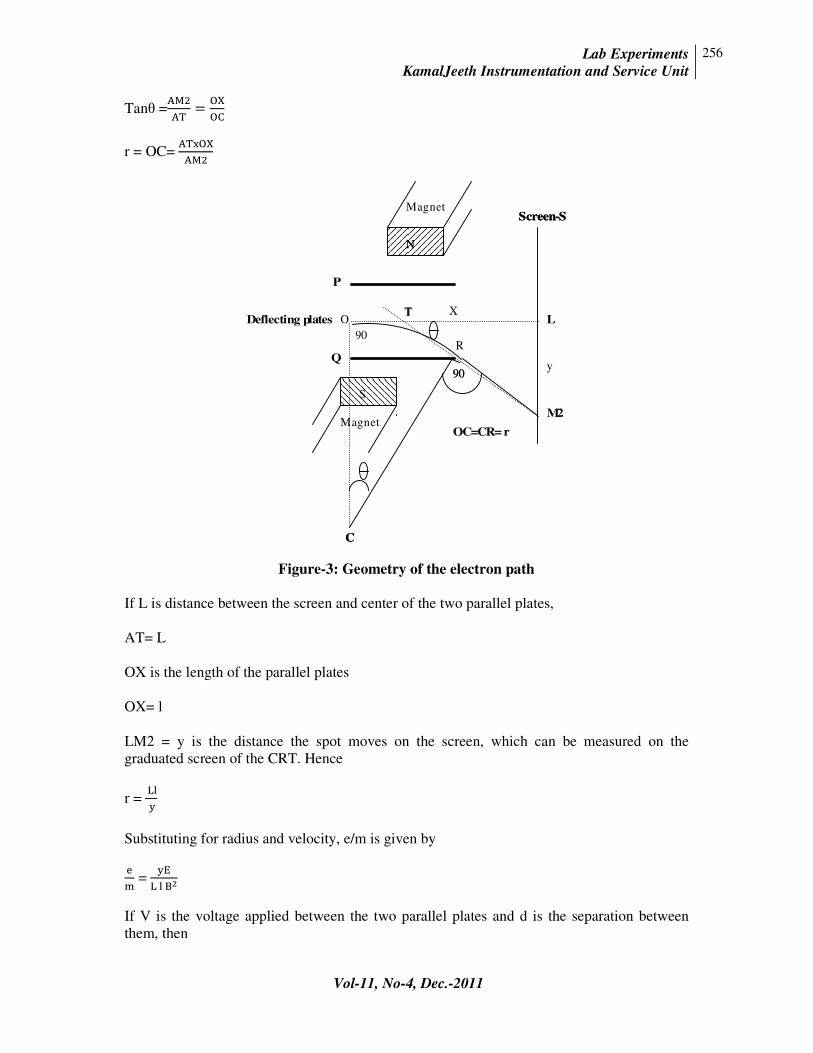
In order to determine the radius, r, one needs to consider the geometry of electron path as
shown in Figure-3. An electron entering between the pair of plates PQ at O will trace an arc
and leave the plates at R and then move in a straight line path and strike the screen at the
point M2. OA is the path traced by the electron when there is no applied field. The line
joining the electron path after leaving the plates is extrapolated to meet the OA line at T. Two
perpendicular lines OC and RC are drawn to meet at C which forms the circle of radius r.
OC and CR are two perpendicular lines drawn to meet at C. From the geometry one can write
∟OCR =∟ATM2 = θ
Lab Experiments
KamalJeeth Instrumentation and Service Unit
256
Vol-11, No-4, Dec.-2011
Tanθ =�
��=
�
�
r = OC= ��� �
�
Figure-3: Geometry of the electron path
If L is distance between the screen and center of the two parallel plates,
AT= L
OX is the length of the parallel plates
OX= l
LM2 = y is the distance the spot moves on the screen, which can be measured on the
graduated screen of the CRT. Hence
r = ��
�
Substituting for radius and velocity, e/m is given by
�
� =
��
� � ��
If V is the voltage applied between the two parallel plates and d is the separation between
them, then
O
Screen-S
Deflecting plates
Screen-S
L
M2
y
R
P
Q
TT X
9090
90
CC
OC=CR= r
Magnet
Magnet
NN
S

Lab Experiments
KamalJeeth Instrumentation and Service Unit
257
Vol-11, No-4, Dec.-2011
E=�
�
Hence
�
� =
��
����� …5
Using this equation e/m can be calculated from this experiment.
Measurement of magnetic field (B)
The magnetic field at the center of the two plates P and Q, cannot be measured using a gauss
meter because the magnetic field produced by bar magnets is of the order of 10-3
Tesla which
is quite low. Hence conventional methods are used for this. The magnetic field strength, B,
can be calculated knowing the pole strength and dimensions of the bar magnet or by the well-
known method using a magnetometer which does not need information on any dimensional
parameters of the magnet. In this method the bar magnets are placed perpendicular to the
earth’s magnetic field, as shown in the Figure-4. The CRT is aligned parallel to the earth’s
magnetic meridian in which case the electron beam travels parallel to the magnetic meridian.
Figure-4: Magnetic compass used for measuring magnetic field
The magnetic field strength at the center of the compass due to a bar magnet is given by
B = H tanθ
where H is earth’s magnetic field =3.81 x 10⁻⁵
T at Bengaluru, and
θ is the angle of deflection of the compass needle.
The permeability of vacuum (µo) does not come into picture in this case, because the
magnetic field produced by a moving electron or vice versa is not being considered here.
Hence,
NORTH
SOUTH
WEST EASTN NNS S
Bar magnetBar magnet
Magnetic compass
Magnetic meridian
9090
9090
0 0

Lab Experiments
KamalJeeth Instrumentation and Service Unit
258
Vol-11, No-4, Dec.-2011
B = H tanθ
The parameters that appear in the e/m equation (Equation-5), namely v, r and B, can be
measured experimentally and, therefore, e/m can be determined. The dimensions of the CRT
can be treated as constant K
K = lLd, Hence
�
� =
��
����� =
��
��� =
��
�����θ �� …6
From this equation if one draws a straight line graph taking Vy along Y-axis and Tan2θ along
X-axis, the slope of the straight line will be the average value of
Slope = Vy
tanθ
which can be substituted in Equation-6 to obtain the value of e/m
�
� =
��
�����θ �� =
*�+,�
��� …7
CRT constant K (=Lld)
K=Lld is known as CRT constant. As the data on the physical parameters of the tube is not
supplied by the manufacturer, we had to cut open the tube as shown in Figure-5 for
measuring them. The measured values of these parameters are:
The length (L) distance from the center of the Y-deflecting plates to the screen
L =12.3cm
(This can also be measured without breaking the tube, being the length of blackened portion
of the CRT which is visible from outside.)
Figure-5: 8SJ31J CRT internal construction
Over the years due to the change in technology, the CRT design has also changed. The Y-and
X- deflecting plates are no longer parallel plates but are horn shaped as shown in Figure-5.
Figure-6 shows their dimensions for 8SJ31J CRT. The X-plates are connected to voltage

Lab Experiments
KamalJeeth Instrumentation and Service Unit
259
Vol-11, No-4, Dec.-2011
source and there is a non-uniform electric field inside horn shaped X-plates. The electric field
decreases along the horn length. The electric field is a constant wherein the electron makes
entry in to the X-plates because of its uniform separation (10mm length of the X-plates are
parallel). Hence there is an average electric field throughout the length of plates. Or the
electric field is present along the length of the tube hence
Length of the X-plate = l =3.1cm
The magnets are placed perpendicular to the Y-plates. Hence inside the two Y-plates there is
non-uniform magnetic field. This field is present throughout the width and length of the Y-
plates. Hence width of the Y-plate is taken as plate separation d
Width of the Y-plate = d =2.8cm
K = 12.3x3.1 x 2.8 =106.7cm3=106.7x10
-6m
3.
Figure-6: Structure and dimensions of CRT 8SJ31J
Apparatus used
The apparatus used to determine e/m is shown in Figure-7. It consists of 1000V power
supply, deflection voltage ± 25V, X-shift, focus and intensity controls. A deflection
magnetometer with U-shaped stand and a set of bar magnets.
Figure-7: Experimental set-up for determination of e/m
X-plates
Y-plates
Slit
V
Applied Electric fieldin theY-direction
X
Y
Z
electron path
Screen
X-plate
X-plate
Y-plateY-plate
3.1cm
2.8cm
l =3.1cm
l =3.1cm
d =
2.8
cm
d =
2.8
cm
1.2
1.2
2
0.5 2.8 1.2
3.2

Lab Experiments
KamalJeeth Instrumentation and Service Unit
260
Vol-11, No-4, Dec.-2011
Experimental procedure
1. The magnetic meridian, giving the direction of earth’s North-South magnetic field, is
marked on the center of a study table.
2. The U-shaped stand is placed on the table and its two arms are made perpendicular to
the magnetic meridian.
3. The CRT is now placed in the arms of the U-shaped stand. In this position the axis of
the CRT is parallel to the earth’s magnetic field.
4. The CRT is now connected to the power supply kept away from the CRT and is
switched on. The brightness and focus knobs are adjusted to get a bright spot on the
CRT screen. With X- and Y- deflection voltage knobs turned to the minimum
position, the position of the spot on the screen is noted.
Initial position of the spot is reckoned as 0.0cm
5. The two bar magnets are placed on either side with opposite poles and at equal
distance from the tube on the two arms of the U-shaped deflection magnetometer
stand. The distance, D, is read from the scale
D = 3cm on the left arm and 3cm on the right arm
6. The spot moves up or down (Y-direction) depending on how the bar magnets are
placed.
7. The distance moved by the spot on the screen is noted. This is the ‘y’ deflection
y =3.3cm
8. The Y-deflection voltage is now applied so that the spot comes back to its origin
position at 0.0. The deflection voltage is read from the digital meter. This gives the
value of V as
V= 27.3 Volt
9. This completes the first trial. The Y-deflection voltage is now brought back 0.0V and
the magnets are positioned at 4cm on both the arms to repeat the experiment. The
distance moved by the spot
y =2.6cm
V=21.5V are noted
10. The trial is repeated by keeping the two magnets at different distances on the arms
and applying voltage to bring the spot back to 0.0 positions. The readings obtained are
tabulated in Table-1.

Lab Experiments
KamalJeeth Instrumentation and Service Unit
261
Vol-11, No-4, Dec.-2011
11. In the second part of the experiment the position of the magnets is reversed so that the
deflection of the spot is on the opposite side. The polarity of the deflecting voltage is
also reversed by turning the switch to the reverse position. The readings of deflection
y, and deflecting voltage for different positions of the magnet are recorded in Table-2.
12. The CRT is now removed without disturbing the arms and a compass is placed in its
place with its pointer reading 900-90
0 along the magnetic meridian and 0
0-0
0
perpendicular to the magnetic meridian, as shown in Figure-8.
Table-1
Position of
the magnet
(D)cm
Spot
deflection
y (cm)
Y-
deflecting
voltage (V)
Vy
Deflection
θ
Tanθ Tan2θ
3 3.3 27.3 90.09 80.0 5.67 32.14
4 2.6 21.5 55.90 76.5 4.16 17.30
5 2.0 16.9 33.80 73.0 3.27 10.69
6 1.6 13.6 21.76 69.0 2.60 6.76
7 1.3 11.0 14.30 65.0 2.14 4.57
8 1.1 9.2 10.12 60.5 1.76 3.09
9 0.9 7.6 6.84 55.0 1.43 2.04
10 0.7 6.5 4.55 51.0 1.23 1.51
Deflection of the spot and voltage applied in forward (upward) direction
13. The two bar magnets are now placed at a distance of 3cm on both the arms and
deflection in the compass is noted (reading of any one of the two pointers is enough
for this purpose).
14. For various positions of the magnet given in Table-1, the deflection angle is noted and
recorded in Table-1. Value of the tangent of the angle is also recorded and Tan2θ is
calculated and presented in Table-1.
Figure-8: The compass placed in the magneto meter to measure B
15. The magnets are reversed in their positions and the deflection angle, θ, of the compass
needle is noted for various positions of the magnet and recorded in Table-2. Tanθ
and Tan2θ are also calculated and presented in the Table-2.
16. A graph is drawn with Tan2θ on X-axis and the product ‘Vy’ on Y-axis, as shown in
Figures-9 and 10 for the forward and reverse case respectively. The slope of the
straight line is determined as
Slope= -.- -/0
1-1= 2.8cmV = 0.028mV
The value of e/m is calculated using Equation-7

Lab Experiments
KamalJeeth Instrumentation and Service Unit
262
Vol-11, No-4, Dec.-2011
Figure-9: Tan2θ versus Vy curve with forward voltage
Slope= 89-:9
.9-;= 2.857cmV = 0.02857mV
Table-2
Position of
the magnet
(D)cm
Spot
deflection
y (cm)
Y-
deflection
voltage (V)
Vy
Deflection
θ
Tanθ Tan2θ
3 3.2 -26.9 -86.08 80 5.67 32.14
4 2.4 -20.5 -49.20 76 4.01 16.08
5 1.9 -16.3 -30.97 74 3.48 12.11
6 1.5 -12.7 -19.05 70 2.74 7.50
7 1.2 -10.5 -12.60 65 2.14 4.57
8 1.0 -8.7 -8.70 61 1.80 3.24
9 0.8 -7.1 -5.68 57 1.53 2.34
10 0.7 -6.0 -4.2 51 1.23 1.51
Deflection of the spot and voltage applied in reverse (downward) direction
Figure-10: Tan2θ versus Vy curve with reverse voltage
0
10
20
30
40
50
60
70
80
90
100
0 10 20 30 40
Vy (
cm.V
)
Tan2θ
-100
-90
-80
-70
-60
-50
-40
-30
-20
-10
0
0 5 10 15 20 25 30 35
Vy (
Vcm
)
Tan2θ

Lab Experiments
KamalJeeth Instrumentation and Service Unit
263
Vol-11, No-4, Dec.-2011
�
� =
��
�����θ �� =
*�+,�
��� =
9.901:
>8.0.?.9@AB>[email protected]/.:?.9@C=1.84x10
11Kg/C
For the case of reverse voltage
�
� =
��
�����θ �� =
*�+,�
��� =
9.90
>8.0.?.9@AB>[email protected]/.:?.9@C=1.80x10
11Kg/C
Average value of e/m = 1.81x10¹¹
Kg/C
Results
Electron charge to mass ratio, e/m is found to be 1.81x10¹¹
Kg/Coulomb, which is very close
to the currently accepted value 1.758x10¹¹
Kg/Coulomb.
References
[1] Jeethendra Kumar P K and P Sharma, Electron and its charge, Lab Experiments, Vol-
11, No-3, Sept.-2011, Page-246.
[2] C L Arpra, BSc Proactical Physics, 19th
Edn., S Chand & Company Ltd, 2000, Page-
410.
[3] Experiment to show that cathode rays could be deflected electrically,
en.wikipedia.org/wiki/J._J._Thomson