Determination of Atmospheric Pollutant Emission Factors at ... - Defra, UK · Determination of...
32
AEAT/R/ENV/0518 Issue 1 Determination of Atmospheric Pollutant Emission Factors at a Small Industrial Wood-Burning Furnace A report produced for the Department of the Environment, Transport and the Regions, the National Assembly for Wales, the Scottish Executive and the Department of the Environment for Northern Ireland AEA Technology Environment March 2001
Transcript of Determination of Atmospheric Pollutant Emission Factors at ... - Defra, UK · Determination of...
AEAT/R/ENV/0518 Issue 1
Determination ofAtmospheric PollutantEmission Factors at a SmallIndustrial Wood-BurningFurnace
A report produced for the Department of theEnvironment, Transport and the Regions, the NationalAssembly for Wales, the Scottish Executive and theDepartment of the Environment for Northern Ireland
AEA Technology Environment
March 2001

AEAT/R/ENV/0518 Issue 1
AEA Technology ii
Title Determination of Atmospheric Pollutant Emission Factors at a SmallIndustrial Wood-Burning Furnace
Customer Department of the Environment, Transport and the Regions, theNational Assembly for Wales, the Scottish Executive and theDepartment of the Environment for Northern Ireland
Customer reference
Confidentiality,copyright andreproduction
Copyright AEA Technology plcAll rights reserved.
Enquiries about copyright and reproduction should be addressed tothe Commercial Manager, AEA Technology plc
File reference AEAT/20699208
Report number AEAT/R/ENV/0518
Report status Issue 1
AEA Technology EnvironmentE1 CulhamAbingdonOxonOX14 3EDTelephone 01235 463391Facsimile 01235 463038
AEA Technology Environment is the trading name ofAEA Technology plc.AEA Technology Environment is certified to BS EN ISO9001.
Name Signature Date
Author G Thistlethwaite
Reviewed by R Stewart
Approved by A Collings

AEAT/R/ENV/0518 Issue 1
AEA Technology Environment iii
Executive Summary
AEA Technology has undertaken a programme of measurements at a wood-burning plant todetermine pollutant emission factors for the Department of Environment, Transport and theRegions (DETR), the National Assembly for Wales, the Scottish Executive and theDepartment of the Environment for Northern Ireland. The emission factor data are intendedfor further development of the UK National Atmospheric Emissions Inventory (NAEI) which ismaintained by AEA Technology on behalf of DETR.
Emission measurements were undertaken at a furnace burning joinery waste from a furniturefactory. The SNAP code for the furnace is 020103. Emission factors were determined for thefollowing determinands :
• Polychlorinated dibenzo-p-dioxins (PCDD)• Polychlorinated dibenzofurans (PCDF)• Polychlorinated biphenyls (PCB)• Polycyclic aromatic hydrocarbons (PAH)• PM10
• PM2.5
• Carbon Monoxide• Total Particulate Matter (TPM)
A summary of the emission factors determined in the programme is provided in the followingtable.
Pollutant Emission factorng kg-1 ng MJ-1
Total PCDD/F (ITEQ) 13 0.72Total PCB 556 32Total PCB (ITEQ) 0.37 0.021Total PAH 41,000 2,300
g kg-1 g MJ-1
PM10 0.44 0.025PM2.5 0.37 0.021TPM 0.46 0.026CO 2.58 0.150
Notes :1. Factors are calculated for mass of wood as burned and for net thermal input.2. See main text for speciated PCDD/F, PCB and PAH emission factors.
This work indicates that the NAEI PAH data may overestimate emissions from industrial woodcombustion by several orders of magnitude. It is recommended that the NAEI considersadopting PAH emission factors from this investigation or from USEPA. The Naphthaleneemission factor determined in this investigation is not proposed for inclusion in the NAEI as itlikely to underestimate emissions.
AEAT/R/ENV/0518 Issue 1
AEA Technology Environment iv
In the absence of other PAH data, the conservative approach may be to adopt the highestfactors for each compound. The data should be assessed by the NAEI to determine if emissionsare significant and if further emission measurements are required to improve uncertainty for thesource sector.
This work indicates that the PAH data published by EMEP/Corinair may overestimateemissions from industrial wood combustion by several orders of magnitude. In addition, thePAH emission factors determined for this wood furnace indicate that the EMEP/Corinair PAHemission profile may not be applicable to UK industrial wood combustion.
Emission factors for dioxins and furans from wood combustion are higher than the currentNAEI factor and USEPA default factors. In the absence of data specific to UK processes and toprovide a ‘worst case’ emission inventory it is recommended that the NAEI adopt emissionfactors from this investigation. The significance of the emission from industrial woodcombustion should be assessed by the NAEI and the need for further investigation determined.
In the absence of other published data for PCB emissions from wood combustion,AEA Technology recommends inclusion of the emission factors determined in this investigationinto the NAEI. The contribution of industrial wood combustion to UK PCB emissions shouldbe assessed by NAEI to determine if further source monitoring is required.
The NAEI emission factor for CO from industrial wood burning processes is higher than theemission factor determined at this plant. The CO emission concentration found at the furnacewas higher than the emission limit value for new plant. Consequently the NAEI factor mayoverestimate current emissions and is likely to overestimate future emissions from such plant. IfCO emissions are significant from this sector, further investigation may be required to improveuncertainty for the sector.
The NAEI does not currently estimate PM10 , particulate or black smoke emission factors forwood combustion. The PM10 and PM2.5 emission factors determined in this investigationshould be assessed by the NAEI to determine if emissions are significant and if furtherinvestigation is required to improve uncertainty for the source sector.
Benzene measurements provided limited information and it is recommended that the USEPAdefault factor is adopted by the NAEI to determine if emissions are significant and if furtherinvestigation is required to improve uncertainty for the source sector.
AEAT/R/ENV/0518 Issue 1
AEA Technology Environment v
Contents
1 Introduction 1
2 Plant Description 2
3 Emission factors 3
3.1 DEFINITION 33.2 DERIVATION 33.3 EXPRESSION 3
4 Experimental 4
4.1 SAMPLING POSITION 44.2 AIR EMISSIONS SAMPLING METHODS 44.3 FUEL ANALYSIS METHODOLOGY 4
5 Emission Factor Results 6
6 Emission limit values 9
7 Comparison with NAEI, USEPA and UNECE Emission Factors10
7.1 COMPARISON WITH NAEI EMISSION FACTORS 107.2 COMPARISON WITH EMEP/CORINAIR EMISSION FACTORS 117.3 COMPARISON WITH USEPA EMISSION FACTORS 11
7.3.1 Overview 117.3.2 Total Particulate and PM10 127.3.3 Carbon monoxide and carbon dioxide 127.3.4 PAH Emission factors 127.3.5 Dioxins and furans 127.3.6 Benzene 12
8 Uncertainty of Emission Factors 14
9 Findings and Recommendations 15
9.1 PAH EMISSIONS 159.2 DIOXINS AND FURANS EMISSION FACTORS 159.3 PCB EMISSION FACTORS 16
AEAT/R/ENV/0518 Issue 1
AEA Technology Environment vi
9.4 CARBON MONOXIDE AND BENZENE 169.5 PARTICULATE, PM10 AND PM2.5 16
10 Acknowledgement 17
11 References 18
APPENDIX A Summary of test data – 30 October 2000
APPENDIX B Summary of test data – 31 October 2000
APPENDIX C Summary of test data – 1 November 2000
APPENDIX D Summary of test data – 2 November 2000
APPENDIX E Summary of test data – 3 November 2000
APPENDIX F Fuels analysis
AEAT/R/ENV/0518 Issue 1
Page 1 of 18 AEA Technology Environment
1 Introduction
AEA Technology has undertaken a programme of measurements at a wood-burning furnace todetermine pollutant emission factors for the Department of Environment, Transport and theRegions (DETR) , the National Assembly for Wales, the Scottish Executive and the Department ofthe Environment for Northern Ireland. The emission factor data are intended for development ofthe UK National Atmospheric Emissions Inventory (NAEI) which is maintained by AEATechnology on behalf of DETR.
This report summarises a work programme undertaken to determine emission factors for thefollowing determinands:
• Polychlorinated dibenzo-p-dioxins (PCDD)• Polychlorinated dibenzofurans (PCDF)• Polychlorinated biphenyls (PCB)• Polycyclic aromatic hydrocarbons (PAH)• PM10
• PM2.5
• Carbon Monoxide• Total Particulate Matter (TPM)
The existing information on emission factors from wood-burning sources in the NAEI for the abovesubstances is either highly uncertain or absent altogether. This set of tests was required in order toallow the NAEI to assess the significance of industrial wood-burning processes as a source of thesesubstances.
The emission factors derived from the emission measurements are compared with emission factorscurrently used in the NAEI and emission factors published by the US Environmental ProtectionAgency (USEPA) and in the UNECE EMEP/Corinair Atmospheric emissions inventoryguidebook.
AEAT/R/ENV/0518 Issue 1
Page 2 of 18 AEA Technology Environment
2 Plant Description
Emissions to atmosphere from a wood-fired air-heater at a furniture factory was investigated. Theboiler burns waste soft and hard wood from machining processes, at a rate of approximately 0.25te/hr. The system is refractory lined, has no secondary burner fitted and has a cyclone installed toabate particulate emissions. Heat is recovered from the unit in the form of hot air used for heatingand drying purposes, and the system has a maximum heat output of 5 million BTU/hr (about 1.5MW).
The SNAP (Selected Nomenclature of Air Pollution) source code for the furnace is 020103.Solid waste combustion processes between 0.4 and 3MW (net thermal input) are prescribed for localauthority control under the UK Environmental Protection Act 1990.
Selection of the process was based on several criteria. Ideally, the site chosen was to berepresentative of UK wood burning processes. However, it is clear that whilst this is acomparatively modest industry sector, there is wide variation both in the type of materials burnedand in the process plant.
The plant selected was chosen following a survey of Local Authorities (the regulatory authority forthis category of process in the UK). Selection was based on the cooperation offered by regulatorsand operators, ease of access to the site, the operating regime of the plant (continuous preferred tobatch in this instance), the availability of sampling facilities, a reasonably constant supply of feedmaterial and the ease of installation of sampling equipment.
AEAT/R/ENV/0518 Issue 1
Page 3 of 18 AEA Technology Environment
3 Emission factors
3.1 DEFINITION
An emission factor enables the calculation of the quantity of a pollutant discharged to atmospherefrom a specified process with a known production activity, and has been defined[1] as, "a statisticalaverage of the rate at which a pollutant is released to the atmosphere as a result of some activity suchas combustion or industrial production divided by the rate of that activity".
3.2 DERIVATION
There are several ways of deriving (and expressing) emission factors. The method which has beenused to derive the emission factors at combustion plant in this measurement programme is based ona knowledge of the fuel composition, via chemical analysis, and an analysis of the flue gas.
For combustion processes, the ultimate analysis of the fuel can be used to provide the theoretical(stoichiometric) flue gas volume and composition associated with a unit of the fuel (for example fora kg of wood). The relationship between the oxygen concentration and the excess air is thendetermined. The flue gas oxygen analysis is then used to calculate the total volume of flue gas (perunit of fuel). The mass of pollutant emitted per unit of fuel (the pollutant emission factor) can thenbe calculated from the flue gas analysis and the derived flue gas volume.
This approach has the advantage that it can be applied almost universally to combustion processes.Other techniques for measurement of emission factors require information that may not be readilyavailable or cannot be accurately measured at all plant.
3.3 EXPRESSION
Emission factors for combustion sources are usually expressed as the mass of pollutant emitteddivided by the mass or volume of fuel burned (for example, g CO per kg wood).
When comparing emission factors it is necessary to express the emission factors in comparable termsfor example, g pollutant per kg dry, ash-free coal, g pollutant per m3 gas at STP (0°C, 101.3 kPa), orper unit of heat input, g GJ-1 (on a Net or Inferior basis).
The emission factors for wood combustion in this report are expressed as a mass of pollutant permass of wood as burned (for example g kg-1) and, as a mass of pollutant per unit of net thermal input(for example g GJ-1).

AEAT/R/ENV/0518 Issue 1
Page 4 of 18 AEA Technology Environment
4 Experimental
4.1 SAMPLING POSITION
The sampling position is installed in a vertical section of the ductwork, downstream from theabatement plant.
Ideally, the selected sampling position should be located downstream of all abatement kit andsources of flow disturbances where the velocity profile is even across the duct and the flue gases arehomogeneous. The sampling position should allow sampling methodologies to be conducted torecognised standards.
Most of the target pollutants have a significant particulate fraction and the sampling methodologiesrequire multi-point isokinetic sampling on a grid pattern across two or more traverses (dioxins,furans, PCBs, PAHs, TPM, PM10 and PM2.5). However, multi-point sampling could not beconducted in full accordance with the standard methods, as there was only a single access port fittedat the sampling position, due to access constraints about the stack.
4.2 AIR EMISSIONS SAMPLING METHODS
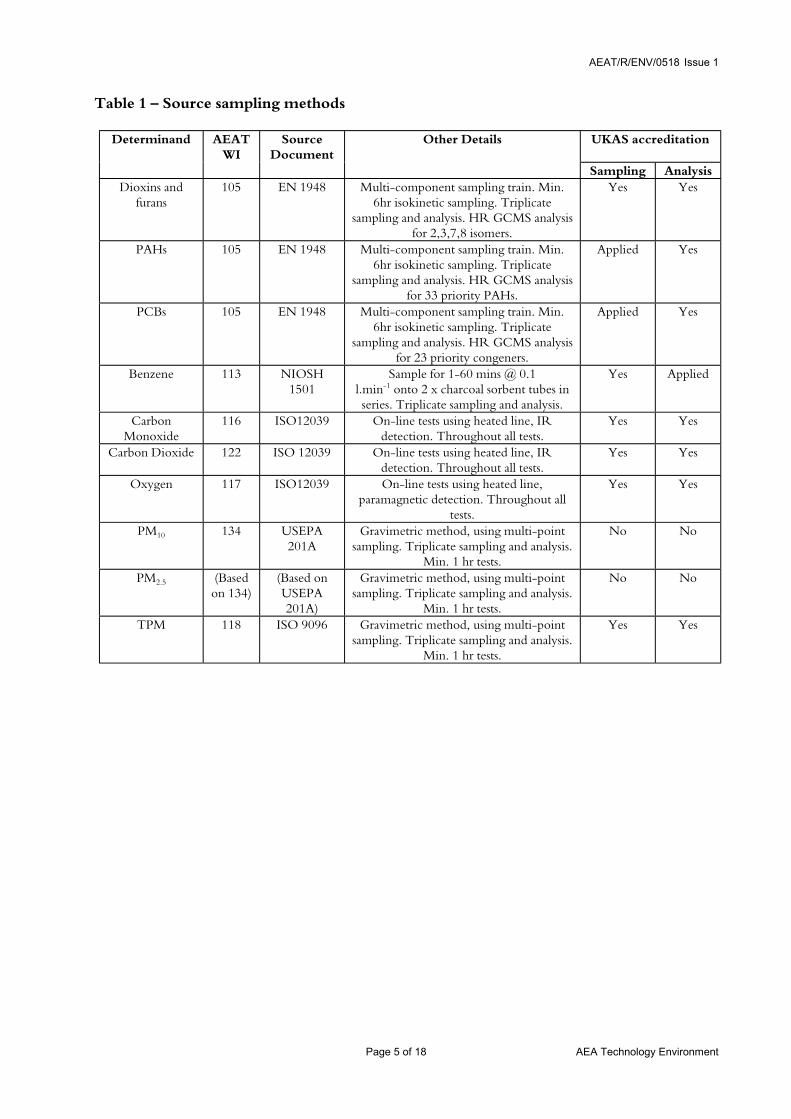
The releases to air were monitored using AEA Technology documented procedures, shown inTable 1. Many of the procedures employed by AEA Technology are UKAS accredited however,deviations from the procedures were necessary for most of the measurements.
4.3 FUEL ANALYSIS METHODOLOGY
Wood fuel samples (both hard and soft wood samples) were obtained during the visit and submittedfor ultimate analysis. However, due to the limited supply of waste and the large size of the material,a sampling protocol to ensure that the sample was representative could not be followed.
Analysis of these fuel samples was undertaken by TES Bretby, P.O. Box 100, Burton-on-Trent,Staffordshire.
AEAT/R/ENV/0518 Issue 1
Page 5 of 18 AEA Technology Environment
Table 1 – Source sampling methods
Determinand AEATWI
SourceDocument
Other Details UKAS accreditation
Sampling AnalysisDioxins and
furans105 EN 1948 Multi-component sampling train. Min.
6hr isokinetic sampling. Triplicatesampling and analysis. HR GCMS analysis
for 2,3,7,8 isomers.
Yes Yes
PAHs 105 EN 1948 Multi-component sampling train. Min.6hr isokinetic sampling. Triplicate
sampling and analysis. HR GCMS analysisfor 33 priority PAHs.
Applied Yes
PCBs 105 EN 1948 Multi-component sampling train. Min.6hr isokinetic sampling. Triplicate
sampling and analysis. HR GCMS analysisfor 23 priority congeners.
Applied Yes
Benzene 113 NIOSH1501
Sample for 1-60 mins @ 0.1l.min-1 onto 2 x charcoal sorbent tubes inseries. Triplicate sampling and analysis.
Yes Applied
CarbonMonoxide
116 ISO12039 On-line tests using heated line, IRdetection. Throughout all tests.
Yes Yes
Carbon Dioxide 122 ISO 12039 On-line tests using heated line, IRdetection. Throughout all tests.
Yes Yes
Oxygen 117 ISO12039 On-line tests using heated line,paramagnetic detection. Throughout all
tests.
Yes Yes
PM10 134 USEPA201A
Gravimetric method, using multi-pointsampling. Triplicate sampling and analysis.
Min. 1 hr tests.
No No
PM2.5 (Basedon 134)
(Based onUSEPA201A)
Gravimetric method, using multi-pointsampling. Triplicate sampling and analysis.
Min. 1 hr tests.
No No
TPM 118 ISO 9096 Gravimetric method, using multi-pointsampling. Triplicate sampling and analysis.
Min. 1 hr tests.
Yes Yes
AEAT/R/ENV/0518 Issue 1
Page 6 of 18 AEA Technology Environment
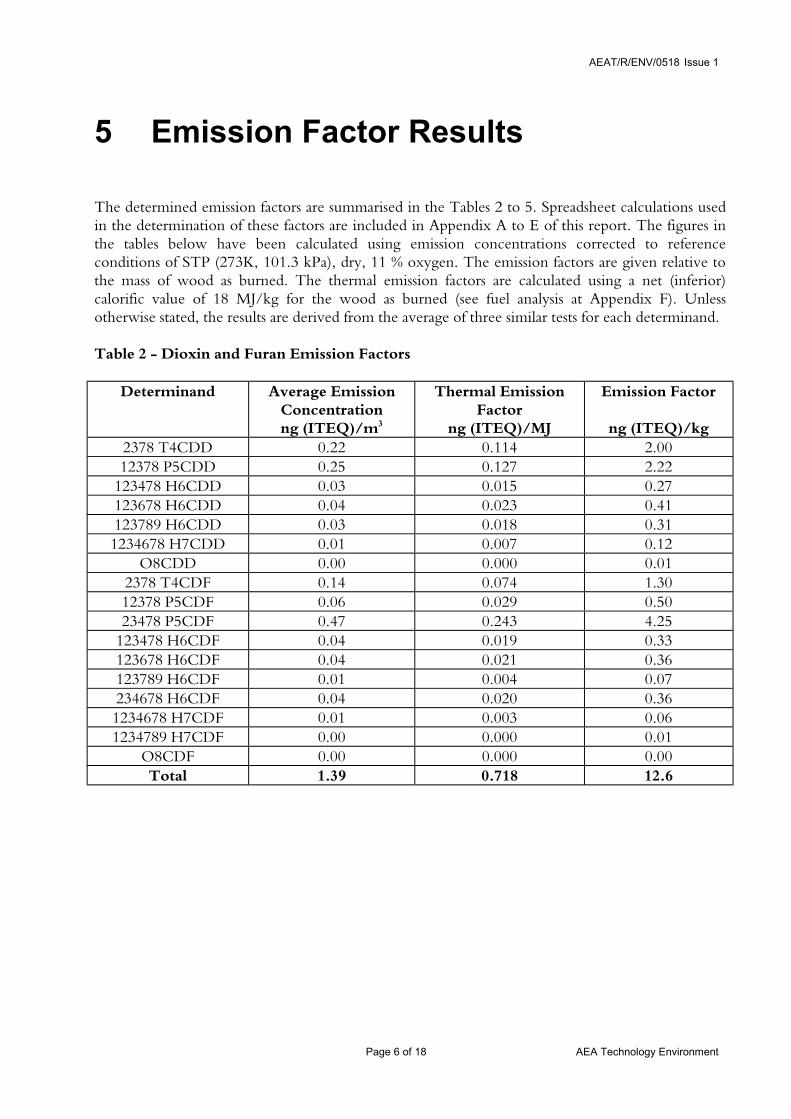
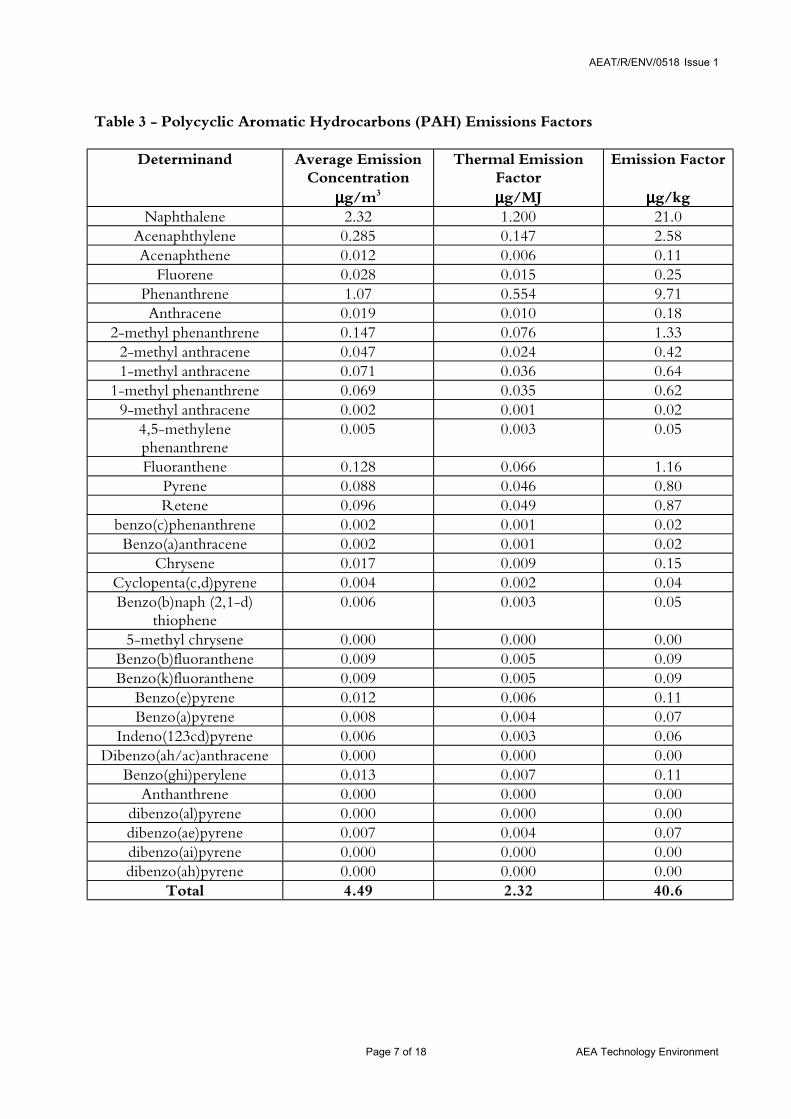
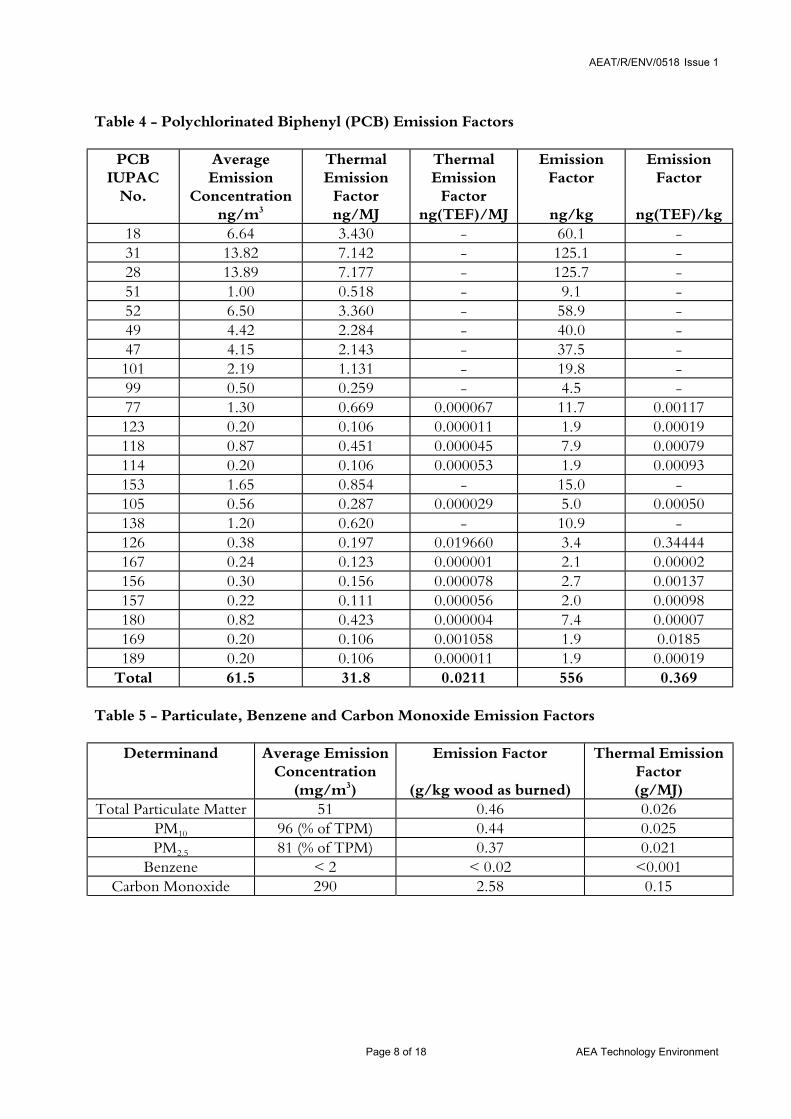
5 Emission Factor Results
The determined emission factors are summarised in the Tables 2 to 5. Spreadsheet calculations usedin the determination of these factors are included in Appendix A to E of this report. The figures inthe tables below have been calculated using emission concentrations corrected to referenceconditions of STP (273K, 101.3 kPa), dry, 11 % oxygen. The emission factors are given relative tothe mass of wood as burned. The thermal emission factors are calculated using a net (inferior)calorific value of 18 MJ/kg for the wood as burned (see fuel analysis at Appendix F). Unlessotherwise stated, the results are derived from the average of three similar tests for each determinand.
Table 2 - Dioxin and Furan Emission Factors
Determinand Average EmissionConcentrationng (ITEQ)/m3
Thermal EmissionFactor
ng (ITEQ)/MJ
Emission Factor
ng (ITEQ)/kg2378 T4CDD 0.22 0.114 2.0012378 P5CDD 0.25 0.127 2.22
123478 H6CDD 0.03 0.015 0.27123678 H6CDD 0.04 0.023 0.41123789 H6CDD 0.03 0.018 0.31
1234678 H7CDD 0.01 0.007 0.12O8CDD 0.00 0.000 0.01
2378 T4CDF 0.14 0.074 1.3012378 P5CDF 0.06 0.029 0.5023478 P5CDF 0.47 0.243 4.25
123478 H6CDF 0.04 0.019 0.33123678 H6CDF 0.04 0.021 0.36123789 H6CDF 0.01 0.004 0.07234678 H6CDF 0.04 0.020 0.361234678 H7CDF 0.01 0.003 0.061234789 H7CDF 0.00 0.000 0.01
O8CDF 0.00 0.000 0.00Total 1.39 0.718 12.6
AEAT/R/ENV/0518 Issue 1
Page 7 of 18 AEA Technology Environment
Table 3 - Polycyclic Aromatic Hydrocarbons (PAH) Emissions Factors
Determinand Average EmissionConcentration
µµµµg/m3
Thermal EmissionFactorµµµµg/MJ
Emission Factor
µµµµg/kgNaphthalene 2.32 1.200 21.0
Acenaphthylene 0.285 0.147 2.58Acenaphthene 0.012 0.006 0.11
Fluorene 0.028 0.015 0.25Phenanthrene 1.07 0.554 9.71Anthracene 0.019 0.010 0.18
2-methyl phenanthrene 0.147 0.076 1.332-methyl anthracene 0.047 0.024 0.421-methyl anthracene 0.071 0.036 0.64
1-methyl phenanthrene 0.069 0.035 0.629-methyl anthracene 0.002 0.001 0.02
4,5-methylenephenanthrene
0.005 0.003 0.05
Fluoranthene 0.128 0.066 1.16Pyrene 0.088 0.046 0.80Retene 0.096 0.049 0.87
benzo(c)phenanthrene 0.002 0.001 0.02Benzo(a)anthracene 0.002 0.001 0.02
Chrysene 0.017 0.009 0.15Cyclopenta(c,d)pyrene 0.004 0.002 0.04Benzo(b)naph (2,1-d)
thiophene0.006 0.003 0.05
5-methyl chrysene 0.000 0.000 0.00Benzo(b)fluoranthene 0.009 0.005 0.09Benzo(k)fluoranthene 0.009 0.005 0.09
Benzo(e)pyrene 0.012 0.006 0.11Benzo(a)pyrene 0.008 0.004 0.07
Indeno(123cd)pyrene 0.006 0.003 0.06Dibenzo(ah/ac)anthracene 0.000 0.000 0.00
Benzo(ghi)perylene 0.013 0.007 0.11Anthanthrene 0.000 0.000 0.00
dibenzo(al)pyrene 0.000 0.000 0.00dibenzo(ae)pyrene 0.007 0.004 0.07dibenzo(ai)pyrene 0.000 0.000 0.00dibenzo(ah)pyrene 0.000 0.000 0.00
Total 4.49 2.32 40.6
AEAT/R/ENV/0518 Issue 1
Page 8 of 18 AEA Technology Environment
Table 4 - Polychlorinated Biphenyl (PCB) Emission Factors
PCBIUPAC
No.
AverageEmission
Concentrationng/m3
ThermalEmission
Factorng/MJ
ThermalEmission
Factorng(TEF)/MJ
EmissionFactor
ng/kg
EmissionFactor
ng(TEF)/kg18 6.64 3.430 - 60.1 -31 13.82 7.142 - 125.1 -28 13.89 7.177 - 125.7 -51 1.00 0.518 - 9.1 -52 6.50 3.360 - 58.9 -49 4.42 2.284 - 40.0 -47 4.15 2.143 - 37.5 -101 2.19 1.131 - 19.8 -99 0.50 0.259 - 4.5 -77 1.30 0.669 0.000067 11.7 0.00117123 0.20 0.106 0.000011 1.9 0.00019118 0.87 0.451 0.000045 7.9 0.00079114 0.20 0.106 0.000053 1.9 0.00093153 1.65 0.854 - 15.0 -105 0.56 0.287 0.000029 5.0 0.00050138 1.20 0.620 - 10.9 -126 0.38 0.197 0.019660 3.4 0.34444167 0.24 0.123 0.000001 2.1 0.00002156 0.30 0.156 0.000078 2.7 0.00137157 0.22 0.111 0.000056 2.0 0.00098180 0.82 0.423 0.000004 7.4 0.00007169 0.20 0.106 0.001058 1.9 0.0185189 0.20 0.106 0.000011 1.9 0.00019
Total 61.5 31.8 0.0211 556 0.369
Table 5 - Particulate, Benzene and Carbon Monoxide Emission Factors
Determinand Average EmissionConcentration
(mg/m3)
Emission Factor
(g/kg wood as burned)
Thermal EmissionFactor(g/MJ)
Total Particulate Matter 51 0.46 0.026PM10 96 (% of TPM) 0.44 0.025PM2.5 81 (% of TPM) 0.37 0.021
Benzene < 2 < 0.02 <0.001Carbon Monoxide 290 2.58 0.15
AEAT/R/ENV/0518 Issue 1
Page 9 of 18 AEA Technology Environment
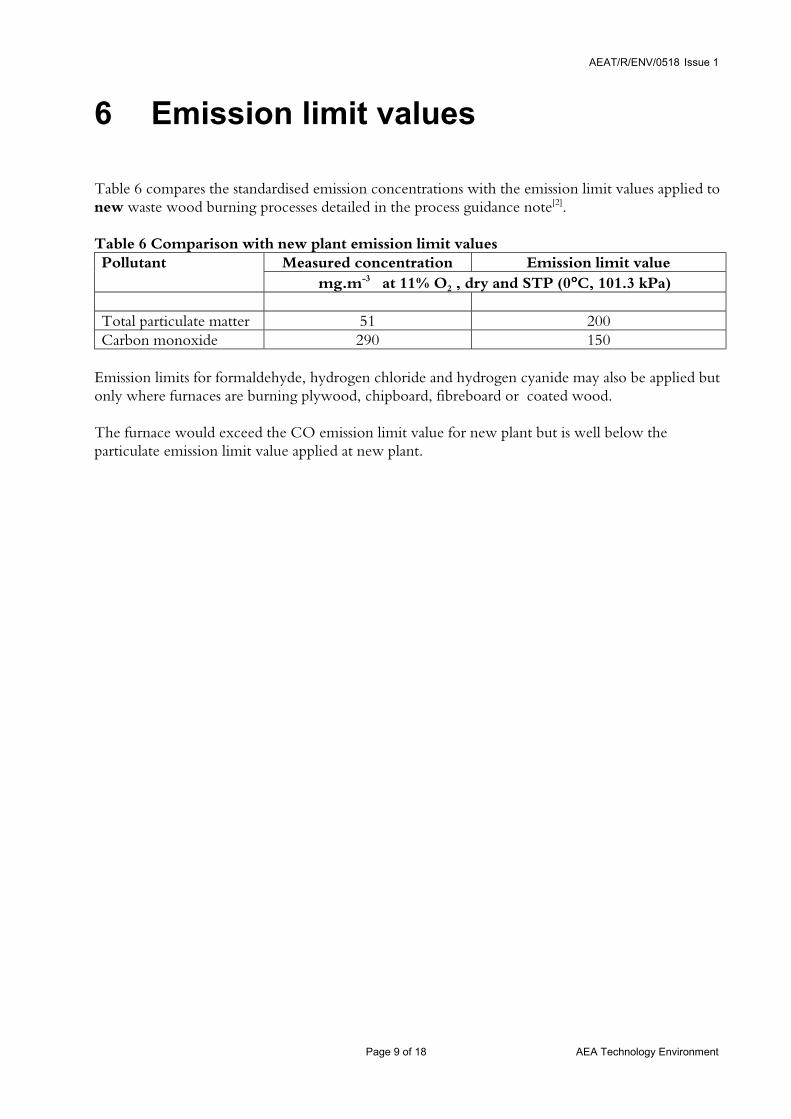
6 Emission limit values
Table 6 compares the standardised emission concentrations with the emission limit values applied tonew waste wood burning processes detailed in the process guidance note[2].
Table 6 Comparison with new plant emission limit valuesPollutant Measured concentration Emission limit value
mg.m-3 at 11% O2 , dry and STP (0°°°°C, 101.3 kPa)
Total particulate matter 51 200Carbon monoxide 290 150
Emission limits for formaldehyde, hydrogen chloride and hydrogen cyanide may also be applied butonly where furnaces are burning plywood, chipboard, fibreboard or coated wood.
The furnace would exceed the CO emission limit value for new plant but is well below theparticulate emission limit value applied at new plant.
AEAT/R/ENV/0518 Issue 1
Page 10 of 18 AEA Technology Environment
7 Comparison with NAEI, USEPA andUNECE Emission Factors
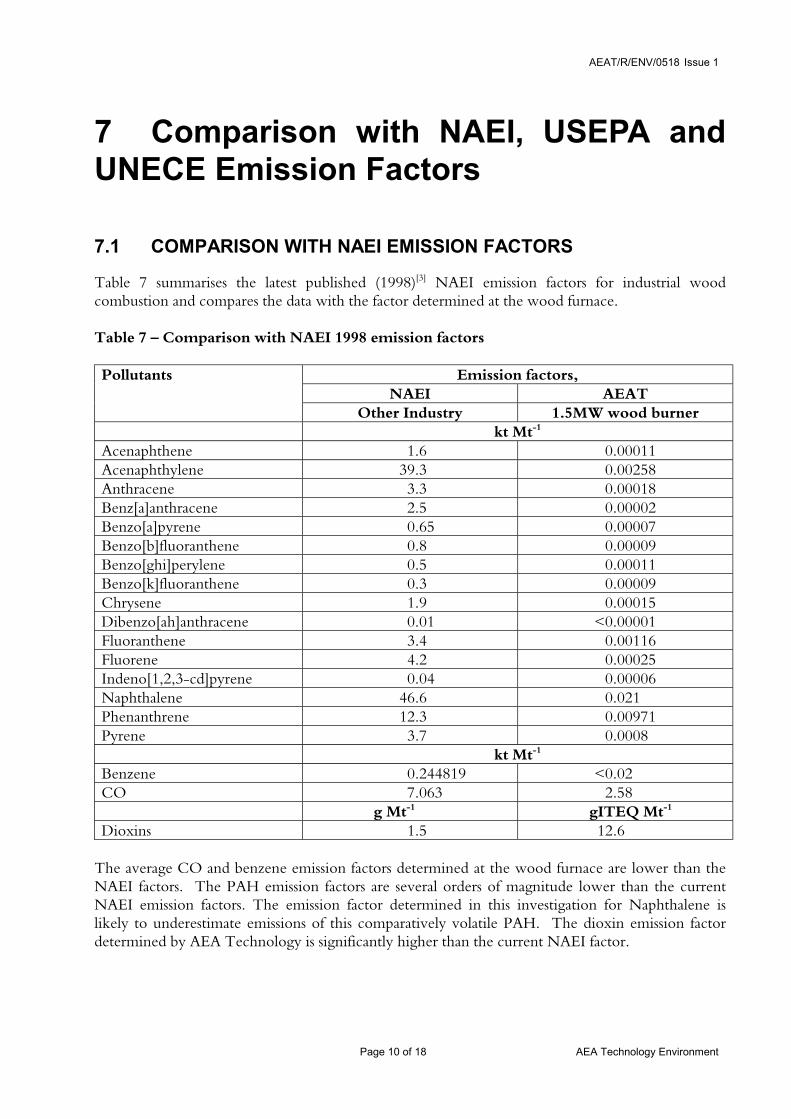
7.1 COMPARISON WITH NAEI EMISSION FACTORS
Table 7 summarises the latest published (1998)[3] NAEI emission factors for industrial woodcombustion and compares the data with the factor determined at the wood furnace.
Table 7 – Comparison with NAEI 1998 emission factors
Pollutants Emission factors,NAEI AEAT
Other Industry 1.5MW wood burnerkt Mt-1
Acenaphthene 1.6 0.00011Acenaphthylene 39.3 0.00258Anthracene 3.3 0.00018Benz[a]anthracene 2.5 0.00002Benzo[a]pyrene 0.65 0.00007Benzo[b]fluoranthene 0.8 0.00009Benzo[ghi]perylene 0.5 0.00011Benzo[k]fluoranthene 0.3 0.00009Chrysene 1.9 0.00015Dibenzo[ah]anthracene 0.01 <0.00001Fluoranthene 3.4 0.00116Fluorene 4.2 0.00025Indeno[1,2,3-cd]pyrene 0.04 0.00006Naphthalene 46.6 0.021Phenanthrene 12.3 0.00971Pyrene 3.7 0.0008
kt Mt-1
Benzene 0.244819 <0.02CO 7.063 2.58
g Mt-1 gITEQ Mt-1
Dioxins 1.5 12.6
The average CO and benzene emission factors determined at the wood furnace are lower than theNAEI factors. The PAH emission factors are several orders of magnitude lower than the currentNAEI emission factors. The emission factor determined in this investigation for Naphthalene islikely to underestimate emissions of this comparatively volatile PAH. The dioxin emission factordetermined by AEA Technology is significantly higher than the current NAEI factor.
AEAT/R/ENV/0518 Issue 1
Page 11 of 18 AEA Technology Environment
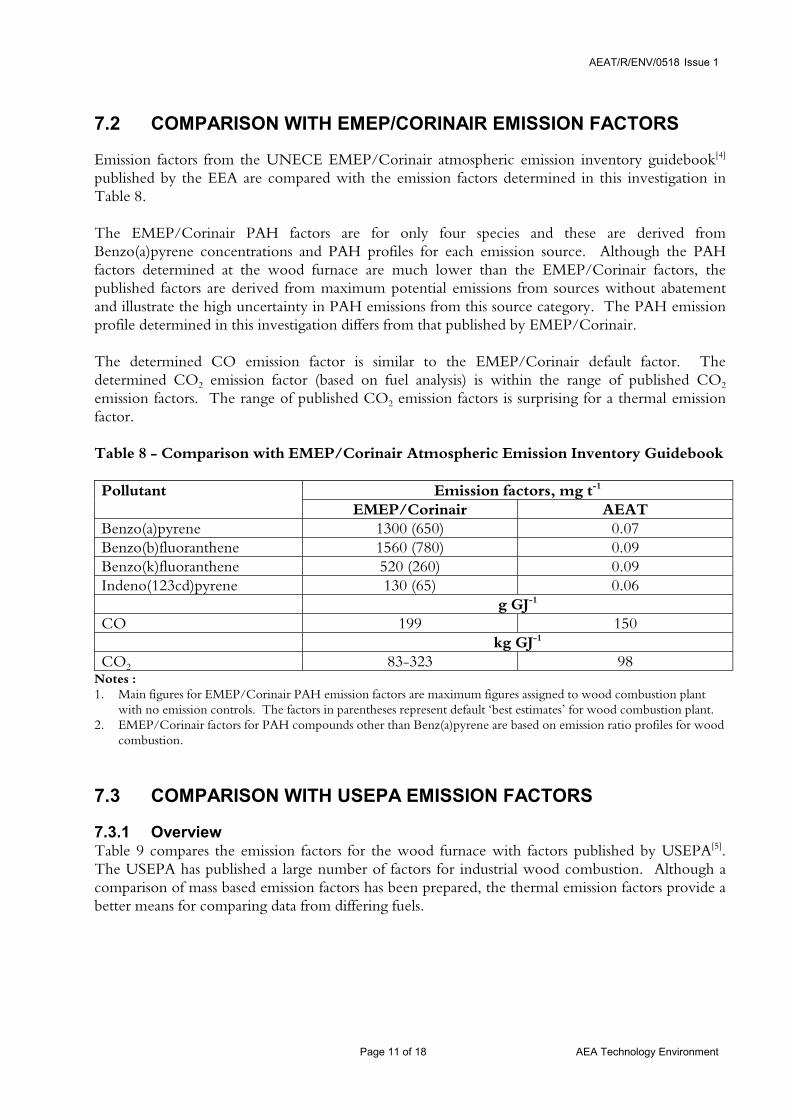
7.2 COMPARISON WITH EMEP/CORINAIR EMISSION FACTORS
Emission factors from the UNECE EMEP/Corinair atmospheric emission inventory guidebook[4]
published by the EEA are compared with the emission factors determined in this investigation inTable 8.
The EMEP/Corinair PAH factors are for only four species and these are derived fromBenzo(a)pyrene concentrations and PAH profiles for each emission source. Although the PAHfactors determined at the wood furnace are much lower than the EMEP/Corinair factors, thepublished factors are derived from maximum potential emissions from sources without abatementand illustrate the high uncertainty in PAH emissions from this source category. The PAH emissionprofile determined in this investigation differs from that published by EMEP/Corinair.
The determined CO emission factor is similar to the EMEP/Corinair default factor. Thedetermined CO2 emission factor (based on fuel analysis) is within the range of published CO2
emission factors. The range of published CO2 emission factors is surprising for a thermal emissionfactor.
Table 8 - Comparison with EMEP/Corinair Atmospheric Emission Inventory Guidebook
Pollutant Emission factors, mg t-1
EMEP/Corinair AEATBenzo(a)pyrene 1300 (650) 0.07Benzo(b)fluoranthene 1560 (780) 0.09Benzo(k)fluoranthene 520 (260) 0.09Indeno(123cd)pyrene 130 (65) 0.06
g GJ-1
CO 199 150kg GJ-1
CO2 83-323 98Notes :1. Main figures for EMEP/Corinair PAH emission factors are maximum figures assigned to wood combustion plant
with no emission controls. The factors in parentheses represent default ‘best estimates’ for wood combustion plant.2. EMEP/Corinair factors for PAH compounds other than Benz(a)pyrene are based on emission ratio profiles for wood
combustion.
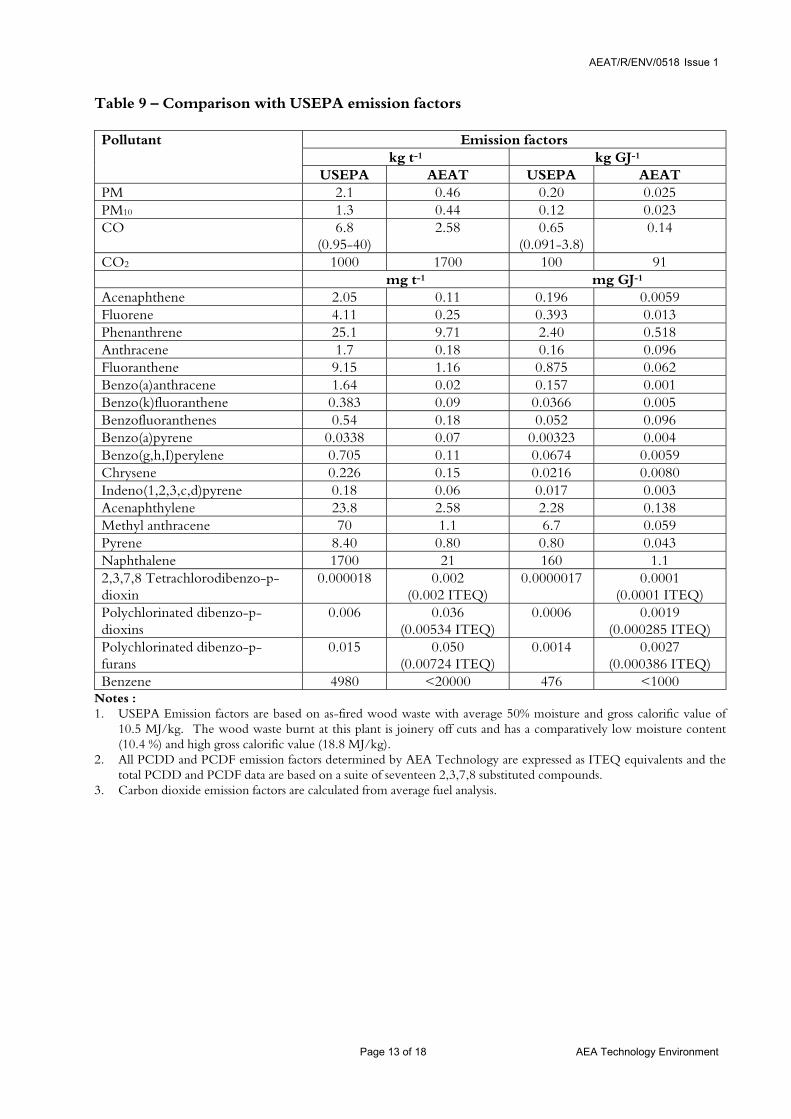
7.3 COMPARISON WITH USEPA EMISSION FACTORS
7.3.1 OverviewTable 9 compares the emission factors for the wood furnace with factors published by USEPA[5].The USEPA has published a large number of factors for industrial wood combustion. Although acomparison of mass based emission factors has been prepared, the thermal emission factors provide abetter means for comparing data from differing fuels.
AEAT/R/ENV/0518 Issue 1
Page 12 of 18 AEA Technology Environment
The USEPA recommends comparing thermal emission factors where the wood burned issubstantially different from the US ‘typical’ wood/wood waste which has about 50% moisturecontent. The wood waste burned at the furnace in this investigation was derived from seasonedwood at furniture factory and had a lower moisture content. It should be noted that the thermalfactors are calculated from the gross (superior) heat input.
7.3.2 Total Particulate and PM10
The TPM and PM10 emission factors are lower than the published USEPA factors.
7.3.3 Carbon monoxide and carbon dioxideThe average CO emission factor determined at the wood furnace is lower than the USEPA factorbut the CO2 emission factors (based on fuel calculation) are similar.
7.3.4 PAH Emission factorsIn general the PAH emission factors were lower than the USEPA emission factors however thedetermined factor for Benzo (a) pyrene and Benzofluoranthenes are higher than the default USEPAemission factor. The emission factors determined in this investigation for Naphthalene are likely tounderestimate emissions of this comparatively volatile PAH.
7.3.5 Dioxins and furansThe USEPA total PCDD and PCDF emission factors may include other compounds outwith thesuite of seventeen dioxins and furans determined in this investigation. However, the emissionfactors determined by AEA Technology are generally higher than the USEPA default emissionfactors. In particular the USEPA emission factor for 2,3,7,8 Tetrachlorodibenzo-p-dioxin (the mostsignificant dioxin congener) is less than 2% of factor determined by AEA Technology.
7.3.6 BenzeneThe measurements for Benzene have a high uncertainty as all concentrations were below theanalytical LOD however, the determined emission factor is consistent with the USEPA factor.
AEAT/R/ENV/0518 Issue 1
Page 13 of 18 AEA Technology Environment
Table 9 – Comparison with USEPA emission factors
Pollutant Emission factorskg t-1 kg GJ-1
USEPA AEAT USEPA AEATPM 2.1 0.46 0.20 0.025PM10 1.3 0.44 0.12 0.023CO 6.8
(0.95-40)2.58 0.65
(0.091-3.8)0.14
CO2 1000 1700 100 91mg t-1 mg GJ-1
Acenaphthene 2.05 0.11 0.196 0.0059Fluorene 4.11 0.25 0.393 0.013Phenanthrene 25.1 9.71 2.40 0.518Anthracene 1.7 0.18 0.16 0.096Fluoranthene 9.15 1.16 0.875 0.062Benzo(a)anthracene 1.64 0.02 0.157 0.001Benzo(k)fluoranthene 0.383 0.09 0.0366 0.005Benzofluoranthenes 0.54 0.18 0.052 0.096Benzo(a)pyrene 0.0338 0.07 0.00323 0.004Benzo(g,h,I)perylene 0.705 0.11 0.0674 0.0059Chrysene 0.226 0.15 0.0216 0.0080Indeno(1,2,3,c,d)pyrene 0.18 0.06 0.017 0.003Acenaphthylene 23.8 2.58 2.28 0.138Methyl anthracene 70 1.1 6.7 0.059Pyrene 8.40 0.80 0.80 0.043Naphthalene 1700 21 160 1.12,3,7,8 Tetrachlorodibenzo-p-dioxin
0.000018 0.002(0.002 ITEQ)
0.0000017 0.0001(0.0001 ITEQ)
Polychlorinated dibenzo-p-dioxins
0.006 0.036(0.00534 ITEQ)
0.0006 0.0019(0.000285 ITEQ)
Polychlorinated dibenzo-p-furans
0.015 0.050(0.00724 ITEQ)
0.0014 0.0027(0.000386 ITEQ)
Benzene 4980 <20000 476 <1000Notes :1. USEPA Emission factors are based on as-fired wood waste with average 50% moisture and gross calorific value of
10.5 MJ/kg. The wood waste burnt at this plant is joinery off cuts and has a comparatively low moisture content(10.4 %) and high gross calorific value (18.8 MJ/kg).
2. All PCDD and PCDF emission factors determined by AEA Technology are expressed as ITEQ equivalents and thetotal PCDD and PCDF data are based on a suite of seventeen 2,3,7,8 substituted compounds.
3. Carbon dioxide emission factors are calculated from average fuel analysis.
AEAT/R/ENV/0518 Issue 1
Page 14 of 18 AEA Technology Environment
8 Uncertainty of Emission Factors
The overall uncertainty of the emission factors have not been determined. Some guidance on thelikely uncertainties is provided in the analytical uncertainties associated with measuredconcentrations (Appendices A to E). However, these uncertainties are limited as they do notinclude a provision for the deviations from the particulate sampling protocol which affects almost allof the species measured. For example, the sampling of particulate material may have an uncertaintyof up to 45%. The calculation of the emission factor introduces additional uncertainty from thesampling and analysis of the fuel.
The determined emission factors are based on a single furnace burning wood waste. Although thefactors are considered to be representative of normal operation of the process tested, extension of thefactors to other UK wood waste combustion processes is likely to increase uncertainty. Nonetheless,the emission factors determined in this investigation help to address the uncertainty associated withemissions from wood combustion in the NAEI.
For all of the dioxin and furan congeners, the analysis results were well above the Limit of Detection(LOD) for the analysis technique employed. The emission concentration results were veryconsistent across the three tests, which would suggest that the process is quite consistent in terms ofdioxin emissions over time. The three tests gave a mean concentration of 1.4 ng(ITEQ).m-3, with arelative standard deviation over the three tests of 18%.
The analysis results indicate that the pattern of PAH emissions is similar across the three tests, withthe predominant species being naphthalene in each case. Other species such as phenanthrene,acenaphthylene, 2-methyl phenanthrene, fluoranthene, pyrene and retene also found at levels wellabove their respective LODs in each test. Around half of the species analysed for were found atlevels that were very close to the LOD. The variability of figures across the three tests is greater thanin the case of dioxins and furans, with a mean emission concentration of total PAHs of 4.5 µg.m-3,with a relative standard deviation over the three tests of 32%.
The PCB analysis indicated that the repeatability of these results was far less than that for the dioxins,furans and PAHs. Consequently these data are likely to have a high uncertainty.
Benzene concentrations were below the LOD of the analysis method and consequently have a veryhigh uncertainty.
The uncertainty of particulate, PM10 and PM2.5 measurements may be as high as 45 %.

AEAT/R/ENV/0518 Issue 1
Page 15 of 18 AEA Technology Environment
9 Findings and Recommendations
9.1 PAH EMISSIONS
This work indicates that the NAEI PAH data and factors published by EMEP/Corinair mayoverestimate emissions from industrial wood combustion by several orders of magnitude. Inaddition, the PAH emission factors determined for this wood furnace indicate that theEMEP/Corinair PAH emission profile may not be applicable to UK industrial wood combustion.
The determined Benzo(a)pyrene and Benzofluoranthenes emission factors are similar to the USEPAdefault factors however most other PAH emission factors are lower than the default USEPA factors.The differences between USEPA and the emission factors determined in this investigation suggestthat USEPA emission factors may not be applicable to UK industry and/or there may be largedifferences in PAH emissions from different wood or wood waste combustion facilities.
It is recommended that the NAEI considers adopting PAH factors from this investigation or fromUSEPA. In general, the PAH emission factors determined at the wood furnace are recommendedfor inclusion in the Inventory. However, the Naphthalene emission factor determined in thisinvestigation is not proposed for inclusion in the NAEI as it is likely to underestimate emissions.
In the absence of other data, the conservative approach may be to adopt the highest factors for eachcompound. The data should be assessed by the NAEI to determine if emissions are significant and iffurther emission measurements are required to improve uncertainty for the source sector.
9.2 DIOXINS AND FURANS EMISSION FACTORS
Emission data for dioxins and furans from wood combustion are higher than in the current NAEI.The determined emission concentrations are comparatively high (compared to emission limits forwaste incineration) and indicate that wood combustion could be a significant source of dioxins andfurans emission.
The USEPA default emission factor for 2,3,7,8 Tetrachlorodibenzo-p-dioxin is about 2% of thefactor determined in this investigation. Similarly, the total dioxin and furan emission factorsdetermined at this process are higher than published USEPA emission factors for industrial woodcombustion. However, the USEPA has not applied toxicity factors to its total dioxins and furansemission factors and consequently comparison may not be meaningful.
In the absence of other data specific to UK processes and to provide a ‘worst case’ emissioninventory it is recommended that the NAEI adopt emission factors from this investigation. Thesignificance of the emission from industrial wood combustion should be assessed by the NAEI andthe need for further investigation determined.

AEAT/R/ENV/0518 Issue 1
Page 16 of 18 AEA Technology Environment
9.3 PCB EMISSION FACTORS
In the absence of other published data for PCB emissions from wood combustion, AEA Technologyrecommends inclusion of the emission factors determined in this investigation into the NAEI. Thecontribution of industrial wood combustion to UK PCB emissions should be assessed by NAEI todetermine if further source monitoring is required.
9.4 CARBON MONOXIDE AND BENZENE
The NAEI emission factor for CO from industrial wood burning processes is higher than theemission factor determined at this plant. The CO emission concentration found at the furnace washigher than the emission limit value for new plant. Consequently the NAEI factor mayoverestimate current emissions and is likely to overestimate future emissions from such plant. If COemissions are significant from this sector, further investigation may be required to improveuncertainty for the sector.
Benzene measurements provided limited information and it is recommended that the USEPAdefault factor is adopted by the NAEI to determine if emissions are significant and if furtherinvestigation is required to improve uncertainty for the source sector.
9.5 PARTICULATE, PM10 AND PM2.5
The NAEI does not currently estimate emissions of these components for wood combustion. ThePM10 and PM2.5 emission factors determined in this investigation should be assessed by the NAEI todetermine if emissions are significant and if further investigation is required to improve uncertaintyfor the source sector.
AEAT/R/ENV/0518 Issue 1
Page 17 of 18 AEA Technology Environment
10 Acknowledgement
AEA Technology acknowledges the assistance of the plant owners and the company's operational,technical and management personnel in undertaking the survey. The work was funded by the Airand Environment Quality Division of the Department of Environment, Transport and the Regions.
AEAT/R/ENV/0518 Issue 1
Page 18 of 18 AEA Technology Environment
11 References
1. Stern A.C. (Ed). Air Pollution - Measuring, monitoring and surveillance of air pollution. NewYork : Academic Press, 3rd Ed, Vol 3.
2. Environmental Protection Act 1990, Part 1. Secretary of State’s Guidance – Combustion of fuelmanufactured from or comprised of solid waste in appliances between 0.4 and 3MW net ratedthermal input. PG1/12 (95), November 1995. HMSO. ISBN 0-11-753196-0.
3. Goodwin J.W.L et al. UK Emissions of air pollutants 1970-1998. National AtmosphericEmissions Inventory. AEAT/R/EN0270, August 2000. AEA Technology.ISBN 0-7058-1794-6
4. EMEP/Corinair Atmospheric emission inventory guidebook. Vol 1. 2nd Edition, September1999. UN ECE, European Environment Agency. ISBN 92-9167-165-7.
5. Compilation of Air Pollutant Emission Factors Vol. 1. Stationary Point & Area Sources.Research Triangle Park, NC: US Environmental Protection Agency, September 1996, ReportAP-42, 5th Ed incl. Supplements A, B, C, D and E.
AEAT/R/ENV/0518 Issue 1
A1 of 8 AEA Technology Environment
Appendix ASummary of test data – 30 October 2000

AEAT/R/ENV/0518 Issue 1
B1 of 9 AEA Technology Environment
Appendix BSummary of test data – 31 October 2000

AEAT/R/ENV/0518 Issue 1
C1 of 5 AEA Technology Environment
Appendix CSummary of test data – 1 November 2000

AEAT/R/ENV/0518 Issue 1
D1 of 11 AEA Technology Environment
Appendix DSummary of test data – 2 November 2000
AEAT/R/ENV/0518 Issue 1
E1 of 10 AEA Technology Environment
Appendix ESummary of test data – 3 November 2000

AEAT/R/ENV/0518 Issue 1
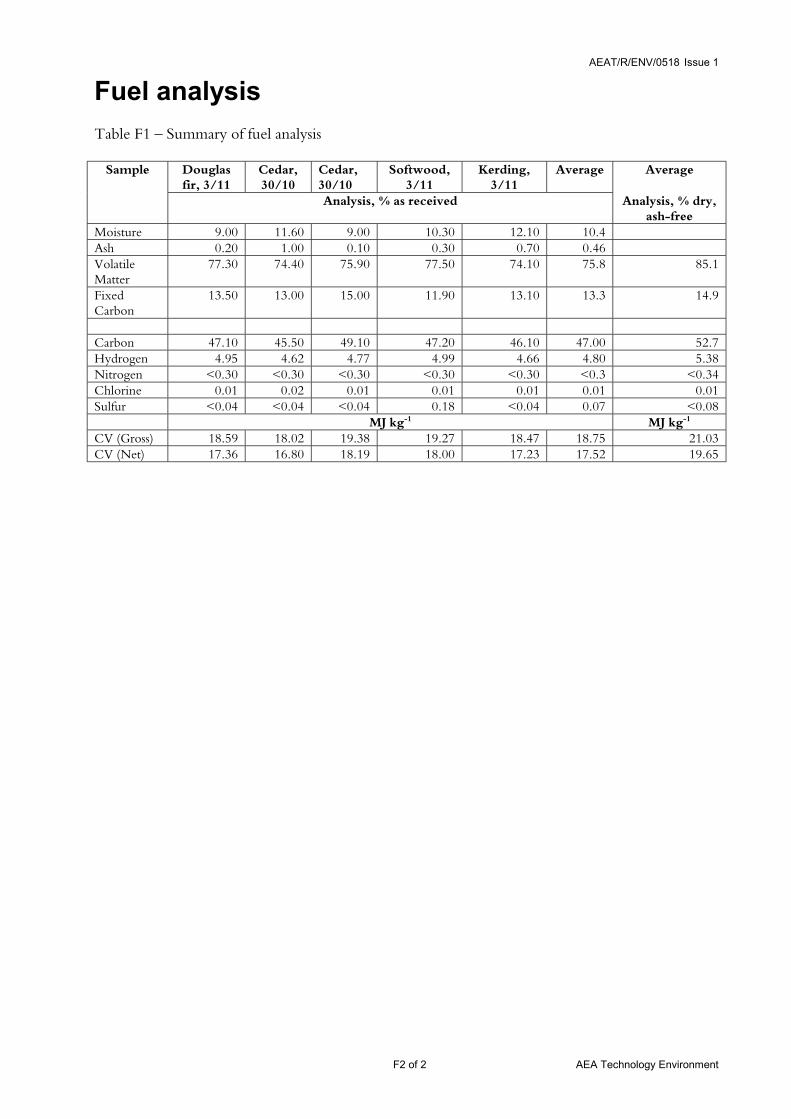
F1 of 2 AEA Technology Environment
Appendix FFuel Analysis
AEAT/R/ENV/0518 Issue 1
F2 of 2 AEA Technology Environment
Fuel analysis
Table F1 – Summary of fuel analysis
Sample Douglasfir, 3/11
Cedar,30/10
Cedar,30/10
Softwood,3/11
Kerding,3/11
Average Average
Analysis, % as received Analysis, % dry,ash-free
Moisture 9.00 11.60 9.00 10.30 12.10 10.4Ash 0.20 1.00 0.10 0.30 0.70 0.46VolatileMatter
77.30 74.40 75.90 77.50 74.10 75.8 85.1
FixedCarbon
13.50 13.00 15.00 11.90 13.10 13.3 14.9
Carbon 47.10 45.50 49.10 47.20 46.10 47.00 52.7Hydrogen 4.95 4.62 4.77 4.99 4.66 4.80 5.38Nitrogen <0.30 <0.30 <0.30 <0.30 <0.30 <0.3 <0.34Chlorine 0.01 0.02 0.01 0.01 0.01 0.01 0.01Sulfur <0.04 <0.04 <0.04 0.18 <0.04 0.07 <0.08
MJ kg-1 MJ kg-1
CV (Gross) 18.59 18.02 19.38 19.27 18.47 18.75 21.03CV (Net) 17.36 16.80 18.19 18.00 17.23 17.52 19.65