
Acoustic Emission within an Atmospheric Helium … Emission within an Atmospheric Helium ... drive...
8
1 Acoustic Emission within an Atmospheric Helium Discharge Jet V J Law 1 , C E Nwankire 2 , D P Dowling 2 and S Daniels 1 1 Dublin City University, National Center of Plasma Science and Technology, Collins Avenue, Glasnevin, Dublin 9, Dublin, Ireland (e-mail: [email protected] ) 2 School of Electrical, Electronic and Mechanical Engineering, University College Dublin, Belfield, Dublin 4, Ireland Abstract: This paper describes the thermal gas effluent and ion acoustic pressure wave interaction between the fundamental drive frequency and its harmonics within an atmospheric helium discharge. Deconvolution of the acoustic signal and the electrical signals reveal that the plasma jet undergoes a change in operational mode from chaotic (where the plasma is spatially and temporally inhomogeneous at the electrode surface) to stable (periodic in nature) when the plasma expands away from the electrodes and into the reactor cylinder. This effect is strongly influence by the helium flow and input power. In addition the generated acoustic signals is found to have a frequency response to that of a closed-end cylinder column which supports antinodes of n = 1 and 3. Decoding of the acoustic signal allows the helium thermal gas temperature to be obtained: T gas ~ 290 K. The signal allows the axial gap distance between the jet nozzle and work surface to be estimated which has technology importance in terms of plasma metrology and in the basic understanding of atmospheric pressure plasma jet physics. Keywords: Corona discharge, phase-space diagrams, and acoustic emission 1. Introduction Atmospheric pressure plasmas are used in many engineering [1, 2], biological applications [3], and medicine [4]. In recent years multivariate analyses tools have been deployed to explore their plasma-surface interactions [5]. Acoustic metrology is one such promising plasma metrology tool that has been deployed on plasma welding processes [6] and reel-to- reel plasma process systems [7]. This paper is focused on the examination of a low temperature atmospheric pressure Corona discharge jet system called PlasmaStream™, which was developed by Dow Corning Plasma Solutions. Amongst the applications of this PlasmaStream™ source are: enhancing silicone adhesion to steel [8, 9], control of cell adhesion [10] antimicrobial applications [11] and the deposition of plasma polymerised coatings [12, 13, 14]. For this plasma device the initial gas breakdown produces a corona discharge which is spatially and temporally inhomogeneous, and then proceeds to stable and homogenous volume discharge at high flow rates and powers. Understanding this mode change in terms of electro-acoustic emission and gas flow dynamics shall help in the control of low temperature treatment of heat sensitive biological materials. The electro-acoustic being generated from the abundance of fast flow thermal molecules and rarer abundance of activated species (metastable and ions) that are rapidly quenched in the plume and at the surface. This paper reports on a systematic study of the non-invasive acoustic emission measurement of the PlasmaStream™ system as function of plasma nozzle to work-surface gap distance and helium gas flow. The analysis of which enables the physical geometry around the plasma-surface interaction to be understood in terms of gas flow dynamics, and surface response outcomes to discharge plume exposure. This paper is organised into the following sections. Section 2 provides the measurement methodology. Section 3 details the electrical measurements, and section 4 provides the acoustic measurements and deconvolution. Finally, section 5 forms the discussion of the data. CHAOTIC MODELING & SIMULATION - Papers from CHAOS 2010 International Conference http://www.cmsim.net/sitebuildercontent/sitebuilderfiles/conf_papers.html
Transcript of Acoustic Emission within an Atmospheric Helium … Emission within an Atmospheric Helium ... drive...

1
Acoustic Emission within an Atmospheric Helium Discharge Jet
V J Law1, C E Nwankire2, D P Dowling2 and S Daniels1
1Dublin City University, National Center of Plasma Science and Technology, Collins Avenue, Glasnevin, Dublin 9, Dublin, Ireland(e-mail: [email protected] )2School of Electrical, Electronic and Mechanical Engineering, University College Dublin, Belfield, Dublin 4, Ireland
Abstract: This paper describes the thermal gas effluent and ion acoustic pressure wave interaction between the fundamental drive frequency and its harmonics within an atmospheric helium discharge. Deconvolution of the acoustic signal and the electrical signals reveal that the plasma jet undergoes a change in operational mode from chaotic (where the plasma is spatially and temporally inhomogeneous at the electrode surface) to stable (periodic in nature) when the plasma expands away from the electrodes and into the reactor cylinder. This effect is strongly influence by the helium flow and input power. In addition the generated acoustic signals is found to have a frequency response to that of a closed-end cylinder column which supports antinodes of n = 1 and 3. Decoding of the acoustic signal allows the helium thermal gas temperature to be obtained: Tgas ~ 290 K. The signal allows the axial gap distance between the jet nozzle and work surface to be estimated which has technology importance in terms of plasma metrology and in the basic understanding of atmospheric pressure plasma jet physics.
Keywords: Corona discharge, phase-space diagrams, and acoustic emission
1. IntroductionAtmospheric pressure plasmas are used in many engineering [1, 2], biological applications[3], and medicine [4]. In recent years multivariate analyses tools have been deployed to explore their plasma-surface interactions [5]. Acoustic metrology is one such promising plasma metrology tool that has been deployed on plasma welding processes [6] and reel-to-reel plasma process systems [7]. This paper is focused on the examination of a low temperature atmospheric pressure Corona discharge jet system called PlasmaStream™, which was developed by Dow Corning Plasma Solutions. Amongst the applications of this PlasmaStream™ source are: enhancing silicone adhesion to steel [8, 9], control of cell adhesion [10] antimicrobial applications [11] and the deposition of plasma polymerised coatings [12, 13, 14]. For this plasma device the initial gas breakdown produces a corona discharge which is spatially and temporally inhomogeneous, and then proceeds to stable and homogenous volume discharge at high flow rates and powers. Understanding this modechange in terms of electro-acoustic emission and gas flow dynamics shall help in the control of low temperature treatment of heat sensitive biological materials. The electro-acoustic being generated from the abundance of fast flow thermal molecules and rarer abundance of activated species (metastable and ions) that are rapidly quenched in the plume and at the surface. This paper reports on a systematic study of the non-invasive acoustic emissionmeasurement of the PlasmaStream™ system as function of plasma nozzle to work-surface gap distance and helium gas flow. The analysis of which enables the physical geometry around the plasma-surface interaction to be understood in terms of gas flow dynamics, and surface response outcomes to discharge plume exposure. This paper is organised into the following sections. Section 2 provides the measurement methodology. Section 3 details the electrical measurements, and section 4 provides the acoustic measurements and deconvolution. Finally, section 5 forms the discussion of the data. CHAOTIC MODELING & SIMULATION - Papers from CHAOS 2010 International Conferencehttp://www.cmsim.net/sitebuildercontent/sitebuilderfiles/conf_papers.html
2
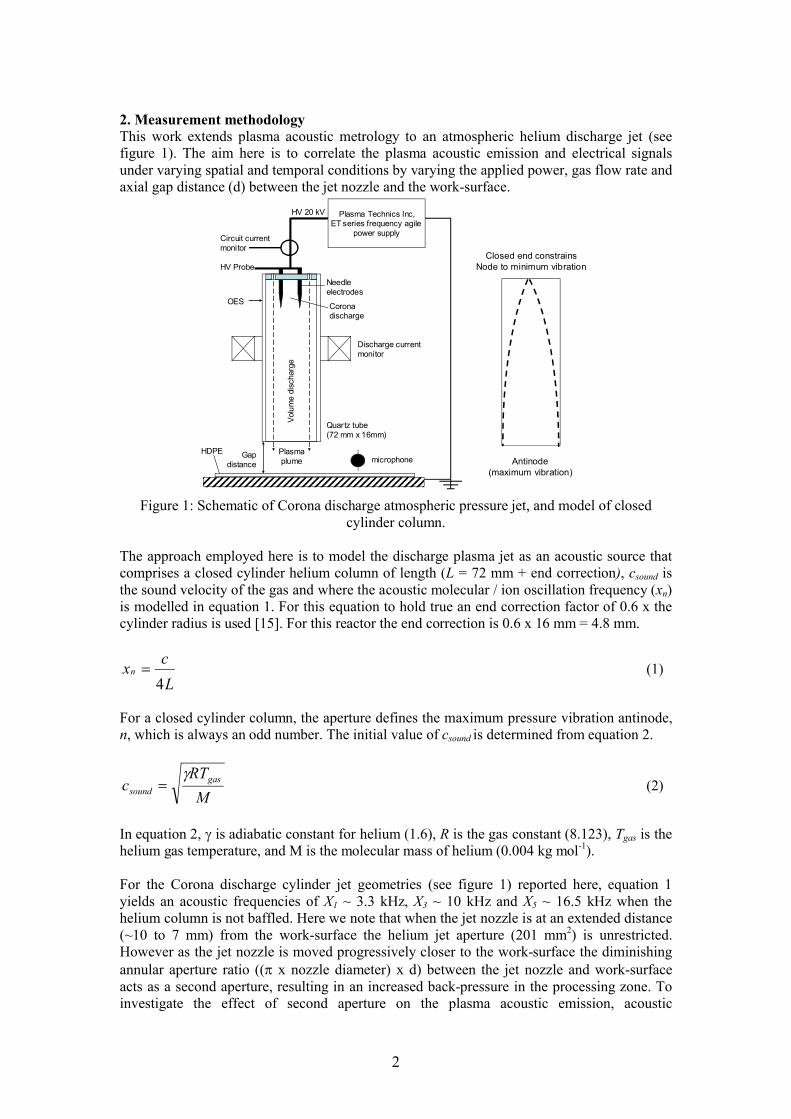
2. Measurement methodologyThis work extends plasma acoustic metrology to an atmospheric helium discharge jet (see figure 1). The aim here is to correlate the plasma acoustic emission and electrical signals under varying spatial and temporal conditions by varying the applied power, gas flow rate and axial gap distance (d) between the jet nozzle and the work-surface.
Plasma Technics Inc,ET series frequency agile
power supply
Quartz tube(72 mm x 16mm)
Gap distance
Circuit currentmonitor
HV Probe
Needleelectrodes
Coronadischarge
Discharge currentmonitor
OES
Plasmaplume
HDPE
HV 20 kV
Vol
um
e di
scha
rge
microphone Antinode(maximum vibration)
Closed end constrainsNode to minimum vibration
Figure 1: Schematic of Corona discharge atmospheric pressure jet, and model of closed cylinder column.
The approach employed here is to model the discharge plasma jet as an acoustic source that comprises a closed cylinder helium column of length (L = 72 mm + end correction), csound is the sound velocity of the gas and where the acoustic molecular / ion oscillation frequency (xn) is modelled in equation 1. For this equation to hold true an end correction factor of 0.6 x the cylinder radius is used [15]. For this reactor the end correction is 0.6 x 16 mm = 4.8 mm.
L
cxn
4 (1)
For a closed cylinder column, the aperture defines the maximum pressure vibration antinode, n, which is always an odd number. The initial value of csound is determined from equation 2.
M
RTc gas
sound
(2)
In equation 2, is adiabatic constant for helium (1.6), R is the gas constant (8.123), Tgas is the helium gas temperature, and M is the molecular mass of helium (0.004 kg mol-1).
For the Corona discharge cylinder jet geometries (see figure 1) reported here, equation 1 yields an acoustic frequencies of X1 ~ 3.3 kHz, X3 ~ 10 kHz and X5 ~ 16.5 kHz when the helium column is not baffled. Here we note that when the jet nozzle is at an extended distance (~10 to 7 mm) from the work-surface the helium jet aperture (201 mm2) is unrestricted. However as the jet nozzle is moved progressively closer to the work-surface the diminishingannular aperture ratio (( x nozzle diameter) x d) between the jet nozzle and work-surface acts as a second aperture, resulting in an increased back-pressure in the processing zone. To investigate the effect of second aperture on the plasma acoustic emission, acoustic
3
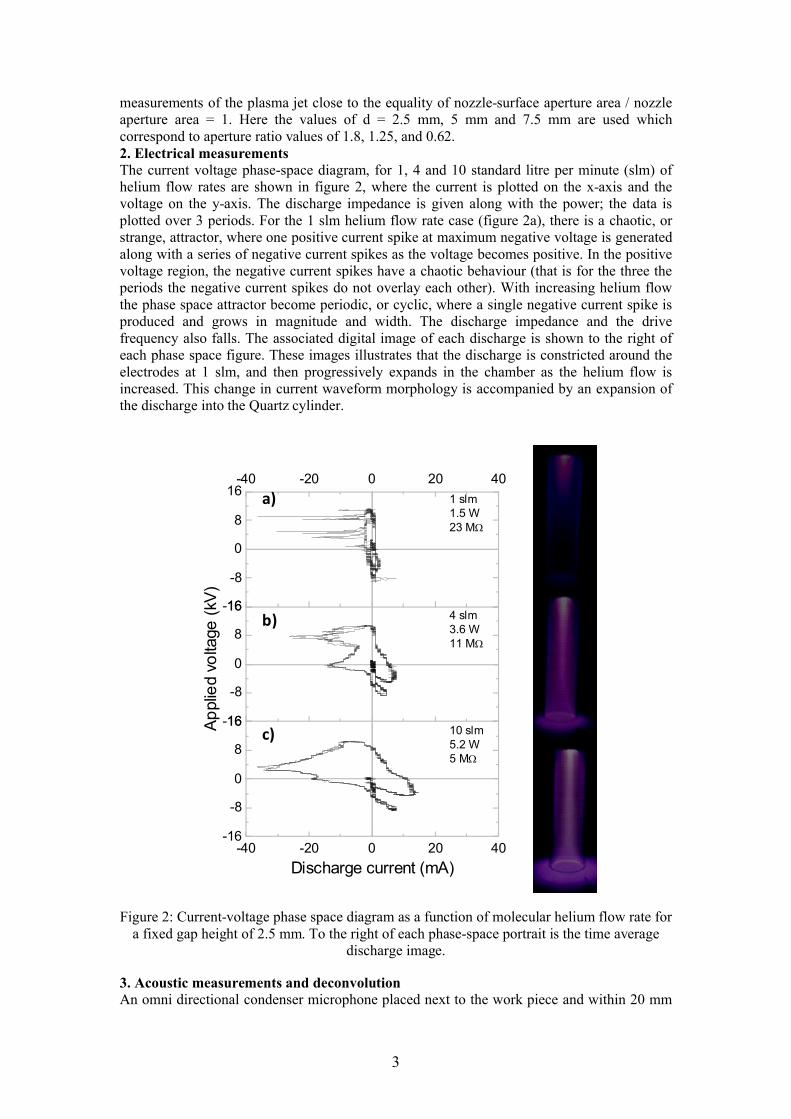
measurements of the plasma jet close to the equality of nozzle-surface aperture area / nozzle aperture area = 1. Here the values of d = 2.5 mm, 5 mm and 7.5 mm are used which correspond to aperture ratio values of 1.8, 1.25, and 0.62.2. Electrical measurementsThe current voltage phase-space diagram, for 1, 4 and 10 standard litre per minute (slm) of helium flow rates are shown in figure 2, where the current is plotted on the x-axis and the voltage on the y-axis. The discharge impedance is given along with the power; the data is plotted over 3 periods. For the 1 slm helium flow rate case (figure 2a), there is a chaotic, or strange, attractor, where one positive current spike at maximum negative voltage is generated along with a series of negative current spikes as the voltage becomes positive. In the positive voltage region, the negative current spikes have a chaotic behaviour (that is for the three the periods the negative current spikes do not overlay each other). With increasing helium flow the phase space attractor become periodic, or cyclic, where a single negative current spike is produced and grows in magnitude and width. The discharge impedance and the drive frequency also falls. The associated digital image of each discharge is shown to the right of each phase space figure. These images illustrates that the discharge is constricted around the electrodes at 1 slm, and then progressively expands in the chamber as the helium flow is increased. This change in current waveform morphology is accompanied by an expansion of the discharge into the Quartz cylinder.
-16
-8
0
8
16-40 -20 0 20 40
-16
-8
0
8
16
-40 -20 0 20 40-16
-8
0
8
16
1 slm1.5 W23 M
4 slm3.6 W11 M
Ap
plie
d vo
ltage
(kV
)
10 slm5.2 W5 M
Discharge current (mA)
a)
b)
c)
Figure 2: Current-voltage phase space diagram as a function of molecular helium flow rate for a fixed gap height of 2.5 mm. To the right of each phase-space portrait is the time average
discharge image.
3. Acoustic measurements and deconvolutionAn omni directional condenser microphone placed next to the work piece and within 20 mm
4
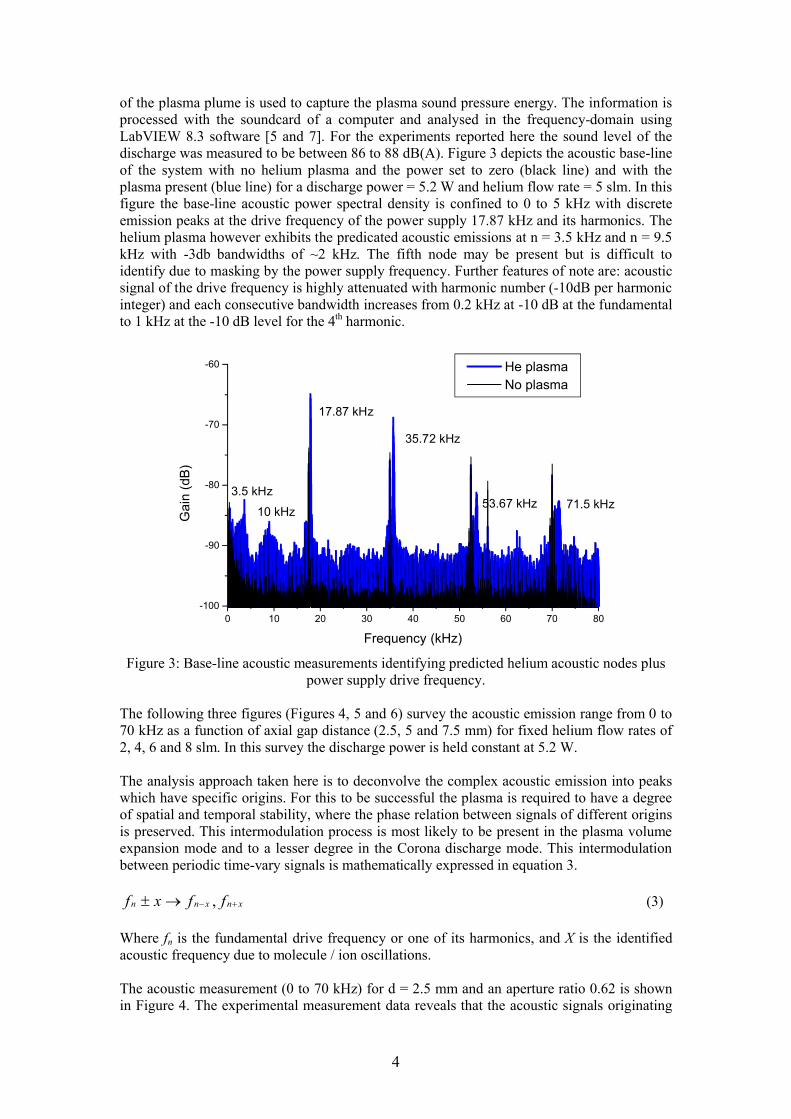
of the plasma plume is used to capture the plasma sound pressure energy. The information isprocessed with the soundcard of a computer and analysed in the frequency-domain using LabVIEW 8.3 software [5 and 7]. For the experiments reported here the sound level of the discharge was measured to be between 86 to 88 dB(A). Figure 3 depicts the acoustic base-line of the system with no helium plasma and the power set to zero (black line) and with the plasma present (blue line) for a discharge power = 5.2 W and helium flow rate = 5 slm. In this figure the base-line acoustic power spectral density is confined to 0 to 5 kHz with discreteemission peaks at the drive frequency of the power supply 17.87 kHz and its harmonics. The helium plasma however exhibits the predicated acoustic emissions at n = 3.5 kHz and n = 9.5 kHz with -3db bandwidths of ~2 kHz. The fifth node may be present but is difficult to identify due to masking by the power supply frequency. Further features of note are: acoustic signal of the drive frequency is highly attenuated with harmonic number (-10dB per harmonic integer) and each consecutive bandwidth increases from 0.2 kHz at -10 dB at the fundamental to 1 kHz at the -10 dB level for the 4th harmonic.
0 10 20 30 40 50 60 70 80-100
-90
-80
-70
-60
10 kHz
3.5 kHz71.5 kHz53.67 kHz
35.72 kHz
17.87 kHz
He plasma No plasma
Gai
n (d
B)
Frequency (kHz)
Figure 3: Base-line acoustic measurements identifying predicted helium acoustic nodes plus power supply drive frequency.
The following three figures (Figures 4, 5 and 6) survey the acoustic emission range from 0 to 70 kHz as a function of axial gap distance (2.5, 5 and 7.5 mm) for fixed helium flow rates of 2, 4, 6 and 8 slm. In this survey the discharge power is held constant at 5.2 W.
The analysis approach taken here is to deconvolve the complex acoustic emission into peaks which have specific origins. For this to be successful the plasma is required to have a degree of spatial and temporal stability, where the phase relation between signals of different origins is preserved. This intermodulation process is most likely to be present in the plasma volume expansion mode and to a lesser degree in the Corona discharge mode. This intermodulation between periodic time-vary signals is mathematically expressed in equation 3.
xnxnn ffxf , (3)
Where fn is the fundamental drive frequency or one of its harmonics, and X is the identified acoustic frequency due to molecule / ion oscillations.
The acoustic measurement (0 to 70 kHz) for d = 2.5 mm and an aperture ratio 0.62 is shown in Figure 4. The experimental measurement data reveals that the acoustic signals originating

5
from the molecules / ion oscillations (3.5 and 10 kHz) increase in amplitude to +10 dB above the noise floor as the helium gas flow is increased from 2 to 8 slm. There is also a degree of intermodulation with the drive frequency and its harmonics. For example in the of the 8 slm case the flowing relationships are observed:
X1 (3.5 kHz) mixes with f1 (18 kHz) to produce sidebands at 15 kHz and 21 kHz
X2 (9.5 kHz) mixes with f1 (18 kHz) to produce sidebands at 8.5 kHz and 27.5 kHz
The result of both of these intermodulation processes generates the appearance of a double peak in the 8 to 10 kHz frequency region. Further to this, the process also occurs on each of the drive frequency harmonics, but this more difficult to observe due to the noise floor of the measurement.
0 4 8 12 16 20 24 28 32 36 40 44 48 52 56 60 64 68-100
-80
-60
2 slm
Frequency (kHz)
4 slm
-100
-80
-60
Ga
in (
dB
) 6 slm
8 slm
Figure 4: 2.5 mm gap distance at a discharge power of 5.2 W
Figure 5 shows the results for d = 5 mm and aperture ratio of 1.25. The first feature here to note is that drive frequency has been pulled to 17.6 kHz, indicting an increase in plasma capacitance to the work-surface [16]. Intermodulation process is also occurring. However the intermodulation of f1 -Xn=3 product now overlays the original Xn=3.acoustic signal. This superposition generates strong sidebands around fo and f1 and f2 at low helium flow rates.
Figure 6 provides further measurements for d = 7.5 mm, and aperture ratio of 1.8 at a discharge power of 5.2 W. Under these conditions the acoustic emission is found to be greater with respect to the small gap distance of 5 and 2.5 mm. The acoustic emissions are obtained some 15 dB above the noise floor at high helium flow rate (8 slm). Intermodulation between the molecular / ion acoustic signals and the drive and its harmonics are observed to be present at middle helium flow rates (6 and 4 slm). At low helium flow rates only X1 interacts with the fundamental drive frequency.

6
0 4 8 12 16 20 24 28 32 36 40 44 48 52 56 60 64 68-100
-80
-60
Frequency (kHz)
2 slm
4 slm
-100
-80
-60
6 slm
Ga
in (
dB)
8 slm
Figure 5: 5 mm gap distance at a discharge power of 5.2 W.
0 4 8 12 16 20 24 28 32 36 40 44 48 52 56 60 64 68-100
-80
-60
Frequency (kHz)
2 slm
4 slm
-100
-80
-60
6 slm
Ga
in (
dB
)
8 slm
Figure 6: 7.5mm gap distance at 5.2 W discharge power.
4. DiscussionThis work has examined the electro-acoustic emission from a low temperature discharge jet. In this configuration the jet exhibits a clarinet-like acoustic, or closed-end cylinder behaviour.The jet is found to have two operational modes: The electrical voltage-current phase-space diagrams map these two modes. The first mode is a Corona / Filamentary discharge [17] that has chaotic behaviour at low helium flow rates of 1-2 slm. Above this level of helium flow the voltage-current phase-space attractor becomes periodic (cyclic) with one major plasma ignition per cycle. Under these conditions, the discharge fills the cylinder with a visible plume issuing from the nozzle to the work-surface.

7
It is also found that there is a correlation of these modes with the electro-acoustic emission. When the discharge is in the Corona / Filamentary mode [17], the acoustic fundamental is present and the acoustic 3rd harmonic (overtone) is weakly supported. When the discharge fills the cylinder generating only one current event per cycle both the acoustic fundamental and it 3rd harmonic (overtone) under go an intermodulation with the power supply drive frequency.
The strongest acoustic measurement of the sound velocity is found at Xn=3 frequency (~10 kHz) at high flow rates when the plasma jet is at extended distance from the work-surfacewith an aperture ratio of 1.8. Under these conditions, the influence of the work-surface can be considered to be minimal.
As the axial gap distance is decreased to d = 5 mm and aperture ratio of 1.25, the first acoustic node (Xn=1 = 3.5 kHz) signal increase in strength and interacts with the drive frequency. Under these conditions, the second aperture can be considered to be influencing the gas flow properties within the plume-surface interaction zone.
Finally as the axial gap distance is reduced further (d = 2.5 mm) where the aperture ratio is 0.62, the Xn=3 frequency signal increase with helium gas flow.
Based on the electro-acoustic measurements made, it can be concluded that the reactor geometries provide a unique electro-acoustic emission signature. Within the acoustic signature an intermodulation process is identified with the power source drive frequency and its harmonics. A simple acoustic model (equations: 1 and 2) based on chamber geometry is used to describe the thermal molecular acoustic emission. The model predicts a series of odd number acoustic nodes (n = 1, 3, 5 ...). The value of n = 1 and 3 are confirmed by experimental measurements. The thermal gas temperature of the discharge effluent is found by using equation (2). Consider first the acoustic emission model (equation 2) for this reactor where L = 0.0768 m (72 mm + end correction of 4.8 mm) and a resonant fundamental frequency value of 3.2 kHz. From these values a gas velocity of 983 m s-1 is obtained which equates to a gas temperature of ~290 K (~170C). This value agrees well with the thermal gas temperature (18oC) reported in reference [14] using an alcohol thermometer. As the even 2nd
harmonic (overtone) is not present (as predicted by the closed-end cylinder model (equation 1) the 3rd harmonic (overtone) may be used and does produce a similar gas velocity and helium gas temperature.
For the intermodulation process, electromagnetic interaction between activated low temperature (400 ±50 K) nitrogen ions and radicals [17] and drive frequency could be a possible mechanism. This relationship is mathematically in equation (3) as a RF mixing mechanism. Undoubtedly the intermodulation model must be more complex as the two electromagnetic sources have different origins: the electrodes for the drive frequency signal and the nozzle aperture for the acoustic. The coherence of these two signals will therefore be function of axial distance and position of the microphone. Nevertheless the electro-acoustic emission measurement proves a means of process monitoring by linking the acoustic signature to gas temperature and gap distance and mode of operation.
The above experimental observations lead to a number of non-invasive acoustic plasma metrology innovations to reference [7] and patent [18] in atmospheric pressure plasma processing.
5. AcknowledgementsThis work is partly supported by Enterprise Ireland grant CDT/7/IT/304 and the Science foundation Ireland under grant 08/SRC/1141.
8
6. References[1] K. Baba, T. Okada, T. Kaneko, R. Hatakeyama, H. Yoshiki. Investigation of gas–liquid
interface in atmospheric-pressure micro plasma with solution. Thin Solid Films 5154308, 2007.
[2] B. Twomey, D. P. Dowling, G. Byrne, L. O'Neill and L O'Hare. Properties of siloxane coatings deposited in a reel-to-reel atmospheric pressure plasma system. Plasma Process and Polymers. 4, 450-454, 2007.
[3] G. Fridman, A. D. Brooks, M. Balasubramanian, A. Fridman, A. Gutsol, V. N.Vasilets, H. Ayan, G. Friedman. Comparison of direct and indirect effects of non-thermal atmospheric-pressure plasma on bacteria. Plasma Process. Polym. 4, 370, 2007.
[4] M. G. Kong, G. Kroesen, G. Morfill, T. Nosenko, T. Shimizu, J. van Dijk and J L Zimmermann. Plasma medicine: an introductory review. New Journal of Physics 11, 11501 2009.
[5] V. J. Law, N. O’Connor, B. Twomey, D. P. Dowling and S. Daniels. Visualization of atmospheric pressure plasma electrical parameters. Topics of Chaotic Systems: Selected Papers of Chaos 2008 International Conference. 204-213, Ed. C H Skiadas, I Dimotikalis & C Skiadas. (World Scientific Publishing 2009). ISBN 978-981-4271-33-2
[6] Z. Szymanski, J. Hoffman and J. Kurzyna. Plasma plume oscillations during welding of thin metal sheets with a Co2 laser. J Phys. D: Appl, Phys. 34 189-199, 2001.
[7] J. Tynan, V. J. Law, P Ward, A. M. Hynes J Cullen, G. Byrne, D. P. Dowling and S.Daniels. Comparison of pilot and industrial scale atmospheric pressure glow discharge systems including a novel electro-acoustic technique for process monitoring, PSST, 19, 015015, 2010.
[8] C. E. Nwankire, M. Ardhaoui, and D. P. Dowling. The effect of plasma-polymerisedsilicon hydride-rich polyhydrogenmethylsiloxane on the adhesion of silicone elastomers Polym. Int. 58 996-1001, 2009.
[9] L. O'Neill, N, Shephard, S. R. Leadley, and L. A. O'Hare. Atmospheric pressure plasma polymerised primer to promote adhesion of silicones. J. Adhesion 84 562-77, 2008.
[10] M. Ardhaoui, M. Nassiri, C. Brugha, A K Keenan, M. Al-Rubeai, and D. P. Dowling.Evaluation of cell behaviour on atmospheric plasma deposited siloxane and fluorosiloxane coatings. Submitted to J. Adhesion Science and Technology. 2009.
[11] L. A. O'Hare, L. O'Neill, and A. J. Goodwin. Anti-microbial coatings by agent entrapment in coatings deposited via atmospheric pressure plasma liquid deposition J. Surf. Interface Anal. 38, 2006.
[12] L. O'Neill, and C. O'Sullivan. Polymeric coatings deposited from an aerosol-assisted non-thermal plasma jet. Chemical Vapor Deposition. 15 21-6, 2009.
[13] C. E. Nwankire and D. P. Dowling. Influence of nm thick atmospheric plasma pressure deposited coatings on silicon elastomer to stainless steel. Submitted to J. Adhesion Sci, Technol, 2009.
[14] P. A. F. Herbert, L. O’Neill and J Jarosynska-Wolinska. Soft plasma polymerization of gas state precursors from an atmospheric pressure corona plasma discharge. Chem, Mater, 21, 4401-4407, 2009.
[15] H. Levine and J. Schwinger. On the radiation of sound from an unflanged circular pipe. Physical Review. 73(4) 383-406, 1948.
[16] V. J. Law. Process induced oscillator frequency pulling and phase noise within plasma systems. Vacuum 82(6) 630-638, 2008.
[17] C. E. Nwankire, V. J. Law, A Nindrayog, B. Twomey, K. Niemi, W. G. Graham, D. P. Dowling. Electrical, Thermal and optical diagnostics of the plasmastream atmospheric plasma jet system. Accepted for Plasma Chemistry, Polymer Processing, May 2010.
[18] Patent: GB 2459858 A (published: 11 November 2009), and Patent: WO 209/135919 A1 (published: 12 November 2009).