
Determinants of Corporate Cash Holdings...
101
Determinants of Corporate Cash Holdings and its Implications: Evidence from Pakistan’s Corporate Sector By Muhammad Faisal Rizwan A research thesis submitted to the Department of Management & Social Sciences, Mohammad Ali Jinnah University, Islamabad in partial fulfillment of the requirements for the degree of DOCTOR OF PHILOSOPHY IN MANAGEMENT SCIENCES (FINANCE) DEPARTMENT OF MANAGEMENT & SOCIAL SCIENCES MOHAMMAD ALI JINNAH UNIVERSITY ISLAMABAD AUGUST 2015
Transcript of Determinants of Corporate Cash Holdings...
Determinants of Corporate Cash Holdings and
its Implications: Evidence from Pakistan’s
Corporate Sector
By
Muhammad Faisal Rizwan
A research thesis submitted to the Department of Management & Social Sciences,
Mohammad Ali Jinnah University, Islamabad
in partial fulfillment of the requirements for the degree of
DOCTOR OF PHILOSOPHY IN MANAGEMENT SCIENCES
(FINANCE)
DEPARTMENT OF MANAGEMENT & SOCIAL SCIENCES
MOHAMMAD ALI JINNAH UNIVERSITY
ISLAMABAD
AUGUST 2015
i
Determinants of Corporate Cash Holdings and
its Implications: Evidence from Pakistan’s
Corporate Sector
By
Mohammad Faisal Rizwan
A research thesis submitted to the Department of Management & Social Sciences,
Mohammad Ali Jinnah University, Islamabad
in partial fulfillment of the requirements for the degree of
DOCTOR OF PHILOSOPHY IN MANAGEMENT SCIENCES
(FINANCE)
DEPARTMENT OF MANAGEMENT & SOCIAL SCIENCES
MOHAMMAD ALI JINNAH UNIVERSITY
ISLAMABAD
AUGUST 2015
ii
Determinants of Corporate Cash Holdings and
its Implications: Evidence from Pakistan’s
Corporate Sector
By Muhammad Faisal Rizwan
(PM091017)
Dr. Ishaq Bhatti
La Trobe Business School
Melbourne, Vic 3109, Australia
Dr. Shammyla Naeem
Adam Smith Business School
University of Glasgow, Glasgow, UK
__________________________
Dr. Abdur Rehman
(Thesis Supervisor)
__________________________
Dr. Sajid Bashir
(Head, Department of Management & Social Sciences)
__________________________
Dr. Arshad Hassan
(Dean, Faculty of Management & Social Sciences)
DEPARTMENT OF MANAGEMENT & SOCIAL SCIENCES
MOHAMMAD ALI JINNAH UNIVERSITY
ISLAMABAD
AUGUST 2015

iii
Copyright© 2015 by Mr. M. Faisal Rizwan
All rights are reserved. No part of the material protected by this copy right notice may be
reproduced or utilized in any form or any means, electronic or mechanical, including
photocopying, recording or by any information storage and retrieval system, without the
permission from the author.

iv
Replace with result sheet
v
Certificate
This is to certify that Mr. Muhammad Faisal Rizwan has incorporated all observations,
suggestions and comments made by the external evaluators as well as the internal examiners and
thesis supervisor. The title of his Thesis is: Determinants of Corporate Cash Holdings and its
Implications: Evidence from Pakistan’s Corporate Sector.
Forwarded for necessary action
Dr. Abdur Rehman
(Thesis Supervisor)

vi
ACKNOWLEDGEMENTS
This dissertation would not have been possible without the support of many individuals. I would
like, firstof all, to thank my PhD supervisor, Dr.Abdul Rehman, for his generous support and
guidance throughout my doctoral years. I would like to extend my thanks to other committee
members—Dr. Hassan Raza, Prof. Dr. Attiya, Dr. Ramzan and Dr. Arshad. Iwill remain forever
indebted to the superb group of faculty members and staff at Mohammad Ali JinnahUniversity,
for being supportive of my PhD studies. I wish to express my deepest gratitude and respect.
Many fellow students at the doctoral program deserve many thanks for their valuable friendship
and special thanks to Dr. Safiullah Khan. They have been a constant source of support and
inspiration.
I will never be able to thank my family enough. I especially thank my parents, brothers and
sisters, my wife and my only son for their love, support, and understanding and the patience that
they have shown throughout the long process.
Last, but not the least, I am very thankful to the Higher Education Commission, Government of
Pakistan, for the generous and timely financial support during my PhD studies, and has
contributed enormously to fulfilling my dream of attaining the highest educational qualification.
vii
Determinants of Corporate Cash Holdings and its
Implications: Evidence from Pakistan’s Corporate Sector
Abstract
This study examines the determinants of corporate cash holdings and their implications for non-financial
firms by pursuing three main objectives. The first objective examines firm-specific factors that determine
the optimal level of corporate cash holdings. Empirical results are consistent with some of the theories
such as information asymmetry theory, financial distress hypothesis and the transaction costs hypothesis
that suggests that the higher fixed processing fee for obtaining external financing discourages smaller
firms to go for external financing and hence prompting them to hold more liquid assets. Nevertheless,
these results support the argument of Opler et al. (1995) that larger firms have more capacity to
accumulate cash since they are presumably more profitable. The results also suggest that Pakistani
companies are sensitive to the volatility of cash flow and that firm’s cash holdings are highly influenced
by a precautionary need. Empirical evidence also lends credence to the argument that credit market
frictions are responsible for high correlation between cash holdings and cash flow of the firm. Results
also indicate that there are no differences in the patterns of cash holdings between the group-affiliated and
the non-group businesses.
Second objective of the study examines the effect of corporate governance on cash holdings. Results are
line with the finance literature which suggests a role for effective corporate governance in disciplining
managers and weak governance may lead to a tendency of the managers to hold excess cash holdings.
Empirical results are also in line with the interest alignment hypothesis. Finally, third objective of our
study examine cash holding behavior under macroeconomic uncertainty. Empirical results provide
support to the hypothesis that uncertainty in macro-economic variables leads firms to similar cash holding
behavior since uncertainty in the macroeconomic environment can affect the manager’s ability to predict
their future cash flows.
viii
Table of Contents
Chapter 1 ........................................................................................................................................... 1
Introduction ....................................................................................................................................... 1
Motivation of the study ..................................................................................................................... 5
Organization of the study .................................................................................................................. 6
Chapter 2 ........................................................................................................................................... 7
Pakistan Economy: A overview of Pakistan’s Economy .................................................................. 7
Country Overview ............................................................................................................................. 7
Infrastructure, Power and Communications: .................................................................................... 7
Power ................................................................................................................................................ 8
Telecommunications: ........................................................................................................................ 8
Mining/ Hydrocarbons: ..................................................................................................................... 9
Manufacturing: ................................................................................................................................ 10
Financial Services: .......................................................................................................................... 10
Commerce ....................................................................................................................................... 10
State of the Economy ...................................................................................................................... 11
Investment ....................................................................................................................................... 11
Stabilization .................................................................................................................................... 11
Inflation ........................................................................................................................................... 12
Outlook for the Economy................................................................................................................ 12
Capital Markets ............................................................................................................................... 13
Debt Capital Markets ...................................................................................................................... 15
ix
National Saving Schemes ............................................................................................................... 15
Investor Base: .................................................................................................................................. 16
Real Estate Investment Trusts (REITs) ........................................................................................... 17
Private equity and Venture Capital fund (PE & VCF) .................................................................... 17
Mutual Funds .................................................................................................................................. 17
Chapter 3 ......................................................................................................................................... 18
Review of Literature and Theoretical Framework .......................................................................... 18
Determinants of firm-level corporate cash holding ........................................................................ 18
Corporate governance and cash holdings ....................................................................................... 21
Theoretical framework for present study ........................................................................................ 22
Trade-off Model .............................................................................................................................. 22
Leverage .......................................................................................................................................... 23
Size of the firm................................................................................................................................ 23
Cash flow ........................................................................................................................................ 23
Pecking Order Theory ..................................................................................................................... 24
Free Cash Flow Theory of Jensen (1986) ....................................................................................... 24
Identification of Variables ............................................................................................................... 25
Determinants of Corporate Cash Holdings ..................................................................................... 25
Transactional motive ....................................................................................................................... 25
Firm Size ......................................................................................................................................... 26
Net Working Capital (NWC) .......................................................................................................... 26
Precautionary motives ..................................................................................................................... 26
Financing motives ........................................................................................................................... 27
x
Effect of internal capital markets (Group Affiliations) on corporate cash holding ........................ 27
Effect of corporate governance on corporate cash holdings ........................................................... 28
Economic uncertainty and corporate cash holding behavior .......................................................... 29
Measurement of Macroeconomic uncertainty ................................................................................ 29
Implications of corporate cash holdings ......................................................................................... 30
Motives for excess cash holdings ................................................................................................... 30
Chapter 4 ......................................................................................................................................... 31
Methodology and Data .................................................................................................................... 31
Data description and sources .......................................................................................................... 31
Econometric Methodology.............................................................................................................. 32
Determinants of cash holdings ........................................................................................................ 32
Firm-specific variables.................................................................................................................... 32
Determinants of cash holdings using Firm-specific and Industry Dummies .................................. 33
Determinants of cash holdings and Effect of Group Affiliation ..................................................... 35
Corporate governance ..................................................................................................................... 35
Estimated Model ............................................................................................................................. 36
Economic uncertainty and corporate cash holding behavior .......................................................... 37
Cross-sectional distribution of the cash-to-asset ratio .................................................................... 37
Effect of excess cash holdings on investments ............................................................................... 39
Chapter 5 ......................................................................................................................................... 40
Results and Discussion ................................................................................................................... 40
Summary Statistics and Unit-root test ............................................................................................ 40
Determinants of cash holdings ........................................................................................................ 43
xi
Industry effects using industry-specific dummy variable ............................................................... 47
Effect of group affiliations on corporate cash holdings .................................................................. 50
Determinants of corporate cash holdings (corporate governance variables) .................................. 52
Economic uncertainty and corporate cash holdings ........................................................................ 54
Excess cash holdings and capital expenditure ................................................................................ 55
Chapter 6 ......................................................................................................................................... 57
Conclusion and Recommendations ................................................................................................. 57
Policy Recommendations: .............................................................................................................. 59
ANNEXURE A: .............................................................................................................................. 67
ANNEXURE 1................................................................................................................................ 69
1
Chapter 1
Introduction
In a world without capital market imperfections, such as information frictions, there is no difference
between the cost of internal and external funds and thus a perfect substitution is possible. However, this is
not the case in an environment where market imperfections also exist. The presence of market
imperfections does not allow perfect substitution between internal and external funds; and the cost of
external financing tend to depend on how far firms are subject to capital market imperfections. External
financing is also related to firm-specific characteristics and the quality of corporate governance; for
instance, severe informational and agency problems may restrict firms’ access to external finance and
curtail their internal funds. Consequently, profitable investment opportunities at times become inevitable
for these firms, and the availability of internal funds to keep investing in planned investments becomes
crucial for such financially constrained firms.
The question ‘why do firms hold a cash balance’ has been investigated extensively in the literature (Afza
and Adnan, 2007; Gil and Shah, 2012; Cossin and Hricko, 2004; Drobetz and Grüninger, 2007). So far
financial literature identifies three motives to explain the aforementioned question. First and foremost is
the transactional motive (Ross, 2000) which is related to the liquidity need of the firms. It documents that
most often cash inflows and outflows of a firm do not synchronize perfectly and a certain level of cash
holding becomes necessary to serve as a buffer. The next is the precautionary motive which is connected
to the volatile cash flows in an uncertain world (Nguyen, 2005). It explains that a firm has to maintain a
minimum level of liquid reserves as a precautionary measure (Diamond, 1984, Stiglitz and Weiss, 1981)
in order to cover any unexpected shortfall in cash flow. For instance, in the real world, there may be a
significant cost of financial distress (Shah, 2011; Ferreira and Vilela; 2004). Lastly, financing motive
states that firms tend to hold liquid reserves with an objective to provide them an opportunity to finance
positive Net Present Value (NPV) projects when external financing is either costly or unavailable. In
short, a corporation may carry a significant amount of liquid assets to guard against probable financial
distress, to pursue an investment policy when financial constraints are met or to minimize costs of raising
external funds.
Given that under any of the above-stated motives an optimal level of cash balance becomes desirable for
the firms; financial literature discerns three theoretical models that explain how the firms decide about
their optimal level of cash holdings. First, Trade-Off model suggests that firm’s optimal level of cash
2
holdings is determined by trade-off between the marginal costs and marginal benefits of holding cash.
Second, Pecking Order Theory of Myers & Majluf (1984) suggests that, to minimize financing costs,
firms have some preference for a financing hierarchy where investments are financed first with internally
generated funds, followed by debt and, finally, with equity. This “preferred financing hierarchy”
hypothesis suggests that there are no such things as “target cash levels” but cash functions as a buffer
between internally generated funds and investment needs. Finally, Free Cash Flow Theory of Jensen
(1986) posits that managers value “flexibility” and “control”. They have an incentive to pile up cash to
increase their control over firm’s assets and, in turn, over firm’s investment decisions. Having excess cash
at one’s disposal also eases the pressures on managers to perform well and also allow them to invest in
projects that best suit their own interests, but may not be in the shareholders’ best interest.
Importance of optimal cash holdings becomes striking when one considers the role of cash holdings in
terms of dividend policy, hedging, and incremental capital structure decisions Dividend policy is
influenced by the cash accounts of the company as company may be unable to pay dividends in the
absence of extra cash. Acharya, Almedia & Campello (2007) theoretically argue that corporate cash
holdings play an important role in firm’s financial policy. Hedging being the important ingredient of the
company’s financial policy provides cash when the firm runs short of the cash. Decisions related to
hedging are also affected by the firm’s cash balance.
Furthermore, capital structure decisions of a company are highly correlated with the internal funds
available to the company. Therefore, examining the role of corporate cash holdings outside the
Modigliani and Miller (1958) world, where asymmetric information and frictions do exist, is very
relevant to understand hedging, dividend policy and financing patterns.
Recently, the subject of the determinants of capital structure has been examined extensively in the
empirical literature, but relatively little attention has been paid to explore their effect on cash holdings.
Holding cash is worthless in a world of perfect capital markets. In efficient markets firms can undertake
all positive NPV projects regardless of their liquidity level. However, in the presence of market frictions,
liquidity ratios vary with firm characteristics such as firm size, degree of financial leverage and industry
characteristics. Several studies have documented the relation between firm characteristics and liquid asset
holdings. Kim, Mauer & Sherman (1998) point out that firms increase investment in liquid assets in
response to increases in the cost of external financing, future cash flows uncertainty and the return on
future investment opportunities. Almeida, Campello & Weisbach (2004) show that financially constrained
firms' cash-flow sensitivity increases during recessions, while that of unconstrained firms is unaffected by
the business cycle. These studies suggest a positive relation between liquid asset holdings and proxies for
3
the severity of agency problems. Mikkelson & Partch (2002) document that variables used to measure
managerial incentive problems, such as ownership and board characteristics, fail to explain differences in
cash levels.
Besides firm-specific determinants and motives of cash holdings, the other area that has been gaining an
increase in attention is the role of the corporate governance in the determination of the optimum level of
cash holdings for the firms. The quality of corporate governance is linked to the efficient levels of cash
holdings. Empirical evidence of Dittmar et al. (2003) is consistent with the theories that investors in
countries with poor shareholder protection cannot force managers to disgorge excessive cash balances.
Dittmar et al. (2007) report a positive relation between the level of cash holdings maintained by firms and
the quality of corporate governance for the firms. Similar results are documented by Harford et al. (2008)
for U.S. firms.
Behavioral finance largely documents that macroeconomic factor such as market volatility affects the
investment decisions of managers as well as investors. For instance, it is argued that higher levels of
macroeconomic uncertainty adversely affect the ability of managers to accurately predict the firm-specific
information such as future expected cash flows; and thus volatile and uncertain macroeconomic
environment can influence manager’s decisions in determining appropriate levels of liquid asset holdings.
Given this theory, we expect to observe fewer variations in the liquid assets holding levels across firms
during the market downturns or in bearish scenarios. Conversely, in periods of stable macroeconomic
environment managers may expect less risk in allocating the resources efficiently by adjusting the firm’s
liquid assets aligned to the firm’s requirements. Some studies document that liquidity ratios vary with
firm characteristics such as firm size, industry and degree of financial leverage. Hence, managers of the
firms may respond differently, given the firms’ characteristics, to changes in the macroeconomic
environment, leading to more variations in the levels of liquid asset holdings in tranquil macroeconomic
environment compared to the more volatile macroeconomic conditions.
So far it is established that firms are required to maintain certain levels of cash holdings for various
reasons such as transactional, precautionary and financing motives. The finance literature also documents
that firms maintain excess levels of cash for a number of other reasons. These reasons include financial
institution’s requirements, avoiding hostile takeover /mergers and guard against the unexpected cash
shortages. According to the agency theory of free cash flows, the excess cash holdings are likely to be
used inefficiently; for instance, the excess cash may be used by managers to invest in pet projects or for
empire building. Another area that has recently gained an increasing attention is the role of cash as a
determining factor for corporate investment expenditures (Almeida et al. 2004; Acharya et al. 2005). A
4
study by Arsalan, Florackis & Ozkan (2006) documents that the investment expenditures of cash-poor
firms are found to be more sensitive to the availability of internal funds, particularly, in periods of
financial crisis.
The primary aim of this study is investigating into the major determinants of corporate cash holdings, its
major underlying reasons and implications for Pakistani firms. More specifically, the study would try to
answer the following research questions.
Research Questions
1. What are the major determinants of corporate cash holdings and their underlying causes in non-
financial Pakistani firms?
2. Do cash holdings across industries vary?
3. Do group-affiliation effects the cash holdings?
4. How does corporate governance affect corporate cash holdings?
5. How do the country’s varying macro-economic situations change corporate liquid asset
management practices?
6. Does excess cash effect the firm’s investment decisions?
The answers to the above research questions were achieved, pursuing the following specific objectives.
Research Objectives
1. To identify and analyze the determinants of cash holdings for Pakistani corporate firms using
firm-specific variables
2. To examine the firm-specific and industry-specific effects of differences in corporate cash
holding
3. To examine, whether group-affiliated and non-group businesses have different cash holding
patterns
5
4. To examine the relation between corporate governance and corporate cash holdings with various
firm-specific control variables
5. To examine linkages between macroeconomic uncertainty and behavior of corporate managers
towards liquid asset management policies
6. To examine the effect of firm’s excess cash holdings on the firm’s levels of investments.
The first two research objectives of the study have been examined by using firm-specific variables
identified through an extensive survey of the literature. Dummy variable regression has been used to
examine the third objective, that is, whether group-affiliated and non-group businesses have different cash
holding patterns. Firms have been divided into two groups— group affiliated and non-group businesses.
Furthermore, various corporate governance variables such as managerial ownership, board size, board
composition; board independence has been used to account for the quality of corporate governance
mechanisms. To achieve research objective V, variations in various macroeconomic indicators such as
industrial production, consumer price index, interest rates and stock market aggregates are used as proxies
for macroeconomic uncertainty. Managers’ behaviors are measured in terms of cross-sectional variation
in the distribution of cash to asset ratio.
Motivation of the study
Most of the existing financial literature on determinants of cash holdings is limited to the advanced
economies where the markets are developed and work under a sophisticated regulatory environment, and
firms are required to meet certain level of restrictions to report their data regularly. Corporate governance
is expected to be weak in emerging and developing markets; and weak corporate governance is believed
to encourage excess cash holdings (Dittmar et al, 2003). The impact of corporate governance is expected
to be relatively different in emerging and developing markets because of the different nature of
governance in these markets. Being a developing country, Pakistan must have its own characteristics of
corporate governance with particular implications for the cash holding patterns for Pakistan’s corporate
sector. This study provides an opportunity to investigate whether or not the theories on determinants of
cash holdings prevail in Pakistan’s market, and help one to identify the major factors responsible for
firm’s cash holdings. The study contributes to the existing literature by analyzing the cash holding
patterns and its implications for Pakistan’s market. We also extend our analysis further by testing the
existing theories at group-affiliation, industry level and at firm level. Lastly, this study goes beyond the
determinants of cash holdings by exploring the possible implications of cash holdings for investments.
6
Our study also explores corporate cash holding behavior taking into account macroeconomic
environment. Emerging markets are also characterized by high macroeconomic uncertainty prompting the
managers to hold more cash than would be optimally required. This may necessitate examining cash
holdings patterns at times of macroeconomic uncertainty. Since macroeconomic uncertainty also leads to
higher volatility in firm’s cash flows, managers are sensitive to such variations in firm’s cash flows and
this may lead to have different cash holding behavior than under stable macroeconomic environment.
Given the high contracting costs in developing markets because of low judicial efficiency (Shah, 2011)
and costly judicial process, firms are tempted to hold higher levels of cash because of lower availability
of external funds. Hence, given that Pakistan is lower in judicial efficiency (Shah, 2011) it provides an
interesting area to explore the cash holding patterns in Pakistan’s market. In short, the results of this study
provide important insight into the problem investigated, and bring into light certain important
implications, not only, for Pakistan’s corporate sector, but also for that of other developing countries.
Organization of the study
After this introductory chapter, chapter 2 introduces Pakistan economy and discusses its various aspects
and sub-sectors related to the research topic. Chapter 3 presents the relevant literature, discusses the
themes of important studies and develops theoretical framework. Chapter 4 presents the methodological
framework; Chapter 5 carries out the required analysis and presents the findings and discussion thereon.
Chapter 6 summarizes the findings, draws conclusions and presents recommendations based on the
research findings.
7
Chapter 2
Pakistan Economy: A overview of Pakistan’s Economy
This chapter provides an overview of Pakistan’s economy and brief description of all the sectors of the
economy. This chapter is intended mainly for readers to acquaint them with Pakistan’s economy and
different economic sectors. This brief economic review is related to our study in the broader context since
our data relates to Pakistan’s corporate sector and we have drawn our data from all the major sectors of
Pakistan’s economy.
Country Overview
Located in Asian Subcontinent and covering an Area of 790,095 square kilometers (310,410 square
miles), Pakistan is a country with diverse cultures. It has four provinces namely Punjab, Baluchistan,
Sindh and Khyber Pukhtunkhwa (formerly called NWFP). In year 2010, the present government of
Pakistan People’s Party gave the name of Gilgit Bultistan to the formerly northern areas and gave it a
status of de-facto province. Pakistan shares its border with India (2,192 km long border) in the east,
Afghanistan (2430 km long border) and Iran (909 km) respectively in the west and China (523 km long
border).
Pakistan claims a diverse terrain. In north, it has the great Hindukush and Karakoram mountain ranges
and in south it borders the Arabian Sea. The country’s temperature is extreme with mercury rising to 50
degrees Celsius and above in the deserts of Sindh to -58 degrees Celsius and below on the mountain
ranges. The national language of Pakistan is Urdu spoken by 10 percent of the population while the
official language is English. Punjabi is spoken by 48 percent, Sindhi is spoken by 12 percent, and Siraiki
is spoken by 10 percent while Pushtu is spoken by 8 percent. The education medium is Urdu and English.
Only 40 percent of population is literate compared to South Asian region that has an average literacy rate
of 49 percent. Majority of population belongs to Sunni Sect of Islam, while a respectable minority of 15
to 25 percent of population belongs to Shia Sect of Islam. Christians (1.6 percent of the population) are
the major minority in Pakistan along with Hindus (1.5 percent of the population).
Infrastructure, Power and Communications:
Pakistan’s infrastructure is not up to the mark when compared with other developing countries of the
world. Almost 90 percent of the population uses roads for transporting goods and traveling from one

8
place to another. About 87,774 km of roads are paved. There are only 339 km of expressway. The arterial
roads are the victims of gross miss neglect by the government. The poor conditions of these roads claim
precious lives and also result in increasing transportation cost by 30 to 40 percent. The lack of farm to
market roads results in agricultural goods to perish before reaching the markets. The importance of trains,
a popular medium of transportation in India and most of the world, has declined. There are 8,163 km of
railway tracks. Pakistan Railways is responsible for the whole rails system in the country. Bad
governance, corruption and neglect have caused this institution to strive for its existence. The government
wants to make railways a profitable institution by trying to increase its share in freight traffic. At present
the railways has 15 percent share in freight traffic while road vehicles has 85 percent.
Pakistan’s main ports are Karachi and Port Muhammad bin Qasim. The recently opened Gawadar port is
still in its infancy. Karachi is the main port that handles the bulk of dry and liquid cargo followed by Port
Qasim. The country has a merchant fleet of 20 ships and the government is trying to increase its size by
acquiring new ships to enhance its capability.
Pakistan International Airlines is the only National carrier. Qaid-e-Azam International Airport is the
largest and the busiest airport accommodating a bulk of national and international flights. However
Lahore, Islamabad, Peshawar and Quetta airport also entertain number of international flights. The
government has allowed private sector to operate in domestic aviation market. In response three air lines
i.e Shaheen Air, Aero Asia and Bhoja Air are operating on domestic and international routes.
Power
The total installed capacity of Pakistan’s power sector is 16,375 MW. This power is generated from oil
(42.8 percent), natural gas (38.6 percent), water (12.8 percent) and Coal (5.2 percent). However, the
existing capacity is unable to bridge the supply demand gap of power. The power tariffs have been
increased in recent years to adjust to market conditions but yet the public power distribution companies
are witnessing massive losses in their books of accounts. The major contributor in this phenomena is line
losses and unpaid electricity bills. Unpaid bills amounted to Rs. 36 billion in recent years. Further the
rising oil prices are fueling an upward surge in the cost of electricity production.
Telecommunications:
Pakistan has one of the best telecommunication networks in the region. Pakistan Telecommunication
Authority is the regulatory body that supervises all the telecommunication companies in Pakistan.
9
Pakistan Telecommunication Company Ltd. (PTCL) is the main telecom service provider whose 54
percent shares are owned by government while 26 percent are owned by a strategic investor. The cellular
telephone industry is booming in Pakistan and there is a cut throat competition among 5 operators for
subscribers. By 2003, there were 1 million cellular phone subscribers in Pakistan and as of today, their
number has reached 130 million. The Government, inspired by India’s IT success, wanted to develop a
software sector. The prerequisite for this sector is an advanced telecommunication network and affordable
bandwidth. Thus the telecom sector has been deregulated to achieve the above stated prerequisites.
Pakistan’s IT policy is targeting education and allocation of funds for science and technology went from
Rs.120 million to Rs. 5 billion in 2001. At present high speed internet is available in almost all the major
cities of Pakistan and the government is trying to accommodate far flung areas to get access to fast
internet facilities.
Mining/ Hydrocarbons:
The crude oil production in Pakistan satisfies 18 percent of the country’s requirements and are depleting
fast. The experts suggest that Pakistan has 226 million barrels of recoverable reserves. Since a lot of
investment is required for oil exploration, the government has invited multinational corporations to
explore oil reserves in Pakistan. However most of the domestic requirement is fulfilled by importing oil.
The crude oil and related imports cost Rs. 100.4 billion in year 19992000). While in period 2009-2010, it
was at staggering $10.6 billion that may balloon to $ 12.6 billion during the financial year 2011.Natural
gas is a major energy asset for Pakistan. In 19992000 its production on average was 2.22 billion cubic
feet per day. However Pakistan’s internal gas reserves are depleting and its reliance on foreign imports is
increasing. In this regard the government is interested in gas pipeline project with Iran and India. By
connecting it with the second largest natural gas reserve of the world, Pakistan will have guaranteed
supply of natural gas for decades to come. Coal has the potential of being the future guarantor of energy
supply for Pakistan. The recent discovery of Coal in Thar Desert, Sindh province has excited the
geologists. A total of 175 billion tons of coal resource potential has been assessed. This high quality coal
will be exploited to generate electricity. Along with the above stated natural resources the recent
discovery of huge reserves of blister copper and gold in remote Chagai district of Baluchistan will
increase revenue of the government.
10
Manufacturing:
In 1947, Pakistan’s manufacturing industry was in shambles. With most of industrial units located in main
land, Pakistan had to start the manufacturing sector from a scratch. However Pakistan still has a small
manufacturing. Textiles is Pakistan’s major industry. In year 1999, it accounted for 8.5 percent of gross
domestic product and represented 60 percent of total exports of Pakistan. It represented 38 percent of total
industrial employment. In the period 2009-2010 the textile industry represented 60 percent of the total
exports and represented 46 percent of the total manufacturing of the country. Further it represented 39
percent of total industrial employment. The industry spent about $6.4 billion for balancing, modernizing,
restructuring and expansion. The ready-made garment industry is responsible for highest value addition in
the textile industry. This industry has the facility to import duty free machinery. This Industry recorded
7.3% growth in the year 2010 as compared to year 2009. In the year 2010, seven polyester fiber units are
operational in the country with production capacity of 640,000 tons per annum. The industry experienced
double digit growth prior to 2008 but it has declined by 3.9 percent in year 2008. This sector has a
promising future as Pakistan has ratio of 10 cars per 1,000 persons.
Financial Services:
Pakistan’s financial sector comprises of Commercial Banks, Non-banking Financial Institutions
(NBFIs) that involve Development Finance Institutions (DFIs), Investment Banks, leasing companies,
modarabas, and housing finance companies.
Commercial banks and NBFIs are working under direct supervision of State Bank of Pakistan while
Modarba and leasing companies are supervised by Securities and Exchange Commission of Pakistan
(SECP).Government has encouraged Islamic banking. In June 2002, there was only one Islamic bank with
6 branches. By 2006, this number has risen to 4 Islamic banks with 100 branches all across the country.
Cumulatively, the financial sector in Pakistan has advanced loans worth 193,987 million rupees to more
than 2.6 million borrowers in 2003. In 2006, these banks released 401,910 million rupees to more than 5
million borrowers.
Commerce
Commerce activities involve whole sale and retail businesses. They command largest share in services
industry by about 30 percent. The rising taxes, power shortfalls and poor law and order situation has
11
eroded much of their profits. Since this sector is responsible for much of the country’s employment the
government needs to step in to solve their problems.
State of the Economy
Despite of global recession, Pakistani economy has stood the test of time. The GDP growth is estimated
to be 4.1 percent (inflation adjusted) as compared to 1.2 percent in the previous year. In 2009-2010,
agriculture sector indicated a growth of 2 percent, live-stock indicated a rise of 4.1 percent, industrial
output increased by 4.9 percent and the services sector grew by 4.6 percent compared to 2008-2009.
These positive figures are the results of government crop support price, bumper cotton production and
increased demand for Pakistan’s exports. However the above positive indicators should not be mistaken
with structural shifts in the economy. Heavy government borrowing and rising unemployment (7.1
percent in 2010 as compared to 6.3 percent in 2009) can create problems for the economy. High inflation,
law and order situation, rising debt services and poor domestic resource mobilization indicate that
Pakistan cannot enter in to expansionary economic policy at this stage.
Investment
The gross fixed capital formation has indicated a decline of 0.6 percent compared to 5.5 percent increase
in 2008-2009. Private fixed investments have declined by 3.5 percent coupled with a decline in foreign
direct investments (FDIs). The FDI cumulatively stood at US $ 1.8 billion as compared to US $ 3.2
billion in year 2009. This massive decline of 45 percent is not surprising as global economy is in
recession. However the bad news is massive disinvestment in Pakistan’s IT sector that amounted to US $
95 million. On the whole, 12 major industries indicated higher FDI for the period and 24 major industries
witnessed a reduction in FDI inflow.
Stabilization
In the wake of balance of payment crises in 2008, Pakistan has been successful in attaining
macroeconomic stability. Due to careful and prudent economic planning, Fiscal deficit has been reduced
to 5.2 percent of GDP in 2008-2009 from 7.6 percent in 2007-2008. Also external current account deficit
was reduced to 5.6 percent of GDP in 2008-2009 as compared to 8.3 percent in 2007-2008. Foreign
exchange reserve stood at US $ 15 billion 2009-2010 as compared to US $ 6.6 billion in 2008. Inflation is
back in single digit of 8.5 percent in 2009 as compared to 25 percent in 2008. However inflation has risen
12
in 2010 and still is on the rise. Lastly, Pakistan has been given improved credit rating of B- by S&P
compared to previous CCC+ while the country has been given the status of stable by Moody’s.
Inflation
The persistent rise in commodity prices since 2008 has put strain on prices in Pakistan also. Thus despite
of containment of inflation to 8.5 percent in 2009, the inflation is back in double digits of 13.3 percent.
The food inflation stood at 14.5 percent and non-food inflation stood at 12.2 percent. Thus on average,
inflation stood at 11.5 percent in year 2010 while SBP indicates that it is at 12 percent.
The reduction of inflation from 25 percent in 2008 to 12 percent in 2010 will have impact on poor.
However rising oil prices, Electricity and other utility cost coupled with lower employment rates will
adversely impact the poor people in Pakistan. The gap between rich and poor is expected to further
increase. However on the positive side, increase in worker’s remittances and government’s income
support programs (estimated Rs. 35 billion in 2009-2010) will have positive impact on poor of Pakistan.
Due to adverse conditions, Pakistan’s public finance has come under lot of strain. Two factors
have contributed to adverse public finance. Firstly, more reliance on oil for electricity generation and
secondly lower rain fall contributing to lower electricity generation from dams. The government is forced
to give subsidy on electricity thus it has to reduce its spending on developmental public programs.
However tax collection has improved by 14 percent in 20092010. However compared to GDP, it is still a
meager amount. Also after the seventh amendment, the resources have been transferred to provinces from
the center. This resource allocation will be effective from 2011-2012.
The public debt is about 56 percent of the GDP (March 2010). The rupee dominated debt stood at 31
percent of GDP while foreign currency dominated debt stood at 25 percent of GDP in 2010.The primary
reasons for such high debt are currency translation losses, subsidy payments, lower FDI, delays in
payment by coalition against terrorism, lower inflow of external assistance and repayment of maturing
defense saving certificates.
Outlook for the Economy
Despite of adverse conditions, the economic mangers of Pakistan have worked well to stabilize the
economy but however a long road is ahead of them to achieve a positive structural shift in the economy.
The policy identified for future economic growth must take following such actions as curtailing inflation,
13
increase Employment opportunities, increase direct taxes as opposed to indirect taxes, and curtail non
developmental expenditures, Reform of public sector enterprises
Capital Markets
Pakistan’s equity market consists of three stock exchanges. Of these, Karachi Stock Exchange (KSE)is
the biggest, oldest and the most liquid stock exchange in Pakistan. The other two are in Lahore and
Islamabad but are very small in terms of listings and market capitalization. A total of 591 companies were
listed on Karachi Stock Exchange byMay2012. The total paid up capital stood at Pak Rs. 1,059.087
billion in May 20112. The market capitalization stood at Rs. 3,730.489 billion (US $ 41.0 billion) as of
May 4, 2012. Average daily share turnover has been around 160 million shares in the last five years (i.e.,
2007-2012)1. KSE trades four stock indices in the market, namely, Karachi Stock Exchange (KSE) 100
Index, KSE 30 Index and KSE All Share Index and KSE Meezan Index (KMI)2. Of these, KSE 100 Index
is the most widely followed index. It is a valued-weighted index and has representation from all the
sectors of the economy and includes largest companies on the basis of market capitalization. KSE-100
index represents more than 85 per cent of the market capitalization of the market.
The international business magazine “Business Week” declared KSE as the best performing world stock
market in 2002 on the basis of the annual percentage rate of return for investors. That had attracted many
foreign investors to the market and foreign investment inflow had increased substantially. However, the
market saw turbulent times in 2007 and 2008 when there were minimarket crashes. Since then, the market
has reasonably recovered over the years, though it still remains one of the most buoyant and volatile
market in the region.
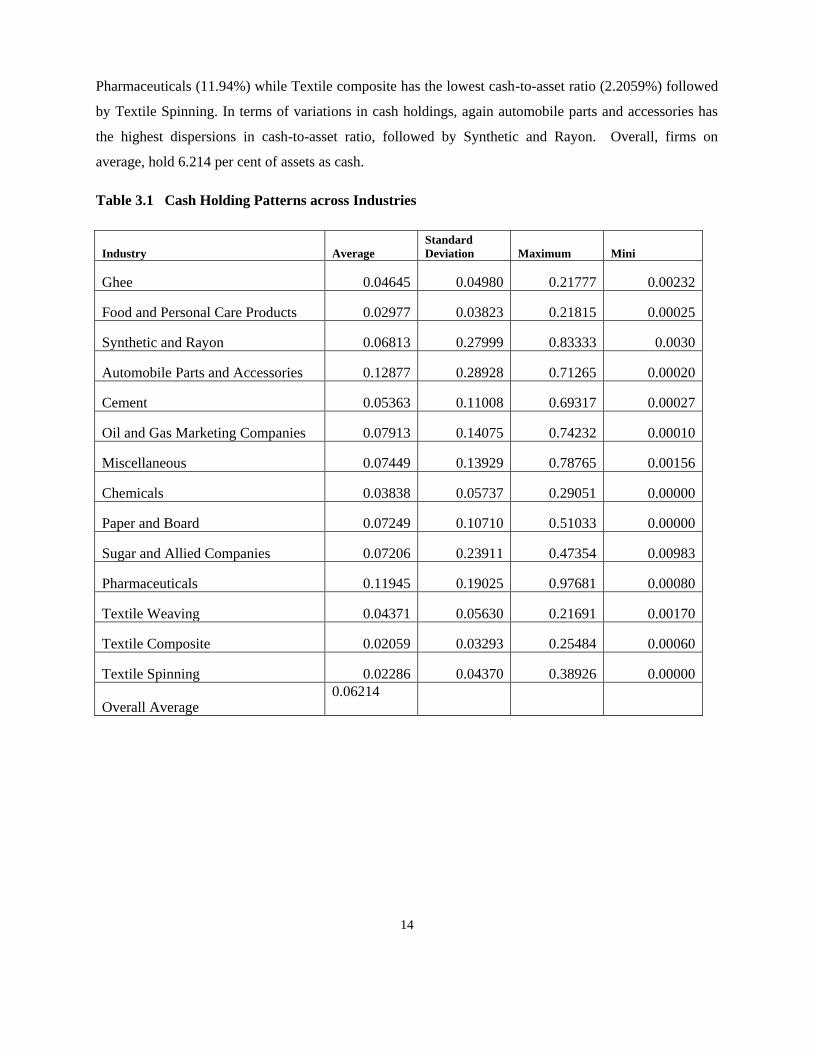
Patterns of cash holdings across industries
Table 3.1 provides descriptive statistics for cash holding patterns across different industries of the sample
firms. The table reports cash as percentage of firm’s total assets. As reported by the table that
Automobile parts and accessories has the highest mean cash holdings (12.88%), followed by
1
Source: Karachi Stock Exchange Limited, May 4, 2012
2
KMI tracks 30 most liquid “Islamic Law-compliant stocks listed at the Karachi Stock Exchange.
14
Pharmaceuticals (11.94%) while Textile composite has the lowest cash-to-asset ratio (2.2059%) followed
by Textile Spinning. In terms of variations in cash holdings, again automobile parts and accessories has
the highest dispersions in cash-to-asset ratio, followed by Synthetic and Rayon. Overall, firms on
average, hold 6.214 per cent of assets as cash.
Table 3.1 Cash Holding Patterns across Industries
Industry Average
Standard
Deviation Maximum Mini
Ghee 0.04645 0.04980 0.21777 0.00232
Food and Personal Care Products 0.02977 0.03823 0.21815 0.00025
Synthetic and Rayon 0.06813 0.27999 0.83333 0.0030
Automobile Parts and Accessories 0.12877 0.28928 0.71265 0.00020
Cement 0.05363 0.11008 0.69317 0.00027
Oil and Gas Marketing Companies 0.07913 0.14075 0.74232 0.00010
Miscellaneous 0.07449 0.13929 0.78765 0.00156
Chemicals 0.03838 0.05737 0.29051 0.00000
Paper and Board 0.07249 0.10710 0.51033 0.00000
Sugar and Allied Companies 0.07206 0.23911 0.47354 0.00983
Pharmaceuticals 0.11945 0.19025 0.97681 0.00080
Textile Weaving 0.04371 0.05630 0.21691 0.00170
Textile Composite 0.02059 0.03293 0.25484 0.00060
Textile Spinning 0.02286 0.04370 0.38926 0.00000
Overall Average 0.06214
15
Debt Capital Markets
Historically, like other emerging markets, Pakistan’s economy has mostly relied on the banking system to
meet the financial needs of the economy. This is coupled with the fact that equity markets also developed
very slowly. However, as compared to the equity market, Pakistan’s debt market is relatively under-
developed and consists mainly of government treasury bonds. Hence, the bond market in Pakistan is
dominated by the government bonds. Of these, Pakistan Investment Bonds (PIBs) form a big chunk of
government securities. PIBs are issued in various tensors and provide government with long term finance.
The major drivers of financial assets in Pakistan are deposits and government bonds whereas corporate
bonds remain a very small portion of the total debt market. The corporate bond market in Pakistan exists
in the form of Term Finance Certificates (TFC). The first TFC was issued in 1995 by Packages Limited
for Pak Rs. 232 million in February 1995. The corporate bond market has since then experienced
considerable growth. As of March 2012, a total of 131 corporate debt securities were outstanding with an
amount of Pak Rs.500 billion3, yet it is very small amount as compared to the total domestic bond
outstanding of Pak Rs. 5.8 trillion as of June 2012.The TFC issuers include financial institutions, non-
financial institutions and private and public firms. Besides TFCs, corporations can also issue commercial
papers (CP) to raise short-term working funding for up to 9 months. CPs can be sold to financial
institutions which has an appetite for short term money market instruments. However, commercial papers
market is at a very nascent stage. At present, both the government and the corporations are competing on
raising funds in the market. The rate of return on TFCs issued by corporations is almost equal to that
offered by the Defense Saving Certificates (DSC) and other National Savings Certificates (NSC) which
are issued by government and this has become a major hurdle in the development of the corporate bond
market (Khan, 2012). This phenomenon is particularly relevant for pension funds and provident funds
where these institutions end up investing heavily in government securities. Consequently, these funds are
used to finance government fiscal deficits instead of being utilized to impact on the country’s growth and
development.
National Saving Schemes
National savings organization is the biggest non-bank borrowing institution for the government. With six
million account holders and representing investment of over Rs. 1500 billion, its products namely special
3
Source: Pakistan Economic Survey 2012-2013
16
savings certificates and special savings accounts are popular with investors. In recent times it is facing
competition from “bahbood” savings certificates and pensioner’s benefit accounts. In recent time, its
tradable national saving bond gained lot of popularity. The government is backing these bonds and it
raised 3.2 billion by the auction of these bonds. However the funds generated by government on these
bonds are costly. Further in year 2009, the government offered a higher interest rate to raise against
national savings certificates.
Investor Base:
Leasing
Due to stiff competition and low liquidity, the Pakistani leasing companies have shown lot of mergers and
acquisitions. At present, there are 11 leasing companies operating in Pakistan whose general financial
position as of June, 2012 is as follows; Total Assets(Rs. in millions): 33,607; Total Equity(Rs. in
millions): 4,829; Total Deposits(Rs. In millions): 4,0754
Investment banks
Investment banks didn’t perform well in Pakistan. The reason for bad performance was that they offered
similar products that were offered by conventional banks. At present there are 8 investments banks in
Pakistan. Their financial position as on March 31, 2010 is as follows; total Assets (Rs. In millions):
31,499.97; Total Equity (Rs. In millions): 3,358.37; Total Deposits (Rs. In millions): 27,616.27
Modaraba
Despite of interest based securities in the market, modaraba sector has performed impressively. Although
there is a decrease in assets of modaraba companies, analysts predict that conditions will become
favorable as economy improves. Further, approval of Religious board for twelve new Islamic financing
schemes will bring these companies at par with other financial institutions. At present there were 41
registered modaraba companies.
4
http://www.nbfi-modaraba.com.pk/statistics.aspx
17
Real Estate Investment Trusts (REITs)
Pakistan has experienced growth in property sector in last decade. To facilitate investor to get advantage
of boom in construction industry and to facilitate developers to undertake construction endeavors, REITs
were introduced. In March 2009, the SECP granted registration to two REIT engagement companies
(RMC) in Pakistan. These companies have launched REIT schemes after their approval from SECP.
Private equity and Venture Capital fund (PE & VCF)
PE & VCF is a close ended highly priced mutual fund that is bought by rich individuals and institutions.
However due to persistent poor performance of the economy, dismal regulations and deteriorating law
and order situation in the country, these funds were not successful.
Mutual Funds
Mutual funds are showing signs of improvement in recent years. In year 2009, it indicated a growth of 42
percent. In monetary terms, mutual funds recorded a growth of Rs. 258 billion at the end of FY 2009 to
Rs. 182 billion. The total number of mutual funds stood at 116 in
December, 2009 compared to 95 in beginning of year 2009.
18
Chapter 3
Review of Literature and Theoretical Framework
This chapter consists of three major sections. The first section presents literature on various variables
affecting cash holding patterns of firms and its implications, in general. The review of studies on
corporate governance and cash holdings is separately covered in the second section. On the basis of the
relevant theories and their empirical implications discussed and reviewed in the first two sections, the
third section revisits the latest theories and develops the theoretical framework for the present study.
Determinants of firm-level corporate cash holding
Although academic interest in corporate cash holdings dates back to 1945, it is generally sparse and
mainly descriptive. Chudson (1945) studies balance sheets of a cross section of industrial corporations in
the 1930s and finds that firm’s cash to asset ratio (government security) is negative (positively) related to
the firm’s size. Of the earlier studies Baumol (1952) presents a model in which the author argues that the
firm’s target level of cash holdings depends on a trade-off between the costs and benefits of holding
higher or lower levels of cash than is normally required. If a company holds less than the required level of
cash they have to bear the trading costs incurred to generate funds, on the other hand, if they hold too
much cash, they have to bear the opportunity costs on holding idle funds since cash generates little
returns. Miller & Orr (1966) develop a model on the basis of daily fluctuations in firm’s cash flows. In
their study, the authors assume that company’s cash flows exhibit normal distribution. On each day the
net cash flows could be the expected value or some higher or lower value. Thus the best strategy for the
firm is to allow its cash balance to wander randomly within the lower and upper limits set by the Miller
and Orr model. Vogel & Maddala (1967) examine panel data for US firms and argue that ignoring the
time series data for analyzing cash ratio would mean leaving important dynamic components out of the
analysis. The time series components of their study indicate that the ratio of liquid assets to total assets
has decreased over time. The authors confirm Chudson’s findings that ratio of liquid assets increases with
the size of the firm. They also confirm that, with the increase in size of the organization, there is an
increased substitution of Treasury securities for actual cash.
Whereas most of the previous studies focus on precautionary and transactions demand for liquidity,
Baskin (1987) adopted a different approach. In his model, he used liquidity strategically in an
oligopolistic setting. He indicates that organizations can use liquidity to commit to fight entry quickly.
19
John (1993) studied the financial distress cost and argued that the cost of financial distress had a positive
relation with the firm’s cash holding level. He proposed different various in order to measure financial
distress cost, including advertising, research and development expenditures and index of chances of
occurrence of bankruptcy. His findings support a hypothesis that firms hold more in liquid assets with
higher cost of financial distress. Kim, Mauer & Ann (1998) investigated determinants of cash holding of
U.S. companies. They demonstrate that the cash-holding level increases proportionate to the expected
returns, volatility in expected cash flows and cost of retained earnings and decreases with the firm size.
Opler et al. (1999) employ publically traded US firm’s data for the period 1971-1994 and reports that
firms with relatively higher risk in future cash flows and firms with significant growth opportunities tend
to hold higher levels of cash. Furthermore, the study shows that firms tend to maintain lower levels of
cash if they have more access to capital market. Chang & Noorbakhsh (2006) analyze 22,000 firms’ data
for 44 countries and indicate that firms hold high levels of cash where shareholder protection is low. The
author’s results also indicate that size of the firm also had a negative relation with cash holdings. These
results are also similar to Dittmar et al. (2003).
A recent study by Han & Qiu (2007) shows, through two-period investment model, that firms that are
facing financial constraints are more sensitive to variations in their cash flows since financial constraints
leads to the creation of an inter-temporal trade-off between the future and the current investment. Their
empirical evidence demonstrates that financially unconstrained firms’ cash holdings have no relationship
with cash flow volatility. But financially constrained firms increase its cash holding with the increase in
cash flow volatility. Pinkowiz & Williamson (2007) analyze the determinants of cash-holding patterns in
the Japanese and German firms. They find that, in contrast to the US firms, Japanese and German firms
have distinct features in cashholding patterns. For example, they explain the negative relation between
cash reserves and cash flow by the existence of the Keiretsu relationship since the high cash may fund
high cash flow firms but low cash flow firms may be channeled within the Keiretsu firms. Guney, Ozkan
& Ozkan (2007) examine the relationship of leverage on corporate cash holdings in some of the
developed markets including UK, US, France, Germany and Japan for a period of 1996-2000, as these
markets are characterized by different legal and institutional arrangements. The results of the study report
a significant negative (positive) non-linear relationship at the lower (higher) levels of leverage. The
authors attribute their findings to the view that, since, at the lower levels of leverage the firms have the
20
ability to borrow as and when needed and, hence, they maintain low levels of cash. Whereas, high-levered
firms need to maintain higher levels of cash in order to avoid the increased chance of financial distress.
Han & Qui (2007) analyze the precautionary needs of corporate cash holdings by classifying firms into
financially constrained (firms with low dividend payout, debt and commercial ratings) and unconstrained
firms. Their empirical results are consistent with the view that firms with financial constraints hold larger
amounts of cash in response to an increase in volatility of cash flows whereas cash holding patterns for
financially unconstrained firms were not found to be responsive to cash flow volatility. Kim, Kim and
Wood (2010) study firm-level corporate cash holding variables for the US restaurant industry and find an
inverse relationship between levels of cash holding and firm’s variables such as size, liquid asset
substitutes, capital expenditures and dividend payouts while the results indicate that restaurant firm’s
cash patterns are directly related to investment opportunities.
Gryglewicz (2011) analyzes ‘liquidity’ (short-term) measured as cash flow volatility together with cash
reserves and ‘solvency’(long-term) measured as uncertainty in future profitability together with leverage.
The author concludes that firms hold larger amounts of cash where there is higher volatility in cash flows
and less uncertainty in future profitability. He attributes these differential effects on cash holdings to the
short-term and long-term uncertainty (risk) in cash flows and profitability. Kusandi & Wei (2011)
investigate the cash flow sensitivity by studying the role of legal protection to investors. The results of the
study show that firms hold the lesser amount of cash in relation to the cash flows in those countries where
the legal system provides strong protection to investors. They also document that firms with financial
constraints hold larger cash levels in relation to cash flows in countries with weaker legal investor
protection. Similar conclusions are also drawn by Porta, Silanes, Shleifer & Vishny (1997) who contend
that in those countries with poor investor protection leads to weak financial market development. This
reduces firm’s access to external funds and, as a result, firms have the tendency to build up more cash.
Drobetz, Gruninger and Hirschvogl (2010) study the relation between information asymmetry and
corporate cash holdings, measuring information asymmetry as a dispersion of earnings forecast by
analysts and employing Fixed Effects regressions and Fama-McBeth (1973) procedures. According to the
findings of their study marginal value of cash responds negatively to an increase in the level of
information asymmetry. These results were supportive of the Jenson’s (1986) theory. According to this
21
theory the cost of maintaining cash (moral hazard problem) exceeds the benefits (avoidance of costly
external financing). Carrascal (2010) argues that the investment decisions of small companies, having
limited access to financial markets and hence financially constrained firms, are more dependent on cash
flows as they are more concerned about cash flow volatility and thus have positive link with cash-to-cash
flow sensitivity.
Corporate governance and cash holdings
Research on whether corporate governance can have an effect on firm’s cash holding patterns have not
received much attention in the literature as judged by the few studies on this subject. However, studies
conducted so far are mainly related to the developed markets. Dittmar & Smith (2007) report that
corporations often hold large amounts of cash where there is poor corporate governance. Similar findings
are also reported by Harford, Mansi & Maxwell (2008) who report significant negative relationship
between corporate cash holdings and the corporate governance in the U.S. market. Their results indicate
that firms having poor corporate governance may lead to hold larger amounts of cash on their balance
sheet, and they often spend cash on acquisitions and capital expenditures. Tong (2009) finds that in the
presence of poor corporate governance diversified corporations hold lower levels of cash while strong
corporate governance has no effect on diversified corporation’s cash holdings. Chen and Chuang (2008)
report various variables of corporate governance such as managerial ownership; board independence is
positively related to the levels of cash holdings. Moreover, the effects of corporate governance are more
significant in younger firms relative to older firms.
One of the influential papers on the manager’s behavior in relation of levels of cash holdings to
macroeconomic uncertainty is that of Baum et al. (2006). The findings of their study reveal convincing
evidence that firms tend to behave homogeneous in terms of holding cash and liquid reserves at times of
greater macroeconomic uncertainty. Most recently, Baum et al. (2008) investigates the relation between
an optimal level of firms' liquid assets and uncertainty using U.S. firm-level data covering the period
1993-2002. They develop a partial equilibrium model of precautionary demand for liquid assets and their
empirical findings is indicative of the proposition that firms increase their liquidity ratios in response to
an increase in macroeconomic or idiosyncratic uncertainty.
A recent study by Drobetz et al. (2010) concludes a positive relation between the value of the cash and
strong investor protection and corporate governance. Kuan, Li & Chu (2011) examine the effect board
independence on the corporate cash holding policies for family-controlled and non-family businesses and
document that the family-controlled (non-family controlled) businesses maintain higher (lower) levels of
22
cash for their operating business strategies. The study also finds insignificant effect on board
independence on the firm’s cash policy for high cash holding firms in the family-controlled businesses.
Amir (2010) studies the impact of institutional investor’s (domestic and foreign banks) shareholding on
the firm’s cash and inventory management policies in Asian economies, including Japan, Singapore,
South Korea, Indonesia, Thailand and Malaysia. Empirical results lead the author to conclude that as the
fraction of foreign banks shareholdings increase there is also an increase in firm’s cash holdings and a
decrease in inventory levels as compared to local bank shareholdings.
Theoretical framework for present study
This section consists of two major sub-sections. In the first sub-section we discuss various theories and
models in an attempt to provide theoretical explanations for our research design and come up with the
variables and hypotheses to be tested empirically. First, we discuss theories and theoretical models,
followed by the identification of measurable variables for various research questions developed in our
research design. The second sub-section develops the theoretical framework for the present study in light
of the theories discussed and analyzed.
Trade-off Model
The trade-off argument hypothesizes that firm’s optimal level of cash holdings are determined by a trade-
off between the marginal costs and marginal benefits of holding cash. Maintaining large cash balances
offers several benefits to a firm. First, having large cash balances lead to a reduction in the probability
that the firm will experience financial distress as cash acts as a safety reserve to face unexpected losses or
external fundraising constraints. Second, even after overcoming financial constraints, cash holdings still
helps firms to adopt an optimal investment policy which would otherwise have not been possible because
of the external fund raising constraints as it would force the firm to forgo investment projects with
positive net present value (NPV). Finally, cash holdings contribute to minimize the costs of raising
external funds or liquidating existing assets as it acts like a buffer between the firm’s sources and uses of
funds. On the other hand, the most widely mentioned marginal cost of holding cash is the opportunity cost
due to the low return on liquid assets (Tong, 2010).
23
Leverage
Leverage refers to the extent to which firm finances, assets with debt. Theoretical explanations for the
relationship between leverage and liquid asset holdings are not entirely conclusive. On the one hand, it is
generally accepted that higher leverage tends to increase the probability of financial distress because of
the pressure that rigid amortization plans put on the firm’s funds management. This implies that firms
with higher leverage ratios would tend to hold higher levels of liquid assets in an attempt to reduce the
probability of experiencing financial distress (see e.g., Guney, Ozkan & Ozkan, 2007). Further,
financially constrained firms also have incentives to maintain large cash balances as they face constraints
to raise external capital (see, e.g., Guney et al., 2007; Fazzari, Hubbard & Petersen, 1988; Hovakimian &
Titman, 2003). Consequent to these arguments, we hypothesize a positive relation between leverage ratio
and levels of cash holdings.
Size of the firm
The large size of the firm often puts it in some advantageous position over smaller firms when it comes to
managing cash and raising external financing. Miller & Orr (1966) suggest that there are economies of
scale for large sized firms in terms of cash management. This makes larger firms to hold less cash as
compared to smaller firms. Another advantage that larger firms have over smaller firms is the cost
incurred in obtaining external financing. It is argued that the size of the loan and the processing fees of
the loan are not correlated, suggesting the fixed nature of the processing fees (Peterson & Rajan, 2003).
This tends to make external funds relatively more expensive for smaller firms and encourage them to hold
more cash. Another advantage of the large sized firms is in terms of information asymmetry and the lower
probability of financial distress (Titman & Wessels, 1988; Rajan and Zingales, 1995). These arguments
are suggestive of a negative relation between firm size and cash holdings.
Cash flow
Firm’s cash flows can be considered as a ready source of liquidity (Kim, Mauer & Sherman, 1998) and,
hence, serves as a cash substitute. This implies that the higher the volume of cash flows and the more
certain these cash flows are, the more these can be considered as a cash substitute. This argument implies
that we hypothesize that there is a negative relation between cash flow and cash holdings. In addition,
firms with more volatile cash flows can’t properly predict expected cash flow generation and, hence, face
higher probability of experiencing cash shortages. Hence, firms will tend to maintain high levels of cash
when their cash flows are volatile in an attempt to provide a buffer when operating cash flows fall
24
unexpectedly (Almeida, Campello & Weibach, 2004).Thus, we expect that cash flow uncertainty will
have a positive relation with cash holdings.
Pecking Order Theory
The pecking order theory of Myers (1984) ranks the various sources of funds. Firms will go to external
financing source (Debt and then equity) only once it has exhausted its internal sources (retained earnings).
Firm’s preference for this financing hierarchy is believed to be mainly motivated by the desire to
minimize asymmetric information costs and other financing costs. Pecking order theory advocates for the
use of debt only when investments exceed retained earnings. However, investments are less than the
retained earnings the portion of the outstanding debt is paid off to reduce the level of debt. Consequently,
this implies that cash holdings will grow in the opposite direction to the levels of debt and investments.
That is, cash holdings will fall in the first place when retained earnings are not enough to finance
investments and excess fund requirements need to be financed through debt. In contrast, cash holdings
will tend to grow when retained earnings are not enough to finance investments. These inter-relationships
between cash holdings, leverage and investments are suggestive of a negative relationship between cash
holdings and leverage.
Firms that are large in size, presumably are expected to be more successful, and hence should have more
cash, after controlling for investment (Opler et al, 1999). The similar positive relation is also suggested
for the level of cash flows as, controlling for other variables, it is expected that firms with high cash flow
will have more cash.
Free Cash Flow Theory of Jensen (1986)
According to this theory, management has a tendency to hold more cash for investment purposes to gain
more control over firm’s assets. If the company has sufficient internal funds for investment purposes, they
may not be required to access external financing and they may not be required to be evaluated by the
market. This may incentivize them to select negative NPV projects in order to increase their discretionary
powers over firm’s control of assets. Those companies with less growth opportunity may make
investments because they have available funds.
Debt financing is believed to put some financial discipline on the firm’s managers. This may imply that
low leverage firms are less subject to monitoring and hence, providing managers with more flexibility,
control and discretion. This argument allows us to hypothesize that less levered firms hold more cash.
25
Jenson’s (1986) theory predicts that larger firms tend to hold higher levels of cash because the ownership
pattern of such firms is very dispersed which results in managers having greater managerial discretions as
shareholders have little control over managers and, consequently, the higher probability that managers of
such firms will hold higher cash holdings.
Identification of Variables
This section attempts to evolve the variables to be identified from the literature and used in our study.
Although a large part of the previous studies of the determinants of corporate cash holding is empirical in
nature, we do find a number of hypotheses and theories in finance literature that attempt to describe the
relationship of various variables with the corporate cash holdings.
Determinants of Corporate Cash Holdings
A firm may hold cash for different motives. Three distinct motives have been identified in the finance
literature that has an influence on corporate cash holdings, namely transactional motive (Keynes, 1936),
precautionary motive and the financing motive (Delof, 2001). On the other hand, there are some reasons
to avoid high levels of cash holdings. Holding cash in hand can be least productive asset as it can generate
little or no accounting returns. Besides this, there may be a cost of carrying cash holdings since the money
can be better invested elsewhere. The objective of the study, therefore, is to examine the determinants of
the cash holdings in the Pakistan’s corporate sector.
Transactional motive
The timings of the cash outflows and inflows are rarely same for firms that necessitate maintaining some
level of cash holdings in order to serve as a buffer to meet short-term cash needs. Since long-term
investments are difficult and often costly to convert to readily available liquid assets and maintaining
large cash holdings are also expensive as cash or near-to-cash assets earns a little interest, a trade-off has
to be made between those costs and the interest, which can be earned. This trade-off leads to an optimal
cash level. Several models including Baumol (1952) and Miller & Orr (1967) describe this trade off. In
this study, we use the size of the Net Working Capital as a proxy for the transactional motive.
26
Firm Size
Large sized firms can have substantial benefits in terms of information asymmetry and possibility of
occurrence of financial distress. Vast finance literature has suggested less severe information asymmetry
for larger firms as they have an economy in managing about the firm (Petit & Singer, 1985; Brennen &
Huges, 1991). Hence, larger firms face lower transaction costs when they raise funds from external
sources (Barclay & Smith, 1996). Thus, it is expected there will be a negative relationship between the
firm size and investment in liquid assets. In this study, we measure size as Logarithm of total assets.
Consequently the null hypothesis is given by the following statement.
Hypothesis
H1: The larger the size of the firm the lower will be the investment in liquid assets
Net Working Capital (NWC)
The length of the cash conversion cycle may have a positive relationship with the higher cash holding as
the longer conversion period suggests that the firm keeps more cash. The length of the cash conversion is
related to the holding of working capital since a longer conversion implies a larger amount of receivables
and inventory.
H2: Firms with larger networking capital balance will tend to hold larger cash holdings. In
other words, there is a positive relationship between the amount of net working capital and the
level of cash holdings.
It is also argued that firms with higher levels of net working capital tend to hold less cash. In other words,
the more net working capital a firm holds, the less cash it needs since other current assets can be
converted to cash as and when needed. Hence, we can postulate an alternative hypothesis that there will
be a negative relationship between the levels of net working capital and cash holdings.
Precautionary motives
In an uncertain world where firm’s cash flows are volatile, we can expect a firm to keep liquid reserves as
a precautionary motive against an unexpected short fall in cash flows. This leads us to hypothesize a
positive relation between the level of uncertainty in cash flows and the level of liquid asset holdings by
the firm. Hence, we develop following hypothesis:
27
H3: The more uncertain the expected cash flows the higher will be the tendency for the firm to
keep liquid assets.
Following Yitikim (2001), we use the volatility of cash flows as a proxy for precautionary motives.
Financing motives
The pecking order theory of Myers & Majluf (1984) argues that firms have any preferred order of
financing where they prefer internal capital to external financing, and if financing requirements go
beyond the level of retained earnings, debt issues are preferred to equity issues. This pecking order theory
can be explained by two factors. Information asymmetry can lead to a reluctance of shareholders to accept
new equity issues. Secondly, external financing is expensive because of the transaction costs. So it can be
expected that firms are ready to build an internal capital market since liquid reserves allows management
to make investments that the financial market would not be willing to finance. The leverage and market to
book ratio are the two variables that are, therefore, taken in this study as a proxy for financing motives.
According to the pecking order theory, there is a negative relationship between levels of leverage and
liquid assets. Market-to-book ratio (MB ratio) is a good proxy for Tobin’s Q representing the growth
opportunities of the firms. We expect the MB ratio to have a positive relationship with cash holdings
since this ratio is a proxy for growth opportunities and firms with a high MB ratio have a greater
likelihood that they will have profitable investment opportunities in the future, and would tend to hoard
more cash to take advantage of those profitable investment opportunities.
These arguments lead to the formulation of the following two hypotheses:
H4: The higher the levels of leverage the lower will be the corporate cash holdings
H5: Firms with high growth opportunities will tend to hold larger amounts of cash
Effect of internal capital markets (Group Affiliations) on corporate
cash holding
Despite the importance of holding internal financial resources, recent research also emphasizes the role of
corporate-wide financial resources in perusing competitive advantages. According to Porter (1987),
corporations can create value by sharing rent-generating activities and transferring skills. Business groups
28
receive various benefits by sharing financial resources with group firms such as sharing the cost,
achieving economies of scales and sharing the risks.
Funds generated from internal sources for group firms can come from two alternative sources. Either a
reputed firm of the group generates funds using her reputation and makes available the funds to other
member companies of the group where the funds are needed. Alternatively, internal cash surpluses can be
re-directed among the firms in the group, without resorting to the capital market, leading to a more
efficient utilization of the cash.
Pakistani firms may have some incentives to develop the internal markets for mobilizing financial
resources. First, the group can control their subsidiaries/divisions more easily than relying on the external
capital market. Second, considering the fact that capital markets in Pakistan are poorly developed, this
might lead firms in developing and making use of the internal capital markets as one of their significant
sources of capital. Third, the multiple companies in a group provided the group with the added advantage
of internal capital markets. If a member firm performs poorly, her assets can be redeployed and combined
with another asset/firm in the group. On the other hand, an external provider of the firm will have to sell
the assets in the open market and would not be able to extract their full value. These factors may lead the
group to develop internal capital markets for financial resource mobilization and lead the firms to hold
lower cash holdings as the surplus cash can be mobilized in the group and deficient firms can be provided
with the cash as and when needed. Based on the above theoretical arguments and to capture the effect of
group affiliations on cash holdings, we formulate the following hypothesis:
H6: Companies with access to intra-group financing will tend to hold low levels of cash
Effect of corporate governance on corporate cash holdings
Firms may also hold excess cash for many other reasons. First, agency cost of free cash flow could
explain excess cash holdings. Managers may hold excess cash to peruse pet projects that would not be
otherwise sanctioned by the capital markets. Further, management may avoid making payouts to
shareholders to keep resources in his empire. Second, Jensen (1986) argues that if managers prefer growth
to profit they may invest free cash flows in the negative NPV projects. Shareholders are thus in a tradeoff
position between facing the agency problem of excess cash and losing the opportunities of higher returns.
If the corporate governance can protect the interests of shareholders, shareholders can then be free of
concern about the agency problem of excess cash and thus allow firms to hold a high level of cash for
high-return investment opportunities. Consequently, we state the following hypothesis:
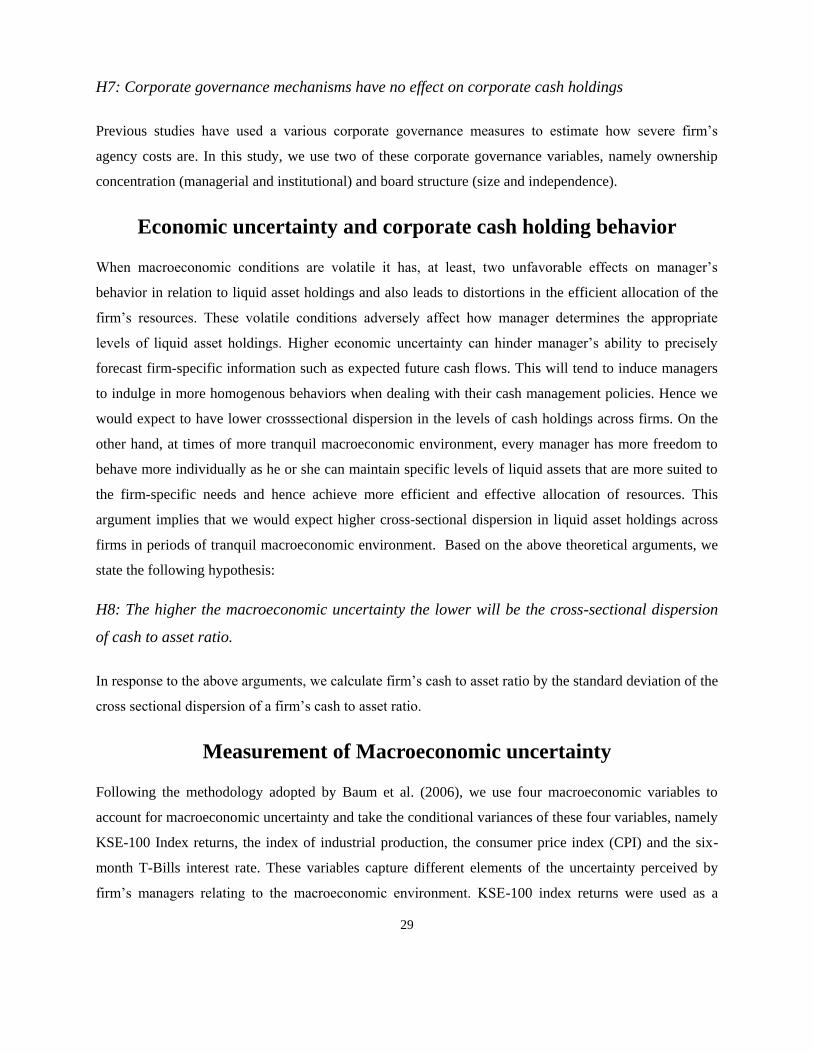
29
H7: Corporate governance mechanisms have no effect on corporate cash holdings
Previous studies have used a various corporate governance measures to estimate how severe firm’s
agency costs are. In this study, we use two of these corporate governance variables, namely ownership
concentration (managerial and institutional) and board structure (size and independence).
Economic uncertainty and corporate cash holding behavior
When macroeconomic conditions are volatile it has, at least, two unfavorable effects on manager’s
behavior in relation to liquid asset holdings and also leads to distortions in the efficient allocation of the
firm’s resources. These volatile conditions adversely affect how manager determines the appropriate
levels of liquid asset holdings. Higher economic uncertainty can hinder manager’s ability to precisely
forecast firm-specific information such as expected future cash flows. This will tend to induce managers
to indulge in more homogenous behaviors when dealing with their cash management policies. Hence we
would expect to have lower crosssectional dispersion in the levels of cash holdings across firms. On the
other hand, at times of more tranquil macroeconomic environment, every manager has more freedom to
behave more individually as he or she can maintain specific levels of liquid assets that are more suited to
the firm-specific needs and hence achieve more efficient and effective allocation of resources. This
argument implies that we would expect higher cross-sectional dispersion in liquid asset holdings across
firms in periods of tranquil macroeconomic environment. Based on the above theoretical arguments, we
state the following hypothesis:
H8: The higher the macroeconomic uncertainty the lower will be the cross-sectional dispersion
of cash to asset ratio.
In response to the above arguments, we calculate firm’s cash to asset ratio by the standard deviation of the
cross sectional dispersion of a firm’s cash to asset ratio.
Measurement of Macroeconomic uncertainty
Following the methodology adopted by Baum et al. (2006), we use four macroeconomic variables to
account for macroeconomic uncertainty and take the conditional variances of these four variables, namely
KSE-100 Index returns, the index of industrial production, the consumer price index (CPI) and the six-
month T-Bills interest rate. These variables capture different elements of the uncertainty perceived by
firm’s managers relating to the macroeconomic environment. KSE-100 index returns were used as a
30
measure of overall macroeconomic activity, whereas the index of industrial production is a narrower
measure and includes only industrial production. Interest rate focuses on financial market uncertainty.
Implications of corporate cash holdings
Motives for excess cash holdings
Firms may hold excess cash for a variety of other reasons, besides the three motives explained earlier,
namely transactional motive, financing motive and precautionary motives. First, according to agency cost
of free cash flows, managers may hold excess cash to pursue pet projects which otherwise may not be
approved by the competitive external capital market. Also, managers may be tempted to keep the
resources in their hands and thus avoid making payments to shareholders. Second, managers may also
hoard excess cash to guard against the unexpected shortages of cash for a variety of reasons, and, also
against any hostile attacks such as bankruptcy or against the threat of hostile takeovers and/or mergers.
Moreover, this argument can also be related to the use of the excess cash, the agency theory hints at the
overspending patterns of the free cash flows (excess cash flows). According to Jensen (1986), “if
managers prefer growth to profit, they may invest free cash flows in the negative NPV projects”. In
contrast to Jensen’s (1986) assertion, Stulz (1988) and Opler et al. (1999) state that there may be
persistence in the excess cash holdings by the corporate firms because of the risk aversion attitude of the
management. On the other hand, Pinkowitz, Stultz & Williamson (1999) attribute the excess cash
holdings by Japanese firms to the bank power whereby firms are compelled by the banks to maintain high
level of cash balances as the banks act as principal monitor and thus attempt to reduce their monitoring
costs.
The above arguments raise a question whether excess cash holdings by firms have any effect on firm’s
spending (investment) decisions. Two main possibilities may emerge from the above discussion. First,
when firms in the Pakistan’s corporate sector have more cash holdings than is actually required, it is
possible that they will invest more than what is required, according to the Jensen’s (1986) theory. Second,
persistence of excess cash holdings may suggest that firms would persist to hold excess cash rather than
squander the excess cash in less efficient or negative NPV projects. On the basis of these arguments we
formulate the following hypothesis:
H9: Excess cash holdings may be related to an increase in the capital expenditure
31
Chapter 4
Methodology and Data
In this chapter we first describe the data and its sources. The detailed methodology for determinants of
corporate cash holdings is presented and followed by a description of the methodology for inclusion of
other variables such as corporate governance variables and economic uncertainty and corporate cash
holding behavior.
Data description and sources
This study uses financial data of Pakistani firms listed on the Karachi Stock Exchange for a period of
thirteen years from 1998 to 2010. Initially, we start with all the active firms listed on the Karachi Stock
Exchange. As a standard practice in previous empirical studies on the subject, we exclude financial
companies (banks, insurance companies, mutual funds, asset management companies) from the sample
since financial firms may carry mandatory cash reserves to meet their statuary capital requirements. This
leaves us with a total of 421 non-financial firms. The sample was then screened using several criteria.
First, those firms were excluded from the sample that did not have the data for the whole sample period.
Second, firms that were delisted during the sample period were also excluded from the final sample. The
final sample consisted of 221 firms from different industries that constitute more than 90 percent of the
market capitalization. To examine the group-affiliation effects for cash holding patterns, 30 groups were
identified in the sample. Annexure-I provides details of the business groups for the sample.
Firm-specific accounting data were compiled from financial statements published in the company’s
annual reports. These financial variables include such items as cash and short-term investments, book
value of total assets, book value of stockholder’s equity, operating cash flows, net working capital, total
debt, and capital expenditures. Data for economic variables were sourced from the statistical bulletin, a
monthly publication by State Bank of Pakistan. The economic variables include inflation (Consumer
Price Index), interest rate (6-months T-Bills rate), and industrial production. Monthly closing values of
the Karachi Stock Exchange-100 Index (a value-weighted index of 100 companies) were included as a
proxy for the overall market. We hand-collect the non-financial items from the company’s annual reports
and include the total number of board members, including the executive and non-executive directors,
institutional ownership and managerial ownership. These variables are taken as proxy for corporate
governance.
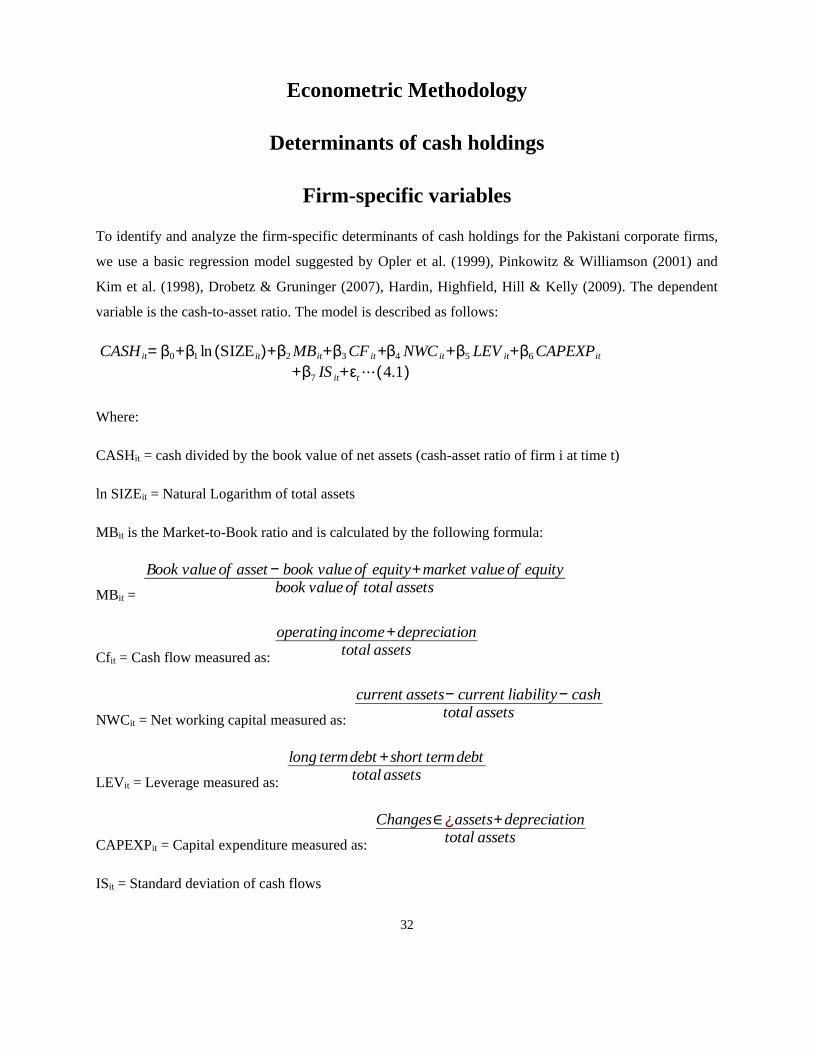
32
Econometric Methodology
Determinants of cash holdings
Firm-specific variables
To identify and analyze the firm-specific determinants of cash holdings for the Pakistani corporate firms,
we use a basic regression model suggested by Opler et al. (1999), Pinkowitz & Williamson (2001) and
Kim et al. (1998), Drobetz & Gruninger (2007), Hardin, Highfield, Hill & Kelly (2009). The dependent
variable is the cash-to-asset ratio. The model is described as follows:
CASH it= β0+β1 ln (SIZE it)+β2 MBit+β3 CF it+β4 NWC it+β5 LEV it+β6 CAPEXPit
+β7 IS it+εt⋯(4.1)
Where:
CASHit = cash divided by the book value of net assets (cash-asset ratio of firm i at time t)
ln SIZEit = Natural Logarithm of total assets
MBit is the Market-to-Book ratio and is calculated by the following formula:
MBit =
Book value of asset− book value of equity+market value of equitybook value of total assets
Cfit = Cash flow measured as:
operating income+depreciation
total assets
NWCit = Net working capital measured as:
current assets− current liability− cashtotal assets
LEVit = Leverage measured as:
long termdebt +short termdebttotal assets
CAPEXPit = Capital expenditure measured as:
Changes∈¿assets+depreciationtotal assets
ISit = Standard deviation of cash flows
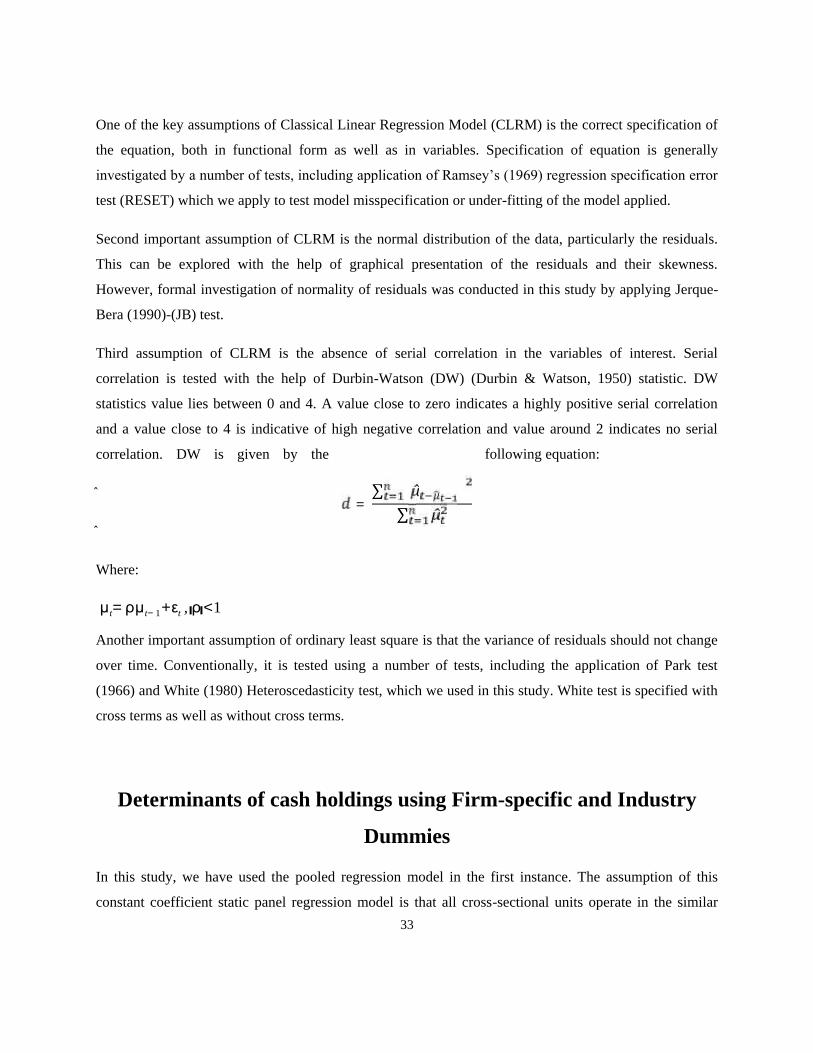
33
One of the key assumptions of Classical Linear Regression Model (CLRM) is the correct specification of
the equation, both in functional form as well as in variables. Specification of equation is generally
investigated by a number of tests, including application of Ramsey’s (1969) regression specification error
test (RESET) which we apply to test model misspecification or under-fitting of the model applied.
Second important assumption of CLRM is the normal distribution of the data, particularly the residuals.
This can be explored with the help of graphical presentation of the residuals and their skewness.
However, formal investigation of normality of residuals was conducted in this study by applying Jerque-
Bera (1990)-(JB) test.
Third assumption of CLRM is the absence of serial correlation in the variables of interest. Serial
correlation is tested with the help of Durbin-Watson (DW) (Durbin & Watson, 1950) statistic. DW
statistics value lies between 0 and 4. A value close to zero indicates a highly positive serial correlation
and a value close to 4 is indicative of high negative correlation and value around 2 indicates no serial
correlation. DW is given by the following equation:
Where:
μt= ρμt− 1+εt ,∣ρ∣<1
Another important assumption of ordinary least square is that the variance of residuals should not change
over time. Conventionally, it is tested using a number of tests, including the application of Park test
(1966) and White (1980) Heteroscedasticity test, which we used in this study. White test is specified with
cross terms as well as without cross terms.
Determinants of cash holdings using Firm-specific and Industry
Dummies
In this study, we have used the pooled regression model in the first instance. The assumption of this
constant coefficient static panel regression model is that all cross-sectional units operate in the similar
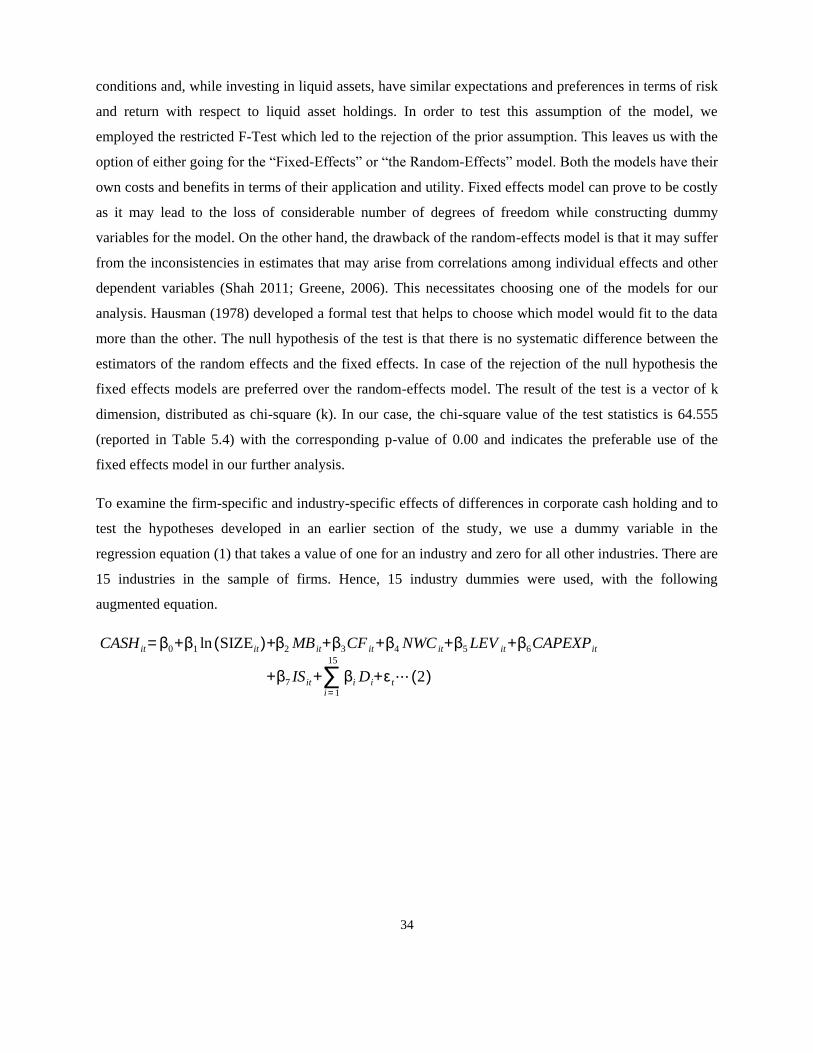
34
conditions and, while investing in liquid assets, have similar expectations and preferences in terms of risk
and return with respect to liquid asset holdings. In order to test this assumption of the model, we
employed the restricted F-Test which led to the rejection of the prior assumption. This leaves us with the
option of either going for the “Fixed-Effects” or “the Random-Effects” model. Both the models have their
own costs and benefits in terms of their application and utility. Fixed effects model can prove to be costly
as it may lead to the loss of considerable number of degrees of freedom while constructing dummy
variables for the model. On the other hand, the drawback of the random-effects model is that it may suffer
from the inconsistencies in estimates that may arise from correlations among individual effects and other
dependent variables (Shah 2011; Greene, 2006). This necessitates choosing one of the models for our
analysis. Hausman (1978) developed a formal test that helps to choose which model would fit to the data
more than the other. The null hypothesis of the test is that there is no systematic difference between the
estimators of the random effects and the fixed effects. In case of the rejection of the null hypothesis the
fixed effects models are preferred over the random-effects model. The result of the test is a vector of k
dimension, distributed as chi-square (k). In our case, the chi-square value of the test statistics is 64.555
(reported in Table 5.4) with the corresponding p-value of 0.00 and indicates the preferable use of the
fixed effects model in our further analysis.
To examine the firm-specific and industry-specific effects of differences in corporate cash holding and to
test the hypotheses developed in an earlier section of the study, we use a dummy variable in the
regression equation (1) that takes a value of one for an industry and zero for all other industries. There are
15 industries in the sample of firms. Hence, 15 industry dummies were used, with the following
augmented equation.
CASH it=β0+β1 ln (SIZEit)+β2 MB it+β3CF it+β4 NWC it+β5 LEV it+β6CAPEXPit
+β7 ISit+∑i = 1
15
βi Di+ε t⋯ (2)
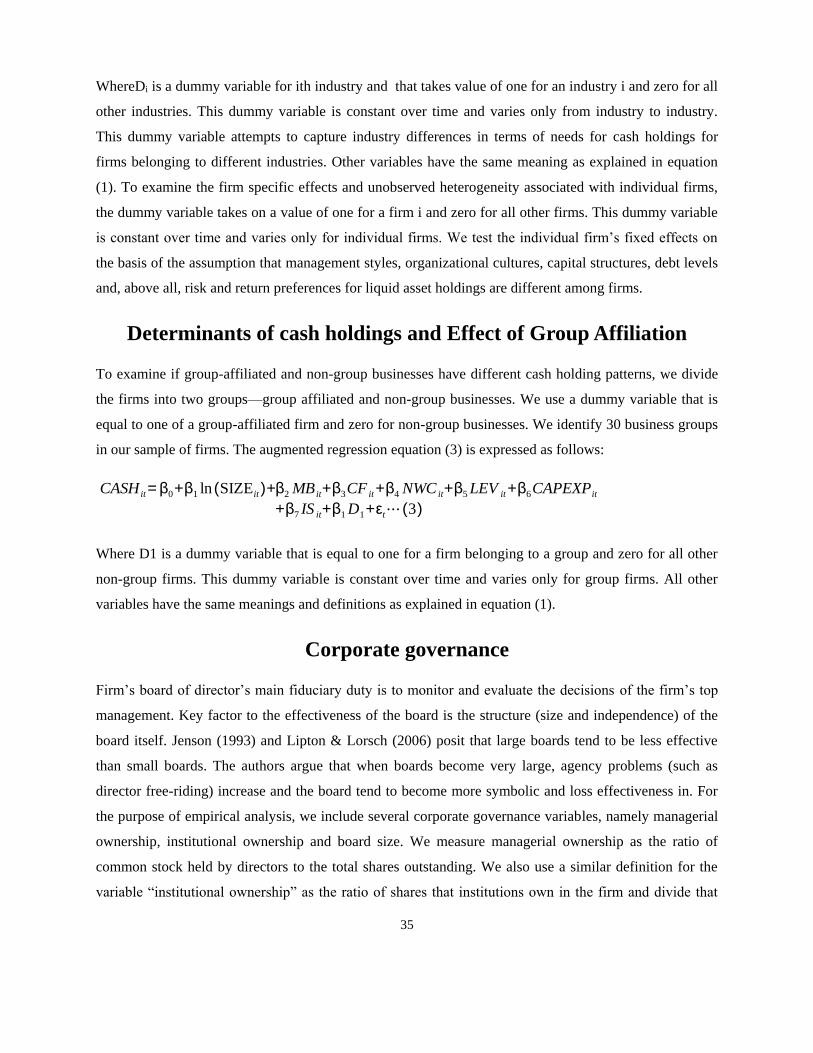
35
WhereDi is a dummy variable for ith industry and that takes value of one for an industry i and zero for all
other industries. This dummy variable is constant over time and varies only from industry to industry.
This dummy variable attempts to capture industry differences in terms of needs for cash holdings for
firms belonging to different industries. Other variables have the same meaning as explained in equation
(1). To examine the firm specific effects and unobserved heterogeneity associated with individual firms,
the dummy variable takes on a value of one for a firm i and zero for all other firms. This dummy variable
is constant over time and varies only for individual firms. We test the individual firm’s fixed effects on
the basis of the assumption that management styles, organizational cultures, capital structures, debt levels
and, above all, risk and return preferences for liquid asset holdings are different among firms.
Determinants of cash holdings and Effect of Group Affiliation
To examine if group-affiliated and non-group businesses have different cash holding patterns, we divide
the firms into two groups—group affiliated and non-group businesses. We use a dummy variable that is
equal to one of a group-affiliated firm and zero for non-group businesses. We identify 30 business groups
in our sample of firms. The augmented regression equation (3) is expressed as follows:
CASH it=β0+β1 ln (SIZEit)+β2 MB it+β3CF it+β4 NWC it+β5 LEV it+β6CAPEXPit
+β7 IS it+β1 D1+εt⋯ (3)
Where D1 is a dummy variable that is equal to one for a firm belonging to a group and zero for all other
non-group firms. This dummy variable is constant over time and varies only for group firms. All other
variables have the same meanings and definitions as explained in equation (1).
Corporate governance
Firm’s board of director’s main fiduciary duty is to monitor and evaluate the decisions of the firm’s top
management. Key factor to the effectiveness of the board is the structure (size and independence) of the
board itself. Jenson (1993) and Lipton & Lorsch (2006) posit that large boards tend to be less effective
than small boards. The authors argue that when boards become very large, agency problems (such as
director free-riding) increase and the board tend to become more symbolic and loss effectiveness in. For
the purpose of empirical analysis, we include several corporate governance variables, namely managerial
ownership, institutional ownership and board size. We measure managerial ownership as the ratio of
common stock held by directors to the total shares outstanding. We also use a similar definition for the
variable “institutional ownership” as the ratio of shares that institutions own in the firm and divide that
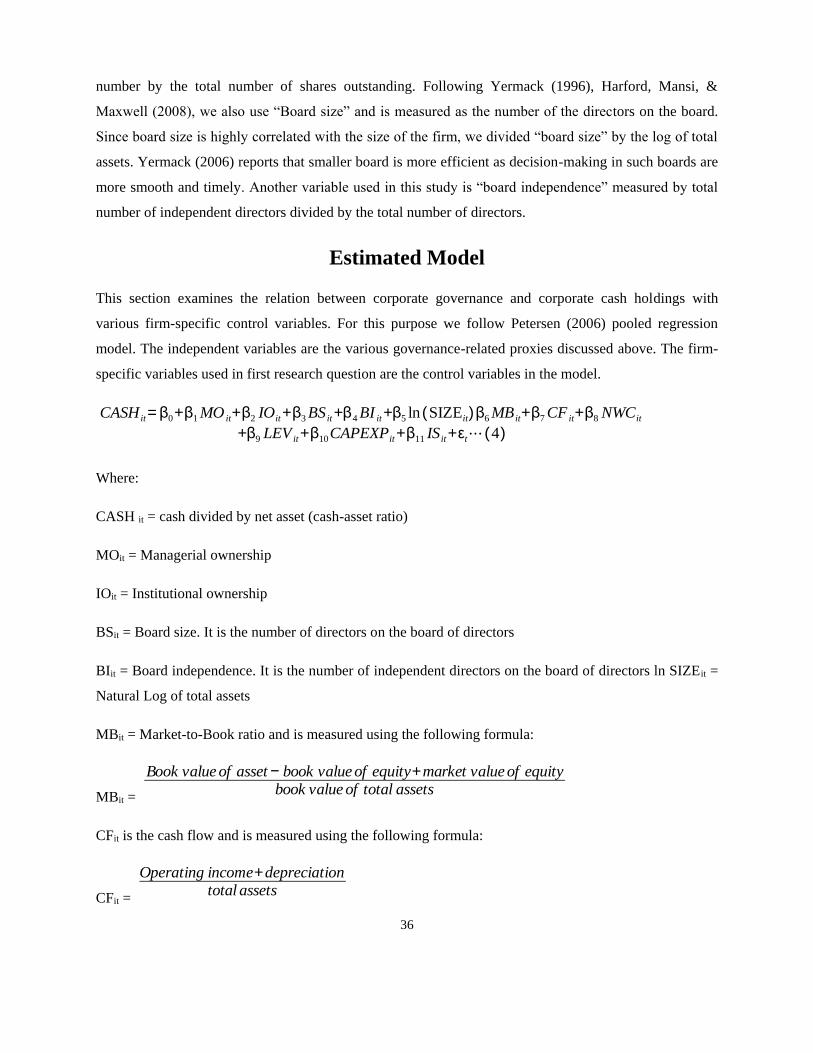
36
number by the total number of shares outstanding. Following Yermack (1996), Harford, Mansi, &
Maxwell (2008), we also use “Board size” and is measured as the number of the directors on the board.
Since board size is highly correlated with the size of the firm, we divided “board size” by the log of total
assets. Yermack (2006) reports that smaller board is more efficient as decision-making in such boards are
more smooth and timely. Another variable used in this study is “board independence” measured by total
number of independent directors divided by the total number of directors.
Estimated Model
This section examines the relation between corporate governance and corporate cash holdings with
various firm-specific control variables. For this purpose we follow Petersen (2006) pooled regression
model. The independent variables are the various governance-related proxies discussed above. The firm-
specific variables used in first research question are the control variables in the model.
CASH it=β0+β1 MO it+β2 IOit+β3 BS it+β4 BI it+β5 ln (SIZEit)β6 MB it+β7 CF it+β8 NWCit
+β9 LEV it+β10CAPEXPit+β11 IS it+εt⋯ (4)
Where:
CASH it = cash divided by net asset (cash-asset ratio)
MOit = Managerial ownership
IOit = Institutional ownership
BSit = Board size. It is the number of directors on the board of directors
BIit = Board independence. It is the number of independent directors on the board of directors ln SIZEit =
Natural Log of total assets
MBit = Market-to-Book ratio and is measured using the following formula:
MBit =
Book value of asset− book value of equity+market value of equitybook value of total assets
CFit is the cash flow and is measured using the following formula:
CFit =
Operating income+depreciationtotal assets
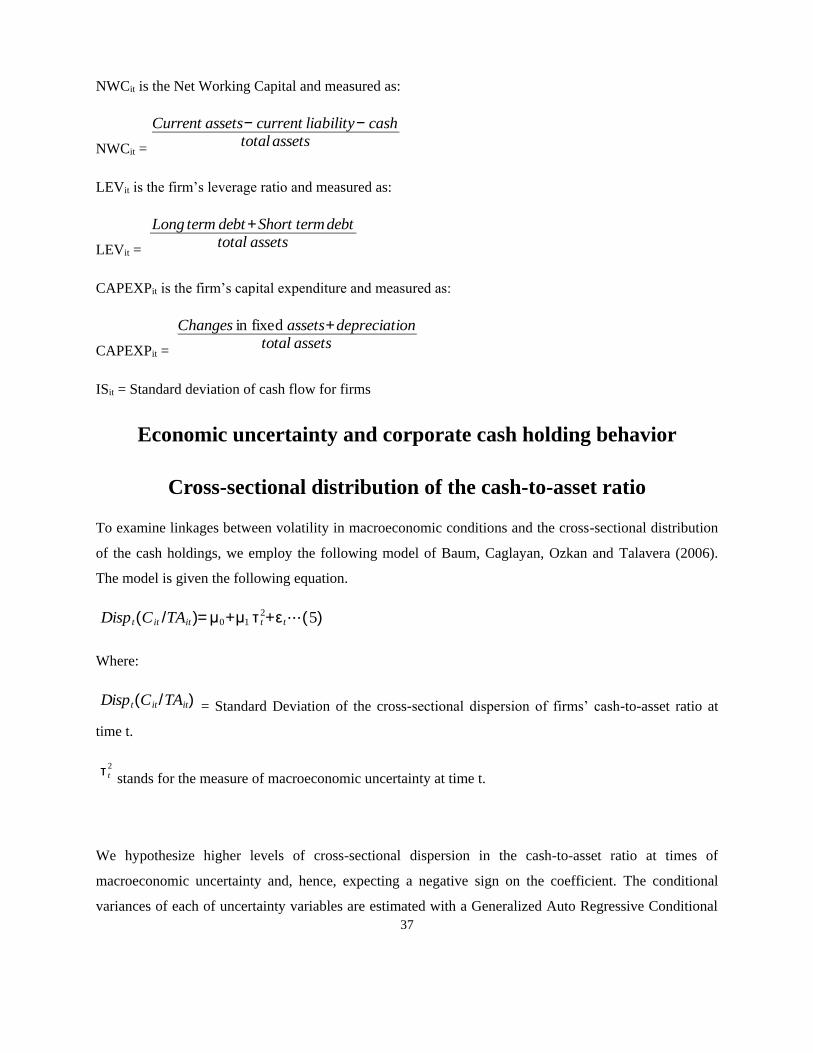
37
NWCit is the Net Working Capital and measured as:
NWCit =
Current assets− current liability− cashtotal assets
LEVit is the firm’s leverage ratio and measured as:
LEVit =
Long term debt+Short termdebttotal assets
CAPEXPit is the firm’s capital expenditure and measured as:
CAPEXPit =
Changes in fixed assets+depreciationtotal assets
ISit = Standard deviation of cash flow for firms
Economic uncertainty and corporate cash holding behavior
Cross-sectional distribution of the cash-to-asset ratio
To examine linkages between volatility in macroeconomic conditions and the cross-sectional distribution
of the cash holdings, we employ the following model of Baum, Caglayan, Ozkan and Talavera (2006).
The model is given the following equation.
Disp t(C it /TAit)=μ0+μ1 τ t2+εt⋯(5)
Where:
Dispt(Cit /TAit) = Standard Deviation of the cross-sectional dispersion of firms’ cash-to-asset ratio at
time t.
τ t2
stands for the measure of macroeconomic uncertainty at time t.
We hypothesize higher levels of cross-sectional dispersion in the cash-to-asset ratio at times of
macroeconomic uncertainty and, hence, expecting a negative sign on the coefficient. The conditional
variances of each of uncertainty variables are estimated with a Generalized Auto Regressive Conditional
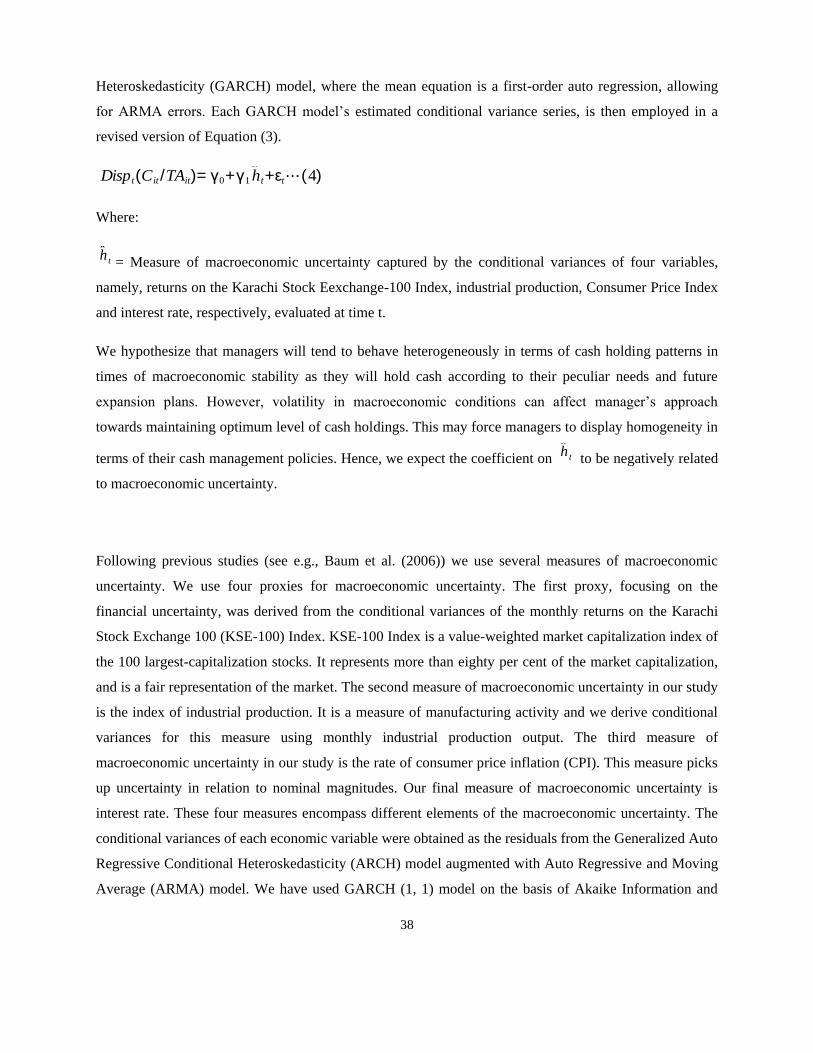
38
Heteroskedasticity (GARCH) model, where the mean equation is a first-order auto regression, allowing
for ARMA errors. Each GARCH model’s estimated conditional variance series, is then employed in a
revised version of Equation (3).
Dispt(Cit /TAit)= γ0+γ1 ht+εt⋯(4)
Where:
h t = Measure of macroeconomic uncertainty captured by the conditional variances of four variables,
namely, returns on the Karachi Stock Eexchange-100 Index, industrial production, Consumer Price Index
and interest rate, respectively, evaluated at time t.
We hypothesize that managers will tend to behave heterogeneously in terms of cash holding patterns in
times of macroeconomic stability as they will hold cash according to their peculiar needs and future
expansion plans. However, volatility in macroeconomic conditions can affect manager’s approach
towards maintaining optimum level of cash holdings. This may force managers to display homogeneity in
terms of their cash management policies. Hence, we expect the coefficient on h t to be negatively related
to macroeconomic uncertainty.
Following previous studies (see e.g., Baum et al. (2006)) we use several measures of macroeconomic
uncertainty. We use four proxies for macroeconomic uncertainty. The first proxy, focusing on the
financial uncertainty, was derived from the conditional variances of the monthly returns on the Karachi
Stock Exchange 100 (KSE-100) Index. KSE-100 Index is a value-weighted market capitalization index of
the 100 largest-capitalization stocks. It represents more than eighty per cent of the market capitalization,
and is a fair representation of the market. The second measure of macroeconomic uncertainty in our study
is the index of industrial production. It is a measure of manufacturing activity and we derive conditional
variances for this measure using monthly industrial production output. The third measure of
macroeconomic uncertainty in our study is the rate of consumer price inflation (CPI). This measure picks
up uncertainty in relation to nominal magnitudes. Our final measure of macroeconomic uncertainty is
interest rate. These four measures encompass different elements of the macroeconomic uncertainty. The
conditional variances of each economic variable were obtained as the residuals from the Generalized Auto
Regressive Conditional Heteroskedasticity (ARCH) model augmented with Auto Regressive and Moving
Average (ARMA) model. We have used GARCH (1, 1) model on the basis of Akaike Information and
39
Schwartz Information Criteria. Through this model, it is possible that the dispersion in the cash holing
ratio across firms can be directly related to the proxies of volatility in the macroeconomic environment.
Effect of excess cash holdings on investments
The optimal level of cash a firm can hold in her balance sheet can be determined from the regression
equation (2) while to examine the effect of excess cash on the firm’s capital expenditures we use a
measure of excess cash calculated from the residuals of the equation (2). Excess cash held by a firm is
thus the difference between actual cash holdings and the cash holdings predicted by the model. The effect
of excess cash on spending pattern is explained by how capital expenditure in next year (that is, year t+1)
is related to positive excess cash in the current year (that is, year t). We separate firm-years into quartiles
on the basis of positive excess cash. In each quartile, we distribute the firms into high Market-to-book
(MB) ratio and low market-to-book ratio. If MB ratio can be used as a proxy for the presence of profitable
growth opportunities the agency cost of the managerial discretion are small in high MB ratio firms as
compared to the low MB ratio firms. We compare mean (average) capital expenditure values of high MB
ratio firms with the low MB ratio firms in each quartile and also compare mean capital expenditure values
across quartiles in the same MB ratio levels. If we don’t find any systematic pattern in changes in capital
expenditures for both high MB ratio and low MB ratio firms then that will suggest that there will be no
agency-related problems for low MB ratio firms.
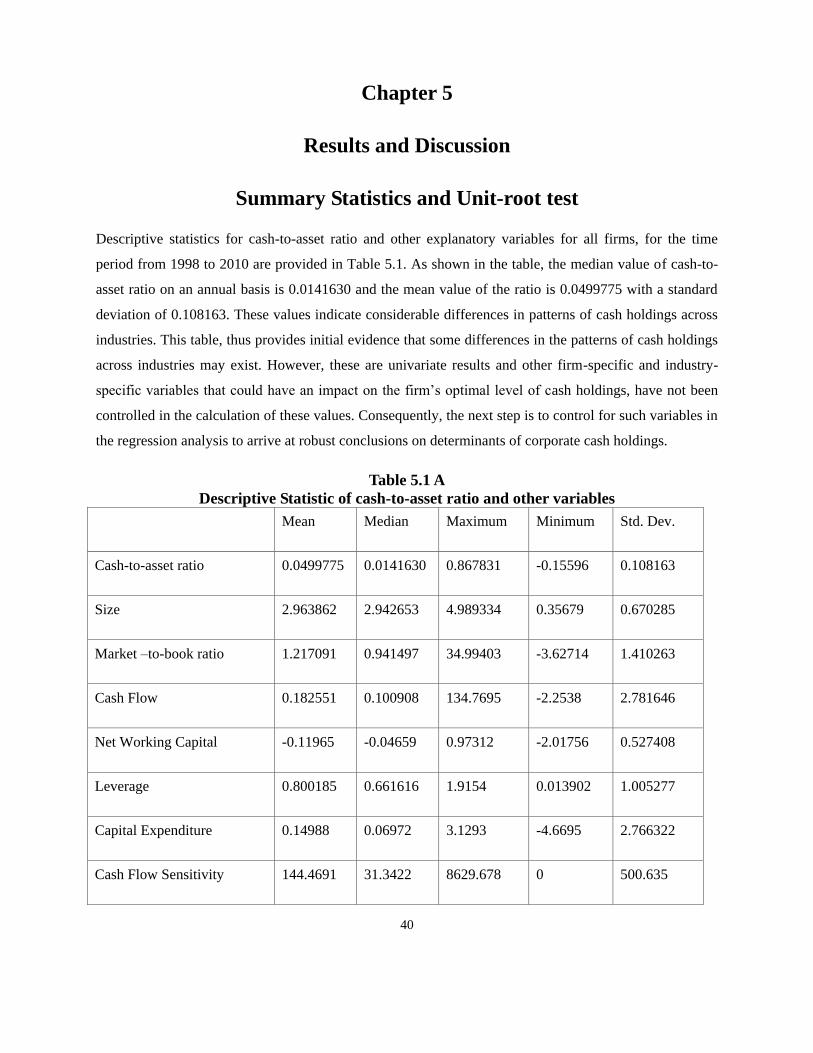
40
Chapter 5
Results and Discussion
Summary Statistics and Unit-root test
Descriptive statistics for cash-to-asset ratio and other explanatory variables for all firms, for the time
period from 1998 to 2010 are provided in Table 5.1. As shown in the table, the median value of cash-to-
asset ratio on an annual basis is 0.0141630 and the mean value of the ratio is 0.0499775 with a standard
deviation of 0.108163. These values indicate considerable differences in patterns of cash holdings across
industries. This table, thus provides initial evidence that some differences in the patterns of cash holdings
across industries may exist. However, these are univariate results and other firm-specific and industry-
specific variables that could have an impact on the firm’s optimal level of cash holdings, have not been
controlled in the calculation of these values. Consequently, the next step is to control for such variables in
the regression analysis to arrive at robust conclusions on determinants of corporate cash holdings.
Table 5.1 A
Descriptive Statistic of cash-to-asset ratio and other variables Mean Median Maximum Minimum Std. Dev.
Cash-to-asset ratio 0.0499775 0.0141630 0.867831 -0.15596 0.108163
Size 2.963862 2.942653 4.989334 0.35679 0.670285
Market –to-book ratio 1.217091 0.941497 34.99403 -3.62714 1.410263
Cash Flow 0.182551 0.100908 134.7695 -2.2538 2.781646
Net Working Capital -0.11965 -0.04659 0.97312 -2.01756 0.527408
Leverage 0.800185 0.661616 1.9154 0.013902 1.005277
Capital Expenditure 0.14988 0.06972 3.1293 -4.6695 2.766322
Cash Flow Sensitivity 144.4691 31.3422 8629.678 0 500.635
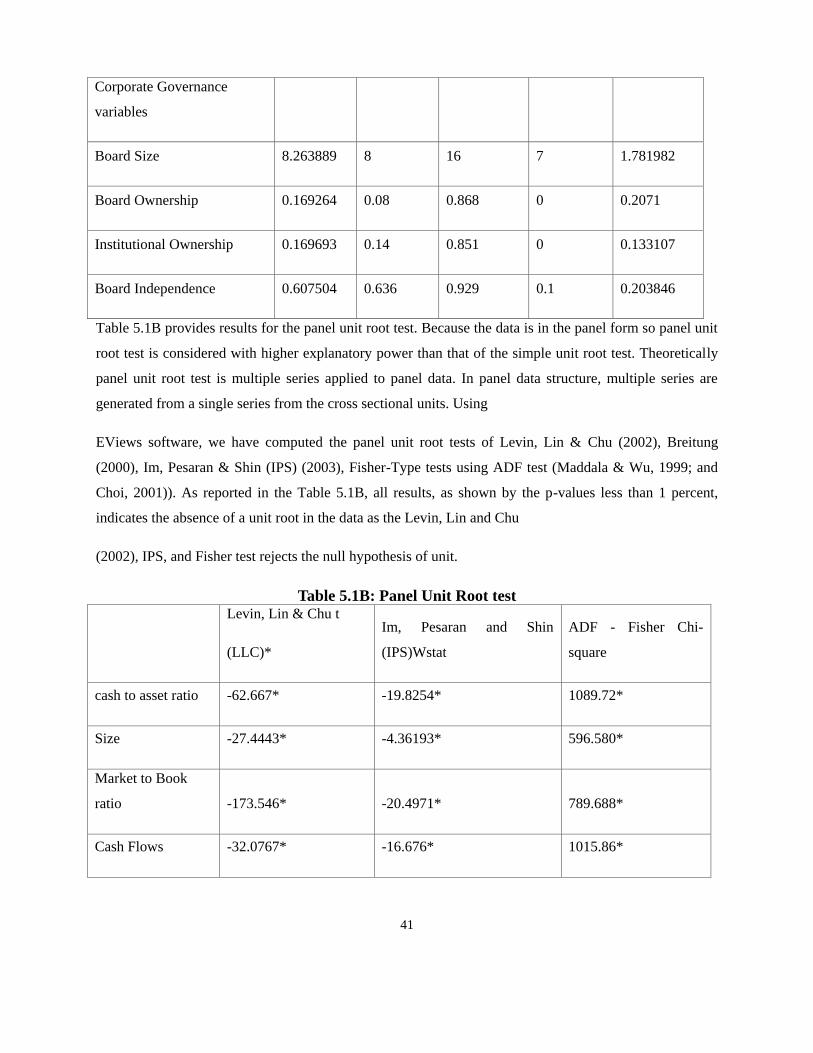
41
Corporate Governance
variables
Board Size 8.263889 8 16 7 1.781982
Board Ownership 0.169264 0.08 0.868 0 0.2071
Institutional Ownership 0.169693 0.14 0.851 0 0.133107
Board Independence 0.607504 0.636 0.929 0.1 0.203846
Table 5.1B provides results for the panel unit root test. Because the data is in the panel form so panel unit
root test is considered with higher explanatory power than that of the simple unit root test. Theoretically
panel unit root test is multiple series applied to panel data. In panel data structure, multiple series are
generated from a single series from the cross sectional units. Using
EViews software, we have computed the panel unit root tests of Levin, Lin & Chu (2002), Breitung
(2000), Im, Pesaran & Shin (IPS) (2003), Fisher-Type tests using ADF test (Maddala & Wu, 1999; and
Choi, 2001)). As reported in the Table 5.1B, all results, as shown by the p-values less than 1 percent,
indicates the absence of a unit root in the data as the Levin, Lin and Chu
(2002), IPS, and Fisher test rejects the null hypothesis of unit.
Table 5.1B: Panel Unit Root test Levin, Lin & Chu t
(LLC)*
Im, Pesaran and Shin
(IPS)Wstat
ADF - Fisher Chi-
square
cash to asset ratio -62.667* -19.8254* 1089.72*
Size -27.4443* -4.36193* 596.580*
Market to Book
ratio -173.546* -20.4971* 789.688*
Cash Flows -32.0767* -16.676* 1015.86*
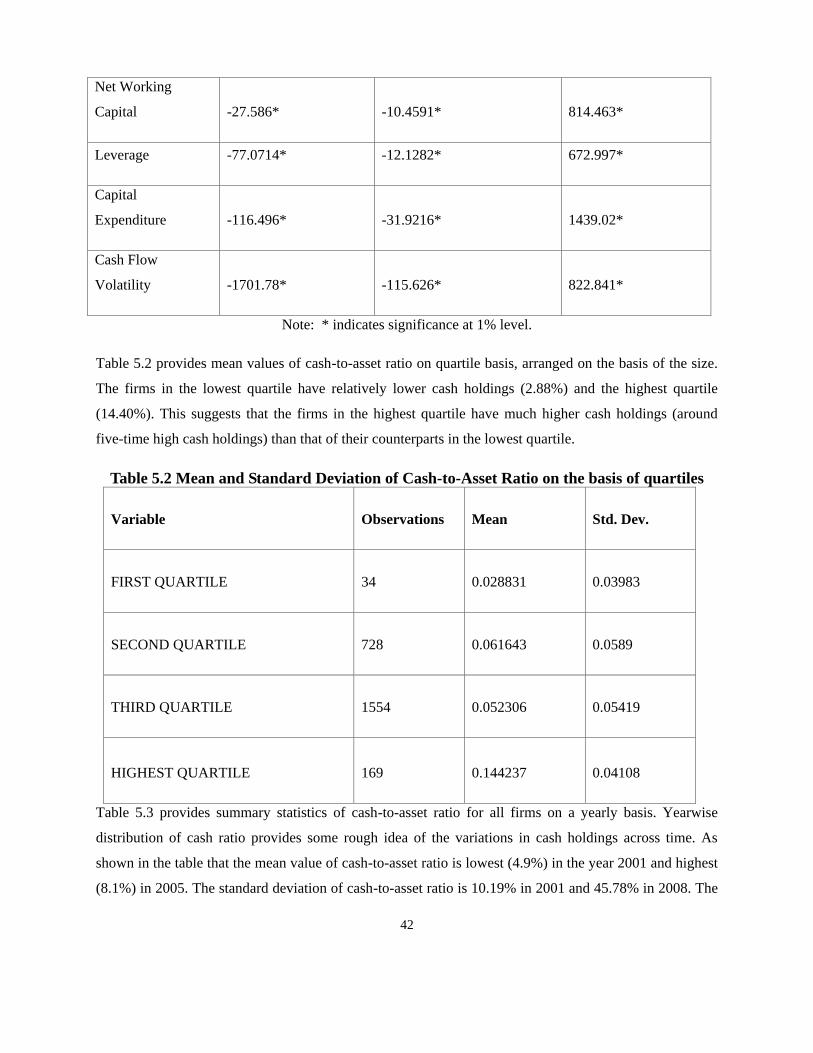
42
Net Working
Capital -27.586* -10.4591* 814.463*
Leverage -77.0714* -12.1282* 672.997*
Capital
Expenditure -116.496* -31.9216* 1439.02*
Cash Flow
Volatility -1701.78* -115.626* 822.841*
Note: * indicates significance at 1% level.
Table 5.2 provides mean values of cash-to-asset ratio on quartile basis, arranged on the basis of the size.
The firms in the lowest quartile have relatively lower cash holdings (2.88%) and the highest quartile
(14.40%). This suggests that the firms in the highest quartile have much higher cash holdings (around
five-time high cash holdings) than that of their counterparts in the lowest quartile.
Table 5.2 Mean and Standard Deviation of Cash-to-Asset Ratio on the basis of quartiles
Variable Observations Mean Std. Dev.
FIRST QUARTILE 34 0.028831 0.03983
SECOND QUARTILE 728 0.061643 0.0589
THIRD QUARTILE 1554 0.052306 0.05419
HIGHEST QUARTILE 169 0.144237 0.04108
Table 5.3 provides summary statistics of cash-to-asset ratio for all firms on a yearly basis. Yearwise
distribution of cash ratio provides some rough idea of the variations in cash holdings across time. As
shown in the table that the mean value of cash-to-asset ratio is lowest (4.9%) in the year 2001 and highest
(8.1%) in 2005. The standard deviation of cash-to-asset ratio is 10.19% in 2001 and 45.78% in 2008. The
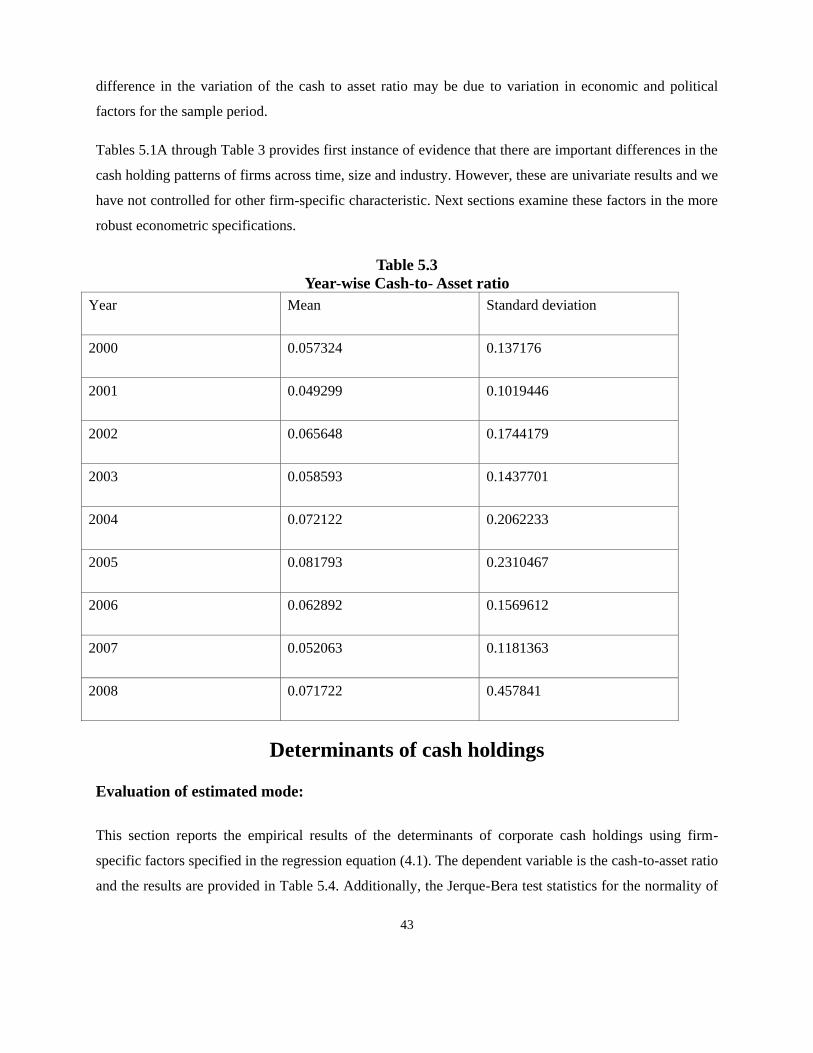
43
difference in the variation of the cash to asset ratio may be due to variation in economic and political
factors for the sample period.
Tables 5.1A through Table 3 provides first instance of evidence that there are important differences in the
cash holding patterns of firms across time, size and industry. However, these are univariate results and we
have not controlled for other firm-specific characteristic. Next sections examine these factors in the more
robust econometric specifications.
Table 5.3
Year-wise Cash-to- Asset ratio
Year Mean Standard deviation
2000 0.057324 0.137176
2001 0.049299 0.1019446
2002 0.065648 0.1744179
2003 0.058593 0.1437701
2004 0.072122 0.2062233
2005 0.081793 0.2310467
2006 0.062892 0.1569612
2007 0.052063 0.1181363
2008 0.071722 0.457841
Determinants of cash holdings
Evaluation of estimated mode:
This section reports the empirical results of the determinants of corporate cash holdings using firm-
specific factors specified in the regression equation (4.1). The dependent variable is the cash-to-asset ratio
and the results are provided in Table 5.4. Additionally, the Jerque-Bera test statistics for the normality of
44
residual test are also reported in the table. The null hypothesis of the Jerque-Bera test is that the data is
normally distributed. The test statistics are 0.745 with a corresponding p-value of 0.730. The p-value
indicates that we fail to reject the null hypothesis of normality of data. Further, the Durbin-Watson test
statistics is 1.898 which is close to the value of 2.00 and shows that the serial correlation problem is not
severe. We also conducted White’s Heteroscedasticity test and results are reported in the table. F-test
value of 0.53 with corresponding p-value of 0.370 fails to reject the null hypothesis that the series is
homoscedastic. Finally, Ramsey test statistics are also reported in the table. The p-value of 0.460 fails to
reject the null hypothesis of no specification error in our model.
Interpretation of estimated model: Empirical results, as reported in Table 5.4, show that the coefficients
of most of the variables are consistent with the theoretical predictions. For the purpose of looking at
whether or not the transactional motive is well explained, we investigate the coefficient of the firm size
and net working capital. The coefficient of the firm size is negative and statistically significant, indicating
that cash to asset ratio of the Pakistani firms is affected by the size of the firm. This result is consistent
with some of the theories such as information asymmetry theory, the financial distress hypothesis and the
transaction costs hypothesis that suggests that the higher fixed processing fee for obtaining external
financing discourages smaller firms to go for external financing and hence prompting them to hold more
liquid assets. Nevertheless, these results are not in line with the argument of Opler et al (1995) that larger
firms have more capacity to accumulate cash since they are presumably more profitable.
The coefficient of net working capital can affect either negatively or positively on corporate cash
holdings. In Pakistani corporations, coefficient of net working capital is negative, but statistically not
different than zero, which indicates that firms with higher levels of networking capital tend to hold less
cash. In other words, the more a firm holds networking capital the less cash it needs since other current
assets are cash substitutes and can be converted to cash. This result is consistent with some of the earlier
studies such as Islam (2012), Noguera & Pech (2012). On the basis of these results we can say that
Pakistani firm’s cash to net asset ratio is closely related to the transactional motive, as indicated by the
negative signs on variables of the firm size and net working capital.
The proxy for the precautionary need used in this study is the volatility of cash flow, measured as a
standard deviation of operating cash flows. The coefficient of this variable is positive and statistically
significant, which suggests that Pakistani companies are sensitive to the volatility of cash flow and that
firm’s cash holdings are highly influenced by a precautionary need. These results are consistent with
Diamond (1984) and Stiglitz & Weiss (1981) and Shah (2011). According to these studies, the firm’s
credit quality is determined by the information asymmetry between the firm and its lender. The higher the
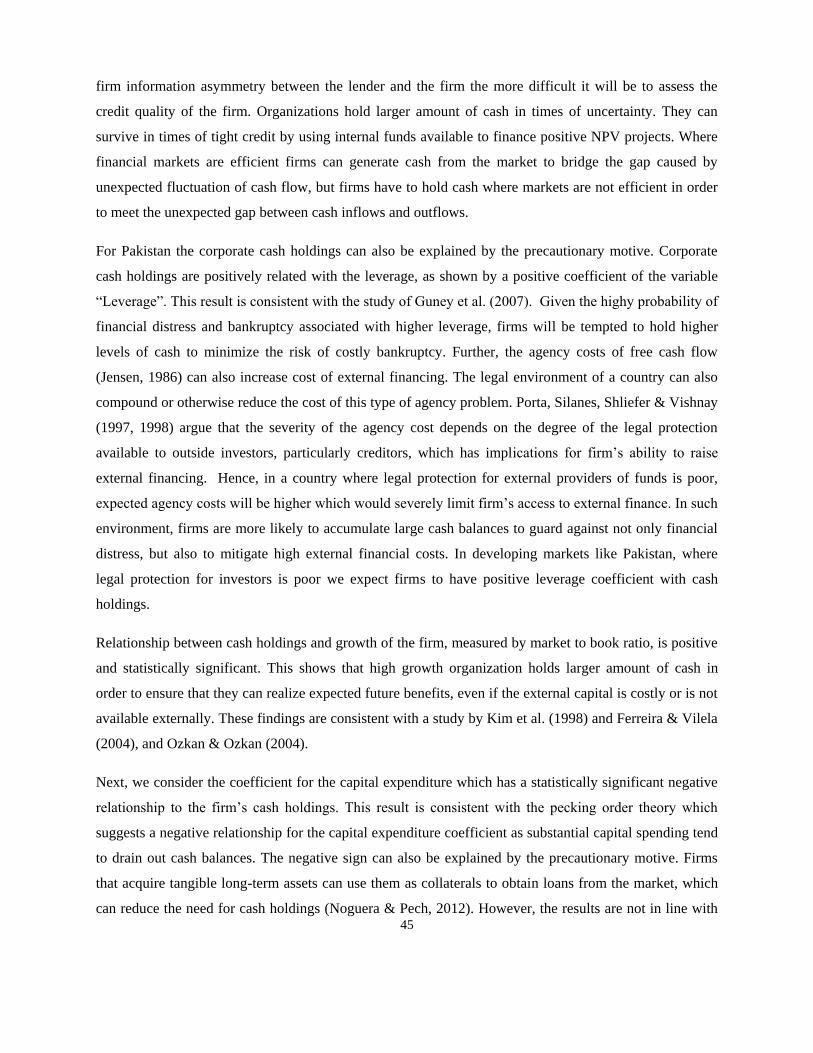
45
firm information asymmetry between the lender and the firm the more difficult it will be to assess the
credit quality of the firm. Organizations hold larger amount of cash in times of uncertainty. They can
survive in times of tight credit by using internal funds available to finance positive NPV projects. Where
financial markets are efficient firms can generate cash from the market to bridge the gap caused by
unexpected fluctuation of cash flow, but firms have to hold cash where markets are not efficient in order
to meet the unexpected gap between cash inflows and outflows.
For Pakistan the corporate cash holdings can also be explained by the precautionary motive. Corporate
cash holdings are positively related with the leverage, as shown by a positive coefficient of the variable
“Leverage”. This result is consistent with the study of Guney et al. (2007). Given the highy probability of
financial distress and bankruptcy associated with higher leverage, firms will be tempted to hold higher
levels of cash to minimize the risk of costly bankruptcy. Further, the agency costs of free cash flow
(Jensen, 1986) can also increase cost of external financing. The legal environment of a country can also
compound or otherwise reduce the cost of this type of agency problem. Porta, Silanes, Shliefer & Vishnay
(1997, 1998) argue that the severity of the agency cost depends on the degree of the legal protection
available to outside investors, particularly creditors, which has implications for firm’s ability to raise
external financing. Hence, in a country where legal protection for external providers of funds is poor,
expected agency costs will be higher which would severely limit firm’s access to external finance. In such
environment, firms are more likely to accumulate large cash balances to guard against not only financial
distress, but also to mitigate high external financial costs. In developing markets like Pakistan, where
legal protection for investors is poor we expect firms to have positive leverage coefficient with cash
holdings.
Relationship between cash holdings and growth of the firm, measured by market to book ratio, is positive
and statistically significant. This shows that high growth organization holds larger amount of cash in
order to ensure that they can realize expected future benefits, even if the external capital is costly or is not
available externally. These findings are consistent with a study by Kim et al. (1998) and Ferreira & Vilela
(2004), and Ozkan & Ozkan (2004).
Next, we consider the coefficient for the capital expenditure which has a statistically significant negative
relationship to the firm’s cash holdings. This result is consistent with the pecking order theory which
suggests a negative relationship for the capital expenditure coefficient as substantial capital spending tend
to drain out cash balances. The negative sign can also be explained by the precautionary motive. Firms
that acquire tangible long-term assets can use them as collaterals to obtain loans from the market, which
can reduce the need for cash holdings (Noguera & Pech, 2012). However, the results are not in line with
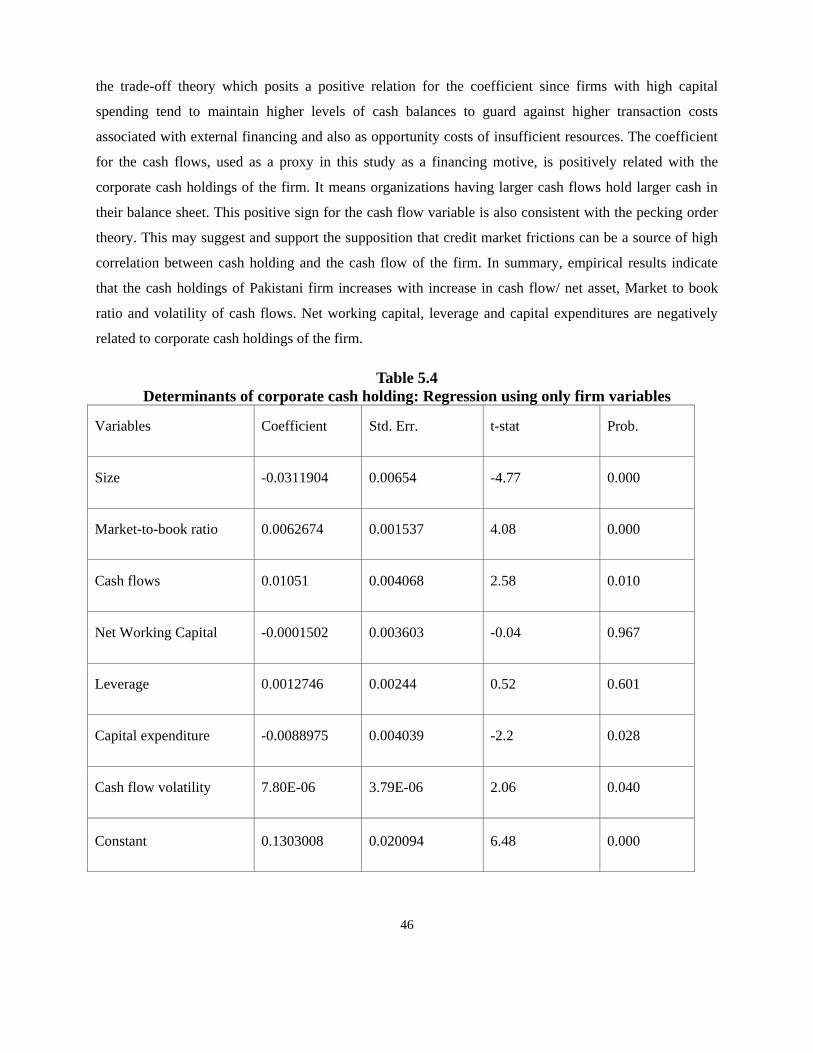
46
the trade-off theory which posits a positive relation for the coefficient since firms with high capital
spending tend to maintain higher levels of cash balances to guard against higher transaction costs
associated with external financing and also as opportunity costs of insufficient resources. The coefficient
for the cash flows, used as a proxy in this study as a financing motive, is positively related with the
corporate cash holdings of the firm. It means organizations having larger cash flows hold larger cash in
their balance sheet. This positive sign for the cash flow variable is also consistent with the pecking order
theory. This may suggest and support the supposition that credit market frictions can be a source of high
correlation between cash holding and the cash flow of the firm. In summary, empirical results indicate
that the cash holdings of Pakistani firm increases with increase in cash flow/ net asset, Market to book
ratio and volatility of cash flows. Net working capital, leverage and capital expenditures are negatively
related to corporate cash holdings of the firm.
Table 5.4
Determinants of corporate cash holding: Regression using only firm variables
Variables Coefficient Std. Err. t-stat Prob.
Size -0.0311904 0.00654 -4.77 0.000
Market-to-book ratio 0.0062674 0.001537 4.08 0.000
Cash flows 0.01051 0.004068 2.58 0.010
Net Working Capital -0.0001502 0.003603 -0.04 0.967
Leverage 0.0012746 0.00244 0.52 0.601
Capital expenditure -0.0088975 0.004039 -2.2 0.028
Cash flow volatility 7.80E-06 3.79E-06 2.06 0.040
Constant 0.1303008 0.020094 6.48 0.000
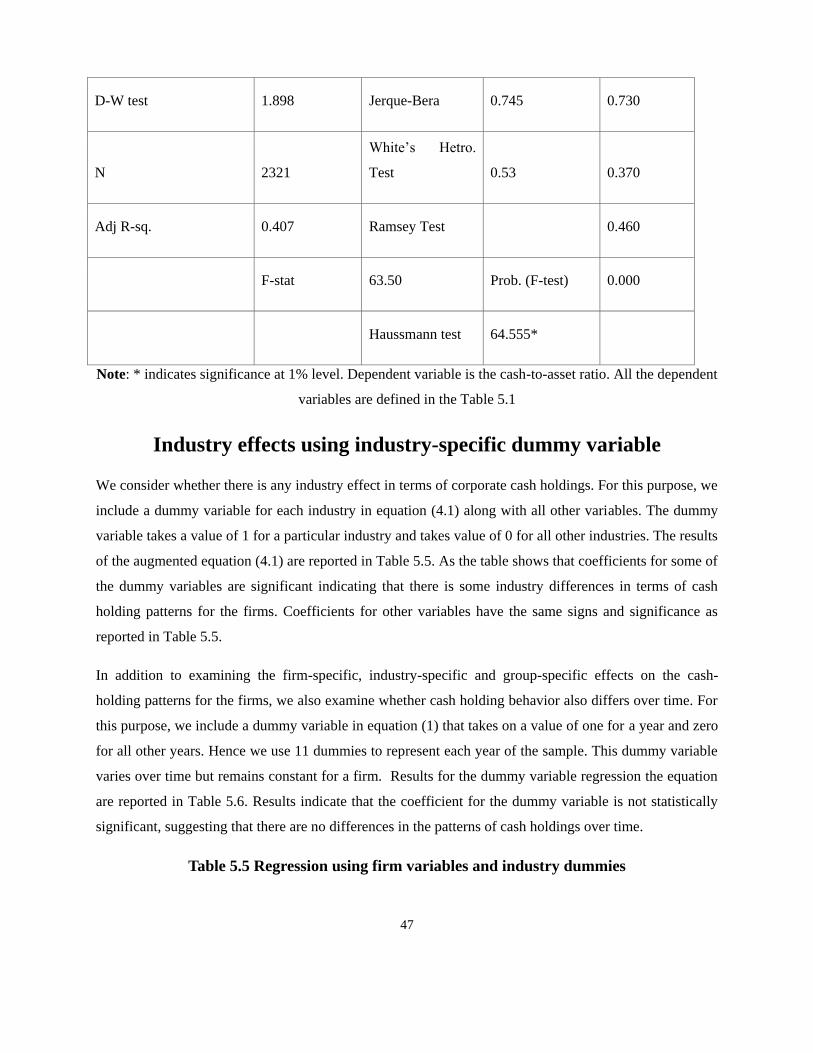
47
D-W test 1.898 Jerque-Bera 0.745 0.730
N 2321
White’s Hetro.
Test 0.53 0.370
Adj R-sq. 0.407 Ramsey Test
0.460
F-stat 63.50 Prob. (F-test) 0.000
Haussmann test 64.555*
Note: * indicates significance at 1% level. Dependent variable is the cash-to-asset ratio. All the dependent
variables are defined in the Table 5.1
Industry effects using industry-specific dummy variable
We consider whether there is any industry effect in terms of corporate cash holdings. For this purpose, we
include a dummy variable for each industry in equation (4.1) along with all other variables. The dummy
variable takes a value of 1 for a particular industry and takes value of 0 for all other industries. The results
of the augmented equation (4.1) are reported in Table 5.5. As the table shows that coefficients for some of
the dummy variables are significant indicating that there is some industry differences in terms of cash
holding patterns for the firms. Coefficients for other variables have the same signs and significance as
reported in Table 5.5.
In addition to examining the firm-specific, industry-specific and group-specific effects on the cash-
holding patterns for the firms, we also examine whether cash holding behavior also differs over time. For
this purpose, we include a dummy variable in equation (1) that takes on a value of one for a year and zero
for all other years. Hence we use 11 dummies to represent each year of the sample. This dummy variable
varies over time but remains constant for a firm. Results for the dummy variable regression the equation
are reported in Table 5.6. Results indicate that the coefficient for the dummy variable is not statistically
significant, suggesting that there are no differences in the patterns of cash holdings over time.
Table 5.5 Regression using firm variables and industry dummies
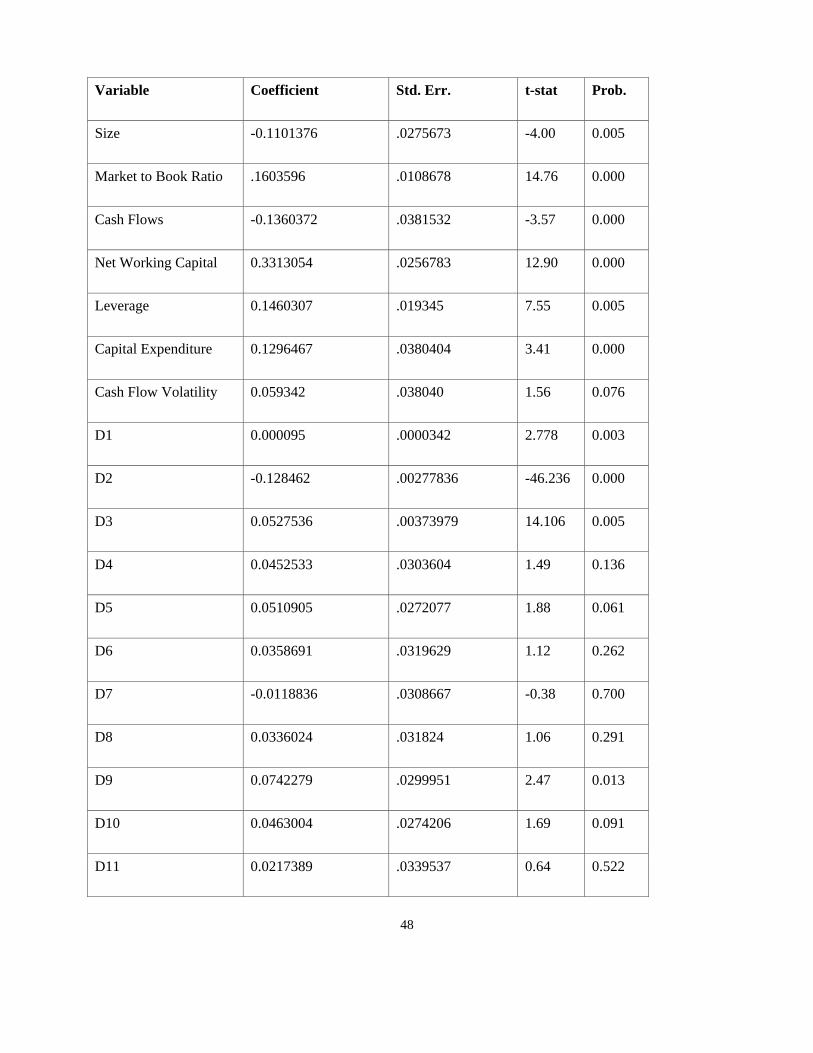
48
Variable Coefficient Std. Err. t-stat Prob.
Size -0.1101376 .0275673 -4.00 0.005
Market to Book Ratio .1603596 .0108678 14.76 0.000
Cash Flows -0.1360372 .0381532 -3.57 0.000
Net Working Capital 0.3313054 .0256783 12.90 0.000
Leverage 0.1460307 .019345 7.55 0.005
Capital Expenditure 0.1296467 .0380404 3.41 0.000
Cash Flow Volatility 0.059342 .038040 1.56 0.076
D1 0.000095 .0000342 2.778 0.003
D2 -0.128462 .00277836 -46.236 0.000
D3 0.0527536 .00373979 14.106 0.005
D4 0.0452533 .0303604 1.49 0.136
D5 0.0510905 .0272077 1.88 0.061
D6 0.0358691 .0319629 1.12 0.262
D7 -0.0118836 .0308667 -0.38 0.700
D8 0.0336024 .031824 1.06 0.291
D9 0.0742279 .0299951 2.47 0.013
D10 0.0463004 .0274206 1.69 0.091
D11 0.0217389 .0339537 0.64 0.522
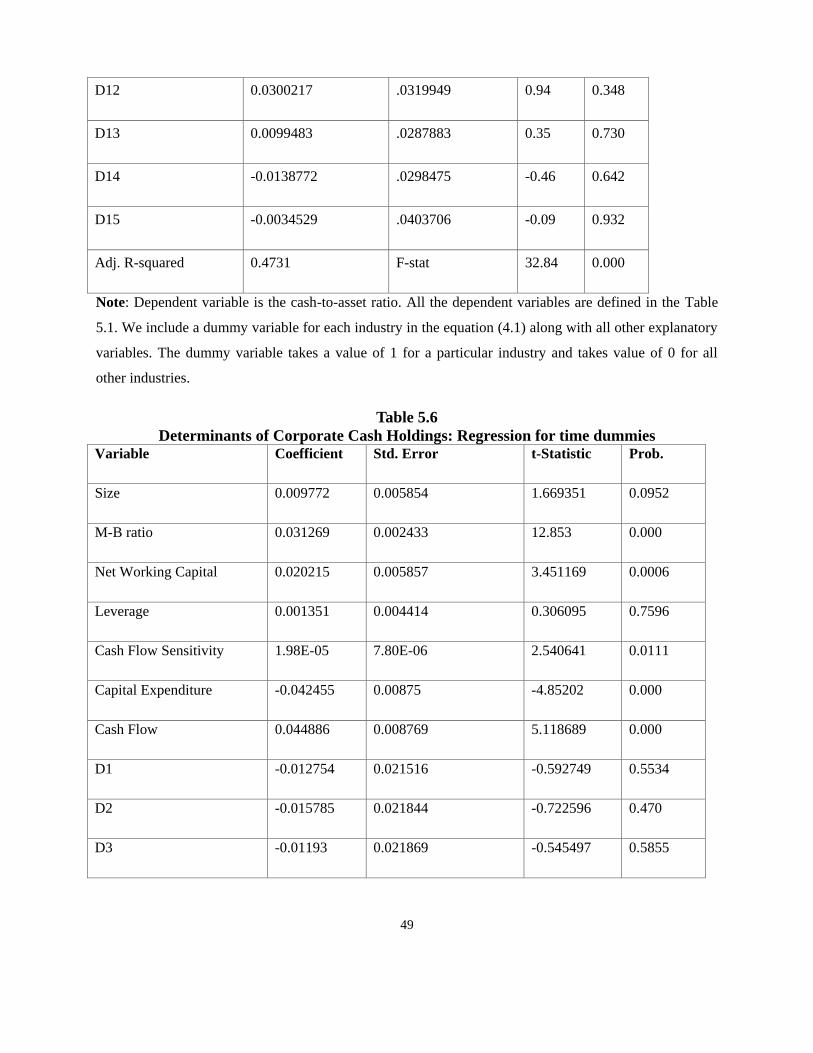
49
D12 0.0300217 .0319949 0.94 0.348
D13 0.0099483 .0287883 0.35 0.730
D14 -0.0138772 .0298475 -0.46 0.642
D15 -0.0034529 .0403706 -0.09 0.932
Adj. R-squared 0.4731 F-stat 32.84 0.000
Note: Dependent variable is the cash-to-asset ratio. All the dependent variables are defined in the Table
5.1. We include a dummy variable for each industry in the equation (4.1) along with all other explanatory
variables. The dummy variable takes a value of 1 for a particular industry and takes value of 0 for all
other industries.
Table 5.6
Determinants of Corporate Cash Holdings: Regression for time dummies Variable Coefficient Std. Error t-Statistic Prob.
Size 0.009772 0.005854 1.669351 0.0952
M-B ratio 0.031269 0.002433 12.853 0.000
Net Working Capital 0.020215 0.005857 3.451169 0.0006
Leverage 0.001351 0.004414 0.306095 0.7596
Cash Flow Sensitivity 1.98E-05 7.80E-06 2.540641 0.0111
Capital Expenditure -0.042455 0.00875 -4.85202 0.000
Cash Flow 0.044886 0.008769 5.118689 0.000
D1 -0.012754 0.021516 -0.592749 0.5534
D2 -0.015785 0.021844 -0.722596 0.470
D3 -0.01193 0.021869 -0.545497 0.5855
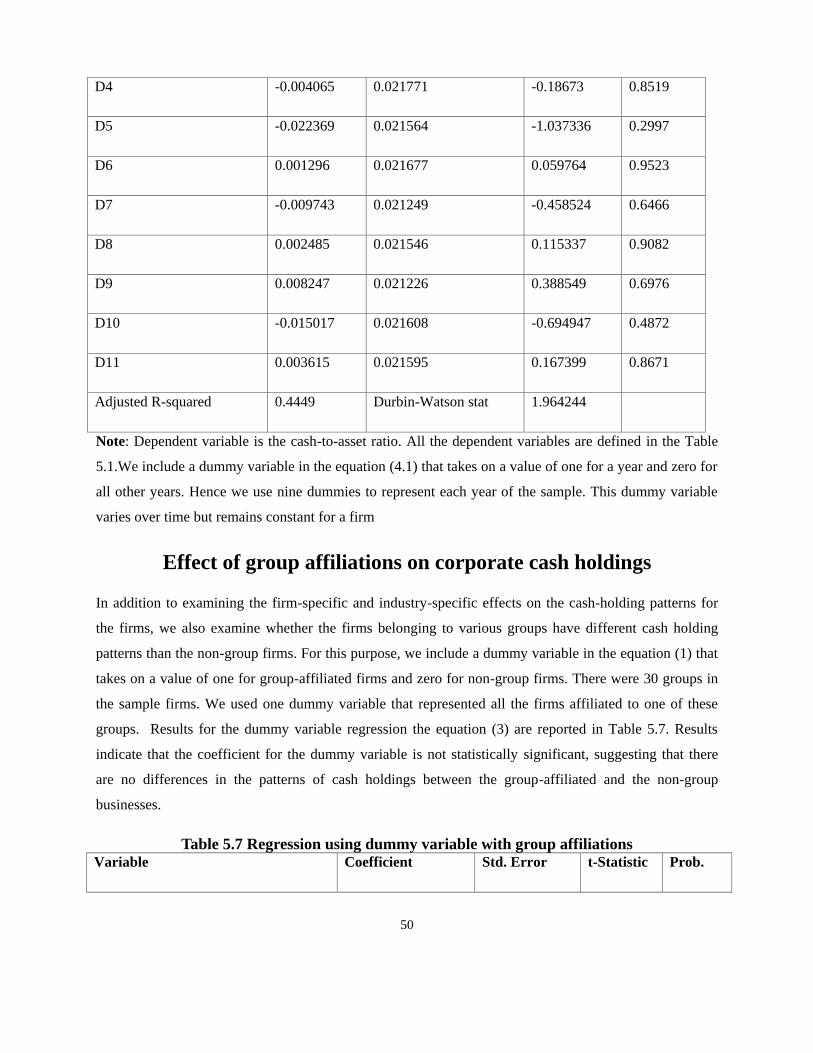
50
D4 -0.004065 0.021771 -0.18673 0.8519
D5 -0.022369 0.021564 -1.037336 0.2997
D6 0.001296 0.021677 0.059764 0.9523
D7 -0.009743 0.021249 -0.458524 0.6466
D8 0.002485 0.021546 0.115337 0.9082
D9 0.008247 0.021226 0.388549 0.6976
D10 -0.015017 0.021608 -0.694947 0.4872
D11 0.003615 0.021595 0.167399 0.8671
Adjusted R-squared 0.4449 Durbin-Watson stat 1.964244
Note: Dependent variable is the cash-to-asset ratio. All the dependent variables are defined in the Table
5.1.We include a dummy variable in the equation (4.1) that takes on a value of one for a year and zero for
all other years. Hence we use nine dummies to represent each year of the sample. This dummy variable
varies over time but remains constant for a firm
Effect of group affiliations on corporate cash holdings
In addition to examining the firm-specific and industry-specific effects on the cash-holding patterns for
the firms, we also examine whether the firms belonging to various groups have different cash holding
patterns than the non-group firms. For this purpose, we include a dummy variable in the equation (1) that
takes on a value of one for group-affiliated firms and zero for non-group firms. There were 30 groups in
the sample firms. We used one dummy variable that represented all the firms affiliated to one of these
groups. Results for the dummy variable regression the equation (3) are reported in Table 5.7. Results
indicate that the coefficient for the dummy variable is not statistically significant, suggesting that there
are no differences in the patterns of cash holdings between the group-affiliated and the non-group
businesses.
Table 5.7 Regression using dummy variable with group affiliations Variable Coefficient Std. Error t-Statistic Prob.
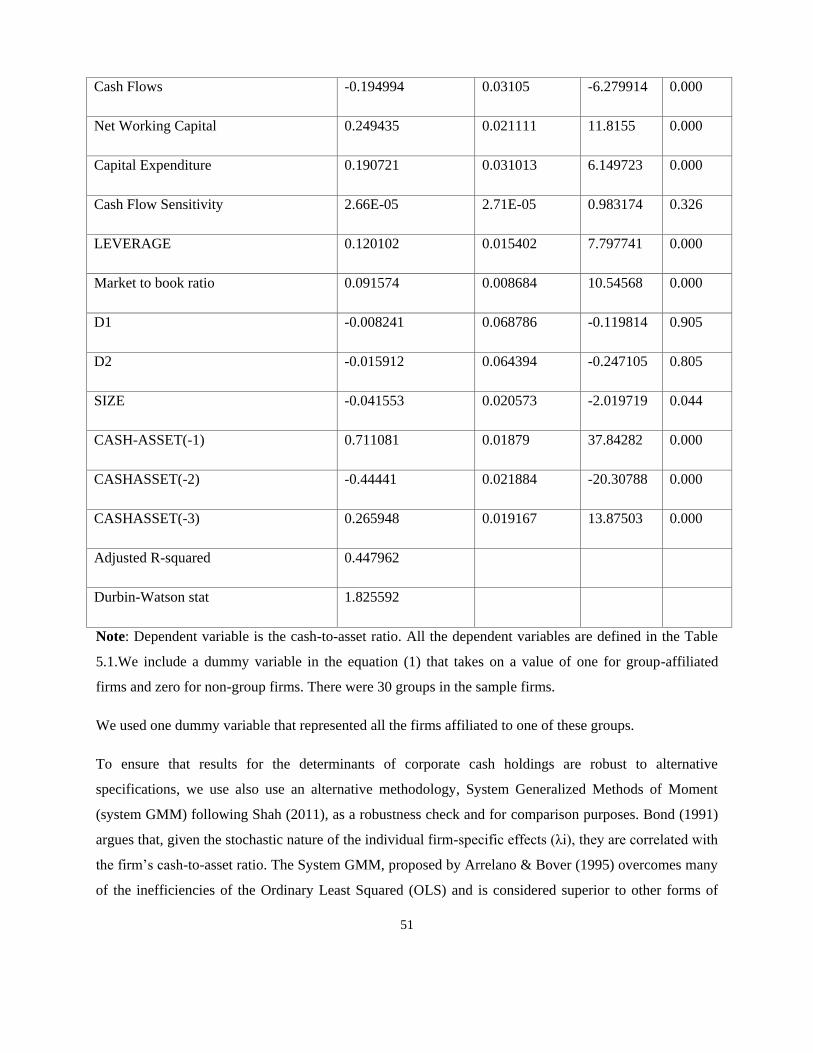
51
Cash Flows -0.194994 0.03105 -6.279914 0.000
Net Working Capital 0.249435 0.021111 11.8155 0.000
Capital Expenditure 0.190721 0.031013 6.149723 0.000
Cash Flow Sensitivity 2.66E-05 2.71E-05 0.983174 0.326
LEVERAGE 0.120102 0.015402 7.797741 0.000
Market to book ratio 0.091574 0.008684 10.54568 0.000
D1 -0.008241 0.068786 -0.119814 0.905
D2 -0.015912 0.064394 -0.247105 0.805
SIZE -0.041553 0.020573 -2.019719 0.044
CASH-ASSET(-1) 0.711081 0.01879 37.84282 0.000
CASHASSET(-2) -0.44441 0.021884 -20.30788 0.000
CASHASSET(-3) 0.265948 0.019167 13.87503 0.000
Adjusted R-squared 0.447962
Durbin-Watson stat 1.825592
Note: Dependent variable is the cash-to-asset ratio. All the dependent variables are defined in the Table
5.1.We include a dummy variable in the equation (1) that takes on a value of one for group-affiliated
firms and zero for non-group firms. There were 30 groups in the sample firms.
We used one dummy variable that represented all the firms affiliated to one of these groups.
To ensure that results for the determinants of corporate cash holdings are robust to alternative
specifications, we use also use an alternative methodology, System Generalized Methods of Moment
(system GMM) following Shah (2011), as a robustness check and for comparison purposes. Bond (1991)
argues that, given the stochastic nature of the individual firm-specific effects (λi), they are correlated with
the firm’s cash-to-asset ratio. The System GMM, proposed by Arrelano & Bover (1995) overcomes many
of the inefficiencies of the Ordinary Least Squared (OLS) and is considered superior to other forms of
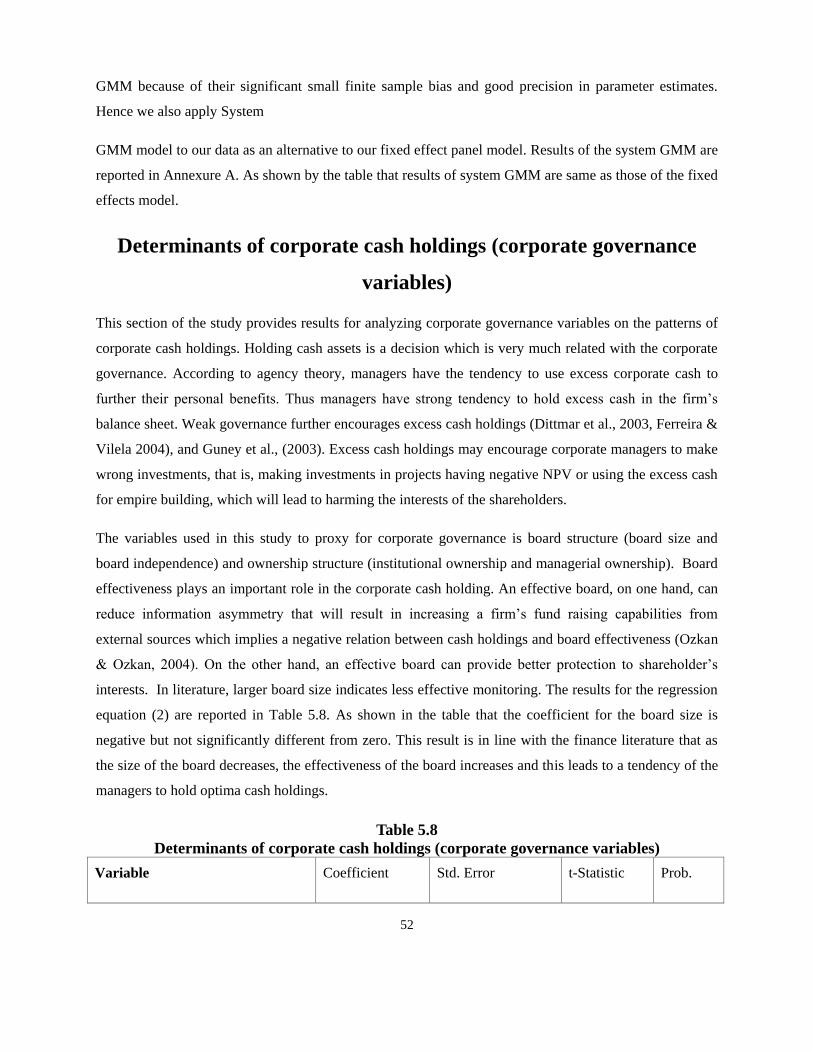
52
GMM because of their significant small finite sample bias and good precision in parameter estimates.
Hence we also apply System
GMM model to our data as an alternative to our fixed effect panel model. Results of the system GMM are
reported in Annexure A. As shown by the table that results of system GMM are same as those of the fixed
effects model.
Determinants of corporate cash holdings (corporate governance
variables)
This section of the study provides results for analyzing corporate governance variables on the patterns of
corporate cash holdings. Holding cash assets is a decision which is very much related with the corporate
governance. According to agency theory, managers have the tendency to use excess corporate cash to
further their personal benefits. Thus managers have strong tendency to hold excess cash in the firm’s
balance sheet. Weak governance further encourages excess cash holdings (Dittmar et al., 2003, Ferreira &
Vilela 2004), and Guney et al., (2003). Excess cash holdings may encourage corporate managers to make
wrong investments, that is, making investments in projects having negative NPV or using the excess cash
for empire building, which will lead to harming the interests of the shareholders.
The variables used in this study to proxy for corporate governance is board structure (board size and
board independence) and ownership structure (institutional ownership and managerial ownership). Board
effectiveness plays an important role in the corporate cash holding. An effective board, on one hand, can
reduce information asymmetry that will result in increasing a firm’s fund raising capabilities from
external sources which implies a negative relation between cash holdings and board effectiveness (Ozkan
& Ozkan, 2004). On the other hand, an effective board can provide better protection to shareholder’s
interests. In literature, larger board size indicates less effective monitoring. The results for the regression
equation (2) are reported in Table 5.8. As shown in the table that the coefficient for the board size is
negative but not significantly different from zero. This result is in line with the finance literature that as
the size of the board decreases, the effectiveness of the board increases and this leads to a tendency of the
managers to hold optima cash holdings.
Table 5.8
Determinants of corporate cash holdings (corporate governance variables)
Variable Coefficient Std. Error t-Statistic Prob.
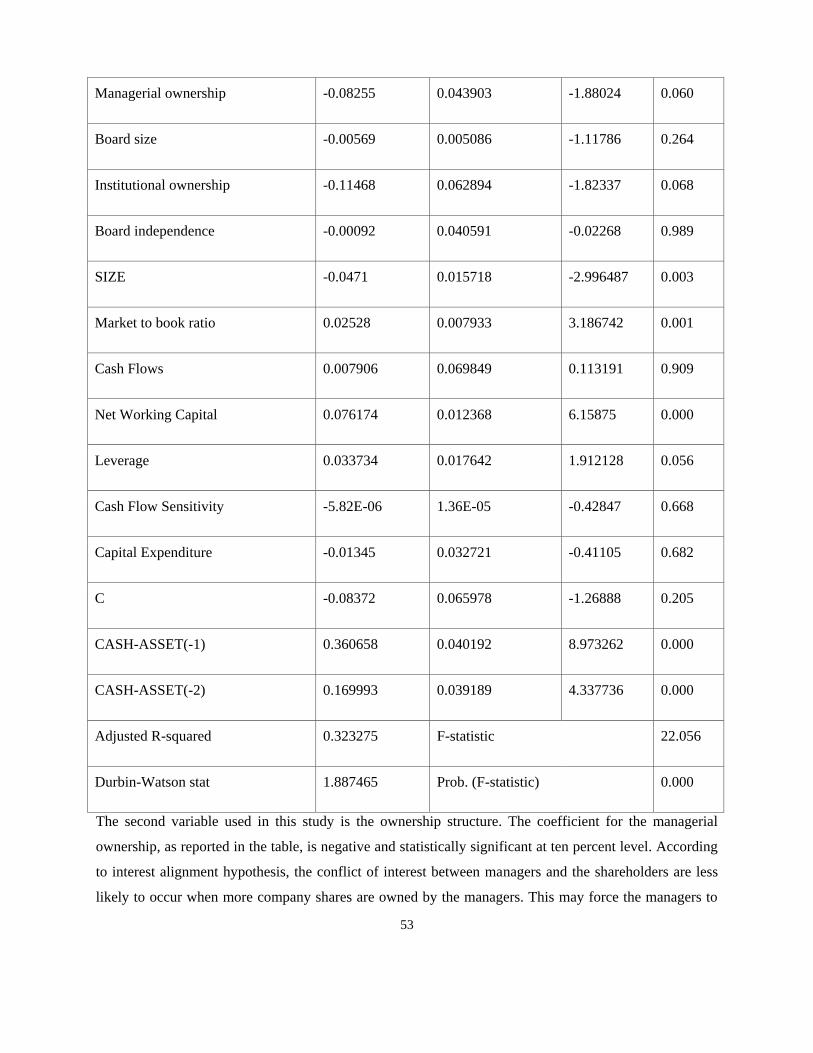
53
Managerial ownership -0.08255 0.043903 -1.88024 0.060
Board size -0.00569 0.005086 -1.11786 0.264
Institutional ownership -0.11468 0.062894 -1.82337 0.068
Board independence -0.00092 0.040591 -0.02268 0.989
SIZE -0.0471 0.015718 -2.996487 0.003
Market to book ratio 0.02528 0.007933 3.186742 0.001
Cash Flows 0.007906 0.069849 0.113191 0.909
Net Working Capital 0.076174 0.012368 6.15875 0.000
Leverage 0.033734 0.017642 1.912128 0.056
Cash Flow Sensitivity -5.82E-06 1.36E-05 -0.42847 0.668
Capital Expenditure -0.01345 0.032721 -0.41105 0.682
C -0.08372 0.065978 -1.26888 0.205
CASH-ASSET(-1) 0.360658 0.040192 8.973262 0.000
CASH-ASSET(-2) 0.169993 0.039189 4.337736 0.000
Adjusted R-squared 0.323275 F-statistic 22.056
Durbin-Watson stat 1.887465 Prob. (F-statistic) 0.000
The second variable used in this study is the ownership structure. The coefficient for the managerial
ownership, as reported in the table, is negative and statistically significant at ten percent level. According
to interest alignment hypothesis, the conflict of interest between managers and the shareholders are less
likely to occur when more company shares are owned by the managers. This may force the managers to

54
hold the required amount of cash and avoid holding excess cash. The interest alignment hypothesis,
therefore, suggests that there is a negative relationship between managerial ownership and corporate cash
holdings. The result of this study is, therefore, in line with the interest alignment hypothesis.
Finally, the coefficient for the institutional ownership is also statistically significant at the ten percent
level, indicating that the institutional ownership may be a relevant factor in explaining corporate cash
holding patterns for Pakistani firms. The marginal significance of the results for ownership variable may
be quite understandable as the role of the institutions in the corporate governance is very limited, almost
non-existent in the Pakistan’s corporate sector.
Economic uncertainty and corporate cash holdings
Table 5.9 reports results for the relationship between macroeconomic uncertainty and variation in cross-
sectional dispersion of cash-to-asset ratio of corporate firms.
Table 5.9
Regression of Economic uncertainty and variation in corporate cash holdings
Variable Coefficient Std. Error t-Statistic Prob.
Industrial Production -0.033409 0.016522 -2.02211 0.099
KSE-100 Index 5.960692 10.11073 0.589541 0.577
Interest Rate -0.202377 0.052577 -3.849165 0.008
CPI -0.33286 0.727615 -0.45747 0.663
C 0.099038 0.041178 2.405126 0.052
R-squared 0.733 D-Watson stat 2.056005
Adj. R-squared 0.610 F-stat 10.0369
Log likelihood 18.18333 Prob. 0.009
Note: KSE and CPI stands for Karachi Stock Exchange and Consumer Price Index, respectively.
For measuring macroeconomic uncertainty, we use four different proxies that include variation in
Industrial Production, interest rate, inflation (CPI) and stock market (KSE-100 Index).
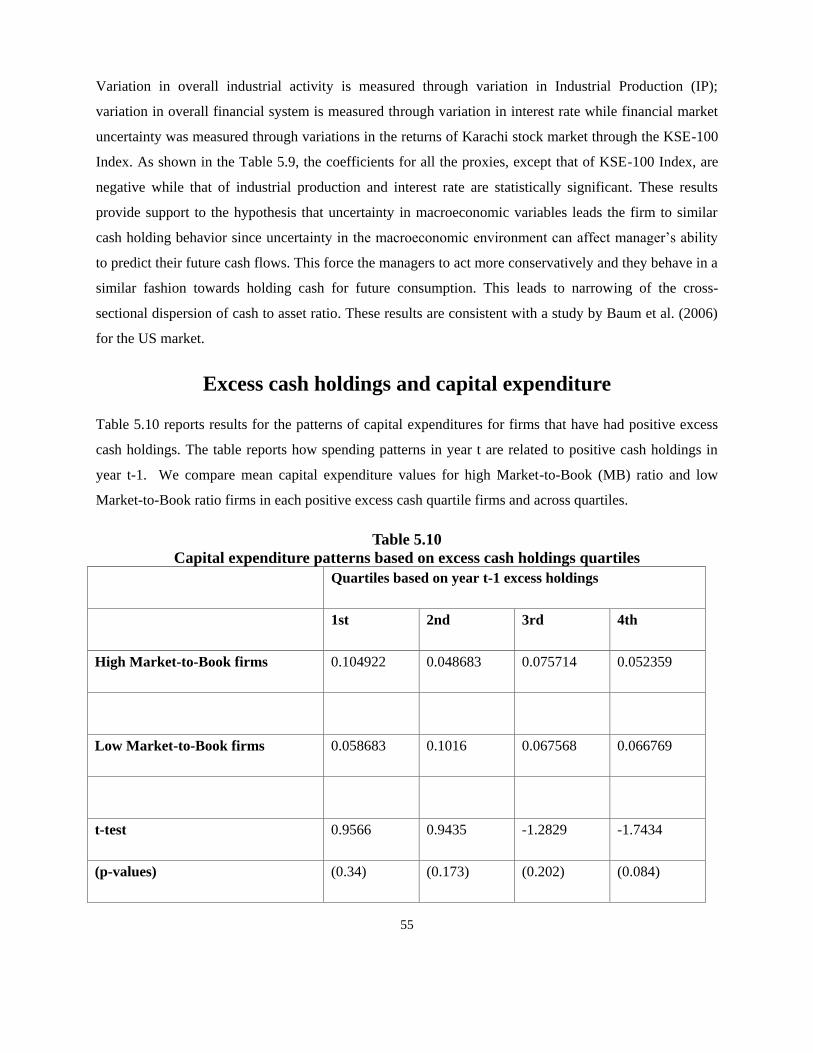
55
Variation in overall industrial activity is measured through variation in Industrial Production (IP);
variation in overall financial system is measured through variation in interest rate while financial market
uncertainty was measured through variations in the returns of Karachi stock market through the KSE-100
Index. As shown in the Table 5.9, the coefficients for all the proxies, except that of KSE-100 Index, are
negative while that of industrial production and interest rate are statistically significant. These results
provide support to the hypothesis that uncertainty in macroeconomic variables leads the firm to similar
cash holding behavior since uncertainty in the macroeconomic environment can affect manager’s ability
to predict their future cash flows. This force the managers to act more conservatively and they behave in a
similar fashion towards holding cash for future consumption. This leads to narrowing of the cross-
sectional dispersion of cash to asset ratio. These results are consistent with a study by Baum et al. (2006)
for the US market.
Excess cash holdings and capital expenditure
Table 5.10 reports results for the patterns of capital expenditures for firms that have had positive excess
cash holdings. The table reports how spending patterns in year t are related to positive cash holdings in
year t-1. We compare mean capital expenditure values for high Market-to-Book (MB) ratio and low
Market-to-Book ratio firms in each positive excess cash quartile firms and across quartiles.
Table 5.10
Capital expenditure patterns based on excess cash holdings quartiles Quartiles based on year t-1 excess holdings
1st 2nd 3rd 4th
High Market-to-Book firms 0.104922 0.048683 0.075714 0.052359
Low Market-to-Book firms 0.058683 0.1016 0.067568 0.066769
t-test 0.9566 0.9435 -1.2829 -1.7434
(p-values) (0.34) (0.173) (0.202) (0.084)
56
Opler, Pinkowitz, stulz and Williamson (1999) states that “if the MB ratio is a good measure of the
growth opportunities, then our discussion of the agency costs of managerial discretion predicts that these
agency costs are small in high MB firms”. As reported in Table 5.11, that we do not find systematic
pattern in changes in capital expenditures in excess cash for both high MB and low MB firms. Except
fourth quartile, for other quartiles of excess cash, we do not observe significant patterns of spending
between high M-B and low M-B firms. In other words, there is no evidence that the capital expenditures
are higher for high MB firms as compared to low MB firms. Interestingly, low MB firms in the fourth
(highest) quartile spend more than the high MB firms in the same quartile, indicating the higher agency
costs for firms in the Pakistan’s market.
57
Chapter 6
Conclusion and Recommendations
This study examines the determinants of corporate cash holdings for non-financial firms listed on the
Karachi Stock Exchange. Specifically, the study focuses on three main objectives. The first objective is to
look at the firm-specific factors that determine the optimal level of corporate cash holdings. Firm-
specific factors were used for three motives of holding cash. These include transactional, precautionary
and financing motive. This analysis was also extended to examining any industry and group affiliations
effects on differences in cash holding patterns for corporate firms. The second objective of the study is to
analyze the effect of corporate governance on corporate cash holdings. Finally, the third objective is to
examine the cash holding behavior under macroeconomic uncertainty.
The first section of the study provides results for the determinants of corporate cash holdings using firm-
specific factors. To examine whether the transactional motive is well explained, the coefficient of the firm
size is positive but not statistically significant, indicating that cash to asset ratio of the Pakistani firms is
not affected by firm size. It may be because in Pakistan many large organizations are owned and
managed by Government. The mangers of these organizations are conservative. They are conscious about
the risk factor, that’s why they hold large amount of cash in their balance sheet. In Pakistani corporations,
coefficient of net working capital is significantly positive, indicating that the length of the cash
conversion cycle may have a positive relationship with the higher corporate cash holdings. As the longer
conversion cycle suggest that firm keeps more cash in its balance sheet. The length of the cash conversion
cycle is related with the holding of the working capital. On the basis of these results, we can say that
Pakistani firm’s cash to asset ratio is closely related to the transactional motive. Further, empirical results
suggest that Pakistani firms are sensitive to the volatility of cash flow and that firm’s cash holdings are
highly influenced by a precautionary need. These results are consistent with Diamond (1984) and Stiglitz
and Weiss (1981). According to these studies, the firm’s credit quality is determined by the information
asymmetry between the firm and its lender. Organizations hold larger amount of cash in times of
uncertainty. They can survive in times of tight credit by using internal funds available to finance positive
NPV projects. Where financial markets are efficient organizations can generate cash from the market to
bridge the gap caused by unexpected fluctuation of cash flow, but the organizations have to hold cash

58
where the markets are not efficient in order to meet the unexpected gap between cash inflows and out
flows.
Relationship between the corporate cash holdings and growth of the firm shows that high growth
organization hold larger amount of cash in order to ensure that they can realize expected future benefits,
even if the capital is not available externally. Empirical results firms having larger cash flows hold larger
cash in their balance sheet. This result may be indicative of the suggestion that there are credit market
frictions that may be a cause for high correlation between cash holding and the cash flow of the firm.
To examine the firm-specific and industry-specific effects in determining the cash-holding pattern for the
firm, the study finds no firm-specific effects but industry effects were found to be there in determining the
cash holding patterns for the firms of the Pakistani corporate sector. We also examine whether the firms
belonging to various groups have different cash holding patterns than the non-group firms. Results
indicate that there are no differences in the patterns of cash holdings between the group-affiliated and the
non-group businesses.
According to agency theory, managers have the tendency to use excess corporate cash to further their
personal benefits. Thus managers have strong tendency to hold excess cash in the firm’s balance sheet.
Weak corporate governance further encourages excess cash holdings (Dittmar et al, 2003). Excess cash
holdings may encourage corporate managers to make wrong investments, that is, making investments in
projects having negative NPV or using the excess cash for empire building, which will lead to harming
the interests of the shareholders.
The variables used in this study to proxy for corporate governance is board structure and ownership
structure. Board effectiveness plays an important role in the corporate cash holding. An effective board,
on one hand, can reduce information asymmetry that will result in increasing a firm’s fund raising
capabilities from external sources which implies a negative relation between cash holdings and board
effectiveness. In addition, an effective board can provide better protection to shareholder’s interests. In
literature, larger board size indicates less effective monitoring. Our result is in line with the finance
literature that as the size of the board increases, the effectiveness of the board declines and this leads to a
tendency of the managers to hold excess cash holdings. According to interest alignment hypothesis, the
59
conflict of interest between managers and the shareholders are less likely to occur when more company
shares are owned by the managers. This may force the managers to hold the required amount of cash and
avoid holding excess cash. The result of our study is in line with the interest alignment hypothesis.
Finally, the coefficient for the institutional ownership is not statistically significant, indicating that the
institutional ownership may not be a relevant factor in explaining corporate cash holding patterns for
Pakistani firms. This may be quite understandable as the role of the institutions in the corporate
governance is very limited, almost non-existent in the Pakistan’s corporate sector.
For the relationship between macroeconomic uncertainty and firm’s cash holindg patterns, results provide
support to the hypothesis that uncertainty in macroeconomic variables leads firms to similar cash holding
behavior since uncertainty in the macroeconomic environment can affect manager’s ability to predict their
future cash flows. This force the managers to act more conservatively and they behave in a similar fashion
towards holding cash for future consumption. This leads to narrowing of the cross-sectional dispersion of
cash to asset ratio.
Our results do not provide evidence that the capital expenditures are higher for high Market-toBook (MB)
firms as compared to low Market-to-Book firms. Interestingly, low MB firms in the fourth (highest)
quartile spend more than the high MB firms in the same quartile, indicating the higher agency costs for
firms in the Pakistan’s market.
Policy Recommendations:
This study adds to the finance literature by examining dynamics of corporate cash holding determinants in
a developing market like Pakistan. The findings of this study are important to managers as well market
regulators. The study highlights the importance of agency problems in Pakistan’s corporate firms.
Capital market efficiency and market development
In an efficient market cash is considered as a negative debt but the market imperfections force the
companies to hold more cash balances to meet the future needs. Hence, for efficient allocation of
resources and to hold optimal levels of cash capital market development becomes imperative.
Macroeconomic uncertainty do cause considerable distortions for firms when efficiently allocating firm’s
financial resources between long term spending and short term liquidity needs. Results of our study build
60
a strong case for a need to assess overall impact of easing macroeconomic uncertainty and advocate its
beneficial aspects to the economy. Consequently, fluctuations in macroeconomic aggregates should be of
concern to policy makers.
Given the higher probability of financial distress and bankruptcy associated with higher leverage, firms
will be tempted to hold higher levels of cash only when the judicial efficiency is high and creditors can
promptly and effectively use the system to sue defaulted firms. However, firms will not prefer holding
more liquid assets at times of higher leverage if they are confident enough to bit on the lower probability
of the creditors being able to enforce their actions through the judicial system. Previous studies have
shown that “judicial efficiency” is one of an important factor whether creditor go for suing firms that have
defaulted on their loans. Hence, given the fact that Pakistan is relatively lower in judicial efficiency
(Shah, 2011) one could possibly argue that we need to strengthen the judicial system that would protect
the interests of the lenders and ensure just system and add in developing debt market.
Development of effective corporate governance mechanism
The importance of strong and effective corporate governance practices and structures on manager’s
behavior and decisions has increasingly been advocated in finance literature. One of these important
decisions relates to cash holding and spending decisions. Effective corporate governance structures can
discipline managers in decisions relating to disbursement of excess cash to shareholders and discouraging
them from hoarding excess cash or spending it in their empire building. Notwithstanding the various
obstacles, unfortunately, the implementation of the corporate governance has not been a success story in
Pakistan. We need to revolutionize the corporate governance implementation and get away with the old
school of family-business and a “rubber stamp” board. Moreover, market regulators (SECP and SBP)
need to strengthen the implementation of corporate governance codes and increase their role and assume
an active monitoring role.
61
References:
Shah, A. (2011). The Corporate Cash Holdings: Determinants and Implications. African Journal of
Business Management Vol. 5(34), 12939 – 12950.
Acharya, V. V., Almeida, H., & Campello, M. (2007). Is cash negative debt? A hedgingperspective on
corporate financial policies. Journal of Financial Intermediation, 16(4), 515-554.
Afza, T., & Adnan, S. M. (2007). Determinants of corporate cash holdings: A case study of Pakistan.
Proceedings of Singapore Economic Review Conference (SERC) 2007, August 01-04, Organized by
Singapore Economics Review and the University of Manchester (Brooks World Poverty Institute),
Singapore 164-165.
Almeida, H., Campello, M., & Weisbach, M. S. (2004). The cash flow sensitivity of cash. Journal of
Finance 59, 1777–1804.
Arslan, O., Florackis, C., & Ozkan, A. (2006). The role of cash holdings in reducing investmentcash flow
sensitivity: Evidence from a financial crisis period in an emerging market. Emerging Markets Review,
7(4), 320-338.
Baum, C. F., Caglayan, M., Ozkan, N., & Talavera, O. (2006). The impact of macroeconomic uncertainty
on non-financial firms' demand for liquidity. Review of Financial Economics. 15, 289–304.
Baskin, J. (1987). Corporate liquidity in games of monopoly power. Review of Economics and Statistics
69, 312-319.
Baumol, W. (1952). The transactions demand for cash: An inventory theoretic approach. Quarterly
Journal of Economics, 66(4), 545–556.
Brennan, M. J., & Hughes, P. J. (1991). Stock Prices and the Supply of Information. Journal of Finance,
46(5), 1665-1691. doi: 10.1111/j.1540-6261.1991.tb04639.x
Barclay, M. J. and C. W. Smith (1996). On Financial Architecture: Leverage, maturity and priority.
Journal of Applied Corporate Finance, 8, 4-17
Baum, C. F., Chakraborty, A., & Liu, B. (2008).The impact of macroeconomic uncertainty on firm's
changes in financial leverage. International Journal of Finance and Economics, 15(1), 2230. doi:
10.1002/ijfe.406
Breitung, J. (2000). The local power of some unit root tests for panel data. Advances in Econometrics,
Volume 15: Nonstationary Panels, Panel Cointegration, and Dynamic Panels, (eds)., B. H. Baltagi,
(pp.161–178). Amsterdam: JAY Press.
62
Carrascal, M.C. (2010). Cash Holdings, Firm Size and Access to External Finance - Evidence for the
Euro Area (November 18, 2010). Banco de Espana Working Paper No. 1034. Available at SSRN:
http://ssrn.com/
Chudson, Walter Alexander. (1945). The Pattern of Corporate Financial Structure: A CrossSection View
of Manufacturing, Mining, Trade, and Construction, 1937. Ph.D. Thesis submitted to the Faculty of
Political Science, Columbia University.
Chang, K., & Noorbakhsh, A. (2006). Corporate cash holdings, foreign direct investment, and corporate
governance. Global Finance Journal 16, 302-316.
Chen, Y. R., & Chuang, W. T. (2008).Alignment or entrenchment? Corporate governance and cash
holdings in growing firms. Journal of Business Research, 6, 211-245.
Choi, I. (2002). Instrumental variables estimation of a nearly nonstationary, heterogeneous error
component model. Journal of Econometrics, 109, 1–32.
Cossin, D., & Hricko, T. (2004). The Benefits of Holding Cash: A Real Options Approach. Managerial
Finance, 30(5), 29-43. http://dx.doi.org/10.1108/03074350410769056.
Dittmar, A., & Shivdasani, A. (2003). Divestitures and Divisional Investment Policies. The Journal of
Finance, 58, 2711–2744.
Dittmar, A., & Thakor, A. (2007). Why Do Firms Issue Equity? The Journal of Finance, 62, 1– 54.
Dittmar, A., & Mahrt-Smith, J. (2007). Corporate governance and the value of cash holdings. Journal of
Financial Economics 83, 599-634.
Deloof, M. (2001). Belgian intragroup relations on the determinants of corporate liquid reserves,
European Financial Management, 7(3), 375-392. DOI: 10.1111/1468-036X.00161
Drobetz, W., & Grüninger, M. C. (2007). Corporate cash holdings: Evidence from Switzerland. Financial
markets Portfolio, 21, 293–324, http://dx.doi.org/10.1007/s11408-007-0052-8.
Diamond, D. W. (1984). Financial intermediation and delegated monitoring. Review of Economic Studies
51, 393–414.
Fama, E. F., & Macbeth, J. D. (1973). Risk, return, and equilibrium: Empirical Tests. The Journal of
Political Economy, 81(3), 607-636.
Fazzari, S. M., Hubbard, R.G., & Petersen, B. (1988). Financing constraints and corporate investment.
Broking Papers on Economic Activity, 141-195.
63
Ferreira, M. A., & Vilela, A. S. (2004). Why do firms hold cash? Evidence from EMU countries.
European Financial Management, 10(2), 295-319. http://dx.doi.org/10.1111/j.13547798.2004.00251.x.
Gryglewicz, S. (2011). A Theory of Corporate Financial Decisions with Liquidity and Solvency
Concerns. Journal of Financial Economics, 99(2), 365-384.
Gill, A. & Shah, C. (2012). Determinants of Corporate Cash Holdings: Evidence from Canada.
International Journal of Economics and Finance, 4(1), 70-79.
Guney, Y., Ozkan, A., & N. Ozkan (2007). International evidence on the non-linear impact of leverage on
corporate cash holdings. Journal of Multinational Financial Management, 17(1), 4560.
Han, S., & Qiu, J. (2007).Corporate precautionary cash savings. Journal of Corporate Finance 13, 43-57.
Hardin, W. G., Highfield, M. J., Hill, M. D., & Kelly, G. W. (2009). The Determinants of REIT cash
holdings. Journal of Real Estate Finance and Economics, 39(1), 39-57.
Harferd, J., Mansi, S. A., & Maxwell, W. F. (2008). Corporate governance and firm cash holdings in the
US. Journal of Financial Economics, 87, 535–555.
Hausman, J. A. (1978). Specification tests in econometrics. Econometrica 46(6), 1251–1271.
Hovakimian, G., & Titman, S. (2003). Corporate investment with financial constraints: Sensitivity of
investment to funds from voluntary asset sales. NBER working paper no:9432.
Im, K. S., Pesaran, M.H., & Shin, Y. (2003). Testing for unit roots in heterogeneous panels. Journal of
Econometrics, 115, 53–74.
Islam, S. (2012).Manufacturing firms’ cash holding determinants: Evidence from Bangladesh,
International Journal of Business and Management, 7(6), 172-184.
John, T. A. (1993). Accounting measures of corporate liquidity, leverage, and costs of financial distress.
Financial Management 22, 91-100.
Jensen, M. C. (1986). Agency costs of free cash flow, corporate finance and takeovers. American
Economic Review 76, 323–339.
Jarque, C .M., &. Berra, A. K. (1990). Efficient tests for normality, homoskedasticity and serial
independence of regression residuals. Economic Letters, 6, 255-59.
Khan, M. U. (2012). Development of Bond Market in Pakistan, Atlas Asset Management Limited
Keynes, J. M. (1936). The general theory of employment. In: Interest and Money. London: Harcourt
Brace
64
Kusnadi, Y., & Wei, K. C. J. (June 2011). The determinants of corporate cash management policy:
Evidence from around the World. Journal of Corporate Finance, 17(3), 725-740.
Kuan, T. H., Li, C. S., & Chu, S. H. (2011).Cash holdings and corporate governance in familycontrolled
firms. Journal of Business Research, 64(7), 757-764.
Kim, C., Mauer, D. C., Sherman, A. E. (1998). The determinants of corporate liquidity: Theory and
evidence. Journal of Financial and Quantitative Analysis, 33, 335–359.
Laporta, R., Lopex-De-Silanes, F., Shleifer, A. & Vishny, R. W. (1997). Legal Determinants of External
Finance. The Journal of Finance, 52, 1131–1150.
Lipton, M., & Lorsch, J.W. (1992): A Modest proposal for improved corporate governance. Business
Lawyer 48, 59-77.
Levin, A., Lin, C.F., & Chu, C.S.J. (2002). Unit root tests in panel data: Asymptotic and finitesample
properties. Journal of Econometrics, 108, 1–24.
Maddala, G. S., & Wu, S. (1999). A comparative study of unit root tests with panel data and new simple
test. Oxford Bulletin of Economics and Statistics, Special issue, 631-652
McConnell, J., & Servaes, H. (1990). Additional evidence on equity ownership and corporate value.
Journal of Economics, 413-435.
Mikkelson, W. & Partch, M. Do Persistent Large Cash Reserves Hinder Performance? Journal of
Financial and Quantitative Analysis, 38(2), 275-283.
Miller, M. H., & Orr, D. (1966). A model of the demand for money by firms. Quarterly Journal of
Economics, 80, 413–435.
Modigliani, F., & Miller, M. (1958).The cost of capital, corporation finance and theory of investment.
American Economic Review, 48, 261-297.
Myers, S. C., & Majluf, N. S. (1984). Corporate financing and investment decisions when firms have
information that investors do not have. Journal of Financial Economics, 13, 187–221.
Noguera, M., & Pech, C. O. (2012).The Determinants of Cash For Latin American Firms. The
International Journal of Business and Finance Research, 6(1), 121-133.
Opler, T., Pinkowitz, L., Stulz, R., & Williamson, R. (1999). The determinants and implications of
corporate cash holdings. Journal of Financial Economics 52, 3–46.
Ozkan, A., & Ozkan, N. (2004). Corporate Cash Holdings: An Empirical Investigation of Uk Companies.
Journal of Banking and Finance, 28, 2013-2134.
65
Nguyen, P. (2005). How sensitive are Japanese firms to earnings risk? Evidence from cash holdings.1-
41.[Online]Available: http://www.musashi.jp/~togo/Seminar/Sensitivity_earnings_riskNguyen.pdf (August 3, 2011).
Park, R. (1966). Estimating with heteroscedastistic error terms. Econometrica, 34, 888-901.
Peterson, M. A., & Rajan, G. R. (2003). Does Distance Still Matter? The Information Revolution in Small
Business Lending. The Journal of Finance, 57(6), 2533-2570
Pinkowitz, L., & Williamson, R. (2001). Bank power and cash holdings: Evidence from Japan. Review of
Financial Studies, 14, 1059–1082.
Pinkowitz, L., & Williamson, R. (2007). What is the market value of a dollar of corporate cash? Journal
of Applied Corporate Finance, 19, 74–81.
Pettit, R. R., Singer, R. F. (1985). Small business finance: A research agenda. Financial Management, 14,
47-60.
Rajan, R. G., & Zingales, L. (1995). What do we know from capital structure? Some evidence from the
international data. The Journal of Finance, 50(5), 1421-1460.
Ramsey, J. B. (1969). Test of specification error in classical least square regression analysis. Journal of
Royal Statistical Society, 31, 250-271.
Ross, Wethersfield, and Jaffe, (2000), Corporate Finance, 715-716.
Han, S., & Qiu, J. (2007). Corporate precautionary cash holdings. Journal of Corporate Finance 13, 43-
57.
Shah, A. (2011).Impact of judicial efficiency on debt maturity structure: Evidence from judicial districts
of Pakistan. Pakistan Development Review, 50(4), 663-682.
Stiglitz, J., & Weiss, A. (1984). Information imperfections in the capital market and macroeconomic
fluctuations. American Economic Review, 74, 194–199.
Tong, Z. (2009). Firm diversification and the value of corporate cash holdings. Journal of Corporate
Finance, 9(5), 203-256.
Tong, Z. (2010). CEO Risk incentives and corporate cash holdings. Journal of Business Finance and
Accounting, 37(9) & (10), 1248–1280. doi: 10.1111/j.1468-5957.2010.02208.x
Titman, S., & Wessels, R. (1988).The determinants of capital structure choice. The Journal of Finance,
43, 1-19.

66
Vogel, R. C., & Maddala, G. S. (1967). Cross-section estimates of liquid asset demand by manufacturing
corporations. The Journal of Finance, 22, 557–575.
White, H. (1980). A heteroscedasticity-consistent covariance matrix estimator and a direct test for
heteroscedasticity. Econometrica, 48, 817- 838.
Yermack, D. (1996). Higher market valuation companies with a small board of directors. Journal of
Financial Economics, 40, 185–212.
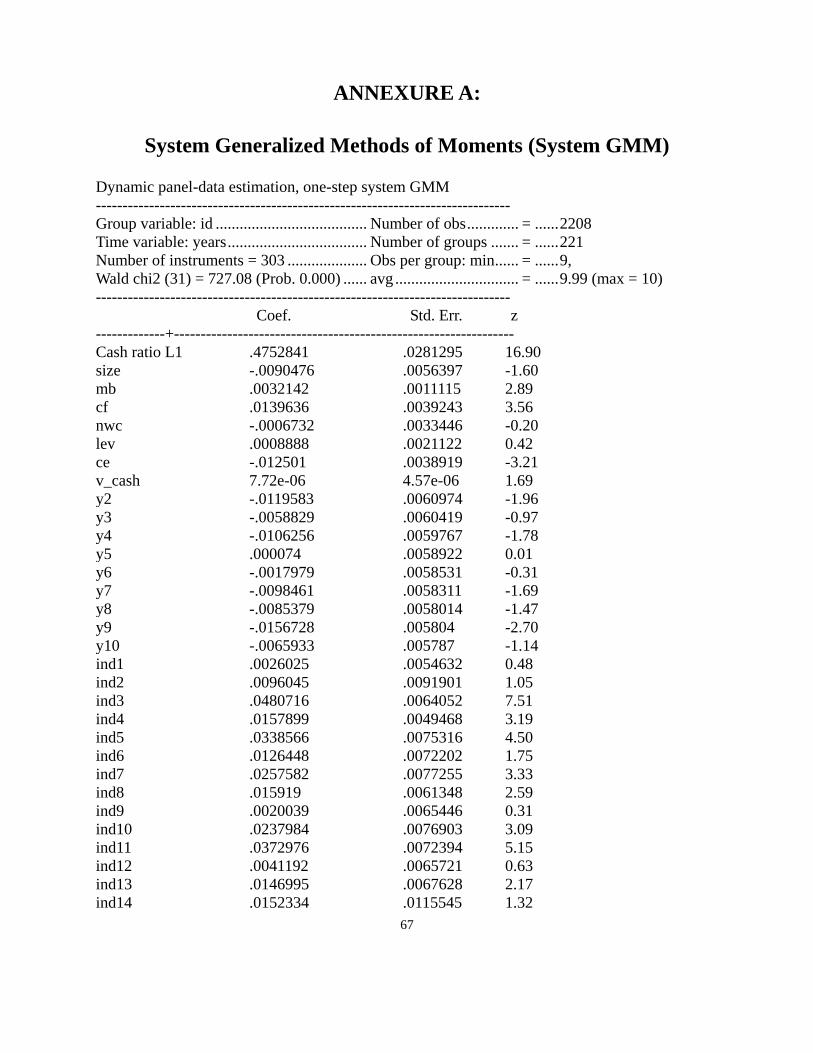
67
ANNEXURE A:
System Generalized Methods of Moments (System GMM)
Dynamic panel-data estimation, one-step system GMM
------------------------------------------------------------------------------
Group variable: id ...................................... Number of obs ............. = ...... 2208
Time variable: years ................................... Number of groups ....... = ...... 221
Number of instruments = 303 .................... Obs per group: min ...... = ...... 9,
Wald chi2 (31) = 727.08 (Prob. 0.000) ...... avg ............................... = ...... 9.99 (max = 10)
------------------------------------------------------------------------------
Coef. Std. Err. z
-------------+----------------------------------------------------------------
Cash ratio L1 .4752841 .0281295 16.90
size -.0090476 .0056397 -1.60
mb .0032142 .0011115 2.89
cf .0139636 .0039243 3.56
nwc -.0006732 .0033446 -0.20
lev .0008888 .0021122 0.42
ce -.012501 .0038919 -3.21
v_cash 7.72e-06 4.57e-06 1.69
y2 -.0119583 .0060974 -1.96
y3 -.0058829 .0060419 -0.97
y4 -.0106256 .0059767 -1.78
y5 .000074 .0058922 0.01
y6 -.0017979 .0058531 -0.31
y7 -.0098461 .0058311 -1.69
y8 -.0085379 .0058014 -1.47
y9 -.0156728 .005804 -2.70
y10 -.0065933 .005787 -1.14
ind1 .0026025 .0054632 0.48
ind2 .0096045 .0091901 1.05
ind3 .0480716 .0064052 7.51
ind4 .0157899 .0049468 3.19
ind5 .0338566 .0075316 4.50
ind6 .0126448 .0072202 1.75
ind7 .0257582 .0077255 3.33
ind8 .015919 .0061348 2.59
ind9 .0020039 .0065446 0.31
ind10 .0237984 .0076903 3.09
ind11 .0372976 .0072394 5.15
ind12 .0041192 .0065721 0.63
ind13 .0146995 .0067628 2.17
ind14 .0152334 .0115545 1.32

68
const. .0373539 .017663 2.11
------------------------------------------------------------------------------
Note: Y1 to Y11 are time dummies while ind1 till ind14 are industry dummies. Size is natural log
of total assets, mb is Market to Book ratio, cf is cash flow, ce is capital expenditures, nwc is net
working capital, v_cash is standard deviation of cash flow, lev is leverage. ANNEXURE A (Continued)
Instruments for first differences equation
Standard
D.(y1 y2 y3 y4 y5 y6 y7 y8 y9 y10 y11 ind1 ind2 ind3 ind4 ind5 ind6 ind7 ind8 ind9 ind10
ind11 ind12 ind13 ind14)
GMM-type (missing=0, separate instruments for each period unless collapsed)
L.(L.chold size mb cf nwc lev ce v_cash y1 y2 y3 y4 y5 y6 y7 y8 y9 y10 y11 ind1 ind2
ind3 ind4 ind5 ind6 ind7 ind8 ind9 ind10 ind11 ind12 ind13 ind14)
Instruments for levels equation
Standard
y1 y2 y3 y4 y5 y6 y7 y8 y9 y10 y11 ind1 ind2 ind3 ind4 ind5 ind6 ind7 ind8 ind9 ind10
ind11 ind12 ind13 ind14
_cons
GMM-type (missing=0, separate instruments for each period unless collapsed)
D.(L.chold size mb cf nwc lev ce v_cash y1 y2 y3 y4 y5 y6 y7 y8 y9 y10 y11 ind1 ind2
ind3 ind4 ind5 ind6 ind7 ind8 ind9 ind10 ind11 ind12 ind13 ind14)
------------------------------------------------------------------------------
Arellano-Bond test for AR(1) in first differences: z = -14.64 Pr > z = 0.000
Arellano-Bond test for AR(2) in first differences: z = 2.24 Pr > z = 0.025
------------------------------------------------------------------------------
Sargan test of overid. restrictions: chi2(271) = 620.49 Prob > chi2 = 0.000
(Not robust, but not weakened by many instruments.)
Difference-in-Sargan tests of exogeneity of instrument subsets:
GMM instruments for levels
Sargan test excluding group: chi2(191) = 324.13 Prob > chi2 = 0.000
Difference (null H = exogenous): chi2(80) = 296.35 Prob > chi2 = 0.000 iv(y1 y2 y3 y4
y5 y6 y7 y8 y9 y10 y11 ind1 ind2 ind3 ind4 ind5 ind6 ind7 ind8 ind9 ind10 ind11 ind12
ind13 ind14)
Sargan test excluding group: chi2(248) = 575.24 Prob > chi2 = 0.000
Difference (null H = exogenous): chi2(23) = 45.25 Prob > chi2 = 0.004
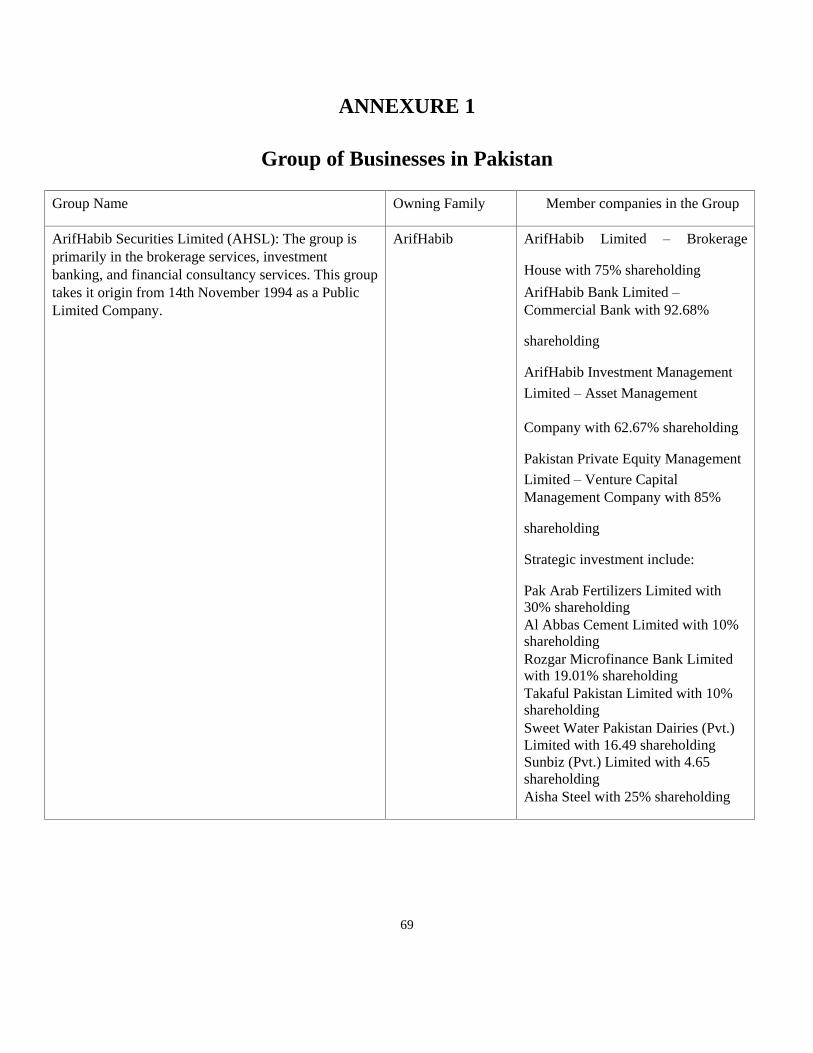
69
ANNEXURE 1
Group of Businesses in Pakistan
Group Name Owning Family Member companies in the Group
ArifHabib Securities Limited (AHSL): The group is
primarily in the brokerage services, investment
banking, and financial consultancy services. This group
takes it origin from 14th November 1994 as a Public
Limited Company.
ArifHabib ArifHabib Limited – Brokerage
House with 75% shareholding
ArifHabib Bank Limited –
Commercial Bank with 92.68%
shareholding
ArifHabib Investment Management
Limited – Asset Management
Company with 62.67% shareholding
Pakistan Private Equity Management
Limited – Venture Capital
Management Company with 85%
shareholding
Strategic investment include:
Pak Arab Fertilizers Limited with
30% shareholding
Al Abbas Cement Limited with 10% shareholding
Rozgar Microfinance Bank Limited with 19.01% shareholding
Takaful Pakistan Limited with 10% shareholding
Sweet Water Pakistan Dairies (Pvt.)
Limited with 16.49 shareholding
Sunbiz (Pvt.) Limited with 4.65
shareholding
Aisha Steel with 25% shareholding
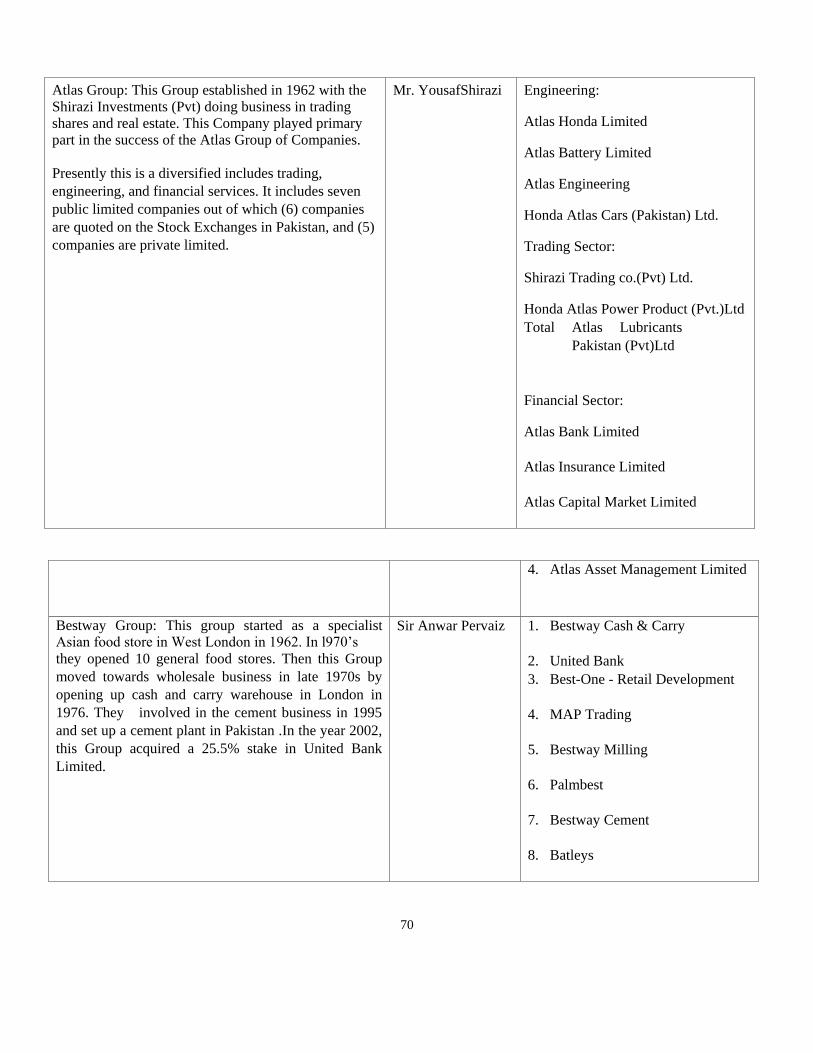
70
Atlas Group: This Group established in 1962 with the
Shirazi Investments (Pvt) doing business in trading
shares and real estate. This Company played primary
part in the success of the Atlas Group of Companies.
Presently this is a diversified includes trading,
engineering, and financial services. It includes seven
public limited companies out of which (6) companies
are quoted on the Stock Exchanges in Pakistan, and (5)
companies are private limited.
Mr. YousafShirazi Engineering:
Atlas Honda Limited
Atlas Battery Limited
Atlas Engineering
Honda Atlas Cars (Pakistan) Ltd.
Trading Sector:
Shirazi Trading co.(Pvt) Ltd.
Honda Atlas Power Product (Pvt.)Ltd
Total Atlas Lubricants
Pakistan (Pvt)Ltd
Financial Sector:
1. Atlas Bank Limited
2. Atlas Insurance Limited
3. Atlas Capital Market Limited
4. Atlas Asset Management Limited
Bestway Group: This group started as a specialist Asian food store in West London in 1962. In l970’s
they opened 10 general food stores. Then this Group
moved towards wholesale business in late 1970s by
opening up cash and carry warehouse in London in
1976. They involved in the cement business in 1995
and set up a cement plant in Pakistan .In the year 2002,
this Group acquired a 25.5% stake in United Bank
Limited.
Sir Anwar Pervaiz 1. Bestway Cash & Carry
2. United Bank
3. Best-One - Retail Development
4. MAP Trading
5. Bestway Milling
6. Palmbest
7. Bestway Cement
8. Batleys
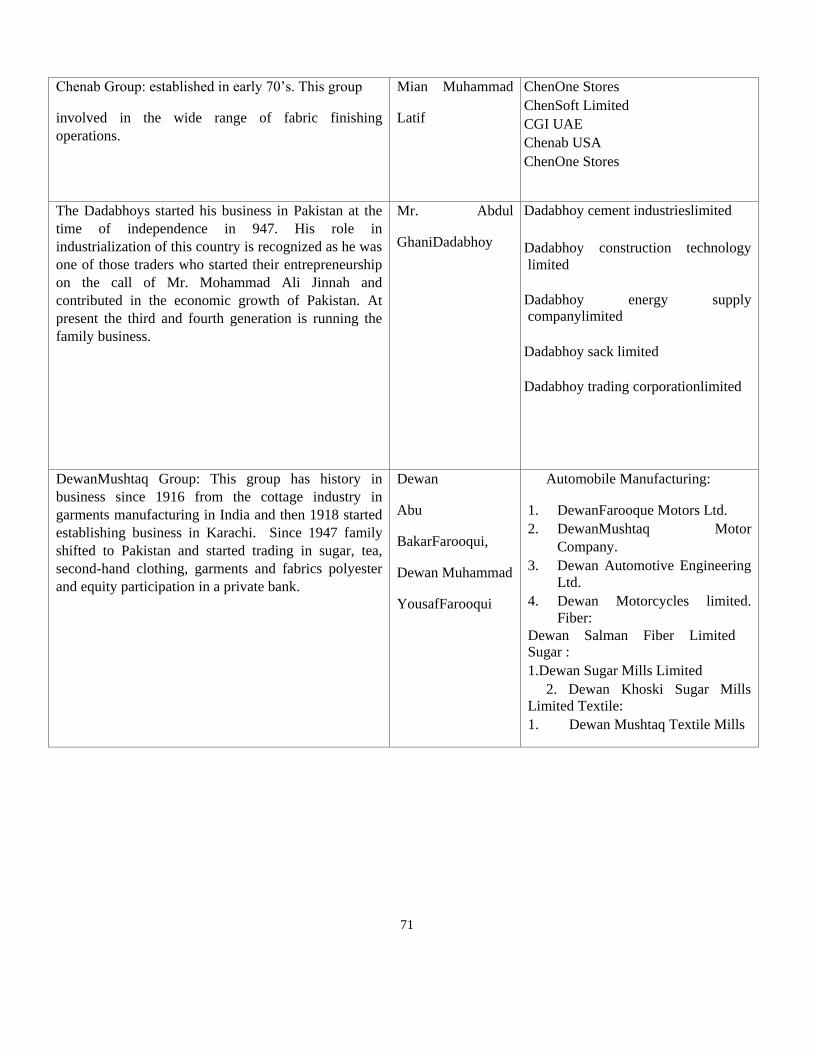
71
Chenab Group: established in early 70’s. This group
involved in the wide range of fabric finishing
operations.
Mian Muhammad
Latif
1 ChenOne Stores
2 ChenSoft Limited
3 CGI UAE
4 Chenab USA
5 ChenOne Stores
The Dadabhoys started his business in Pakistan at the
time of independence in 947. His role in
industrialization of this country is recognized as he was
one of those traders who started their entrepreneurship
on the call of Mr. Mohammad Ali Jinnah and
contributed in the economic growth of Pakistan. At
present the third and fourth generation is running the
family business.
Mr. Abdul
GhaniDadabhoy
1. Dadabhoy cement industrieslimited
2. Dadabhoy construction technology
limited
3. Dadabhoy energy supply companylimited
4. Dadabhoy sack limited
5. Dadabhoy trading corporationlimited
DewanMushtaq Group: This group has history in
business since 1916 from the cottage industry in
garments manufacturing in India and then 1918 started
establishing business in Karachi. Since 1947 family
shifted to Pakistan and started trading in sugar, tea,
second-hand clothing, garments and fabrics polyester
and equity participation in a private bank.
Dewan
Abu
BakarFarooqui,
Dewan Muhammad
YousafFarooqui
Automobile Manufacturing:
1. DewanFarooque Motors Ltd.
2. DewanMushtaq Motor
Company.
3. Dewan Automotive Engineering
Ltd.
4. Dewan Motorcycles limited.
Fiber:
Dewan Salman Fiber Limited Sugar :
1.Dewan Sugar Mills Limited
2. Dewan Khoski Sugar Mills
Limited Textile:
1. Dewan Mushtaq Textile Mills
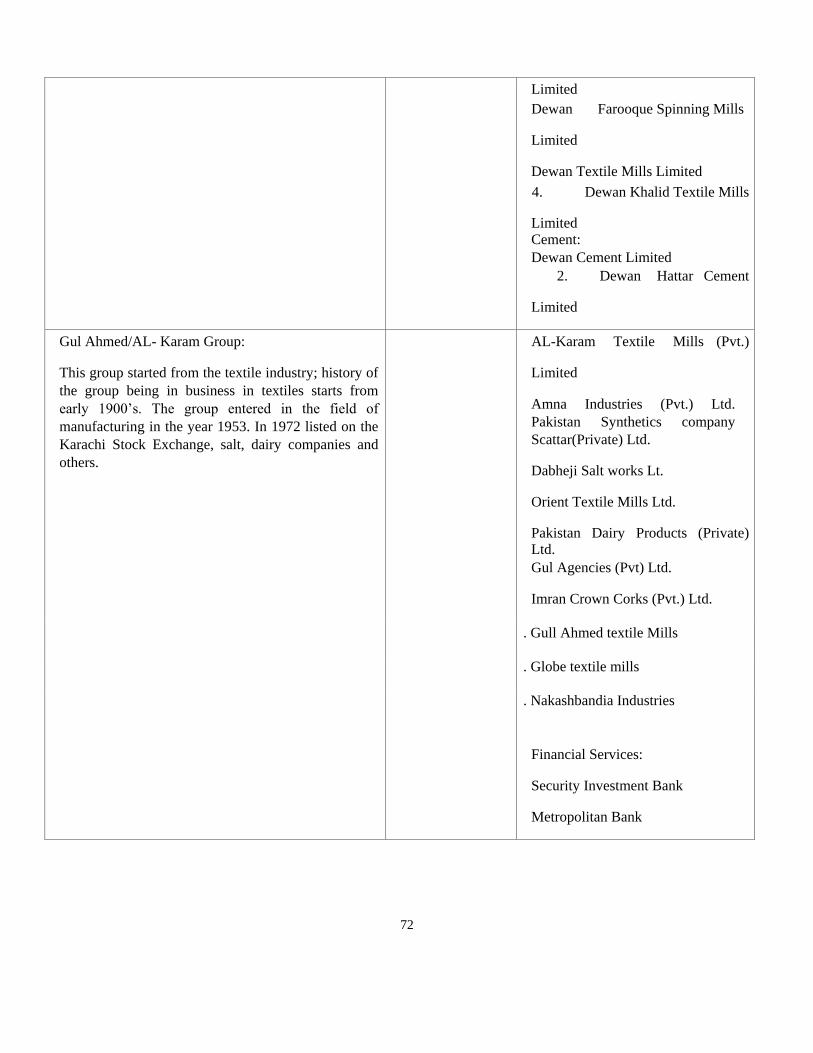
72
Limited
Dewan Farooque Spinning Mills
Limited
Dewan Textile Mills Limited
4. Dewan Khalid Textile Mills
Limited Cement:
Dewan Cement Limited
2. Dewan Hattar Cement
Limited
Gul Ahmed/AL- Karam Group:
This group started from the textile industry; history of
the group being in business in textiles starts from
early 1900’s. The group entered in the field of
manufacturing in the year 1953. In 1972 listed on the
Karachi Stock Exchange, salt, dairy companies and
others.
AL-Karam Textile Mills (Pvt.)
Limited
Amna Industries (Pvt.) Ltd.
Pakistan Synthetics company
Scattar(Private) Ltd.
Dabheji Salt works Lt.
Orient Textile Mills Ltd.
Pakistan Dairy Products (Private) Ltd.
Gul Agencies (Pvt) Ltd.
Imran Crown Corks (Pvt.) Ltd.
. Gull Ahmed textile Mills
. Globe textile mills
. Nakashbandia Industries
Financial Services:
Security Investment Bank
Metropolitan Bank
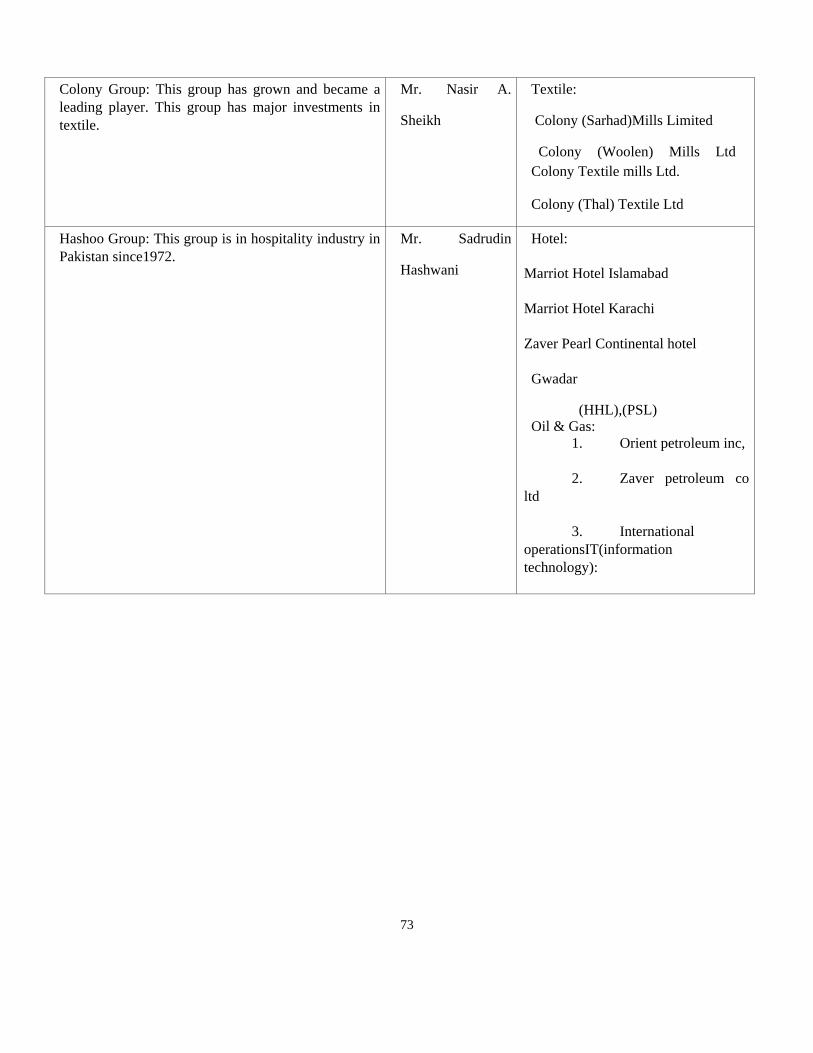
73
Colony Group: This group has grown and became a
leading player. This group has major investments in
textile.
Mr. Nasir A.
Sheikh
Textile:
Colony (Sarhad)Mills Limited
Colony (Woolen) Mills Ltd
Colony Textile mills Ltd.
Colony (Thal) Textile Ltd
Hashoo Group: This group is in hospitality industry in
Pakistan since1972.
Mr. Sadrudin
Hashwani
Hotel:
1. Marriot Hotel Islamabad
2. Marriot Hotel Karachi
3. Zaver Pearl Continental hotel
Gwadar
(HHL),(PSL) Oil & Gas:
1. Orient petroleum inc,
2. Zaver petroleum co
ltd
3. International
operationsIT(information
technology):
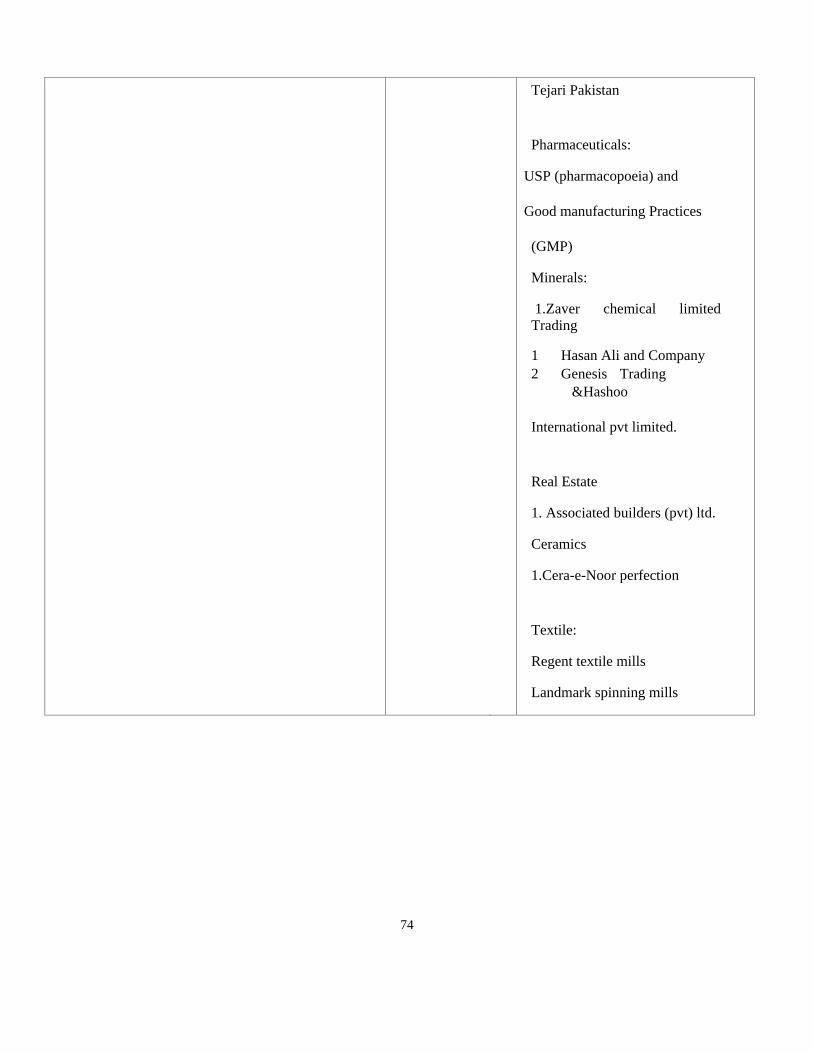
74
Tejari Pakistan
Pharmaceuticals:
1. USP (pharmacopoeia) and
2. Good manufacturing Practices
(GMP)
Minerals:
1.Zaver chemical limited
Trading
1 Hasan Ali and Company
2 Genesis Trading
&Hashoo
International pvt limited.
Real Estate
1. Associated builders (pvt) ltd.
Ceramics
1.Cera-e-Noor perfection
Textile:
Regent textile mills
Landmark spinning mills
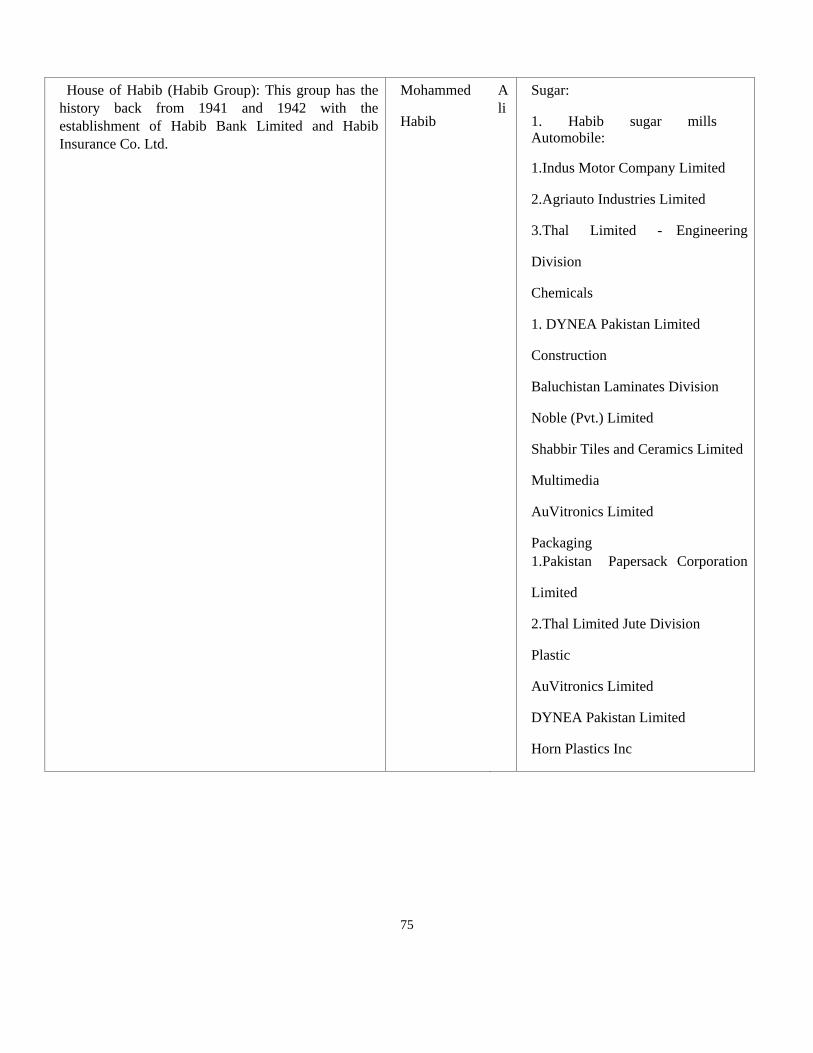
75
House of Habib (Habib Group): This group has the
history back from 1941 and 1942 with the
establishment of Habib Bank Limited and Habib
Insurance Co. Ltd.
Mohammed
Habib
A
li
Sugar:
1. Habib sugar mills Automobile:
1.Indus Motor Company Limited
2.Agriauto Industries Limited
3.Thal Limited - Engineering
Division
Chemicals
1. DYNEA Pakistan Limited
Construction
Baluchistan Laminates Division
Noble (Pvt.) Limited
Shabbir Tiles and Ceramics Limited
Multimedia
AuVitronics Limited
Packaging
1.Pakistan Papersack Corporation
Limited
2.Thal Limited Jute Division
Plastic
AuVitronics Limited
DYNEA Pakistan Limited
Horn Plastics Inc
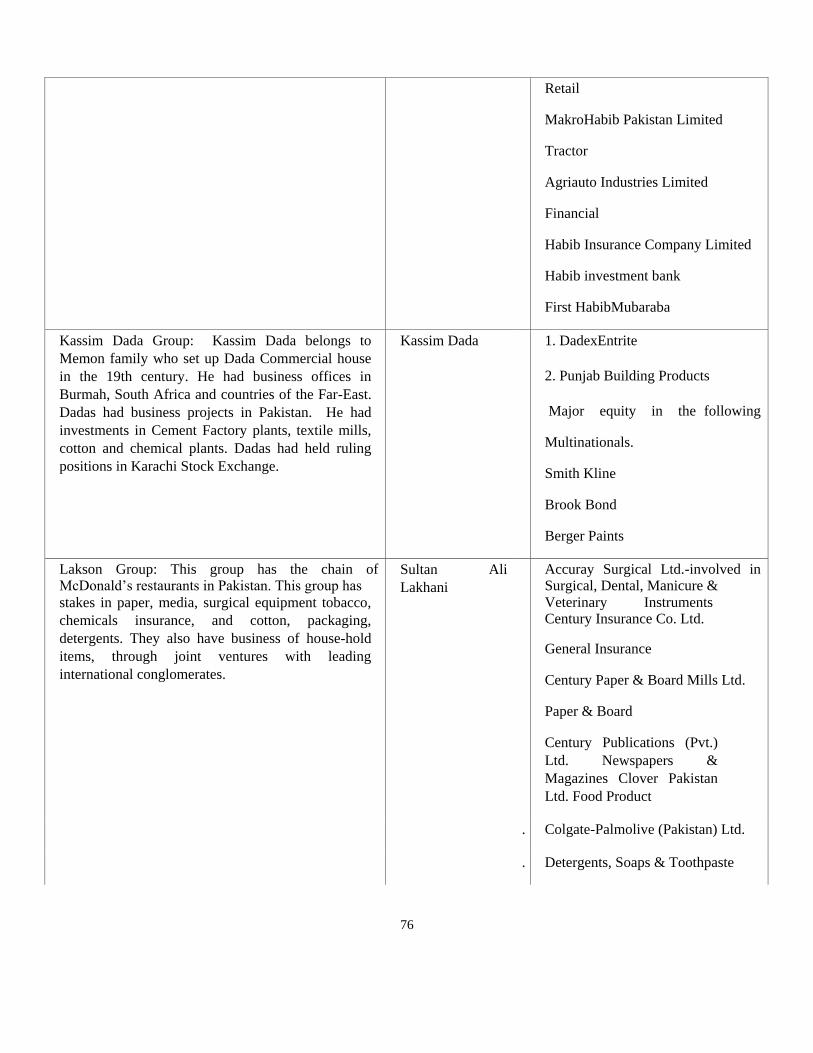
76
Retail
MakroHabib Pakistan Limited
Tractor
Agriauto Industries Limited
Financial
Habib Insurance Company Limited
Habib investment bank
First HabibMubaraba
Kassim Dada Group: Kassim Dada belongs to
Memon family who set up Dada Commercial house
in the 19th century. He had business offices in
Burmah, South Africa and countries of the Far-East.
Dadas had business projects in Pakistan. He had
investments in Cement Factory plants, textile mills,
cotton and chemical plants. Dadas had held ruling
positions in Karachi Stock Exchange.
Kassim Dada 1. DadexEntrite
2. Punjab Building Products
Major equity in the following
Multinationals.
Smith Kline
Brook Bond
Berger Paints
Lakson Group: This group has the chain of McDonald’s restaurants in Pakistan. This group has
stakes in paper, media, surgical equipment tobacco,
chemicals insurance, and cotton, packaging,
detergents. They also have business of house-hold
items, through joint ventures with leading
international conglomerates.
Sultan Ali
Lakhani
Accuray Surgical Ltd.-involved in Surgical, Dental, Manicure &
Veterinary Instruments Century Insurance Co. Ltd.
General Insurance
Century Paper & Board Mills Ltd.
Paper & Board
Century Publications (Pvt.)
Ltd. Newspapers &
Magazines Clover Pakistan
Ltd. Food Product
. Colgate-Palmolive (Pakistan) Ltd.
. Detergents, Soaps & Toothpaste
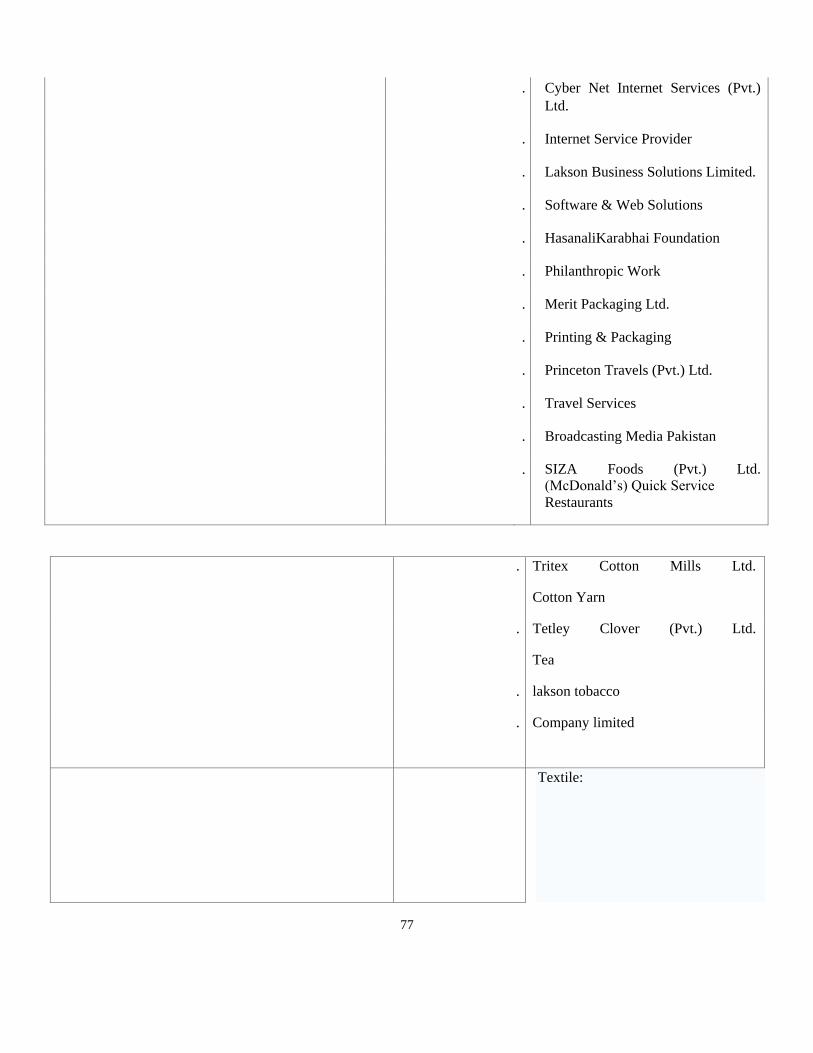
77
. Cyber Net Internet Services (Pvt.)
Ltd.
. Internet Service Provider
. Lakson Business Solutions Limited.
. Software & Web Solutions
. HasanaliKarabhai Foundation
. Philanthropic Work
. Merit Packaging Ltd.
. Printing & Packaging
. Princeton Travels (Pvt.) Ltd.
. Travel Services
. Broadcasting Media Pakistan
. SIZA Foods (Pvt.) Ltd. (McDonald’s) Quick Service
Restaurants
. Tritex Cotton Mills Ltd.
Cotton Yarn
. Tetley Clover (Pvt.) Ltd.
Tea
. lakson tobacco
. Company limited
Textile:

78
.
Nishat textiles
Nishatchunian Ltd
Umer Fabrics
Cement:
Dera Ghazi Khan Cement Company
Financial services:
Muslim Commercial Bank
Fidelity Investment Bank
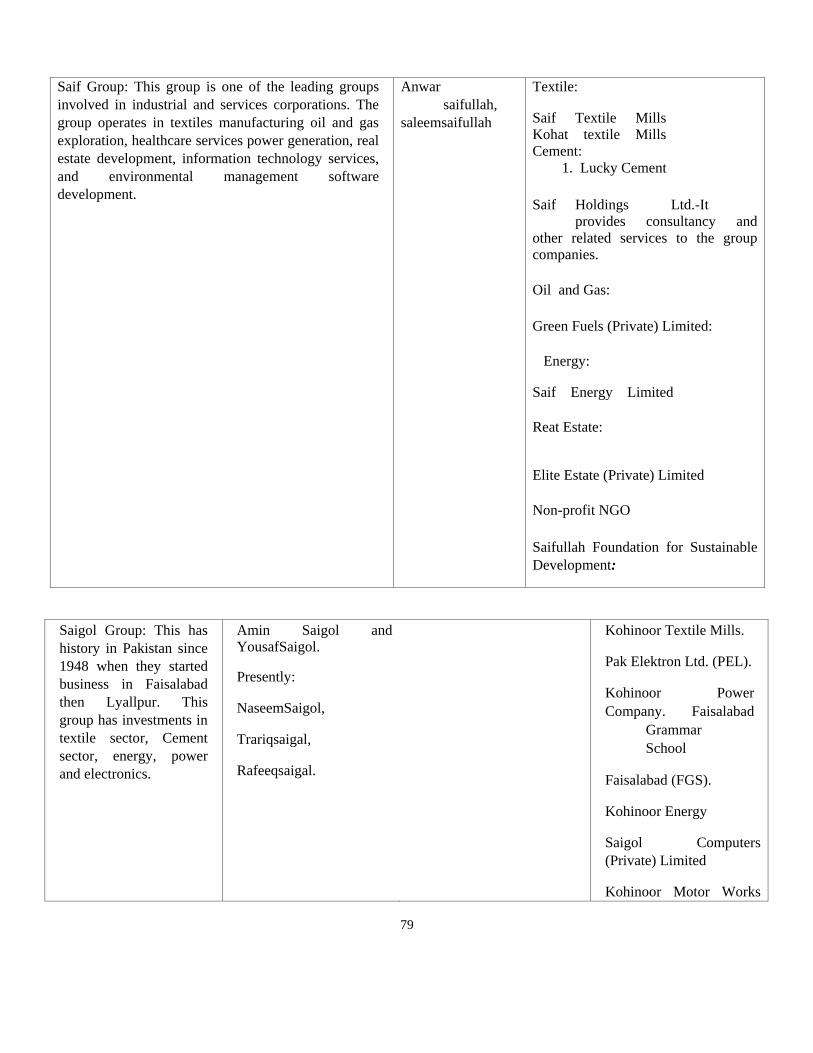
79
Saif Group: This group is one of the leading groups
involved in industrial and services corporations. The
group operates in textiles manufacturing oil and gas
exploration, healthcare services power generation, real
estate development, information technology services,
and environmental management software
development.
Anwar
saifullah,
saleemsaifullah
Textile:
Saif Textile Mills
Kohat textile Mills
Cement:
1. Lucky Cement
Saif Holdings Ltd.-It
provides consultancy and
other related services to the group
companies.
Oil and Gas:
Green Fuels (Private) Limited:
Energy:
Saif Energy Limited
Reat Estate:
Elite Estate (Private) Limited
Non-profit NGO
Saifullah Foundation for Sustainable
Development:
Saigol Group: This has
history in Pakistan since
1948 when they started
business in Faisalabad
then Lyallpur. This
group has investments in
textile sector, Cement
sector, energy, power
and electronics.
Amin Saigol and YousafSaigol.
Presently:
NaseemSaigol,
Trariqsaigal,
Rafeeqsaigal.
Kohinoor Textile Mills.
Pak Elektron Ltd. (PEL).
Kohinoor Power
Company. Faisalabad
Grammar
School
Faisalabad (FGS).
Kohinoor Energy
Saigol Computers
(Private) Limited
Kohinoor Motor Works
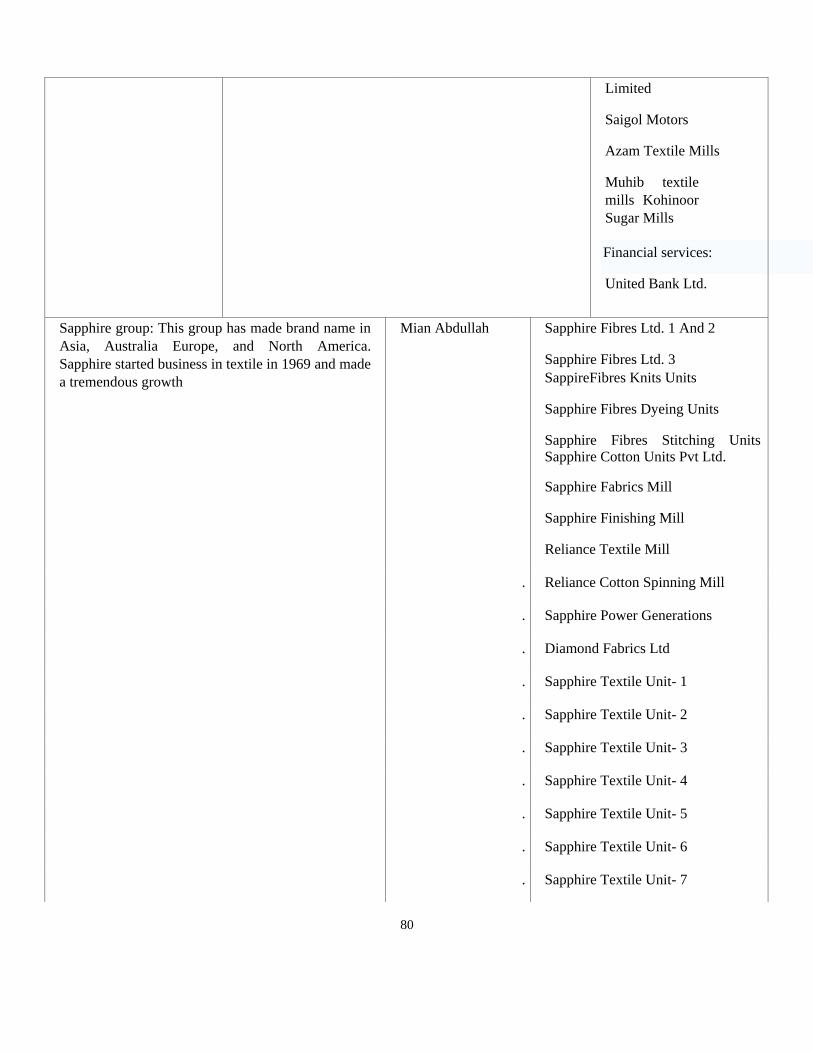
80
Limited
Saigol Motors
Azam Textile Mills
Muhib textile
mills Kohinoor
Sugar Mills
Financial services:
United Bank Ltd.
Sapphire group: This group has made brand name in
Asia, Australia Europe, and North America.
Sapphire started business in textile in 1969 and made
a tremendous growth
Mian Abdullah Sapphire Fibres Ltd. 1 And 2
Sapphire Fibres Ltd. 3
SappireFibres Knits Units
Sapphire Fibres Dyeing Units
Sapphire Fibres Stitching Units
Sapphire Cotton Units Pvt Ltd.
Sapphire Fabrics Mill
Sapphire Finishing Mill
Reliance Textile Mill
. Reliance Cotton Spinning Mill
. Sapphire Power Generations
. Diamond Fabrics Ltd
. Sapphire Textile Unit- 1
. Sapphire Textile Unit- 2
. Sapphire Textile Unit- 3
. Sapphire Textile Unit- 4
. Sapphire Textile Unit- 5
. Sapphire Textile Unit- 6
. Sapphire Textile Unit- 7
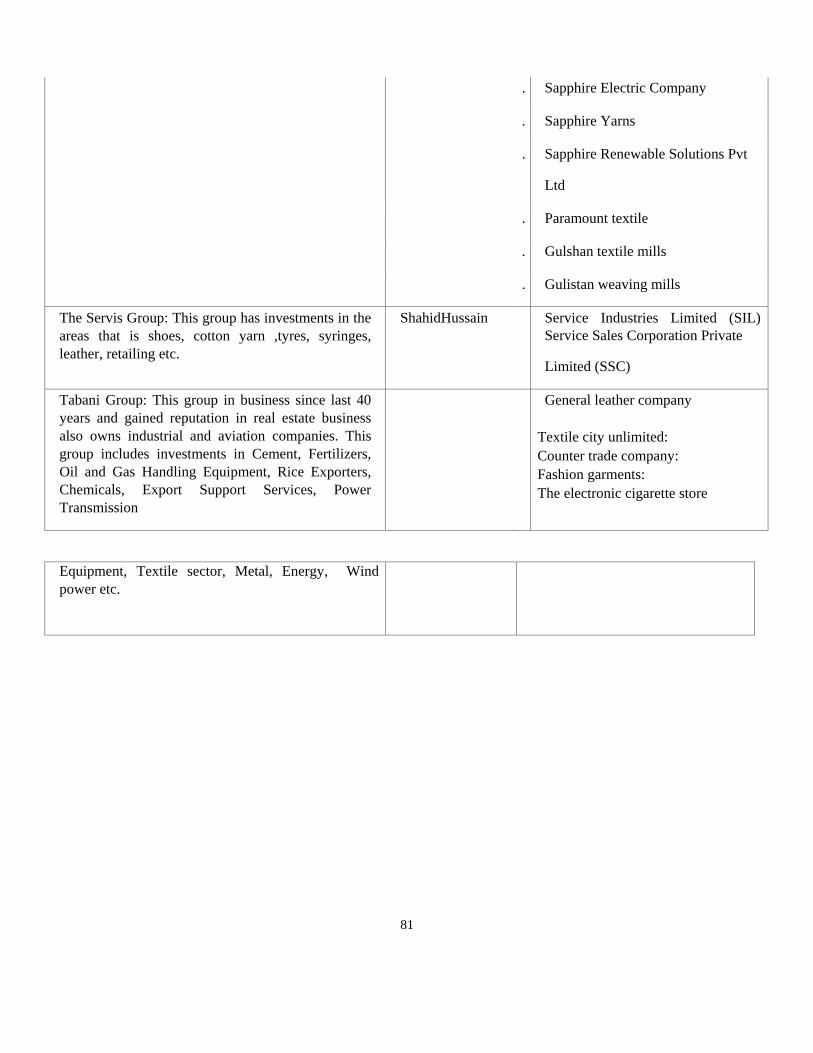
81
. Sapphire Electric Company
. Sapphire Yarns
. Sapphire Renewable Solutions Pvt
Ltd
. Paramount textile
. Gulshan textile mills
. Gulistan weaving mills
The Servis Group: This group has investments in the
areas that is shoes, cotton yarn ,tyres, syringes,
leather, retailing etc.
ShahidHussain Service Industries Limited (SIL)
Service Sales Corporation Private
Limited (SSC)
Tabani Group: This group in business since last 40
years and gained reputation in real estate business
also owns industrial and aviation companies. This
group includes investments in Cement, Fertilizers,
Oil and Gas Handling Equipment, Rice Exporters,
Chemicals, Export Support Services, Power
Transmission
General leather company
2. Textile city unlimited:
3. Counter trade company:
4. Fashion garments:
5. The electronic cigarette store
Equipment, Textile sector, Metal, Energy, Wind
power etc.
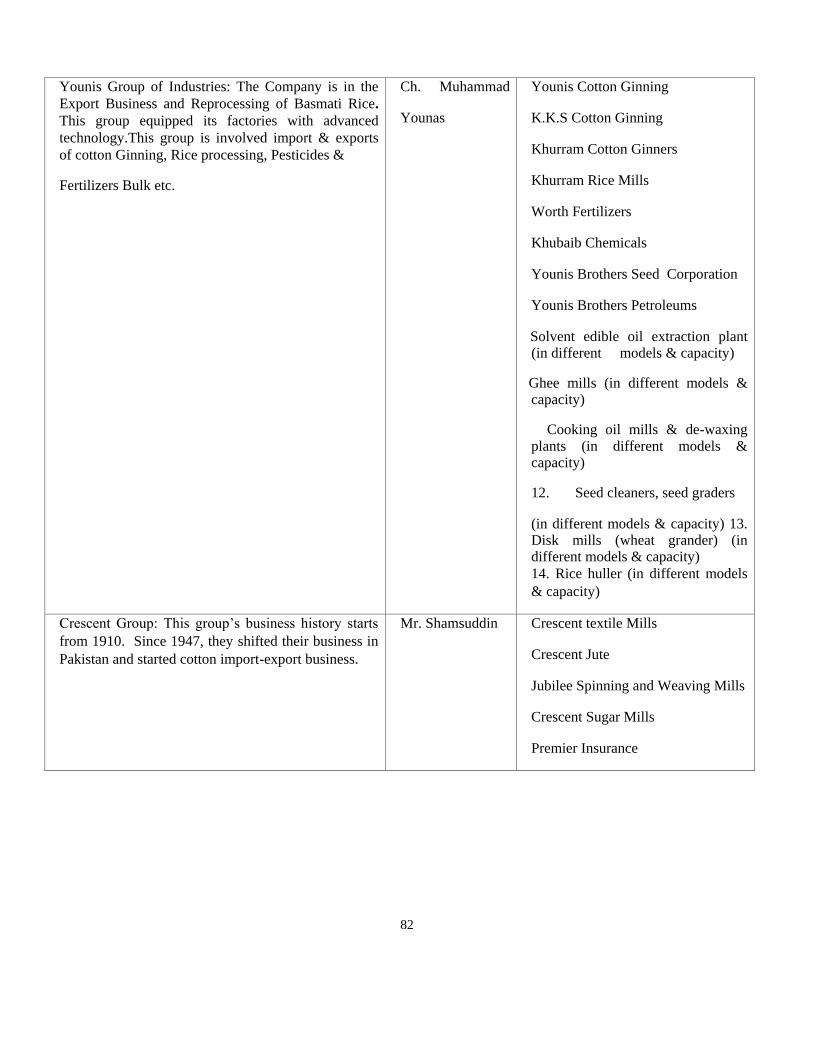
82
Younis Group of Industries: The Company is in the
Export Business and Reprocessing of Basmati Rice.
This group equipped its factories with advanced
technology.This group is involved import & exports
of cotton Ginning, Rice processing, Pesticides &
Fertilizers Bulk etc.
Ch. Muhammad
Younas
Younis Cotton Ginning
K.K.S Cotton Ginning
Khurram Cotton Ginners
Khurram Rice Mills
Worth Fertilizers
Khubaib Chemicals
Younis Brothers Seed Corporation
Younis Brothers Petroleums
Solvent edible oil extraction plant (in different models & capacity)
Ghee mills (in different models & capacity)
Cooking oil mills & de-waxing
plants (in different models & capacity)
12. Seed cleaners, seed graders
(in different models & capacity) 13. Disk mills (wheat grander) (in different models & capacity)
14. Rice huller (in different models
& capacity)
Crescent Group: This group’s business history starts
from 1910. Since 1947, they shifted their business in
Pakistan and started cotton import-export business.
Mr. Shamsuddin Crescent textile Mills
Crescent Jute
Jubilee Spinning and Weaving Mills
Crescent Sugar Mills
Premier Insurance
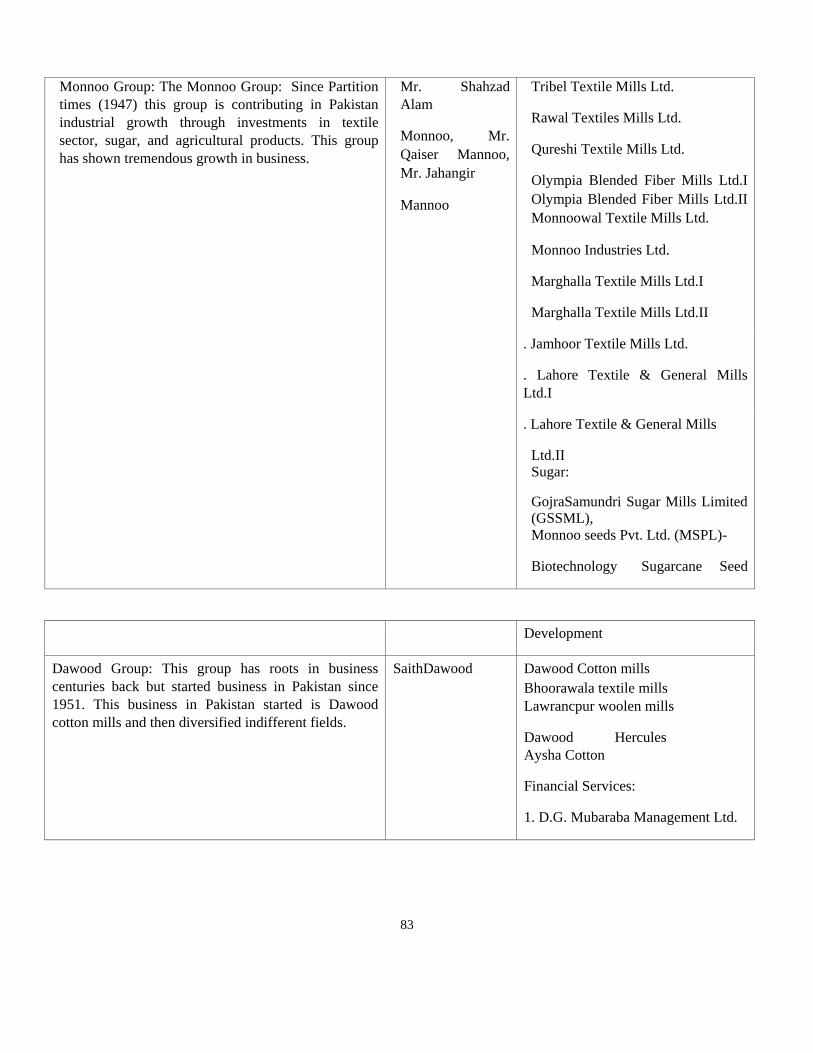
83
Monnoo Group: The Monnoo Group: Since Partition
times (1947) this group is contributing in Pakistan
industrial growth through investments in textile
sector, sugar, and agricultural products. This group
has shown tremendous growth in business.
Mr. Shahzad
Alam
Monnoo, Mr.
Qaiser Mannoo,
Mr. Jahangir
Mannoo
Tribel Textile Mills Ltd.
Rawal Textiles Mills Ltd.
Qureshi Textile Mills Ltd.
Olympia Blended Fiber Mills Ltd.I
Olympia Blended Fiber Mills Ltd.II
Monnoowal Textile Mills Ltd.
Monnoo Industries Ltd.
Marghalla Textile Mills Ltd.I
Marghalla Textile Mills Ltd.II
. Jamhoor Textile Mills Ltd.
. Lahore Textile & General Mills
Ltd.I
. Lahore Textile & General Mills
Ltd.II Sugar:
GojraSamundri Sugar Mills Limited (GSSML),
Monnoo seeds Pvt. Ltd. (MSPL)-
Biotechnology Sugarcane Seed
Development
Dawood Group: This group has roots in business
centuries back but started business in Pakistan since
1951. This business in Pakistan started is Dawood
cotton mills and then diversified indifferent fields.
SaithDawood Dawood Cotton mills
Bhoorawala textile mills
Lawrancpur woolen mills
Dawood Hercules
Aysha Cotton
Financial Services:
1. D.G. Mubaraba Management Ltd.
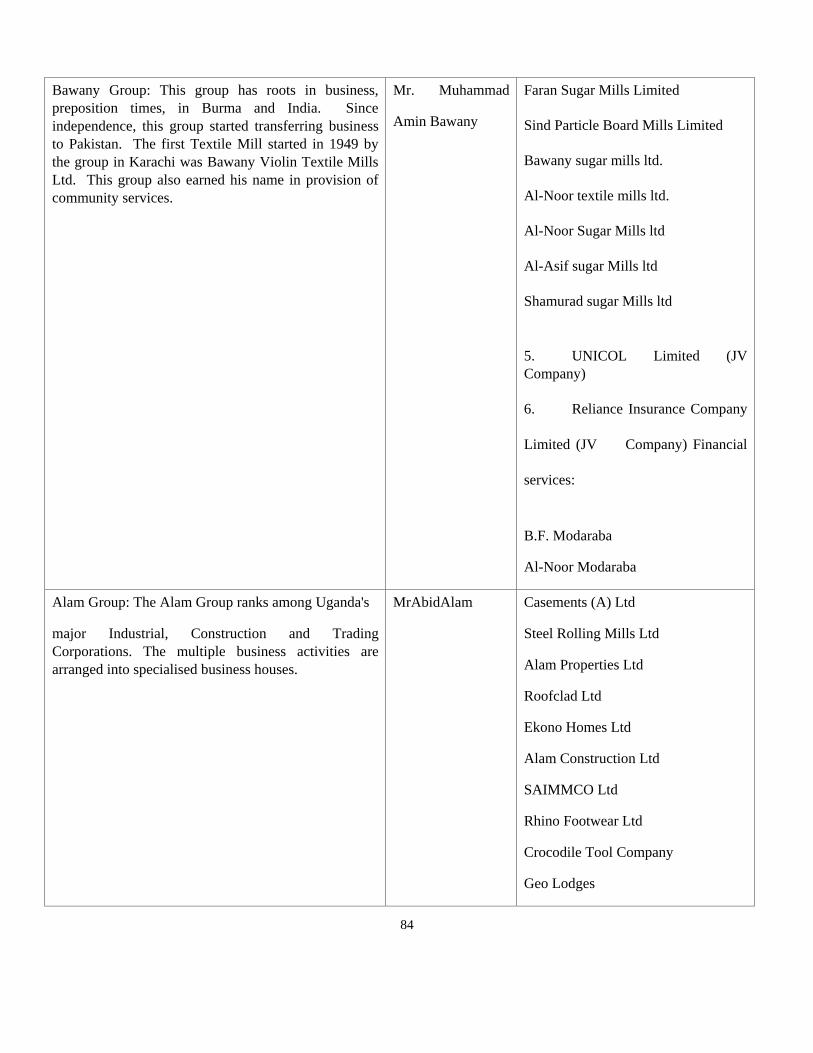
84
Bawany Group: This group has roots in business,
preposition times, in Burma and India. Since
independence, this group started transferring business
to Pakistan. The first Textile Mill started in 1949 by
the group in Karachi was Bawany Violin Textile Mills
Ltd. This group also earned his name in provision of
community services.
Mr. Muhammad
Amin Bawany
1. Faran Sugar Mills Limited
2. Sind Particle Board Mills Limited
3. Bawany sugar mills ltd.
4. Al-Noor textile mills ltd.
5. Al-Noor Sugar Mills ltd
6. Al-Asif sugar Mills ltd
7. Shamurad sugar Mills ltd
5. UNICOL Limited (JV
Company)
6. Reliance Insurance Company
Limited (JV Company) Financial
services:
B.F. Modaraba
Al-Noor Modaraba
Alam Group: The Alam Group ranks among Uganda's
major Industrial, Construction and Trading
Corporations. The multiple business activities are
arranged into specialised business houses.
MrAbidAlam Casements (A) Ltd
Steel Rolling Mills Ltd
Alam Properties Ltd
Roofclad Ltd
Ekono Homes Ltd
Alam Construction Ltd
SAIMMCO Ltd
Rhino Footwear Ltd
Crocodile Tool Company
Geo Lodges

85
Aerostar
Kusco
EjazGROUP:
This group is in operation since 1950 in Pakistan. Up
till 1980s this group remained involved in trading
activities in the field of chemicals, oil, textile etc. Late
1980s they started to work in textile manufacturing.
MianNazir Sons 1.Ejaz Spinning Unit - I
2. Ejaz Spinning Unit - II
3. Ejaz Spinning Unit - III
4 Compact Yarn Unit
5 Ejaz Textile Mills Limited
6 Ejaz Dyeing and Finishing Mills
Limited
7 Ejaz Power Limited
Abid Group: This group earned its repute in
construction and real estate.
Mr Sheikh
AbidHussain
Construction Projects:
Adamjee Group: This group has history in business
since 1922. In 1927 the first muslin“AdamjeeJute Mill
Ltd”was established. After creation of Pakistan, they
had investments both in East and West Pakistan.
Sir Adamjee Haji
Dawood
1. Adamjee engineering private limited
2. Adamjee paper mills
3. Adamjee jute mills
4. Orient airways
5. K.S.B Ltd.
Financial services:
1. Adamjee insurance company
limited
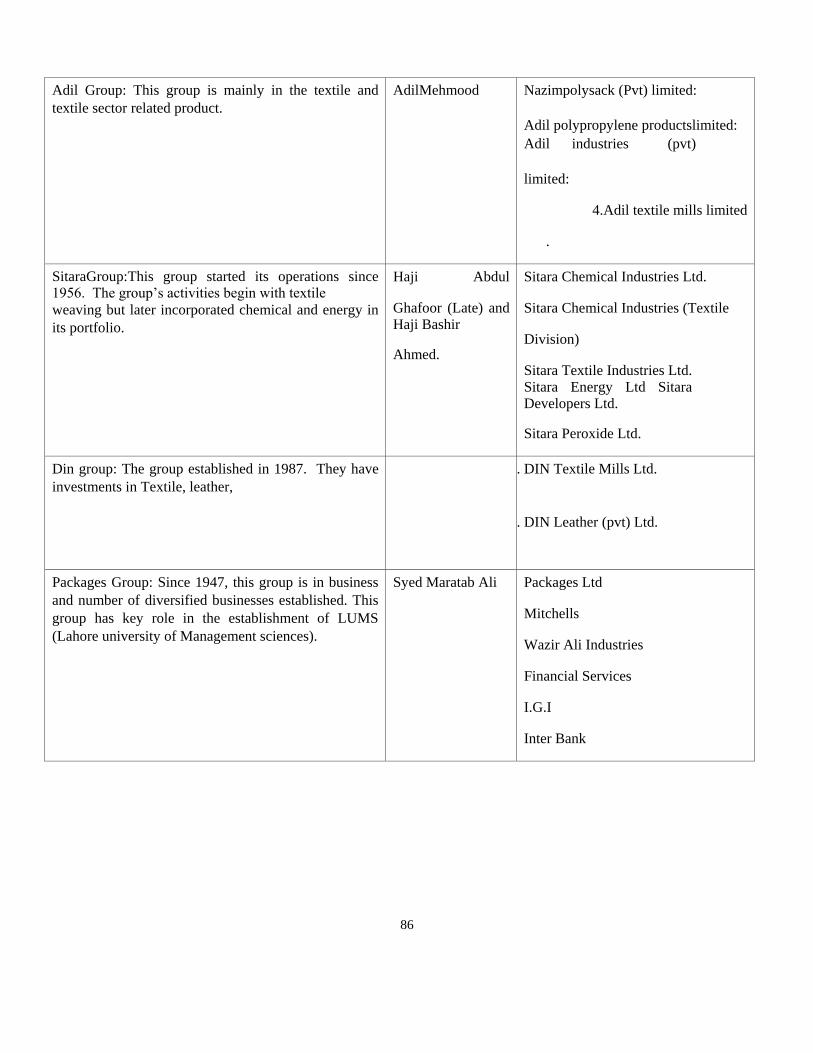
86
Adil Group: This group is mainly in the textile and
textile sector related product.
AdilMehmood 1. Nazimpolysack (Pvt) limited:
2. Adil polypropylene productslimited:
3. Adil industries (pvt)
limited:
4.Adil textile mills limited
.
SitaraGroup:This group started its operations since 1956. The group’s activities begin with textile
weaving but later incorporated chemical and energy in
its portfolio.
Haji Abdul
Ghafoor (Late) and Haji Bashir
Ahmed.
Sitara Chemical Industries Ltd.
Sitara Chemical Industries (Textile
Division)
Sitara Textile Industries Ltd.
Sitara Energy Ltd Sitara Developers Ltd.
Sitara Peroxide Ltd.
Din group: The group established in 1987. They have
investments in Textile, leather,
1. DIN Textile Mills Ltd.
2. DIN Leather (pvt) Ltd.
Packages Group: Since 1947, this group is in business
and number of diversified businesses established. This
group has key role in the establishment of LUMS
(Lahore university of Management sciences).
Syed Maratab Ali Packages Ltd
Mitchells
Wazir Ali Industries
Financial Services
I.G.I
Inter Bank

87
Chakwal group: This group started business since 1942
by establishing Chakwal textile mills in chakwal and
then diversified their business in cement, and financial
services.
Khawaja
Muhammad Javed
Amin spinning Mills
Kohinoor Spinning mills
Chakwal spinning Chakwal cement
Financial Services:
Platinum Bank Ltd.
Fecto Group: This group history back 1947. This
group has major investments in sugar and cement
sectors.
Mr. Ghulam
Muhammad
Baba Frid Sugar mills Fecto sugar mills
Fecto cement ltd.
United Group: This group has major investments in
sugar and textile sectors.
Mr. Muhammad
Saleem
Ahmed Spinning mills ltd
Sajjad textile mills Sana fabrics
Sugar
United sugar Mills Ltd.
Pasroor Sugar Mills
Kohistan Group: This group has major investments in
textile sector.
Mr. Masood Masood textile ltd
Mahmood textile ltd
Asim textile ltd
Fateh group: This group has major investments in
textile sector.
Fateh Textile mills Ltd.
Fatehsports wear ltd.
Feteh industries ltd.
Sargogha Group: This group has major investments in
textile and sugar sector.
Mian Muhammad
Aslam
Textile:
Shadab Textile mills
Shadman Textile mills
Sargodha spinning mills Sugar:
1. Hussain sugar mill Ltd.
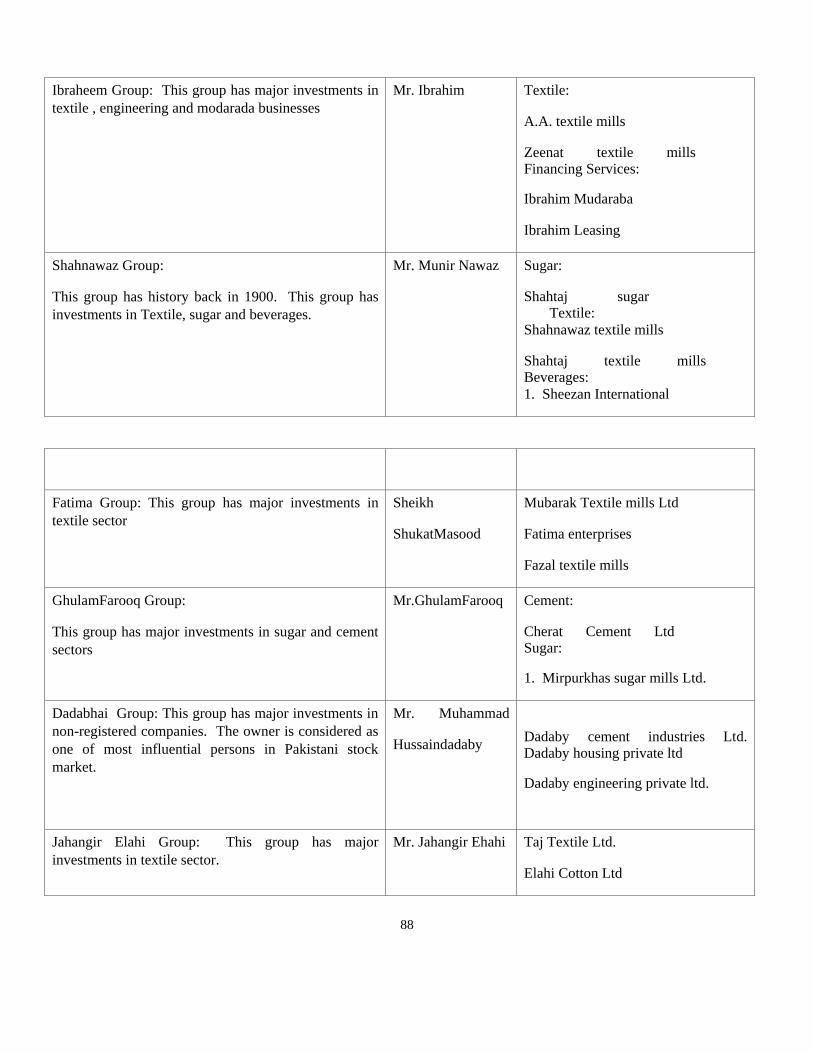
88
Ibraheem Group: This group has major investments in
textile , engineering and modarada businesses
Mr. Ibrahim Textile:
A.A. textile mills
Zeenat textile mills Financing Services:
Ibrahim Mudaraba
Ibrahim Leasing
Shahnawaz Group:
This group has history back in 1900. This group has
investments in Textile, sugar and beverages.
Mr. Munir Nawaz Sugar:
Shahtaj sugar Textile:
Shahnawaz textile mills
Shahtaj textile mills Beverages:
1. Sheezan International
Fatima Group: This group has major investments in
textile sector
Sheikh
ShukatMasood
Mubarak Textile mills Ltd
Fatima enterprises
Fazal textile mills
GhulamFarooq Group:
This group has major investments in sugar and cement
sectors
Mr.GhulamFarooq Cement:
Cherat Cement Ltd Sugar:
1. Mirpurkhas sugar mills Ltd.
Dadabhai Group: This group has major investments in
non-registered companies. The owner is considered as
one of most influential persons in Pakistani stock
market.
Mr. Muhammad
Hussaindadaby Dadaby cement industries Ltd. Dadaby housing private ltd
Dadaby engineering private ltd.
Jahangir Elahi Group: This group has major
investments in textile sector.
Mr. Jahangir Ehahi Taj Textile Ltd.
Elahi Cotton Ltd
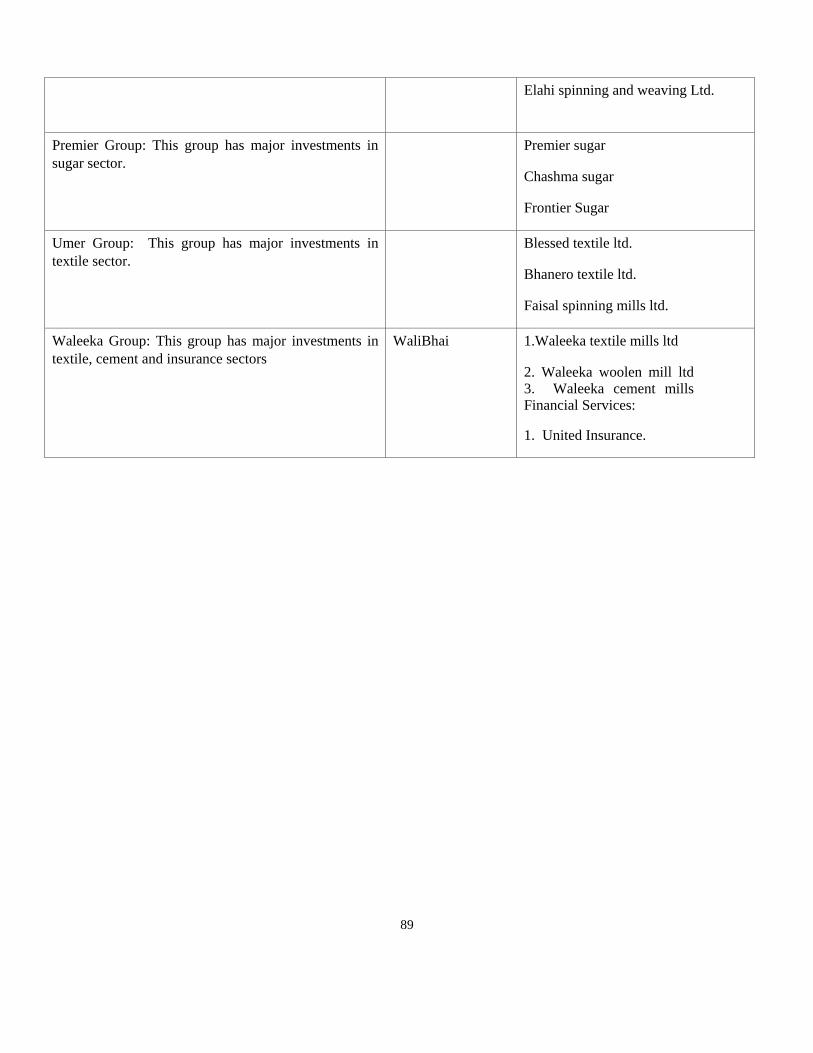
89
Elahi spinning and weaving Ltd.
Premier Group: This group has major investments in
sugar sector.
Premier sugar
Chashma sugar
Frontier Sugar
Umer Group: This group has major investments in
textile sector.
Blessed textile ltd.
Bhanero textile ltd.
Faisal spinning mills ltd.
Waleeka Group: This group has major investments in
textile, cement and insurance sectors
WaliBhai 1.Waleeka textile mills ltd
2. Waleeka woolen mill ltd
3. Waleeka cement mills Financial Services:
1. United Insurance.