Describing Bivariate Relationships 17.871 Spring 2006.
21
Describing Bivariate Relationships 17.871 Spring 2006
-
date post
20-Dec-2015 -
Category
Documents
-
view
219 -
download
0
Transcript of Describing Bivariate Relationships 17.871 Spring 2006.
Describing Bivariate Relationships
17.871
Spring 2006
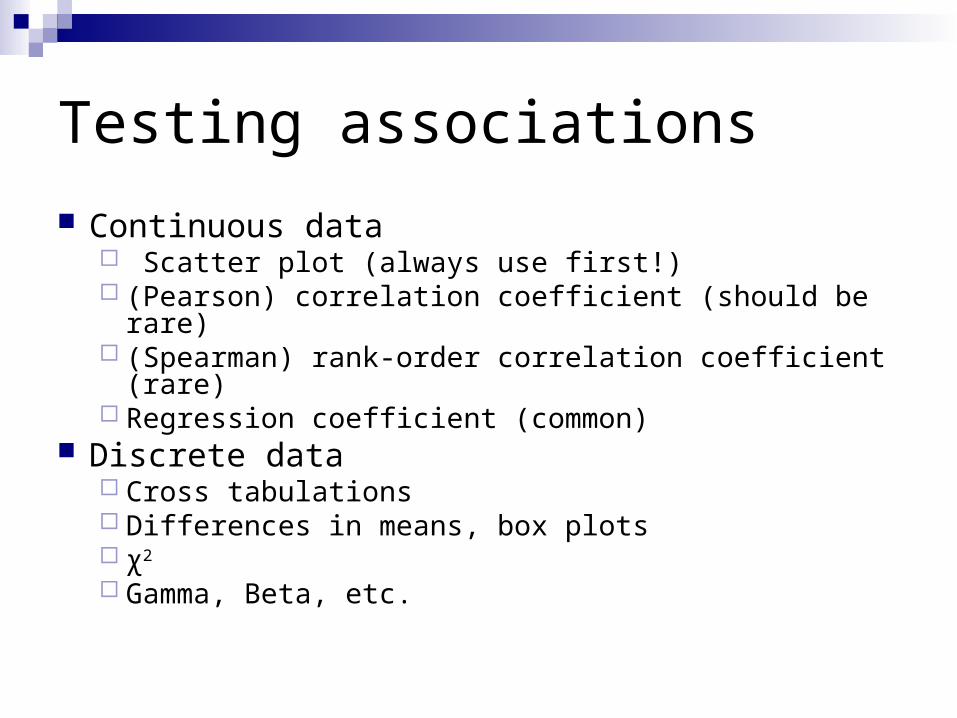
Testing associations
Continuous data Scatter plot (always use first!) (Pearson) correlation coefficient (should be rare) (Spearman) rank-order correlation coefficient (rare) Regression coefficient (common)
Discrete data Cross tabulations Differences in means, box plots χ2
Gamma, Beta, etc.
Continuous DV, continuous EV
Example: What is the relationship between Bush’s vote (by county) in 2000 and in 2004?
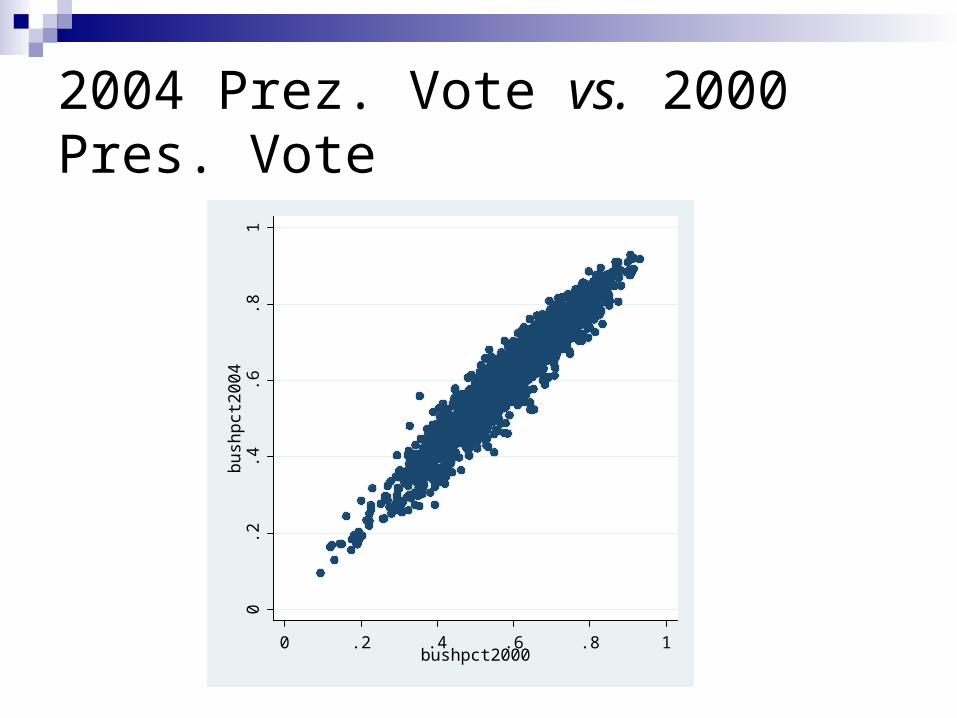
2004 Prez. Vote vs. 2000 Pres. Vote
0.2
.4.6
.81
bu
shp
ct2
00
4
0 .2 .4 .6 .8 1bushpct2000
-.6
-.4
-.2
0.2
.4n
ew
20
04
-.6 -.4 -.2 0 .2 .4new2000
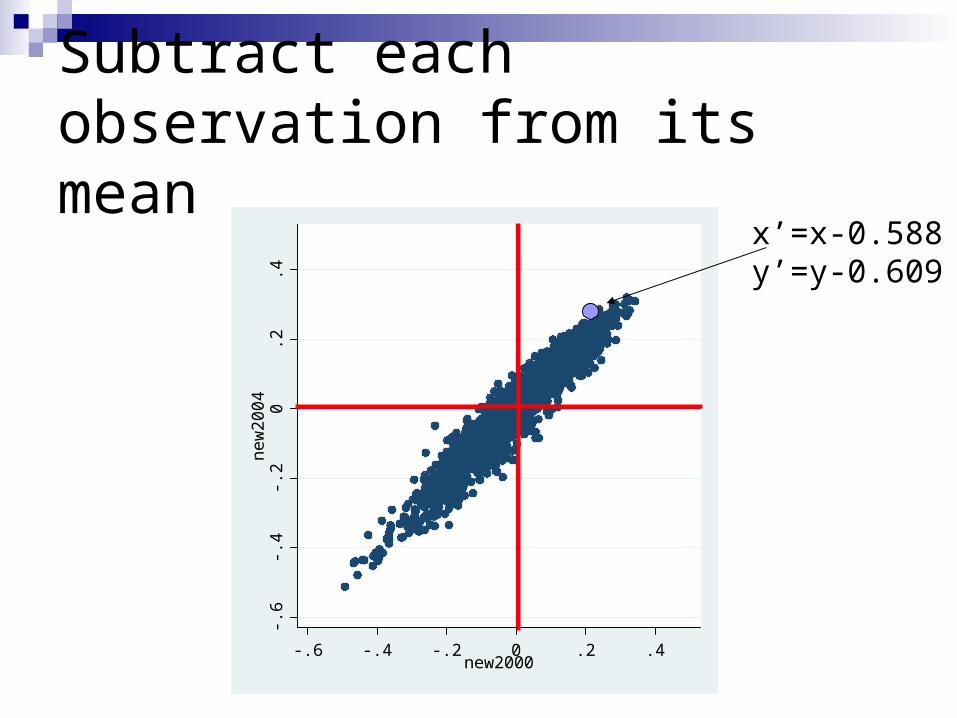
Subtract each observation from its mean
x’=x-0.588y’=y-0.609
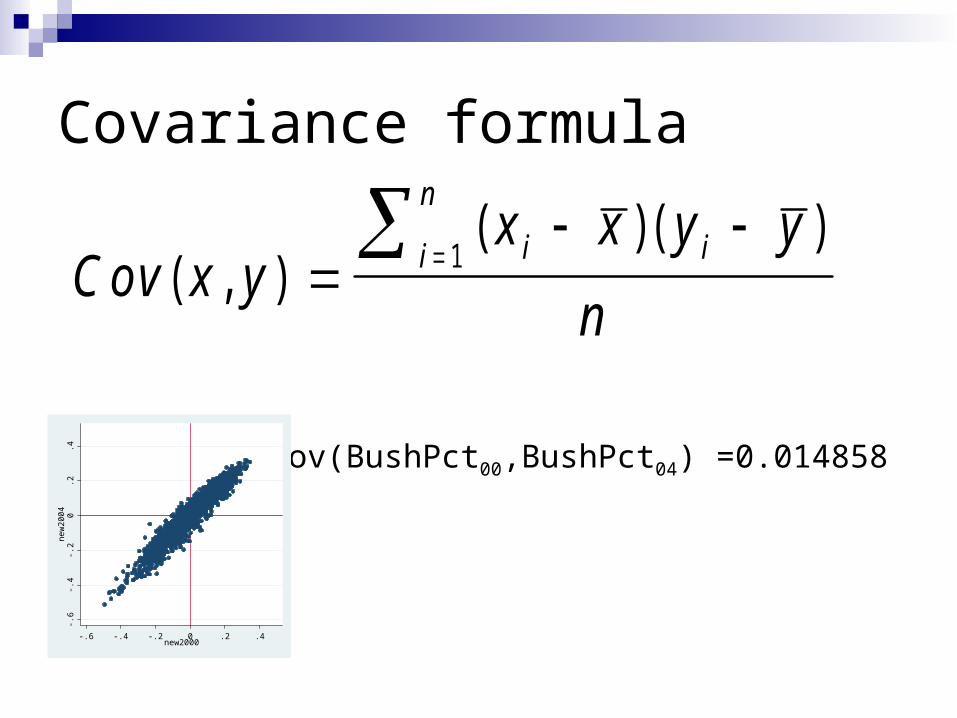
Covariance formula
Cov x yx x y y
ni ii
n
( , )( )( )
1
Cov(BushPct00,BushPct04) =0.014858
-.6
-.4
-.2
0.2
.4n
ew
20
04
-.6 -.4 -.2 0 .2 .4new2000
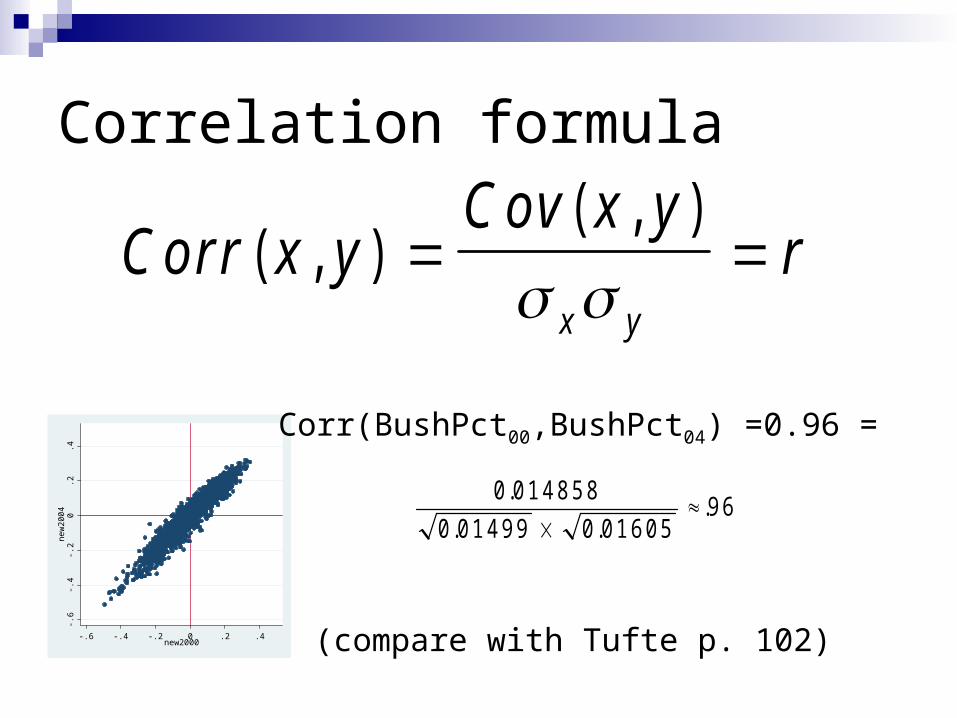
Correlation formula
Corr x yCov x y
rx y
( , )( , )
(compare with Tufte p. 102)
-.6
-.4
-.2
0.2
.4n
ew
20
04
-.6 -.4 -.2 0 .2 .4new2000
Corr(BushPct00,BushPct04) =0.96 =
0 0 1 4 8 5 8
0 0 1 4 9 9 0 0 1 6 0 59 6
.
. ..
Warning: Don’t correlate often!
Correlation only measures linear relationship
Correlation is sensitive to variance Correlation usually doesn’t measure a
theoretically interesting quantity
Regression quantifies how one variable can bedescribed in terms of another
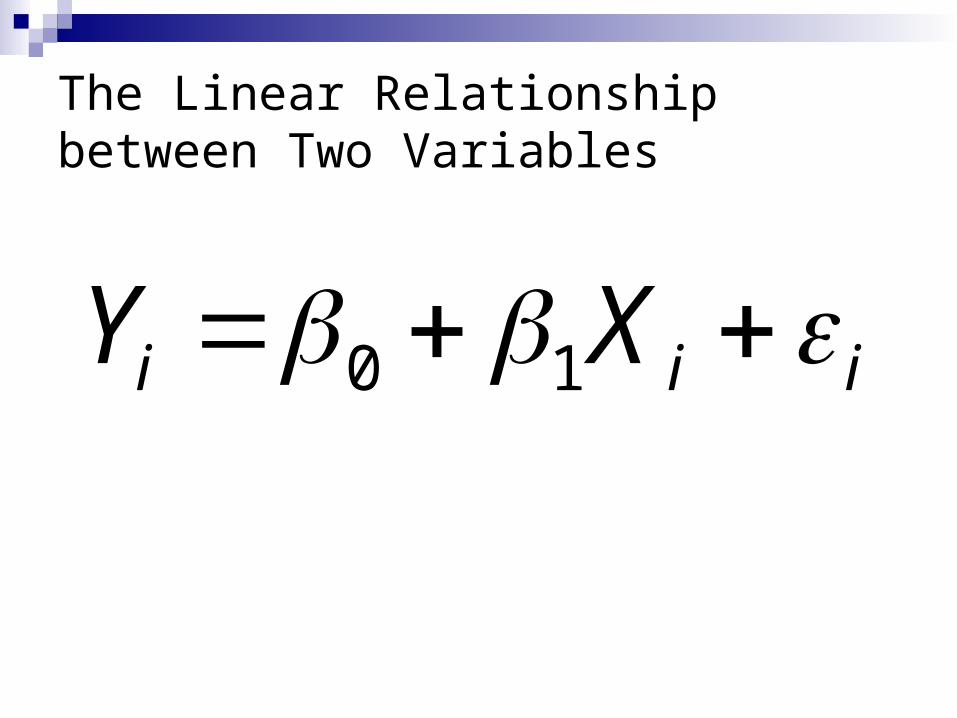
The Linear Relationship between Two Variables
iii XY 10
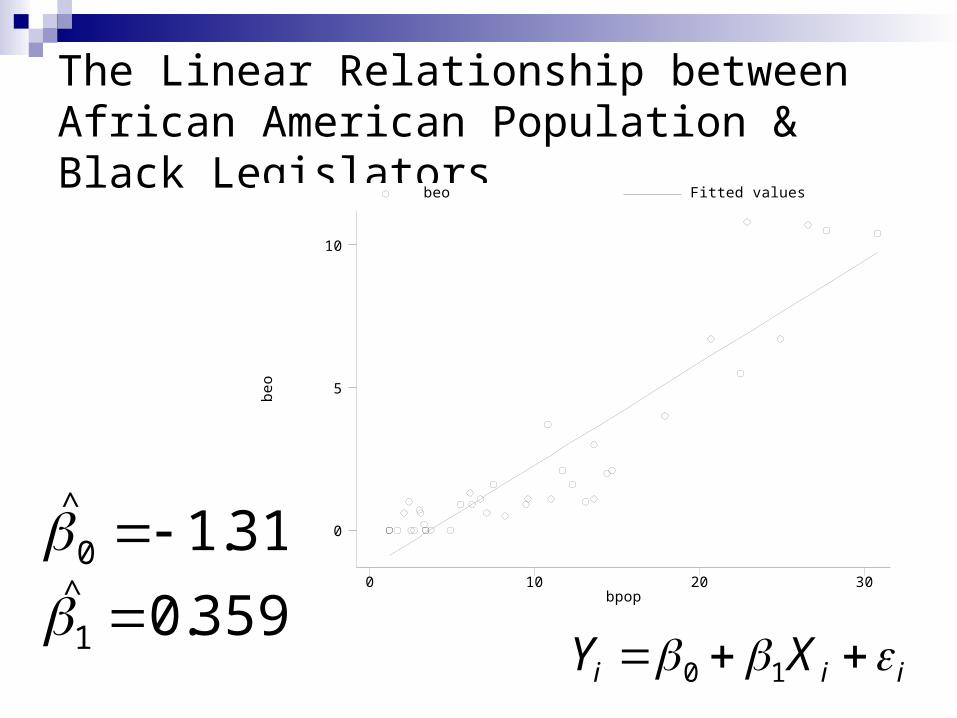
The Linear Relationship between African American Population & Black Legislators
be
o
bpop
beo Fitted values
0 10 20 30
0
5
10
359.0
31.1
1
0
iii XY 10
^
^
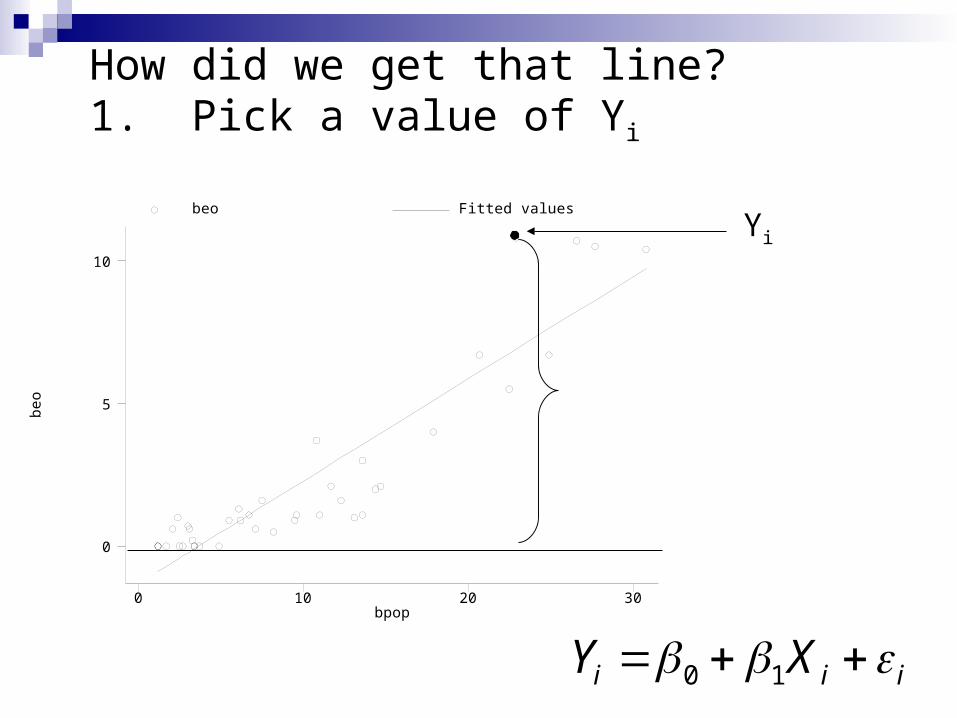
How did we get that line?1. Pick a value of Yi
be
o
bpop
beo Fitted values
0 10 20 30
0
5
10
Yi
iii XY 10
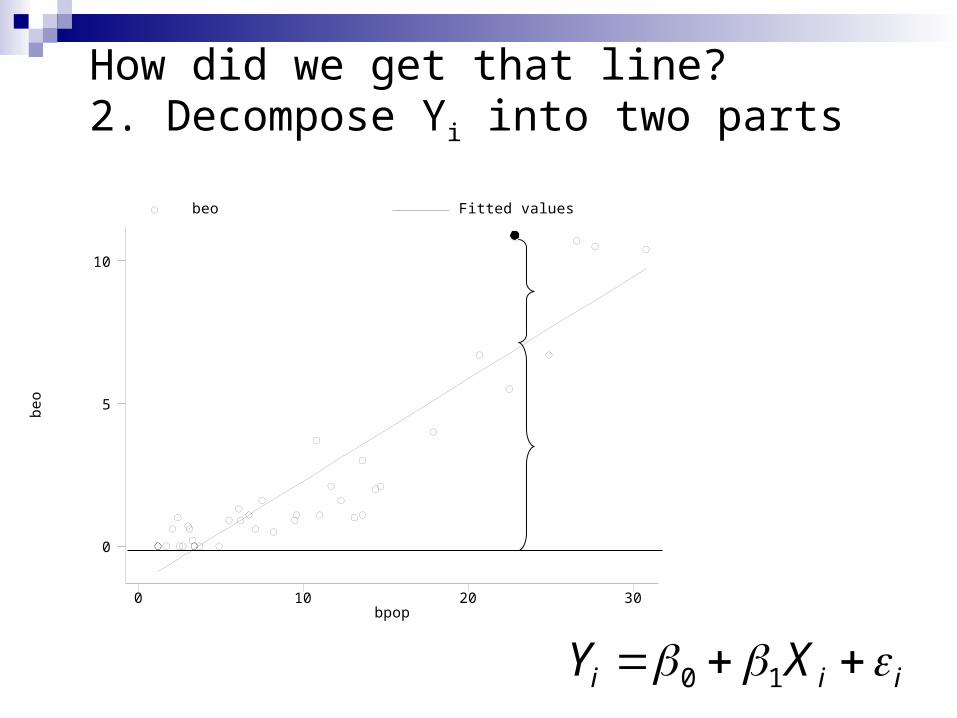
How did we get that line?2. Decompose Yi into two parts
be
o
bpop
beo Fitted values
0 10 20 30
0
5
10
iii XY 10
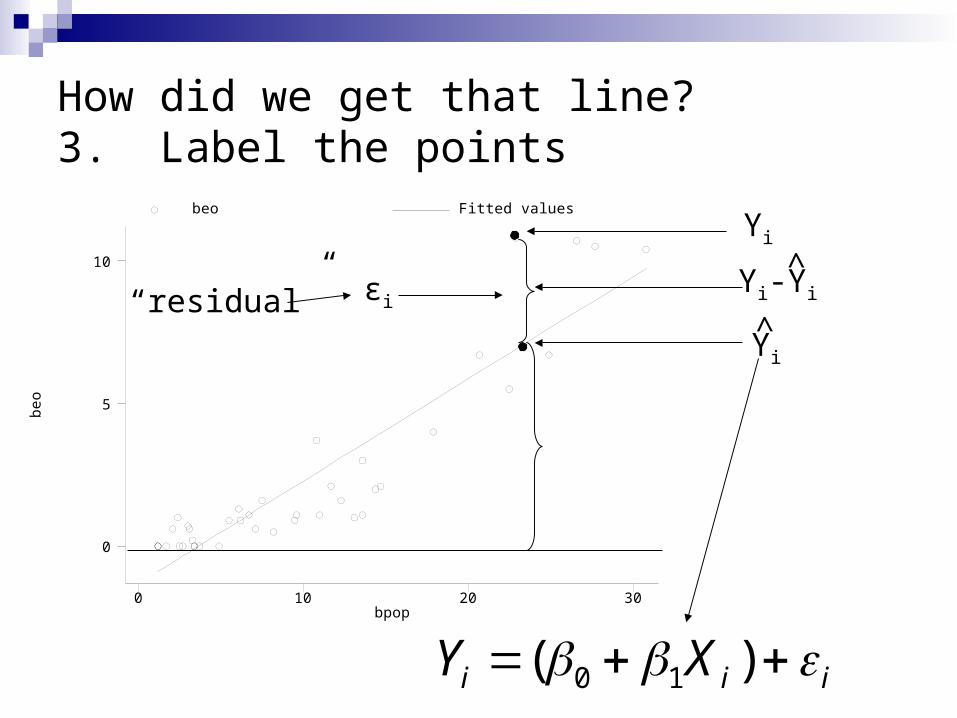
How did we get that line?3. Label the points
be
o
bpop
beo Fitted values
0 10 20 30
0
5
10
Yi
Yi^
εiYi-Yi
^
iii XY )( 10
“residual”
What is εi?
Vagueness of theory Poor proxies (i.e., measurement error) Wrong functional form
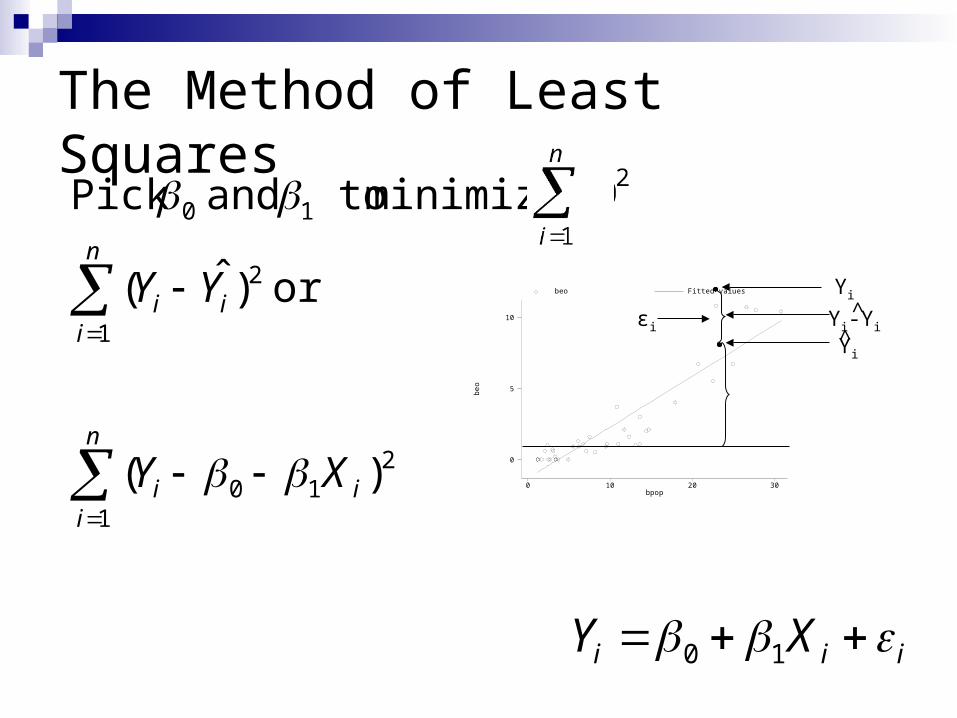
The Method of Least Squares
n
iii
n
iii
XY
YY
1
210
2
1
10
)(
or )ˆ(
minimize to and Pick
be
o
bpop
beo Fitted values
0 10 20 30
0
5
10
Yi
Yi^
εi Yi-Yi^
iii XY 10
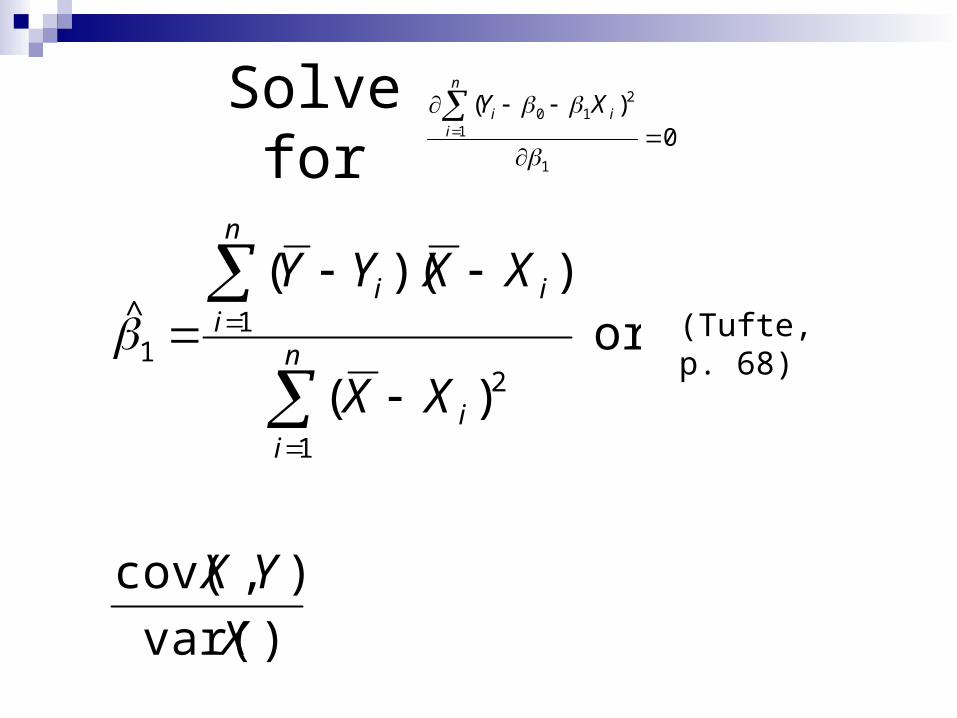
Solve for 0)(
1
1
210
n
iii XY
)var(
),cov(
or )(
))((
1
2
11
X
YX
XX
XXYY
n
ii
n
iii
(Tufte,
p. 68)
^
Discrete DV, discrete EV
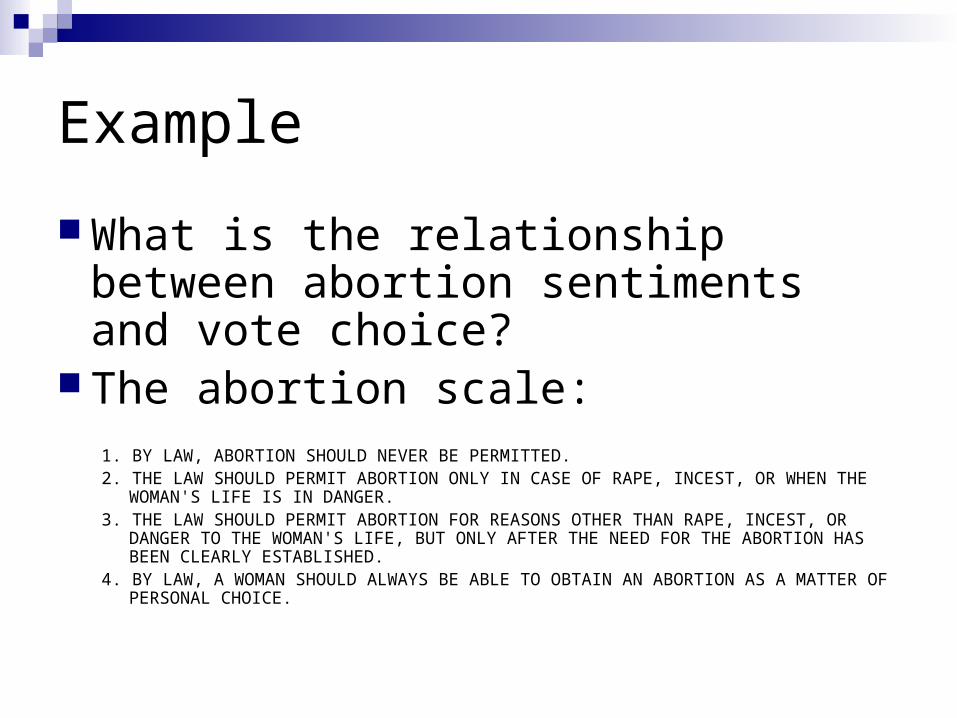
Example
What is the relationship between abortion sentiments and vote choice?
The abortion scale:1. BY LAW, ABORTION SHOULD NEVER BE PERMITTED.2. THE LAW SHOULD PERMIT ABORTION ONLY IN CASE OF RAPE, INCEST, OR WHEN
THE WOMAN'S LIFE IS IN DANGER.3. THE LAW SHOULD PERMIT ABORTION FOR REASONS OTHER THAN RAPE, INCEST,
OR DANGER TO THE WOMAN'S LIFE, BUT ONLY AFTER THE NEED FOR THE ABORTION HAS BEEN CLEARLY ESTABLISHED.
4. BY LAW, A WOMAN SHOULD ALWAYS BE ABLE TO OBTAIN AN ABORTION AS A MATTER OF PERSONAL CHOICE.
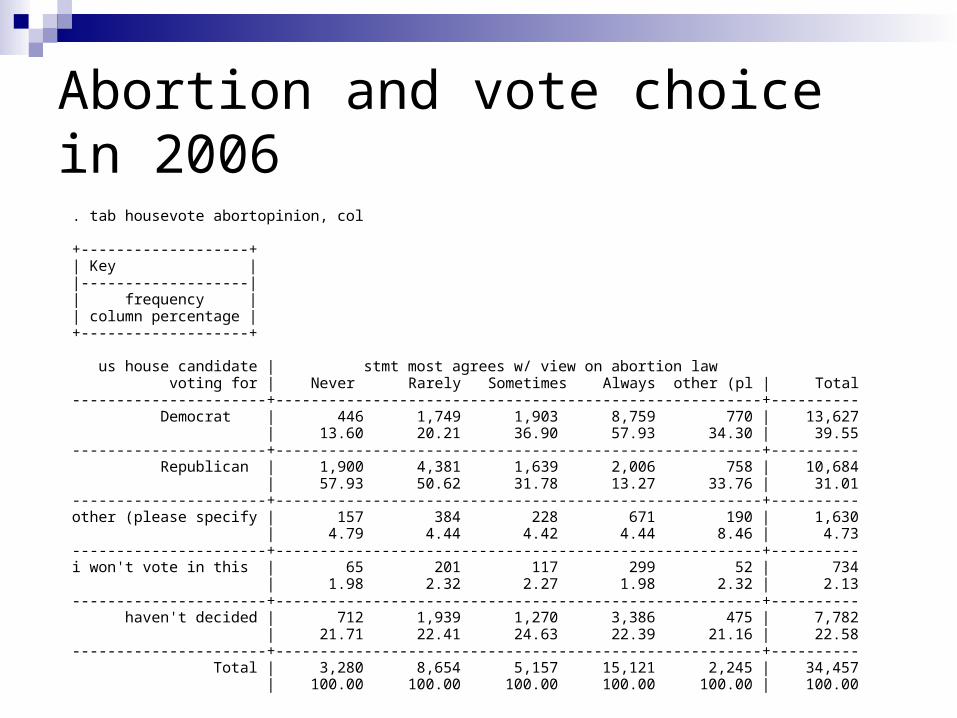
Abortion and vote choice in 2006 . tab housevote abortopinion, col +-------------------+ | Key | |-------------------| | frequency | | column percentage | +-------------------+ us house candidate | stmt most agrees w/ view on abortion law voting for | Never Rarely Sometimes Always other (pl | Total ----------------------+-------------------------------------------------------+---------- Democrat | 446 1,749 1,903 8,759 770 | 13,627 | 13.60 20.21 36.90 57.93 34.30 | 39.55 ----------------------+-------------------------------------------------------+---------- Republican | 1,900 4,381 1,639 2,006 758 | 10,684 | 57.93 50.62 31.78 13.27 33.76 | 31.01 ----------------------+-------------------------------------------------------+---------- other (please specify | 157 384 228 671 190 | 1,630 | 4.79 4.44 4.42 4.44 8.46 | 4.73 ----------------------+-------------------------------------------------------+---------- i won't vote in this | 65 201 117 299 52 | 734 | 1.98 2.32 2.27 1.98 2.32 | 2.13 ----------------------+-------------------------------------------------------+---------- haven't decided | 712 1,939 1,270 3,386 475 | 7,782 | 21.71 22.41 24.63 22.39 21.16 | 22.58 ----------------------+-------------------------------------------------------+---------- Total | 3,280 8,654 5,157 15,121 2,245 | 34,457 | 100.00 100.00 100.00 100.00 100.00 | 100.00
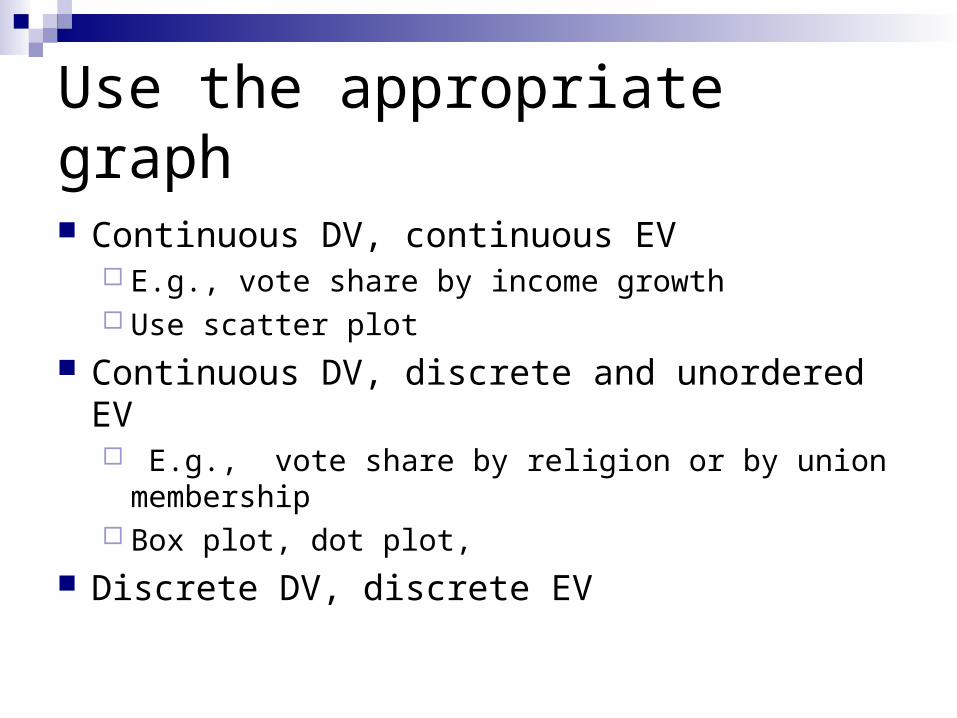
Use the appropriate graph
Continuous DV, continuous EV E.g., vote share by income growth Use scatter plot
Continuous DV, discrete and unordered EV E.g., vote share by religion or by union membership Box plot, dot plot,
Discrete DV, discrete EV