Dental size and shape in the Roman imperial age: Two examples from the area of Rome
11
Dental Size and Shape in the Roman Imperial Age: Two Examples From the Area of Rome GIORGIO MANZI,* ELENA SANTANDREA, AND PIETRO PASSARELLO Dipartimento di Biologia Animale e dell’Uomo, Universita ` di Roma ‘‘La Sapienza,’’ 00185 Roma, Italy KEY WORDS human paleobiology; dental reduction; discrete crown traits; Roman age; Italy ABSTRACT Different socioeconomic strata of Roman imperial age are represented by two large dental samples recovered from archaeological excavations near Rome, Italy. Teeth are investigated for crown dimensions and morphological variants. One sample, comprising 1,465 permanent teeth, represents the rural town of Lucus Feroniae (LFR) and is mainly composed of slaves and war veterans. The other, comprising 734 teeth from the Isola Sacra necropolis at Portus Romae (NIS), represents the ‘‘middle class’’ segment of an urban population. Both series show small dental dimensions and fit at the lower end of the trend toward dental reduction in Europe from the Upper Paleolithic to the historical times. The urban sample is less variable metri- cally and less sexually dimorphic than the rural one. The analysis of discrete crown traits shows absence of rare phenotypic variants in both series. The urban sample is also less variable in this last respect, suggesting that the gene pool of this particular ‘‘stratum’’ of the NIS population was more homogeneous than that of LFR. The occurrence of enamel hypoplasia indicates that metabolic stress during growth and development was similar in LFR and NIS. The overall set of available data is evaluated in the light of the history of the two Roman sites and the composition of each population. Am J Phys Anthropol 102:469–479, 1997. r 1997 Wiley-Liss, Inc. Systematic examinations of dental sam- ples of prehistoric and more recent Italian populations have been published in the last two decades (e.g., Passarello, 1976; Alciati et al., 1977; Coppa and Macchiarelli, 1982; Mallegni et al., 1984; Macchiarelli et al., 1988; Repetto et al., 1988); research on the structure of the teeth and the masticatory apparatus has been also developed on samples from this same country (e.g., Mac- chiarelli et al., 1991; Vargiu et al., 1993; various papers in Moggi-Cecchi, 1995). Un- til recently, however, dental variation regard- ing population samples of the Roman age (conventionally from the 5th century B.C. to the 5th century A.D.) has been little studied. During the past decade, one of us (P.P.) coordinated the examination of two skeletal samples from necropolises of the Roman imperial period, from the rural village of Lucus Feroniae and from the town of Portus Romae (Isola Sacra necropolis), respectively, both referable to about the 2nd century A.D. Data were collected on the dentition (Santa- barbara, 1987; Santandrea, 1994) and the associated skeletal material (Argenti and Manzi, 1988; Manzi and Sperduti, 1988; Manzi et al., 1987, 1989, 1991). Further research is scheduled for the near future, particularly on a new sample from Isola Sacra (Bondioli et al., 1995). Here, we con- sider dental size and shape of dental series *Correspondence to: Giorgio Manzi, Dipartimento di Biologia Animale e dell’Uomo, Universita ` di Roma ‘‘La Sapienza,’’ P.le Aldo Moro 5, 00185 Roma, Italy. [email protected] Received 20 March 1996; accepted 10 November 1996. AMERICAN JOURNAL OF PHYSICAL ANTHROPOLOGY 102:469–479 (1997) r 1997 WILEY-LISS, INC.
Transcript of Dental size and shape in the Roman imperial age: Two examples from the area of Rome
Dental Size and Shape in the Roman Imperial Age:Two Examples From the Area of Rome
GIORGIO MANZI,* ELENA SANTANDREA,AND PIETRO PASSARELLODipartimento di Biologia Animale e dell’Uomo, Universita di Roma‘‘La Sapienza,’’ 00185 Roma, Italy
KEY WORDS human paleobiology; dental reduction; discretecrown traits; Roman age; Italy
ABSTRACT Different socioeconomic strata of Roman imperial age arerepresented by two large dental samples recovered from archaeologicalexcavations near Rome, Italy. Teeth are investigated for crown dimensionsand morphological variants. One sample, comprising 1,465 permanent teeth,represents the rural town of Lucus Feroniae (LFR) and is mainly composed ofslaves and war veterans. The other, comprising 734 teeth from the Isola Sacranecropolis at Portus Romae (NIS), represents the ‘‘middle class’’ segment of anurban population. Both series show small dental dimensions and fit at thelower end of the trend toward dental reduction in Europe from the UpperPaleolithic to the historical times. The urban sample is less variable metri-cally and less sexually dimorphic than the rural one. The analysis of discretecrown traits shows absence of rare phenotypic variants in both series. Theurban sample is also less variable in this last respect, suggesting that the genepool of this particular ‘‘stratum’’ of the NIS population wasmore homogeneousthan that of LFR. The occurrence of enamel hypoplasia indicates thatmetabolic stress during growth and development was similar in LFR andNIS.The overall set of available data is evaluated in the light of the history of thetwo Roman sites and the composition of each population. Am J PhysAnthropol 102:469–479, 1997. r 1997 Wiley-Liss, Inc.
Systematic examinations of dental sam-ples of prehistoric and more recent Italianpopulations have been published in the lasttwo decades (e.g., Passarello, 1976;Alciati etal., 1977; Coppa and Macchiarelli, 1982;Mallegni et al., 1984; Macchiarelli et al.,1988; Repetto et al., 1988); research on thestructure of the teeth and the masticatoryapparatus has been also developed onsamples from this same country (e.g., Mac-chiarelli et al., 1991; Vargiu et al., 1993;various papers in Moggi-Cecchi, 1995). Un-til recently, however, dental variation regard-ing population samples of the Roman age(conventionally from the 5th century B.C. tothe 5th centuryA.D.) has been little studied.During the past decade, one of us (P.P.)
coordinated the examination of two skeletal
samples from necropolises of the Romanimperial period, from the rural village ofLucus Feroniae and from the town of PortusRomae (Isola Sacra necropolis), respectively,both referable to about the 2nd century A.D.Data were collected on the dentition (Santa-barbara, 1987; Santandrea, 1994) and theassociated skeletal material (Argenti andManzi, 1988; Manzi and Sperduti, 1988;Manzi et al., 1987, 1989, 1991). Furtherresearch is scheduled for the near future,particularly on a new sample from IsolaSacra (Bondioli et al., 1995). Here, we con-sider dental size and shape of dental series
*Correspondence to: Giorgio Manzi, Dipartimento di BiologiaAnimale e dell’Uomo, Universita di Roma ‘‘La Sapienza,’’ P.leAldo Moro 5, 00185 Roma, Italy. [email protected] 20 March 1996; accepted 10 November 1996.
AMERICAN JOURNAL OF PHYSICAL ANTHROPOLOGY 102:469–479 (1997)
r 1997 WILEY-LISS, INC.

from the two sites and combine these datawith other sources of information alreadyavailable.Both necropolises were associated with
towns that lay at no great distance fromRome (roughly 30 km in both instances) andhad close links with the city that was at thecenter of the social and economic life of theempire. However, the two towns had verydifferent histories and economies (Bartoc-cini, 1960; Testaguzza, 1970). One of these,the village of Lucus Feroniae, was an an-cient commercial and religious center to thenortheast of Rome. The other one, PortusRomae, came into being during the imperialperiod as the product of urban growth aroundRome’s main seaport at the mouth of theTiber River. The archaeology of the associ-ated burial grounds, the necropolis alongthe Via Capenate at Lucus Feroniae and theIsola Sacra necropolis between the cities ofPortus and Ostia, also reveals a difference insocial composition between the two casestudies (Calza, 1940; Pellegrino, 1984; Bal-dassare et al., 1985; Gazzetti, 1986; Baldas-sare, 1987). In Isola Sacra, the epigraphicdata, decoration, and monumental layoutindicate that this particular skeletal samplerepresents an economically well-off ‘‘middleclass’’ of artisans and tradesmen. Con-versely, the type of grave used at LucusFeroniae and the almost total absence ofgrave goods suggest that this necropolis wasassigned to manual laborers of humble ori-gin (slaves, freedmen, war veterans).
MATERIALS AND METHODS
The dental samples examined in this studyinclude 1,465 permanent teeth from LucusFeroniae (LFR), belonging to 112 individu-als (43 males, 51 females and 18 of unknownsex) and 734 teeth fromPortus Romae (NIS),referable to 64 adults (39 males, 22 femalesand 3 of unknown sex). Teeth with fracturedor extremely worn crowns, widespread anddestructive carious lesions, or dental calcu-lus were omitted from the study. All othersweremeasured and scored for discrete traits.Sex and age determinations were performedfollowing the procedures ofAcsadi and Nem-eskeri (1970), Buikstra and Mielke (1985),Ferembach et al. (1979), Krogman and Iscan(1986). The examination of associated post-
cranial elements was frequently possiblewith the LFR material, whereas for the NISsample, the determinations were carried outsolely on the basis of cranial morphology,because depositional conditions made it im-possible to reassemble the skeletons. Diag-noses of sex were made independently bytwo observers using the index introduced byAcsadi and Nemeskeri (1970). The two ob-servers agreed in 92.8% of cases. When theydid not agree, a third diagnosis was soughtfrom another investigator and the majorityopinion was adopted.Mesio-distal (MD) and bucco-lingual (BL)
crown diameters weremeasured to the near-est 0.1 mm independently by two observers,using digital calipers and the proceduresdescribed by Goose (1963). The mean of thetwo measurements was used unless the twodiffered by more than 0.5 mm, in which casea third measurement was obtained. Meaninterobserver errorwas less than 6.5%.Whenboth antimeres were present, the left andright values were averaged (Calcagno, 1986).Crown areas were calculated following Garnet al. (1977). Dimensional sexual dimor-phism was assessed by Student’s t-test (Kie-ser, 1990). Differences with P , 0.05 wereconsidered statistically significant.Nonmetric traits were recorded following
the standard proposed by Turner et al.(1991), known also as the ASU (ArizonaState University) system. The scoring wasperformed using plaster plaques represent-ing the various gradations of expression of asingle dental trait. Each trait was scoredseparately by two observers on both theantimeres. Cases of disagreement, whichvaried in frequency from 0% to 66.3% forvarious traits (cf., Nichol and Turner, 1986),were settled by seeking a third opinion.Presence/absence thresholds were definedfollowing Turner (1987, 1990). Frequencieswere calculated by the individual countmethod, i.e., considering only the antimerewith the highest expression of the trait asthe best expression of the genotype of theindividual (Turner and Scott, 1977; Scott,1980). The morphological diversity in thetwo Roman samples was evaluated usingthe chi-square test, with a significance levelof 0.05, and compared with Iron Age Italiansamples using factorial correspondence
470 G. MANZI ET AL.
analysis (software SPAD.N, version 1.2;Lambert, 1986).
RESULTSMorphometric analysis
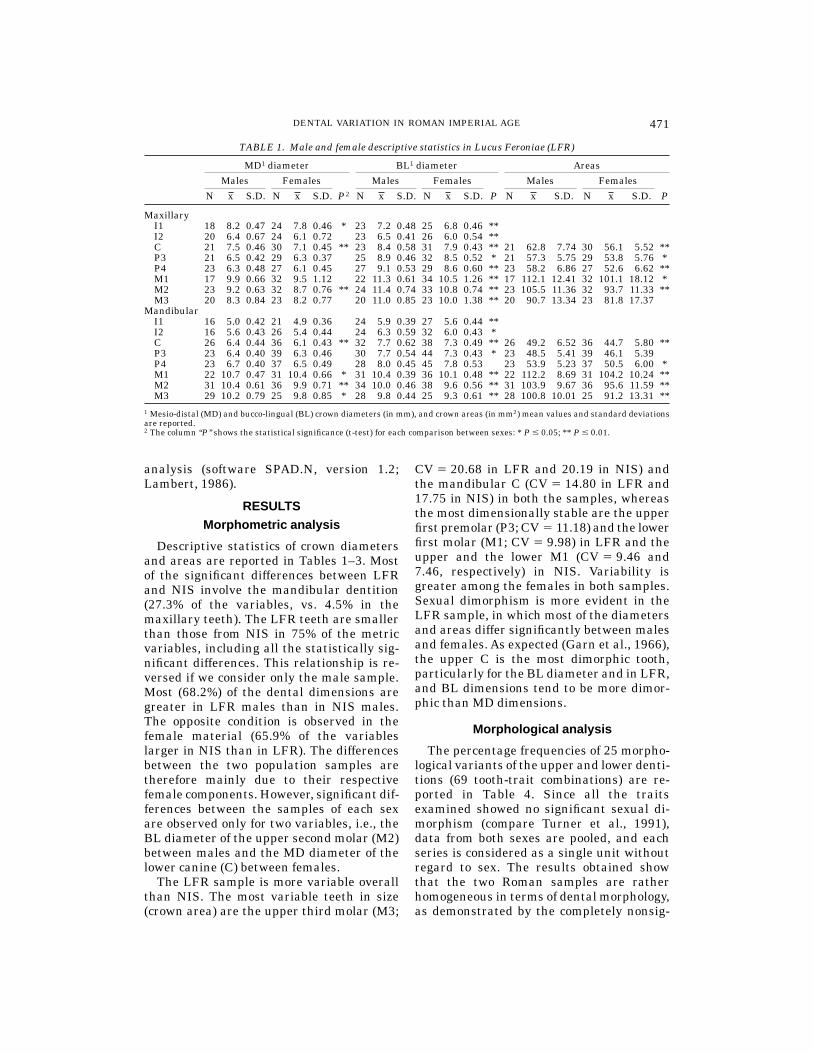
Descriptive statistics of crown diametersand areas are reported in Tables 1–3. Mostof the significant differences between LFRand NIS involve the mandibular dentition(27.3% of the variables, vs. 4.5% in themaxillary teeth). The LFR teeth are smallerthan those from NIS in 75% of the metricvariables, including all the statistically sig-nificant differences. This relationship is re-versed if we consider only the male sample.Most (68.2%) of the dental dimensions aregreater in LFR males than in NIS males.The opposite condition is observed in thefemale material (65.9% of the variableslarger in NIS than in LFR). The differencesbetween the two population samples aretherefore mainly due to their respectivefemale components. However, significant dif-ferences between the samples of each sexare observed only for two variables, i.e., theBL diameter of the upper second molar (M2)between males and the MD diameter of thelower canine (C) between females.The LFR sample is more variable overall
than NIS. The most variable teeth in size(crown area) are the upper third molar (M3;
CV 5 20.68 in LFR and 20.19 in NIS) andthe mandibular C (CV 5 14.80 in LFR and17.75 in NIS) in both the samples, whereasthe most dimensionally stable are the upperfirst premolar (P3; CV 5 11.18) and the lowerfirst molar (M1; CV 5 9.98) in LFR and theupper and the lower M1 (CV 5 9.46 and7.46, respectively) in NIS. Variability isgreater among the females in both samples.Sexual dimorphism is more evident in theLFR sample, in which most of the diametersand areas differ significantly between malesand females. As expected (Garn et al., 1966),the upper C is the most dimorphic tooth,particularly for the BLdiameter and in LFR,and BL dimensions tend to be more dimor-phic than MD dimensions.
Morphological analysis
The percentage frequencies of 25 morpho-logical variants of the upper and lower denti-tions (69 tooth-trait combinations) are re-ported in Table 4. Since all the traitsexamined showed no significant sexual di-morphism (compare Turner et al., 1991),data from both sexes are pooled, and eachseries is considered as a single unit withoutregard to sex. The results obtained showthat the two Roman samples are ratherhomogeneous in terms of dental morphology,as demonstrated by the completely nonsig-
TABLE 1. Male and female descriptive statistics in Lucus Feroniae (LFR)
MD1 diameter BL1 diameter Areas
Males Females
P2
Males Females
P
Males Females
PN x S.D. N x S.D. N x S.D. N x S.D. N x S.D. N x S.D.
MaxillaryI1 18 8.2 0.47 24 7.8 0.46 * 23 7.2 0.48 25 6.8 0.46 **I2 20 6.4 0.67 24 6.1 0.72 23 6.5 0.41 26 6.0 0.54 **C 21 7.5 0.46 30 7.1 0.45 ** 23 8.4 0.58 31 7.9 0.43 ** 21 62.8 7.74 30 56.1 5.52 **P3 21 6.5 0.42 29 6.3 0.37 25 8.9 0.46 32 8.5 0.52 * 21 57.3 5.75 29 53.8 5.76 *P4 23 6.3 0.48 27 6.1 0.45 27 9.1 0.53 29 8.6 0.60 ** 23 58.2 6.86 27 52.6 6.62 **M1 17 9.9 0.66 32 9.5 1.12 22 11.3 0.61 34 10.5 1.26 ** 17 112.1 12.41 32 101.1 18.12 *M2 23 9.2 0.63 32 8.7 0.76 ** 24 11.4 0.74 33 10.8 0.74 ** 23 105.5 11.36 32 93.7 11.33 **M3 20 8.3 0.84 23 8.2 0.77 20 11.0 0.85 23 10.0 1.38 ** 20 90.7 13.34 23 81.8 17.37
MandibularI1 16 5.0 0.42 21 4.9 0.36 24 5.9 0.39 27 5.6 0.44 **I2 16 5.6 0.43 26 5.4 0.44 24 6.3 0.59 32 6.0 0.43 *C 26 6.4 0.44 36 6.1 0.43 ** 32 7.7 0.62 38 7.3 0.49 ** 26 49.2 6.52 36 44.7 5.80 **P3 23 6.4 0.40 39 6.3 0.46 30 7.7 0.54 44 7.3 0.43 * 23 48.5 5.41 39 46.1 5.39P4 23 6.7 0.40 37 6.5 0.49 28 8.0 0.45 45 7.8 0.53 23 53.9 5.23 37 50.5 6.00 *M1 22 10.7 0.47 31 10.4 0.66 * 31 10.4 0.39 36 10.1 0.48 ** 22 112.2 8.69 31 104.2 10.24 **M2 31 10.4 0.61 36 9.9 0.71 ** 34 10.0 0.46 38 9.6 0.56 ** 31 103.9 9.67 36 95.6 11.59 **M3 29 10.2 0.79 25 9.8 0.85 * 28 9.8 0.44 25 9.3 0.61 ** 28 100.8 10.01 25 91.2 13.31 **
1 Mesio-distal (MD) and bucco-lingual (BL) crown diameters (in mm), and crown areas (in mm2) mean values and standard deviationsare reported.2 The column ‘‘P ’’ shows the statistical significance (t-test) for each comparison between sexes: * P # 0.05; ** P # 0.01.
471DENTAL VARIATION IN ROMAN IMPERIAL AGE
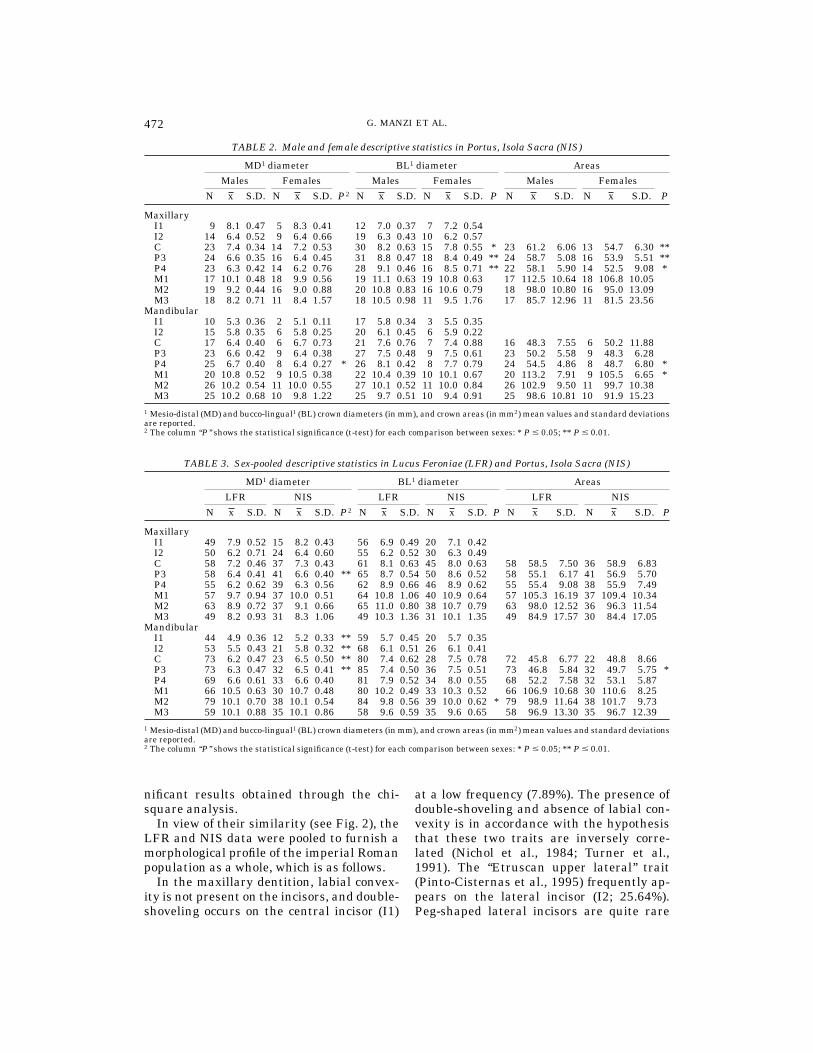
nificant results obtained through the chi-square analysis.In view of their similarity (see Fig. 2), the
LFR and NIS data were pooled to furnish amorphological profile of the imperial Romanpopulation as a whole, which is as follows.In the maxillary dentition, labial convex-
ity is not present on the incisors, and double-shoveling occurs on the central incisor (I1)
at a low frequency (7.89%). The presence ofdouble-shoveling and absence of labial con-vexity is in accordance with the hypothesisthat these two traits are inversely corre-lated (Nichol et al., 1984; Turner et al.,1991). The ‘‘Etruscan upper lateral’’ trait(Pinto-Cisternas et al., 1995) frequently ap-pears on the lateral incisor (I2; 25.64%).Peg-shaped lateral incisors are quite rare
TABLE 2. Male and female descriptive statistics in Portus, Isola Sacra (NIS)
MD1 diameter BL1 diameter Areas
Males Females
P2
Males Females
P
Males Females
PN x S.D. N x S.D. N x S.D. N x S.D. N x S.D. N x S.D.
MaxillaryI1 9 8.1 0.47 5 8.3 0.41 12 7.0 0.37 7 7.2 0.54I2 14 6.4 0.52 9 6.4 0.66 19 6.3 0.43 10 6.2 0.57C 23 7.4 0.34 14 7.2 0.53 30 8.2 0.63 15 7.8 0.55 * 23 61.2 6.06 13 54.7 6.30 **P3 24 6.6 0.35 16 6.4 0.45 31 8.8 0.47 18 8.4 0.49 ** 24 58.7 5.08 16 53.9 5.51 **P4 23 6.3 0.42 14 6.2 0.76 28 9.1 0.46 16 8.5 0.71 ** 22 58.1 5.90 14 52.5 9.08 *M1 17 10.1 0.48 18 9.9 0.56 19 11.1 0.63 19 10.8 0.63 17 112.5 10.64 18 106.8 10.05M2 19 9.2 0.44 16 9.0 0.88 20 10.8 0.83 16 10.6 0.79 18 98.0 10.80 16 95.0 13.09M3 18 8.2 0.71 11 8.4 1.57 18 10.5 0.98 11 9.5 1.76 17 85.7 12.96 11 81.5 23.56
MandibularI1 10 5.3 0.36 2 5.1 0.11 17 5.8 0.34 3 5.5 0.35I2 15 5.8 0.35 6 5.8 0.25 20 6.1 0.45 6 5.9 0.22C 17 6.4 0.40 6 6.7 0.73 21 7.6 0.76 7 7.4 0.88 16 48.3 7.55 6 50.2 11.88P3 23 6.6 0.42 9 6.4 0.38 27 7.5 0.48 9 7.5 0.61 23 50.2 5.58 9 48.3 6.28P4 25 6.7 0.40 8 6.4 0.27 * 26 8.1 0.42 8 7.7 0.79 24 54.5 4.86 8 48.7 6.80 *M1 20 10.8 0.52 9 10.5 0.38 22 10.4 0.39 10 10.1 0.67 20 113.2 7.91 9 105.5 6.65 *M2 26 10.2 0.54 11 10.0 0.55 27 10.1 0.52 11 10.0 0.84 26 102.9 9.50 11 99.7 10.38M3 25 10.2 0.68 10 9.8 1.22 25 9.7 0.51 10 9.4 0.91 25 98.6 10.81 10 91.9 15.23
1 Mesio-distal (MD) and bucco-lingual1 (BL) crown diameters (in mm), and crown areas (in mm2) mean values and standard deviationsare reported.2 The column ‘‘P ’’ shows the statistical significance (t-test) for each comparison between sexes: * P # 0.05; ** P # 0.01.
TABLE 3. Sex-pooled descriptive statistics in Lucus Feroniae (LFR) and Portus, Isola Sacra (NIS)
MD1 diameter BL1 diameter Areas
LFR NIS
P2
LFR NIS
P
LFR NIS
PN x S.D. N x S.D. N x S.D. N x S.D. N x S.D. N x S.D.
MaxillaryI1 49 7.9 0.52 15 8.2 0.43 56 6.9 0.49 20 7.1 0.42I2 50 6.2 0.71 24 6.4 0.60 55 6.2 0.52 30 6.3 0.49C 58 7.2 0.46 37 7.3 0.43 61 8.1 0.63 45 8.0 0.63 58 58.5 7.50 36 58.9 6.83P3 58 6.4 0.41 41 6.6 0.40 ** 65 8.7 0.54 50 8.6 0.52 58 55.1 6.17 41 56.9 5.70P4 55 6.2 0.62 39 6.3 0.56 62 8.9 0.66 46 8.9 0.62 55 55.4 9.08 38 55.9 7.49M1 57 9.7 0.94 37 10.0 0.51 64 10.8 1.06 40 10.9 0.64 57 105.3 16.19 37 109.4 10.34M2 63 8.9 0.72 37 9.1 0.66 65 11.0 0.80 38 10.7 0.79 63 98.0 12.52 36 96.3 11.54M3 49 8.2 0.93 31 8.3 1.06 49 10.3 1.36 31 10.1 1.35 49 84.9 17.57 30 84.4 17.05
MandibularI1 44 4.9 0.36 12 5.2 0.33 ** 59 5.7 0.45 20 5.7 0.35I2 53 5.5 0.43 21 5.8 0.32 ** 68 6.1 0.51 26 6.1 0.41C 73 6.2 0.47 23 6.5 0.50 ** 80 7.4 0.62 28 7.5 0.78 72 45.8 6.77 22 48.8 8.66P3 73 6.3 0.47 32 6.5 0.41 ** 85 7.4 0.50 36 7.5 0.51 73 46.8 5.84 32 49.7 5.75 *P4 69 6.6 0.61 33 6.6 0.40 81 7.9 0.52 34 8.0 0.55 68 52.2 7.58 32 53.1 5.87M1 66 10.5 0.63 30 10.7 0.48 80 10.2 0.49 33 10.3 0.52 66 106.9 10.68 30 110.6 8.25M2 79 10.1 0.70 38 10.1 0.54 84 9.8 0.56 39 10.0 0.62 * 79 98.9 11.64 38 101.7 9.73M3 59 10.1 0.88 35 10.1 0.86 58 9.6 0.59 35 9.6 0.65 58 96.9 13.30 35 96.7 12.39
1 Mesio-distal (MD) and bucco-lingual1 (BL) crown diameters (in mm), and crown areas (in mm2) mean values and standard deviationsare reported.2 The column ‘‘P ’’ shows the statistical significance (t-test) for each comparison between sexes: * P # 0.05; ** P # 0.01.
472 G. MANZI ET AL.
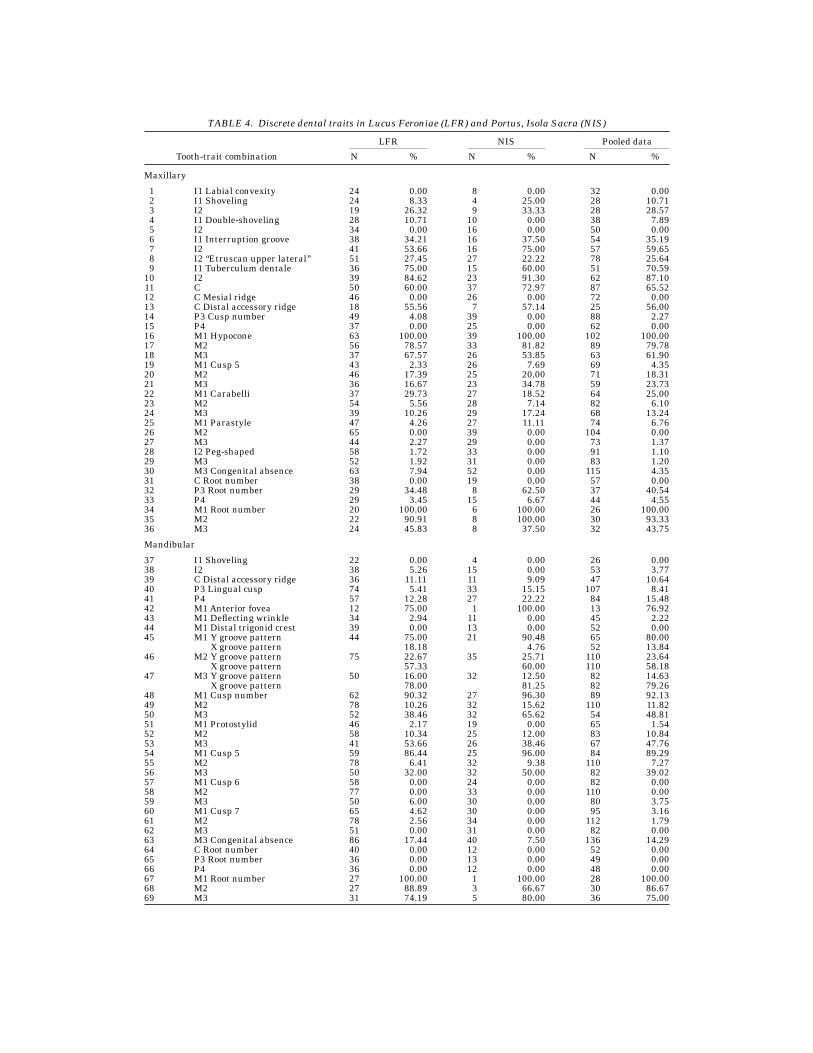
TABLE 4. Discrete dental traits in Lucus Feroniae (LFR) and Portus, Isola Sacra (NIS)
Tooth-trait combination
LFR NIS Pooled data
N % N % N %
Maxillary
1 I1 Labial convexity 24 0.00 8 0.00 32 0.002 I1 Shoveling 24 8.33 4 25.00 28 10.713 I2 19 26.32 9 33.33 28 28.574 I1 Double-shoveling 28 10.71 10 0.00 38 7.895 I2 34 0.00 16 0.00 50 0.006 I1 Interruption groove 38 34.21 16 37.50 54 35.197 I2 41 53.66 16 75.00 57 59.658 I2 ‘‘Etruscan upper lateral’’ 51 27.45 27 22.22 78 25.649 I1 Tuberculum dentale 36 75.00 15 60.00 51 70.5910 I2 39 84.62 23 91.30 62 87.1011 C 50 60.00 37 72.97 87 65.5212 C Mesial ridge 46 0.00 26 0.00 72 0.0013 C Distal accessory ridge 18 55.56 7 57.14 25 56.0014 P3 Cusp number 49 4.08 39 0.00 88 2.2715 P4 37 0.00 25 0.00 62 0.0016 M1 Hypocone 63 100.00 39 100.00 102 100.0017 M2 56 78.57 33 81.82 89 79.7818 M3 37 67.57 26 53.85 63 61.9019 M1 Cusp 5 43 2.33 26 7.69 69 4.3520 M2 46 17.39 25 20.00 71 18.3121 M3 36 16.67 23 34.78 59 23.7322 M1 Carabelli 37 29.73 27 18.52 64 25.0023 M2 54 5.56 28 7.14 82 6.1024 M3 39 10.26 29 17.24 68 13.2425 M1 Parastyle 47 4.26 27 11.11 74 6.7626 M2 65 0.00 39 0.00 104 0.0027 M3 44 2.27 29 0.00 73 1.3728 I2 Peg-shaped 58 1.72 33 0.00 91 1.1029 M3 52 1.92 31 0.00 83 1.2030 M3 Congenital absence 63 7.94 52 0.00 115 4.3531 C Root number 38 0.00 19 0.00 57 0.0032 P3 Root number 29 34.48 8 62.50 37 40.5433 P4 29 3.45 15 6.67 44 4.5534 M1 Root number 20 100.00 6 100.00 26 100.0035 M2 22 90.91 8 100.00 30 93.3336 M3 24 45.83 8 37.50 32 43.75
Mandibular
37 I1 Shoveling 22 0.00 4 0.00 26 0.0038 I2 38 5.26 15 0.00 53 3.7739 C Distal accessory ridge 36 11.11 11 9.09 47 10.6440 P3 Lingual cusp 74 5.41 33 15.15 107 8.4141 P4 57 12.28 27 22.22 84 15.4842 M1Anterior fovea 12 75.00 1 100.00 13 76.9243 M1 Deflecting wrinkle 34 2.94 11 0.00 45 2.2244 M1 Distal trigonid crest 39 0.00 13 0.00 52 0.0045 M1 Y groove pattern 44 75.00 21 90.48 65 80.00
X groove pattern 18.18 4.76 52 13.8446 M2 Y groove pattern 75 22.67 35 25.71 110 23.64
X groove pattern 57.33 60.00 110 58.1847 M3 Y groove pattern 50 16.00 32 12.50 82 14.63
X groove pattern 78.00 81.25 82 79.2648 M1 Cusp number 62 90.32 27 96.30 89 92.1349 M2 78 10.26 32 15.62 110 11.8250 M3 52 38.46 32 65.62 54 48.8151 M1 Protostylid 46 2.17 19 0.00 65 1.5452 M2 58 10.34 25 12.00 83 10.8453 M3 41 53.66 26 38.46 67 47.7654 M1 Cusp 5 59 86.44 25 96.00 84 89.2955 M2 78 6.41 32 9.38 110 7.2756 M3 50 32.00 32 50.00 82 39.0257 M1 Cusp 6 58 0.00 24 0.00 82 0.0058 M2 77 0.00 33 0.00 110 0.0059 M3 50 6.00 30 0.00 80 3.7560 M1 Cusp 7 65 4.62 30 0.00 95 3.1661 M2 78 2.56 34 0.00 112 1.7962 M3 51 0.00 31 0.00 82 0.0063 M3 Congenital absence 86 17.44 40 7.50 136 14.2964 C Root number 40 0.00 12 0.00 52 0.0065 P3 Root number 36 0.00 13 0.00 49 0.0066 P4 36 0.00 12 0.00 48 0.0067 M1 Root number 27 100.00 1 100.00 28 100.0068 M2 27 88.89 3 66.67 30 86.6769 M3 31 74.19 5 80.00 36 75.00

(1.10%). Both shoveling and the interrup-tion groove show increasing frequenciesfrom I1 (respectively, 10.71% and 35.19%)to I2 (respectively, 28.71% and 59.65%); sodoes the tuberculum dentale (70.59% and87.1%), which occurs at lower frequenciesin C (65.52%). The upper canines alsoshow high frequencies of the distal accessoryridge (56%). Premolar mesial and distalaccessory cusps are rarely present on P3(2.27%), and are absent on the second premo-lar (P4). Two roots are rare on P4 (4.55%),but frequently present on P3 (40.54%), thekey site for root number variation (Turner,1981). On the maxillary molars, the fre-quency of hypocone occurrence decreasesfrom M1 to M3 (respectively, 100%, 79.78%and 61.9%). Conversely, frequencies of themetaconule increase fromM1 to M3 (respec-tively, 4.35%, 18.31% and 23.73%), contraryto expectations (Harris and Bailit, 1980).Carabelli’s trait occurs more frequently onM1 and M3 (respectively, 25% and 13.24%).A parastyle occurs at low frequencies on M1(6.76%) and on M3 (1.37%). Peg-shaped mo-lars and congenital absence of upper M3 arerarely present (respectively, 1.20% and4.35%).In the lower dentition, shoveling of inci-
sors and distal accessory ridge of C are quiterare. Premolar lingual cusp variation isuncommon; the lower P4, which is consid-ered the key site for this trait (Turner et al.,1991), is the most variable of the premolars(15.48%). In the mandibular molars, thehighest frequency of the Y groove pattern(metaconid and hypoconid in contact) is onM1 (80.00%); lowerM2 and lowerM3 exhibitgreater frequencies of the X groove pattern(protoconid and entoconid in contact; 58.18%and 79.26%, respectively). Conversely, theprotostylid is seldom observed onM1 (1.54%),but its frequency increases from lower M2(10.84%) to lower M3 (47.76%). More than 4cusps are almost always present on lowerM1 (92.13%), far less frequent on lower M2(11.82%), and moderately frequent on lowerM3 (48.81%). The entoconulid (cusp 6), themetaconulid (cusp 7), and the deflectingwrinkle are quite rare. Lower M3 is congeni-tally absent in 14.29% of all mandibles.
DISCUSSION
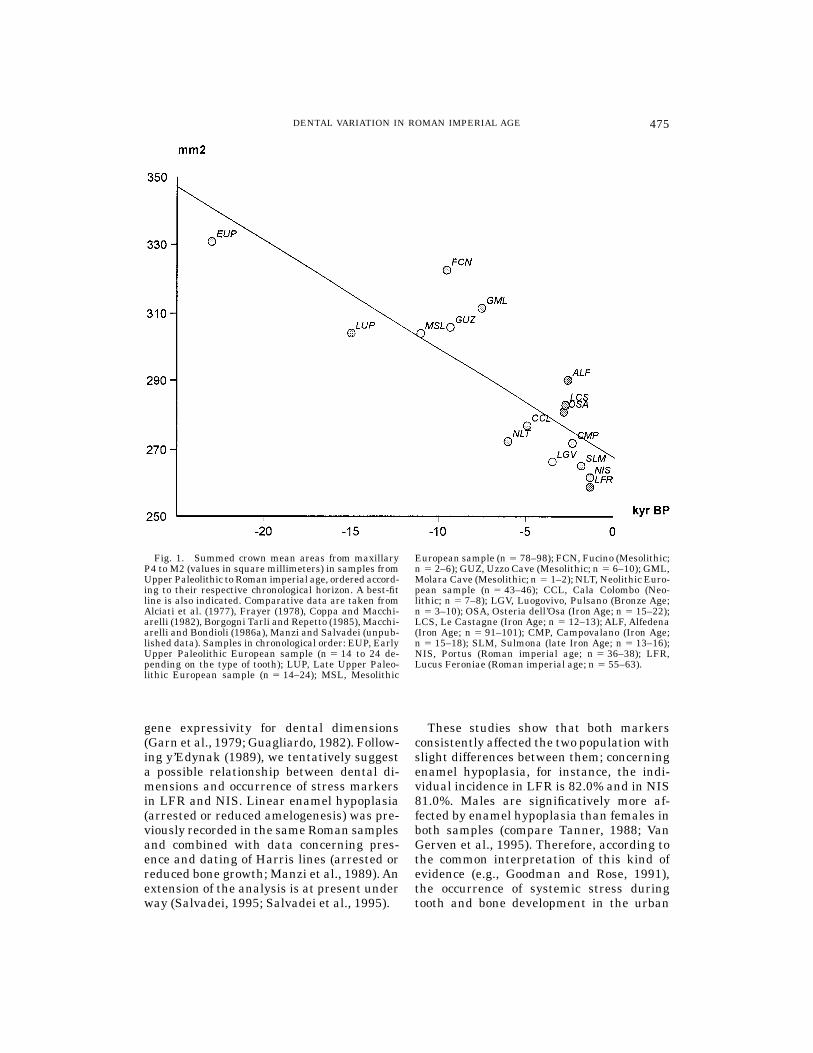
The data presented here provide a basisfor characterizing dental variation in Italianpopulations of the Roman imperial age. Theprincipal findings are: the presence of smalldental dimensions in both samples, a dimen-sional variability greater in LFR than inNIS, including higher levels of sexual dimor-phism, and the absence of rare phenotypicvariants in both samples.The small dental dimensions of the two
Roman samples are apparent in Figure 1,where data on LFR and NIS are plottedagainst those from other European and Ital-ian populations ranging in time from theUpper Paleolithic to the IronAge. The graphshows the well-known trend toward reduc-tion in dental size among human popula-tions (Smith, 1977; Frayer, 1984; Macchia-relli and Bondioli, 1986b; Brace et al., 1987;Calcagno, 1986, 1989; Calcagno and Gibson,1988, 1991). Between the two extremes (EUPand LFR), more than 20% of the occlusalsurface from maxillary P4 to M2 is lost. Adramatic decrease is observed at the Meso-lithic-Neolithic transition, probably reflect-ing gene flow, if not the arrival in Europe ofwaves of agriculturalist immigrants fromtheLevant (Ammermann andCavalli-Sforza,1984). Subsequently, Bronze and Iron Agedentitions show a great amount of diversitybetween populations. This pattern could re-flect different adaptations to various environ-mental conditions, as well as microregionaldifferences in genetic balance between thegene pools of earlier and more recent immi-grants.The LFR and NIS samples fit the lower
end of the reduction trend illustrated by theplot in Figure 1. Since imperial Romanpopulations (particularly the LFR sample)would be expected to bemore variable geneti-cally than their predecessors, it can be hy-pothesized that their position was condi-tioned by environmental more than geneticfactors, for instance, by adaptive responsesto new life conditions (e.g., Calcagno, 1989),or by increased population density and itsrelated effects (Macchiarelli and Bondioli,1986b; compare Gibson and Calcagno, 1989).It is known that metabolic disturbances
during growth and development can reduce
474 G. MANZI ET AL.
gene expressivity for dental dimensions(Garn et al., 1979; Guagliardo, 1982). Follow-ing y’Edynak (1989), we tentatively suggesta possible relationship between dental di-mensions and occurrence of stress markersin LFR and NIS. Linear enamel hypoplasia(arrested or reduced amelogenesis) was pre-viously recorded in the sameRoman samplesand combined with data concerning pres-ence and dating of Harris lines (arrested orreduced bone growth; Manzi et al., 1989). Anextension of the analysis is at present underway (Salvadei, 1995; Salvadei et al., 1995).
These studies show that both markersconsistently affected the two populationwithslight differences between them; concerningenamel hypoplasia, for instance, the indi-vidual incidence in LFR is 82.0% and in NIS81.0%. Males are significatively more af-fected by enamel hypoplasia than females inboth samples (compare Tanner, 1988; VanGerven et al., 1995). Therefore, according tothe common interpretation of this kind ofevidence (e.g., Goodman and Rose, 1991),the occurrence of systemic stress duringtooth and bone development in the urban
Fig. 1. Summed crown mean areas from maxillaryP4 to M2 (values in square millimeters) in samples fromUpper Paleolithic to Roman imperial age, ordered accord-ing to their respective chronological horizon. A best-fitline is also indicated. Comparative data are taken fromAlciati et al. (1977), Frayer (1978), Coppa and Macchi-arelli (1982), Borgogni Tarli and Repetto (1985), Macchi-arelli and Bondioli (1986a), Manzi and Salvadei (unpub-lished data). Samples in chronological order: EUP, EarlyUpper Paleolithic European sample (n 5 14 to 24 de-pending on the type of tooth); LUP, Late Upper Paleo-lithic European sample (n 5 14–24); MSL, Mesolithic
European sample (n 5 78–98); FCN, Fucino (Mesolithic;n 5 2–6); GUZ, Uzzo Cave (Mesolithic; n 5 6–10); GML,Molara Cave (Mesolithic; n 5 1–2); NLT, Neolithic Euro-pean sample (n 5 43–46); CCL, Cala Colombo (Neo-lithic; n 5 7–8); LGV, Luogovivo, Pulsano (Bronze Age;n 5 3–10); OSA, Osteria dell’Osa (Iron Age; n 5 15–22);LCS, Le Castagne (Iron Age; n 5 12–13); ALF, Alfedena(Iron Age; n 5 91–101); CMP, Campovalano (Iron Age;n 5 15–18); SLM, Sulmona (late Iron Age; n 5 13–16);NIS, Portus (Roman imperial age; n 5 36–38); LFR,Lucus Feroniae (Roman imperial age; n 5 55–63).
475DENTAL VARIATION IN ROMAN IMPERIAL AGE

andmiddle class population of NIS is compa-rable to that in the rural and slave LFRcommunity. Such an unexpected result canbe related to the effects of higher populationdensity (recurring famine episodes, spreadof epidemic diseases, etc.) in the urban sam-ple than in the rural one. For the latter, wecan hypothesize the consequences on growthand development of indigent conditionswhich probably characterized that popula-tion segment. Thus, though any causal inter-pretation of this composite evidence is largelyspeculative at present, the data presentedhere suggest a possible correlation betweenenvironmental stress and dental dimen-sions. From this perspective, the lower sexualdimorphism observed in NIS should be bet-ter considered as an expression of adaptiveresponses to environmental stress (Braceand Ryan, 1980; Relethford and Hodges,1985), rather than as an indicator of geneticdiversity between NIS and LFR.From another point of view, however, the
higher variability observed in LFR for den-tal size is in accordance with the resultsreached in previous comparisons of cranialsize and shape between the same samples(Argenti and Manzi, 1988; Manzi and Sper-duti, 1988), as well as with the variabilityobserved for the postcranial morphometricsin LFR (Salomone, 1990). The population ofNIS appears also more homogeneous thanLFR in terms of dental morphology, accord-ing to the presence of peaks of expression forsome variants which characterize the formersample (cf. Table 4: traits n. 7, 21, 32, 45, 50,56). This evidence appears consistent withthe known ancient importance of Lucus Fero-niae as a commercial and religious center,before its stable ‘‘colonization’’ during theRoman empire, and also with the inferredassignment of this particular necropolis tomanual laborers of diverse ethnic prove-nience.Regarding morphological dental varia-
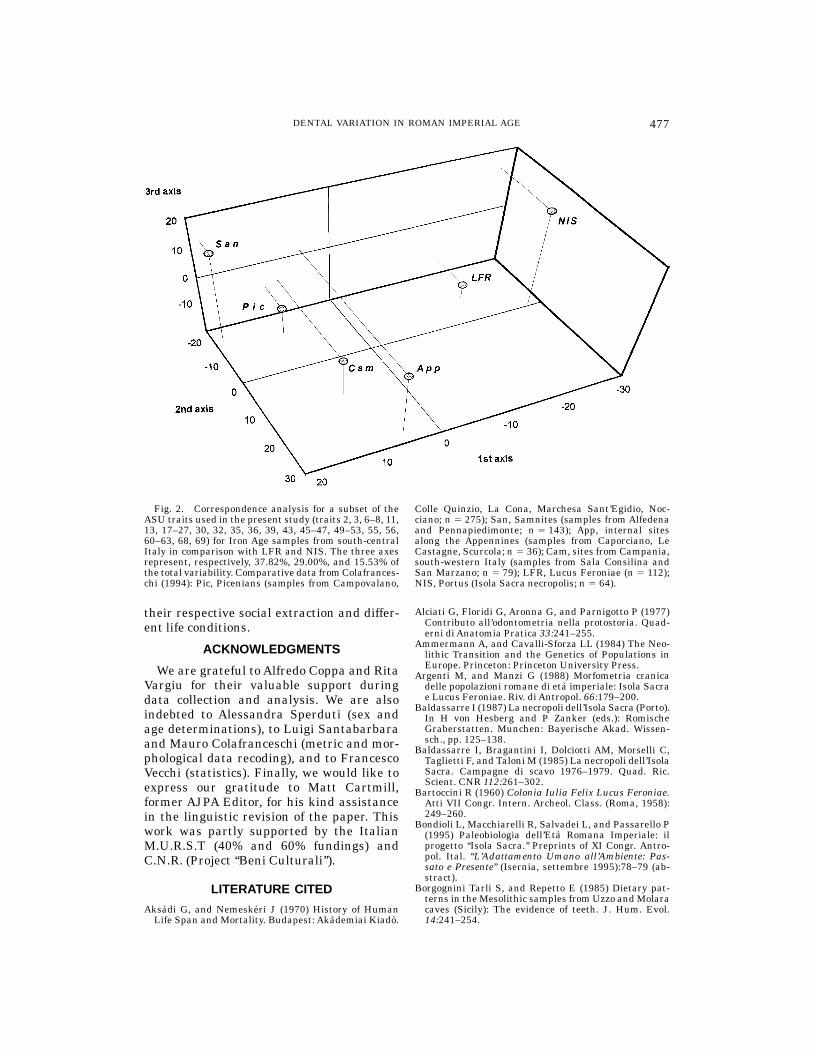
tion, an exploratory comparison was madepossible by a research project aimed to ob-tain large series of nonmetric (ASU) data onteeth of Italian populations of the 1st Mille-nium B.C. (Coppa et al., 1995). One of thepreliminary results of this attempt (Cola-franceschi, 1994) produced a set of datauseful for our comparisonwith discrete crown
variation in the Roman age. A correspon-dence analysis was performed using 40 dis-crete dental traits recorded for LFR, NIS,and groups of pre-Roman (Iron Age) popula-tion samples: Appenninians, Campanians,Picenians, and Samnites. In this analysis(Fig. 2), the first three axes involved 82.3%of the total variability, more than 75% ofwhich was concentrated in the first twoaxes. Combining the relative distributionsalong the 1st and the 2nd axes, the Romansamples cluster together, whereas a majordivergence between LFR and NIS is observ-able along the 3rd axis. The IronAge samplesare widely displaced from the Romansamples along the 1st axis, but differ mark-edly from each other along the 2nd and the3rd axes. The Appenninians seem to segre-gate from the other samples, consistentlywith their geographic isolation in the moun-tain habitat of central Italy. The Samnitesand the Picenians show more affinities withLFR than with NIS, in accordance with theancient link of Lucus Feroniae with internalpaths of communication before the Roman‘‘colonization.’’To summarize, the critical evaluation of
dental size and shape variables collected inthis study is consistent with the history ofthe two Roman sites and the hypothesesabout the composition of each population.These can be seen, in turn, as a secondaryconsequence of genetic admixture due to theopening of gene flow pathways during bothpre-Roman periods (e.g., Etruscans, Greekcolonies; compare Piazza et al., 1988) andthe military and political expansion of Romeacross theMediterraneum. Furthermore, thecharacterization of the two samples withrespect to Iron Age populations of centralItaly is in accordance with the similarityobserved in the direct comparison betweenthem. The differences between the two Ro-man samples support the hypothesis thatthe gene pool of the population segmentrepresented here by NIS (the ‘‘middle class’’inhabitants of the town of Portus) was morehomogeneous than that of the LFR ruralsample, mainly composed of slaves and warveterans. Both samples, however, show indi-cations of metabolic stress suffered by mostof the individuals during growth and devel-opment, without a clear connection with
476 G. MANZI ET AL.
their respective social extraction and differ-ent life conditions.
ACKNOWLEDGMENTS
We are grateful to Alfredo Coppa and RitaVargiu for their valuable support duringdata collection and analysis. We are alsoindebted to Alessandra Sperduti (sex andage determinations), to Luigi Santabarbaraand Mauro Colafranceschi (metric and mor-phological data recoding), and to FrancescoVecchi (statistics). Finally, we would like toexpress our gratitude to Matt Cartmill,former AJPA Editor, for his kind assistancein the linguistic revision of the paper. Thiswork was partly supported by the ItalianM.U.R.S.T (40% and 60% fundings) andC.N.R. (Project ‘‘Beni Culturali’’).
LITERATURE CITED
Aksadi G, and Nemeskeri J (1970) History of HumanLife Span and Mortality. Budapest: Akademiai Kiado.
Alciati G, Floridi G, Aronna G, and Parnigotto P (1977)Contributo all’odontometria nella protostoria. Quad-erni di Anatomia Pratica 33:241–255.
Ammermann A, and Cavalli-Sforza LL (1984) The Neo-lithic Transition and the Genetics of Populations inEurope. Princeton: Princeton University Press.
Argenti M, and Manzi G (1988) Morfometria cranicadelle popolazioni romane di eta imperiale: Isola Sacrae Lucus Feroniae. Riv. di Antropol. 66:179–200.
Baldassarre I (1987) La necropoli dell’Isola Sacra (Porto).In H von Hesberg and P Zanker (eds.): RomischeGraberstatten. Munchen: Bayerische Akad. Wissen-sch., pp. 125–138.
Baldassarre I, Bragantini I, Dolciotti AM, Morselli C,Taglietti F, and Taloni M (1985) La necropoli dell’IsolaSacra. Campagne di scavo 1976–1979. Quad. Ric.Scient. CNR 112:261–302.
Bartoccini R (1960) Colonia Iulia Felix Lucus Feroniae.Atti VII Congr. Intern. Archeol. Class. (Roma, 1958):249–260.
Bondioli L, Macchiarelli R, Salvadei L, and Passarello P(1995) Paleobiologia dell’Eta Romana Imperiale: ilprogetto ‘‘Isola Sacra.’’ Preprints of XI Congr. Antro-pol. Ital. ‘‘L’Adattamento Umano all’Ambiente: Pas-sato e Presente’’ (Isernia, settembre 1995):78–79 (ab-stract).
Borgognini Tarli S, and Repetto E (1985) Dietary pat-terns in theMesolithic samples fromUzzo andMolaracaves (Sicily): The evidence of teeth. J. Hum. Evol.14:241–254.
Fig. 2. Correspondence analysis for a subset of theASU traits used in the present study (traits 2, 3, 6–8, 11,13, 17–27, 30, 32, 35, 36, 39, 43, 45–47, 49–53, 55, 56,60–63, 68, 69) for Iron Age samples from south-centralItaly in comparison with LFR and NIS. The three axesrepresent, respectively, 37.82%, 29.00%, and 15.53% ofthe total variability. Comparative data fromColafrances-chi (1994): Pic, Picenians (samples from Campovalano,
Colle Quinzio, La Cona, Marchesa Sant’Egidio, Noc-ciano; n 5 275); San, Samnites (samples from Alfedenaand Pennapiedimonte; n 5 143); App, internal sitesalong the Appennines (samples from Caporciano, LeCastagne, Scurcola; n 5 36); Cam, sites fromCampania,south-western Italy (samples from Sala Consilina andSan Marzano; n 5 79); LFR, Lucus Feroniae (n 5 112);NIS, Portus (Isola Sacra necropolis; n 5 64).
477DENTAL VARIATION IN ROMAN IMPERIAL AGE
Brace LC, and Ryan AS (1980) Sexual dimorphism andhuman tooth size differences. J. Hum. Evol. 9:417–435.
Brace LC, Rosenberg KR, and Hunt KD (1987) Gradualchange in human tooth size in the late Pleistocene andpost-Pleistocene. Evolution 41:705–720.
Buikstra JE and Mielke JH (1985) Demography, dietand health. In RI Gilbert and JH Mielke (eds.): TheAnalysis of Prehistoric Diets. Orlando:Academic Press,pp. 359–422.
Calcagno JM (1986) Dental reduction in post-Pleis-tocene Nubia. Am. J. Phys. Anthropol. 70:349–363.
Calcagno JM (1989) Mechanisms of Human DentalReduction:ACase Study from Post-Pleistocene Nubia.Lawrence: University of Kansas.
Calcagno JM, and Gibson KR (1988) Human dentalreduction: Natural selection or the probable mutationeffect. Am. J. Phys. Anthropol. 77:505–517.
Calcagno JM, and Gibson KR (1991) Selective compro-mise: Evolutionary trends and mechanisms in homi-nid tooth size. In MA Kelley and CS Larsen (eds.):Advances in Dental Anthropology. New York: Wiley-Liss, pp. 59–76.
Calza G (1940) La Necropoli del Porto di Roma nell’IsolaSacra. Roma: Ist. Poligrafico dello Stato.
Colafranceschi M (1994) Relazioni biologiche tra popola-zioni dell’Italia centrale dell’eta del Ferro: I trattinon-metrici dei denti. Tesi di Laurea (a.a. 1993–94).Roma: Universita degli Studi ‘‘La Sapienza.’’
Coppa A, and Macchiarelli R (1982) The maxillarydentition of the Iron-age population of Alfedena(middle-Adriatic area, Italy). J. Hum. Evol. 11:219–235.
Coppa A, Vargiu R, Cucina A, Mancinelli D, Petrone PP,Alciati G, and Calcagno J (1995) Biological relation-ships among populations in central-southern Italyduring the 1st Millennium BC. Preprints of 1st Inter-nat. Congr. on ‘‘Science and Technology fro the Safe-guard of Cultural Heritage in the MediterraneanBasin’’ (Catania-Siracusa, November-December 1995):374 (abstract).
Ferembach D, Schwidtzky I, and Stloukal M (1979)Raccomandazioni per la determinazione dell’eta e delsesso sullo scheletro. Riv. di Antropol. 60:5–51.
Frayer DW (1978) The Evolution of Dentition in UpperPaleolithic and Mesolithic Europe. Lawrence: Univer-sity of Kansas Publications inAnthropology n. 10.
Frayer DW (1984) Biological and cultural change in theEuropean late Pleistocene and early Holocene. In FHSmith and F Spencer (eds.): The Origins of ModernHumans. NewYork: Alan R. Liss, Inc., pp. 211–250.
Garn SM, Kerenwsky RS, and Swindler DR (1966)Canine ‘‘field’’ in sexual dimorphism of tooth size.Nature 212:1501–1502.
Garn SM, Brace LC, and Cole PE (1977) Use of crownareas in odontometric analysis. J. Dent. Res. 58:876.
Garn SM, Osborne RH, and McCabe KD (1979) Theeffect of prenatal factors on crown dimensions. Am. J.Phys. Anthropol. 51:665–678.
Gazzetti G (1986) La colonia romana di Lucus Feroniaee suburbio. In VV.AA.: Tevere: Un’antica via per ilMediterraneo. Roma: Ist. Poligrafico dello Stato, pp.193–194.
Gibson KR, and Calcagno JM (1989) A critique of the‘‘Increasing Population Density Effect.’’ Human Evol.4:515–523.
Goodman AH, and Rose JC (1991) Dental enamel hypo-plasias as indicators of nutritional status. In MAKelley and CS Larsen (eds): Advances in DentalAnthropology. NewYork: Wiley-Liss, pp. 279–293.
Goose DH (1963) Dental measurement: An assessmentof its value in anthropological studies. In DR Broth-
well (ed.): Dental Anthropology. London: PergamonPress, pp. 125–148.
Guagliardo MF (1982) Tooth crown size differencesbetween age groups: A possible new indicator of stressin skeletal samples. Am. J. Phys. Anthropol. 58:383–389.
Harris EF, and Bailit HL (1980) The metaconule: Amorphological and familial analysis of a molar cusp.Am. J. Phys. Anthropol. 53:349–358.
Kieser JA (1990) Human Adult Odontometrics. Cam-bridge: Cambridge University Press.
Krogman WM, and Iscan MY (1986) The Human Skel-eton in Forensic Medicine. Springfield: C.C. Thomas.
Lambert T (1986) Realisation d’un Logiciel d’Analyse deDonnees. Paris, Orsay: Universite de Paris-Sud, Dep.de Statistique.
Macchiarelli R, and Bondioli L (1986a) Morphometricchanges in permanent dentition through the Neo-lithic: A microregional analysis. I. Upper dentition.Homo 37:239–256.
Macchiarelli R, and Bondioli L (1986b) Post-Pleistocenereductions in human dental structures: A reappraisalin terms of increasing population density. Hum. Evol.1:405–418.
Macchiarelli R, Salvadei L, and Catalano P (1988)Biocultural changes and continuity throughout the1st millennium B.C. in Central Italy: Anthropologicalevidence and perspectives. Riv. di Antropol. Suppl.66:249–272.
Macchiarelli R, Passarello P, and Bondioli L (1991) Thefossa mandibularis in the Neandertal cranium of theGuattari cave: A comparative morphometrical analy-sis. In M Piperno and G Scichilone (eds.): The Circeo 1Neandertal Skull Studies and Documentation. Roma:Istituto Poligrafico e Zecca dello Stato, pp. 357–389.
Mallegni F, Brogi G, and Balducci E (1984) Paleodontolo-gia dei reperti umani di Pontecagnano (Salerno)VII–IV sec. a C.Arch. per l’Antropol. e l’Etnol. 114:63–93.
Manzi G, and Sperduti A (1988) Variabilita morfologicanei campioni cranici di Isola Sacra e Lucus Feroniae(Roma, I-III secolo d.C.). Riv. di Antropol. 66:201–216.
Manzi G, Di Giorgio M, and Santabarbara L (1987)Materiale scheletrico umano di eta barbarica. Problem-atiche storico-antropologiche del popolamento di Romae del Lazio dopo la caduta dell’Impero romano. Riv. diAntropol. 65:377–400.
Manzi G, Censi L, Sperduti A, and Passarello P (1989)Linee di Harris e ipoplasia dello smalto nei restischeletrici delle popolazioni umane di Isola Sacra eLucus Feroniae (Roma, I–III sec. d.C.). Riv. di Antro-pol. 67:129–148.
Manzi G, Sperduti A, and Passarello P (1991) Behavior-induced auditory exostoses in imperial Roman society:Evidence from coeval urban and rural communitiesnear Rome. Am. J. Phys. Anthropol. 85:253–260.
Moggi-Cecchi J (ed.) (1995) Aspects of Dental Biology:Palaeontology, Anthropology and Evolution. Firenze:A. Pontecorboli Editore.
Nichol CR, and Turner CG (1986) Intra- and interob-server concordance in classifying dental morphology.Am. J. Phys. Anthropol. 69:299–315.
Nichol CR, Turner CG, and Dahlberg AA (1984) Varia-tion in the convexity of the human maxillary incisorlabial surface. Am. J. Phys. Anthropol. 63:361–370.
Passarello P (1976) Paleodemographic aspects of theIron age in Italy: the Veio’s Villanovians. J. Hum.Evol. 6:175–179.
Pellegrino A (1984) Le necropoli pagane di Ostia e diPorto. Itinerari ostiensi. Roma: Soprintendenza Ar-cheologica di Ostia.
Piazza A, Capello N, Olivetti E, and Rendine S (1988) Agenetic history of Italy.Ann. Hum. Genet. 52:203–213.
478 G. MANZI ET AL.
Pinto-Cisternas J,Moggi-Cecchi J, and Pacciani E (1995)A morphological variant of the permanent upperlateral incisor in two Tuscan samples from differentperiods. In J Moggi-Cecchi (ed.): Aspects of DentalBiology: Palaeontology, Anthropology and Evolution.Firenze: A. Pontecorboli Editore, in press.
Relethford JH, and Hodges C (1985) A statistical test fordifferences in sexual dimorphism between popula-tions. Am. J. Phys. Anthropol. 66:55–61.
Repetto E, Canci A, and Borgognini Tarli SM (1988)Indicatori scheletrici e dentari dello stato di salute nelcampione dell’Eta del Bronzo di ToppoDaguzzo, Basili-cata. Riv. di Antropol. 66:89–112.
Salomone F (1990) Indicatori scheletrici di dimorfismosessuale e lateralizzazione in un campione della popo-lazione umana di Lucus Feroniae (I–III sec. d.C.). Tesidi Laurea (a.a. 1989–90). Roma: Universita degliStudi ‘‘La Sapienza.’’
Salvadei L (1995) Le anomalie e le patologie dentali eparadentali come indicatori paleobiologicidell’interazione uomo-ambiente. Un esempio di discon-tinuita nel passaggio dall’eta romana all’Altomedioevo:i campioni laziali di Lucus Feroniae (I–III sec. dC),dell’Isola Sacra (I–III sec. dC) e della Selvicciola (VIIsec. dC). Tesi di Laurea (a.a. 1994–95). Roma: Univer-sita degli Studi ‘‘La Sapienza.’’
Salvadei L, Santandrea E, Manzi G, and Passarello P(1995) I Longobardi di ‘‘La Selvicciola’’ (Ischia diCastro, Viterbo). III—Morfologia e morfometria den-taria. Riv. di Antropol. 73:281–290.
Santabarbara L (1987) Il popolamento di Roma e delLazio in eta romana imperiale. Studio odontologicosui reperti di Lucus Feroniae e Isola Sacra. Tesi diLaurea (a.a. 1986–87). Roma: Universita degli Studi‘‘La Sapienza.’’
Santandrea E (1994) Antropologia dentaria in eta ro-mana imperiale: variabilita fenotipica nei campioni diLucus Feroniae e Portus Romae (I–III sec. d.C.). Tesidi Laurea (a.a. 1993–94). Roma: Universita degliStudi ‘‘La Sapienza.’’
Scott GR (1980) Population variation of Carabelli’s trait.Hum. Biol. 52:63–78.
Smith P (1977) Selective pressures and dental evolutionof hominids. Am. J. Phys. Anthropol. 47:453–458.
Stini WA (1969) Nutritional stress and growth: Sexdifference in adaptive response. Am. J. Phys. Anthro-pol. 31:417–426.
Tanner JM (1988) Human growth and costitution. In GAHarrison, JM Tanner, DR Pilbeam, and PD Baker(eds.): Human Biology. Oxford: Oxford UniversityPress, pp. 339–438.
Testaguzza O (1970) Portus. Roma: Jiulia.Turner CG II (1981) Root number determination inmaxillary first premolars for moderns human popula-tions. Am. J. Phys. Anthropol. 54:59–62.
Turner CG II (1987) Late Pleistocene and Holocenepopulation history of East Asia based on dental varia-tion. Am. J. Phys. Anthropol. 73:305–321.
Turner CG II (1990) Major features of Sundadonty andSinodonty, including suggestions about East Asianmicroevolution, population history, and Late Pleis-tocene relationship with Australian aboriginals. Am.J. Phys. Anthropol. 82:295–317.
Turner CG II, and Scott GR (1977) Dentition of EasterIlanders. In AA Dahlberg and TM Graber (eds.):Orofacial Growth and Development. Mouton: TheHague, pp. 229–249.
Turner CG II, Nichol CR, and Scott GR (1991) Scoringprocedures for key morphological traits of the perma-nent dentition: The Arizona State University DentalAnthropology System. In MA Kelley and CS Larsen(eds.): Advances in Dental Anthropology. New York:Wiley-Liss, pp. 13–31.
Van Gerven DP, Sheridan SG, and Adams WY (1995)The health and nutrition of a Medieval Nubian popu-lation. The impact of political and economic change.Am.Anthropol. 97:468–480.
Vargiu R, Coppa A, and Blakey ML (1993) L’ipoplasiadello smalto dei denti nelle necropoli di Campovalanodi Campli (Teramo) e di San Marzano (Salerno).Antropol. Contemp. 16:345–250.
y’Edynak G (1989) Yugoslav Mesolithic dental reduc-tion. Am. J. Phys. Anthropol. 78:17–36.
479DENTAL VARIATION IN ROMAN IMPERIAL AGE