DEMOGRAPHIC RESEARCH · While this assumption ... But the question asked in this paper about which...
30
DEMOGRAPHIC RESEARCH VOLUME 30, ARTICLE 16, PAGES 465-492 PUBLISHED 20 FEBRUARY 2014 http://www.demographic-research.org/Volumes/Vol30/16/ DOI: 10.4054/DemRes.2014.30.16 Research Article How does education change the relationship between fertility and age-dependency under environmental constraints? A long-term simulation exercise Erich Striessnig Wolfgang Lutz This publication is part of the Special Collection on “Population Dynamics and Economic Development”, organized by Guest Alexia Fürnkranz- Prskawetz, David Bloom, and Wolfgang Lutz. © 2014 Erich Striessnig and Wolfgang Lutz. This open-access work is published under the terms of the Creative Commons Attribution NonCommercial License 2.0 Germany, which permits use, reproduction & distribution in any medium for non-commercial purposes, provided the original author(s) and source are given credit. See http:// creativecommons.org/licenses/by-nc/2.0/de/
Transcript of DEMOGRAPHIC RESEARCH · While this assumption ... But the question asked in this paper about which...

DEMOGRAPHIC RESEARCH VOLUME 30, ARTICLE 16, PAGES 465-492 PUBLISHED 20 FEBRUARY 2014 http://www.demographic-research.org/Volumes/Vol30/16/ DOI: 10.4054/DemRes.2014.30.16 Research Article
How does education change the relationship between fertility and age-dependency under environmental constraints? A long-term simulation exercise
Erich Striessnig
Wolfgang Lutz
This publication is part of the Special Collection on “Population Dynamics and Economic Development”, organized by Guest Alexia Fürnkranz-Prskawetz, David Bloom, and Wolfgang Lutz.
© 2014 Erich Striessnig and Wolfgang Lutz. This open-access work is published under the terms of the Creative Commons Attribution NonCommercial License 2.0 Germany, which permits use, reproduction & distribution in any medium for non-commercial purposes, provided the original author(s) and source are given credit. See http:// creativecommons.org/licenses/by-nc/2.0/de/
Table of Contents
1 Introduction 466 2 Criteria of optimality 469 3 Methods and data 472 4 Results 475 5 Sensitivity 477 6 Adding the climate change dimension 482 7 Discussion 485 References 488 Appendix 491

Demographic Research: Volume 30, Article 16 Research Article
http://www.demographic-research.org 465
How does education change the relationship between fertility and age-dependency under environmental constraints?
A long-term simulation exercise
Erich Striessnig1
Wolfgang Lutz2
Abstract
BACKGROUND When asked what a desirable fertility level for populations might be, most politicians, journalists, and even social scientists would say it is around two children per woman, a level that has been labelled by demographers “replacement-level fertility.” The reasons given for considering this level of fertility as something to aim at usually include maintaining the size of the labour force and stabilizing the old-age-dependency ratio.
OBJECTIVE In this paper, we scrutinize this wide-spread view by introducing education in addition to age and sex as a further relevant source of observable population heterogeneity. We consider several criteria for assessing the long-term implications of alternative fertility levels and present numerical simulations with a view on minimizing the education-weighted total dependency ratio and complement this with the goal of reducing the amount of greenhouse gas emission in the context of climate change.
METHODS We perform thousands of alternative simulations for different fertility levels (assumed to be constant over time) starting from empirically given population structures and derive the rate of fertility which yields the lowest level of our education-weighted dependency ratio. We study the sensitivity of our results to different parameter values and choose to focus on the actual populations of Europe and China over the course of the 21st century.
1 Wittgenstein Centre for Demography and Global Human Capital (IIASA, VID/ÖAW, WU), Vienna University of Economics and Business. E-Mail: [email protected]. 2 Wittgenstein Centre for Demography and Global Human Capital (IIASA, VID/ÖAW, WU), International Institute for Applied Systems Analysis. E-Mail: [email protected].

Striessnig & Lutz: Optimal Fertility
466 http://www.demographic-research.org
RESULTS The results show that when education is assumed to present a cost at young age and results in higher productivity during adult age, then the fertility rate that on the long run keeps dependency at a minimum turns out to lie well below replacement fertility both in Europe and in China under a set of plausible assumptions. The optimal fertility level falls even lower when climate change is factored in as well.
CONCLUSION We conclude that there is nothing magical or particularly desirable about replacement level fertility.
1. Introduction
Many scientific and public discussions about demographic trends in low fertility countries are based on the implicit assumption that somehow replacement level fertility (RLF) is the most desirable long-term fertility level for any nation state. This leads to the popular view in Germany that fertility was too low, whereas in France it was about right. Consequently, newspaper headlines in those countries often claim that family policies were not reaching their goals because they failed to raise fertility to RLF. But this view is also reflected in official UN compendia about government views on demographic trends (UN Population Division 2011; Vobecká, Butz,and Reyes 2013).
This normative view about what is the most desirable long-term level of fertility shows an interesting interaction with the long-term fertility assumptions in international population projections. For decades the UN population projections have – with only minor variations – consistently assumed that in the long run all populations of the world will converge to RLF. While this assumption has likely been inspired by political desirability of a view where in the long run there will be a global population equilibrium, with no populations shrinking and none increasing, it is also plausible to assume that the pervasiveness of this long-term population assumption has in turn influenced what people consider to be the norm. If a country sees itself below or above the medium path as projected by the UN, then it may think that its fertility is either too low or too high under a normative perspective.
In this paper, we will question this ubiquitous normative belief that RLF is somehow the ultimate goal. We will do so by discussing and specifying clear criteria for what is desirable and then simulate the long-term consequences of alternative fertility levels with respect to these criteria. When doing this we will go beyond the conventional rather narrow view of population dynamics by age and sex and instead apply models that have been developed more recently, integrating population dynamics

Demographic Research: Volume 30, Article 16
http://www.demographic-research.org 467
in three dimensions, namely age, sex, and level of educational attainment. This new multi-dimensional approach has recently been summarized by Lutz and KC (2011). Therefore, we only provide a brief illustration for the case of South Korea, where – as in many other low fertility countries – the question arises as to whether the smaller number of young people can be compensated for in terms of aggregate economic wellbeing by their better education (compare Lee and Mason 2010). The example of Korea is a rather extreme case due to the very low level of fertility and the very rapid recent expansion of educational attainment as illustrated in the projection for 2020 by age, sex, and level of education in Figure 1. Here the different colours refer to men and women by highest level of educational attainment as indicated by the legend at the bottom of the figure. The government of Korea is clearly very concerned about the currently low level of fertility. At the IUSSP International Population Conference in Busan in August 2013, hundreds of provincial and local level “family consultants” or social workers attended seeking more information about how to convince couples to have more children. There seemed to be a general conviction that the low level of fertility posed a major threat to the future of the country.
Figure 1: Population by age, sex, and education. Republic of Korea, 2020
Source: Lutz and KC 2011
Striessnig & Lutz: Optimal Fertility
468 http://www.demographic-research.org
As shown in the figure, the age pyramid of Korea is indeed becoming extremely narrow at the bottom. In 2020 the age group 0-4 will be less than half of the size of the age group 45-49. This is because South Korea has had a TFR (total fertility rate) of roughly 1.2, one of the world’s lowest, for some time now. On the other hand, Korea has experienced one of the fastest expansions of the educational composition of its population in human history. While as recently as in 1960 the vast majority of women of reproductive age had never been to school and only very few had had at least junior secondary education (the consequences of this can still be seen among elderly women in Figure 1), today young Korean women are among the best educated in the world with already more than half of the younger cohorts having completed college education. There is little doubt that this most impressive educational expansion has been one of the key factors behind the astonishing economic growth which followed soon thereafter (Lutz, Cuaresma, and Sanderson 2008).
Nevertheless, the picture presented in Figure 1 has given rise to very different conclusions concerning the future socioeconomic prospects of South Korea. Some see the tremendous aging and the associated increase in the conventional old-age-dependency ratio as an implication of doom, if not economic collapse, for the future. Others point at the stunning increases in education and assume that in a likely future of high tech industries, the Korean labour market will need fewer and much better educated young people. Who is right? These differing views also result in opposing policy recommendations. Given that highly educated Korean women have difficulty finding an equally or better educated male partner and often reject the traditional role as a housewife (Choe and Retherford 2009), some of those primarily concerned about the low fertility blame, in part, higher female education for this trend.
In scientific terms, the question refers to the trade-offs between age-structure and education structure in terms of their contributions to current and future wellbeing. This is the main topic of this paper. Let us assume for the moment that fertility is a policy variable and we can choose among different hypothetical future pathways. Which average level of fertility should we see as most desirable in terms of being in the best long-term interest of society? (“Long-term” referring here to the next decades, through the end of this century.) One argument often mentioned in favour of RLF is that in the very long run (over several centuries or millennia), any other level would result either in population explosion or in eradication. But it seems to make little sense to argue with possible consequences many centuries down the road when the task is to assess the implications of fertility levels in the near-term future. Given the still unknown technologies and socioeconomic conditions of those future days, we can leave the task of looking at those consequences that go well beyond our current century to our great grandchildren, who should figure out for themselves what they see as the optimal fertility in the 22nd century.

Demographic Research: Volume 30, Article 16
http://www.demographic-research.org 469
It is surprising that this highly relevant question of the criteria for the desirability of different fertility levels among low-fertility societies has hardly been posed by demographers thus far. Whether or not countries such as South Korea should launch major and possibly very expensive efforts to increase the birth rate depends first and foremost on the question of what is considered a desirable level of fertility. Unless this is to be left entirely to politically intuitive or emotional factors, there must be clearly specified criteria for assessing this question. The abundant literature on the century-old discussion of optimal population size has been inconclusive up to the present date. Joel Cohen’s impressive book entitled “How many people can the world support?” (Cohen 1995) presents and discusses a wealth of different estimates and criteria for optimality of population size, but it also fails to give a clear answer to the question posed in the title, primarily because of the uncertainty about the technologies to be assumed for the longer-term future. But the question asked in this paper about which fertility rate would be most desirable in terms of long-term social welfare is less a question about population size – which enters only indirectly – and more one about desirable population structures in terms of the implied dependency ratios.
The goal of our paper therefore is to first define possible criteria for preferring one level of fertility over others. These criteria are then operationalized in a quantitative model in the following sections. Section 3 introduces the age-dependency model and the basic assumptions with the results presented in Section 4. Section 5 presents a detailed sensitivity analysis with some of the key model parameters. In Section 6 we add the climate change dimension to our analysis of the desirable rate of fertility. The paper concludes with a discussion.
2. Criteria of optimality
Any discussion of what should be considered an optimal level of fertility (OLF) must be very clear and explicit with respect to the optimality criteria used. In the context of current low-fertility populations, most of the concern in the discussion of demographic trends relates to the economic and social consequences of population ageing, addressed in the recent demographic literature in terms of a major expected increase in the old-age-dependency ratio which is also often seen as the closing of a demographic window of opportunity (Bloom, Canning, and Sevilla 2003; Cutler et al. 1990; Lee and Mason 2006). Other things being equal, it can be assumed that a lower dependency burden is associated with higher per capita well-being because the same economic production generated by the working age population must be shared with fewer children and elderly who are not of working age.

Striessnig & Lutz: Optimal Fertility
470 http://www.demographic-research.org
But an increase in the age-dependency burden can also be triggered by above-replacement rates of fertility. In the context of our question about the desirable level of fertility, this is just the other side of the coin. Both below-replacement and above-replacement levels of fertility have in common that they can lead to an unbalanced population age-structure, which in the long run places population policies under pressure.
Since Bloom and Williamson (1998) began to focus on the relationship between age-structure change and economic growth, thus explicitly introducing age as a relevant source of population heterogeneity into the analysis, the now widely used and popularized concept of the demographic dividend refers only to changes in age-dependency ratios, whose evolution over the course of the demographic transition presumably results in a demographic window that first opens and then closes in a predictable way as the old-age-dependency ratio starts to increase (UNFPA 2011). However, such theoretical reasoning about the future dependency burden due to fertility-induced reductions in the size of the labour force still misses an important point as long as education is not factored in. Bloom and Williamson explicitly included education as an independent variable yielding significantly positive effects, yet they did not discuss the importance of education in depth.
Lutz et al. (2008) extended the demographic dividend model. First, by distinguishing two mechanisms for human capital to influence economic growth: (1) through the direct effect of the productivity of workers and (2) indirectly through its effect on the rate of total factor productivity growth. Second, they used a new education database (Lutz et al. 2007) that was more consistent and more detailed than previous data sources to disaggregate education effects by both age and level of educational attainment. Using data for 101 countries over six 5-year periods from 1970–2000, they found that the direct productivity effect is particularly strong for older workers with secondary education, while younger workers with tertiary education have the greatest effect on the speed of total factor productivity growth.
In line with this evidence and still within the context of the literature about the demographic dividend, in this paper we seek to show that when smaller future cohorts are better equipped with human capital than the ones in the labour market they are replacing, fertility should be well below RLF if the goal is to minimize the future dependency burden. This has been demonstrated for the theoretical case of a stable population by Lutz, Sanderson, and O’Neill (2004). Our goal is to greatly expand this initial analysis and conduct systematic sensitivity analyses along several dimensions: we assess the long-term impacts of a large number of alternative fertility levels with respect to different sets of education costs and benefits, different future education trajectories, and different possible pension systems with respect to replacement rates and pension ages. We also apply the model to the actual age and education structures of

Demographic Research: Volume 30, Article 16
http://www.demographic-research.org 471
real world populations over the 21st century rather than unrealistic steady states. In addition, we attempt to factor in the effects of population trends on greenhouse gas emissions and thus on climate change.
In times of major concerns about global climate change, the possible impacts of different demographic trajectories on future paths of greenhouse gas emissions can be viewed as an additional criterion of the desirability of a certain level of fertility and as a relevant factor contributing to future societal wellbeing. With respect to this environmental dimension, there is generally little doubt that fewer people are considered to be better for the planet (Royal Society 2012). While there certainly are major challenges in trying to quantify this effect and in weighing it against the costs and benefits of population ageing, we can still conduct a first approximation to a combined criterion of optimality by presenting results for a reasonable range of possible weights on the criterion derived from both projected dependency and emissions levels. To demonstrate our results, we use the example of the EU-27 and China, because for these countries model-based calculations of the effects of alternative fertility levels on greenhouse gas emissions were available (compare O'Neill et al. 2010).
Apart from the economic and the environmental perspective, there are of course other criteria in assessing the OLF. Viewed from the individual perspective, it appears to be “optimal” to follow a supposedly “natural” desire for a man and a woman to have two children together in order to replace themselves and hence continue living in their children (Lutz and Scherbov 2008). Yet it remains questionable whether minimizing the difference between desired and actual family size on the individual level also yields the most desirable aggregate level of fertility. Viewed from a nationalistic perspective, population becomes a relevant security factor where historically, a higher rate of fertility was considered to be preferable. Whether this remains to be the case today, is a matter of debate and depends on a range of other – not only demographic – factors (compare Fargues 2000 referring to the Israeli-Palestinian conflict). Yet, while such nationalistic and individual level criteria clearly play an important role in our contemporary world, they cannot be operationalized in terms of internationally applicable criteria for optimal fertility.
In the following, we focus on the economic and environmental aspects associated with the changing size and age-structure of the population while explicitly taking education into account. To suggest that future low-fertility societies can tackle the consequences of societal aging solely by raising fertility levels to RLF means to ignore the resulting acceleration of climate change, in particular when considering that in the rich countries per capita emissions are significantly higher than in the poorer countries. Here again, education may play an important role. On the climate change mitigation side it is plausible to assume that at a given level of income more educated people move to cleaner technologies more quickly (Sharygin 2013), while at the adaptation side, the

Striessnig & Lutz: Optimal Fertility
472 http://www.demographic-research.org
role of education in enhancing societies’ capacities to adapt to climate change has recently been shown by Striessnig and Lutz (2013).
3. Methods and data
In order to assess the welfare impact of different long-term levels of fertility, we use a simple population projection model that enables us to calculate education-weighted dependency ratios (EWDR), based on observed initial (2010) population structures, survival probabilities as reported by the UN Population Division (2010), as well as different exogenous population projections by educational attainment developed at the International Institute for Applied Systems Analysis (IIASA) and the Vienna Institute of Demography (VID) (KC et al. 2010). We are well aware that the educational trajectory of every society impacts its fertility, as was first stressed within the context of a dynamic equilibrium model by (Barro and Becker, 1989) and empirically proven by numerous other studies (Cochrane 1979; Cochrane, Khan and Osheba 1990; Bongaarts 2010; Skirbekk and KC 2012). In fact, these considerations have been at the heart of many of the recent writings on education-specific population projections (Lutz and KC 2011). Yet, in this particular paper we are interested in the long-term consequences of different fixed rates of fertility given certain exogenously provided narratives for the future of education. These narratives are provided through the scenarios of the IIASA/VID projections and will be described in detail later on.
In accordance with the education projections, we divide the population into four education categories (none, primary, secondary, and tertiary – where for Europe the first category is irrelevant), applying different weights to each of them both with regard to the dependency burden due to the cost of education and to differential support (considering education-specific productivity) that people of working age can supply for those not of working age. This is simply an extension of the conventional total dependency ratio in which the strong and unrealistic assumption is made that every person of working age will make the same contribution to the support of the dependent population. The optimal level of fertility is the TFR, which in the long run shows the lowest level of the EWDR.

Demographic Research: Volume 30, Article 16
http://www.demographic-research.org 473
𝐸𝑊𝐷𝑅 =𝐸𝑊𝐶 + 𝑅𝐸𝑊𝑊
𝐸𝑊𝐶 = 𝑝𝑜𝑝𝑝𝑟𝑒𝑠𝑐ℎ𝑜𝑜𝑙0−5 ∗ 𝑒𝑑0𝑐𝑜𝑠𝑡 + 𝑝𝑜𝑝𝑝𝑟𝑖𝑚6−10 ∗ 𝑒𝑑1𝑐𝑜𝑠𝑡 + 𝑝𝑜𝑝𝑠𝑒𝑐11−18 ∗ 𝑒𝑑2𝑐𝑜𝑠𝑡
+ 𝑝𝑜𝑝𝑡𝑒𝑟𝑡19−25 ∗ 𝑒𝑑3𝑐𝑜𝑠𝑡
𝐸𝑊𝑊 = 𝑝𝑜𝑝𝑝𝑟𝑖𝑚16−57 ∗ 𝑒𝑑1𝑤𝑒𝑖𝑔ℎ𝑡 + 𝑝𝑜𝑝𝑠𝑒𝑐19−61 ∗ 𝑒𝑑2𝑤𝑒𝑖𝑔ℎ𝑡 + 𝑝𝑜𝑝𝑡𝑒𝑟𝑡26−65 ∗ 𝑒𝑑3𝑤𝑒𝑖𝑔ℎ𝑡
𝑅 = 𝑝𝑜𝑝𝑝𝑟𝑖𝑚58+ ∗ 𝑝𝑒𝑛𝑐𝑜𝑠𝑡 + 𝑝𝑜𝑝𝑠𝑒𝑐62+ ∗ 𝑝𝑒𝑛𝑐𝑜𝑠𝑡 + 𝑝𝑜𝑝𝑡𝑒𝑟𝑡66+ ∗ 𝑝𝑒𝑛𝑐𝑜𝑠𝑡
In the calculation of the education-weighted workforce (𝐸𝑊𝑊), 𝑒𝑑1𝑤𝑒𝑖𝑔ℎ𝑡
refers to the weight given to working age people with only primary education (this is usually set to 1.0), 𝑒𝑑2𝑤𝑒𝑖𝑔ℎ𝑡 refers to those with at least junior secondary and 𝑒𝑑3𝑤𝑒𝑖𝑔ℎ𝑡 to those who have at least a completed first-level tertiary education. While there had previously been some ambiguity around the specific effect of education on economic growth (i.e., Krueger and Lindahl 2000; Pritchett 2001), more recent literature which also considers the age-structure of human capital yields clear evidence that in virtually every society the more educated are more productive in economic terms and contribute more to macro-economic growth (Lutz, Cuaresma and Sanderson 2008; Carneiro, Heckman and Vytlacil 2010; Patrinos and Psacharopoulos 2011). This effect is captured here by giving the better educated higher weights when calculating the denominator of the EWDR.3 In the figures below, the specific assumptions made are listed in the box on the upper left. In all other respects this analysis makes the same simplifying assumption as the usual dependency ratios (that everyone of working age who no longer attends school is in the labour force, there is no unemployment, etc.).
As far as the dependents (numerator of the EWDR) are concerned, retirees (𝑅) all get the same weight (𝑝𝑒𝑛𝑐𝑜𝑠𝑡, here assumed to be 1), but the ages of labour market entry and exit are education-specific. In other words, uneducated and primary-educated people are assumed to move from the numerator of the dependency ratio to the denominator after age 15, secondary-educated after age 18, and tertiary-educated follow at the age of 25. In accordance with UNESCO (2009), we also assume that those receiving secondary and tertiary education require a higher educational input after the
3 The specific weights at this stage are chosen rather arbitrarily because there is only fragmentary empirical evidence on the many different channels through which education affects productivity. As we are taking the simplifying assumption that everybody of working age is in the labor force while labor force participation does, in fact, depend strongly on educational attainment, these weights must be seen as including more than just productivity. But as a sensitivity analysis shows in the following, the optimum does not respond greatly to the choice of these weights. Rather they affect the level of the dependency ratio.

Striessnig & Lutz: Optimal Fertility
474 http://www.demographic-research.org
age of 10. The assumed values for education-weighted children (𝐸𝑊𝐶) in the figure below are listed under 𝑒𝑑_𝑐𝑜𝑠𝑡 where – just as in the traditional dependency ratio – the cost is 1.0 for everybody up to age 10. It is then increased to 𝑒𝑑2𝑐𝑜𝑠𝑡 for those with secondary education up to age 18 and to 𝑒𝑑3𝑐𝑜𝑠𝑡 for those going on to study to age 25.4
But education has benefits as well as costs. When retiring from the labour market and thus returning to the numerator, the primary-educated are initially assumed to make the transition at the age of 57, secondary educated retire at 61, and tertiary educated at 65. These assumptions roughly resemble the current empirical evidence from Europe (Heckman and Jacobs 2010). However, current trends across the continent strongly suggest these ages will increase over the coming decades. Therefore, as life expectancy goes up in our model, following the medium scenario of the UN (2010), the labour market exit is also delayed in parallel.5
Adding the climate change dimension to our analysis, we examine how different fertility levels affect future wellbeing through their impacts on carbon emissions, which can be seen as another criterion for determining the OLF in the sense of socially desirable fertility. In doing so, we rely on the model-based aggregate level carbon emission projections kindly produced for us by Brian O’Neill and his colleagues at the National Center For Atmospheric Research (NCAR) following the methodology described in O'Neill et al. (2010). These emission projections are currently sensitive to differences in urbanization and household size resulting from different fertility rates but not to the education structure of the population. We are thus missing potential feedback from different education scenarios on the resulting levels of emissions. To date there is very little scientific evidence on this question.
In the final step of our analysis, we combine the two criteria of optimality and weigh the environmental consequences of human reproduction against the costs and benefits arising from the ageing dimension. Because it is impossible to know the extent to which future generations will emphasize climate change in their calculus of the socially desirable level of emissions, we can only assume different levels of intensity. But no matter how strong an importance we assign to the climate change argument in our joint criterion of optimality, the resulting OLF will always lie below what has been found to be optimal under the merely economic criterion of education-weighted dependency.
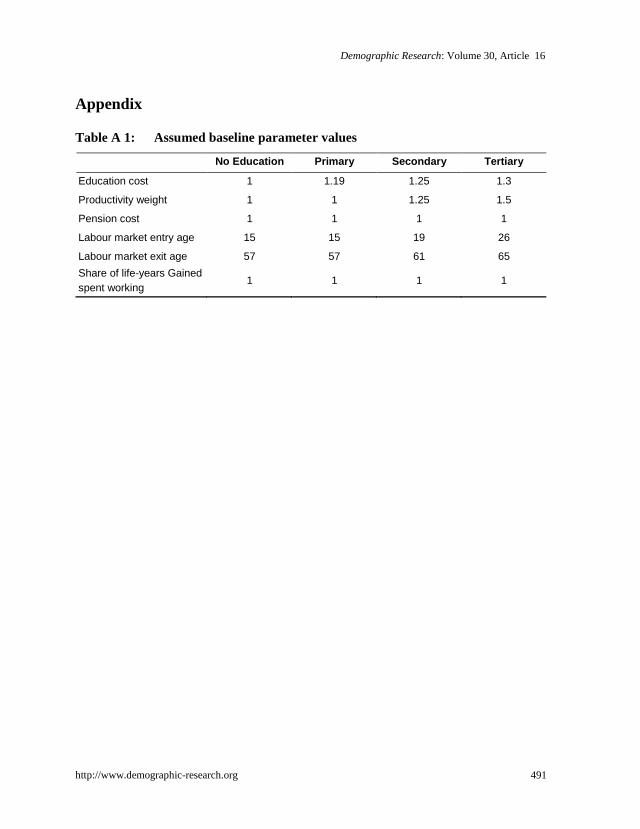
4 As UNESCO did not provide us with cost estimates for the entire EU-27 or China, for our baseline results at least we assumed German education costs and provide sensitivity analysis with regard to this assumption later on. 5 A detailed sensitivity analysis for the case in which pension ages do not respond to increases in life expectancy is presented in the sensitivity section. For simplicity, the retirement ages are assumed to be the same for men and women, but this could easily be changed, as could all of the other assumptions on weights and transition ages. Table A 1 of the Appendix summarizes all of our baseline assumptions.

Demographic Research: Volume 30, Article 16
http://www.demographic-research.org 475
4. Results
In the context of real world populations with non-stable age distributions, the time dimension becomes extremely important in this exercise. If the time horizon for optimization is only 10 or 20 years, the fertility level that minimizes the dependency ratio is very different from that under a longer time horizon. In all the following figures it was assumed that the fertility will move from its current level to the target level (listed on the TFR-axis) by 2030 and then remains constant. The standard assumption used here for all education trends is the global education trend (GET) scenario – defined as a mildly optimistic baseline in the IIASA/VID education projections. It assumes a further improving trend following those countries that are already more advanced in their educational structure with tertiary education assumed to level off at a maximum proportion of 60% of a cohort. Our baseline results for the EU-27 and China are given in Figure 2. As shown in Figure 2 (a) and (b), extremely low fertility turns out to be optimal for all time horizons in which these fewer children do not yet affect the size of the labour force but only bring down young age-dependency. Under such a short time horizon, not to have any children is best. Such a policy decreases the dependency ratio, but is of course very short-sighted because it will begin to starve the economy of workers 15 years later. As can be seen in the second half of the century, the pattern of an inverted U-shape appears which characterizes the graphs for the longer run. It is also interesting to note that the curve inclines more steeply to the left for cases of extremely low fertility and somewhat slower to the right for cases of high fertility. The OLF is also indicated for different points in time in the box in the lower right corner.

Striessnig & Lutz: Optimal Fertility
476 http://www.demographic-research.org
Figure 2: Education-Weighted Dependency Ratio (EWDR) for different Total Fertility Rates (TFR) for Global Education Trend (GET) – Scenario. Baseline for (a) EU-27 and (b) China with lines at 2030 to 2100

Demographic Research: Volume 30, Article 16
http://www.demographic-research.org 477
Figure 3 goes further into detail by showing the total fertility rates minimizing dependency in every year up until 2150 for the EU-27 and China. As we shall see, in the GET-scenario for any year these levels of TFR are well below RLF.
Figure 3: Optimal Total Fertility Rate (TFR) for the EU-27 and China for Global Education Trend (GET), individual years 2020-2150
5. Sensitivity
What if the educational system does not, as assumed in the GET-Scenario, continue to expand over the course of the 21st century but rather shows stagnation? As we do not look at the dynamic case where the chances of an expansion in educational attainment depend on the level of fertility but assume fixed shares of population within different education groups, in our next step we are looking at the sensitivity of the EWDR with respect to alternative educational structures of the population. This is illustrated in Figure 4 for the cases of the EU-27 and China where we compare our baseline scenario with the CER (Constant Enrolment Rate) – Scenario. It assumes constant education levels based on current (2010) age-specific school enrolment rates. This implies that among future young cohorts the share of the matriculated population at any level of educational attainment will remain constant at the current (2010) level. Nevertheless, the overall educational composition of the population will improve slightly over several

Striessnig & Lutz: Optimal Fertility
478 http://www.demographic-research.org
decades due to preexisting intercohort discrepancies in educational attainment as younger, typically better educated cohorts replace the older, less educated ones.
The picture clearly shows that the optimal TFR is lower in a population with higher average education. Whereas in Europe it decreases from an average of 1.98 to 1.79 children, switching from CER to GET, in China the OLF is down from 1.9 to 1.68 children. This reduction is rather insensitive to the choice of the relative productivity weights. It is primarily due to two effects: the increased total education cost which makes children more expensive and the increased average age of retirement which in the optimum requires a smaller number of children to pay for a smaller number of future pensioners.
Figure 4: The effect of alternative education trajectories. Education-Weighted
Dependency Ratio (EWDR) for different Total Fertility Rates (TFR) and resulting Optimal Level of Fertility (OLF) for the Global Education Trend (GET) and Constant Enrollment Rate (CER) scenarios in 2100 for the EU-27 and China

Demographic Research: Volume 30, Article 16
http://www.demographic-research.org 479
But the OLF does not just depend on the education scenario. Figure 5 shows its sensitivity to our assumptions about how additional life years will be used in the future. One might even question that life expectancy will go up in the future but we do not consider this possibility for the moment. Rather, we take a look at what happens to our measure of social wellbeing when we keep pension ages constant in spite of the fact that life expectancy goes up (dashed line) or assume that only half of the gains in life expectancy will be time spent in the denominator of the EWDR, whereas the other half is additional time spent in retirement (dotted line).
Again, a smaller share of additional life years spent working not only raises the level of dependency, it also has a strong effect on the OLF. If only half the gain in life expectancy becomes a gain in working years, then the mean age at retirement in 2100 would be roughly 3 years lower than in the baseline case and the OLF would be 1.93. In the extreme case, if pension ages are entirely inelastic with respect to life expectancy, the retirement age stagnates, making a TFR of 2.05 optimal. Turning the rationale around, if fertility cannot easily be stimulated, effective pension ages will have to increase in order to maximize welfare. Figure 5: The effect of alternative assumptions regarding future life
expectancy gains. Education-Weighted Dependency Ratio (EWDR) for different Total Fertility Rates (TFR) and resulting Optimal Level of Fertility (OLF) in 2100 for the EU-27

Striessnig & Lutz: Optimal Fertility
480 http://www.demographic-research.org
Apart from the education scenario, our results also crucially depend on the parameter values assumed for pension payments, cost of education, and productivity weights. The baseline assumption with regard to the pension cost is the model of the “Volkspension” in which the government provides comparatively equal low levels of pension payments which then can be supplemented through individual savings. This is close to what we see in the USA or in Scandinavian countries. However, the OLF might be different when looking at a system with a fixed pension replacement rate which is linked to previous labour income. This is the sensitivity analysis that is presented in Figure 6. Figure 6: The effect of alternative pension schemes. Education-Weighted
Dependency Ratio (EWDR) for different Total Fertility Rates (TFR) and resulting Optimal Level of Fertility (OLF) in 2100 for the EU-27
It is interesting to see that when the pension rate is 100 per cent and retiring does
not lead to a loss in income, the resulting OLF coincides with RLF. Such a high pension rates is however rather untypical, and so we assumed a range of lower pension rates which all lead both to lower levels of fertility in the optimum, but also to a lower level of dependency and thus to higher welfare in the optimum.
The values assumed for the education cost in the baseline case are empirically grounded (compare UNESCO 2009) and correspond to the costs observed at different

Demographic Research: Volume 30, Article 16
http://www.demographic-research.org 481
schooling levels in those European countries for which data is available. One might argue that these values do not properly reflect the situation in China or even the EU-27. In Figure 7, therefore, we compare our baseline results with the cases of 20 per cent lower and higher costs of education, respectively. Figure 7: The effect of alternative education costs. Education-Weighted
Dependency Ratio (EWDR) for different Total Fertility Rates (TFR) and resulting Optimal Level of Fertility (OLF) in 2100 for the EU-27
The sensitivity analysis reveals that if children are assumed to be 20 per cent more
expensive in terms of their education, comparing the solid line with the dotted line, the fertility level associated with the lowest dependency falls even lower. This is, of course, disregarding the possibility of more expensive education also being better quality education and thus leading to greater gains in productivity later on. Lower education costs lead to a higher OLF.
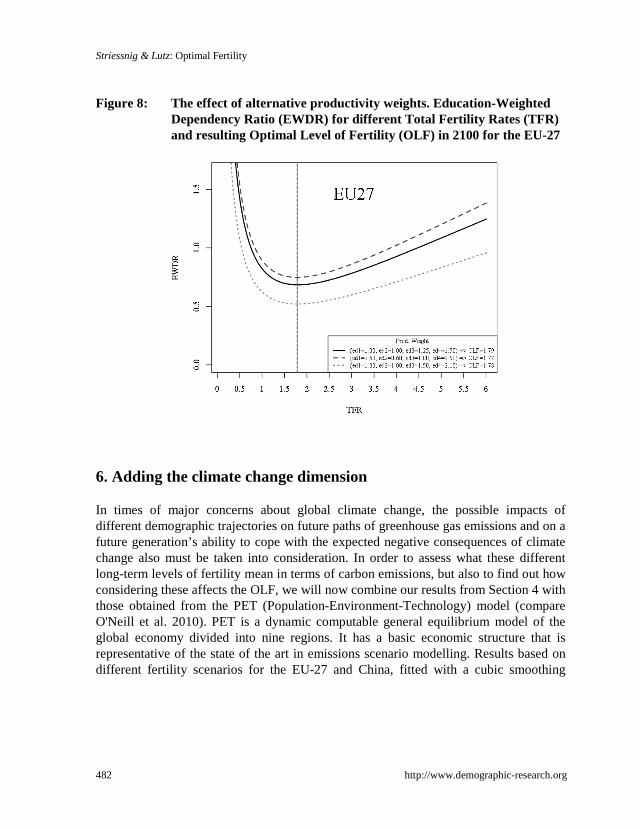
Finally, we want to look at the sensitivity with regard to the education-specific productivity weights. Here the assumptions behind our baseline results were chosen rather arbitrarily. Yet, as we show in Figure 8, the optimum does not respond greatly to the choice of these weights. Rather, they affect the level of the dependency ratio and the stronger education is assumed to affect productivity of those participating in the work force, the lower the level of dependency in the optimum.
Striessnig & Lutz: Optimal Fertility
482 http://www.demographic-research.org
Figure 8: The effect of alternative productivity weights. Education-Weighted Dependency Ratio (EWDR) for different Total Fertility Rates (TFR) and resulting Optimal Level of Fertility (OLF) in 2100 for the EU-27
6. Adding the climate change dimension
In times of major concerns about global climate change, the possible impacts of different demographic trajectories on future paths of greenhouse gas emissions and on a future generation’s ability to cope with the expected negative consequences of climate change also must be taken into consideration. In order to assess what these different long-term levels of fertility mean in terms of carbon emissions, but also to find out how considering these affects the OLF, we will now combine our results from Section 4 with those obtained from the PET (Population-Environment-Technology) model (compare O'Neill et al. 2010). PET is a dynamic computable general equilibrium model of the global economy divided into nine regions. It has a basic economic structure that is representative of the state of the art in emissions scenario modelling. Results based on different fertility scenarios for the EU-27 and China, fitted with a cubic smoothing

Demographic Research: Volume 30, Article 16
http://www.demographic-research.org 483
spline (Chambers and Hastie 1992), are shown in Figure 9 below.6 As can be seen here, carbon emissions do not decrease linearly with fertility. This is due to the fact that energy consumption in PET is linked not only to the absolute number of people that arises from different levels of fertility, but also on urbanization and the number of households. As fertility goes down, the number of households declines at a slower rate than the population due to population ageing and the fact that many elderly tend to live alone. Figure 9: CO2-emissions for the EU-27 and China in 2100 following from
different long-term fertility levels
Source of original data: PET-Model (cf. O'Neill et al. 2010)
6 While in Figure 9 the data points for UN-Med and UN-High come directly from the O’Neill et al. paper (following the fertility paths over time as assumed by the UN), the results for 1.0, 1.25 and 1.5 for China and the EU stem from special model runs by O’Neill and colleagues as presented in the opening plenary of the European Population Conference 2010 in Vienna.
01
23
4
TFR-Scenario
Car
bon
Em
issi
ons
(GtC
/YR
)
1 1.25 1.5 UN-Med UN-High
ChinaOriginal DataCubic Spline
EU27

Striessnig & Lutz: Optimal Fertility
484 http://www.demographic-research.org
If we were to care only about this environmental dimension, there would be little doubt that fewer people would be better and the resulting OLF would be zero. Yet it is unreasonable that when weighing the social cost of aging against the environmental cost of human reproduction, any future society will place a weight of 100% on the environmental dimension and zero weight on the aging dimension. To be conservative, our results presented in Figure 10 do not assume a weight of more than 20% for the environmental dimension. But even when we do not place a heavy weight on the resulting level of emissions, there is a downward effect on the OLF, both for the EU-27 and China.
Figure 10: Joint criterion of optimality. Education-Weighted Dependency Ratio
(EWDR) times Emissions with 5 different weighing schemes for different Total Fertility Rates (TFR) and resulting Optimal Level of Fertility (OLF) for the EU-27 and China in 2100

Demographic Research: Volume 30, Article 16
http://www.demographic-research.org 485
Table 1 summarizes the results of different weights applied to the combination of the two optimality criteria, EWDR and greenhouse gas emissions. In a society which cares exclusively about aging, meaning zero weight on emissions, the results are identical to those presented in the earlier part of the paper. If emissions are given a weight of 0.20 and the EWDR of 0.80, respectively, then the resulting OLF for the year 2100 turns out to be lower by about a quarter of one child: 1.51 in Europe and 1.41 in China. As the right hand side of the table indicates, the optimum is rather flat when looking at dependency, meaning this lower OLF comes at the expense of a very small deterioration in the EWDR while resulting in huge reductions in greenhouse gas emissions. At the same time, it is associated with substantially lower total population sizes by the end of this century.
Table 1: Results for Global Education Trend (GET) Scenario, EU-27 and China in 2100
Country Dependency
Weight Emissions
Weight OLF Emissions- Weighted
Dependency Dependency
Carbon Emissions
(GtC/Yr)
Population (in 1000)
EU-27
1.00 0.00 1.79 0.99 0.684 0.83 359487
0.95 0.05 1.73 0.98 0.685 0.81 340683
0.90 0.10 1.67 0.97 0.686 0.78 322587
0.85 0.15 1.61 0.96 0.688 0.76 305181
0.80 0.20 1.51 0.95 0.695 0.72 277666
China
1.00 0.00 1.68 0.97 0.601 1.90 884437
0.95 0.05 1.62 0.96 0.602 1.81 832863
0.90 0.10 1.55 0.94 0.604 1.69 775605
0.85 0.15 1.48 0.92 0.608 1.58 721375
0.80 0.20 1.41 0.90 0.614 1.46 670067
7. Discussion7
Many governments in Europe report that they are dissatisfied with the current levels of fertility in their countries in the sense that fertility is considered as being too low. The lower the level of recently observed period fertility, the stronger the expressed concern is. Also, the further one goes to the east of the continent, the stronger this publicly expressed concern. While the prime minister of Bulgaria calls his country’s
7 Part of this section was previously published by Wolfgang Lutz, as a commentary in VYPR 2008.

Striessnig & Lutz: Optimal Fertility
486 http://www.demographic-research.org
‘demographic crisis’ the number one policy priority, the president of Belarus even speaks of a national ‘demographic security crisis’, implying that this may require equally drastic action as a security crisis at the military level. Less dramatic in tone but equally urgent in its message, the President of the European Commission repeatedly called Europe’s demographic trends one of the three main challenges facing Europe, the other two being globalisation and technological change.8
In the global-level policy debate, the notion of ‘population stabilisation’ has been the guiding principle and the explicit goal of virtually all population-related policies for decades, both within the United Nations system and outside. The international political goal of population stabilisation corresponds nicely to the UN population projections which used to assume that in the longer run all countries of the world would converge in their fertility rates to replacement level, resulting (in combination with an assumed levelling-off of life expectancy) in a long-term stabilization, i.e. a constant size of the world population as well as of the population of all individual countries. Such a perceived future of population stabilisation is likely to please government officials who do not want to see their population as either disappearing or exploding in the long run. The only problem with this politically attractive concept is that the empirical evidence from the past decades does not seem to support it. With very few exceptions (including France and the US) most countries went well below replacement level, once they had reached this level. This trend is particularly strong in East Asia, affecting a quarter of the world population. As to the future, fertility trends are highly uncertain.
In this paper, we first looked at the effect of different long-term fertility assumptions combined with alternative education trajectories on levels of education-weighted dependency in the context of population ageing. We also provided an extensive and systematic sensitivity analysis with respect to different possible education-specific productivity weights, education costs, and pension systems. This simulation exercise helped us to assess the long-term level of welfare (measured in terms of education-weighted dependency ratios) as a function of future fertility levels, future education trajectories, and different pension systems. The results show that generally the highest welfare levels are reached under high education combined with relatively low government granted pension entitlements and fertility levels that are well below replacement level,
In a further step, we added the effect of fertility on total greenhouse gas emissions in countries that are big per capita polluters. Here the effect is very straightforward in the sense that relatively higher fertility leads to higher total population size and at any given level of per capita emissions to higher total greenhouse gas emissions. Hence, if this were the only criterion, optimal fertility would go to zero. When combined with the
8 Source: José Manuel Barroso in his video address delivered at the opening of the European Population Conference in Barcelona, 9 July 2008.

Demographic Research: Volume 30, Article 16
http://www.demographic-research.org 487
age-dependency criterion, the outcome depends on the relative weights attached to the two. But universally, the optimal level of fertility comes out lower when the environmental effect is also factored in.
When trying to judge whether for any particular country the current period fertility level is to be considered as too low, the impact of migration also has to be taken into account – an aspect which in this simulation exercise was intentionally left out because it would only further complicate the picture. But to some extent migration gains do indeed compensate for low fertility levels, and the populations of several Western European countries are currently still growing despite experiencing more deaths than births. In this respect, even without the above described age-dependency considerations of heterogeneous populations, optimal fertility would lie below replacement level if there was a constant gain of younger migrants. And the higher the education level of those migrants, the better it would be for the given welfare indicator.
In a nutshell these simulations suggest that – under the specified criteria – current fertility levels in countries such as Germany and Austria, where fertility is generally said to be too low, can be seen as being about right; whereas they may be considered as being too high in countries like France and the US. This finding is certainly opposite to widely held perceptions. While much more research is undoubtably needed on this important and complex topic, our main goal in this paper was to open up a new field of discussion and analysis around the question of whether the welfare decline caused by rising dependency ratios could be counterbalanced in part by the improved education of smaller young cohorts. The first very tentative results seem to suggest that perhaps longer-term fertility levels somewhere between 1.5 and 1.8 are the best for our planet and will, at the same time, result in future higher welfare as long as we invest more in the education of our slowly declining number of children.
Striessnig & Lutz: Optimal Fertility
488 http://www.demographic-research.org
References
Barro, R.J. and Becker, G.S. (1989). Fertility Choice in a Model of Economic-Growth. Econometrica 57(2): 481−501. doi:10.2307/1912563.
Bloom, D.E., Canning, D., and Sevilla, J. (2003). The demographic dividend: a new perspective on the economic consequences of population change. Santa Monica: Rand Corp.
Bloom, D.E. and Williamson, J.G. (1998). Demographic transitions and economic miracles in emerging Asia. World Bank Economic Review 12(3): 419−455. doi:10.1093/wber/12.3.419.
Bongaarts, J. (2010). The causes of educational differences in fertility in Sub-Saharan Africa. Vienna Yearbook of Population Research 8: 31−50. doi:10.1553/ populationyearbook2010s31.
Carneiro, P., Heckman, J.J., and Vytlacil, E.J. (2010). Estimating marginal returns to education. Cambridge: National Bureau of Economic Research (No. 16474). doi:10.3386/w16474.
Chambers, J.M. and Hastie, T. (1992). Statistical models in S. Pacific Grove, Calif.: Wadsworth & Brooks/Cole Advanced Books & Software.
Choe, M.K. and Retherford, R.D. (2009). The contribution of education to South Korea's fertility decline to 'lowest-low' level. Asian Population Studies 5(3): 267−288.
Cochrane, S.H. (1979). Fertility and Education. What Do We Really Know? Baltimore: Johns Hopkins University Press.
Cochrane, S.H., Khan, M.A., and Osheba, I.K.T. (1990). Education, income, and desired fertility in Egypt: A revised perspective. Economic Development and Cultural Change : 313−339. doi:10.1086/451795.
Cohen, J.E. (1995). How many people can the Earth support? New York: Norton.
Cutler, D.M., Poterba, J.M., Sheiner, L.M., Summers, L.H., and Akerlof, G.A. (1990). An aging society: opportunity or challenge? Brookings papers on economic activity 1990(1): 1−73. doi:10.2307/2534525.
Fargues, P. (2000). Protracted national conflict and fertility change: Palestinians and Israelis in the twentieth century. Population and Development Review 26(3): 441−482. doi:10.1111/j.1728-4457.2000.00441.x.
Demographic Research: Volume 30, Article 16
http://www.demographic-research.org 489
Heckman, J.J. and Jacobs, B. (2010). Policies to Create and Destroy Human Capital in Europe. Cambridge: National Bureau of Economic Research (No. 15742).
KC, S., Barakat, B., Goujon, A., Skirbekk, V., and Lutz, W. (2010). Projection of populations by level of educational attainment, age, and sex for 120 countries for 2005-2050. Demographic Research 22(15): 383−472.
Krueger, A.B. and Lindahl, M. (2000). Education for growth: why and for whom? Cambridge: National Bureau of Economic Research (No. 7591).
Lee, R. and Mason, A. (2006). What is the demographic dividend? Finance and Development 43(3): 16.
Lee, R. and Mason, A. (2010). Fertility, Human Capital, and Economic Growth over the Demographic Transition. European Journal of Population 26(2): 159−182. doi:10.1007/s10680-009-9186-x.
Lutz, W., Cuaresma, J.C., and Sanderson, W.C. (2008). The Demography of Educational Attainment and Economic Growth. Science 319(5866): 1047−1048. doi:10.1126/science.1151753.
Lutz, W., Goujon, A., KC, S., and Sanderson, W.C. (2007). Reconstruction of populations by age, sex and level of educational attainment for 120 countries for 1970-2000. Vienna Yearbook of Population Research 2007 5: 193−235. doi:10.1553/populationyearbook2007s193.
Lutz, W. and KC, S. (2011). Global Human Capital: Integrating Education and Population. Science 333(6042): 587−592. doi:10.1126/science.1206964.
Lutz, W., Sanderson, W.C., and O'Neill, B.C. (2004). Conceptualizing Population in Sustainable Development: From "Population Stabilization" to "Population Balance". In: Lutz, W., Sanderson, W.C., and O'Neill, B.C. (eds.). The End of World Population Growth in the 21st Century: New Challenges for Human Capital Formation and Sustainable Development. London: Earthscan: 315−334.
Lutz, W. and Scherbov, S. (2008). Exploratory Extension of IIASA's World Population Projections: Scenarios to 2300. Laxenburg, Austria: IIASA, IIASA Interim Report IR-08-022.
O'Neill, B.C., Dalton, M., Fuchs, R., Jiang, L., Pachauri, S., and Zigova, K. (2010). Global demographic trends and future carbon emissions. Proceedings of the National Academy of Sciences of the United States of America 107(41): 17521−17526. doi:10.1073/pnas.1004581107.

Striessnig & Lutz: Optimal Fertility
490 http://www.demographic-research.org
Patrinos, H.A. and Psacharopoulos, G. (2011). Education: past, present and future global challenges. Washington, D.C.: The World Bank.
Pritchett, L. (2001). Where Has All the Education Gone? The World Bank Economic Review 15(3): 367−391. doi:10.1093/wber/15.3.367.
Royal Society (2012). People and the planet. London: The Royal Society.
Sharygin, E. (2013). The Carbon Cost of an Educated Future: A Consumer Lifestyle Approach. Vienna, Austria: Vienna Institute of Demography (No. 1304).
Skirbekk, V. and KC, S. (2012). Fertility-reducing dynamics of women's social status and educational attainment. Asian Population Studies 8(3): 251−264. doi:10.1080/17441730.2012.714667.
Striessnig, E., Lutz, W., and Patt, A.G. (2013). Effects of educational attainment on climate risk vulnerability. Ecology and Society 18(1): 16. doi:10.5751/ES-05252-180116.
UN Population Division (2010). World Population Prospects: The 2008 Revision Population Database [electronic resource]. http://esa.un.org/unpd/wpp/unpp/ panel_population.htm
UN Population Division (2011). World fertility policies, 2011. New York: United Nations, Deptartment of Economic and Social Affairs.
UNESCO (2009). Global Education Digest: Comparing Education Statistics Across the World, 2009. Montreal: UNESCO Institute for Statistics.
UNFPA (2011). Impact of demographic change in Thailand. Bangkok, Thailand: United Nations Population Fund.
Vobecká, J., Butz, W.P., and Reyes, G.C. (2013). Population Trends and Policies in the UNECE Region: Outcomes, Policies and Possibilities. Laxenburg: UNFPA and IIASA.
Demographic Research: Volume 30, Article 16
http://www.demographic-research.org 491
Appendix
Table A 1: Assumed baseline parameter values
No Education Primary Secondary Tertiary
Education cost 1 1.19 1.25 1.3
Productivity weight 1 1 1.25 1.5
Pension cost 1 1 1 1
Labour market entry age 15 15 19 26
Labour market exit age 57 57 61 65 Share of life-years Gained spent working
1 1 1 1

Striessnig & Lutz: Optimal Fertility
492 http://www.demographic-research.org