Dell Technologies - Dell Technologies
32
1Q FY21 Performance Review May 28, 2020
Transcript of Dell Technologies - Dell Technologies
1Q FY21 Performance ReviewMay 28, 2020
2 © Copyright 2020 Dell Inc.2
DisclaimerNON-GAAP FINANCIAL MEASURES
This presentation includes information about non-GAAP revenue, non-GAAP gross margin, non-GAAP
operating expenses, non-GAAP selling, general, and administrative expenses, non-GAAP research and
development expenses, non-GAAP operating income, non-GAAP interest and other, net, non-GAAP
income tax, non-GAAP net income, non-GAAP net income attributable to non-controlling interests, non-
GAAP net income attributable to Dell Technologies Inc. – basic, non-GAAP net income attributable to
Dell Technologies Inc. – diluted, non-GAAP earnings per share attributable to Dell Technologies Inc. –
basic, non-GAAP earnings per share attributable to Dell Technologies Inc. – diluted, EBITDA, Adjusted
EBITDA, free cash flow, and free cash flow, excluding VMware, before impact from DFS related items
(collectively the “non-GAAP financial measures”), which are not measurements of financial performance
prepared in accordance with U.S. generally accepted accounting principles. We have provided a
reconciliation of the non-GAAP measures to the most directly comparable GAAP measures in the slides
captioned “Supplemental Non-GAAP Measures.”
SPECIAL NOTE ON FORWARD LOOKING STATEMENTS
Statements in this material that relate to future results and events are forward-looking statements and
are based on Dell Technologies' current expectations. In some cases, you can identify these statements
by such forward-looking words as “anticipate,” “believe,” “could,” “estimate,” “expect,” “intend,”
“confidence,” “may,” “plan,” “potential,” “should,” “will” and “would,” or similar expressions. Actual results
and events in future periods may differ materially from those expressed or implied by these forward-
looking statements because of a number of risks, uncertainties and other factors, including those
discussed in Dell Technologies’ periodic reports filed with the Securities and Exchange Commission.
Dell Technologies assumes no obligation to update its forward-looking statements.
3 © Copyright 2020 Dell Inc.
We are the essential technology companyDemonstrating our purpose and commitment to our stakeholders today and tomorrow
PURPOSE To create technologies that drive human progress.
VISION To become the most essential technology company for the data era.
STRATEGYUse our unique strengths to win in the consolidation of the markets in which we compete
and create differentiated Dell Technologies solutions.
Customers Shareholders Team Members Partners Community
4 © Copyright 2020 Dell Inc.4
Overview1QFY21
The speed of digital transformation has accelerated and Dell Technologies is well
positioned to be the essential technology company today and in the future.
• Navigating COVID-19
We are prioritizing the well-being of our people, support for our customers, and
prudently managing our business.
• Fulfilling demand for work and learn from home solutions
Delivered Q1 revenue of $21.9B driven by strong work and learn from home
demand and were the only vendor in the top five to have positive year-over-year
PC unit growth for calendar Q11.
• Growing recurring revenue
Q1 recurring revenue of $6B grew 16% Y/Y driven by deferred revenue
amortization, data center utility and as-a-service models2.
• Innovating and integrating
Launched new midrange solution PowerStore, announced OneFS for Google
Cloud hybrid cloud storage solution, advanced Dell Technologies Cloud with
VMware Tanzu Kubernetes Grid and VMware Cloud Foundation 4, and
enhanced Dell Technologies On Demand flexible consumption offerings.
1 Per IDC WW Quarterly Personal Computing Device Tracker CY20Q12 Recurring revenue includes deferred revenue amortization, data center utility and as-a-service models
5 © Copyright 2020 Dell Inc.
Business Operations
Global direct sales force
• Successfully pivoted to all-virtual engagements with
thousands of virtual customer interactions in the quarter.
• Addressing customer’s cash flow requirements by adding to
our as-a-Service and financing offerings.
• e-commerce set us apart. In April, site visits to
DellTechnologies.com and Dell.com were up 77 percent and
28 percent, respectively.
Global supply chain
• Scale and resiliency has allowed for flexibility to manage
through different challenges over the past year.
• In Q1, we leveraged our global footprint and partnerships to
fulfill orders as quickly as possible, exploring all sourcing,
production and logistics strategies.
Operational HighlightsOur broad portfolio of businesses and capabilities enabled us to work through the crisis and deliver
differentiated results - for our customers and our company
Our Customers
• Flight to quality
Customers leaned on technology partners who had the
flexibility and agility to provide solutions at scale, across all
their IT needs, and deliver services quickly and globally.
• New York City
Deployed PC’s, severs, storage and VMware to NYC
Department of Information Technology and
Telecommunications to support the city’s health care
professionals and first responders.
• Payment Flexibility Program
We rolled out our Payment Flexibility Program so customers
can access the technology they need now, scale usage of IT
and preserve cash
6 © Copyright 2020 Dell Inc.
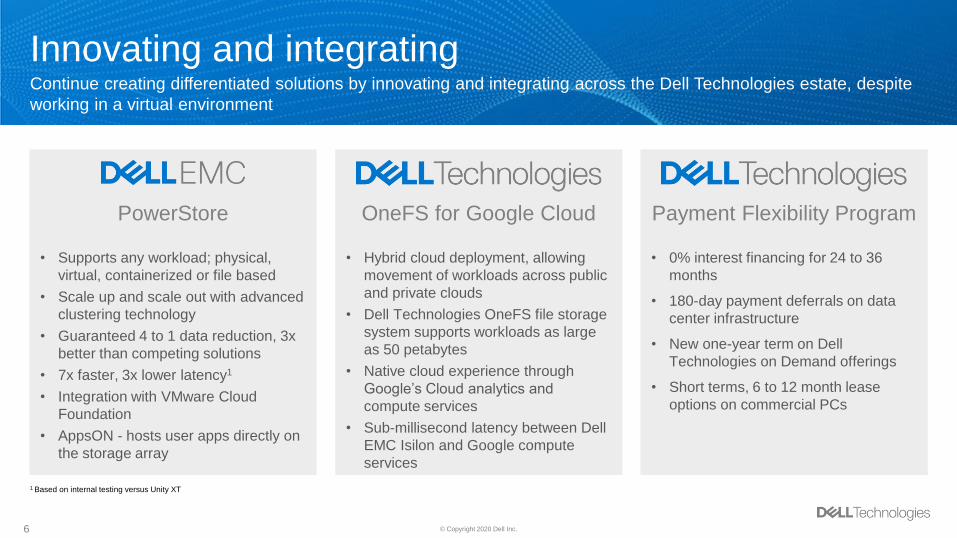
Innovating and integratingContinue creating differentiated solutions by innovating and integrating across the Dell Technologies estate, despite
working in a virtual environment
PowerStore OneFS for Google Cloud Payment Flexibility Program
• Supports any workload; physical,
virtual, containerized or file based
• Scale up and scale out with advanced
clustering technology
• Guaranteed 4 to 1 data reduction, 3x
better than competing solutions
• 7x faster, 3x lower latency1
• Integration with VMware Cloud
Foundation
• AppsON - hosts user apps directly on
the storage array
• Hybrid cloud deployment, allowing
movement of workloads across public
and private clouds
• Dell Technologies OneFS file storage
system supports workloads as large
as 50 petabytes
• Native cloud experience through
Google’s Cloud analytics and
compute services
• Sub-millisecond latency between Dell
EMC Isilon and Google compute
services
• 0% interest financing for 24 to 36
months
• 180-day payment deferrals on data
center infrastructure
• New one-year term on Dell
Technologies on Demand offerings
• Short terms, 6 to 12 month lease
options on commercial PCs
1 Based on internal testing versus Unity XT
7 © Copyright 2020 Dell Inc.
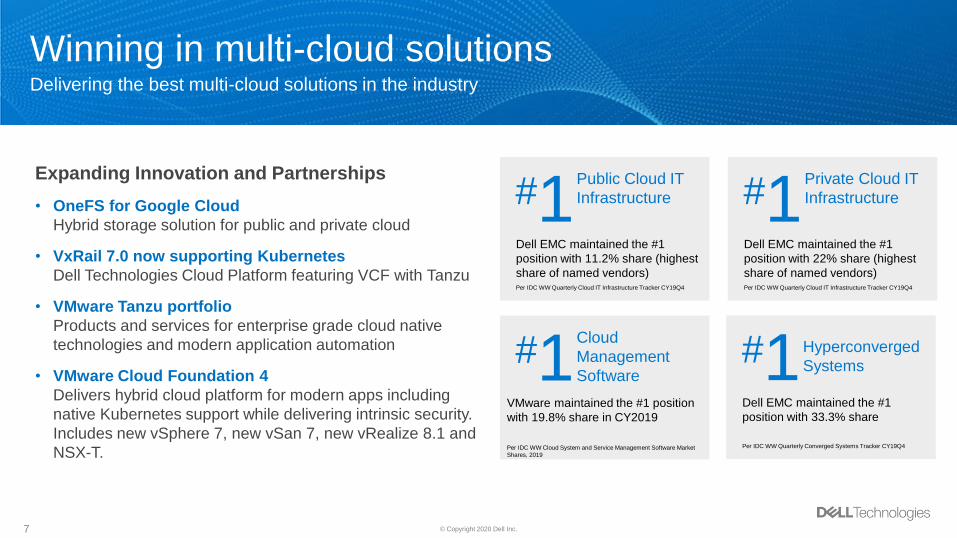
Expanding Innovation and Partnerships
• OneFS for Google Cloud
Hybrid storage solution for public and private cloud
• VxRail 7.0 now supporting Kubernetes
Dell Technologies Cloud Platform featuring VCF with Tanzu
• VMware Tanzu portfolio
Products and services for enterprise grade cloud native
technologies and modern application automation
• VMware Cloud Foundation 4
Delivers hybrid cloud platform for modern apps including
native Kubernetes support while delivering intrinsic security.
Includes new vSphere 7, new vSan 7, new vRealize 8.1 and
NSX-T.
Winning in multi-cloud solutionsDelivering the best multi-cloud solutions in the industry
Public Cloud IT
Infrastructure #1Dell EMC maintained the #1
position with 11.2% share (highest
share of named vendors)Per IDC WW Quarterly Cloud IT Infrastructure Tracker CY19Q4
Hyperconverged
Systems#1Dell EMC maintained the #1
position with 33.3% share
Per IDC WW Quarterly Converged Systems Tracker CY19Q4
Private Cloud IT
Infrastructure #1Dell EMC maintained the #1
position with 22% share (highest
share of named vendors)Per IDC WW Quarterly Cloud IT Infrastructure Tracker CY19Q4
Cloud
Management
Software#1
VMware maintained the #1 position
with 19.8% share in CY2019
Per IDC WW Cloud System and Service Management Software Market
Shares, 2019
8 © Copyright 2020 Dell Inc.
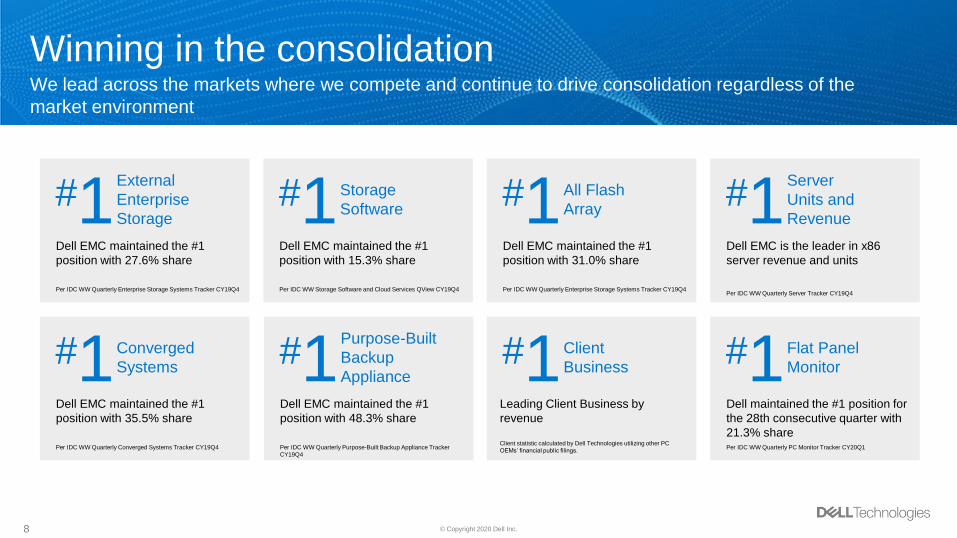
All Flash
Array#1Dell EMC maintained the #1
position with 31.0% share
Per IDC WW Quarterly Enterprise Storage Systems Tracker CY19Q4
Storage
Software#1Dell EMC maintained the #1
position with 15.3% share
Per IDC WW Storage Software and Cloud Services QView CY19Q4
External
Enterprise
Storage#1Dell EMC maintained the #1
position with 27.6% share
Per IDC WW Quarterly Enterprise Storage Systems Tracker CY19Q4
Winning in the consolidationWe lead across the markets where we compete and continue to drive consolidation regardless of the
market environment
Purpose-Built
Backup
Appliance #1Dell EMC maintained the #1
position with 48.3% share
Per IDC WW Quarterly Purpose-Built Backup Appliance Tracker
CY19Q4
Flat Panel
Monitor#1Dell maintained the #1 position for
the 28th consecutive quarter with
21.3% sharePer IDC WW Quarterly PC Monitor Tracker CY20Q1
Client
Business#1
Server
Units and
Revenue#1Dell EMC is the leader in x86
server revenue and units
Per IDC WW Quarterly Server Tracker CY19Q4
Converged
Systems#1Dell EMC maintained the #1
position with 35.5% share
Per IDC WW Quarterly Converged Systems Tracker CY19Q4
Leading Client Business by
revenue
Client statistic calculated by Dell Technologies utilizing other PC
OEMs’ financial public filings.

9 © Copyright 2020 Dell Inc.
Consolidated GAAP results1
We remain focused on maximizing long-term value creation for all aligned shareholders
1 Results include material adjustments related to purchase accounting and other items. For additional detail on these adjustments, please refer to supplemental slides in the appendix.2 See appendix B for weighted average shares and EPS calculation
$ in millions, except per share amounts 1Q20 2Q20 3Q20 4Q20 1Q21 Y/Y Q/Q
Revenue 21,908 23,370 22,844 24,032 21,897 0% -9%
Gross Margin 6,797 7,326 7,126 7,684 6,853 1% -11%
SG&A 5,071 5,578 5,028 5,642 4,886 -4% -13%
R&D 1,176 1,229 1,262 1,325 1,265 8% -5%
Operating Expense 6,247 6,807 6,290 6,967 6,151 -2% -12%
Operating Income (Loss) 550 519 836 717 702 28% -2%
Interest and Other, Net (693) (630) (677) (626) (566) 18% 10%
Income Tax (472) (4,343) (393) (325) (46) 90% 86%
Effective tax rate % 330.1% 3912.6% -247.2% -357.1% -33.8%
Net Income (Loss) 329 4,232 552 416 182 -45% -56%
Less: Net Income attributable to non-controlling interests 36 816 53 8 39 8% 388%
Net Income (loss) attributable to Dell Technologies Inc. - basic 293 3,416 499 408 143 -51% -65%
Less: Incremental dilution from VMware, Inc. 8 62 6 3 2
Net Income attributable to Dell Technologies Inc. - diluted 285 3,354 493 405 141
Earnings Per Share - basic 2 0.41 4.75 0.69 0.56 0.19
Earnings Per Share - diluted 2 0.38 4.47 0.66 0.54 0.19
10 © Copyright 2020 Dell Inc.
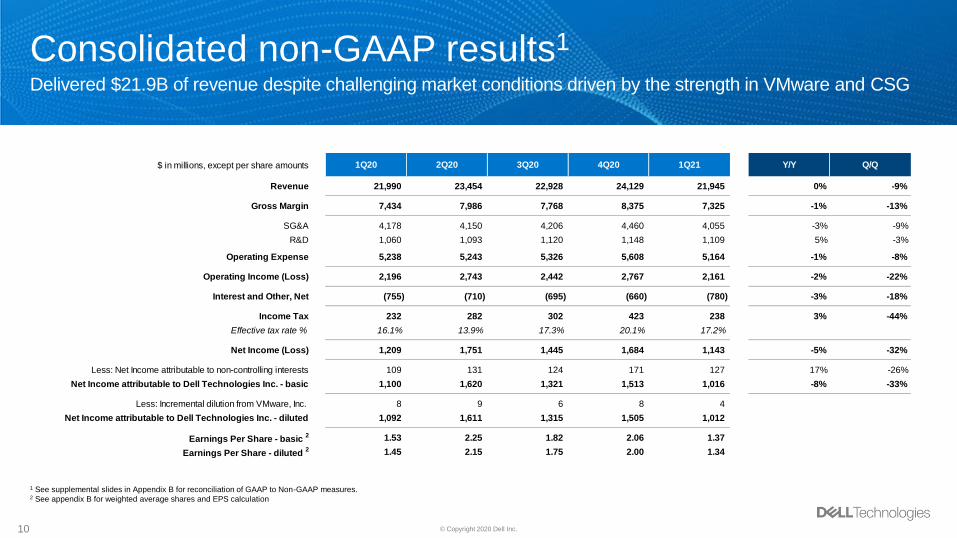
Consolidated non-GAAP results1
Delivered $21.9B of revenue despite challenging market conditions driven by the strength in VMware and CSG
1 See supplemental slides in Appendix B for reconciliation of GAAP to Non-GAAP measures.2 See appendix B for weighted average shares and EPS calculation
$ in millions, except per share amounts 1Q20 2Q20 3Q20 4Q20 1Q21 Y/Y Q/Q
Revenue 21,990 23,454 22,928 24,129 21,945 0% -9%
Gross Margin 7,434 7,986 7,768 8,375 7,325 -1% -13%
SG&A 4,178 4,150 4,206 4,460 4,055 -3% -9%
R&D 1,060 1,093 1,120 1,148 1,109 5% -3%
Operating Expense 5,238 5,243 5,326 5,608 5,164 -1% -8%
Operating Income (Loss) 2,196 2,743 2,442 2,767 2,161 -2% -22%
Interest and Other, Net (755) (710) (695) (660) (780) -3% -18%
Income Tax 232 282 302 423 238 3% -44%
Effective tax rate % 16.1% 13.9% 17.3% 20.1% 17.2%
Net Income (Loss) 1,209 1,751 1,445 1,684 1,143 -5% -32%
Less: Net Income attributable to non-controlling interests 109 131 124 171 127 17% -26%
Net Income attributable to Dell Technologies Inc. - basic 1,100 1,620 1,321 1,513 1,016 -8% -33%
Less: Incremental dilution from VMware, Inc. 8 9 6 8 4
Net Income attributable to Dell Technologies Inc. - diluted 1,092 1,611 1,315 1,505 1,012
Earnings Per Share - basic 2 1.53 2.25 1.82 2.06 1.37
Earnings Per Share - diluted 2 1.45 2.15 1.75 2.00 1.34
11 © Copyright 2020 Dell Inc.
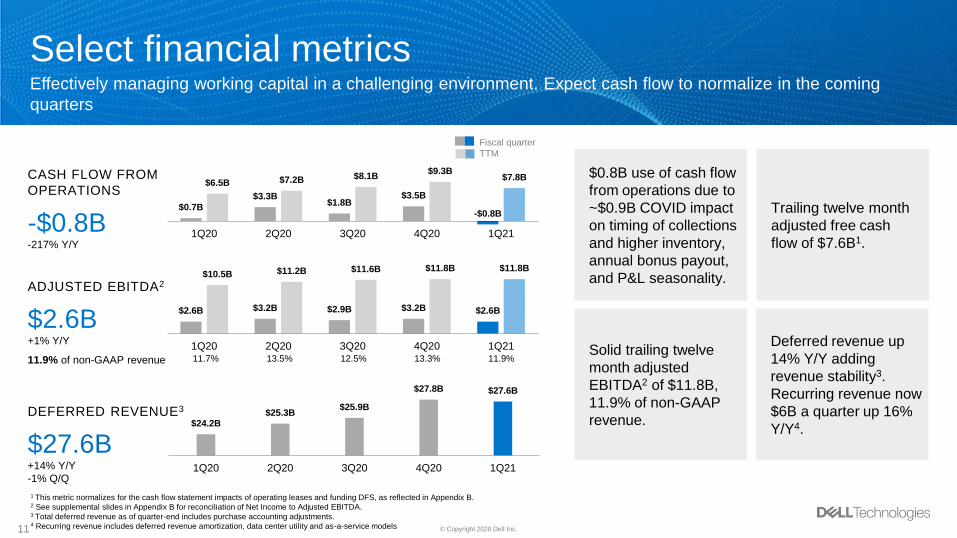
CASH FLOW FROM
OPERATIONS
-$0.8B-217% Y/Y
ADJUSTED EBITDA2
$2.6B+1% Y/Y
11.9% of non-GAAP revenue
DEFERRED REVENUE3
$27.6B+14% Y/Y
-1% Q/Q
$0.7B
$3.3B$1.8B
$3.5B
-$0.8B
$6.5B $7.2B $8.1B$9.3B
$7.8B
1Q20 2Q20 3Q20 4Q20 1Q21
Select financial metricsEffectively managing working capital in a challenging environment. Expect cash flow to normalize in the coming
quarters
Fiscal quarter
TTM
$0.8B use of cash flow
from operations due to
~$0.9B COVID impact
on timing of collections
and higher inventory,
annual bonus payout,
and P&L seasonality.
Trailing twelve month
adjusted free cash
flow of $7.6B1.
Solid trailing twelve
month adjusted
EBITDA2 of $11.8B,
11.9% of non-GAAP
revenue.
Deferred revenue up
14% Y/Y adding
revenue stability3.
Recurring revenue now
$6B a quarter up 16%
Y/Y4.
1 This metric normalizes for the cash flow statement impacts of operating leases and funding DFS, as reflected in Appendix B.2 See supplemental slides in Appendix B for reconciliation of Net Income to Adjusted EBITDA.3 Total deferred revenue as of quarter-end includes purchase accounting adjustments.4 Recurring revenue includes deferred revenue amortization, data center utility and as-a-service models
$2.6B $3.2B $2.9B $3.2B $2.6B
$10.5B $11.2B $11.6B $11.8B $11.8B
1Q20 2Q20 3Q20 4Q20 1Q2111.7% 13.5% 12.5% 13.3% 11.9%
$24.2B$25.3B
$25.9B
$27.8B $27.6B
1Q20 2Q20 3Q20 4Q20 1Q21
12 © Copyright 2020 Dell Inc.
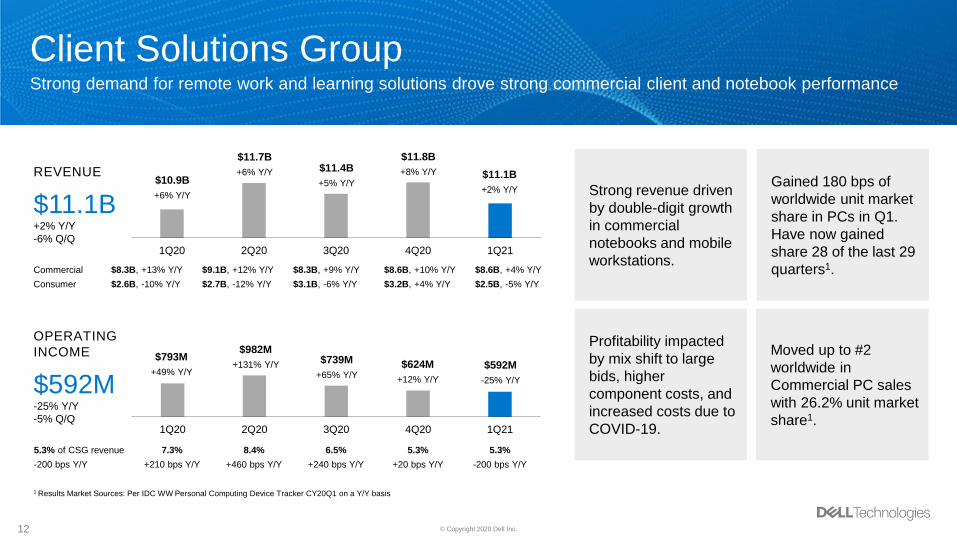
Client Solutions GroupStrong demand for remote work and learning solutions drove strong commercial client and notebook performance
REVENUE
$11.1B+2% Y/Y
-6% Q/Q
OPERATING
INCOME
$592M-25% Y/Y
-5% Q/Q
$8.3B, +13% Y/Y
$2.6B, -10% Y/Y
$9.1B, +12% Y/Y
$2.7B, -12% Y/Y
$8.3B, +9% Y/Y
$3.1B, -6% Y/Y
$8.6B, +10% Y/Y
$3.2B, +4% Y/Y
$8.6B, +4% Y/Y
$2.5B, -5% Y/Y
7.3%
+210 bps Y/Y
8.4%
+460 bps Y/Y
6.5%
+240 bps Y/Y
5.3%
+20 bps Y/Y
5.3%
-200 bps Y/Y
1Q20 2Q20 3Q20 4Q20 1Q21
$11.7B
+6% Y/Y $11.4B
+5% Y/Y
$11.8B
+8% Y/Y $11.1B
+2% Y/Y
1Q20 2Q20 3Q20 4Q20 1Q21
$982M
+131% Y/Y$739M
+65% Y/Y$624M
+12% Y/Y
$592M
-25% Y/Y
$10.9B
+6% Y/Y
$793M
+49% Y/Y
5.3% of CSG revenue
-200 bps Y/Y
Commercial
Consumer
Strong revenue driven
by double-digit growth
in commercial
notebooks and mobile
workstations.
Gained 180 bps of
worldwide unit market
share in PCs in Q1.
Have now gained
share 28 of the last 29
quarters1.
Profitability impacted
by mix shift to large
bids, higher
component costs, and
increased costs due to
COVID-19.
Moved up to #2
worldwide in
Commercial PC sales
with 26.2% unit market
share1.
1 Results Market Sources: Per IDC WW Personal Computing Device Tracker CY20Q1 on a Y/Y basis
13 © Copyright 2020 Dell Inc.
$4.2B,
$4.0B,
$4.4B,
$4.2B,
$4.2B,
$4.1B,
$4.3B,
$4.5B,
$3.8B,
$3.8B,
-9% Y/Y
-1% Y/Y
-12% Y/Y
+0% Y/Y
-16% Y/Y
+7% Y/Y
-19% Y/Y
-3% Y/Y
-10% Y/Y
-5% Y/Y
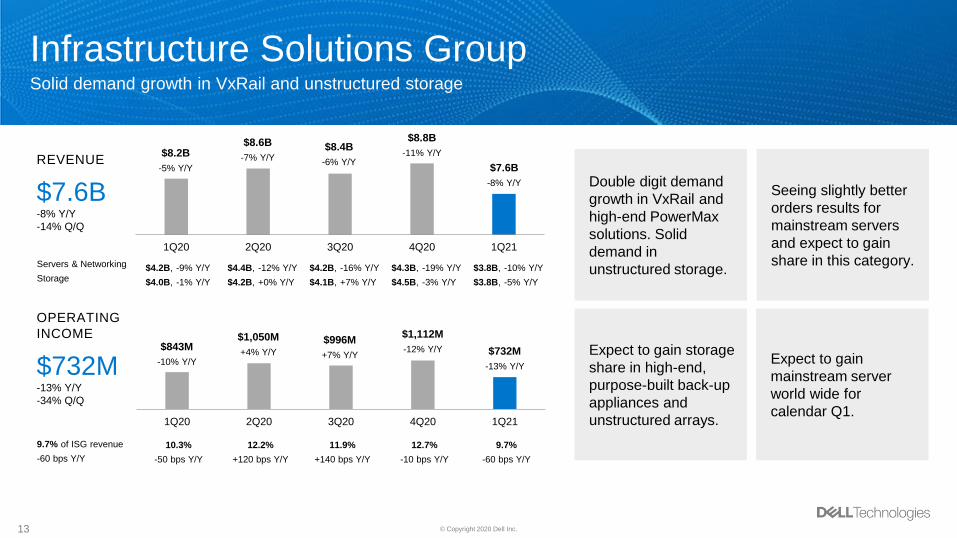
Infrastructure Solutions GroupSolid demand growth in VxRail and unstructured storage
REVENUE
$7.6B-8% Y/Y
-14% Q/Q
OPERATING
INCOME
$732M-13% Y/Y
-34% Q/Q
9.7% of ISG revenue
-60 bps Y/Y
Servers & Networking
Storage
Double digit demand
growth in VxRail and
high-end PowerMax
solutions. Solid
demand in
unstructured storage.
Seeing slightly better
orders results for
mainstream servers
and expect to gain
share in this category.
Expect to gain storage
share in high-end,
purpose-built back-up
appliances and
unstructured arrays.
Expect to gain
mainstream server
world wide for
calendar Q1.
1Q20 2Q20 3Q20 4Q20 1Q21
$8.6B
-7% Y/Y$8.4B
-6% Y/Y
$8.8B
-11% Y/Y
$7.6B
-8% Y/Y
$8.2B
-5% Y/Y
1Q20 2Q20 3Q20 4Q20 1Q21
$1,050M
+4% Y/Y
$996M
+7% Y/Y
$1,112M
-12% Y/Y $732M
-13% Y/Y
$843M
-10% Y/Y
10.3%
-50 bps Y/Y
12.2%
+120 bps Y/Y
11.9%
+140 bps Y/Y
12.7%
-10 bps Y/Y
9.7%
-60 bps Y/Y
14 © Copyright 2020 Dell Inc.
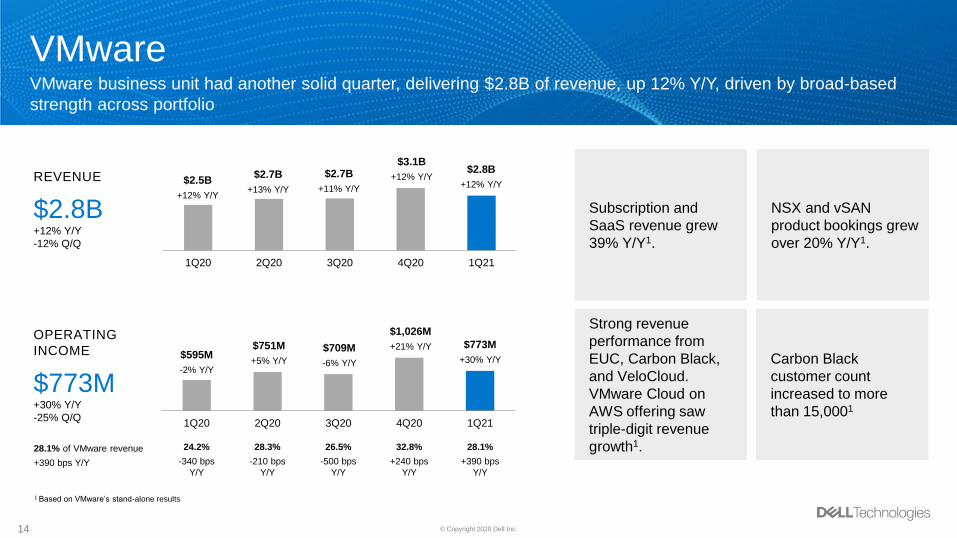
VMwareVMware business unit had another solid quarter, delivering $2.8B of revenue, up 12% Y/Y, driven by broad-based
strength across portfolio
REVENUE
$2.8B+12% Y/Y
-12% Q/Q
OPERATING
INCOME
$773M+30% Y/Y
-25% Q/Q
28.1% of VMware revenue
+390 bps Y/Y
Subscription and
SaaS revenue grew
39% Y/Y1.
NSX and vSAN
product bookings grew
over 20% Y/Y1.
Strong revenue
performance from
EUC, Carbon Black,
and VeloCloud.
VMware Cloud on
AWS offering saw
triple-digit revenue
growth1.
Carbon Black
customer count
increased to more
than 15,0001
1Q20 2Q20 3Q20 4Q20 1Q21
$2.7B
+13% Y/Y
$2.7B
+11% Y/Y
$3.1B
+12% Y/Y$2.5B
+12% Y/Y
24.2%
-340 bps
Y/Y
28.3%
-210 bps
Y/Y
26.5%
-500 bps
Y/Y
32.8%
+240 bps
Y/Y
28.1%
+390 bps
Y/Y
1Q20 2Q20 3Q20 4Q20 1Q21
$751M
+5% Y/Y
$709M
-6% Y/Y
$1,026M
+21% Y/Y$595M
-2% Y/Y
$2.8B
+12% Y/Y
$773M
+30% Y/Y
1 Based on VMware’s stand-alone results
15 © Copyright 2020 Dell Inc.
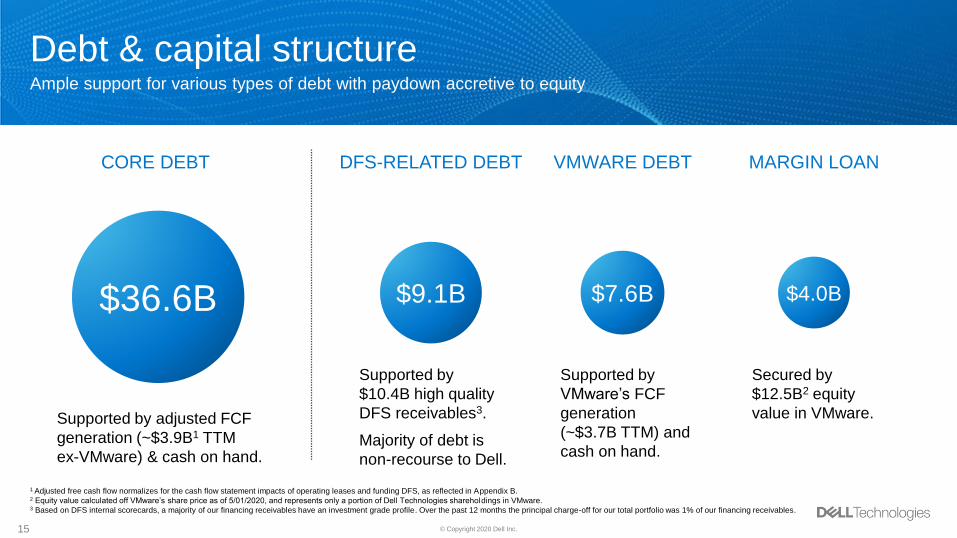
Debt & capital structureAmple support for various types of debt with paydown accretive to equity
1 Adjusted free cash flow normalizes for the cash flow statement impacts of operating leases and funding DFS, as reflected in Appendix B.2 Equity value calculated off VMware’s share price as of 5/01/2020, and represents only a portion of Dell Technologies shareholdings in VMware.3 Based on DFS internal scorecards, a majority of our financing receivables have an investment grade profile. Over the past 12 months the principal charge-off for our total portfolio was 1% of our financing receivables.
CORE DEBT DFS-RELATED DEBT MARGIN LOANVMWARE DEBT
Supported by
$10.4B high quality
DFS receivables3.
Majority of debt is
non-recourse to Dell.
Secured by
$12.5B2 equity
value in VMware.
Supported by
VMware’s FCF
generation
(~$3.7B TTM) and
cash on hand.
Supported by adjusted FCF
generation (~$3.9B1 TTM
ex-VMware) & cash on hand.
$36.6B $9.1B $7.6B $4.0B
16 © Copyright 2020 Dell Inc.
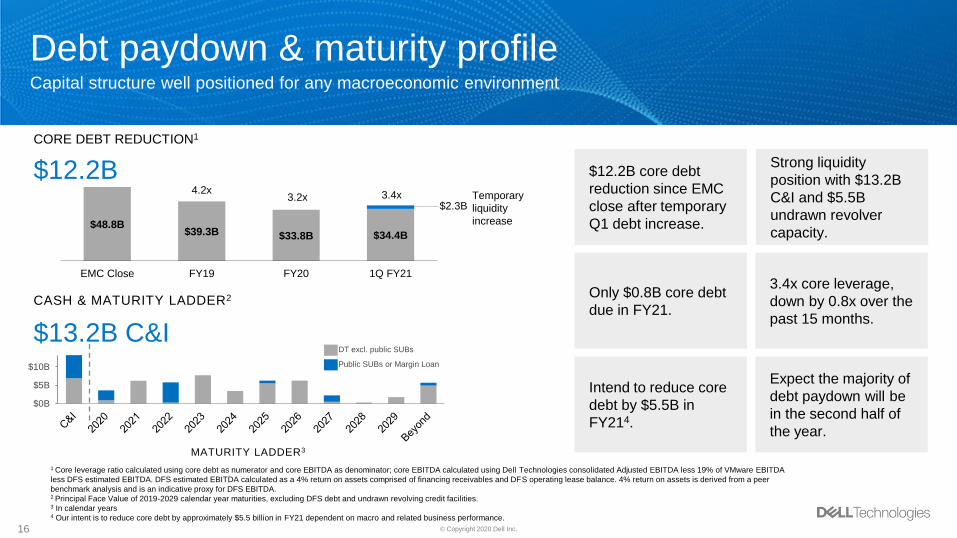
CORE DEBT REDUCTION1
$12.2B
CASH & MATURITY LADDER2
$13.2B C&I
$0B
$5B
$10B
Debt paydown & maturity profileCapital structure well positioned for any macroeconomic environment
$12.2B core debt
reduction since EMC
close after temporary
Q1 debt increase.
Strong liquidity
position with $13.2B
C&I and $5.5B
undrawn revolver
capacity.
Only $0.8B core debt
due in FY21.
3.4x core leverage,
down by 0.8x over the
past 15 months.
$48.8B$39.3B $33.8B $34.4B
EMC Close FY19 FY20 1Q FY21
DT excl. public SUBs
Public SUBs or Margin Loan
MATURITY LADDER3
4.2x 3.4x
Intend to reduce core
debt by $5.5B in
FY214.
Expect the majority of
debt paydown will be
in the second half of
the year.
1 Core leverage ratio calculated using core debt as numerator and core EBITDA as denominator; core EBITDA calculated using Dell Technologies consolidated Adjusted EBITDA less 19% of VMware EBITDA
less DFS estimated EBITDA. DFS estimated EBITDA calculated as a 4% return on assets comprised of financing receivables and DFS operating lease balance. 4% return on assets is derived from a peer
benchmark analysis and is an indicative proxy for DFS EBITDA.2 Principal Face Value of 2019-2029 calendar year maturities, excluding DFS debt and undrawn revolving credit facilities.3 In calendar years4 Our intent is to reduce core debt by approximately $5.5 billion in FY21 dependent on macro and related business performance.
3.2x$2.3B
Temporary
liquidity
increase
17 © Copyright 2020 Dell Inc.17
In a world that is increasingly looking for resiliency, reliability and innovation, we are
uniquely positioned to emerge from this time as the essential technology company
for the data era.
• Different company than three years ago
We have assembled a broad set of capabilities that are differentiated within the
industry and drive an attractive financial model. We have broad diversification
across our portfolio of software and service solutions
• Innovating and integrating
Continue to deliver on powerful integrated solutions across our Dell Technologies
portfolio and continue to strengthen our multi-cloud solutions. Expect us to
continue to deliver best in class highly integrated solutions.
• Q2 and core debt
We saw strong demand in February and March, but did see demand soften in the
last month of the quarter. As a result, we expect Q2 to be seasonally lower than
prior years, which has typically been up 6% to 8% sequentially. Our intent is to
reduce core debt by approximately $5.5 billion in FY21 dependent on macro and
related business performance.
1 Per IDC WW Quarterly Personal Computing Device Tracker CY20Q1
Key Takeaways
18 © Copyright 2020 Dell Inc.
Appendix ADebt and DFS summary
19 © Copyright 2020 Dell Inc.
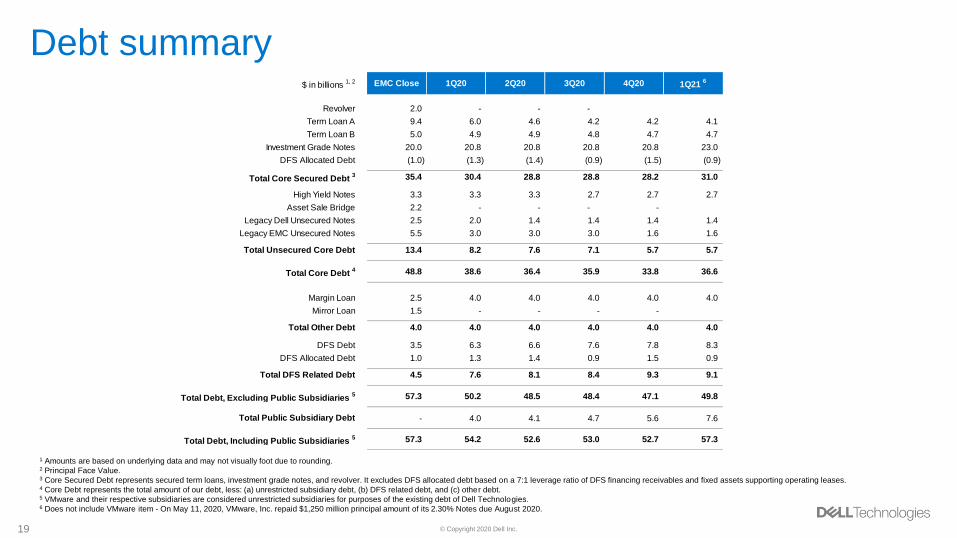
Debt summary
1 Amounts are based on underlying data and may not visually foot due to rounding.2 Principal Face Value.3 Core Secured Debt represents secured term loans, investment grade notes, and revolver. It excludes DFS allocated debt based on a 7:1 leverage ratio of DFS financing receivables and fixed assets supporting operating leases.4 Core Debt represents the total amount of our debt, less: (a) unrestricted subsidiary debt, (b) DFS related debt, and (c) other debt. 5 VMware and their respective subsidiaries are considered unrestricted subsidiaries for purposes of the existing debt of Dell Technologies.6 Does not include VMware item - On May 11, 2020, VMware, Inc. repaid $1,250 million principal amount of its 2.30% Notes due August 2020.
$ in billions 1, 2 EMC Close 1Q20 2Q20 3Q20 4Q20 1Q21
6
Revolver 2.0 - - -
Term Loan A 9.4 6.0 4.6 4.2 4.2 4.1
Term Loan B 5.0 4.9 4.9 4.8 4.7 4.7
Investment Grade Notes 20.0 20.8 20.8 20.8 20.8 23.0
DFS Allocated Debt (1.0) (1.3) (1.4) (0.9) (1.5) (0.9)
Total Core Secured Debt 3 35.4 30.4 28.8 28.8 28.2 31.0
High Yield Notes 3.3 3.3 3.3 2.7 2.7 2.7
Asset Sale Bridge 2.2 - - - -
Legacy Dell Unsecured Notes 2.5 2.0 1.4 1.4 1.4 1.4
Legacy EMC Unsecured Notes 5.5 3.0 3.0 3.0 1.6 1.6
Total Unsecured Core Debt 13.4 8.2 7.6 7.1 5.7 5.7
Total Core Debt 4 48.8 38.6 36.4 35.9 33.8 36.6
Margin Loan 2.5 4.0 4.0 4.0 4.0 4.0
Mirror Loan 1.5 - - - -
Total Other Debt 4.0 4.0 4.0 4.0 4.0 4.0
DFS Debt 3.5 6.3 6.6 7.6 7.8 8.3
DFS Allocated Debt 1.0 1.3 1.4 0.9 1.5 0.9
Total DFS Related Debt 4.5 7.6 8.1 8.4 9.3 9.1
Total Debt, Excluding Public Subsidiaries 5 57.3 50.2 48.5 48.4 47.1 49.8
Total Public Subsidiary Debt - 4.0 4.1 4.7 5.6 7.6
Total Debt, Including Public Subsidiaries 5 57.3 54.2 52.6 53.0 52.7 57.3
20 © Copyright 2020 Dell Inc.
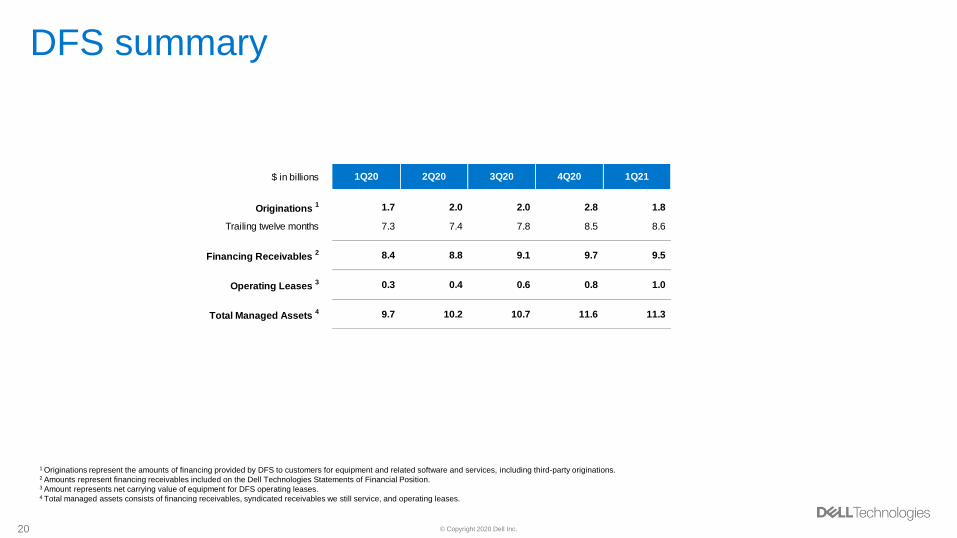
DFS summary
1 Originations represent the amounts of financing provided by DFS to customers for equipment and related software and services, including third-party originations.2 Amounts represent financing receivables included on the Dell Technologies Statements of Financial Position.3 Amount represents net carrying value of equipment for DFS operating leases.4 Total managed assets consists of financing receivables, syndicated receivables we still service, and operating leases.
$ in billions 1Q20 2Q20 3Q20 4Q20 1Q21
Originations 1 1.7 2.0 2.0 2.8 1.8
Trailing twelve months 7.3 7.4 7.8 8.5 8.6
Financing Receivables 2 8.4 8.8 9.1 9.7 9.5
Operating Leases 3 0.3 0.4 0.6 0.8 1.0
Total Managed Assets 4 9.7 10.2 10.7 11.6 11.3
21 © Copyright 2020 Dell Inc.
Appendix BSupplemental non-GAAP measures
22 © Copyright 2020 Dell Inc.
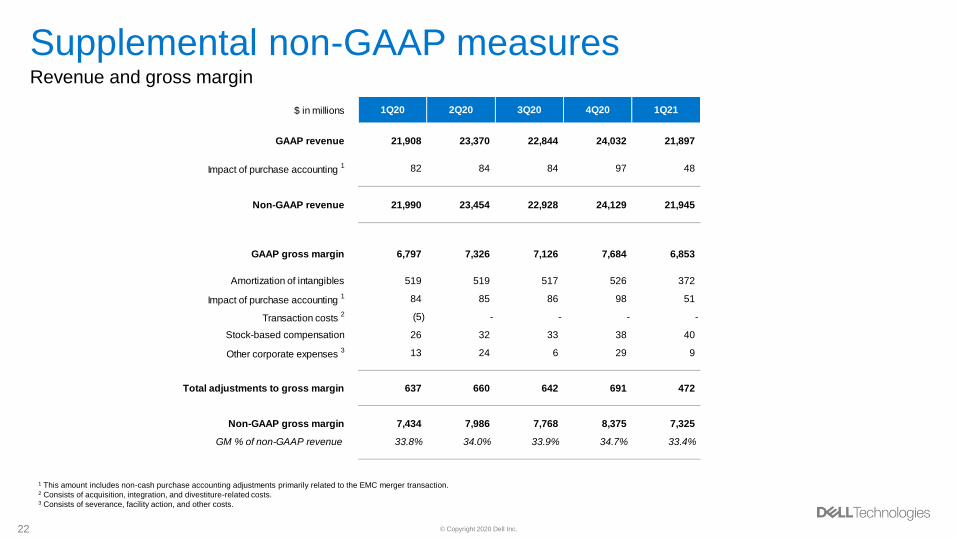
Supplemental non-GAAP measuresRevenue and gross margin
1 This amount includes non-cash purchase accounting adjustments primarily related to the EMC merger transaction.2 Consists of acquisition, integration, and divestiture-related costs.3 Consists of severance, facility action, and other costs.
$ in millions 1Q20 2Q20 3Q20 4Q20 1Q21
GAAP revenue 21,908 23,370 22,844 24,032 21,897
Impact of purchase accounting 1 82 84 84 97 48
Non-GAAP revenue 21,990 23,454 22,928 24,129 21,945
GAAP gross margin 6,797 7,326 7,126 7,684 6,853
Amortization of intangibles 519 519 517 526 372
Impact of purchase accounting 1 84 85 86 98 51
Transaction costs 2 (5) - - - -
Stock-based compensation 26 32 33 38 40
Other corporate expenses 3 13 24 6 29 9
Total adjustments to gross margin 637 660 642 691 472
Non-GAAP gross margin 7,434 7,986 7,768 8,375 7,325
GM % of non-GAAP revenue 33.8% 34.0% 33.9% 34.7% 33.4%
23 © Copyright 2020 Dell Inc.
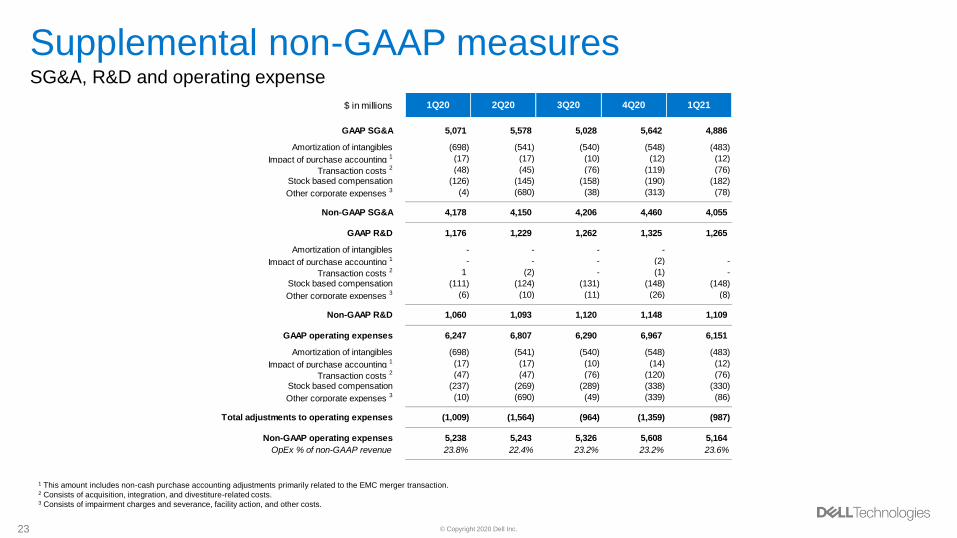
Supplemental non-GAAP measuresSG&A, R&D and operating expense
1 This amount includes non-cash purchase accounting adjustments primarily related to the EMC merger transaction.2 Consists of acquisition, integration, and divestiture-related costs.3 Consists of impairment charges and severance, facility action, and other costs.
$ in millions 1Q20 2Q20 3Q20 4Q20 1Q21
GAAP SG&A 5,071 5,578 5,028 5,642 4,886
Amortization of intangibles (698) (541) (540) (548) (483)
Impact of purchase accounting 1 (17) (17) (10) (12) (12)
Transaction costs 2 (48) (45) (76) (119) (76)
Stock based compensation (126) (145) (158) (190) (182)
Other corporate expenses 3 (4) (680) (38) (313) (78)
Non-GAAP SG&A 4,178 4,150 4,206 4,460 4,055
GAAP R&D 1,176 1,229 1,262 1,325 1,265
Amortization of intangibles - - - -
Impact of purchase accounting 1 - - - (2) -
Transaction costs 2 1 (2) - (1) -
Stock based compensation (111) (124) (131) (148) (148)
Other corporate expenses 3 (6) (10) (11) (26) (8)
Non-GAAP R&D 1,060 1,093 1,120 1,148 1,109
GAAP operating expenses 6,247 6,807 6,290 6,967 6,151
Amortization of intangibles (698) (541) (540) (548) (483)
Impact of purchase accounting 1 (17) (17) (10) (14) (12)
Transaction costs 2 (47) (47) (76) (120) (76)
Stock based compensation (237) (269) (289) (338) (330)
Other corporate expenses 3 (10) (690) (49) (339) (86)
Total adjustments to operating expenses (1,009) (1,564) (964) (1,359) (987)
Non-GAAP operating expenses 5,238 5,243 5,326 5,608 5,164
OpEx % of non-GAAP revenue 23.8% 22.4% 23.2% 23.2% 23.6%
24 © Copyright 2020 Dell Inc.
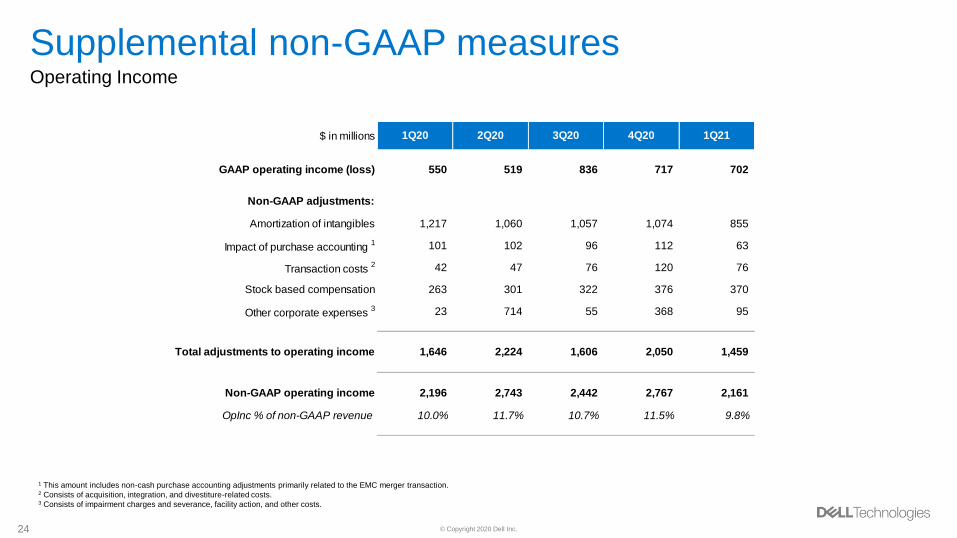
Supplemental non-GAAP measuresOperating Income
1 This amount includes non-cash purchase accounting adjustments primarily related to the EMC merger transaction.2 Consists of acquisition, integration, and divestiture-related costs.3 Consists of impairment charges and severance, facility action, and other costs.
$ in millions 1Q20 2Q20 3Q20 4Q20 1Q21
GAAP operating income (loss) 550 519 836 717 702
Non-GAAP adjustments:
Amortization of intangibles 1,217 1,060 1,057 1,074 855
Impact of purchase accounting 1 101 102 96 112 63
Transaction costs 2 42 47 76 120 76
Stock based compensation 263 301 322 376 370
Other corporate expenses 3 23 714 55 368 95
Total adjustments to operating income 1,646 2,224 1,606 2,050 1,459
Non-GAAP operating income 2,196 2,743 2,442 2,767 2,161
OpInc % of non-GAAP revenue 10.0% 11.7% 10.7% 11.5% 9.8%
25 © Copyright 2020 Dell Inc.
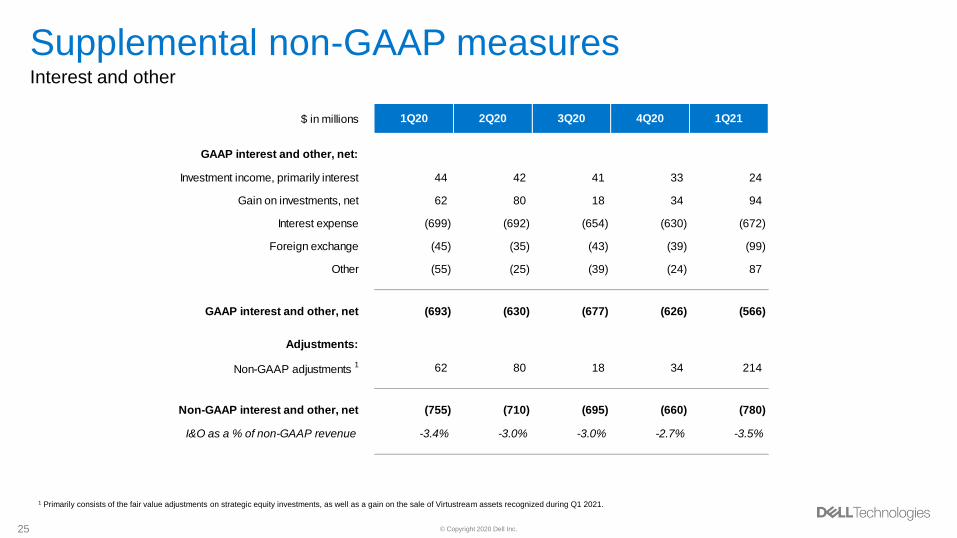
Supplemental non-GAAP measuresInterest and other
1 Primarily consists of the fair value adjustments on strategic equity investments, as well as a gain on the sale of Virtustream assets recognized during Q1 2021.
$ in millions 1Q20 2Q20 3Q20 4Q20 1Q21
GAAP interest and other, net:
Investment income, primarily interest 44 42 41 33 24
Gain on investments, net 62 80 18 34 94
Interest expense (699) (692) (654) (630) (672)
Foreign exchange (45) (35) (43) (39) (99)
Other (55) (25) (39) (24) 87
GAAP interest and other, net (693) (630) (677) (626) (566)
Adjustments:
Non-GAAP adjustments 1 62 80 18 34 214
Non-GAAP interest and other, net (755) (710) (695) (660) (780)
I&O as a % of non-GAAP revenue -3.4% -3.0% -3.0% -2.7% -3.5%
26 © Copyright 2020 Dell Inc.
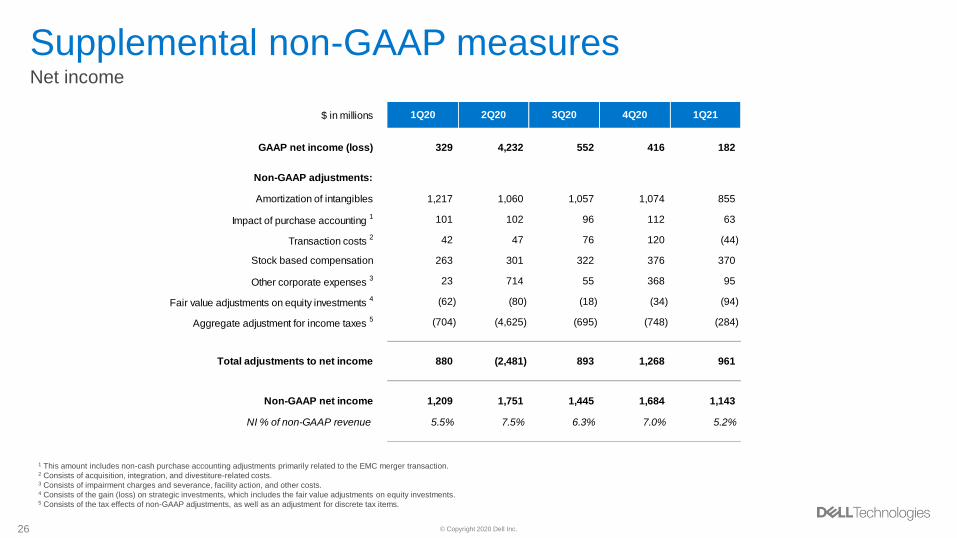
Supplemental non-GAAP measuresNet income
26
1 This amount includes non-cash purchase accounting adjustments primarily related to the EMC merger transaction.2 Consists of acquisition, integration, and divestiture-related costs.3 Consists of impairment charges and severance, facility action, and other costs.4 Consists of the gain (loss) on strategic investments, which includes the fair value adjustments on equity investments.5 Consists of the tax effects of non-GAAP adjustments, as well as an adjustment for discrete tax items.
$ in millions 1Q20 2Q20 3Q20 4Q20 1Q21
GAAP net income (loss) 329 4,232 552 416 182
Non-GAAP adjustments:
Amortization of intangibles 1,217 1,060 1,057 1,074 855
Impact of purchase accounting 1 101 102 96 112 63
Transaction costs 2 42 47 76 120 (44)
Stock based compensation 263 301 322 376 370
Other corporate expenses 3 23 714 55 368 95
Fair value adjustments on equity investments 4 (62) (80) (18) (34) (94)
Aggregate adjustment for income taxes 5 (704) (4,625) (695) (748) (284)
Total adjustments to net income 880 (2,481) 893 1,268 961
Non-GAAP net income 1,209 1,751 1,445 1,684 1,143
NI % of non-GAAP revenue 5.5% 7.5% 6.3% 7.0% 5.2%
27 © Copyright 2020 Dell Inc.
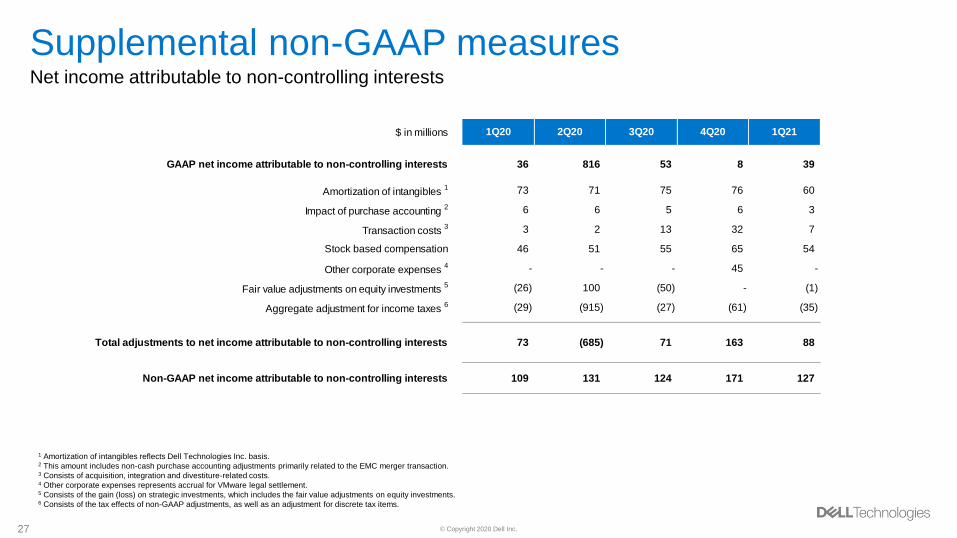
Supplemental non-GAAP measuresNet income attributable to non-controlling interests
27
1 Amortization of intangibles reflects Dell Technologies Inc. basis.2 This amount includes non-cash purchase accounting adjustments primarily related to the EMC merger transaction.3 Consists of acquisition, integration and divestiture-related costs.4 Other corporate expenses represents accrual for VMware legal settlement.5 Consists of the gain (loss) on strategic investments, which includes the fair value adjustments on equity investments.6 Consists of the tax effects of non-GAAP adjustments, as well as an adjustment for discrete tax items.
$ in millions 1Q20 2Q20 3Q20 4Q20 1Q21
GAAP net income attributable to non-controlling interests 36 816 53 8 39
Amortization of intangibles 1 73 71 75 76 60
Impact of purchase accounting 2 6 6 5 6 3
Transaction costs 3 3 2 13 32 7
Stock based compensation 46 51 55 65 54
Other corporate expenses 4 - - - 45 -
Fair value adjustments on equity investments 5 (26) 100 (50) - (1)
Aggregate adjustment for income taxes 6 (29) (915) (27) (61) (35)
Total adjustments to net income attributable to non-controlling interests 73 (685) 71 163 88
Non-GAAP net income attributable to non-controlling interests 109 131 124 171 127
28 © Copyright 2020 Dell Inc.
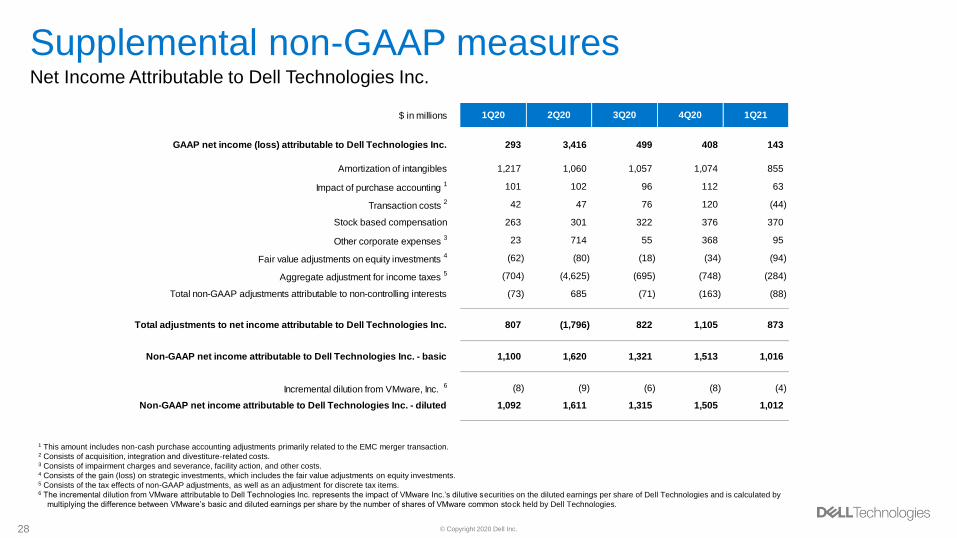
Supplemental non-GAAP measuresNet Income Attributable to Dell Technologies Inc.
28
1 This amount includes non-cash purchase accounting adjustments primarily related to the EMC merger transaction.2 Consists of acquisition, integration and divestiture-related costs.3 Consists of impairment charges and severance, facility action, and other costs.4 Consists of the gain (loss) on strategic investments, which includes the fair value adjustments on equity investments.5 Consists of the tax effects of non-GAAP adjustments, as well as an adjustment for discrete tax items.6 The incremental dilution from VMware attributable to Dell Technologies Inc. represents the impact of VMware Inc.’s dilutive securities on the diluted earnings per share of Dell Technologies and is calculated by
multiplying the difference between VMware’s basic and diluted earnings per share by the number of shares of VMware common stock held by Dell Technologies.
$ in millions 1Q20 2Q20 3Q20 4Q20 1Q21
GAAP net income (loss) attributable to Dell Technologies Inc. 293 3,416 499 408 143
Amortization of intangibles 1,217 1,060 1,057 1,074 855
Impact of purchase accounting 1 101 102 96 112 63
Transaction costs 2 42 47 76 120 (44)
Stock based compensation 263 301 322 376 370
Other corporate expenses 3 23 714 55 368 95
Fair value adjustments on equity investments 4 (62) (80) (18) (34) (94)
Aggregate adjustment for income taxes 5 (704) (4,625) (695) (748) (284)
Total non-GAAP adjustments attributable to non-controlling interests (73) 685 (71) (163) (88)
Total adjustments to net income attributable to Dell Technologies Inc. 807 (1,796) 822 1,105 873
Non-GAAP net income attributable to Dell Technologies Inc. - basic 1,100 1,620 1,321 1,513 1,016
Incremental dilution from VMware, Inc. 6 (8) (9) (6) (8) (4)
Non-GAAP net income attributable to Dell Technologies Inc. - diluted 1,092 1,611 1,315 1,505 1,012

29 © Copyright 2020 Dell Inc.
Supplemental non-GAAP measuresEarnings per share - basic and diluted
1 The incremental dilution from VMware attributable to Dell Technologies Inc. represents the impact of VMware Inc.’s dilutive securities on the diluted earnings per share of Dell Technologies and is calculated by
multiplying the difference between VMware’s basic and diluted earnings per share by the number of shares of VMware common stock held by Dell Technologies.
$ in millions, except per share figures 1Q20 2Q20 3Q20 4Q20 1Q21
GAAP net income attributable to Dell Technologies Inc. 293 3,416 499 408 143
Weighted-average shares outstanding - basic 717 719 725 734 740
GAAP EPS attributable to Dell Technolgies Inc. - basic 0.41 4.75 0.69 0.56 0.19
Incremental dilution from VMware Inc. 1 (8) (62) (6) (3) (2)
GAAP net income attributable to Dell Technolgies Inc. - diluted 285 3,354 493 405 141
Weighted-average shares outstanding - diluted 751 751 750 754 755
GAAP EPS attributable to Dell Technolgies Inc. - diluted 0.38 4.47 0.66 0.54 0.19
Non-GAAP net income attributable to Dell Technologies Inc. 1,100 1,620 1,321 1,513 1,016
Weighted-average shares outstanding - basic 717 719 725 734 740
Non-GAAP EPS attributable to Dell Technolgies Inc. - basic 1.53 2.25 1.82 2.06 1.37
Incremental dilution from VMware Inc. 1 (8) (9) (6) (8) (4)
Non-GAAP net income attributable to Dell Technolgies Inc. - diluted 1,092 1,611 1,315 1,505 1,012
Weighted-average shares outstanding - diluted 751 751 750 754 755
Non-GAAP EPS attributable to Dell Technolgies Inc. - diluted 1.45 2.15 1.75 2.00 1.34
30 © Copyright 2020 Dell Inc.
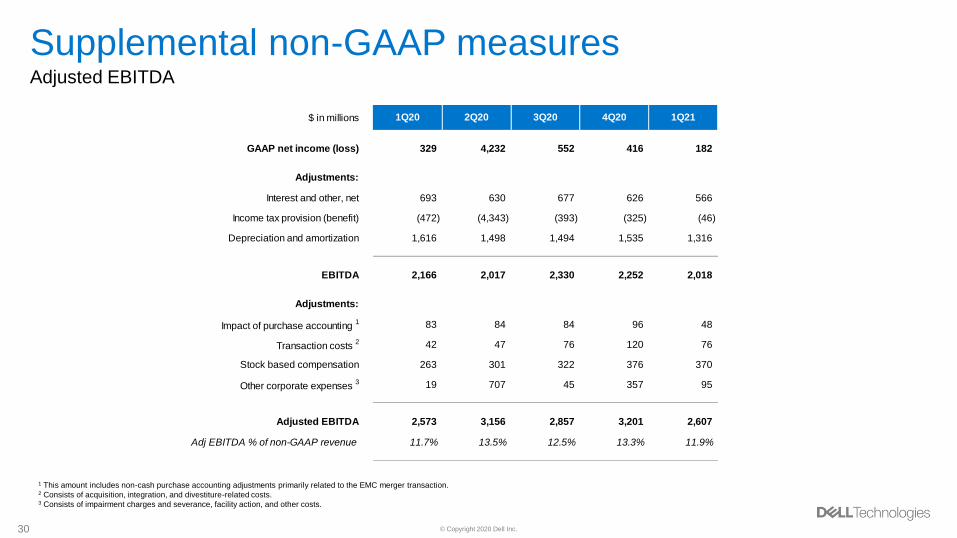
Supplemental non-GAAP measuresAdjusted EBITDA
1 This amount includes non-cash purchase accounting adjustments primarily related to the EMC merger transaction.2 Consists of acquisition, integration, and divestiture-related costs.3 Consists of impairment charges and severance, facility action, and other costs.
$ in millions 1Q20 2Q20 3Q20 4Q20 1Q21
GAAP net income (loss) 329 4,232 552 416 182
Adjustments:
Interest and other, net 693 630 677 626 566
Income tax provision (benefit) (472) (4,343) (393) (325) (46)
Depreciation and amortization 1,616 1,498 1,494 1,535 1,316
EBITDA 2,166 2,017 2,330 2,252 2,018
Adjustments:
Impact of purchase accounting 1 83 84 84 96 48
Transaction costs 2 42 47 76 120 76
Stock based compensation 263 301 322 376 370
Other corporate expenses 3 19 707 45 357 95
Adjusted EBITDA 2,573 3,156 2,857 3,201 2,607
Adj EBITDA % of non-GAAP revenue 11.7% 13.5% 12.5% 13.3% 11.9%
31 © Copyright 2020 Dell Inc.
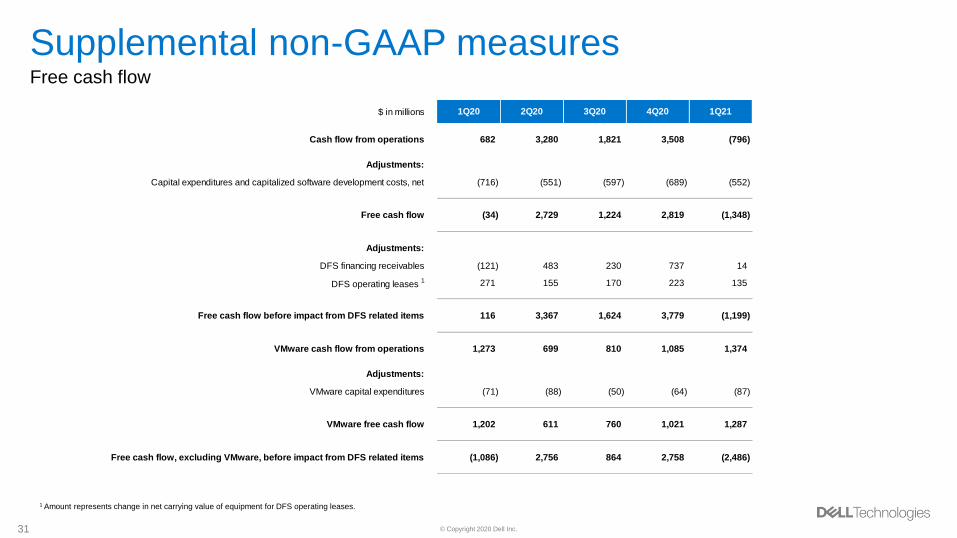
Supplemental non-GAAP measuresFree cash flow
1 Amount represents change in net carrying value of equipment for DFS operating leases.
$ in millions 1Q20 2Q20 3Q20 4Q20 1Q21
Cash flow from operations 682 3,280 1,821 3,508 (796)
Adjustments:
Capital expenditures and capitalized software development costs, net (716) (551) (597) (689) (552)
Free cash flow (34) 2,729 1,224 2,819 (1,348)
Adjustments:
DFS financing receivables (121) 483 230 737 14
DFS operating leases 1 271 155 170 223 135
Free cash flow before impact from DFS related items 116 3,367 1,624 3,779 (1,199)
VMware cash flow from operations 1,273 699 810 1,085 1,374
Adjustments:
VMware capital expenditures (71) (88) (50) (64) (87)
VMware free cash flow 1,202 611 760 1,021 1,287
Free cash flow, excluding VMware, before impact from DFS related items (1,086) 2,756 864 2,758 (2,486)