July 2018 - Dell Technologies
36
The Essential and Trusted Technology Partner Leading the Way to Digital Transformation July 2018 Filed by Dell Technologies Inc.; Pursuant to Rule 425 under the Securities Act of 1933 and deemed filed pursuant to Rule 14a-12 of the Securities Exchange Act of 1934. Subject Company: Dell Technologies Inc. (Commission File No. 001-37867)
Transcript of July 2018 - Dell Technologies

The Essential and Trusted Technology Partner
Leading the Way to Digital Transformation
July 2018
Filed by Dell Technologies Inc.; Pursuant to Rule 425
under the Securities Act of 1933 and deemed filed
pursuant to Rule 14a-12 of the Securities Exchange Act
of 1934. Subject Company: Dell Technologies Inc.
(Commission File No. 001-37867)

2
128 128 128
0 125 184
247 181 0
115 173 8
247 107 16
0 0 0
Important Notices No Offer or Solicitation
This communication does not constitute an offer to sell or a solicitation of an offer to sell or a solicitation of an offer to buy any securities or a solicitation of any vote or
approval, nor shall there be any sale of securities in any jurisdiction in which such offer, solicitation or sale would be unlawful prior to registration or qualification under
the securities laws of any such jurisdiction. No offering of securities shall be made except by means of a prospectus meeting the requirements of Section 10 of the
Securities Act of 1933, as amended (the “Securities Act”), and otherwise in accordance with applicable law.
Additional Information and Where to Find It
This communication is being made in respect of the proposed merger of a wholly-owned subsidiary of Dell Technologies Inc. (“Dell Technologies”) with and into Dell
Technologies, with Dell Technologies as the surviving entity, pursuant to which each share of Class V common stock of Dell Technologies will, at the election of the
holder, convert into the right to receive shares of Class C common stock of Dell Technologies or cash, without interest, and each existing share of Class A common
stock, Class B common stock and Class C common stock of Dell Technologies will be unaffected by the merger and remain outstanding. The proposed transaction
requires the approval of a majority of the aggregate voting power of the outstanding shares of Class A common stock, Class B common stock, Class V common stock
other than those held by affiliates of Dell Technologies, in each case, voting as a separate class, and all outstanding shares of common stock of Dell Technologies,
voting together as a single class, and will be submitted to stockholders for their consideration. Dell Technologies will file a registration statement containing a
preliminary proxy statement/prospectus regarding the proposed transaction with the Securities and Exchange Commission (“SEC”). After the registration statement has
been declared effective by the SEC, a definitive proxy statement/prospectus will be mailed to each holder of Class A common stock, Class B common stock, Class C
common stock and Class V common stock entitled to vote at the special meeting in connection with the proposed transaction. INVESTORS ARE URGED TO READ
THE PROXY STATEMENT/PROSPECTUS AND ANY OTHER DOCUMENTS RELATING TO THE TRANSACTION TO BE FILED WITH THE SEC CAREFULLY AND
IN THEIR ENTIRETY IF AND WHEN THEY BECOME AVAILABLE BECAUSE THEY WILL CONTAIN IMPORTANT INFORMATION ABOUT THE PROPOSED
TRANSACTION. You may get these documents, when available, for free by visiting EDGAR on the SEC Website at www.sec.gov or by visiting Dell Technologies’
website at www.investors.delltechnologies.com.
3
128 128 128
0 125 184
247 181 0
115 173 8
247 107 16
0 0 0
Important Notices (Cont’d) Participants in the Solicitation
Dell Technologies and its directors, executive officers and other members of its management and employees may be deemed to be participants in the solicitation of proxies from its stockholders in favor of the proposed merger and the other transactions contemplated by the merger agreement, including the exchange of shares of Class V common stock of Dell Technologies for shares of Class C common stock of Dell Technologies or cash. Information regarding Dell Technologies’ directors and executive officers is contained in Dell Technologies’ proxy statement for its 2018 annual meeting of stockholders, which was filed with the SEC on May 15, 2018. Additional information concerning persons who may be considered participants in such solicitation under the rules of the SEC, including a description of their direct or indirect interests, by security holdings or otherwise, will be set forth in the aforementioned proxy statement/prospectus to be filed with the SEC.
Forward-Looking Statements
These materials contain “forward-looking statements” within the meaning of Section 27A of the Securities Act of 1933 and Section 21E of the Securities Exchange Act of 1934. The words "may," "will," "anticipate," "estimate," "expect," "intend," "plan," "aim," "seek," and similar expressions as they relate to Dell Technologies or its management are intended to identify these forward-looking statements. All statements by Dell Technologies regarding its expected financial position, revenues, cash flows and other operating results, business strategy, legal proceedings, and similar matters are forward-looking statements. The expectations expressed or implied in these forward-looking statements may not turn out to be correct. Dell Technologies’ results could be materially different from its expectations because of various risks, including but not limited to: (i) the failure to consummate or delay in consummating the proposed transaction, including the failure to obtain the requisite stockholder approvals or the failure of VMware to pay the special dividend or any inability of Dell Technologies to pay the cash consideration to Class V holders; (ii) the risk as to the trading price of Class C common stock to be issued by Dell Technologies in the proposed transaction relative to the trading price of shares of Class V common stock and VMware, Inc. common stock; and (iii) the risks discussed in the "Risk Factors" section of the registration statement containing a preliminary proxy statement/prospectus that will be filed with the SEC as well as its periodic and current reports filed with the SEC. Any forward-looking statement speaks only as of the date as of which such statement is made, and, except as required by law, Dell Technologies undertakes no obligation to update any forward-looking statement after the date as of which such statement was made, whether to reflect changes in circumstances or expectations, the occurrence of unanticipated events, or otherwise.
Non-GAAP Financial Measures
This presentation includes certain financial measures not presented in accordance with generally accepted accounting principles (“GAAP”) including, but not limited to, Non-GAAP Net Revenue, Non-GAAP Operating Income, Non-GAAP Net Income, Adjusted EBITDA, Free Cash Flow, Core Debt and Net Core Debt and certain ratios and other metrics derived therefrom. These non-GAAP financial measures are not measures of financial performance in accordance with GAAP and have important limitations as analytical tools and may exclude items that are significant in understanding and assessing Dell Technologies’ financial results. Therefore, these measures should not be considered in isolation or as an alternative to net income, cash flows from operations or other measures of profitability, liquidity or performance under GAAP. However, Dell Technologies presents these non-GAAP measures because it considers them to be useful supplemental measures of performance for investors, analysts and rating agencies. You should be aware that Dell Technologies’ presentation of these measures may not be comparable to similarly-titled measures used by other companies. See Appendix for reconciliations of Non-GAAP Net Revenue, Non-GAAP Operating Income, Non-GAAP Net Income, Adjusted EBITDA, Free Cash Flow, Core Debt and Net Core Debt to the most comparable GAAP metric.

4
128 128 128
0 125 184
247 181 0
115 173 8
247 107 16
0 0 0
Today’s Speakers
Jeff Clarke Tom Sweet Tyler Johnson Hall Butler Vice Chairman,
Products and Operations
Chief Financial Officer
Senior Vice President,
Treasurer
Director,
Investor Relations

5
128 128 128
0 125 184
247 181 0
115 173 8
247 107 16
0 0 0
Transaction Overview
For each Class V share, existing stockholders can elect to receive:
● 1.3665 shares of Dell Technologies Class C common stock, or
● $109 in cash per DVMT share (~29% premium to the Class V share closing price prior to announcement and ~22% premium to the
Class V all-time high)
● Implies total market capitalization of $21.7bn for the Class V stockholders
● Final consideration mix subject to proration ($9 billion cap on aggregate cash consideration)
Pro forma for the transaction, DVMT stockholders will own 20.8% – 31.0% of Dell Technologies, depending on cash election amounts,
implying a pro forma equity value of $61.1 – $70.1 billion for Dell Technologies
In connection with this transaction, Dell Technologies plans to directly list its Class C common shares on the NYSE
Class V Special Committee conducted thorough evaluation to maximize stockholder value; included ongoing discussions and negotiations
with Dell Technologies regarding transaction structure and key value parameters
VMware’s board of directors, on the recommendation of a special committee of its directors, has voted to declare an $11 billion cash dividend
pro rata to all VMware stockholders, contingent on satisfaction of the other conditions to the completion of the transaction. Dell Technologies’
share of such dividend will be approximately $9 billion
● Dell Technologies plans to use the dividend proceeds to fund the cash consideration paid to Class V stockholders
● If Class V stockholders’ aggregate cash election is less than $9 billion, Dell plans to use the remaining dividend proceeds to repurchase
shares of Class C common stock or to pay down debt
VMware will remain well capitalized with $2+ billion of balance sheet cash / investments and strong cash flow
Transaction expected to close in Q4 CY2018, subject to Class V stockholder approval Expected
Timeline
VMware
Special
Dividend
Class V
Stockholder
Consideration
6
128 128 128
0 125 184
247 181 0
115 173 8
247 107 16
0 0 0
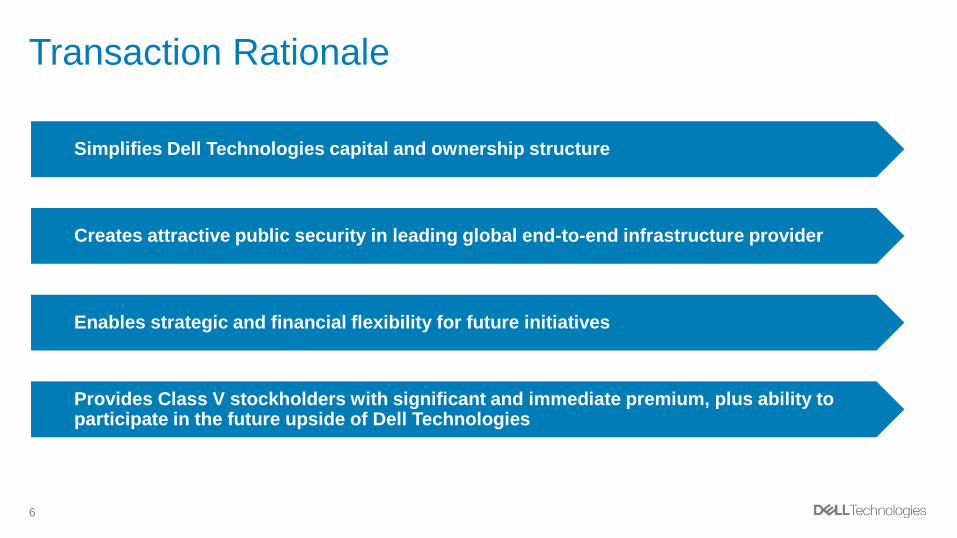
Transaction Rationale
Simplifies Dell Technologies capital and ownership structure
Creates attractive public security in leading global end-to-end infrastructure provider
Provides Class V stockholders with significant and immediate premium, plus ability to participate in the future upside of Dell Technologies
Enables strategic and financial flexibility for future initiatives
7
128 128 128
0 125 184
247 181 0
115 173 8
247 107 16
0 0 0
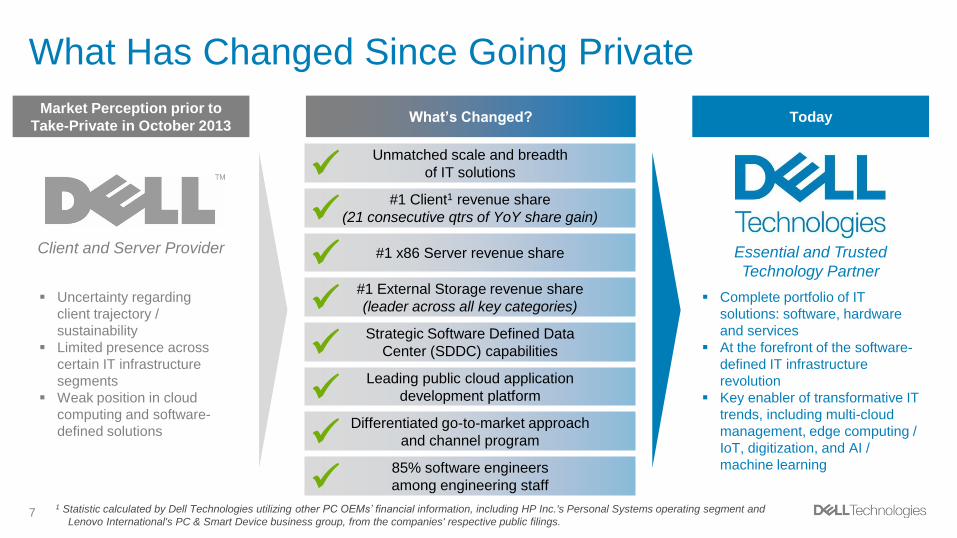
What Has Changed Since Going Private
Market Perception prior to
Take-Private in October 2013 Today
Essential and Trusted
Technology Partner
Client and Server Provider
Uncertainty regarding
client trajectory /
sustainability
Limited presence across
certain IT infrastructure
segments
Weak position in cloud
computing and software-
defined solutions
Complete portfolio of IT
solutions: software, hardware
and services
At the forefront of the software-
defined IT infrastructure
revolution
Key enabler of transformative IT
trends, including multi-cloud
management, edge computing /
IoT, digitization, and AI /
machine learning
Unmatched scale and breadth
of IT solutions
#1 Client1 revenue share
(21 consecutive qtrs of YoY share gain)
#1 x86 Server revenue share
#1 External Storage revenue share
(leader across all key categories)
Strategic Software Defined Data
Center (SDDC) capabilities
Leading public cloud application
development platform
Differentiated go-to-market approach
and channel program
85% software engineers
among engineering staff
What’s Changed?
1 Statistic calculated by Dell Technologies utilizing other PC OEMs’ financial information, including HP Inc.'s Personal Systems operating segment and
Lenovo International's PC & Smart Device business group, from the companies' respective public filings.

8
128 128 128
0 125 184
247 181 0
115 173 8
247 107 16
0 0 0
Company Overview
The Most Complete Portfolio of Technology Solutions: Software, Hardware and Services
DIGITAL IT WORKFORCE SECURITY
Client, Software &
Peripherals
Managed Security
Services
Server,
Storage, HCI
Cloud Native SW
Development
Software Defined
Data Center
Multi-cloud
Management

9
128 128 128
0 125 184
247 181 0
115 173 8
247 107 16
0 0 0
Dell Technologies in Numbers
$83.5B Non-GAAP Revenue
(TTM)1
$12B+ R&D Invested over
Past 3 Fiscal Years2
$9.7B Adjusted EBITDA (TTM)
(11.6 % of Non-GAAP Revenue)1
40K+ Sales Force
#1 Virtualization, Storage,
Servers, Client3
17% Non-GAAP Revenue
Growth YoY (Q1 FY2019)1
99% of Fortune 500 Served
$7.7B+ Cash Flow from
Operations (TTM)
1 See appendix for reconciliation of GAAP to Non-GAAP measures.
2 Dell Technologies’ cumulative R&D investment includes EMC amounts prior to the merger transaction date on September 7, 2016. 3 Gartner, IDC market research, company filings; Client statistic calculated by Dell Technologies utilizing other PC OEMs’ financial information, including HP
Inc.'s Personal Systems operating segment and Lenovo International's PC & Smart Device business group, from the companies' respective public filings.

10
128 128 128
0 125 184
247 181 0
115 173 8
247 107 16
0 0 0
New Data Era Driving Significant Market Growth
Edge Computing / IoT 1 Connectivity AI / Machine Learning
Significant IT Investment Required to Leverage Transformational Technologies
2 3
Client Client Client
Server
x86 / Mainframe
Cloud
Client / Server
Edge / IoT
Unprecedented Data Growth is Driving Accelerating IT Spend Growth of 4.5% in 20181
1 Market Source: Gartner Worldwide IT Spending Forecast (January 2018).
Dell Technologies is well-positioned to capture spend across software, compute, storage, and networking

11
128 128 128
0 125 184
247 181 0
115 173 8
247 107 16
0 0 0
Financial
ServicesTM
Global Services
Dell Technologies Provides a Comprehensive Solution
Applications Digital Transformation
Security Transformation
IT Transformation
Infrastructure
Cloud
Consumption Services
Our Users Workforce Transformation
Enabled by Best-in-Class Go-To-Market and Channel Program with Industry-leading Supply Chain & Scale
12
128 128 128
0 125 184
247 181 0
115 173 8
247 107 16
0 0 0
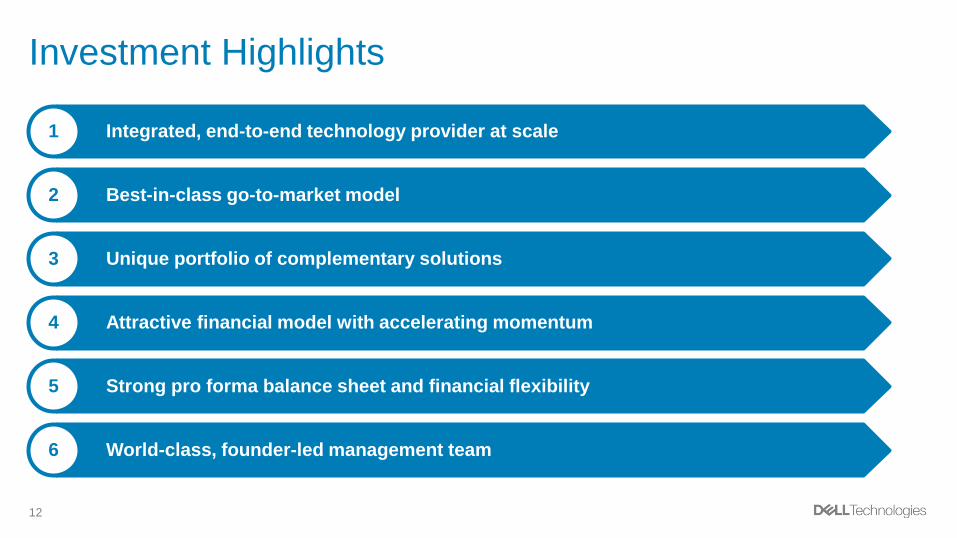
Investment Highlights
Integrated, end-to-end technology provider at scale 1
Best-in-class go-to-market model 2
Unique portfolio of complementary solutions 3
Attractive financial model with accelerating momentum 4
Strong pro forma balance sheet and financial flexibility 5
World-class, founder-led management team 6

13
128 128 128
0 125 184
247 181 0
115 173 8
247 107 16
0 0 0
$80B
$56B$49B $45B
$30B
$6B
Dell Technologies IBM HPQ Cisco Lenovo HPE NetAppClient
Storage
Server
Networking
Virtualization
Cybersecurity
Cloud Platform
$84B
Source: Company filings
Note: TTM Non-GAAP revenue presented for all companies. Cisco’s Whiptail storage business considered immaterial.
Integrated, End-to-End Technology Provider at Scale
1

14
128 128 128
0 125 184
247 181 0
115 173 8
247 107 16
0 0 0
ISG Industry Context
External Storage
Industry
Revenue
Forecast
($B)
ISG remains a clear leader in storage and HCI, now #1 in total x86 server revenue and units
Share
Overview
Hyperconverged Infrastructure x86 Servers
Clear #1 share position in total storage and all
major and emerging storage categories
Recently took over #1 share position in total
revenue, units and mainstream revenue
32.9%
14.2% 10.4%
42.5%
Dell
NetApp
HPE
Other
29.6%
22.2% 5.0% 4.9% 2.5%
35.8%
Dell
Nutanix
HPE
Cisco
Lenovo
Other
20.7%
19.4%
6.3%
53.6%
Dell
HPE
Cisco
Other
#1 in HCI with triple-digit growth in family
developed products like VxRail and VxRack
Source: Gartner, IDC (2018)
11% 35% 48%47%
26% 17%42% 39% 35%
$26 $26 $26
2015A 2018E 2021E
All-Flash Array Hard Disk Array Hybrid Array
CAGR: 0%
$1.1
$5.8
2015A 2018E 2021E
$10.1
$53
$76$87
2015A 2018E 2021E
1

15
128 128 128
0 125 184
247 181 0
115 173 8
247 107 16
0 0 0
100
150
200
250
20
12
20
13
20
14
20
15
20
16
20
17
20
18
20
19
20
20
20
21
Reven
ue $
(bn
)
25%
35%
45%
55%
65%
1Q
'12
2Q
'12
3Q
'12
4Q
'12
1Q
'13
2Q
'13
3Q
'13
4Q
'13
1Q
'14
2Q
'14
3Q
'14
4Q
'14
1Q
'15
2Q
'15
3Q
'15
4Q
'15
1Q
'16
2Q
'16
3Q
'16
4Q
'16
1Q
'17
2Q
'17
3Q
'17
4Q
'17
1Q
'18
CSG Industry Context
Worldwide PC Revenue Forecast PC Unit Share Trend (Units Sold)
Industry has stabilized and has been consolidating
Dell Y/Y Change in Global PC Unit Share (bps)
IDC forecasts trajectory to stabilize over next few years
Demand supported by release of new operating systems and
support end-of-life for older systems
Big 3 share growth partially driven by several players completing or
planning exit of PC businesses (e.g., Sony, Toshiba, Fujitsu and
others)
IDC (May 2018)
All Others Big 3 (Dell, HP, Lenovo)
Source: IDC (2018)
21 consecutive quarters of Y/Y share gains
21
90114
188169 174
119 129
1
70
12086
158129
162143
83110
3 1
105
0
75
150
225
300
Q1
'13
Q2
'13
Q3
'13
Q4
'13
Q1
'14
Q2
'14
Q3
'14
Q4
'14
Q1
'15
Q2
'15
Q3
'15
Q4
'15
Q1
'16
Q2
'16
Q3
'16
Q4
'16
Q1
'17
Q2
'17
Q3
'17
Q4
'17
Q1
'18
1

16
128 128 128
0 125 184
247 181 0
115 173 8
247 107 16
0 0 0
2 Best-in-Class Go-to-Market Model
Dell Technologies Go-To-Market Model
Broad go-to market reach across geographies and
customer segments
Direct sales force
— Enables deeper customer relationships with
greater opportunity for peripheral and services
attach in addition to solution cross-sell
— 40K+ direct salesforce
— Reach in 72 countries worldwide
Dell EMC Partner Program
— Trusted partner community that provides local
proximity, deep and wide coverage,
complementary consulting skills, abilities and
services
— 150K partners worldwide
— Serving 180 countries
DT Select
Enterprise
Commercial
Consumer &
Small
Business V
Mw
are
Piv
ota
l
Vir
tus
tre
am
Secu
rew
ork
s
Highlights
Infr
as
tru
ctu
re S
olu
tio
ns
Gro
up
Cli
en
t S
olu
tio
ns
Gro
up
Strong Direct Salesforce Complemented by a World Class Partner Program

17
128 128 128
0 125 184
247 181 0
115 173 8
247 107 16
0 0 0
Servers
Client1
Virtualization
Client Revenue /
Profitability
Client Monitors
Globally
Total
Revenue and
Units
x86 Servers
Server
Virtualization
Software
# 1 # 1
# 1
$189B Sector Size
$76B Sector Size
$31B Sector Size
Source: Gartner, IDC market research, Company filings; 1 Statistic calculated by Dell Technologies utilizing other PC OEMs’ financial information, including
HP Inc.'s Personal Systems operating segment and Lenovo International's PC & Smart Device business group, from the companies' respective public
filings.
Storage
# 1 External Storage
PBBA / backup
All-flash Arrays
Integrated
Infrastructure
$26B Sector Size
Security
$42B Sector Size
Gartner Magic
Quadrant
Leader
Cloud
$80B Sector Size
Leading
Managed Cloud,
PaaS, and Big
Data
3 Unique Portfolio of Complementary Solutions

18
128 128 128
0 125 184
247 181 0
115 173 8
247 107 16
0 0 0
-0.2%
+6.4%
+0.1%
+4.4%
Forecast -1.5%
Forecast
+1.2%
Forecast
-4.5%
TOTAL CLIENT COMMERCIAL CONSUMER
Forecast
+16.3%
MAINSTREAM SERVER REVENUE2
Forecast
+51%
HYPERCONVERGED SYSTEMS REVENUE3
-23.2%
-2.9%
+2.8%
+9.0%
+6.4%
+4.5%
-1.1% -3.4%
+1.6%
-8.2%
+4.3%
-3.9%
+76%
+142%
+71%
+112%
+77%
1 External Storage Revenue Source: 1Q CY18 IDC External Storage data as of 05-Jun-2018.
2 Mainstream Server Revenue Source: 1Q CY18 IDC Mainstream Server data as of 30-May-2018. 3 Hyper Converged Systems Revenue Source: 1Q CY18 IDC Hyper Converged data as of 26-Jun-2018. 4 Client Unit Source: 1Q CY18 IDC Client data as of 09-May-2018.
+30.4% +42.5%
+24.7%
+39.1%
+18.8% +18.9%
Forecast
+0.5%
EXTERNAL STORAGE REVENUE1
-9.2%
+19.3%
+44.6%
-17.3%
+21.7%
+9.4%
Cli
en
t U
nit
s Y
oY
4
ISG
Yo
Y
Driving Outperformance vs. Market 3

19
128 128 128
0 125 184
247 181 0
115 173 8
247 107 16
0 0 0
Attractive Financial Model & High FCF Conversion 4
($ in billions)
TTM Q1 FY2019
Revenue $74.4 $8.1 $0.5 $0.5 $83.5
Operating Income $5.8 $2.7 $(0.1) $(0.0) $8.4
Op. Inc. Margin (%) 7.8% 33.6% N/A N/A 10.0%
Net Income $2.7 $2.2 $(0.1) $(0.0) $4.8
Adjusted EBITDA $6.9 $2.9 $(0.1) $(0.0) $9.7
Adj. EBITDA Margin (%) 9.3% 36.3% NA NA 11.6%
Free Cash Flow3 $3.0 $3.3 $(0.1) $(0.0) $6.1
FCF Conversion4 (%) 112% 145% N/A N/A 128%
Source: Public filings. See appendix for reconciliation of GAAP to Non-GAAP measures. 1 Derived as Dell Technologies Consolidated less Publicly Traded Subsidiaries. 2 Financials derived from respective public filings and are different from the business unit financials as reflected in Dell Technologies' public filings.
3 Cash flow from operations less capital expenditures and less capitalized software. 4 Free cash conversion calculation defined as Free Cash Flow / Net Income.
Ex. Public Subs1 Publicly Traded Subsidiaries2 Consolidated
Non-GAAP
20
128 128 128
0 125 184
247 181 0
115 173 8
247 107 16
0 0 0
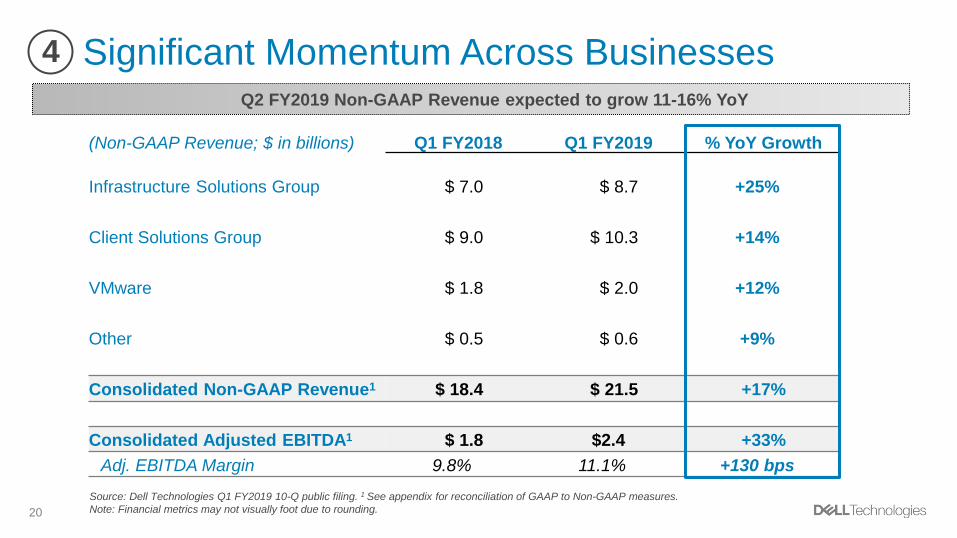
Significant Momentum Across Businesses
Source: Dell Technologies Q1 FY2019 10-Q public filing. 1 See appendix for reconciliation of GAAP to Non-GAAP measures.
Note: Financial metrics may not visually foot due to rounding.
(Non-GAAP Revenue; $ in billions) Q1 FY2018 Q1 FY2019 % YoY Growth
Infrastructure Solutions Group $ 7.0 $ 8.7 +25%
Client Solutions Group $ 9.0 $ 10.3 +14%
VMware $ 1.8 $ 2.0 +12%
Other $ 0.5 $ 0.6 +9%
Consolidated Non-GAAP Revenue1 $ 18.4 $ 21.5 +17%
Consolidated Adjusted EBITDA1 $ 1.8 $2.4 +33%
Adj. EBITDA Margin 9.8% 11.1% +130 bps
Q2 FY2019 Non-GAAP Revenue expected to grow 11-16% YoY
4

21
128 128 128
0 125 184
247 181 0
115 173 8
247 107 16
0 0 0
Strong Balance Sheet and Financial Flexibility
Source: Dell Technologies Public Filings
Note: Core Debt represents the total principal amount of our debt, less: (a) unrestricted subsidiary debt, (b) DFS related debt, and (c) other debt. See
appendix for further information regarding capital structure. 1 Represents pro forma balance sheet amounts based on Q1 FY2019 reported results.
5
Pro Forma Liquidity Profile
~$10.7B1 of cash and investments
will remain on balance sheet
● $8.1B1 of cash and investments
excluding VMware
~$5B undrawn revolver capacity
Manageable near-term maturity profile
Moody’s, S&P and Fitch all held ratings
constant for Dell and VMware post-
announcement
Dell Technologies Core Debt Trajectory
~$13B gross debt paid down since the EMC transaction
$48.8
$39.8
$37.8
At EMC Close (during Q3 FY2017)
Q1 FY2019 June FY2019

22
128 128 128
0 125 184
247 181 0
115 173 8
247 107 16
0 0 0
World-Class, Founder-Led Management Team 6
Michael S. Dell
Chairman of the Board &
Chief Executive Officer
Jeff Clarke
Vice Chairman,
Products and Ops.
Bill Scannell President, Global
Enterprise Sales
Dell EMC
Tom Sweet
CFO
Mike Cote
CEO
SecureWorks
Marius Haas
President and Chief
Commercial Officer
Rob Mee
CEO
Pivotal
Pat Gelsinger
CEO
VMware
Howard Elias
President, Dell Svcs.,
Digital and IT
Alison Dew
Chief Marketing
Officer

23
128 128 128
0 125 184
247 181 0
115 173 8
247 107 16
0 0 0
Simplifies Dell Technologies’ Capital Structure
While Maintaining VMware Independence
Remaining committed to a disciplined financial policy as we re-emerge in the public equity markets
Disciplined Investment Approach
Targeted investment strategy focused on
long-term sustained free cash flow growth
Commitment to Deleveraging and
Achieving an IG Rating
~$13B gross debt paydown since the EMC transaction
and robust cash flow
Financial Policy & Objectives
Prudent Capital Allocation Plan
Any potential future capital return program will reflect
commitment to achieving and maintaining investment
grade metrics
Gain Access to Public Markets
Exchange of DVMT at a significant premium for Dell
Technologies Class C creates a newly publicly traded
security with significant float

24
128 128 128
0 125 184
247 181 0
115 173 8
247 107 16
0 0 0
Financial Guidance on Non-GAAP Revenue / Income
‒ [ ]
Non-
GAAP
Revenue
Non-GAAP Operating Income
Non-GAAP Net Income
Total
ISG Growth
CSG Growth
10% – 12%
7% – 10%
$4.5B – 4.8B
$8.1B – 8.4B
$86.5B - 88.5B
~5 – 7pts Mainstream Server growth premium vs. market
~8 – 9pts External Storage growth premium vs. market
~115 – 145bps annual Client unit share gain
Net income to grow more quickly than
operating income
~12% of Revenue in FY23
4 – 6% CAGR
at current market projections
FY2019 Guidance
Long Term Targets
Note: Client unit share expectations excluding Chrome; Mainstream Server revenue per CY17 IDC forecast reports and ISG internal analysis; Total External Storage per CY17 IDC performance and ISG internal analysis; Internal analysis directionally adjusts IDC reporting to Dell Technologies’ product taxonomy; All IDC reporting on a CY basis, not adjusted for Dell Technologies’ FY convention; Revenue and financials represented on a Non-GAAP basis.

25
128 128 128
0 125 184
247 181 0
115 173 8
247 107 16
0 0 0
Illustrative Value Framework
Source: Public filings, Bloomberg market data as of 29-Jun-2018; reflects fully diluted market capitalization; Pivotal share price of $24.27, Secureworks share price of $12.45 and
VMware share price of $146.97. See appendix for reconciliation of GAAP to Non-GAAP measures. 1 Cash flow from operations less capital expenditures and less capitalized software. 2 Financials derived from respective public filings and are different from the business unit financials as reflected in Dell Technologies' public filings.
Publicly
Traded
Subsidiaries
Current Market
Capitalization
Current Dell Technologies
Economic Stake
$62B
$7.3B
$1.0B
$49B
$3.2B
$0.9B
$53B
Current Dell Tech.
Economic Stake in
Public Subsidiaries
Dell
Technologies
(Excluding
Publicly Traded
Subsidiaries)
($ in billions)
TTM Non-GAAP
Revenue Net Income
Free Cash
Flow¹
Consolidated Dell Technologies $ 83.5 $ 4.8 $ 6.1
(-) VMware2 8.1 2.2 3.3
(-) Pivotal2 0.5 (0.1) (0.1)
(-) Secureworks2 0.5 (0.0) (0.0)
Dell Tech. (excl. Public Subs) $ 74.4
$ 2.7 $ 3.0
$4.7B FCF before increase in DFS
financing receivables
(unadjusted for special dividend)
Represents levered
free cash flow after tax
and debt service
~18%+ Q1 YoY

26
128 128 128
0 125 184
247 181 0
115 173 8
247 107 16
0 0 0
Illustrative Implied Valuation Multiple
Source: Public filings, Bloomberg market data as of 29-Jun-2018; reflects fully diluted market capitalization for publicly traded companies; see appendix for footnotes
(1) For illustrative purposes only and assumes that each share of DVMT receives Class C shares with a value of $109, or $79.77 per Class C share, based on an exchange ratio per Class C common stock to DVMT share of 1.3665:1. We make no
representation as to the actual trading value of the Class C shares as such value will be determined by the market and could be volatile. The opening price of the Class C common stock upon listing on the New York Stock Exchange and its
trading price thereafter will depend on various factors, including, among others, general economic, market or political conditions, issuances of additional debt or equity securities by Dell Technologies, future operating results of Dell Technologies,
failure to meet analysts’ earnings estimates, publication of research reports about our industry, litigation and government investigations, changes or proposed changes in laws or regulations or differing interpretations or enforcement thereof
affecting our business, changes in market valuations of similar companies or speculation in the press or investment community, announcements by our competitors of significant contracts, acquisitions, dispositions, strategic partnerships, joint
ventures or capital commitments, and adverse publicity about our industry or individual scandals. Many of these factors are not within Dell Technologies’ control. We cannot assure you that the Class C common stock will trade at $79.77 or above
or, even if such trading price is achieved, that it will continue to trade at or above such price.
(2) Assumes any excess cash is used for share repurchases. Dell Technologies may elect to use such excess cash for debt paydown instead.
(3) See appendix for reconciliation to nearest GAAP measure.
(4) Reflects increase in DFS accounts receivables balance.
Max. Cash Zero Cash
Election Election
Illustrative Value of DVMT Per Share ($) (1) $109.00 $109.00 A
(x) Total DVMT Shares (M) 199.4 199.4 B
(=) Illustrative Value of Total DVMT Consideration ($B) $21.7 $21.7 C = A * B
(-) Illustrative DVMT Cash Election ($B) $9.0 – D
(=) Illustrative Value of DVMT Stock Consideration ($B) $12.7 $21.7 E = C – D
(/) PF Ownership in Dell Technologies (Fully-Diluted) 21% 31% F
(=) Implied PF Equity Value of Dell Technologies ($B) (1) $61.1 $70.1 G = E / F
Value of Dell Technologies' Equity Stake in VMware ($B) $48.6 $48.6 H
Value of Dell Technologies' Equity Stake in Pivotal ($B) 3.2 3.2 I
Value of Dell Technologies' Equity Stake in Secureworks ($B) 0.9 0.9 J
(=) Value of Equity Ownership in Publicly Traded Subsidiaries ($B) $52.7 $52.7 K = H + I + J
(-) VMware Dividend Paid to Dell Technologies (Reduction in Value of Publicly Traded Subsidiaries) ($B) $9.0 $9.0 L
(=) Value of Equity Ownership in Publicly Traded Subsidiaries Pro Forma for Dividend ($B) $43.7 $43.7 M = K – L
(-) Excess Cash from VMware Dividend at Dell Technologies (Assumes Used for Share Repurchase) ($B) (2) – $9.0 N
(=) Implied PF Equity Value of Dell Technologies, excluding Public Subsidiaries ($B) $17.5 $17.5 O = G – M – N
Implied Valuation Multiples (excluding public subsidiaries): Metric ($B) Implied Multiples
LTM Non-GAAP Net Income (excluding public subsidiaries) (3) $2.7 (i) 6.5x 6.5x = O / (i)
LTM Free Cash Flow (excluding public subsidiaries) (3) $3.0 (ii) 5.9x 5.9x = O / (ii)
LTM Free Cash Flow Before Increase in DFS Financing Receivables (excluding public subsidiaries) (3) (4) $4.7 (iii) 3.7x 3.7x = O / (iii)

27
128 128 128
0 125 184
247 181 0
115 173 8
247 107 16
0 0 0
Committed Long-Term Stockholders
Michael Dell will continue to serve as Chairman and CEO
Michael remains a committed stockholder and will beneficially own
~47 – 54% of Dell Technologies on a fully diluted basis
Michael’s shares will be subject to 180-day lockup period
Silver Lake remains a committed long-term partner with Michael Dell
and will beneficially own ~16 – 18% of Dell Technologies on a fully
diluted basis
Silver Lake shares will be subject to 180-day lockup period

28
128 128 128
0 125 184
247 181 0
115 173 8
247 107 16
0 0 0
Michael Dell Closing Thoughts

29
128 128 128
0 125 184
247 181 0
115 173 8
247 107 16
0 0 0
Appendix: Supplementary Materials
30
128 128 128
0 125 184
247 181 0
115 173 8
247 107 16
0 0 0
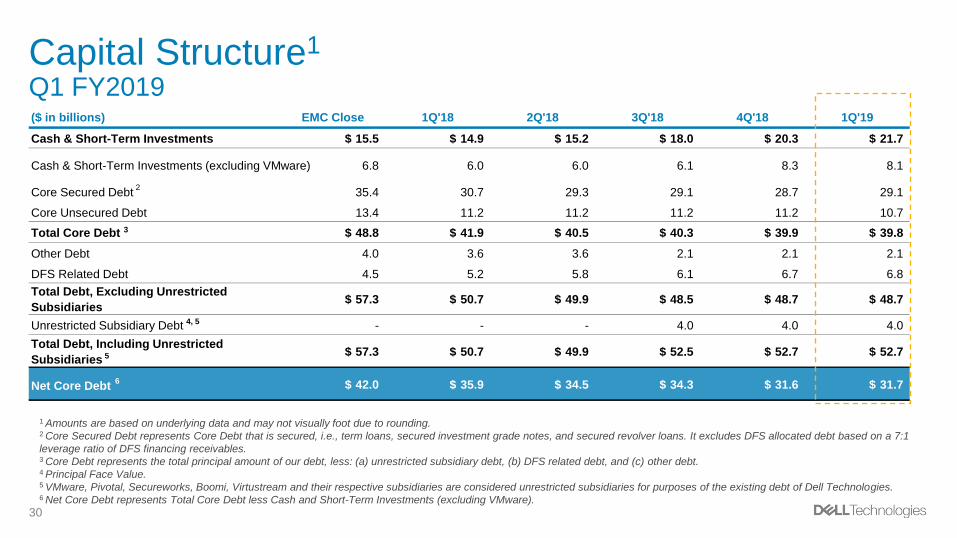
($ in billions) EMC Close 1Q'18 2Q'18 3Q'18 4Q'18 1Q'19
Cash & Short-Term Investments $ 15.5 $ 14.9 $ 15.2 $ 18.0 $ 20.3 $ 21.7
Cash & Short-Term Investments (excluding VMware) 6.8 6.0 6.0 6.1 8.3 8.1
Core Secured Debt 35.4 30.7 29.3 29.1 28.7 29.1
Core Unsecured Debt 13.4 11.2 11.2 11.2 11.2 10.7
Total Core Debt $ 48.8 $ 41.9 $ 40.5 $ 40.3 $ 39.9 $ 39.8
Other Debt 4.0 3.6 3.6 2.1 2.1 2.1
DFS Related Debt 4.5 5.2 5.8 6.1 6.7 6.8
Total Debt, Excluding Unrestricted
Subsidiaries $ 57.3 $ 50.7 $ 49.9 $ 48.5 $ 48.7 $ 48.7
Unrestricted Subsidiary Debt - - - 4.0 4.0 4.0
Total Debt, Including Unrestricted
Subsidiaries $ 57.3 $ 50.7 $ 49.9 $ 52.5 $ 52.7 $ 52.7
Net Core Debt $ 42.0 $ 35.9 $ 34.5 $ 34.3 $ 31.6 $ 31.7
Capital Structure1
Q1 FY2019
1 Amounts are based on underlying data and may not visually foot due to rounding. 2 Core Secured Debt represents Core Debt that is secured, i.e., term loans, secured investment grade notes, and secured revolver loans. It excludes DFS allocated debt based on a 7:1
leverage ratio of DFS financing receivables. 3 Core Debt represents the total principal amount of our debt, less: (a) unrestricted subsidiary debt, (b) DFS related debt, and (c) other debt. 4 Principal Face Value. 5 VMware, Pivotal, Secureworks, Boomi, Virtustream and their respective subsidiaries are considered unrestricted subsidiaries for purposes of the existing debt of Dell Technologies. 6 Net Core Debt represents Total Core Debt less Cash and Short-Term Investments (excluding VMware).
2
3
4, 5
5
6

31
128 128 128
0 125 184
247 181 0
115 173 8
247 107 16
0 0 0
GAAP to Non-GAAP Reconciliation Summary Overview
Ex. Public Subs VMW PVTL SCWX Dell Technologies Consolidated
($ in millions) Calculated Core Dell Q1 FY19 TTM
GAAP Net revenue 73,267 8,105 544 480 82,396
Impact of purchase accounting 1,101 - - - 1,101
Non-GAAP Net revenue 74,368 8,105 544 480 83,497
GAAP Operating income / (loss) (2,885) 1,823 (153) (82) (1,297)
Amortization of intangibles 6,549 139 10 28 6,726
Impact of purchase accounting 1,343 - - 2 1,345
Transaction related 403 74 - - 477
Other corporate expenses 389 686 33 14 1,122
Non-GAAP Operating income / (loss) 5,799 2,722 (110) (38) 8,373
GAAP Net income / (loss) (3,444) 1,356 (144) (29) (2,261)
Amortization of intangibles 6,549 139 10 28 6,726
Impact of purchase accounting 1,343 - - 2 1,345
Transaction related 1,225 (748) - - 477
Other corporate expenses 389 686 33 14 1,122
Aggregate adjustment for taxes (3,393) 809 - (42) (2,626)
Non-GAAP Net income / (loss) 2,669 2,242 (101) (27) 4,783
GAAP Net income / (loss) (3,444) 1,356 (144) (29) (2,261)
Interest and other, net 3,137 (885) (2) 1 2,251
Income tax (benefit) / expense (2,577) 1,352 (7) (55) (1,287)
Depreciation and amortization 7,916 356 22 42 8,336
Stock-based compensation 99 686 33 15 833
Impact of purchase accounting 1,138 - - 1 1,139
Transaction-related expenses 403 74 - - 477
Other corporate expenses 234 - - - 234
Adjusted EBITDA 6,906 2,939 (98) (25) 9,722
CFOps 4,293 3,529 (108) 3 7,717
Capex (943) (275) (9) (13) (1,240)
Cap SW expense (369) - - - (369)
Free Cash Flow 2,981 3,254 (117) (10) 6,108
Q1 FY19 TTM
Note: Data sourced from public filings or derived from public filings. Results are based on underlying data and may not visually foot.

32
128 128 128
0 125 184
247 181 0
115 173 8
247 107 16
0 0 0
GAAP to Non-GAAP Reconciliation (Cont’d) Dell Technologies Consolidated
($ in millions) FY18 + Q1 FY19 - Q1 FY18 TTM
GAAP Net revenue 79,040 21,356 18,000 82,396
Impact of purchase accounting 1,269 187 355 1,101
Non-GAAP Net revenue 80,309 21,543 18,355 83,497
GAAP Operating income / (loss) (2,416) (153) (1,272) (1,297)
Amortization of intangibles 6,980 1,522 1,776 6,726
Impact of purchase accounting 1,546 222 423 1,345
Transaction related 502 166 191 477
Other corporate expenses 1,160 269 307 1,122
Non-GAAP Operating income / (loss) 7,772 2,026 1,425 8,373
GAAP Net income / (loss) (2,926) (538) (1,203) (2,261)
Amortization of intangibles 6,980 1,522 1,776 6,726
Impact of purchase accounting 1,546 222 423 1,345
Transaction related 502 166 191 477
Other corporate expenses 1,160 269 307 1,122
Aggregate adjustment for taxes (2,892) (467) (733) (2,626)
Non-GAAP Net income / (loss) 4,370 1,174 761 4,783
GAAP Net income / (loss) (2,926) (538) (1,203) (2,261)
Interest and other, net 2,353 470 572 2,251
Income tax (benefit) / expense (1,843) (85) (641) (1,287)
Depreciation and amortization 8,634 1,914 2,212 8,336
Stock-based compensation 835 199 201 833
Impact of purchase accounting 1,274 222 357 1,139
Transaction-related expenses 502 166 191 477
Other corporate expenses 305 35 106 234
Adjusted EBITDA 9,134 2,383 1,795 9,722
CFOps 6,843 1,159 285 7,717
Capex (1,212) (273) (245) (1,240)
Cap SW expense (369) (89) (89) (369)
Free Cash Flow 5,262 797 (49) 6,108
Note: Data sourced from public filings or derived from public filings. Results are based on underlying data and may not visually foot.

33
128 128 128
0 125 184
247 181 0
115 173 8
247 107 16
0 0 0
GAAP to Non-GAAP Reconciliation (Cont’d) Secureworks
($ in millions) FY18 + Q1 FY19 - Q1 FY18 TTM
GAAP Net revenue 468 126 114 480
Impact of purchase accounting - -
Non-GAAP Net revenue 468 126 114 480
GAAP Operating income / (loss) (83) (18) (19) (82)
Amortization of intangibles 28 7 7 28
Impact of purchase accounting 2 - - 2
Transaction related - - - -
Other corporate expenses 13 5 4 14
Non-GAAP Operating income / (loss) (40) (6) (8) (38)
GAAP Net income / (loss) (28) (14) (13) (29)
Amortization of intangibles 28 7 7 28
Impact of purchase accounting 2 - - 2
Transaction related - - - -
Other corporate expenses 13 5 4 14
Aggregate adjustment for taxes (42) (2) (3) (42)
Non-GAAP Net income / (loss) (27) (4) (5) (27)
GAAP Net income / (loss) (28) (14) (13) (29)
Interest and other, net 3 (1) 1 1
Income tax (benefit) / expense (58) (3) (6) (55)
Depreciation and amortization 42 10 10 42
Stock-based compensation 14 5 4 15
Impact of purchase accounting 1 - - 1
Transaction-related expenses - - - -
Other corporate expenses -
Adjusted EBITDA (26) (3) (4) (25)
CFOps 1 (18) (20) 3
Capex (14) (2) (3) (13)
Cap SW expense - - - -
Free Cash Flow (13) (20) (23) (10)
Note: Data sourced from public filings or derived from public filings. Results are based on underlying data and may not visually foot.

34
128 128 128
0 125 184
247 181 0
115 173 8
247 107 16
0 0 0
GAAP to Non-GAAP Reconciliation (Cont’d) Pivotal
($ in millions) FY18 + Q1 FY19 - Q1 FY18 TTM
GAAP Net revenue 509 156 121 544
Impact of purchase accounting - - - -
Non-GAAP Net revenue 509 156 121 544
GAAP Operating income / (loss) (168) (34) (48) (153)
Amortization of intangibles 11 2 3 10
Impact of purchase accounting - - - -
Transaction related - - - -
Other corporate expenses 29 11 6 33
Non-GAAP Operating income / (loss) (129) (21) (40) (110)
GAAP Net income / (loss) (164) (33) (52) (144)
Amortization of intangibles 11 2 3 10
Impact of purchase accounting - - - -
Transaction related - - - -
Other corporate expenses 29 11 6 33
Aggregate adjustment for taxes - - - -
Non-GAAP Net income / (loss) (124) (20) (43) (101)
GAAP Net income / (loss) (164) (33) (52) (144)
Interest and other, net (2) (0) (1) (2)
Income tax (benefit) / expense (3) (1) 4 (7)
Depreciation and amortization 22 5 5 22
Stock-based compensation 29 11 6 33
Impact of purchase accounting - - - -
Transaction-related expenses - - - -
Other corporate expenses - - - -
Adjusted EBITDA (117) (18) (37) (98)
CFOps (116) 4 (4) (108)
Capex (13) (2) (5) (9)
Cap SW expense - - - -
Free Cash Flow (129) 3 (10) (117)
Note: Data sourced from public filings or derived from public filings. Results are based on underlying data and may not visually foot.

35
128 128 128
0 125 184
247 181 0
115 173 8
247 107 16
0 0 0
GAAP to Non-GAAP Reconciliation (Cont’d) VMware
($ in millions) FY18 + Q1 FY19 - Q1 FY18 TTM
GAAP Net revenue 7,862 2,008 1,765 8,105
Impact of purchase accounting - - - -
Non-GAAP Net revenue 7,862 2,008 1,765 8,105
GAAP Operating income / (loss) 1,702 382 261 1,823
Amortization of intangibles 132 38 31 139
Impact of purchase accounting - - - -
Transaction related 132 15 73 74
Other corporate expenses 689 163 166 686
Non-GAAP Operating income / (loss) 2,655 598 531 2,722
GAAP Net income / (loss) 659 942 245 1,356
Amortization of intangibles 132 38 31 139
Impact of purchase accounting - - - -
Transaction related 89 (761) 76 (748)
Other corporate expenses 689 163 166 686
Aggregate adjustment for taxes 597 134 (78) 809
Non-GAAP Net income / (loss) 2,166 516 440 2,242
GAAP Net income / (loss) 659 942 245 1,356
Interest and other, net (112) (793) (20) (885)
Income tax (benefit) / expense 1,155 233 36 1,352
Depreciation and amortization 336 156 136 356
Stock-based compensation 689 163 166 686
Impact of purchase accounting - - - -
Transaction-related expenses 132 15 73 74
Other corporate expenses - - - -
Adjusted EBITDA 2,859 716 636 2,939
CFOps 3,211 1,095 777 3,529
Capex (263) (61) (49) (275)
Cap SW expense - - - -
Free Cash Flow 2,948 1,034 728 3,254
Note: Data sourced from public filings or derived from public filings. Results are based on underlying data and may not visually foot.
36
128 128 128
0 125 184
247 181 0
115 173 8
247 107 16
0 0 0
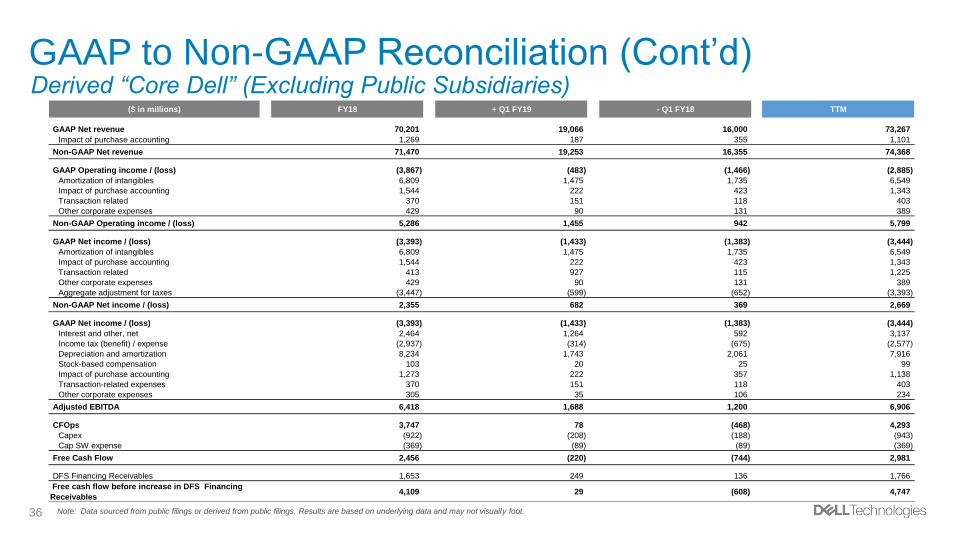
GAAP to Non-GAAP Reconciliation (Cont’d) Derived “Core Dell” (Excluding Public Subsidiaries)
($ in millions) FY18 + Q1 FY19 - Q1 FY18 TTM
GAAP Net revenue 70,201 19,066 16,000 73,267
Impact of purchase accounting 1,269 187 355 1,101
Non-GAAP Net revenue 71,470 19,253 16,355 74,368
GAAP Operating income / (loss) (3,867) (483) (1,466) (2,885)
Amortization of intangibles 6,809 1,475 1,735 6,549
Impact of purchase accounting 1,544 222 423 1,343
Transaction related 370 151 118 403
Other corporate expenses 429 90 131 389
Non-GAAP Operating income / (loss) 5,286 1,455 942 5,799
GAAP Net income / (loss) (3,393) (1,433) (1,383) (3,444)
Amortization of intangibles 6,809 1,475 1,735 6,549
Impact of purchase accounting 1,544 222 423 1,343
Transaction related 413 927 115 1,225
Other corporate expenses 429 90 131 389
Aggregate adjustment for taxes (3,447) (599) (652) (3,393)
Non-GAAP Net income / (loss) 2,355 682 369 2,669
GAAP Net income / (loss) (3,393) (1,433) (1,383) (3,444)
Interest and other, net 2,464 1,264 592 3,137
Income tax (benefit) / expense (2,937) (314) (675) (2,577)
Depreciation and amortization 8,234 1,743 2,061 7,916
Stock-based compensation 103 20 25 99
Impact of purchase accounting 1,273 222 357 1,138
Transaction-related expenses 370 151 118 403
Other corporate expenses 305 35 106 234
Adjusted EBITDA 6,418 1,688 1,200 6,906
CFOps 3,747 78 (468) 4,293
Capex (922) (208) (188) (943)
Cap SW expense (369) (89) (89) (369)
Free Cash Flow 2,456 (220) (744) 2,981
DFS Financing Receivables 1,653 249 136 1,766
Free cash flow before increase in DFS Financing
Receivables 4,109 29 (608) 4,747
Note: Data sourced from public filings or derived from public filings. Results are based on underlying data and may not visually foot.