Dell Technologies Securities Analyst Meeting
71
Dell Technologies Securities Analyst Meeting September 23, 2021
Transcript of Dell Technologies Securities Analyst Meeting

Dell Technologies Securities Analyst MeetingSeptember 23, 2021

Kick OffRob Williams, Senior Vice President, Investor Relations
Securities Analyst Meeting
September 23, 2021

© Copyright 2021 Dell Inc.3
NON-GAAP FINANCIAL MEASURES This presentation includes information about non-GAAP revenue, non-GAAP
gross margin, non-GAAP operating expenses, non-GAAP operating income,
non-GAAP cash flow from operations, non-GAAP income tax, non-GAAP net
income, non-GAAP net income attributable to Dell Technologies Inc., non-
GAAP earnings per share – basic, non-GAAP earnings per share – diluted,
free cash flow and adjusted free cash flow (collectively the “non-GAAP
financial measures”), which are not measurements of financial performance
prepared in accordance with U.S. generally accepted accounting principles.
We have provided a reconciliation of the non-GAAP financial measures to the
most directly comparable GAAP measures in the slides captioned
“Supplemental non-GAAP measures.”
SPECIAL NOTE ON FORWARD-LOOKING STATEMENTS Statements in this presentation that relate to future results and events are
forward-looking statements and are based on Dell Technologies' current
expectations. In some cases, you can identify these statements by such
forward-looking words as “anticipate,” “believe,” “could,” “estimate,” “expect,”
“intend,” “confidence,” “may,” “plan,” “potential,” “should,” “will” and “would,”
or similar expressions. Actual results and events in future periods may differ
materially from those expressed or implied by these forward-looking
statements because of a number of risks, uncertainties and other factors,
including those discussed in Dell Technologies’ periodic reports filed with the
Securities and Exchange Commission. Dell Technologies assumes no
obligation to update its forward-looking statements.
NoteSlides 38 – 42 have been updated for clarity ; long term growth expectations
reflect a four year CAGR, from FY22-26.
DisclaimerPRO FORMA FINANCIAL MEASURES Pro forma financial measures represent current estimated management pro forma
financial measures. Pro forma financial measures are computed assuming the
VMware spin-off transaction occurred at the beginning of each fiscal year and
include adjustments for discontinued operations related to VMware and material
nonrecurring charges and credits which result directly from the transaction.
Material non-recurring charges are reflected in Q1FY21 only. Final pro forma
financial statements, presented in accordance with Regulation S-X Article 11, will
be available later in the year; amounts are subject to change with no obligation to
reconcile these estimates. Diluted EPS includes certain share conversion ratio
assumptions. Final share conversion ratio will be available at the close of the
VMware spin-off transaction.
PRO FORMA NON-GAAP FINANCIAL MEASURES
This presentation includes information about pro forma non-GAAP revenue, pro
forma non-GAAP gross margin, pro forma non-GAAP operating expenses, pro
forma non-GAAP selling, general, and administrative expenses, pro forma non-
GAAP research and development expenses, pro forma non-GAAP operating
income, pro forma non-GAAP interest and other, net, pro forma non-GAAP income
tax, pro forma non-GAAP net income, pro forma non-GAAP net income
attributable to non-controlling interests, pro forma non-GAAP net income
attributable to Dell Technologies Inc., pro forma non-GAAP earnings per share
attributable to Dell Technologies Inc. – basic, and pro forma non-GAAP earnings
per share attributable to Dell Technologies Inc. – diluted (collectively the “pro
forma non-GAAP financial measures”), which are not measurements of financial
performance prepared in accordance with U.S. generally accepted accounting
principles. We have provided a reconciliation of the pro forma non-GAAP financial
measures to the most directly comparable pro forma GAAP measures in the slides
captioned “Supplemental pro forma non-GAAP measures.”

© Copyright 2021 Dell Inc.4
VMware transaction updateExpect to close early Nov., Contingent upon closing conditions including favorable private letter ruling from IRS
• No change to the number of Dell basic shares outstanding
• Shareholders will have economic interest in Dell excluding
VMware + $9.3B2
from VMware special dividend
Key Implied Statistics2
• Implied value $51 per share3
• We expect 22-24M incremental diluted shares4
• ~8x 2Q22 TTM P/E multiple5
• ~6x 2Q22 EV6
/ TTM unlevered adj. FCF multiple
• 1.9x 2Q22 Core Leverage Ratio adj. for FY22 expected
debt repayment7
• Shareholders will receive approximately .44 shares of
VMware for each Dell share8
• Value of VMware distribution is equal to $501 per share of
Dell
1) As of close on Sept. 17, 2021 and for illustrative purposes only. Dell share price was $100.53 (VMware share price was $139.67). $50 = ($139.67 - $27.46 [impact of special dividend]) x .44; 2) Assumes VMware special dividend of $11.5B modeled as accretive or dilutive directly against market cap and Dell
maintains 80.6% ownership of VMware at close for illustrative purposes; 3) Estimated by taking current Dell Technologies share price less estimated VMware distribution value. ($101 - $50) and excludes any share dilution impact; 4) Considering adjustment to outstanding employee equity awards; 5) Estimated
using implied total Dell Technologies market cap less Dell ownership of VMware and 2Q22 TTM Dell Technologies Net Income excluding VMware; 6) Estimated using implied total Dell Technologies market cap less Dell ownership of VMware and remaining FY22 Net Debt paydown according to guidance; 7)
2Q Core leverage ratio adjusted for FY22 expected debt paydown of $16B. Core leverage ratio calculated using Core debt as numerator and Core Adj. EBITDA as denominator. Core Adj. EBITDA calculated using Dell Technologies consolidated Adjusted EBITDA less 19% of VMware EBITDA less DFS
estimated EBITDA. DFS estimated EBITDA calculated as a 4% return on assets comprised of financing receivables and DFS operating lease balance. 4% return on assets is derived from a peer benchmark analysis and is an indicative proxy for DFS EBITDA.
8) Final dividend ratio to be determined based on shares outstanding
Dell Technologies Equity Ownership (Illustrative)
• Each Class A, B and C share has the same economic interest in broader Dell Technologies including its current pro-rata interest in VMware
• Current Dell Class C price is $1011

© Copyright 2021 Dell Inc.5
Dell Technologies Securities Analyst MeetingSeptember 23, 2021
Company Vision
Executing our Strategy
Infrastructure Solutions Group Strategy
Client Solutions Group Strategy
Agenda
Q&A
Michael Dell
Jeff Clarke and Chuck Whitten
Jeff Boudreau
Sam Burd
Value Creation Framework Tom Sweet
Dell Executive Team

Company visionMichael Dell, Chairman and Chief Executive Officer
Securities Analyst Meeting
September 23, 2021
© Copyright 2021 Dell Inc.7
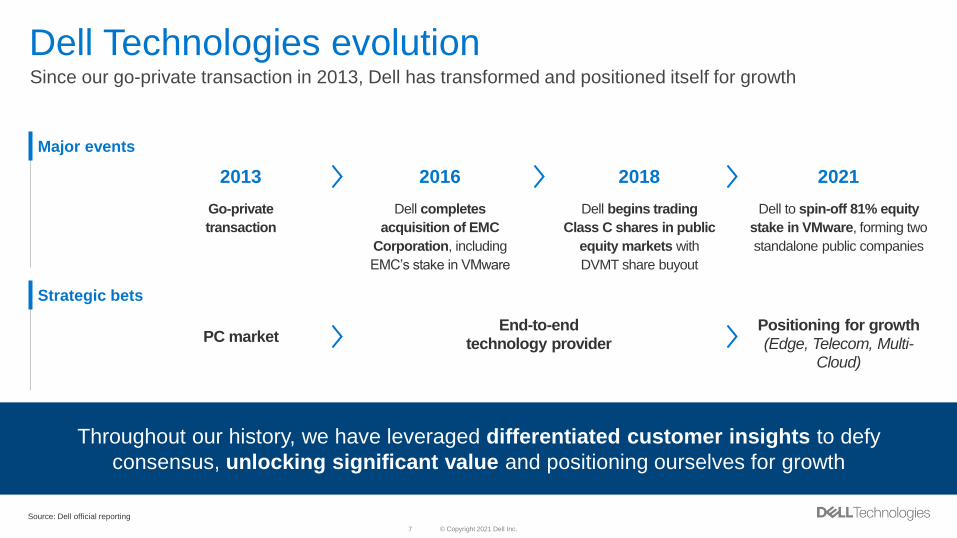
Since our go-private transaction in 2013, Dell has transformed and positioned itself for growth
Dell Technologies evolution
Source: Dell official reporting
Major events
Strategic bets
Dell begins trading
Class C shares in public
equity markets with
DVMT share buyout
Dell to spin-off 81% equity
stake in VMware, forming two
standalone public companies
Go-private
transaction
Dell completes
acquisition of EMC
Corporation, including
EMC’s stake in VMware
2013 2016 2018 2021
PC marketEnd-to-end
technology providerPositioning for growth (Edge, Telecom, Multi-
Cloud)
Throughout our history, we have leveraged differentiated customer insights to defy
consensus, unlocking significant value and positioning ourselves for growth

© Copyright 2021 Dell Inc.8
Multi-cloud ecosystemDell Technologies sits at the center of the multi-cloud ecosystem
Source: 1) Flexera 2021 State of the Cloud report; 2) Rightscale (Flexera) 2016 State of the Cloud report; 3) Dell Multi -Cloud Sprawl E-Book; Disclaimer: ESG Research Insights Paper “The Cloud Complexity Imperative:
Why Organizations Must Unify and Simplify the Management of their Sprawling Multicloud Environment” commissioned by Dell Technologies, VMware and Intel Corporation, February 2020
Dell Technologies has an integral role to play in the dynamic multi-cloud ecosystem of the future
Of companies
leverage multiple
clouds1
Clouds are used by
businesses on
average3
Of companies
leverage hybrid
cloud environments,
up from 55% five
years ago1,2
92% 582%

© Copyright 2021 Dell Inc.9
Extended Dell market:
$650B growing 8% to
2024E
Dell industry position$2T TAM growing GDP to GDP+ as digital transformation drives broad, sustained technology investment
Core Dell market:
$670B growing 3%
to 2024E
2020 Global IT market
Served Addressable Market
6% CAGR 2020-2024E(vs. GDP of 3%)
Note: PC includes PC and Tablet
Source: Dell CSG TAM estimate (PC, Peripherals); Dell ISG TAM estimate (Server, Storage, IT Networking); OECD Economic Outlook 2021 (GDP growth rate); IDC Worldwide ICT Spending Guide 2020 data
(remaining); excludes from ICT Spending Guide categories far out of the scope of Dell’s business (e.g., mobile phone hardware , telecom services, BPO services)

Executing our strategyJeff Clarke, Vice Chairman and Co-Chief Operating OfficerChuck Whitten, Co-Chief Operating Officer
Securities Analyst MeetingSeptember 23, 2021

© Copyright 2021 Dell Inc.11
Executing our strategyExecutive Summary
Realizing our vision requires consolidating and modernizing the Core while
building new growth businesses
In our Core, we have leadership positions in IT infrastructure / PC markets and
have a proven track record of taking share
Our unique and durable competitive advantages include our go-to-market
scale, our services footprint, and our industry-leading supply chain
We have a repeatable process for turning customer insights into
innovation, leveraging the strength in our Core to fuel new growth areas

© Copyright 2021 Dell Inc.12
Dell Technologies strategy
Build new growth businesses
where we have a unique right to win
Edge Telecom Multi-Cloud
Service
Delivery
Data Mgmt.
Consolidate and modernize the
Core business
APEX
Compute &
Networking
PC Storage
#1 positions in
CSG and ISG
Largest GTM
and Channel
ecosystem
Leading
financial services
capabilities
First & best
VMware alliance
Leading global
services footprint
Industry-leading
scale and supply
chain
C O M P E T I T I V E D I F F E R E N T I A T O R S
E2E product
and Multi-Cloud
offerings
Other New
Businesses (e.g., Security
& AI/ML)
Win in
Core
Win in
growth
areas

© Copyright 2021 Dell Inc.13
Dell Technologies strategy
Build new growth businesses
where we have a unique right to win
Edge Telecom Multi-Cloud
Service
Delivery
Data Mgmt.
Consolidate and modernize the
Core business
APEX
Compute &
Networking
PC Storage
#1 positions in
CSG and ISG
Largest GTM
and Channel
ecosystem
Leading
financial services
capabilities
First & best
VMware alliance
Leading global
services footprint
Industry-leading
scale and supply
chain
C O M P E T I T I V E D I F F E R E N T I A T O R S
E2E product
and Multi-Cloud
offerings
Other New
Businesses (e.g., Security
& AI/ML)
Win in
Core
Win in
growth
areas

© Copyright 2021 Dell Inc.14
Dell Technologies industry positionLeadership positions in the Core infrastructure and PC markets
$33B FY21 Revenue1 $48B FY21 Revenue1
Infrastructure Solutions Group (ISG) Client Solutions Group (CSG)
Note: Leading positions based on market share figures calculated on trailing twelve-month calendar period Q3 2020-Q2 2021
Source: 1) Dell FY21 10-K; 2) IDC Quarterly Enterprise Storage Systems Tracker, 2021Q2, based on revenue; 3) IDC Quarterly Server Tracker, 2021Q2, based on revenue, Mainstream Server is: Large System, Standard Rack and Tower; 4) IDC
Quarterly Converged Systems Tracker 2021Q2, based on revenue; 5) Client PC & upsell revenue statistic calculated by Dell Technologies primarily by utilizing other PC OEMs’ financial public filings, as of Q2 FY22;
6) IDC PCD Tracker 2021Q2; NA Commercial PCs includes USA and Canada, and excludes Chrome OS and tablets, based on units; 7) IDC PC Monitor Tracker 2021Q2, based on units
Client Solutions Revenue5
North America Commercial PC6
Commercial Displays7
External Storage and Data
Protection2
Mainstream Server3
HCI4
© Copyright 2021 Dell Inc.15
Dell Technologies Core markets
24%
28%
28%
Commercial
PC unit
share1
Mainstream
Server revenue
share2
External Storage
revenue
share3
We have leadership positions and room to grow
Note: All market share figures based on trailing twelve-month calendar period Q3 2020-Q2 2021
Source: 1) IDC PCD Tracker 2021Q2 excludes Chrome OS and tablets, based on units; 2) IDC Quarterly Server Tracker, 2021Q2, based on revenue; 3) IDC Quarterly Enterprise Storage Systems Tracker, 2021Q2, based on revenue; 4) IDC Quarterly
Converged Systems Tracker 2021Q2, based on revenue; 5) Share gain calculated comparing trailing twelve-month calendar period Q3 2020-Q2 2021 to trailing twelve-month calendar period Q3 2015-Q2 2016
+5.4
pts.Commercial PC
unit share gain1
+5.6
pts.Mainstream
Server revenue
share gain2
Current Core market share positions Last 5-year share gains5
+18.1
pts.HCI revenue
share gain4

© Copyright 2021 Dell Inc.16
Tech’s largest direct go-to-market and channel
ecosystem creates unparalleled market reach
Leading global services footprint in technology to support complex customer
needs, powered by modern, predictive software
Industry-leading scale and differentiated supply chain enables cost position, speed, continuity of supply, security, and sustainability
Dell competitive advantages
#1 positions in
CSG and ISG
Largest GTM
and Channel
ecosystem
Leading
financial services
capabilities
First & best
VMware alliance
Leading global
services footprint
Industry-leading
scale and supply
chain
C O M P E T I T I V E D I F F E R E N T I A T O R S
E2E product
and Multi-Cloud
offerings

© Copyright 2021 Dell Inc.17
Dell Technologies strategy
Build new growth businesses
where we have a unique right to win
Edge Telecom Multi-Cloud
Service
Delivery
Data Mgmt.
Consolidate and modernize the
Core business
APEX
Compute &
Networking
PC Storage
#1 positions in
CSG and ISG
Largest GTM
and Channel
ecosystem
Leading
financial services
capabilities
First & best
VMware alliance
Leading global
services footprint
Industry-leading
scale and supply
chain
C O M P E T I T I V E D I F F E R E N T I A T O R S
E2E product
and Multi-Cloud
offerings
Other New
Businesses (e.g., Security
& AI/ML)
Win in
Core
Win in
growth
areas
© Copyright 2021 Dell Inc.18
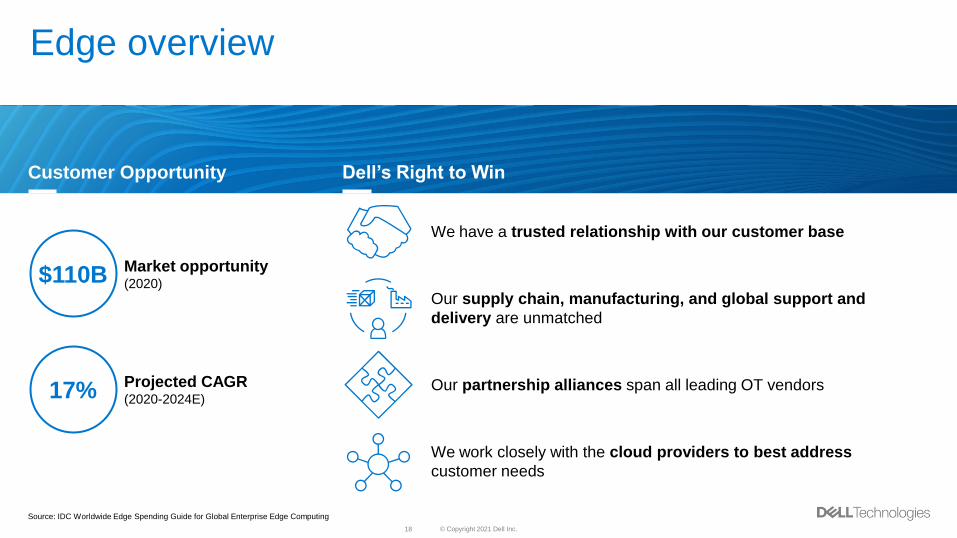
Edge overview
We have a trusted relationship with our customer base
Our supply chain, manufacturing, and global support and
delivery are unmatched
Our partnership alliances span all leading OT vendors
We work closely with the cloud providers to best address
customer needs
$110B
17%
Market opportunity(2020)
Projected CAGR(2020-2024E)
Source: IDC Worldwide Edge Spending Guide for Global Enterprise Edge Computing
Customer Opportunity Dell’s Right to Win

© Copyright 2021 Dell Inc.19
Telecom overview
We are the largest provider of open, software-defined, industry
standard infrastructure
Dell’s engineering, supply chain, and services can anchor the
emerging modern telecom ecosystem
We have new integration and solutions development capabilities
Our strategy and business model allows us to partner across the
vast 5G ecosystem
$114B
2%
Market opportunity(2020)1
Projected CAGR(2020-2024E)1
Source: 1) IDC, Gartner, and numerous telecom-specific industry reports
Customer Opportunity Dell’s Right to Win

© Copyright 2021 Dell Inc.20
Dell Technologies strategy
#1 positions in
CSG and ISG
Largest GTM
and Channel
ecosystem
Leading
financial services
capabilities
First & best
VMware alliance
Leading global
services footprint
Industry-leading
scale and supply
chain
C O M P E T I T I V E D I F F E R E N T I A T O R S
E2E product
and Multi-Cloud
offerings
Consolidate and modernize the
Core business
APEX
Compute &
Networking
PC Storage
Build new growth businesses
where we have a unique right to win
Edge Telecom Multi-Cloud
Service
Delivery
Data Mgmt. Other New
Businesses (e.g., Security
& AI/ML)
Win in
Core
Win in
growth
areas

Infrastructure Solutions Group strategyJeff Boudreau, President
Securities Analyst Meeting
September 23, 2021

© Copyright 2021 Dell Inc.22
ISG key takeawaysExecutive Summary
With our broad portfolio of #1s, innovation and support organizations, ISG is
well-positioned for growth in storage, servers and adjacent opportunities
Our Core TAM is large and growing and we have additional long-term upside
in Telecom, Edge, data management and aaS
We are the partner customers trust to navigate digital transformation including
multi-cloud and the Edge
Our ISG business has been strong and resilient through economic cycles and we
expect to grow the business in 2HFY22, FY22 in total and in FY23
© Copyright 2021 Dell Inc.23
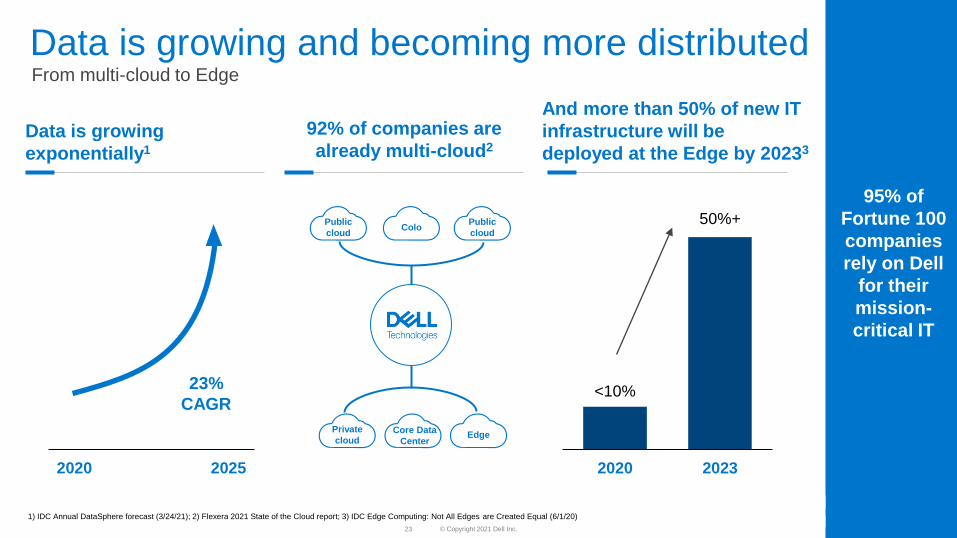
Data is growing and becoming more distributed
Data is growing
exponentially1
92% of companies are
already multi-cloud2
2020 2025
<10%
50%+
2020 2023
And more than 50% of new IT
infrastructure will be
deployed at the Edge by 20233
95% of
Fortune 100
companies
rely on Dell
for their
mission-
critical IT
Public
cloudColo
Public
cloud
From multi-cloud to Edge
23%
CAGR
Private
cloudCore Data
CenterEdge
1) IDC Annual DataSphere forecast (3/24/21); 2) Flexera 2021 State of the Cloud report; 3) IDC Edge Computing: Not All Edges are Created Equal (6/1/20)

© Copyright 2021 Dell Inc.24
HCI 32% share4
TAM is growing
Note: Leading positions based on market share figures calculated on trailing twelve-month calendar period Q3 2020-Q2 2021
1) Dell analysis leveraging external data sources: IDC (Server, Storage); 2) Dell’Oro (Networking); TAM note: Storage includes Core Storage, Data Protection, and HCI; Server is total server less HCI HW 3) IDC Quarterly
Enterprise Storage Systems Tracker, 2021Q2, based on revenue 4) IDC Quarterly Converged Systems Tracker 2021Q2, based on revenue; 5) IDC Quarterly Server Tracker, 2021Q2, based on revenue, Mainstream Server
is: Large System, Standard Rack and Tower
External Storage 28% share3
All-Flash Arrays 33% share3
Mainstream Server 28% share5
High End 44% share3
1
1
2
x86 Server 18% share5
Infrastructure Solutions Group (ISG)Starting from a position of strength, steady financial performance, growing TAM
Leadership positions in Storage / Server
Financial performance (3 year average)
$34B $4B
Revenue Operating Income

© Copyright 2021 Dell Inc.25
Extending our leadership position in Storage
1) IDC Quarterly Storage and Converged Systems Trackers 2021Q2; 2) IDC Quarterly Converged Systems and Enterprise Storage Systems Trackers – 2021Q1 Forecast 3) Rough approximation of market by IDC price
band using 2020 data from IDC Quarterly Enterprise Storage System Tracker 2021Q2
Market leader with simplified Power Portfolio—positioned for growth in 2HFY22 and FY23
Share by
price band
and market
growth
forecast
Power
Portfolio
External
StorageHigh End
~20% of mkt3Midrange
~60% of mkt3Entry
~20% of mkt3HCI
Position1 #1 #1 #1 #1 #1
Market Share (LTM) 1 28% 44% 27% 18% 32%
Dell’s Market Share
relative to #2 Vendor1 2.7x 4.9x 2.2x 1.6x 1.9x
Market GrowthCY21E - CY25E CAGR2
3.1% 0.4% 4.4% 1.1% 10.5%
High
Mid
Entry
VxRail PowerScale PowerProtect
PowerMax
PowerStore
PowerVault
P R I M A R YH Y P E R -
C O N V E R G E D
U N S T R U C -
T U R E D
D A T A
P R O T E C T I O N
PowerFlex
S O F T W A R E -
D E F I N E D

© Copyright 2021 Dell Inc.26
Extending our leadership position in Servers
Mainstream Server Innovation
22.7%
28.3%
5 Years Ago Current
15G Servers
• Adaptive compute
• Advanced automation with built-
in security
• Proactive resilience to protect
against cyber attacks
Telecom Servers (XR11/XR12)
• Designed for compliance with
the rigorous standards of the
Telecom (NEBS) industries
• Made for space constrained
environments
• Support for operation in extreme
temperatures
• Servers & networking reported its
third consecutive quarter of
positive year over year growth
• Servers & networking grew 8%
Y/Y in 1H22 AND demand was
ahead of revenue
• We expect growth in 2HFY22,
FY22 in total and in FY23
Growth
Market leader (#1 in x86 and mainstream), innovator and share consolidator
+5.6 pts. Mainstream
Server revenue share gain1
1) IDC Quarterly Server Tracker, 2021Q2

© Copyright 2021 Dell Inc.27
Multi-cloud ecosystemDell sits at the center of the multi-cloud ecosystem
Of companies leverage multiple
clouds today1
Clouds are used by businesses
on average3
Of companies leverage hybrid
cloud environments, up from
55% five years ago1,2
92%
82%
Public
cloudColo
Public
cloud
Private
cloud
Core Data
CenterEdge
1) Flexera 2021 State of the Cloud report; 2) Rightscale (Flexera) 2016 State of the Cloud report 3) Dell Multi -Cloud Sprawl E-Book; Disclaimer: ESG Research Insights Paper “The Cloud Complexity Imperative: Why
Organizations Must Unify and Simplify the Management of their Sprawling Multicloud Environment” commissioned by Dell Technologies, VMware and Intel Corporation, February 2020
5

Client Solutions Group strategySam Burd, President
Securities Analyst Meeting
September 23, 2021

© Copyright 2021 Dell Inc.29
CSG key takeawaysExecutive Summary
Overall PC industry has reset to a higher level, led by long-term growth of
higher-value segments
Our target PC segments represent the majority of revenue and profit
growth historically and going forward
Delivered consistent P&L growth led by our differentiated direct
sales motion
PC business is a platform to grow in $150B+ adjacent peripherals and services
spaces

© Copyright 2021 Dell Inc.30
Overall PC industry has reset to a higher level
Note: Premium Consumer includes units with ASP > $800; Mainstream Consumer includes units with ASP <= $800
Source: IDC Worldwide PC Tracker 2021 Q2 Final Historical and IDC Worldwide PC Tracker 2021 Q2 Forecast
Unit Growth by Segment
(2016-2024F)Growth CAGR
Chrome
Mainstream
Consumer PCs
Premium
Consumer PCs
Commercial
PCs
~260M units
~350M units
Expansion led by higher-value segments that have a history of stable growth and are where we’re focused

© Copyright 2021 Dell Inc.31
Not all PCs are created equalDell’s target segments drive majority of revenue and profit growth historically and going forward
Chrome
Mainstream
Consumer PCs
Premium
Consumer PCs
Commercial
PCs
Note: Premium Consumer includes units with ASP > $800; Mainstream Consumer includes units with ASP <= $800
Source: IDC Worldwide PC Tracker 2021 Q2 Final Historical and IDC Worldwide PC Tracker 2021 Q2 Forecast
Unit vs. Revenue Mix by Segment
(2021F)
Revenue Dollar Growth by Segment
(2016-2024F)

© Copyright 2021 Dell Inc.32
CSG business delivers consistent P&L growth
+7%CAGR
FY18-FY21
+18%CAGR
FY18-FY21
Source: 1) Client business results (CSG revenue and operating income) compared with other PC OEMs from financial public filings, excluding tablet revenue
Operating
Income
RevenueDirect Customer Relationships
Ongoing
Services
Interactions
Insight-driven
Product and
GTM Design
Telemetry & Operational InsightsOperating Income %
Consumer
Commercial
Premium mixx
Attach Opportunitiesx
Unique Insightsx
Customer Loyalty
Delivered consistent growth and leading profitability1 Led by our differentiated direct sales motion
Heritage built on direct sales that is still a durable advantage for us today

© Copyright 2021 Dell Inc.33
PC is core platform to grow in $150B+ adjacent markets
Services
Support
Deployment
Managed
Services/ End-
point management
Financing
APEX/aaS
Displays
Docks
Webcams
Audio/
headsets
Cables/
adapters
Software & Peripherals
Consulting
Keyboards
& Mice
Software
Cases
We have a proven, strong attach motion to go after incremental Peripherals and Services share
Networking
External
storage
Security

Value Creation FrameworkTom Sweet, Chief Financial Officer
Securities Analyst Meeting
September 23, 2021

© Copyright 2021 Dell Inc.35
Value creation and financial frameworkExecutive Summary
Track record of consistent growth, profitability and shareholder
value creation
Durable competitive advantages provide visibility, scale and service
capabilities unmatched across our industry
Adaptable and focused execution enables us to deliver results in any market
Long-term financial framework delivers durable revenue and EPS growth
Capital allocation policy evolving to deliver broader business investment and
shareholder return
© Copyright 2021 Dell Inc.36
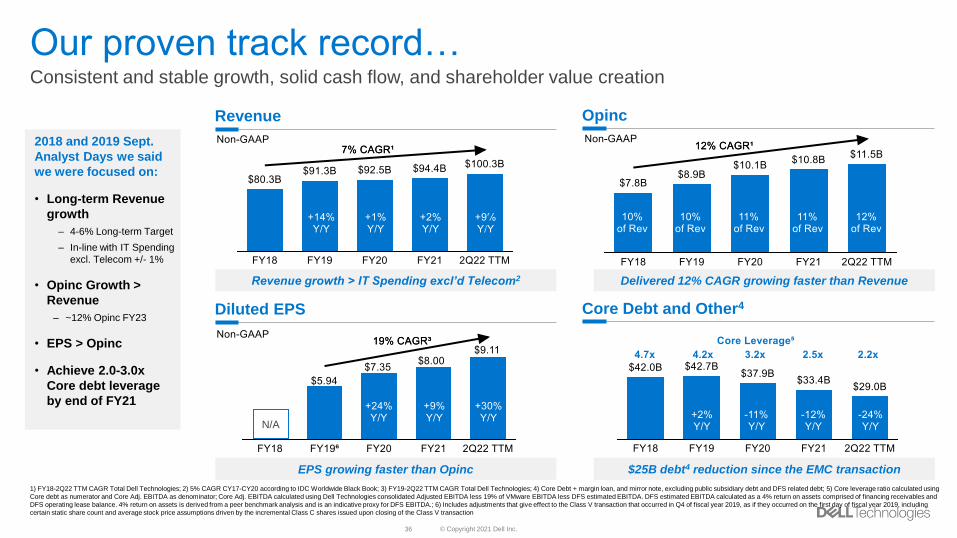
Our proven track record… Consistent and stable growth, solid cash flow, and shareholder value creation
Revenue growth > IT Spending excl’d Telecom2
N/A
Revenue Opinc
Core Debt and Other4Diluted EPS
1) FY18-2Q22 TTM CAGR Total Dell Technologies; 2) 5% CAGR CY17-CY20 according to IDC Worldwide Black Book; 3) FY19-2Q22 TTM CAGR Total Dell Technologies; 4) Core Debt + margin loan, and mirror note, excluding public subsidiary debt and DFS related debt; 5) Core leverage ratio calculated using
Core debt as numerator and Core Adj. EBITDA as denominator; Core Adj. EBITDA calculated using Dell Technologies consolidated Adjusted EBITDA less 19% of VMware EBITDA less DFS estimated EBITDA. DFS estimated EBITDA calculated as a 4% return on assets comprised of financing receivables and
DFS operating lease balance. 4% return on assets is derived from a peer benchmark analysis and is an indicative proxy for DFS EBITDA.; 6) Includes adjustments that give effect to the Class V transaction that occurred in Q4 of fiscal year 2019, as if they occurred on the first day of fiscal year 2019, including
certain static share count and average stock price assumptions driven by the incremental Class C shares issued upon closing of the Class V transaction
2018 and 2019 Sept.
Analyst Days we said
we were focused on:
• Long-term Revenue
growth
‒ 4-6% Long-term Target
‒ In-line with IT Spending
excl. Telecom +/- 1%
• Opinc Growth >
Revenue
– ~12% Opinc FY23
• EPS > Opinc
• Achieve 2.0-3.0x
Core debt leverage
by end of FY21
Delivered 12% CAGR growing faster than Revenue
EPS growing faster than Opinc $25B debt4 reduction since the EMC transaction

© Copyright 2021 Dell Inc.37
We are adapting and delivering results in any market7% Revenue CAGR1 and 12% Opinc CAGR1 delivered through various macro dynamics
Leveraging durable
competitive advantages &
disciplined cost control:
• Industry’s largest direct
sales team and
customer intimacy
provides ability to:‒ Pivot into market
opportunities
‒ Spot trends faster
• Higher margin services,
including DFS
financing
• Our supply chain
excellence & scale
enable navigation of
supply-constrained
environments to meet
customer commitments
• Disciplined cost control
delivered record
operating income and
cash flow through FY21
Navigating through dynamic markets … Commercial and Consumer PC
Server and Networking Opex
1) FY18-2QFY22 TTM CAGR Total Dell Technologies; 2) 4Q21-2Q22; 3) Per IDC PC Units 2QCY16 – 2QCY21 TTM excluding Chrome; 4) Per IDC WW Quarterly Server Tracker 2QCY21,
Data between 2QCY16 – 2QCY21 TTM; 5) Based on non-GAAP EPS. Refer to the appendix in the back for non-GAAP reconciliations for Opex and EPS.
$26.1BNon-GAAP
~560bps Mainstream Server share gain over the past 5 years4 ~$0.70 EPS Benefit 1Q-3Q21 vs 4Q20 Run Rate5
Managing supply chain, delivering record PC shipments2
~540bps Commercial PC unit share gain over the past 5 years3

© Copyright 2021 Dell Inc.38
Proven track record of performance at Core Dell1 …Consistent, profitable growth over time and solid cash flow driven by execution in our CSG & ISG businesses
• 6% CAGR Revenue
growth
• Growing at a premium to
the market9
‒ Over the last 5 years …
‒ ~540bps Commercial PC
‒ ~560bps Mainstream Server
‒ ~200bps Midrange Storage YTD
• 16% Diluted EPS growth
FY19-21
• Strong Cash Flow
N/A
Revenue Estimated Adjusted Free Cash Flow
Diluted EPS Core Debt and Other7
Core Dell1 Performance
1) See Appendix C for more information regarding the calculation of management estimated pro forma revenue and EPS ; estimated adjusted free cash flow, see appendix B slide 58. See Appendix D for reconciliation of these measures to their most directly comparable GAAP measure; 2) FY18-21 CAGR; 3)
FY18 non-GAAP revenue represents Dell Technologies, excluding VMware, including the impact of currently estimated VMware reseller revenue; 4) 5% CAGR CY17-CY20 according to IDC Worldwide Black Book; 5) FY18 – 2Q22 TTM CAGR; 6) FY19-FY21 CAGR; 7) Core Debt + margin loan, and mirror note,
excluding public subsidiary debt and DFS related debt; 8) Core leverage ratio calculated using Core debt as numerator and Core Adj. EBITDA as denominator; Core Adj. EBITDA calculated using Dell Technologies consolidated Adjusted EBITDA less 19% of VMware EBITDA less DFS estimated EBITDA. DFS
estimated EBITDA calculated as a 4% return on assets comprised of financing receivables and DFS operating lease balance. 4% return on assets is derived from a peer benchmark analysis and is an indicative proxy for DFS EBITDA; 9) Per IDC PC Units 2QCY16 – 2QCY21 TTM excluding chrome, Per IDC WW
Quarterly Server Tracker 2QCY21, data between 2QCY16 – 2QCY21 TTM, Per IDC WW Quarterly Enterprise Storage Systems Tracker CY21Q1, Midrange data between 1HCY21 – 1HCY21; 10) See Appendix for more detail around the calculation of FY19 Diluted EPS
Revenue growth > IT Spending excl’d Telecom4 ~$6B Avg. Annual Adj FCF FY18-FY21
EPS growing faster than Revenue $25B debt7 reduction since the EMC transaction

© Copyright 2021 Dell Inc.39
Introducing long-term value creation frameworkDriving 3 - 4% base case Revenue growth compounded annually through FY26
Additional Opportunities and RisksBase Case Revenue Growth & Operational Drivers
Dell
Tech.
CSG
ISG
Base Case
Growth
2 - 3%
CAGR1
Base Case
Growth
3 - 4%
CAGR1
Base Case
Growth
3 - 5%
CAGR1
• Acceleration of key technology trends
• Opportunities to expand into Telecom, Edge, Data
Management and Managed Services
• Significant macroeconomic or geo-political events
• Broadest portfolio in the industry, focused on delivering
customer solutions
• Durable competitive advantages
• Management team with a track record of execution
• Expansion into adjacent growth areas
– Peripheral sales and related attach expansion
– Developing full lifecycle services & APEX / aaS offerings
• Opportunistic growth in mainstream consumer / Chrome
• Market growth lower than expected
• Core Commercial delivers dependable, consistent growth
• Small & Medium business growth
• Premium Consumer / Gaming
• Work from anywhere trends push to NB / Faster Refresh
• Direct model driving large ecosystem around hardware2
• Buyer base expansion
• Further expansion of our multi-cloud solution set
– Edge, Telecom, Data Management, Cyber solutions
• Market growth lower than expected
• Strong track record of Server share gains over time
• Innovation supporting multi-cloud & SW defined– Midrange / HCI support fastest growing market segment
– Consumption-based models to support customers
• Purpose built products / solutions, e.g., Telecom, Edge
1) CAGR FY22-FY26; 2) Attached Services, Peripherals, Software and Dell Financial Services
Non-GAAP
Non-GAAP
Non-GAAP

© Copyright 2021 Dell Inc.40
Introducing long-term value creation frameworkDriving 6+% base case EPS growth compounded annually through FY26, and Adj. FCF > 1x Net Income
Additional Opportunities and RisksBase Case and Operational Drivers
Dell Tech.
Diluted
EPS
Free Cash
Flow
• Revenue and Opinc growth beyond base case
• Interest expense leverage once investment grade
achieved
• Tax policy
• Improved Gross Margin rate driven by innovation
& solutions mix
• P&L leverage through supply chain excellence,
disciplined cost management and industry
leading scale
• Execution of capital allocation in line with today’s
announcement
• Deliver 3 - 4% Revenue growth and 6+% Diluted EPS
growth compounded annually
• Revenue growth and profitability coupled with disciplined
working capital management facilitates cash flow growth
that is faster than revenue
• NI to Adj. FCF Conversion of 100% or better
Base Case FCF ExpectationsEstimated Adjusted Free Cash Flow2
1) CAGR FY22-FY26, EPS projection reflects Dell Technologies expectation post VMW spin and assumes a] the estimated tax rate is based on current enacted tax laws b] diluted share count based on implied Core Dell
share price; 2) Estimated adjusted free cash flow represents historical adjusted free cash flow excluding VMware, adjusted for the impact of cash interest savings associated with the total debt paydown since the EMC
transaction through Fiscal 2022, see appendix B slide 58.
Non-GAAP
6+%
CAGR1
Base Case
Growth
$5.8B average

© Copyright 2021 Dell Inc.41
Balanced approach to Capital AllocationTarget returning 40 - 60% of Adjusted FCF to shareholders… share repurchase & quarterly dividend
What we have done to date:
• $25B1 debt paydown since EMC
transaction
• ~95% FY18-FY21 FCF focused on
debt paydown and goal to achieve
investment grade across all three
rating agencies
• Core business delivers significant
estimated adjusted FCF2 … ~$5.8B
annually FY18-FY21
Post-investment grade strategy to maximize shareholder value
Guiding Principle Execution
Drive growth
while maintaining
Investment Grade
rating
Target returning
40%-60% of
Adjusted FCF to
shareholders
Committed to IG Rating & 1.5x Core Leverage Target
Reinvest in organic growth opportunities
Targeted M&A that accelerates our strategy
Return excess cash to shareholders
Announcing $5B share
repurchase program3
Initiate quarterly dividend
upon BoD approval
beginning Q1FY23
(currently estimating
~$1B annually4)
1) $25.2B reduction in Core Debt + margin loan, and mirror note; 2) Estimated adjusted free cash flow represents historical adjusted free cash flow excluding VMware, adjusted for the impact of cash interest savings
associated with the total debt paydown since the EMC transaction through Fiscal 2022, see appendix B slide 58 ; 3) Approved by Board of Directors to commence following completion of VMware spin off; 4) Quarterly
dividend subject to evaluation and approval by Board of Directors
after completion of VMware spin-off

© Copyright 2021 Dell Inc.42
Committed to long-term value creationOur track record of execution, competitive advantages and strategy have us well positioned
Shareholder value delivered to date…
• Simplified Capital and Corporate Structure
– Sold non-Core assets
– VMW Spin
– De-leveraging … on track to achieve investment
grade from all three rating agencies
• 19% Diluted EPS Growth FY19-2Q22 TTM
Ample value creation going forward…
Long-term Financial Model
Attractive
long-term
financial model
• 3 - 4% Revenue
growth
• 6+% EPS
growth
• NI to FCF
Conversion of
100% or better
• Target returning
40 - 60% of Adj.
FCF to
shareholders
Consolidate and
modernize the
Core business
Delivered 6% Proforma Revenue CAGR2
Growing at a premium to market3
~540bps Commercial PC (last 5 yrs.)
~560bps Mainstream Server (last 5 yrs.)
~200bps Midrange Storage (YTD)
Build growth
businesses
where we have
the unique right
to win
Targeting net-new growth opportunities in
strategic, adjacent areas where we are
advantaged
Edge, Telecom, Multi-Cloud Service
Delivery, Data Management
P&L Leverage
Delivered 16% Core Dell4 non-GAAP Diluted
EPS CAGR5
Through supply chain excellence, industry-
leading scale and disciplined cost
management
Strong Cash
Flow
$25B6 debt paydown since EMC
transaction
Core business delivers significant
proforma adjusted FCF7 … ~$5.8B
annually FY18-FY211) TTM Non-GAAP diluted EPS multiples as of 9/17/2021 market close; Dell Technologies implied Core P/E post VMW spin, considering VMW dividend; 2) FY18-21 CAGR; 3) Per IDC PC Units 2QCY16 – 2QCY21 TTM excluding chrome, Per IDC WW Quarterly Server Tracker 2QCY21, data between
2QCY16 – 2QCY21 TTM, Per IDC WW Quarterly Enterprise Storage Systems Tracker CY21Q1, Midrange data between 1QCY21 – 2QCY21; 4) Refer to Appendix C for management estimated pro forma EPS; 5) FY19-FY21 CAGR; 6) Core Debt + margin loan, and mirror note, excluding public subsidiary
debt and DFS related debt; 7) Estimated adjusted free cash flow represents historical adjusted free cash flow excluding VMware, adjusted for the impact of cash interest savings associated with the total expected debt paydown since the EMC transaction through Fiscal 2022, see appendix B slide 58.
(Implied Core)

Q&A
Michael Dell, Chairman and Chief Executive Officer
Jeff Clarke, Vice Chairman and Co-Chief Operating Officer
Chuck Whitten, Co-Chief Operating Officer
Tom Sweet, Chief Financial Officer
Jeff Boudreau, President, ISG
Sam Burd, President, CSG

© Copyright 2021 Dell Inc.44
Appendix A Consolidated GAAP and non-GAAP financial statements

© Copyright 2021 Dell Inc.45
1) Results include material adjustments related to purchase accounting and other items. For additional detail on these adjustments, please refer to accompanying supplemental slides in Appendix B.; 2) See accompanying supplemental slides for weighted
average shares and EPS calculation.
Consolidated GAAP Results1

© Copyright 2021 Dell Inc.46
Consolidated non-GAAP Results1
1) Please refer to accompanying supplemental slides for reconciliation of non-GAAP measures to GAAP; 2) See accompanying supplemental slides in Appendix B for weighted average shares and EPS calculation; 3) FY19 earnings per share – basic and
earnings per share – diluted are calculated using adjusted non-GAAP net income attributable to Dell Technologies, Inc. See accompanying supplemental slides in Appendix B.

© Copyright 2021 Dell Inc.47
Debt Summary
1) Amounts are based on underlying data and may not visually foot due to rounding; 2) Principal Face Value; 3) Core Secured Debt represents secured term loans, investment grade notes, and revolver. It excludes DFS allocated debt based on a 7:1
leverage ratio of DFS financing receivables and fixed assets supporting operating leases; 4) Core debt represents the total principal amount of our debt, less: (a) public subsidiary debt, (b) DFS related debt, and (c) Margin Loan and other debt
$ in billions 1, 2 FY18 FY19 FY20 FY21 2Q22
Revolver - - - - -
Term Loan A 5.6 7.8 4.2 3.1 3.1
Term Loan B 5.0 4.9 4.7 3.1 3.1
Investment Grade Notes 20.0 20.0 20.8 18.5 18.5
DFS Allocated Debt (1.9) (1.6) (1.5) (0.7) (0.7)
Total Core Secured Debt 3 28.7 31.1 28.2 24.1 24.1
High Yield Notes 3.3 3.3 2.7 2.7 1.6
Asset Sale Bridge - - - - -
Legacy Dell Unsecured Notes 2.5 2.0 1.4 1.4 1.0
Legacy EMC Unsecured Notes 5.5 3.0 1.6 1.0 1.0
Total Unsecured Core Debt 11.2 8.2 5.7 5.1 3.6
Total Core Debt 4 39.9 39.3 33.8 29.2 27.6
Margin Loan and Other 2.1 3.4 4.0 4.2 1.3
DFS Debt 4.8 5.9 7.8 9.7 9.6
DFS Allocated Debt 1.9 1.6 1.5 0.7 0.7
Total DFS Related Debt 6.7 7.5 9.3 10.3 10.3
Total Debt, Excluding Public Subsidiaries 48.7 50.2 47.1 43.7 39.2
Total Public Subsidiary Debt 4.0 4.0 5.6 4.8 4.8
Total Debt, Including Public Subsidiaries 52.7 54.2 52.7 48.5 44.0

© Copyright 2021 Dell Inc.48
Appendix BSupplemental non-GAAP measures
© Copyright 2021 Dell Inc.49
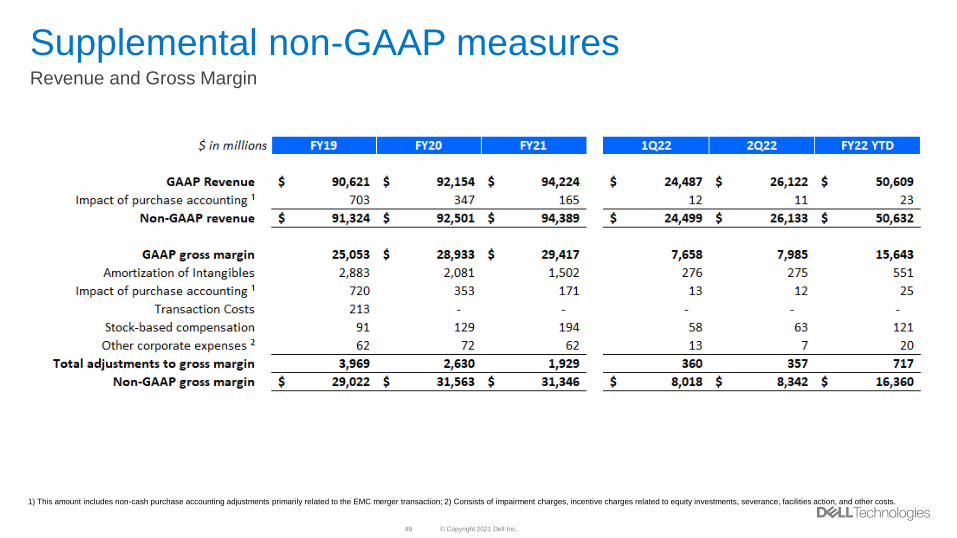
Supplemental non-GAAP measuresRevenue and Gross Margin
1) This amount includes non-cash purchase accounting adjustments primarily related to the EMC merger transaction; 2) Consists of impairment charges, incentive charges related to equity investments, severance, facilities action, and other costs.

© Copyright 2021 Dell Inc.50
Supplemental non-GAAP measuresSG&A, R&D and Operating Expense
1) This amount includes non-cash purchase accounting adjustments primarily related to the EMC merger transaction; 2) Consists of acquisition, integration, and divestiture-related costs; 3) Consists of impairment charges, incentive charges related to
equity investments, severance, facilities action, and other costs. FY21 includes derecognition of a previously accrued litigation loss in a VMware, Inc. patent litigation matter.

© Copyright 2021 Dell Inc.51
Supplemental non-GAAP measuresOperating Income
1) This amount includes non-cash purchase accounting adjustments primarily related to the EMC merger transaction; 2) Consists of acquisition, integration, and divestiture-related costs; 3) Consists of impairment charges, incentive charges related to
equity investments, severance, facilities action, and other costs. FY21 includes derecognition of a previously accrued litigation loss in a VMware, Inc. patent litigation matter.

© Copyright 2021 Dell Inc.52
Supplemental non-GAAP measuresInterest and Other, Net
1) Primarily consists of the fair value adjustments on strategic equity investments as well as a gain on the sale of RSA Security in FY21.

© Copyright 2021 Dell Inc.53
Supplemental non-GAAP measures
1) This amount includes non-cash purchase accounting adjustments primarily related to the EMC merger transaction; 2) Consists of acquisition, integration, and divestiture-related costs and gains; 3) Consists of impairment charges, incentive charges
related to equity investments, severance, facilities action, and other costs. FY21 includes derecognition of a previously accrued litigation loss in a VMware, Inc. patent litigation matter; 4) Consists of the gain (loss) on strategic investments, which
includes recurring fair value adjustments on equity investments; 5) Consists of the tax effects of non-GAAP adjustments, as well as an adjustment for discrete tax items.
Net Income

© Copyright 2021 Dell Inc.54
Supplemental non-GAAP measures
1) Amortization of intangibles reflects Dell Technologies Inc. basis; 2) This amount includes non-cash purchase accounting adjustments primarily related to the EMC merger transaction; 3) Consists of acquisition, integration and divestiture-related
costs; 4) Consists of impairment charges, incentive charges related to equity investments, severance, facilities action, and other costs. FY21 includes derecognition of a previously accrued litigation loss in a VMware, Inc. patent litigation matter;
5) Consists of the gain (loss) on strategic investments, which includes recurring fair value adjustments on equity investments; 6) Consists of the tax effects of non-GAAP adjustments, as well as an adjustment for discrete tax items.
Net Income attributable to non-controlling interests

© Copyright 2021 Dell Inc.55
Supplemental non-GAAP measures
1) This amount includes non-cash purchase accounting adjustments primarily related to the EMC merger transaction; 2) Consists of acquisition, integration and divestiture-related costs; 3) Consists of impairment charges, incentive charges related to
equity investments, severance, facilities action, and other costs. FY21 includes derecognition of a previously accrued litigation loss in a VMware, Inc. patent litigation matter; 4) Consists of the gain (loss) on strategic investments, which includes
recurring fair value adjustments on equity investments; 5) Consists of the tax effects of non-GAAP items as well as an adjustment for discrete tax items; 6) Includes adjustments that give effect to the Class V transaction that occurred in Q4 of fiscal
year 2019, as if they occurred on the first day of fiscal year 2019.
Net Income attributable to Dell Technologies Inc.

© Copyright 2021 Dell Inc.56
Supplemental non-GAAP measures
1) The incremental dilution from VMware, Inc. attributable to Dell Technologies represents the impact of VMware, Inc.’s dilut ive securities on diluted earnings per share of Dell Technologies common stock, and is calculated by multiplying the difference
between VMware, Inc.’s basic and diluted earnings per share by the number of shares of VMware, Inc. common stock held by Dell Technologies; 2) Includes adjustments that give effect to the Class V transaction that occurred in Q4 of fiscal year
2019, as if they occurred on the first day of fiscal year 2019, including certain static share count and average stock price assumptions driven by the incremental Class C shares issued upon closing of the Class V transaction.
Earnings per Share – basic and diluted

© Copyright 2021 Dell Inc.57
Supplemental non-GAAP measures
1) Represents Dell Technologies non-GAAP net revenue, excluding VMware, adjusted to include the impact of currently estimated VMware reseller revenue; 2) This amount includes non-cash purchase accounting adjustments related to the EMC
merger transaction and the going-private transaction; 3) Consists of acquisition, integration, and divestiture-related costs; 4) Consists of severance and facilities action costs.
Revenue and Operating Income

© Copyright 2021 Dell Inc.58
Supplemental non-GAAP measures
1) Amounts are based on underlying data and may not visually foot due to rounding; 2) Amount represents change in net carrying value of equipment for DFS operating leases; 3) Estimated adjusted free cash flow represents historical adjusted
free cash flow excluding VMware, adjusted for the impact of cash interest savings associated with the total expected debt paydown since the EMC transaction through Fiscal 2022.
Estimated Adjusted Free Cash Flow
© Copyright 2021 Dell Inc.59
Appendix CManagement estimated pro forma financial measures

© Copyright 2021 Dell Inc.60
Management estimated pro forma financial measures1,2
1) Represents current estimated management pro forma financial measures. Pro forma financial statements are computed assuming the VMware spin-off transaction occurred at the beginning of each fiscal year and include adjustments for
discontinued operations related to VMware and material nonrecurring charges and credits which result directly from the transaction. Material non-recurring charges are reflected in Q1FY21 only. Final pro forma financial statements, presented in
accordance with Regulation S-X Article 11, will be available later in the year; amounts are subject to change with no obligation to reconcile these estimates; 2) Results include material adjustments related to purchase accounting and other items. For
additional detail on these adjustments, please refer to the accompanying supplemental slides in Appendix D; 3) See accompanying supplemental slides for weighted average shares and EPS calculation.

© Copyright 2021 Dell Inc.61
Management estimated pro forma financial measures1,2
1) Represents current estimated management pro forma financial measures. Pro forma financial statements are computed assuming the VMware spin-off transaction occurred at the beginning of each fiscal year and include adjustments for
discontinued operations related to VMware and material nonrecurring charges and credits which result directly from the transaction. Material non-recurring charges are reflected in Q1FY21 only. Final pro forma financial statements, presented in
accordance with Regulation S-X Article 11, will be available later in the year; amounts are subject to change with no obligation to reconcile these estimates; 2) Results include material adjustments related to purchase accounting and other items. For
additional detail on these adjustments, please refer to the accompanying supplemental slides in Appendix D; 3) See accompanying supplemental slides for weighted average shares and EPS calculation.

© Copyright 2021 Dell Inc.62
Non-GAAP management estimated pro forma financial measures1,2
1) Represents current estimated management pro forma financial measures. Pro forma financial statements are computed assuming the VMware spin-off transaction occurred at the beginning of each fiscal year and include adjustments for
discontinued operations related to VMware and material nonrecurring charges and credits which result directly from the transaction. Material non-recurring charges are reflected in Q1FY21 only. Final pro forma financial statements, presented in
accordance with Regulation S-X Article 11, will be available later in the year; amounts are subject to change with no obligation to reconcile these estimates; 2) See accompanying supplemental slides in Appendix D for reconciliation of non-GAAP
measures to GAAP; 3) See accompanying supplemental slides for weighted average shares and EPS calculation.

© Copyright 2021 Dell Inc.63
1) Represents current estimated management pro forma financial measures. Pro forma financial statements are computed assuming the VMware spin-off transaction occurred at the beginning of each fiscal year and include adjustments for
discontinued operations related to VMware and material nonrecurring charges and credits which result directly from the transaction. Material non-recurring charges are reflected in Q1FY21 only. Final pro forma financial statements, presented in
accordance with Regulation S-X Article 11, will be available later in the year; amounts are subject to change with no obligation to reconcile these estimates; 2) See accompanying supplemental slides in Appendix D for reconciliation of non-GAAP
measures to GAAP; 3) See accompanying supplemental slides for weighted average shares and EPS calculation.
Non-GAAP management estimated pro forma financial measures1,2
© Copyright 2021 Dell Inc.64
Appendix D Supplemental management estimated pro forma non-GAAP
measures

© Copyright 2021 Dell Inc.65
Supplemental pro forma non-GAAP measures1
Management estimated pro forma revenue and gross margin
1) Represents current estimated management pro forma financial measures. Pro forma financial statements are computed assuming the VMware spin-off transaction occurred at the beginning of each fiscal year and include adjustments for
discontinued operations related to VMware and material nonrecurring charges and credits which result directly from the transaction. Material non-recurring charges are reflected in Q1FY21 only. Final pro forma financial statements, presented in
accordance with Regulation S-X Article 11, will be available later in the year; amounts are subject to change with no obligation to reconcile these estimates; 2) This amount includes non-cash purchase accounting adjustments primarily related to the
EMC merger transaction; 3) Consists of acquisition, integration, and divestiture-related costs; 4) Consists of impairment charges, incentive charges related to equity investments, severance, facilities action, and other costs.

© Copyright 2021 Dell Inc.66
Supplemental pro forma non-GAAP measures1
Management estimated pro forma SG&A, R&D and operating expense
1) Represents current estimated management pro forma financial measures. Pro forma financial statements are computed assuming the VMware spin-off transaction occurred at the beginning of each fiscal year and include adjustments for
discontinued operations related to VMware and material nonrecurring charges and credits which result directly from the transaction. Material non-recurring charges are reflected in Q1FY21 only. Final pro forma financial statements, presented in
accordance with Regulation S-X Article 11, will be available later in the year; amounts are subject to change with no obligation to reconcile these estimates; 2) This amount includes non-cash purchase accounting adjustments primarily related to the
EMC merger transaction; 3) Consists of acquisition, integration, and divestiture-related costs; 4) Consists of impairment charges, incentive charges related to equity investments, severance, facilities action, and other costs.

© Copyright 2021 Dell Inc.67
Supplemental pro forma non-GAAP measures1
Management estimated pro forma operating income
1) Represents current estimated management pro forma financial measures. Pro forma financial statements are computed assuming the VMware spin-off transaction occurred at the beginning of each fiscal year and include adjustments for
discontinued operations related to VMware and material nonrecurring charges and credits which result directly from the transaction. Material non-recurring charges are reflected in Q1FY21 only. Final pro forma financial statements, presented in
accordance with Regulation S-X Article 11, will be available later in the year; amounts are subject to change with no obligation to reconcile these estimates; 2) This amount includes non-cash purchase accounting adjustments primarily related to the
EMC merger transaction; 3) Consists of acquisition, integration, and divestiture-related costs; 4) Consists of impairment charges, incentive charges related to equity investments, severance, facilities action, and other costs.

© Copyright 2021 Dell Inc.68
Supplemental pro forma non-GAAP measures1
Management estimated pro forma interest and other, net
1) Represents current estimated management pro forma financial measures. Pro forma financial statements are computed assuming the VMware spin-off transaction occurred at the beginning of each fiscal year and include adjustments for
discontinued operations related to VMware and material nonrecurring charges and credits which result directly from the transaction. Material non-recurring charges are reflected in Q1FY21 only. Final pro forma financial statements, presented in
accordance with Regulation S-X Article 11, will be available later in the year; amounts are subject to change with no obligation to reconcile these estimates; 2) Consists of acquisition, integration, and divestiture-related costs; 3) Consists of
impairment charges, incentive charges related to equity investments, severance, facilities action, and other costs; 4) Consists of the gain (loss) on strategic investments, which includes the fair value adjustments on equity investments.

© Copyright 2021 Dell Inc.69
Supplemental pro forma non-GAAP measures1
Management estimated pro forma net income
1) Represents current estimated management pro forma financial measures. Pro forma financial statements are computed assuming the VMware spin-off transaction occurred at the beginning of each fiscal year and include adjustments for
discontinued operations related to VMware and material nonrecurring charges and credits which result directly from the transaction. Material non-recurring charges are reflected in Q1FY21 only. Final pro forma financial statements, presented in
accordance with Regulation S-X Article 11, will be available later in the year; amounts are subject to change with no obligation to reconcile these estimates; 2) This amount includes non-cash purchase accounting adjustments primarily related to the
EMC merger transaction; 3) Consists of acquisition, integration, and divestiture-related costs; 4) Consists of impairment charges, incentive charges related to equity investments, severance, facilities action, and other costs; 5) Consists of the gain
(loss) on strategic investments, which includes the fair value adjustments on equity investments; 6) Consists of the tax effects of non-GAAP adjustments, as well as an adjustment for discrete tax items.

© Copyright 2021 Dell Inc.70
Supplemental pro forma non-GAAP measures1
Management estimated pro forma net income attributable to Dell Technologies Inc.
1) Represents current estimated management pro forma financial measures. Pro forma financial statements are computed assuming the VMware spin-off transaction occurred at the beginning of each fiscal year and include adjustments for
discontinued operations related to VMware and material nonrecurring charges and credits which result directly from the transaction. Material non-recurring charges are reflected in Q1FY21 only. Final pro forma financial statements, presented in
accordance with Regulation S-X Article 11, will be available later in the year; amounts are subject to change with no obligation to reconcile these estimates; 2) This amount includes non-cash purchase accounting adjustments primarily related to the
EMC merger transaction; 3) Consists of acquisition, integration, and divestiture-related costs; 4) Consists of impairment charges, incentive charges related to equity investments, severance, facilities action, and other costs; 5) Consists of the gain
(loss) on strategic investments, which includes the fair value adjustments on equity investments; 6) Consists of the tax effects of non-GAAP adjustments, as well as an adjustment for discrete tax items.

© Copyright 2021 Dell Inc.71
Supplemental pro forma non-GAAP measures1
Management estimated pro forma earnings per share - basic and diluted
1) Represents current estimated management pro forma financial measures. Pro forma financial statements are computed assuming the VMware spin-off transaction occurred at the beginning of each fiscal year and include adjustments for
discontinued operations related to VMware and material nonrecurring charges and credits which result directly from the transaction. Material non-recurring charges are reflected in Q1FY21 only. Final pro forma financial statements, presented in
accordance with Regulation S-X Article 11, will be available later in the year; amounts are subject to change with no obligation to reconcile these estimates; 2) Includes adjustments that give effect to the Class V transaction that occurred in Q4 of fiscal
year 2019, as if they occurred on the first day of fiscal year 2019, including certain static share count and average stock price assumptions driven by the incremental Class C shares issued upon closing of the Class V transaction; 3) Diluted share count
includes certain share conversion ratio assumptions. Final share conversion ratio will be available at the close of the VMware spin-off transaction.