DELIVERING OUR STRATEGY - Petrofac · Kuwait National Petroleum Corporation, which has been...
215
ANNUAL REPORT AND ACCOUNTS 2018 DELIVERING OUR STRATEGY
Transcript of DELIVERING OUR STRATEGY - Petrofac · Kuwait National Petroleum Corporation, which has been...

ANNUAL REPORT AND ACCOUNTS 2018
DELIVERING OUR STRATEGY
Petro
fac Annual report and accounts 2018

In 2018, we delivered good results, with solid execution, and excellent progress in delivering our strategy.
A healthy new order intake reflects our strong competitive position. Our focus on operational excellence has protected our margins and ensured we made good progress in delivering our portfolio of projects. Meanwhile, our transition back to a capital-light business is largely complete.
Revenue US$5,829mYear ended 31 December 2017: US$6,395 million
EBITDA 1,2,4 US$671mYear ended 31 December 2017: US$748 million
Reported net profit/(loss)5 US$64m
Year ended 31 December 2017: US$(29) million
Return on capital employed1,2,6 26%
Year ended 31 December 2017: 22%
Backlog 3 US$9.6bnAs at 31 December 2017: US$10.2 billion
Diluted earnings per share 1,2,5 102.3 cents
Year ended 31 December 2017: 106.2 cents
Business performance net profit 1,2,5
US$353mYear ended 31 December 2017: US$361 million
Full year dividend per share 38.0 cents
Year ended 31 December 2017: 38.0 cents
1. 2017 re-presented due to the reclassification of an item from exceptional items and certain re-measurements to business performance as set out in note 6 to the consolidated financial statements.
2. Business performance before exceptional items and certain re-measurements. This measurement is shown by Petrofac as a means of measuring underlying business performance. 3. Backlog consists of: the estimated revenue attributable to the uncompleted portion of Engineering & Construction operating segment contracts; and, with regard to Engineering
& Production Services, the estimated revenue attributable to the lesser of the remaining term of the contract and five years. The Group uses this key performance indicator as a measure of the visibility of future revenue (see note 3 to the consolidated financial statements).
4. Earnings before interest, tax, depreciation and amortisation (EBITDA) is calculated as operating profit/(loss), including the share of profit from associates and joint ventures, adjusted to add back charges for depreciation and amortisation (see A3 in Appendix A to the consolidated financial statements).
5. Attributable to Petrofac Limited shareholders, as reported in the consolidated income statement.6. Return on capital employed (ROCE) is calculated as EBITA (earnings before interest, tax and amortisation, calculated as EBITDA less depreciation) divided by average capital
employed (see A8 in Appendix A to the consolidated financial statements).
Achieving our strategy through...
Succeeding in adjacent sectorsThe BorWin3 offshore wind project is a demonstration of our diversification into renewable energy.
See page 8
Creating in-country valueOur TPO Technical Training Centre is teaching young Omanis the skills to enhance the Sultanate’s energy industries for the future.
See page 18
Growing organicallyThe RAPID project in Malaysia shows our ability to bring our expertise and high standards to adjacent sectors and complementary geographies.
See page 30

STRATEGIC REPORT
2Detailed reporting of our financial and operational performance at Group level, as well as our segmental performance. It also includes our full risk report and review of our corporate responsibility activities.
GOVERNANCE
64Details of our Board of Directors, senior management, approach to corporate governance and remuneration.
2 Petrofac at a glance4 Chairman’s statement6 Our business model8 Case study: Succeeding
in adjacent sectors10 Group Chief Executive’s review12 Our leadership team14 Market outlook16 Our strategy18 Case study: Creating in-country value20 Key performance indicators22 Risk management25 Principal risks and uncertainties30 Case study: Growing organically32 Segmental performance40 Financial review44 Corporate responsibility
64 Chairman’s introduction66 Directors’ information68 Corporate Governance report80 Nominations Committee report82 Audit Committee report88 Compliance and Ethics
Committee report
90 Directors’ remuneration report102 Directors’ statements
FINANCIAL STATEMENTS
103Our financial statements and related notes and reports.
103 Group financial statements104 Independent auditor’s report113 Consolidated income statement114 Consolidated statement of other
comprehensive income115 Consolidated balance sheet
116 Consolidated statement of cash flows117 Consolidated statement of changes
in equity118 Notes to the consolidated financial
statements
177 Appendices183 Company financial statements184 Company income statement184 Company statement of other
comprehensive income185 Company balance sheet
186 Company statement of cash flows
187 Company statement of changes in equity
188 Notes to the Company financial statements
202 Shareholder information203 Glossary
Additional video content Scan the codes throughout the report using a QR code app on your device to access additional video content.
Scan code to play video
To view and download our Annual report and accounts 2018 online. petrofac.com/investors/ara2018
Annual report and accounts 2018 Petrofac 1
Strateg
ic repo
rtG
overnance
Financial statem
ents

PETROFAC AT A GLANCE
We are an international service provider to the oil and gas production and processing industry, with a diverse client portfolio including many of the world’s leading integrated, independent and national oil and gas companies.
We design, build, operate and maintain oil and gas facilities, delivered through a range of flexible commercial models, enabling us to respond to the distinct needs of each client and helping them to transform the value of their assets across the oil and gas life cycle.
Oil and gas development and production
ENGINEERING & CONSTRUCTION (E&C)Engineering & Construction delivers onshore and offshore engineering, procurement, construction, installation and commissioning services on a lump-sum basis. We have more than 35 years’ expertise in this area and our services encompass both greenfield and brownfield developments.
Segmental performance See page 33
Revenue
US$4,087m(2017: US$4,801m)
Business performance net profit
US$285m(2017 re-presented: US$360m)
Employees
6,500(as at 31 December 2018)
ENGINEERING & PRODUCTION SERVICES (EPS)Engineering & Production Services brings together our services’ capability across brownfield projects and operations, greenfield projects through concept, feasibility and front-end engineering and full project delivery, as well as a range of operations, maintenance and engineering services for onshore and offshore projects.
Segmental performance See page 36
Revenue
US$1,479m(2017: US$1,392m)
Business performance net profit
US$96m(2017: US$90m)
Employees
4,250(as at 31 December 2018)
INTEGRATED ENERGY SERVICES (IES)Integrated Energy Services provides an integrated service for clients under flexible commercial models that are aligned with their requirements. Our projects cover upstream developments – both greenfield and brownfield, related energy infrastructure projects, and can include investment.
Segmental performance See page 38
Revenue
US$282m(2017: US$228m)
Business performance net profit/(loss)
US$39m(2017: US$(21)m)
Employees
600(as at 31 December 2018)
70%
25%
5%
We delivered a solid operational performance across the Group, with a clear focus on delivery.
Across our portfolio of lump-sum projects, we delivered 213 million man-hours, and secured US$3.8 billion of new order intake. Meanwhile, in our reimbursable business, we secured contract awards and extensions valued at around US$1.2 billion. We also made excellent progress on our organic growth strategy in complementary geographies and adjacent sectors.
The healthy new order intake in both our core markets and our growth markets reflects the competitiveness of our proposition.
UAE ALGERIA IRAQ OMAN
We are nearing completion of the UZ750 offshore project at the Upper Zakum oil field, our share of which is valued at US$3.5 billion. This important mega project is now ready for start-up. We also had success in Dubai with the construction of the 20,000 tonne BorWin3 jacket and topside which, after 13.5 million man-hours of work, departed for the 12,000-mile voyage to the North Sea in mid-2018.
Important milestones included the commissioning of both the Alrar gas plant and the Reggane North Development plant. In terms of new business, a highlight was the award of a 36-month, US$500 million contract as part of the Tinrhert Field Development Project, which covers engineering, procurement, construction, commissioning, start-up, and performance testing.
We announced several new contract wins and extensions in June, with a combined value of more than US$110 million, for construction management, engineering, commissioning and start-up services. In August, we were awarded a US$370 million contract by Basra Oil Company for expansion of the Central Processing Facility at the Majnoon Field in the South of the country.
During the year, we began to see the value of our 10-year Framework Agreement with Petroleum Development Oman, which enables Petrofac to provide EPCm support services for major oil and gas projects. Highlights included the award of a US$265 million contract for the Marmul Polymer Phase 3 (MPP3) project, and a US$115 million contract for the development of the Qarn Alam Co-Generation project.
See pages 8 and 33 See page 34 See page 34 See page 36
THAILAND MALAYSIA INDIA EUROPE KUWAIT
A demonstration of our organic growth strategy was our first major project award in Thailand. In consortium with Saipem and Samsung, we won the contract for the Thai Oil Company’s Clean Fuels Project, with Petrofac’s share amounting to US$1.4 billion. This will transform an existing oil refinery in Chonburi, on the East coast of Thailand, into an environmentally-friendly facility producing high quality transportation fuels.
We have made significant progress on the US$500 million Refinery and Petrochemicals Integrated Development (RAPID) engineering, procurement, construction and commissioning project. An important dimension of this project is our local delivery model – we chose to work exclusively with locally-based subcontractors, helping them to source, recruit and train a high proportion of Malaysian workers.
We celebrated three major project wins in 2018, which demonstrate our organic growth strategy in action. These comprise the US$135 million Kochi Refinery project for Bharat Petroleum Corporation Limited, the US$200 million Sulphur Recovery Unit for Hindustan Petroleum Corporation Limited, and the US$233 million Raageshwari Deep Gas Field Development project for Vedanta Limited.
We secured several awards and extensions, including Siccar Point Energy, Chevron and ENI. Meanwhile, in offshore wind, the topside of the BorWin3 platform was successfully installed, and we secured a US$200 million engineering, procurement, construction and installation contract from TenneT for the Hollandse Kust Zuid (HKZ) offshore grid connection.
We began the handover of the Clean Fuels Project for Kuwait National Petroleum Corporation, which has been instrumental in demonstrating and extending our downstream credentials. We also entered the pre-commissioning of the Lower Fars heavy oil development programme and the GC29 gathering centre and trunkline project, both of which are for Kuwait Oil Company.
See page 35 See page 30 See page 33 See page 36 See page 33
OUR DIVISIONS
SEGMENTAL OVERVIEW
OUR SERVICES
2 Annual report and accounts 2018 Petrofac

Oil and gas processing facilities
Storage and pipelines
Refining and petrochemicals
Offshore production
Offshore wind
We delivered a solid operational performance across the Group, with a clear focus on delivery.
Across our portfolio of lump-sum projects, we delivered 213 million man-hours, and secured US$3.8 billion of new order intake. Meanwhile, in our reimbursable business, we secured contract awards and extensions valued at around US$1.2 billion. We also made excellent progress on our organic growth strategy in complementary geographies and adjacent sectors.
The healthy new order intake in both our core markets and our growth markets reflects the competitiveness of our proposition.
UAE ALGERIA IRAQ OMAN
We are nearing completion of the UZ750 offshore project at the Upper Zakum oil field, our share of which is valued at US$3.5 billion. This important mega project is now ready for start-up. We also had success in Dubai with the construction of the 20,000 tonne BorWin3 jacket and topside which, after 13.5 million man-hours of work, departed for the 12,000-mile voyage to the North Sea in mid-2018.
Important milestones included the commissioning of both the Alrar gas plant and the Reggane North Development plant. In terms of new business, a highlight was the award of a 36-month, US$500 million contract as part of the Tinrhert Field Development Project, which covers engineering, procurement, construction, commissioning, start-up, and performance testing.
We announced several new contract wins and extensions in June, with a combined value of more than US$110 million, for construction management, engineering, commissioning and start-up services. In August, we were awarded a US$370 million contract by Basra Oil Company for expansion of the Central Processing Facility at the Majnoon Field in the South of the country.
During the year, we began to see the value of our 10-year Framework Agreement with Petroleum Development Oman, which enables Petrofac to provide EPCm support services for major oil and gas projects. Highlights included the award of a US$265 million contract for the Marmul Polymer Phase 3 (MPP3) project, and a US$115 million contract for the development of the Qarn Alam Co-Generation project.
See pages 8 and 33 See page 34 See page 34 See page 36
THAILAND MALAYSIA INDIA EUROPE KUWAIT
A demonstration of our organic growth strategy was our first major project award in Thailand. In consortium with Saipem and Samsung, we won the contract for the Thai Oil Company’s Clean Fuels Project, with Petrofac’s share amounting to US$1.4 billion. This will transform an existing oil refinery in Chonburi, on the East coast of Thailand, into an environmentally-friendly facility producing high quality transportation fuels.
We have made significant progress on the US$500 million Refinery and Petrochemicals Integrated Development (RAPID) engineering, procurement, construction and commissioning project. An important dimension of this project is our local delivery model – we chose to work exclusively with locally-based subcontractors, helping them to source, recruit and train a high proportion of Malaysian workers.
We celebrated three major project wins in 2018, which demonstrate our organic growth strategy in action. These comprise the US$135 million Kochi Refinery project for Bharat Petroleum Corporation Limited, the US$200 million Sulphur Recovery Unit for Hindustan Petroleum Corporation Limited, and the US$233 million Raageshwari Deep Gas Field Development project for Vedanta Limited.
We secured several awards and extensions, including Siccar Point Energy, Chevron and ENI. Meanwhile, in offshore wind, the topside of the BorWin3 platform was successfully installed, and we secured a US$200 million engineering, procurement, construction and installation contract from TenneT for the Hollandse Kust Zuid (HKZ) offshore grid connection.
We began the handover of the Clean Fuels Project for Kuwait National Petroleum Corporation, which has been instrumental in demonstrating and extending our downstream credentials. We also entered the pre-commissioning of the Lower Fars heavy oil development programme and the GC29 gathering centre and trunkline project, both of which are for Kuwait Oil Company.
See page 35 See page 30 See page 33 See page 36 See page 33
Annual report and accounts 2018 Petrofac 3
Strateg
ic repo
rtG
overnance
Financial statem
ents

In last year’s Annual Report, the Board’s commitment was that Petrofac would be focused fully on the pursuit of three clear strategic themes: focus on the core, achieve organic growth and reduce capital intensity.
In my first year as Chairman, I am pleased to report that the Company delivered on this commitment.
On the back of successful divestments, we continued to strengthen the balance sheet. The move into adjacent markets progressed unabated. Petrofac also maintained its reputation for delivering challenging projects.
At the same time, the Board oversaw several enhancements to the way the Company is governed and managed. A new leadership structure has been embedded, succession planning has been prioritised, compliance has continued to receive more emphasis, and significant progress has been made on the digitisation agenda.
With a high win-rate on new contracts in our core geographies and a good order backlog, we are well positioned for 2019. Despite the continuing uncertainties within the wider oil and gas sector, the longer-term prospects for Petrofac also remain favourable.
René Médori Non-executive Chairman
Operational progress Operationally, there were many positives to highlight.
Progress in our core markets was complemented by contract wins in growth markets including India and Thailand. Under the new leadership structure, our approach to operational excellence was also strong, enabling the Group to continue to deliver sector-leading margins.
However, a deterioration in our safety record was a cause of real concern. The Board paid particular attention to the three fatalities that occurred in Kuwait and Mexico, and we express our sincere condolences to the families of the men who died. We looked closely into the individual circumstances and examined the root causes behind each of these tragic accidents. In addition, we sought consistent assurances that safety remains the cornerstone of the Petrofac culture, and that effective strategies are in place to restore the Group’s otherwise impressive record.
Financial performanceGiven the ongoing challenging environment, we were pleased to deliver a reported net profit attributable to Petrofac Limited shareholders of US$64 million and business performance net profit of US$353 million.
Again, a priority for the year was to continue the transition back to a capital-light business model. Aided by the successful divestment of the Chergui gas concession, the Greater Stella Area development, 49% of our Mexican operations and the JSD6000 installation vessel, we closed the year with net cash.
As a result, and in line with the Group’s dividend policy, we are proposing a final dividend of 25.30 cents per share. Together with the interim dividend of 12.70 cents per share, this gives a total dividend for the year of 38.00 cents per share.
Investing in digital technologyThe development of digital technologies was a focus for the Board during the year. Having witnessed disruption in other industries, we believe new technologies can change the way our sector does business and, perhaps more importantly, the way our clients do business.
CHAIRMAN’S STATEMENT
2018 was a year of solid progress. Petrofac continued to deliver on its commitments, and is well-positioned for long-term growth.
4 Annual report and accounts 2018 Petrofac

A challenge to the management team for 2018 was to formalise a robust digital strategy and commence its implementation. We were therefore encouraged by several senior-level appointments in this area, and the business-centric way the Company intends to use technology to work faster, smarter, safer and more predictably. Initial concepts and projects from 2018 demonstrate the extent of the opportunity. Our focus for 2019 is to accelerate the strongest of these into implementation.
Maintaining a strong Board for the futureThe foundation of Petrofac’s success is its distinctive culture and the Board sets out to lead by example. We see it as our collective responsibility to live up to the Company’s values: safe, ethical, innovative, responsive, quality and cost conscious, and driven to deliver.
The composition of the Board is a key consideration. In this regard we were sorry to say farewell to my predecessor, Rijnhard van Tets, who had served on the Board since 2007. Rijnhard became Chairman in 2014 at a challenging time in the Company’s history and, during his tenure, steered the Board through some testing times. On behalf of the entire Board, I would like to thank Rijnhard for his leadership.
We were delighted that Sara Akbar and David Davies joined us as Non-executive Directors during 2018. With over 30 years’ in the oil and gas sector and a unique insight into the Middle East environment, Sara brings a valuable client-side perspective to our work. Meanwhile David’s deep financial experience complements our existing strengths and makes him the ideal person to lead our Audit Committee. With these two new appointments, I am confident the Group benefits from a strong, diverse, multi-disciplinary Board, with a good ratio of Non-executive to Executive Directors. We work extremely well together, and I am determined to nurture an inclusive, open and supportive dialogue.
In accordance with good governance, we are disciplined in evaluating the performance of the Board itself. I carried out my first internal Board evaluation this year and will oversee a formal external evaluation during 2019. Further details of our evaluation process are set out on pages 74 and 75.
Staying close to the inner workings of the GroupWith so much activity across the Group, it is important that the Board’s knowledge of Petrofac extends well beyond the boardroom and that we have insights into the realities of the everyday business.
Each year, at least one of our Board meetings takes place in an operational location, and we make a point of experiencing our business first hand. In 2018, the Board visited the BorWin3 facility, which was being built in the Dubai Drydocks World, before it commenced its journey to the German North Sea. This allowed us to meet with our contractors and partners, speak with the project team and some of our graduates on site, and see how Petrofac is moving into adjacent sectors – in this case renewable energy.
A significant development for Petrofac during 2019 is the creation of a new Workforce Forum. Using the framework set out within the 2018 UK Corporate Governance Code, this Forum will meet at least twice a year and comprise 12 representatives from across the Group. It is envisaged that this Forum will give me and two of my fellow Non-executive Directors the opportunity of hearing directly from our employees, and allow us to better understand their ideas, concerns, and perspective, plus what it is about Petrofac that motivates and engages them.
SFO investigationIn February 2019 a former employee of a Petrofac subsidiary admitted offences contrary to the UK Bribery Act 2010. A small number of Petrofac individuals, both former and serving, and entities are alleged to have acted together with this individual.
Petrofac will continue to engage with the SFO. Whether further charges are brought against former or serving employees, or the Company, remains a question for them. We are focused on bringing this matter to closure.
Looking forward to 2019 and beyondFor 2019, we expect the market environment to remain similar to 2018. We have good visibility of the projects that are likely to be awarded during the year and, while there is some uncertainty over timing, we expect to maintain a strong competitive position. We will also work to strengthen, and continue to maintain, a strong balance sheet.
Given our dependence on the ethos and quality of our people, succession planning across all levels of the business will continue to be a key focus for the Board. We will also want to see tangible progress following the implementation of the Group’s digitisation strategy. We expect our safety record to revert to our usual high standards, and will be monitoring progress in this area closely.
Finally, I want to thank all our employees for their continued commitment. In particular, I would like to reiterate the Board’s strong support of Group Chief Executive Ayman Asfari and his leadership team. The Board commends Ayman and his management team for delivering another excellent set of results in challenging circumstances. This reflects their clear, unwavering focus on delivering for our clients and maintaining operational excellence, whilst continuing to engage with the SFO. It is encouraging to see how hard everyone is working to deliver on our collective commitments and position the Group for success over the longer term.
René Médori Non-executive Chairman 27 February 2019
Annual report and accounts 2018 Petrofac 5
Strateg
ic repo
rtG
overnance
Financial statem
ents
Quality &
cost conscious
Responsive Innovative
Eth
ical
OPERATIONALEXCELLENCE
OPERATIONALEXCELLENCE
DESIGN
MANAGEAND MAINTAIN
BUILD
ENGINEERINGEXPERTISE
Driv
en to
d
elive
r
Our values
Safe
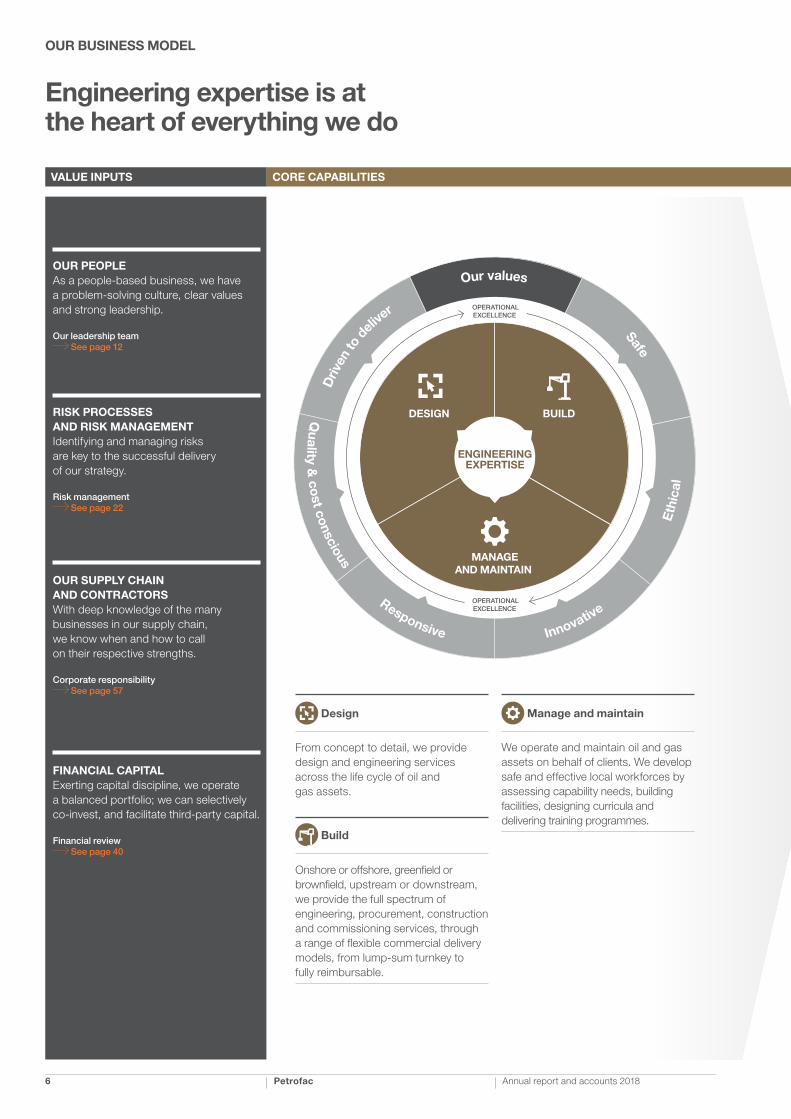
Engineering expertise is at the heart of everything we do
OUR BUSINESS MODEL
OUR PEOPLEAs a people-based business, we have a problem-solving culture, clear values and strong leadership.
Our leadership team See page 12
RISK PROCESSES AND RISK MANAGEMENTIdentifying and managing risks are key to the successful delivery of our strategy.
Risk management See page 22
OUR SUPPLY CHAIN AND CONTRACTORSWith deep knowledge of the many businesses in our supply chain, we know when and how to call on their respective strengths.
Corporate responsibility See page 57
FINANCIAL CAPITALExerting capital discipline, we operate a balanced portfolio; we can selectively co-invest, and facilitate third-party capital.
Financial review See page 40
Design
From concept to detail, we provide design and engineering services across the life cycle of oil and gas assets.
Build
Onshore or offshore, greenfield or brownfield, upstream or downstream, we provide the full spectrum of engineering, procurement, construction and commissioning services, through a range of flexible commercial delivery models, from lump-sum turnkey to fully reimbursable.
Manage and maintain
We operate and maintain oil and gas assets on behalf of clients. We develop safe and effective local workforces by assessing capability needs, building facilities, designing curricula and delivering training programmes.
CORE CAPABILITIESVALUE INPUTS
6 Annual report and accounts 2018 Petrofac

Storage and pipelines Refining and petrochemicals
Offshore production Offshorewind
Oil and gas processing facilities
EQUITY UPSTREAM INVESTMENTSUpstream investments made through production sharing contracts or concession agreements.
PRODUCTION ENHANCEMENT CONTRACTS (PECs) Where we are paid a tariff per barrel for enhancing oil and gas production above an agreed baseline.
REIMBURSABLE SERVICESWhere the cost of our services is reimbursed by the client plus an agreed margin.
COST PLUS KPIsReimbursable with margin linked to the successful delivery of key performance indicators.
LUMP-SUM TURNKEYProjects where we are remunerated on a lump-sum basis.
CLIENT VALUEBenefiting from certainty of cost and delivery, and taking advantage of commercial models that meet client needs.
SHAREHOLDER VALUEDelivering sustainable, long-term value, through dividend payments to our shareholders and the financial returns from share price growth.
IN-COUNTRY VALUEDeveloping local skills and capabilities, benefiting local development, and stimulating productivity in local economies.
Engineering & Construction (E&C)
Group revenue contribution 70%Revenue 2018 US$4,087m
Engineering & Production Services (EPS)
Group revenue contribution 25%Revenue 2018 US$1,479m
Integrated Energy Services (IES)
Group revenue contribution 5%Revenue 2018 US$282m
GROUP DIVISIONS COMMERCIAL MODELS OUTCOMES
Working across the international oil and gas industry, we help our clients unlock the full value of their energy assets.
Annual report and accounts 2018 Petrofac 7
Strateg
ic repo
rtG
overnance
Financial statem
ents
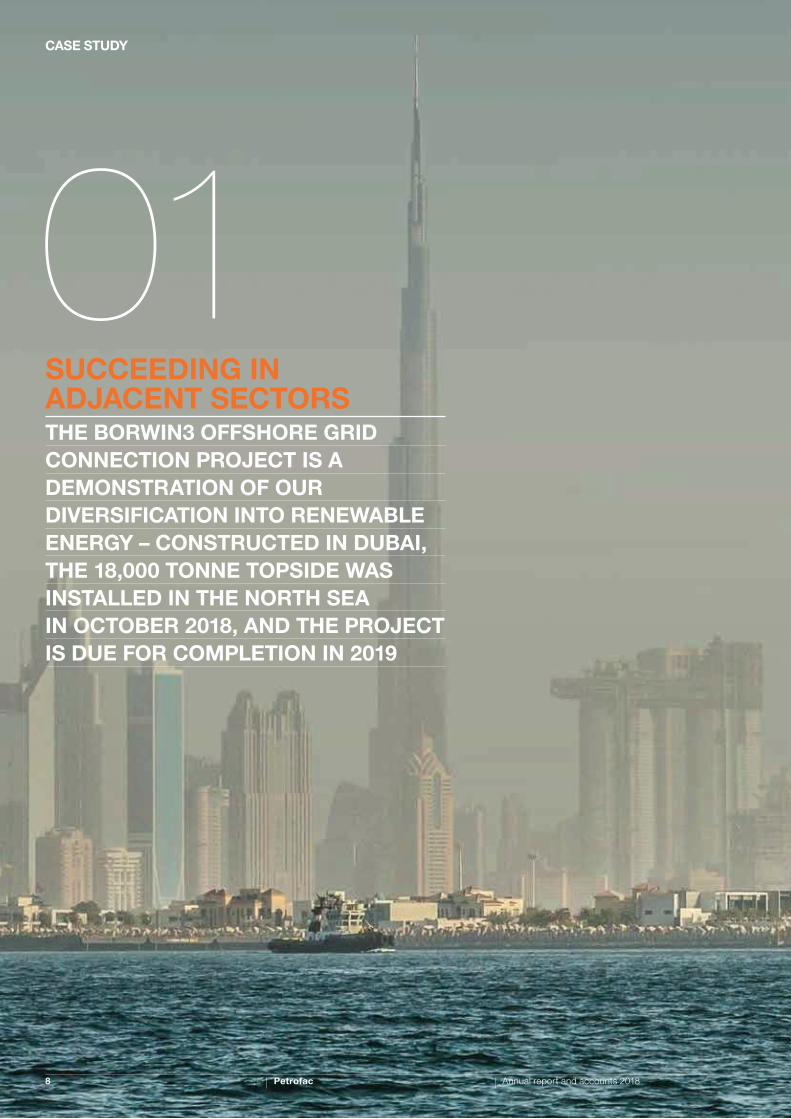
CASE STUDY
SUCCEEDING IN ADJACENT SECTORSTHE BORWIN3 OFFSHORE GRID CONNECTION PROJECT IS A DEMONSTRATION OF OUR DIVERSIFICATION INTO RENEWABLE ENERGY – CONSTRUCTED IN DUBAI, THE 18,000 TONNE TOPSIDE WAS INSTALLED IN THE NORTH SEA IN OCTOBER 2018, AND THE PROJECT IS DUE FOR COMPLETION IN 2019
8 Annual report and accounts 2018 Petrofac
Annual report and accounts 2018 Petrofac 9

KEY FACTS
10,500 tonnesConstruction of the topside alone used 10,500 tonnes of steel – more than the Eiffel Tower.
210,000The total paint area is 30-times the size of a football pitch – at around 210,000 square metres.
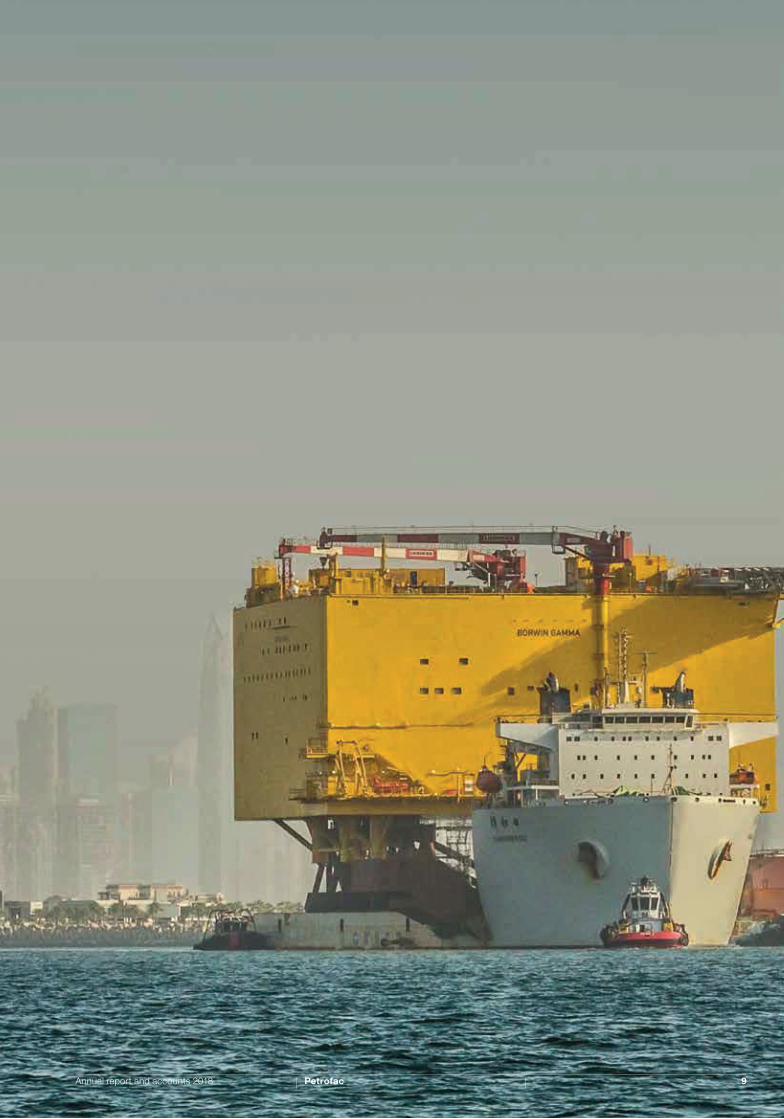
An incredible journey
The 18,000-tonne topside took 28 days to travel 12,000 kilometres from Dubai to the German North Sea. Despite facing potential threats from pirates in the Gulf of Aden, navigating the busy Suez Canal and encountering a hurricane-like storm in the Mediterranean, everything went as planned and the BorWin gamma topside arrived safely on 8 October 2018.
13.5 millionThe construction phase entailed 13.5 million man-hours
18,000 tonnes BorWin gamma platform weight
1,500 workersAt peak, the Petrofac workforce reached 1,500 people
1m BorWin gamma platform will supply more than one million homes with clean energy.

Constructed in Dubai, the platform has been installed in the North Sea, nearly 130 kilometres off the German coast. By the close of 2018 commissioning was largely complete, with completion scheduled by mid-2019.
Jacket and ties The first element to arrive onsite in the German North Sea was the jacket for the BorWin gamma platform. On its own, this six-legged structure weighed 5,600 tonnes and was in place by May 2018, ready for the topside to be installed and tied-in four months later.
Scope of work:
Engineering
Procurement
Construction
Installation
Commissioning and completion
Scan code to play video
Delivering a complex project to time and budgetThis is a complex project. Construction of the topside entailed more than 13.5 million man-hours, used more than 13,500 tonnes of steel, and took up almost five square kilometres of Dubai’s Drydocks World. Now in place in the North Sea and nearing completion, it is one of the world’s largest, heaviest HVDC platforms.
Extending Petrofac’s offshore wind credentialsWe have been involved with the BorWin cluster since as far back as 2009, when we were first enlisted to provide people, maintenance and support services to the adjacent BorWin alpha platform. In the intervening time, we have also delivered the Galloper wind farm project, and been awarded a floating wind turbine research project by the UK’s Carbon Trust, a Dutch offshore wind contract by TenneT, and a UK wind farm project for Transmission Capital. In total, offshore wind projects account for 10% of our 2019 Engineering & Construction bidding pipeline.
Demonstrating operational excellence Given its complexity, the project has entailed the usual mix of Petrofac determination and ingenuity. For example, to house the sophisticated electrical equipment, the converter rooms had to be built dust-free and climate-controlled. We had to create a robust chassis that allows for some flex. Loaded onto a semi-submersible vessel using a custom-made deck support frame, the finished topside was sailed 12,000 kilometres to the North Sea, where its installation involved the region’s first-ever floatover using dynamic positioning technology on a semi-submersible vessel.
Linked to strategy: Deliver organic growth
Moving into offshore wind Since 2014, we have been working in a consortium with Siemens to deliver the BorWin3 offshore wind grid connection project.
Petrofac is responsible for the engineering, procurement, construction and offshore installation of the BorWin gamma platform, which will house a Siemens high voltage direct current (HVDC) station that converts the alternating current produced by the wind turbines to direct current before transmitting it onshore to the German national grid.
Client: TenneT, the German-Dutch transmission grid operator
Location: Topside constructed at Drydocks World, Dubai, and installed in the North Sea
Scale: An 18,000 tonne facility being delivered in partnership with Siemens
Scope: Engineering, procurement, construction and offshore installation of the BorWin gamma platform
Start: 2014
End: 2019

GROUP CHIEF EXECUTIVE’S REVIEW
installation, commissioning or completion of several landmark projects, like the BorWin3 windfarm in the North Sea, and the RAPID refinery improvement in Malaysia.
Highlights for the EPS East business included a series of new contract wins in Iraq, plus significant awards in Oman and Bahrain. Meanwhile, for EPS West, the slight improvement in market conditions was reflected by several new awards and contract extensions.
We also initiated a new strategic programme which seeks to harness the true potential of digital technology, which should enable us to work faster, smarter and safer than ever before, and help our clients do so also. The pilot initiatives implemented in 2018 were a real success, and digitisation is set to be a central theme across the Company in 2019.
Achievements: delivering organic growthIn 2018, our organic growth strategy delivered significant success, including a further contract win in Turkey, three EPC contracts in India, and our first major project in Thailand.
In terms of adjacent sectors, we are now recognised as a well-established downstream player. Following our success in securing large refining projects, we are actively bidding on a number of similarly-sized petrochemical projects, and downstream opportunities make up approximately one-third of our 2019 Engineering & Construction bidding pipeline.
We also continue to extend our credentials in offshore wind. Following the successful delivery of the Galloper Wind Farm project, the prestigious BorWin3 project is progressing well and, in 2018, we were awarded a Dutch offshore wind contract by TenneT and a UK wind farm project for Transmission Capital.
Achievements: reducing capital intensity Of course, a big highlight of 2018 was the progress in reducing capital intensity in order to return to a position of balance sheet strength.
Particular landmarks include the sales of the Chergui asset, our interest in the Greater Stella asset, a 49% share of our Mexico operations, and the JSD6000 vessel.
This puts us in an excellent position for 2019. As the market recovers, we are working to position the business for growth.
I have to say that I am proud of and pleased with Petrofac’s 2018 performance.
There were one or two points of concern, which I will cover later. But, overall, it was a good year. We were strong on operational excellence, maintained our leadership position in our core markets, delivered growth in adjacent sectors, and ended the year in a net cash position.
This means we enter 2019 with a real sense of confidence and look towards profitable growth over the medium to long term.
Of course, it is our people who make this possible. As the market recovers and the business strengthens, a major theme will be employee engagement. We are therefore re-starting our graduate programme, increasing our focus on career development, aiming to lower the average age of the workforce, and striving for increased gender diversity.
Achievements: focusing on our coreOperational excellence was a central theme during 2018, as we continued to focus on the execution of a busy project portfolio.
Whilst there were many achievements to celebrate, the one area of our operational performance that caused real concern was a deterioration in our strong safety record, with three fatalities and a number of lost time incidents.
In particular, we were devastated by the tragic deaths of three workers in separate incidents in Kuwait and in Mexico and, once again, I extend our sincere condolences to their families. At the Board, the Executive Committee, and during our annual Safety Conference, the incidents were reviewed in detail, and we committed to a safety improvement plan to tackle the root causes. Whilst our safety record remains higher than that of our peers across key indicators, I do want to stress that ‘safe’ remains our most important value, and nothing we do at Petrofac can ever compromise our safety ethos. In the same vein, we will continue our commitment to evolve our Compliance agenda, which in 2018 saw the newly-created role of Chief Compliance Officer.
Meanwhile, across the Group, we completed more than 231 million man-hours of work, including the
We met our commitments and executed on our strategic objectives by focusing on our core, delivering organic growth and reducing capital intensity.
Ayman Asfari Group Chief Executive
10 Annual report and accounts 2018 Petrofac

We also continued to benefit from disciplined cost control. As a result, we were back to a net cash position by the end of the year – well ahead of plan.
With a stronger balance sheet, we may have more latitude to invest in the business. However, going forward, the clear intention is to remain a cost-efficient, capital-light business.
A healthy new order intake, with good revenue visibilityNew order intake for the year was US$5.0 billion, having delivered an impressive 40% win-rate in E&C. Given the market conditions and well-documented delays in the awards of several significant projects, this should be viewed as a satisfactory performance. As well as giving us a healthy order book and good revenue visibility for 2019, this shows that we remain competitive.
One thing I would like to stress is that we do continue to maintain our bidding discipline. Whilst we are pursuing a clear growth agenda, our margins will reflect the assumed risk, but we refuse to compromise on quality, compliance or safety.
Investing in our people and their career development Ultimately it is our people who are the key to Petrofac’s distinctive, delivery-focused culture, and, as you would expect, the last few years have been challenging for them. With that in mind, a particular priority for 2019 will be our people agenda.
I am pleased to report that we have already begun our graduate programme for a 2019 intake. We will select the most promising candidates from our core and growth markets, and deliver expert training through the Petrofac Academy coupled with on-the-job training.
As well as lowering the average age of the workforce and refreshing our talent pool, there will be a renewed emphasis on professional development and continued focus on our succession planning processes. We are also keen to bring more diversity to all levels of the Company. Meanwhile, to better understand and track employee engagement and address any issues, we will double the frequency of our PetroVoices survey and are introducing a new Workforce Engagement Forum.
I would like to re-iterate my thanks to all of our employees for their continuing commitment during this challenging year.
Solid foundationsWe have reflected on the progress we have made in the last couple of years on our strategic objectives. This, coupled with our future ambitions, has led us to evolve our strategic focus in a way that builds on our journey to date, and continues to set us up well for the future. As we enter 2019, we are focused fully on three core objectives: best-in-class delivery, positioning for growth and enhancing returns.
Looking a little further out, and with these evolved objectives in mind, I am confident the right market conditions are returning for Petrofac to prosper. For example, drivers for growth in our core Middle Eastern territories include a return to market stability, a determination to invest in local economies and capture more of the value chain, and a big push to develop gas resources.
Against this background, Petrofac’s credentials play incredibly well.
Together with strong client relationships, a cost-competitive delivery model, and a proven track record, we also have a demonstrable commitment to local delivery and in-country value as part of our DNA. From discussions with key influencers and decision-makers, I know these are the qualities our clients are looking for and we are well positioned to deliver.
I would like to extend my thanks to the Board, headed by René Médori, for their support and guidance throughout the year.Thanks to the measures we have taken in recent years, our culture, and our emphasis on operational excellence, I believe we have a solid foundation for growth, and I look forward to continuing to deliver on our strategy for our stakeholders.
Ayman Asfari Group Chief Executive 27 February 2019
I have no doubt in my mind that digital technology will change the way our sector operates and, just as important, the way our clients operate.
In 2019 we therefore initiated a major strategic programme to reimagine the way Petrofac operates – and understand how digital technology could help us work faster, smarter, and safer than ever before.
We have seen the impact of digital disruption in other industries and want to benefit from the changes that are likely to unfold in our own sector. During 2018, more than 100 potential projects were identified, 12 of which were initially prioritised for trial, several of which have been progressed with key clients. We also made some senior-level appointments of proven technology leaders, and installed a new Innovation Zone in Aberdeen.
In EPS, for example, we see that digital technology can be used to improve our earnings, enhance client satisfaction and introduce new service lines. Example projects include:
• Petrolytics – an analytics tool that uses machine-learning to predict plant performance, enhance maintenance schedules, and optimise production.
• Connected Worker – the use of mobile wearable technologies to provide a direct multi-media link between our offshore workers and our onshore experts and resources.
Meanwhile, in E&C, digital technology can help us to enhance our processes, and share learnings between teams and projects. Examples include:
• Improving oversight – to provide a graphical view of project progress across every function and, ultimately, track the location and status of all tools, components, and people.
• Removing repetition – using replication technology to design similar plant components, and automatically generate a full set of technical drawings for each one.
For 2019, we aim to extend the approach and accelerate the implementation.
OUR DIGITALJOURNEY
100potential projects were identified
Annual report and accounts 2018 Petrofac 11
Strateg
ic repo
rtG
overnance
Financial statem
ents

An experienced and highly capable team
2. ALASTAIR COCHRAN Chief Financial Officer
Responsibility Heads up the financial management of the Group, and also plays a significant role in setting its business strategy, including the drive to reduce capital intensity. He is also responsible for managing the Company’s relationships with financiers and investors.
Experience Joined Petrofac in 2016 from BG Group plc, where his responsibilities included corporate finance, M&A, strategy and business development. He began his career with KPMG before moving into investment banking with Barclays de Zoete Wedd, Credit Suisse First Boston and Morgan Stanley.
3. JOHN PEARSON Chief Operating Officer Engineering & Production Services
Responsibility As Chief Operating Officer, he is accountable for all aspects of the delivery, growth and strategic direction of the global EPS business.
Experience Joined Petrofac in 2017, prior to which he spent 28 years with AMEC Foster Wheeler and five years with Chevron, in the UK and US. His previous roles have included president of global oil, gas and chemicals, and multi-market roles running the Americas, Northern Europe and CIS regions. He has also been a Co-Chair of Oil & Gas UK.
5. DES THURLBY Group Director of Human Resources
Responsibility Has overall responsibility for advising on all people aspects of the business. This includes developing a business-focused people strategy, including succession planning, talent management, leadership development, compensation, key hires, performance culture and employee engagement.
Experience Joined Petrofac in 2017. He started his career as a graduate trainee with Ford Motor Company and spent 25 years in the automotive sector, including six years as HR Director for Jaguar Land Rover. He was also interim President of IMI China and Senior Vice President of Seadrill, an offshore drilling contractor.
4. GEORGE SALIBI Chief Operating Officer Engineering & Construction Services
Responsibility As Chief Operating Officer, he has overall accountability for strategy and delivery against our Engineering and Construction (E&C) business plan.
Experience Joined Petrofac in 1998 having spent 11 years in the offshore oil and gas EPC industry, and has held a variety of management and operational roles. He led some of the Company’s largest EPC projects, and his previous roles included Managing Director of the UAE, Oman and Algeria EPC operations. Most recently he was the Group Chief Commercial Officer. He has 32 years’ experience in the offshore and onshore oil and gas industry.
2,1
3,4
5
6,7,8,9
1. AYMAN ASFARI Group Chief Executive
Responsibility Works with the Board to set the strategy of the Group, and takes ultimate responsibility for the operational and financial performance of Petrofac. He also has a close involvement in the approach to corporate responsibility, including health, safety, ethical standards, security and the environment.
Experience Joined the Group in 1991 to establish Petrofac International, before which he led a major civil and mechanical construction business in Oman. He has a wealth of oil and gas industry knowledge, a clear strategic vision, and an entrepreneurial track record.
OUR LEADERSHIP TEAM
12 Annual report and accounts 2018 Petrofac

9. MATTHEW BARTON Group General Counsel
Responsibility Has responsibility for all Legal, Compliance and Company Secretariat functions. Ensuring that all colleagues have access to relevant, timely and commercially valuable legal advice, he also ensures that the Group’s business is conducted in accordance with all applicable laws and regulations.
Experience Joined Petrofac in 2018 with more than 20 years’ experience, 13 of which are in General Counsel roles, both in the UK and the Middle East. He began his legal career in private practice, working in London and Hong Kong before moving into the engineering and construction industry.
6. E S SATHYANARAYANAN Group Managing Director, Engineering & Construction Region One
Responsibility Has full operational and P&L responsibility for Petrofac’s Engineering, Procurement and Construction portfolio in its core geographical markets including the UAE, Kuwait and Algeria. He also heads up the Group’s technical resources, including the three Indian engineering centres.
Experience Joined Petrofac in 1995, and has held various key roles covering diverse geographical locations such as India, CIS and MENA, and led the Company’s entry into Iraq. He has more than 30 years of experience in the oil and gas sector.
8. SUNDER KALYANAM Group Managing Director, Engineering & Construction Region Two
Responsibility Has full P&L and stakeholder responsibility for delivering the E&C portfolio in Petrofac’s strategic growth regions. These include complementary geographies, identified for organic growth, such as India, Southeast Asia, Sub-Saharan Africa, and CIS, where the Group has a good understanding of risks and the capacity to deliver.
Experience Joined Petrofac in 1992, and has held a range of operational and management roles across the Group. Most recently, he was Regional Managing Director, E&C with responsibility for all Petrofac’s onshore operations in Kuwait, Iraq and Oman.
7. ELIE LAHOUD Group Managing Director, Engineering & Construction Region Three
Responsibility He has full P&L responsibility for and leads the operational teams in Iraq, Oman and Saudi Arabia. He also leads two E&C strategic initiatives – Digital Transformation and Project Management Capability Development aimed at maintaining and growing Petrofac’s competitiveness and bringing enhanced predictability in project delivery.
Experience Joined Petrofac in 1997 and has held several key roles including leading the delivery of the strategically significant BP Khazzan project and SVP for Oman operations. He is on the American University of Beirut Advisory Board for its faculty of engineering. He has 25 years’ industry experience.
10. ROBERTO BERTOCCO Chief Commercial Officer
Responsibility Has overall responsibility for our Engineering & Construction business’s Commercial, Project Controls, Project Management, Construction and Completion, Procurement, SubContracting, Systems Development, Quality and Proposals functions, and for Group Business Development.
Experience Joined Petrofac in 2012 as Executive Vice President, Regional Operations for the UAE and North Africa and as CEO of our joint venture Petrofac Emirates. Since 2016 he has led Petrofac’s EPCm business. He has 30 years’ international oil and gas experience, primarily within the EPC and EPCm contracting environments.
11. ROB JEWKES Chief Operating Officer, Integrated Energy Services
Responsibility Heads up the IES business, and has full responsibility for its business portfolio. Most recently he has been charged with the re-shaping of this portfolio, including a number of divestments and contract migrations and the re-positioning of IES as a route to the wider Petrofac services.
Experience Joined Petrofac in 2004 to build a Europe-based engineering services business, before moving into IES where his emphasis has been leveraging our engineering and project management capability. He has over 40 years’ experience in oil and gas and was previously CEO of Clough Engineering.
10 11
Oil and gas Engineering Operational/strategic management
Leadership team skill set
90% 73% 90%
Annual report and accounts 2018 Petrofac 13
Strateg
ic repo
rtG
overnance
Financial statem
ents

MARKET OUTLOOK
2019 E&C bidding pipeline (%)
Upstream gas 55%
Upstream oil 7%
Offshore wind 10%
Downstream 28%
900
800
700
600
500
400
300
200
100
02022202120202019201820172016201520142013201220112010200920082007
Source data: Markit, December 2018
Global upstream spending(US$ billion)
OpexCapex
The long-term market fundamentals are robustWe believe that the long-term market fundamentals are robust – and Petrofac is well positioned to benefit.
Among industry bodies, such as the International Energy Agency (IEA) and the Organization of Petroleum Exporting Economies (OPEC), there is consensus that global energy demand should grow strongly over the mid-to-long term, and that hydrocarbons will continue to play a significant role.
The most recent analysis from the IEA estimates that energy demand is set to grow by almost 27% by 2040 (under the new policies scenario1), by which time the world’s energy supply mix will divide into four broadly equal parts: oil, gas, coal and low-carbon sources. This will see demand for oil growing by more than 11 million barrels a day, or 12%, to exceed 106 million barrels a day. Meanwhile, demand for gas is estimated to grow by 44% to reach 5,399 billion cubic metres per year.
Even under the IEA’s sustainable development scenario2, demand for hydrocarbons remains reasonably strong. Demand for oil would
remain broadly flat to 2025, before falling back by around 25% by 2040, predominantly driven by fuel efficiency and electrification of road transportation. The only sector to register growth in oil demand under this scenario would be petrochemicals. Meanwhile, demand for gas would increase by 12% by 2025 and remain at those levels in 2040.
Under either scenario, large-scale investment in oil and gas infrastructure will remain necessary. Indeed, under its new policies scenario, the IEA anticipates cumulative investment in the oil and gas sector of more than US$20 trillion by 2040, which represents an annual investment of more than US$900 billion. Under the sustainable development scenario, the equivalent figure would approach US$14 trillion, or more than US$630 billion each year.
We therefore expect clients to continue to invest in long-term strategic projects, especially in regions with lower marginal costs of production such as the Middle East and North Africa (MENA). We also see opportunities in adjacent sectors where we have been growing our capability, such as offshore wind generation, as well as the potential for a substantial market in late-life and decommissioning services.
Petrofac is well positioned in some of the most resilient sectors of the marketPetrofac has an extensive track record in MENA, one of our core geographies. In its 2018 ranking of EPC contractors, Oil & Gas Middle East once again ranked Petrofac as the region’s top player (the eighth year in a row that we have taken one of the top four spots). Meanwhile, MEED (www.MEED.com) once again placed us as one of the top five contractors in MENA. MEED also named BP Khazzan as “Project of the Year”, with BP recognising Petrofac’s contribution.
With lower marginal costs of production, we expect the region’s resource holders to continue to invest in upstream projects over the short-to-medium term. Over the longer term, according to the IEA, meeting demand will depend increasingly on the larger resource holders in the region. By 2040, for example, oil production from the OPEC members located in the Middle East is forecast to rise by 6 million barrels per day (up from 30.0 million barrels per day in 2017 to 36.1 million barrels per day in 2040)3.
We have seen a return to growth in upstream capital spendingAfter recent declines, upstream capital spending is showing signs of recovery. In 2018, global upstream capital spending is thought to have grown by around 9%4, and is expected to increase in each of the next few years.
The Middle East has remained robust through the downturn and, in 2018, upstream capital spending returned to the peak levels of 2014, while global upstream capital spending remains 37% below the 2014 peak (see the chart below).
Petrofac has strong credentials in some of the most resilient sectors of the market
14 Annual report and accounts 2018 Petrofac

Major investment plans in many of our core markets remain intact. For example, the Kuwait Petroleum Corporation expects to invest US$500 billion through to 2040 to boost production, whilst the Abu Dhabi National Oil Company has a five-year capital expenditure plan of more than US$130 billion (of which approximately US$45 billion is earmarked for downstream developments). We also see an increased drive to develop gas resources in markets such as Algeria, Iraq, Saudi Arabia and the UAE, borne out by the fact that upstream gas projects account for 55% of our 2019 Engineering & Construction bidding pipeline.
Significant increases in upstream capital spending in 2019 are also expected in regions such as the CIS, Africa and Asia Pacific, where we already have a physical presence and strong relationships. The success of our organic growth strategy in such markets was demonstrated in 2018 through a further contract win in Turkey, three EPC contracts in India, and our first major project in Thailand.
We see good downstream opportunities – where Petrofac has been extending its credentialsIn addition to our upstream activities, Petrofac is well placed to participate in the market for downstream opportunities in the refining and petrochemical sectors.
Whilst refining and petrochemical investments are forecast to increase globally, we see a particular focus in the MENA region, as resource holders look to industrialise their economies, create employment, and capture more of the value chain.
For example, MEED suggests that the Gulf Cooperation Countries (GCC) are now poised for a boom in petrochemical project awards, with more than US$40 billion of projects already in the design phase – a record high.
Petrofac has continued to build its downstream credentials with several new refining projects secured over the last few years, and we are now bidding on a number of petrochemical projects. We were ranked as first in Refining and Petrochemicals Middle East magazine’s top 30 EPC contractors list. In total, downstream opportunities make up 28% of our 2019 Engineering & Construction bidding pipeline.
Globally, there is a significant proportion of ageing refining infrastructure that is likely to be replaced by new refining capacity designed to meet improved environmental standards. For example, Petrofac, in consortium with Samsung and Saipem, won a project in October 2018 with an overall value of around US$4 billion to transform the existing oil refinery in Sriracha, Thailand, into a more environmentally-friendly facility that will produce higher quality transportation fuels.
Continued opportunities and success in other adjacent sectors We have also been successful in moving into other adjacent sectors such as offshore wind generation. In 2018, for example, we continued to make good progress with the BorWin3 project, with the topside platform installed on the jacket in the German North Sea. We were also awarded a Dutch offshore wind contract by TenneT and a UK wind farm project for Transmission Capital.
In total, offshore wind projects account for 10% of our 2019 Engineering & Construction bidding pipeline.
We see a strengthening in upstream operating expenditure – with opportunities for PetrofacIn our reimbursable business, we have seen significant recent decreases in upstream operating expenditures. In Europe the recent spending peak was reached in 2013 and in the Middle East it was in 2014, with subsequent falls driven by deflation in the supply chain and decreasing activity levels.
A return to modest growth was reached in 2017, and the trend continued in 2018, with a 5% increase in Europe and a 4% gain in the Middle East5. As shown by the chart on page 14, global operating expenditure is expected to continue to grow for each of the next few years.
We secured many new awards and contract extensions in 2018. With new operating models among operators, and the progressive deployment of new digital technologies, we expect to continue to evolve our service offering.
Tendering activity remains high, but competitiveWhile tendering activity within our core markets remained high through 2018 and into 2019, we continue to see high levels of competition. However, by lowering our cost base, investing in digital technologies, and focusing on operational excellence, we have shown that we are able to compete effectively while maintaining our bidding discipline.
1 International Energy Agency, World Energy Outlook 2018, the new policies scenario “provides a measured assessment of where today’s policy frameworks and ambitions, together with the continued evolution of known technologies, might take the energy sector in the coming decades. The policy ambitions include those that have been announced as of August 2018 and incorporates the commitments made in the Nationally Determined Contributions under the Paris Agreement, the 2015 United Nations Climate Change Conference, but does not speculate as to further evolution of these positions. Where commitments are aspirational, this scenario makes a judgement as to the likelihood of those commitments being met in full. It does not focus on achieving any particular outcome: it simply looks forward on the basis of announced policy ambitions. Among recent policy announcements, the New Policies Scenario includes the European Union’s new, more ambitious 2030 renewable energy and energy efficiency targets. It likewise includes the June 2018 announcement by China
of a new three-year action plan for cleaner air. It reflects the impact of the planned revision of the Corporate Average Fuel Economy standards in the United States, as well as the announced US Affordable Clean Energy rule that replaces the previous Clean Power Plan. It also takes account of Japan’s revised basic energy plan and Korea’s 8th National Electricity Plan. It is the New Policies Scenario to which we devote most space and attention.”
2 www.iea.org/weo/weomodel/sds/ “Based on existing and announced policies – as described in the IEA New Policies Scenario – the world is not on course to achieve the outcomes of the UN SDGs Sustainable Development Goals most closely related to energy: to achieve universal access to energy (SDG 7), to reduce the severe health impacts of air pollution (part of SDG 3) and to tackle climate change (SDG 13). The SDS Sustainable Development Scenario sets out an ambitious but pragmatic vision of how the global energy sector can evolve in order to achieve these critical
energy-related SDGs. The SDS starts with the SDG outcomes and then works back to set out what would be needed to deliver these goals in the most cost-effective way. The benefits in terms of prosperity, health, environment and energy security would be substantial, but achieving these outcomes would require a profound transformation in the way we produce and consume energy.”
3 International Energy Agency, World Energy Outlook 2018
4 IHS Markit Global Upstream Spending Report, December 2018
5 IHS Markit Global Upstream Spending Report, December 2018
Annual report and accounts 2018 Petrofac 15
Strateg
ic repo
rtG
overnance
Financial statem
ents

OUR STRATEGY
A clear and focused strategy
ENGAGING WITH LOCAL COMMUNITIES
GOVERNANCE AND ETHICAL BUSINESS PRACTICES
DEVELOPING OUR PEOPLE
ENSURING SAFETY, ASSET INTEGRITY AND SECURITY
OUR STRATEGIC PRIORITIES FOR 2018 PERFORMANCE IN 2018 PRIORITIES FOR 2019
FOCUS ON OUR COREBuild relentlessly on our existing strengths and bring continuous improvements to the way we manage the business
• Improve our cost competitiveness• Build on our record of operational excellence
Over more than 35 years, we have built a strong reputation for commitment, delivery and operational execution in our core services – delivering capital projects and supporting our clients’ operating assets.
In today’s tough environment, our people continue to find new ways to increase efficiency, control costs and deliver more value to our clients.
The emphasis is to deliver continuous enhancements to the way we manage our business. Crucially, this goes well beyond our operational performance, and extends to considerations like health and safety, our environmental performance, and our approach to ethics and compliance.
– Protected margins through operational excellence initiatives – Embedded a new organisational leadership structure – Launched a Digital Transformation Programme to differentiate our service delivery
• Made solid progress on operational delivery, reaching the completion and/or commissioning phases on major projects such as the Lower Fars Heavy Oil and KNPC Clean Fuels projects in Kuwait, and the Upper Zakum Field Development in Abu Dhabi.
• Investigated the deployment of digital technologies, appointed a new technology leadership team, and initiated several proof of concept projects, with a view to achieving further differentiation and to take operational excellence to a new level
• Continued to focus on process improvements and cost base reductions in key markets such as Kuwait, Iraq, Oman and the UK
• Ranked as the top EPC contractor by Middle East Oil & Gas magazine, and MEED named BP Khazzan ‘Project of the Year’ with BP recognising Petrofac’s contribution
Best in class delivery
Improve our cost competitiveness
Drive value from digital, moving from proof-of-concept to industrialised and live solutions
Increase our local content and strengthen our positioning
Invest in talent development and management to maximise the return from our most valuable resource
DELIVER ORGANIC GROWTHSeek and achieve managed growth in both complementary geographies and adjacent sectors
• Broaden and deepen our downstream credentials• Extend our service offerings into complementary sectors,
where they can be differentiated• Extend existing service lines into new geographies
where clear synergies exist
Our traditional strengths in markets like Middle East and North Africa (MENA) and the UK provide an excellent launch pad for Petrofac to move progressively into both complementary geographies and adjacent sectors.
For example, we continue to bid actively in India, Southeast Asia and the CIS, where we have a thorough understanding of the risks, associated mitigations and the capacity to deliver. Indicative successes included three EPC contracts in India, our first major project in Thailand, and our first PMC (Project Management Consultancy) projects in Turkey, Kazakhstan and Iraq.
In terms of adjacent sectors, we continued to extend our downstream credentials with several new refinery wins, and we are poised to benefit from forthcoming investments in petrochemical facilities. We also continue to make gains in the offshore wind sector and are expanding our offering into brownfield modifications on and offshore.
– US$5.0 billion of new awards – US$1.9 billion of awards in adjacent markets – Tendering more downstream projects
• Secured US$4 billion contract in a three-way consortium for Thai Oil Public Company Limited’s Clean Fuels Project
• Secured three EPC contracts in India, for Hindustan Petroleum Corporation, Bharat Petroleum Corporation Limited, and Vedanta, jointly valued at around US$568 million
• Extended activity in Turkey with a multi-million dollar Project Management Consultancy (PMC) services joint venture contract in support of the BOTAS North Marmara Underground Gas Storage Expansion Project
• Extended experience in the offshore wind sector, with the ongoing success of the BorWin3 project, and contract wins for both Transmission Capital and TenneT
Position for growth
Continue to expand our presence into complementary geographies – Southeast Asia, India, CIS, East Africa
Continue to expand E&C into complementary sectors – refining, petrochemicals and offshore wind
Continue to expand EPS into complementary sectors – decommissioning, well plug & abandonment, brownfield projects and modifications
REDUCE CAPITAL INTENSITYImprove the overall resilience, agility and financial efficiency of the business
• Divest non-core assets• Maintain our focus on cash management • Protect shareholder value
Petrofac has a strong reputation for operating with financial efficiency and earning differentiated margins.
In response to the changing industry environment and our evolved business strategy, the Group is now focused on reducing capital intensity – by deleveraging the balance sheet and improving cash conversion.
For example, we are bringing increased rigour to cash management. We are also considering the divestment of further non-core assets. When we do choose to co-invest in any additional resources, we do so against clear and disciplined criteria.
– Sold US$0.8 billion of non-core assets – Formally exited the deepwater market – Increased return on capital employed to 26%
• Returned to net cash of US$90 million, reflecting strong working capital management and net divestment proceeds
• Completed the disposal of our interest in the Greater Stella Area Development in the North Sea
• Completed the sale of our interest in the Chergui gas concession in Tunisia
• Completed the sale of 49% of our operations in Mexico
• Sold the JSD6000 deepwater installation vessel
Enhancing returns
Complete the divestment of non-core assets
Optimise working capital
Maintain a strong balance sheet
OUR LICENCE TO OPERATE
16 Annual report and accounts 2018 Petrofac

PROTECTING THE ENVIRONMENT
GENERATING ECONOMIC VALUE IN-COUNTRY
RESPECTING HUMAN RIGHTS ACROSS OUR SUPPLY CHAIN
Key performance indicators See pages 20-21
Directors’ remuneration report See page 90
Principal risks and uncertainties See page 25
OUR STRATEGIC PRIORITIES FOR 2018 PERFORMANCE IN 2018 PRIORITIES FOR 2019
FOCUS ON OUR COREBuild relentlessly on our existing strengths and bring continuous improvements to the way we manage the business
• Improve our cost competitiveness• Build on our record of operational excellence
Over more than 35 years, we have built a strong reputation for commitment, delivery and operational execution in our core services – delivering capital projects and supporting our clients’ operating assets.
In today’s tough environment, our people continue to find new ways to increase efficiency, control costs and deliver more value to our clients.
The emphasis is to deliver continuous enhancements to the way we manage our business. Crucially, this goes well beyond our operational performance, and extends to considerations like health and safety, our environmental performance, and our approach to ethics and compliance.
– Protected margins through operational excellence initiatives – Embedded a new organisational leadership structure – Launched a Digital Transformation Programme to differentiate our service delivery
• Made solid progress on operational delivery, reaching the completion and/or commissioning phases on major projects such as the Lower Fars Heavy Oil and KNPC Clean Fuels projects in Kuwait, and the Upper Zakum Field Development in Abu Dhabi.
• Investigated the deployment of digital technologies, appointed a new technology leadership team, and initiated several proof of concept projects, with a view to achieving further differentiation and to take operational excellence to a new level
• Continued to focus on process improvements and cost base reductions in key markets such as Kuwait, Iraq, Oman and the UK
• Ranked as the top EPC contractor by Middle East Oil & Gas magazine, and MEED named BP Khazzan ‘Project of the Year’ with BP recognising Petrofac’s contribution
Best in class delivery
Improve our cost competitiveness
Drive value from digital, moving from proof-of-concept to industrialised and live solutions
Increase our local content and strengthen our positioning
Invest in talent development and management to maximise the return from our most valuable resource
DELIVER ORGANIC GROWTHSeek and achieve managed growth in both complementary geographies and adjacent sectors
• Broaden and deepen our downstream credentials• Extend our service offerings into complementary sectors,
where they can be differentiated• Extend existing service lines into new geographies
where clear synergies exist
Our traditional strengths in markets like Middle East and North Africa (MENA) and the UK provide an excellent launch pad for Petrofac to move progressively into both complementary geographies and adjacent sectors.
For example, we continue to bid actively in India, Southeast Asia and the CIS, where we have a thorough understanding of the risks, associated mitigations and the capacity to deliver. Indicative successes included three EPC contracts in India, our first major project in Thailand, and our first PMC (Project Management Consultancy) projects in Turkey, Kazakhstan and Iraq.
In terms of adjacent sectors, we continued to extend our downstream credentials with several new refinery wins, and we are poised to benefit from forthcoming investments in petrochemical facilities. We also continue to make gains in the offshore wind sector and are expanding our offering into brownfield modifications on and offshore.
– US$5.0 billion of new awards – US$1.9 billion of awards in adjacent markets – Tendering more downstream projects
• Secured US$4 billion contract in a three-way consortium for Thai Oil Public Company Limited’s Clean Fuels Project
• Secured three EPC contracts in India, for Hindustan Petroleum Corporation, Bharat Petroleum Corporation Limited, and Vedanta, jointly valued at around US$568 million
• Extended activity in Turkey with a multi-million dollar Project Management Consultancy (PMC) services joint venture contract in support of the BOTAS North Marmara Underground Gas Storage Expansion Project
• Extended experience in the offshore wind sector, with the ongoing success of the BorWin3 project, and contract wins for both Transmission Capital and TenneT
Position for growth
Continue to expand our presence into complementary geographies – Southeast Asia, India, CIS, East Africa
Continue to expand E&C into complementary sectors – refining, petrochemicals and offshore wind
Continue to expand EPS into complementary sectors – decommissioning, well plug & abandonment, brownfield projects and modifications
REDUCE CAPITAL INTENSITYImprove the overall resilience, agility and financial efficiency of the business
• Divest non-core assets• Maintain our focus on cash management • Protect shareholder value
Petrofac has a strong reputation for operating with financial efficiency and earning differentiated margins.
In response to the changing industry environment and our evolved business strategy, the Group is now focused on reducing capital intensity – by deleveraging the balance sheet and improving cash conversion.
For example, we are bringing increased rigour to cash management. We are also considering the divestment of further non-core assets. When we do choose to co-invest in any additional resources, we do so against clear and disciplined criteria.
– Sold US$0.8 billion of non-core assets – Formally exited the deepwater market – Increased return on capital employed to 26%
• Returned to net cash of US$90 million, reflecting strong working capital management and net divestment proceeds
• Completed the disposal of our interest in the Greater Stella Area Development in the North Sea
• Completed the sale of our interest in the Chergui gas concession in Tunisia
• Completed the sale of 49% of our operations in Mexico
• Sold the JSD6000 deepwater installation vessel
Enhancing returns
Complete the divestment of non-core assets
Optimise working capital
Maintain a strong balance sheet
Annual report and accounts 2018 Petrofac 17
Strateg
ic repo
rtG
overnance
Financial statem
ents

CASE STUDY
CREATING IN-COUNTRY VALUE FOR OMANOUR TAKATUF PETROFAC OMAN (TPO) TECHNICAL TRAINING CENTRE IS HELPING TO ACCELERATE THE DEVELOPMENT OF YOUNG OMANIS – AND PROVIDE THE SULTANATE’S ENERGY INDUSTRIES WITH A STEADY SUPPLY OF QUALIFIED, JOB-READY GRADUATES
18 Annual report and accounts 2018 Petrofac

Annual report and accounts 2018 Petrofac 19

Investing in Oman for over 30 years
TPO represents a significant investment in the Omani economy
TPO has capacity for 600 students annually, with the option to scale-up to 1,000.600
US$30m
TPO complements Petrofac’s wider Omani credentials. Elsewhere in the Sultanate, we employ around 800 people, nearly a third of whom are Omani nationals. 32%
60:40TPO is a joint venture between 40:60 Petrofac and Takatuf, the human capital solutions provider.
Across Petrofac’s Omani operations, and through our subcontractors, we provide employment for 12,000 people in Oman.
12,000
US$1.5bnTPO is just one of the ways we create value in Oman. Through our wider ICV programmes, we quantify the scale of our investment in the Sultanate – which, cumulatively, is valued at US$1.5 billion.
Investment in the Sultanate
Petrofac Takatuf|||||||||||||||||||||||||||||||||||||||||||||||||||||||||||||||||||||||||||||||||||||||||||||||||||||||||||||||||||||||||||||||||||||||||||||||||||
Business model See page 07
KEY FACTS

Bringing immersive learning to Oman The new Takatuf Petrofac Oman (TPO) technical training centre is a truly world class facility.
The result of a 60:40 joint venture between the human capital solutions provider Takatuf and Petrofac, the new US$30 million initiative welcomed its first cohort of students in May 2018.
A clear commitment to the Omani economyPetrofac has deep roots in Oman. Active in the country since 1988, we have built many projects, have a close working relationship with the Sultanate’s oil and gas players, and continue to increase our locally-based capabilities. In doing so, we are pursuing an in-country value strategy based on four key pillars: Omanisation in operations, local vendor development, local sourcing of goods and services, and developing local skill sets. The TPO investment demonstrates the strength of our commitment.
Integrating the latest digital technologiesThe TPO facilities combine interactive workshops and digital classroom content with augmented reality (AR) learning and immersive, practical experiential training in workshops and four specialised live process plants. Towering nine metres above the ground, these facilities have exactly the same look, feel and functionality as live hydrocarbon assets. This enables trainees to work through real-life scenarios, like a start-up or even an emergency shut-down – getting all of the reality, with none of the risks.
Accelerating the next generation’s journey to job-ready techniciansOman is investing many billions of dollars in its strategic assets and infrastructure, and the government is determined that the value remains in-country. To be successful it requires the right skills to be available locally, so new jobs can be taken up by Omani nationals. TPO contributes to this goal, by training to 600 trainees a year – who graduate with a rare combination of sound theoretical knowledge and deep practical experience.
Initiative: Takatuf Petrofac Oman technical training centre
Partner: A 60:40 joint venture between Takatuf Oman and Petrofac
Location: Knowledge Oasis, Muscat, Oman
Value: US$30 million
Scope: Design, engineering, procurement, and construction of the facility, specification of the facilities, development of the curriculum, and management of the operations.
Start: 2015
End: Ongoing
Linked to strategy: Focus on our core
World-class facilities:
4x full-size true to life production facilities
Fully integrated control room
The latest training and competence management software
Innovative augmented reality (AR) immersive technology
Providing internationally recognised qualifications, equivalent to NVQ Level 3, TPO was able to draw on a valuable blend of Petrofac skills – as well as building and operating the centre, the TPO teams came up with the design for the physical buildings, the specification for all its facilities, and a curriculum for the students to follow.
Internationally-accredited technical training TPO is the only institute in Oman which is internationally accredited to provide vocational training to NVQ Level 3.
Immersive technology Among the learning tools are a range of the latest immersive augmented reality (AR) technologies.
A complete solution Petrofac had all the in-house capabilities to deliver the solution – including the project delivery skills, the training knowhow, and the digital technology credentials.
Scan code to play video

US$7,873m
US$6,395m
US$5,829m
16
17
18
16%
22%
26%
16
17
18
US$285m
US$361m
US$353m
16
17
18
US$1m
US$(29)m
US$64m
16
17
18
US$669m
US$748m
US$671m
16
17
18
Petrofac sets KPI targets and assesses performance against these benchmarks on a regular basis Part of 2018 Executive Directors’
remuneration.
Description Measures the level of revenue of the business.
Measurement Revenue for the year as reported in the consolidated income statement.
9%
Description EBITDA means earnings before interest, tax, depreciation and amortisation and provides a measure of the operating profitability of the business.
Measurement Earnings before interest, tax, depreciation and amortisation (EBITDA) is calculated as operating profit/(loss), including the share of profit from associates and joint ventures, adjusted to add back charges for depreciation and amortisation (see A3 in Appendix A to the consolidated financial statements).
10%
2%Description Provides a measure of the net profitability of the business.
Measurement Business performance net profit attributable to Petrofac Limited shareholders, as reported in the consolidated income statement.
26%Description ROCE is a measure of the efficiency with which the Group is generating operating profits from its capital.
Measurement Return on capital employed (ROCE) is calculated as EBITA (earnings before interest, tax and amortisation, calculated as EBITDA less depreciation) divided by average capital employed (see A8 in Appendix A to the consolidated financial statements).
Revenue
EBITDA1,2
Business performance net profit1,2
Return on capital employed (ROCE)1,2
KEY PERFORMANCE INDICATORS
Description Measures the reported net profitability of the business.
Measurement Reported net profit/(loss) attributable to Petrofac Limited shareholders as per the consolidated income statement.
321%
Reported net profit:
20 Annual report and accounts 2018 Petrofac

0.013
0.009
0.018
16
17
18
0.10
0.05
0.06
16
17
18
83.1¢/s
106.2¢/s
102.3¢/s
16
17
18
US$11.7bn
US$10.2bn
US$9.6bn
16
17
18
Our strategy See page 16
Directors’ remuneration report
See page 90
Description EPS provides a measure of net profitability of the Group taking into account changes in the capital structure, for example, the issuance of additional share capital.
Measurement Business performance EPS as reported in the consolidated income statement and calculated in accordance with note 9 to the consolidated financial statements.
4%
Description Provides an indication of the Group’s service capacity.
Measurement For the purposes of the Annual Report, employee numbers include contract staff and the Group’s share of joint venture employees.13,500
12,500
11,500
16
17
18
8%
Measurement Free cash flow, as per the Financial review, page 42. Cash conversion is calculated as cash generated from operations divided by business performance EBITDA.
US$386m
US$281m
US$921m
16
17
18
120%
77%
101%
16
17
18
Description These KPIs measure both the absolute amount of cash generated from operations and the conversion of EBITDA to cash.
Measurement Lost time injury (LTI) and recordable injury (RI) frequency rates are measured on the basis of reported LTI and RI statistics for all Petrofac companies, subcontractors and partners, expressed as a frequency rate per 200,000 man-hours. We aim continually to improve our safety record, but our target for these measures is zero.
Description Provides a measure of the safety performance of the Group, including partners and subcontractors
Description The Group uses this KPI as a measure of the visibility of future revenues.
Measurement Backlog consists of: the estimated revenue attributable to the uncompleted portion of Engineering & Construction operating segment contracts; and, with regard to Engineering & Production Services, the estimated revenue attributable to the lesser of the remaining term of the contract and five years. The Group uses this key performance indicator as a measure of the visibility of future revenue (see note 3 to the consolidated financial statements).
1 Business performance before exceptional items and certain re-measurements. This measurement is shown by Petrofac as a means of measuring underlying business performance.2 2016 and 2017 re-presented due to the reclassification of an item from exceptional items and certain re-measurements to business performance as set out in note 6 to the consolidated
financial statements.3 2016 restated as the Group no longer recognises backlog in respect of the Integrated Energy Services’ contracts.
6%
Diluted earnings per share (EPS )1,2
Employee numbers
Free cash flow and cash conversion2
Lost time injury and recordable injury frequency rates per 200,000 man-hours
Backlog3
Annual report and accounts 2018 Petrofac 21
Strateg
ic repo
rtG
overnance
Financial statem
ents

The risk governance process is supported by regular risk assessments and reviews of existing and new opportunities, by considering the risk exposure and risk appetite. The diagram on the left sets out the risk governance structure in operation, showing the interaction between the various risk review and management committees.
The Group Risk Committee (GRC) is responsible for the assurance of the Enterprise Risk Management Framework agreed by the Board, including the recommendation of Group policies, principal risks and risk appetite, and the application of the Group’s Delegated Authorities.
The GRC reviews all material new business opportunities and projects (including bid submissions, new country entries, joint ventures, investments, acquisitions and disposals) and is responsible for providing direction as to the management and mitigation of risk exposure. No proposal is presented to the GRC without first being reviewed and supported at the divisional level.
In addition to the Group’s regular risk review meetings, the Executive Committee meets regularly, where safety, compliance, operational, commercial and finance matters are discussed, with any emerging risks and opportunities being identified and addressed as appropriate.
As with all aspects of good governance, the effectiveness of risk management and internal control also depends on the individuals responsible for operating the systems that are put in place.
Risk management frameworkThe Group’s risk management framework is designed to underpin the Group’s longer-term sustainability. It is based on the principles and guidelines of BS ISO 31000/2018 and encompasses the policies, culture, organisation, behaviours, processes, systems (and other aspects of the Group) that, taken together, facilitate its effective and efficient operation. The framework supports the Board in exercising its overall responsibilities and to:
• Regulate the entry of appropriate opportunities and risks into the Group
• Develop our understanding of the most significant threats and opportunities
• Promote active management of risk exposures down to acceptable levels
• Assist the Group in delivering business plan objectives and operational performance
Identifying and managing risks and opportunities is key to the successful delivery of our strategy. We operate in a challenging environment and understand that risks are an inherent part of our business.
We believe our risk management framework provides us with the structure to identify the risks and uncertainties that may impact our business, thereby underpinning our ability to achieve our objectives and assess opportunities as our business evolves.
In 2018, there was a particular focus on strengthening the Group’s Enterprise Risk Management Framework, in particular the more formal articulation of the Group’s risk appetite and a comprehensive review of the principal risks.
Risk governancePetrofac’s overall system of risk governance centres on a number of committees and management processes, which bring together reports on the management of risk at various levels.
PETROFAC OPERATES IN A CHALLENGING ENVIRONMENT, WHERE CAREFUL MANAGEMENT OF RISKS IS KEY.
Risk Governance Framework
Sets and approves risk appetiteApproves Key Risk Register Approves the principal risks Approves significant opportunities
BOARD
Reviews Key Risk Register Reviews principal risks and risk appetiteProvides assurance on framework
AUDITCOMMITTEE
Oversight of Key Risk Register, principal risks and risk appetiteReviews and recommends significant opportunities
GROUP RISK COMMITTEE
Divisional management oversight and review of opportunities
DIVISIONAL RISK REVIEW COMMITTEE
Risk management is embedded within each service line
SERVICELINES
Assurance to management, Audit Committee and the Board
GROUPFUNCTIONS
INTERNALAUDIT
RISK MANAGEMENT
22 Annual report and accounts 2018 Petrofac

Enterprise Risk Management system (and other tools)
Leadership, communications and engagement
Company values and culture
Risk integration
Strategic planning
Medium-term planning
Prospect phase
Go/No-go process
Proposal phase
Design
Procurement
Execution
Operation
Hand over
Management support processes
Infrastructure
Company vision and strategy
Company values
Group policies and standards
Risk appetite anddelegated authorities
Asset integrity framework
Code of Conduct
Risk management process
Risk Review Committees
Global insurance programme
Emergency preparedness
Risk management process
Communicate and consult
Riskassessment
Risktreatment
Riskmonitoring
Riskreporting
Riskidentification
Assurance
During 2018, the framework continued to mature and we have produced procedures to support its application to ensure it is followed consistently across the business.
Risk appetiteDuring 2018, we undertook an exercise to more formally articulate our risk appetite in the context of our strategic priorities and for each of the Group’s principal risks. We will monitor activities against the more formal appetite statements during 2019 and these will be reviewed on at least an annual basis.
The Group’s risk appetite will govern the Delegated Authorities and operation of Risk Review Committees, that are embedded across the Group.
2018 reviewDuring the year we continued to enhance our processes and controls to improve both the consistency and transparency of our approach to risk management. The following improvements were made:
• Revised the Enterprise Risk Management Governance and Framework to align with revised standards (ISO 31000:2018) and regulatory requirements
• Enhanced Group oversight of opportunities by amending the GRC mandate, adding further assurance to our Group risk reviews, aligning GRC membership and attendees to organisational changes and enabling wider cross-management input
• Developed a more formal articulation of risk appetite
• Revised the Group’s principal risks and revised our approach and engagement with risk owners to improve monitoring of principal risks, mitigating actions and key risk indicators
• Reviewed our approach to project risk management consistent with new IFRS requirements
• Reviewed and enhanced key Group control processes including:
– Review of existing Group policies, standards and procedures
– Revision of our Delegated Authorities
• The Third Party Risk Review Committee and Compliance and Ethics Committee continued to meet regularly to review applicable third-party relationships and provide oversight of our compliance arrangements
• Embedded a compliance monitoring programme on projects
• Organisational changes primarily relating to the E&C and EPS business, designed to provide clarity of leadership for our divisions and ensure the optimal long-term structural foundation for the business to deliver our strategic priorities
• We continued to review succession planning and talent development
• Our regular employee survey was conducted, helping to continually drive employee engagement
• We continued to implement findings from lessons learned reviews, and we conducted regular ‘cold eye reviews’ across our E&C projects to support them in identifying risks and mitigating potential impacts
• We continued to develop and expand our ‘stage gate’ approach to our E&C projects with additional improvements introduced through project controls and operational processes becoming more systematic
• The internal audit programme continued to apply a risk-based approach
• We continued to implement a financial controls improvement programme, a broad-reaching initiative to improve our financial controls and provide enhanced assurance. This is building on existing practices and will improve the way we work
• We continued to expand our intrusion detection monitoring of cyber-security threats and tightened our controls, including establishment of a Global Cyber-Security Council
• Refreshed the Global IT Security Policy, and a number of new Information Security standards have been published
RISK MANAGEMENT FRAMEWORK
Annual report and accounts 2018 Petrofac 23
Strateg
ic repo
rtG
overnance
Financial statem
ents

RISK MANAGEMENT CONTINUED
VIABILITY STATEMENT
• A material decline in oil price relative to both our and market expectations;
• A substantial reduction in forecast new orders in Engineering & Construction;
• A material financial loss resulting from poor execution of a major lump-sum project and/or adverse commercial or legal settlements;
• A significant decline in the operating and financial performance of Engineering & Production Services; and
• An increase in working capital driven by a deterioration in contractual terms, weak cash management or delays in commercial settlements.
In considering the impact of these stress test scenarios, the Board has reviewed realistic mitigating actions that could be taken to avoid or reduce the impact or occurrence of the underlying risks. These include reducing operating expenditure, cutting discretionary capital expenditure, suspending dividends and disposing of non-core assets.
The Board has also reviewed and approved the Group’s funding plan, long term liquidity forecasts and risk management policies, which monitor and mitigate the risk of a change in our financial position. In certain scenarios, we may need to raise additional funds to supplement cash flow from operations or to provide additional liquidity headroom. The Directors believe the Group has access to sufficient sources of funding at commercially acceptable rates throughout the assessment period.
Whilst the principal risks all have the potential to affect future performance, none of them are considered likely either individually or collectively to threaten the viability of the business over the assessment period. Based on the results of this detailed assessment, the Directors have a reasonable expectation that the Group will be able to continue in operation and meet its liabilities as they fall due over the next three years.
The Board regularly reviews the funding position of the Group, its projected liquidity requirements and factors that could adversely affect the Group’s future long-term viability. In doing so the Directors assess the prospects of the Group by reference to its current financial and operational position, its recent and historical financial performance, its future financial plans and the potential impact of the principal risks and mitigating factors described on pages 25 to 29.
The Directors have assessed the viability of the Group over a three-year period to 31 December 2021. The Board believes that this is an appropriate time horizon given its business portfolio, order backlog and business development pipeline offer limited visibility beyond three years. The Board reviews its prospects over a longer-term horizon and prepares a three year business plan that is dependent on the external market environment, securing new orders at sustainable margins, operational performance and capital discipline. The Group’s business model aims to deliver sustainable, long term value through dividend payments and financial returns from share price growth.
The Directors considered the following principal risks as the most important in their assessment of the viability of the Group:
• Market conditions;
• Worsening political risks in key geographies;
• Failure to meet future order targets;
• Operational and project performance;
• Licence to operate;
• Delivery of our strategy; and,
• Loss of financial capacity.
The Group’s business plan forecasts have been stress tested against a number of severe but plausible risks to the business that could potentially impact the Group’s ability to fund its future activities and adhere to its banking covenants:
• A number of HSSEIA deep dives were conducted across the business to identify and address key related concerns, with focus on the Group Safety Improvement Plan
• As part of our crisis management programme, we conducted simulation exercises across the organisation
• There has been a continued focus on evacuation and emergency response with mock exercises regularly planned and conducted
• A number of HSSEIA standards have been updated and published
Principal risksThe Board defines principal risks as those risks that, given the Group’s current position, could materially threaten our business model, future performance, prospects, solvency, liquidity, reputation, or prevent us from delivering our strategic objectives.
The Key Risk Register (KRR) is the means by which the Group’s principal risks are reported to the Audit Committee and the Board for review. It includes strategic, operational, compliance, financial and people risks, together with external factors over which the Group may have little or no direct control, such as market conditions and worsening political risks in key geographies. The GRC reviews the KRR quarterly prior to submission to the Audit Committee.
The KRR is designed to provide the Board and Audit Committee with clarity around the Group’s principal risks and uncertainties, ownership, accountability and mitigation strategies, to promote active engagement, informed debate and constructive challenge, and to keep under review the effectiveness of decision making processes.
During 2018, we reviewed the Group’s principal risks, drawing on feedback from the business, executive management and the Audit Committee, benchmarking them against our peers and good governance practice. Emerging risks were considered as part of this exercise, for example Brexit, but the Board believes that as an international Group, we have little exposure to the European continent and do not expect Brexit to have any significant impact on our business.
24 Annual report and accounts 2018 Petrofac

In terms of managing these risks, our systems of risk management and internal control are founded upon deployment of our Enterprise Risk Management Framework (based upon BS ISO 31000:2018), and our Internal Control Framework. Details of these are included in the Audit Committee report on pages 82 to 87.
PRINCIPAL RISKS AND UNCERTAINTIES
Principal risks are those risks that, given the Group’s current position, could materially threaten the business model, future performance, prospects, solvency, liquidity, reputation, or prevent us from delivering our strategic objectives.
MARKET CONDITIONS
Description and impactLow and/or unstable oil and gas prices impact the capital expenditure plans of our key clients and the demand for our services, limiting our profitability and growth. Over the longer term, volatility in oil and gas prices could influence and change the industry’s business models and investment trends.
The financial performance of IES is directly impacted by oil and gas price volatility.
Mitigation and managementThe oil and gas market is showing signs of improvement. Oil prices have improved, and the majority of forecasts expect a rise in price in the medium term. We expect clients in our core markets will continue to invest in long-term strategic projects, especially regions with lower costs of production. New investment decisions are now being taken and capital investment is expected to continue to rise.
We achieved US$5.0 billion of new order intake during 2018, providing us with good revenue visibility, and we continue to see high levels of tendering activity.
We are pushing forward with organic growth initiatives. During 2018, we continued to grow our business through the expansion of existing services and diversification into new geographies and sectors.
We have maintained strong relationships with our clients through the recent downturn, working with them to ensure we have strong commercial and contract management on our projects. We continue to focus on operational excellence to remain competitive.
Significant movements in exchange rates could impact our financial performance.
The majority of Group revenues are denominated in US dollars or currencies pegged to the US dollar. Where we procure equipment or incur costs in other currencies, we use forward currency contracts to hedge any related exposure.
LinksFor more information see: pages 14-15; and 168
ChangeOverall, the market environment has improved during 2018 as the oilfield services sector slowly adjusted to the current macro-economic climate. It will continue to be competitive and bidding discipline will remain important. We will continue our focus on organic growth initiatives and we will maintain our cost competitiveness through our focus on operational excellence.
AssessmentNo change
WORSENING POLITICAL RISKS IN KEY GEOGRAPHIES
Description and impact The Group’s backlog is heavily concentrated on business activities in the Middle East and North Africa which may increase our vulnerability. Recent global economic conditions have had a significant impact on countries whose economies are exposed to the downturn in commodities, placing greater pressure on governments to find alternative means of raising revenues and increasing the risk of social and labour unrest.
The impacts include risks to the successful delivery of our operations and associated impact on margins, the safety of our people, security issues, material logistics, and travel restrictions.
Mitigation and managementThe Board actively monitors political developments and seeks to avoid or minimise our exposure to jurisdictions with unacceptable risk levels.
We have good experience in project execution and maintain positive relationships with key stakeholders. Careful consideration is given to contractual terms and security conditions through our detailed risk review process and we seek external advice on specialist issues as required.
The delivery model is modified to suit each project and we limit exposure to single sources of supply and service. We limit our fixed asset commitment within each contract and closely monitor and manage our cash flow and commitments. There is continued focus on evacuation and emergency response and operations are assessed and executed in accordance with our security policy and security standards.
The risk of over-concentration in a particular market or geography.
We are actively pursuing and executing projects in new geographies and we carry out detailed risk analysis before entering any new country.
LinksFor more information see: pages 16; 44-48; and 57-58
ChangeTo mitigate the risk of geographical concentration, we have made good progress on our growth of business into new geographies. Dedicated leadership and resources have been assigned to identify opportunities and assess the risks and mitigations for business delivery.
AssessmentNo change
Annual report and accounts 2018 Petrofac 25
Strateg
ic repo
rtG
overnance
Financial statem
ents

RISK MANAGEMENT CONTINUED
FAILURE TO MEET PROJECTED ORDER INTAKE
Description and impact The risk is that our clients continue to exercise capital discipline and the demand for our services may be impacted with the cancellation or delay of planned investments. The potential impact is that the Group could fail to deliver its anticipated backlog and growth targets.
Mitigation and managementIn our MENA region, the source of the majority of our backlog, we see a good pipeline of bidding opportunities for 2019. New investment decisions continue to be taken and capital investment is edging upwards.
We saw a good level of new order intake during 2018, albeit in a challenging environment, including projects in adjacent markets such as India, Turkey and South East Asia. We continue to focus on converting opportunities in target adjacent geographies and sectors.
The Group wins most of its work through a competitive bidding process, and as competition increases, there is a risk that we could fail to maintain differentiated margins.
Our service lines work together to review and identify prospects and regularly analyse bid-to-win ratios and our competition. We expect the market for our services to remain very competitive and we will continue our focus on operational excellence to support our competitive bidding performance by protecting, and where possible, enhancing margins. We have dedicated resources to support clients’ financing requirements in our bids.
We continued to review cost reduction plans across the business during 2018. These savings allow us to be more competitive in the market, deliver projects for our clients more cost-effectively, and help to support our margins going forward.
LinksFor more information see: pages 14-15
ChangeDuring 2018 we saw a good level of new orders and we have a healthy bidding pipeline for 2019. However, delays in awards, developments in the SFO investigation and a competitive market have impacted this risk.
AssessmentIncreased
DELIVERING OUR STRATEGY
Description and impact To build enterprise value, we need to assure shareholders and opinion formers that we are pursuing an appropriate strategy capable of delivering shareholder value. The impact is reflected in the appetite for new investors to buy into the Group and consequently our relative valuation multiple.
Mitigation and managementIn a challenging environment, we continued to deliver our strategic objectives in 2018: securing new orders, progressing new organic growth opportunities, reducing capital intensity, and continuing to deliver on our reputation for strong project execution.
We saw a good recovery in new orders, securing US$5.0 billion in new order intake from both existing and adjacent markets. Our agreement with Danos in the United States demonstrates our commitment to grow our reimbursable business in the Western Hemisphere, and we are also exploring longer-term opportunities.
The Board regularly assesses our strategic plan to satisfy itself that the right mix of risk, capability and reward is established. We conduct detailed sensitivity analysis to assess the robustness of our plans. The GRC reviews all material new business opportunities and projects, new country entries, joint ventures, investments, acquisitions and disposals.
The Group may be unable to complete its divestment programme within the desired timescales or achieve the expected values.
We are committed to a capital-light business model going forward. We will continue to focus on strong cash management across the Group and we will release capital from investments that are not strongly linked to our core competence. The divestment programme for our non-core assets has continued, with a number of significant asset sales during 2018 including successful divestment of the Chergui gas concession, the Greater Stella Area development, 49% of our Mexican operations and the JSD6000 installation vessel.
LinksFor more information see: pages 4-5; 10-11 and 16-17
ChangeOur strategic priorities for 2019 will build on those set out last year. Going forward, we will focus on best in class delivery, a return to growth and enhancing our returns. However, developments in the SFO investigation increase the risk of delivery of this strategy.
AssessmentIncreased
26 Annual report and accounts 2018 Petrofac

OPERATIONAL AND PROJECT PERFORMANCE
Description and impact Our portfolio typically includes a relatively small number of large value contracts. Cost or schedule overruns on any of these projects could negatively impact the Group’s profitability, cash flows and relationships with key stakeholders.
Mitigation and managementThe main project risks are the application of contractual liquidated damages by clients and failure to secure assessed variation orders. We regularly review these exposures and are satisfied that the risks are balanced across the E&C portfolio. We work closely with our clients to resolve contractual elements for our substantially completed and ongoing projects.
Key risks to delivery are initially identified at the tender stage, through the risk review process. On award, detailed execution strategies are further developed and, during the execution phase, emerging risks and opportunities are managed through assurance and operational reviews. Lessons learned are cascaded through leadership lines and our quality initiatives are focused on a ‘right first time’ approach.
If we are unable to transfer certain risks to the insurance market (due to the availability or cost of cover, for example), we could be exposed to material uninsured losses.
We maintain a Group-wide insurance programme to mitigate against certain significant losses, which is consistent with general industry practice. We continually review the coverage of our policies.
LinksFor more information see: pages 3; 10-11; and 85
ChangeWe continued to operate effectively throughout 2018. Project delivery remained a significant area of focus for the Board and executive management to ensure that we continued to implement lessons learned from prior projects.
AssessmentNo change
LOSS OF LICENCE TO OPERATE
Description and impact Formal investigations by regulatory authorities could result in a loss in share price value and/or a loss in business. Other consequences could include the prosecution of the Company and of individuals; imprisonment and/or fines for individuals; and fines, penalties or other consequences, including reputational damage, to the Group. There may also be considerable cost and ongoing disruption in responding to allegations or investigations and taking remedial action.
Mitigation and managementA sub-committee of the Board was established in 2017 to be solely responsible for the Company’s engagement with the SFO and to oversee the Company’s response to their investigation.
The investigation by the Serious Fraud Office (SFO) into Petrofac is ongoing. The Company continues to engage with the SFO and is devoting significant resources to this matter. It is unclear when or how the investigation will be concluded. The consequences of this investigation will be determined by the regulatory authorities and it remains therefore too early for Petrofac to predict their outcome. Since the instigation of the investigation, shareholder confidence has been impacted resulting in a material fall in the market value. However, the award of new business has demonstrated that it is a ‘business as usual’ approach and that our clients remain supportive.
There are several factors that could impact our ability to operate safely, ethically and effectively. These include safety and asset integrity risks and extend to a range of environmental and regulatory risks. The risk is the potential harm to our people, and the commercial and/or reputational damage that could be caused.
Safety is a core value and the risk is governed largely by our operating framework, Group policies, systems and various monthly forums (such as the asset integrity review board). During the year we carried out a number of safety deep dives and updated a number of global standards for HSSEIA.
We continued our focus on crisis management training with exercises being held at the Group and project levels and there is a focus on the Group Safety Improvement Plan. We reviewed our business continuity plans and digital media response.
Ethical risks are covered under compliance and controls.
LinksFor more information see: pages 44-48 and 76
ChangeFrom mid-2018, our safety performance deteriorated as a result of a number of incidents, which resulted in three fatalities. Developments in the SFO investigation increase the risk of a loss in share price value, prosecution, fines, penalties or other consequences, including reputational damage.
AssessmentIncreased
Annual report and accounts 2018 Petrofac 27
Strateg
ic repo
rtG
overnance
Financial statem
ents

RISK MANAGEMENT CONTINUED
IT RESILIENCE
Description and impact The Group’s performance is increasingly dependent on the ongoing capability and reliability of our IT platforms.
We (as with all companies) continue to be exposed to external cyber-security threats.
Mitigation and managementBreach or failure of our IT systems due to integrity failings, negligence or attacks on cyber-security could seriously disrupt our operations and could result in the loss or misuse of sensitive information. Such breaches in IT security could adversely impact the Group’s ability to operate and lead to financial loss, damaged reputation, loss of client and shareholder confidence and regulatory fines.
We have adopted a ‘cloud’ strategy and increasingly use secure internet connectivity. We have a number of intrusion detection and prevention tools, so we can quickly respond to alerts and suspicious activity. We have moved to a greater standardisation of our IT systems in an effort to replace our legacy systems. A new IT strategy and organisation has been established to manage IT operations. A key focus is delivering a data-driven and digitised business model.
The Group recognises the increased incidences of cyber-security threats and has reviewed its policies, standards, procedures and defences to mitigate associated risks, engaging market-leading specialists where appropriate.
LinksFor more information see: page 70
ChangeWe continued to develop our IT infrastructure and progress IT initiatives during 2018 to ensure we are resilient to existing and emerging threats.
AssessmentNo change
LOSS OF FINANCIAL CAPACITY
Description and impact Failure to forecast adequately, manage or maintain sufficient liquidity and credit could impact our ability to operate and result in financial loss and/or ability to comply with our financial covenants.
Mitigation and managementWe always maintain an adequate level of liquidity in the form of readily available cash, short-term investments, or committed credit facilities. The Audit Committee has defined a minimum level of liquidity that must be maintained.
Debt costs may rise due to rating agency downgrades and the possibility of restricted access to funding.
We have continued to employ a conservative and flexible funding strategy, robust across a range of business plan scenarios. We made good progress during 2018, securing US$300 million of new banking facilities and continuing to focus on reducing our levels of debt.
Access to multiple sources of funding is critical to our sustainability and future growth. Failure to obtain financing could hamper the Group’s growth, prevent us from taking on new projects and could adversely affect the Group’s financial performance.
We prepare quarterly cash flow forecasts, aligned to our financial reforecasts, to identify any funding requirements well in advance.
We continued to focus on the implementation of a global cash management tool that was introduced in 2017 and working capital management during 2018.
The risk of financial or commercial exposure if counterparties (such as key financial institutions, clients, partners, subcontractors or vendors) default on their commitments.
We perform financial due diligence on new and existing clients. We closely monitor all receivables and seek to minimise the risk of exposure through contractual terms. We have regular, senior level dialogue with our major clients to understand and pre-empt any concerns that they may have.
Bank ratings are monitored to ensure security of counterparty for both deposits and lending. The risk is managed by Group Treasury and overseen by the Audit Committee. Developments in the SFO investigation increase the risk of a loss in share price value, prosecution, fines, penalties or other consequences, including reputational damage.
LinksFor more information see: pages 16; 43; 85; 168-171; and 198-201
ChangeWe initiated a debt reduction plan in 2018 and improved our net debt position over the year. A key component of our strategy is to reduce capital intensity. Developments in the SFO investigation have impacted this risk.
AssessmentIncreased
28 Annual report and accounts 2018 Petrofac

DILUTION OF COMPANY CULTURE AND/OR CAPABILITY
Description and impact An inability to respond quickly and effectively to unplanned changes in the leadership structure could have an adverse impact on the delivery of our strategy and day-to-day operations.
Mitigation and managementThe Group’s organisational structure was revised in August 2018, primarily relating to the E&C and EPC businesses. The changes were designed to provide clarity of leadership for our divisions and ensure the optimal long-term structural foundation for the business to deliver its full potential.
The focus on succession planning remains an important priority for the Board and we continue to review and update succession plans for all our critical roles across the Group. During 2018 the executive team reviewed succession plans for the majority of the management team. The overall senior talent pipeline is reviewed on a quarterly basis.
We are developing a cadre of future leaders and providing them with the opportunities to demonstrate their potential and accelerate their progression. We have identified our high performing employees who we see as having the potential to be longer-term successors. We also focus on the emerging talent who are viewed as high potential individuals and we manage their development in terms of on the job training, rotations and training events to accelerate their progression. Over 50% of graduates hired since 2004 have been retained within the Group, and we will recommence our graduate programme in 2019.
Our aim is to always place our most effective people into our most important roles.
Failure to attract and retain the right level of skilled and experienced personnel could negatively impact our distinctive, delivery-focused culture, and prevent us from maintaining our operational capability and relationships with clients.
We review future headcount requirements as part of our planning process to assess whether to reduce our overall headcount in response to tighter market conditions or to invest in retaining capability. Five-year capability plans have been collated across the Group, linked to the annual business plan process.
An integrated learning management system is used to capture individual performance objectives, support mandatory employee performance reviews and capture personal development plans. Our leadership excellence programme has continued through 2018, with around 300 senior leaders having attended the programme since its inception.
We remain confident that our policies to attract, retain, train, promote and reward our people are appropriate for the Group, and will enable us to meet our strategic goals. Developments in the SFO investigation, increase the risk of us not being able to attract and retain talent.
LinksFor more information see: pages 4-5; 6; 10-11; 16; 49-50; and 64
ChangeSuccession planning at Board and senior management level was a core focus in 2018. A principal objective is to continue to build a strong talent pipeline. Developments in the SFO investigation have impacted this risk.
AssessmentIncreased
COMPLIANCE AND CONTROLS
Description and impact The management of agency relationships represents one of the largest risks of reputational damage that companies face.
Mitigation and managementThe Third Party Risk Committee continued to meet during 2018 to review applicable third-party relationships and further progress was made to develop the compliance-related internal controls framework. A new Chief Compliance Officer was appointed during 2018.
The potential financial and reputational risk that would arise from failure to comply with law and regulation and/or non-conformance with relevant Group standards, policies and procedures.
The Code of Conduct sets out the behaviours expected of our employees and those people who work with us. Our employees at supervisory level and above are required to complete relevant mandatory e-learning and a declaration to confirm they have complied with the Code of Conduct and have declared any actual or potential breach of our Code and any potential conflict of interest. Our Group Finance function continued to implement a controls improvement programme during the year to enhance the financial controls framework.
The Group faces risks associated with the management of trade sanctions as it continues to engage in business in Russia.
The Group must ensure a broad understanding of, and compliance with, the sanctions regime. As part of the risk review process, sanctions implications are reviewed with the business and specialised external counsel before entering any territory that may be impacted. The Compliance Monitoring programme implemented on new projects reviews the risk of possible sanction and export control violations by third parties and transit of goods.
LinksFor more information see: pages 4-5; 44; 62-63; 64-65; 68; 76; 82-85; and 88-89
ChangeDuring the year the Company continued to revise a number of compliance related controls. The Compliance and Ethics Committee continued to meet regularly to review the compliance agenda.
AssessmentNo change
Annual report and accounts 2018 Petrofac 29
Strateg
ic repo
rtG
overnance
Financial statem
ents

GROWING ORGANICALLYTHE RAPID PROJECT IN MALAYSIA SHOWS HOW WE CAN MOVE INTO ADJACENT SECTORS AND COMPLEMENTARY GEOGRAPHIES – WHILST ALSO BUILDING OUR COMMITMENT TO LOCAL DELIVERY AND WORKER WELFARE
CASE STUDY
30 Annual report and accounts 2018 Petrofac

Annual report and accounts 2018 Petrofac 31

73%
Project expenditure
RAPID is part of the Penerang Integrated Petroleum Complex, the biggest petroleum and petrochemicals hub in all of Asia.
Total project value
Around 1,800 people are housed at seven, four-story Petrofac-built accommodation and leisure buildings.
1,800
73%
Petrofac share
In-country value
US$500m+
Petrofac’s share of the RAPID project is valued at around half-a-billion dollars.
Almost three quarters (73%) of our project expenditure was spent on local resources, and remained within the Malaysian economy.
300,000 When complete, RAPID will have a refining capacity of 300,000 barrels a day
Scope of work:
3 Sulphur recovery units
2 Amine regeneration units
2 Sour water-stripping units
1 Liquid sulphur storage unit
1 Sulphur solidification unit
US$27bn
KEY FACTS

RAPID Delivery in Malaysia The RAPID project in Malaysia is strategically significant in several respects. The US$500+ million EPCC project is one of the Company’s first refinery projects – so builds our downstream credentials and shows how we are extending into adjacent sectors.
It is also our first major onshore project in Malaysia – indicating our ability to move into complementary geographies, where we have a full understanding of the risks as well as the capacity to deliver.
Succeeding in adjacent sectorsThe project was one of our first ever downstream assignments. Part of the Refinery and Petrochemicals Integrated Development (RAPID), it includes sulphur recovery, storage and solidification facilities, amine regeneration units, and sour water-stripping units. Since it was awarded in 2014, our downstream activities have grown strongly – and now make up a third of our 2019 E&C bidding pipeline.
An emphasis on local delivery and in-country valueAs with most projects in most countries, the creation of in-country value is a key client consideration, and PETRONAS set down strict requirements for the number of local people on the workforce. Based on our knowledge of the local supply chain, we went much further – by choosing to work exclusively with locally based subcontractors and helping them to source, recruit and train a high proportion of Malaysian workers. In total, 73% of project expenditure has been spent on local resources.
A clear commitment to worker welfareWhen worker welfare is prioritised, productivity can be increased and the scope for delays and disputes is significantly reduced. To keep standards high on the RAPID project, the Petrofac-built onsite accommodation and recreation facilities, which are home to 1,800 people, are regularly audited for cleanliness, hygiene and comfort. A grievance procedure ensures that any concerns can be aired and addressed. And, despite the challenges of working on a congested, tropical site, we maintained an excellent safety record throughout 2018.
Client: PRPC Refinery and Cracker Sdn Bhd, a subsidiary of PETRONAS
Location: Pengerang, Johor, Malaysia
Value: US$500+ million
Scope: Engineering, procurement, construction and commissioning (EPCC), for part of the Refinery and Petrochemicals Integrated Development (RAPID)
Start: 2014
End: 2019
Linked to strategy: Deliver organic growth
A strong safety record By the end of 2018, we had exceeded 20 million man-hours without a single lost time incident (LTI), and received HSSE awards from PETRONAS on three separate occasions.
Worker welfareWe received a Focused Recognition Award from PETRONAS for our approach to worker welfare, and the quality of our accommodation and leisure facilities.
20millionMan-hours without a single lost time incident (LTI) by the end of 2018
Scan code to play video

SEGMENTAL PERFORMANCE
A review of our segmental performance
The Group’s operating segment results were as follows:
US$ million RevenueBusiness performance
net profit 1 EBITDA
For the year ended 31 December 2018 2017 20182017
(re-presented) 20182017
(re-presented)
Engineering & Construction 4,087 4,801 285 360 388 540Engineering & Production Services 1,479 1,392 96 90 138 123Integrated Energy Services 282 228 39 (21) 160 97Corporate, others, consolidation adjustments & eliminations (19) (26) (67) (68) (15) (12)Group 5,829 6,395 353 361 671 748
% Revenue growthBusiness performance
net margin EBITDA margin
For the year ended 31 December 2018 2017 20182017
(re-presented) 20182017
(re-presented)
Engineering & Construction (14.9) (19.0) 7.0 7.5 9.5 11.2Engineering & Production Services 6.3 (19.3) 6.5 6.5 9.3 8.8Integrated Energy Services 23.7 (15.9) 13.8 (9.2) 56.7 42.5Group (8.9) (18.8) 6.1 5.6 11.5 11.71 Attributable to Petrofac Limited shareholders.
SEGMENT OVERVIEW
Engineering & Construction (E&C) See page 33
Engineering & Production Services (EPS) See page 36
Integrated Energy Services (IES) See page 38
Group revenue contribution (%) Group revenue contribution (%) Group revenue contribution (%)
70% 25% 5%
US$4,087mRevenue
US$285mBusiness performance net profit
US$1,479mRevenue
US$96mBusiness performance net profit
US$282mRevenue
US$39mBusiness performance net profit
32 Annual report and accounts 2018 Petrofac

1 2016 and 2017 re-presented due to the reclassification of an item from an exceptional item and certain re-measurements to business performance as set out in note 6 to the consolidated financial statements.
2 New order intake comprises new contract awards and extensions, net variation orders and the rolling increment attributable to EPS contracts which extend beyond five years.
ENGINEERING & CONSTRUCTION The Engineering & Construction (E&C) division delivers onshore and offshore engineering, procurement, construction, installation and commissioning services on a lump-sum basis. We have more than 35 years of expertise in this area and our services encompass both greenfield and brownfield developments.
We have made solid progress delivering our portfolio of projects. In Algeria, we successfully commissioned the Alrar and Reggane gas plants in the first half of the year. In Kuwait, the Lower Fars Heavy Oil, Manifold Group Trunkline and KNPC Clean Fuels projects are in pre-commissioning or phased hand-over stages. In Abu Dhabi, we recently achieved a major milestone on the Upper Zakum Field Development with the oil facility ready for start up. Elsewhere, the Jazan North and South tank farms and Fadhili sulphur recovery plant in Saudi Arabia, and RAPID project in Malaysia are all nearing completion. On the Borwin 3 offshore wind grid connection project, the topside platform has been successfully installed in the German North Sea.
New awardsNew order intake2 for the year totalled US$3.8 billion, including US$1.9 billion of awards in growth markets. These included:
Upstream project, Middle EastIn March 2018, we were awarded a US$580 million contract for the engineering, procurement and construction (EPC) of an upstream project in the GCC with a National Oil Company.
BPCL Kochi Refinery, IndiaIn March 2018, we secured our first project in India in more than 10 years with an award from Bharat Petroleum Corporation Limited (BPCL) valued at approximately US$135 million. Located at BPCL’s Kochi Refinery, Kerala, India, the scope of work encompasses engineering, procurement, construction, pre-commissioning and assistance with commissioning. The 27-month contract is for the addition of a new Motor Spirit block of refining units, which will increase the current output of the facility to meet India’s BS-VI automotive fuel quality.
HPCL Sulphur Recovery Unit, IndiaThe BPCL Kochi Refinery award was quickly followed by the award of a contract by Hindustan Petroleum Corporation Limited for its Sulphur Recovery Unit (SRU) Block Package for the Visakh Refinery Modernisation Project, Visakhapatnam, Andhra Pradesh, India. The lump-sum EPC project, valued at approximately US$200 million, includes licensing and commissioning. The SRU package will be constructed within the existing refinery under the terms of the 30-month contract.
George SalibiE&C Chief Operating Officer
Revenue (US$)
15%US$4,087m
US$5,928m
US$4,801m
US$4,087m
16
17
18
Business performance net profit (US$)1
21%US$285m
US$276m
US$360m
US$285m
16
17
18
Business performance net margin (%)1
7.0% 4.7%
7.5%
7.0%
16
17
18
Group revenue contribution
E&C headcount at 31 December
70% 6,500(2017: 6,750)
Annual report and accounts 2018 Petrofac 33
Strateg
ic repo
rtG
overnance
Financial statem
ents

Key E&C/EPS projectsProgress at December 2018 2
Rabab Harweel Integrated Project, Oman1
Yibal Khuff project, Oman1
Jazan North tank farm, Saudi Arabia
Lower Fars heavy oil project, Kuwait
Fadhili sulphur recovery plant, Saudi Arabia
Turkstream, Turkey1
Khazzan Phase 2, Oman
Salalah LPG, Oman
GC32, Kuwait
Sakhalin OPF, Russia
Duqm re�nery, Oman
Onshore project, GCC
Marmul Polymer Project Phase 3, Oman1
Majnoon CPF, Iraq
Tinrhert, Algeria
Clean Fuels Project, Thailand
NOC/NOC led company/consortium IOC company/consortium
0% 25% 50%
1 EPCm2 Excludes projects < 5% and > 95% complete and < US$250m.
75% 100%
Original contractvalue to Petrofac
US$1.0bn
US$0.9bn
US$1.1bn
>US$3.0bn
Undisclosed
US$0.4bn
US$0.8bn
US$0.6bn
US$1.3bn
US$0.7bn
US$1.1bn
US$0.6bn
US$0.3bn
US$0.4bn
US$0.5bn
US$1.4bn
SEGMENTAL PERFORMANCE CONTINUED
Raageshwari Deep Gas Field Development Project, IndiaIn April 2018, we received a letter of award from Vedanta Limited for its Raageshwari Deep Gas Field Development Project located in Barmer, Rajasthan, India. The lump-sum EPC project, valued at approximately US$233 million, is for integrated gas surface facilities and includes pre-commissioning and commissioning. Under the terms of the 23-month contract, the scope of work includes well pads, flowlines and a new gas processing terminal.
Hollandse Kust Zuid (HKZ) offshore grid connection, The NetherlandsIn July 2018, we were awarded a contract by TenneT, the Dutch-German transmission grid operator, for the Hollandse Kust Zuid (HKZ) offshore grid connection for the Alpha and Beta high voltage alternating current (HVAC) substation platforms in the North Sea. The scope includes the engineering, procurement, construction and installation (EPCI) of the substations, which have a total contract value of approximately US$200 million. As formal approval of the second substation platform was pending at 31 December 2018, only approximately US$100 million was included within new order intake and backlog in 2018.
Majnoon Central Processing Facility, IraqIn August 2018, we were awarded a contract worth around US$370 million by Basra Oil Company (BOC) for expansion of the Central Processing Facility (CPF), located in the Majnoon Field, Southern Iraq. Under the terms of the 34-month contract, the lump-sum EPC project scope of work includes two oil processing trains, able to process 200,000 barrels of oil per day.
Tinrhert Field Development Project, AlgeriaIn August 2018, we received a provisional letter of award for an EPC contract with Sonatrach for package “EPC1” of the Tinrhert Field Development Project. Located in Ohanet, around 1,500 kilometres southeast of Algiers, EPC1 will provide a new inlet separation and compression centre. Under the terms of the 36-month contract, the scope of work includes a pipeline network of approximately 400 km to connect 36 wells, along with commissioning, start-up and performance testing of the facilities. The contract, worth around US$500 million, was signed in November 2018.
Clean Fuels Project, ThailandIn October 2018, we were awarded the Thai Oil Public Company Limited’s (Thai Oil) Clean Fuels Project in consortium with Saipem and Samsung. The overall project value is around US$4 billion, of which Petrofac’s share is around US$1.4 billion. The project, which will be completed over a four-year period, will transform the existing oil refinery in Sriracha, Chonburi, on the East coast of Thailand, into an environmentally-friendly facility that will produce higher quality transportation fuels. The scope of work encompasses engineering, procurement, construction and commissioning services and includes improvements and expansion at the existing facility as well as the addition of new complex processing units, all required utilities and supporting facilities. The project will increase the refinery’s production capacity from 275,000 barrels per day to 400,000 barrels per day.
34 Annual report and accounts 2018 Petrofac

ResultsRevenue for the year decreased 15% to US$4,087 million (2017: US$4,801 million) primarily due to project phasing and mix.
Business performance net margin decreased to 7.0% (2017 re-presented: 7.5%), reflecting project mix, cost over-runs and lower tax. Business performance net profit decreased 21% to US$285 million (2017 re-presented: US$360 million), reflecting lower revenue and net margin.
Backlog in the E&C division stood at US$7.3 billion at 31 December 2018 (2017: US$7.5 billion), reflecting progress delivered on the existing project portfolio and new order intake.
Headcount in the E&C division was 6,500 at 31 December 2018 (2017: 6,750).
RAISING THEROOF IN OMANIn December 2018 we reached an important milestone on the Salalah Liquified Petroleum Gas (SLPG) project in Oman, when the huge dome roofs of two LPG storage tanks were successfully installed using nothing but air. Fabrication of the roofs was undertaken at ground-level inside the tanks, limiting the need to work at height, and thus reducing the safety risks. Four large blowers then pumped the air into the tanks, to raise the roofs into place.
The SLPG project is significant in several respects.
Awarded in 2017 and valued at around US$600 million, this prestigious EPC and start-up contract builds on our long track record in Oman and, for the first time, takes us into the Salalah region. The scope of work includes construction of the LPG unit and associated facilities at Salalah Free
Zone, including tie-ins to existing pipeline infrastructure, together with LPG storage and jetty facilities at the Port of Salalah. It also has an important in-country value component.
Commissioned by Salalah LPG SFZCO LLC, it is a strategic investment for Oman, enabling the Sultanate to get more value from its gas assets. Once completed, the project will create new opportunities for the employment of Omanis, particularly in the Dhofar region.
Meanwhile, in delivering the project, Petrofac focused on local sourcing and vendor development. A supply chain roadshow event was held in Salalah, which enabled more than 100 local companies to demonstrate their capabilities, with particular focus on small and medium-sized enterprises. Across the project as a whole, more than 300 locally-based businesses were engaged by Petrofac.
By the year-end, the project had achieved over 95% project engineering progress, with around 53% progress overall.
95%Overall engineering progress
Scan code to play video
Annual report and accounts 2018 Petrofac 35
Strateg
ic repo
rtG
overnance
Financial statem
ents

In 2018 the continued resilience of our operations business, short-term extensions of historical contracts in EPS East and growth in our Engineering, Procurement and Construction Management (EPCm) portfolio offset a challenging market environment for brownfield projects in the North Sea.
New awards and extensionsDuring the year, EPS secured awards and extensions with new and existing clients worth approximately US$1.2 billion, predominantly in the UK, Oman, Turkey and Iraq.
Marmul Polymer Phase 3 Project, OmanIn March 2018, we were awarded a contract worth US$265 million for the development of the Marmul Polymer Phase 3 (MPP3) Project in southern Oman. This was the first award to be secured under a 10-year Framework Agreement with Petroleum Development Oman (PDO) signed in 2017, which enables Petrofac to provide EPCm support services for PDO’s major oil and gas projects. The scope of the MPP3 project involves EPC support for the extension of off-plot and on-plot production facilities associated with around 500 producing and 75 injector wells. In line with our commitment to further increasing in-country value, we will undertake the engineering, procurement and project management activities in Muscat, Oman.
Qarn Alam Co-Generation Project, OmanIn December 2018, we were awarded our second contract under the Framework Agreement, worth around US$115 million, for the development of the Qarn Alam Co-Generation Project, located 350 kilometres southwest of Muscat, Oman. The 36-month project scope includes installation and commissioning support for a Gas Turbine Generator Package with one Heat Recovery Steam Generator at the power plant which was built to support oil extraction in Oman’s central region.
SEGMENTAL PERFORMANCE CONTINUED
ENGINEERING & PRODUCTION SERVICES The Engineering & Production Services (EPS) division brings together our services’ capability across brownfield projects and operations, greenfield projects through concept, feasibility and front-end engineering and full project delivery as well as a range of operations, maintenance and engineering services for onshore and offshore projects.
John PearsonEPS Chief Operating Officer
Revenue (US$)
6%US$1,479m
US$1,725m
US$1,392m
US$1,479m
16
17
18
Business performance net profit (US$)
7%US$96m
US$111m
US$90m
US$96m
16
17
18
Business performance net margin (%)
6.5% 6.4%
6.5%
6.5%
16
17
18
Group revenue contribution
EPS headcount at 31 December
25% 4,250(2017: 4,950)
36 Annual report and accounts 2018 Petrofac

Awards and extensionsIn addition to the above, we secured many extensions and new awards with a range of clients during the year. In the UK, we secured US$0.3 billion of awards and extensions, including a new Well Operator and Well Engineering Project Management services contract with Siccar Point Energy and contract extensions with Chevron and ENI. In June 2018, we announced a new award and several contract extensions in Iraq, with a combined value of more than US$110 million, for construction management, engineering, commissioning and start-up services for international oil company clients.
ResultsRevenue increased 6% to US$1,479 million (2017: US$1,392 million), reflecting strong growth in EPCm driven by new awards and project phasing.
Business performance net margin was unchanged at 6.5% (2017: 6.5%), with lower overheads offset by higher tax and minority interests. Business performance net profit increased 7% to US$96 million (2017: US$90 million).
Backlog in the EPS division decreased to US$2.3 billion at 31 December 2018 (2017: US$2.7 billion) reflecting the level of order intake.
Headcount in the EPS division was 4,250 at 31 December 2018 (2017: 4,950).
USING DIGITAL TOWORK SMARTER,FASTER, ANDSAFER Having witnessed disruption in other industries, the oil and gas sector is currently looking at how digital technologies could be used to create new value and address historical challenges. To this end, Petrofac has initiated a strategic programme to reimagine the way it operates. In an ageing basin like the UKCS, where cost pressures are intense and new operating models are emerging, the opportunities are significant.
In the EPS business, the money we are paid often reflects the targets we achieve. If we can use digital initiatives to enhance asset performance, the bottom line benefits can be significant – as can the level of client satisfaction.
As part of our Group-wide digital programme, we identified more than 100 potential projects. Of these, 12 were prioritised for trial during 2018, and three are already moving into implementation in the UKCS:
• Connected Worker – uses mobile wearable technologies, like head-mounted cameras and microphones, to create a direct link between offshore workers and the full capability of the wider Petrofac teams. Expert advice is always available and emerging issues are quickly resolved.
In field trials, we saw productivity improvements of up to 30%, as well as improved uptime.
• Petrolytics – uses artificial intelligence and machine learning to forecast an asset’s performance and predict potential failures. This means maintenance programmes can be based on data-driven insights rather than fixed schedules. As just one example, we proved that the technology would have predicted a costly gas compressor fault, avoiding 2,200 boe (barrels of oil equivalent) of lost production, and saving around US$160,000.
• Digital Twin – integrates the 3D visualisation of a facility with all of the relevant engineering information and performance data. This can take engineers on a virtual visit to an asset, and gives them easy access to information upon which key decisions are made. This streamlines engineering and planning activities, more of which can be done without visiting a site. With access to accurate, up-to-date visual information, it also improves work-pack development.
In December a new Innovation Zone was also opened in our Aberdeen offices. This immersive, collaborative space is equipped with a range of the latest technologies. It enables employees, clients, and suppliers to explore emerging digital trends, see new technologies in action, and conduct idea-generation sessions. Attention is focused on the potential value of digital technology, with Petrofac positioned as a pioneer in the field.
Annual report and accounts 2018 Petrofac 37
Strateg
ic repo
rtG
overnance
Financial statem
ents

Equity Upstream InvestmentsNet entitlement production for the year from our equity interests increased to 3.7 million barrels of oil equivalent (mboe) (2017: 2.5 mboe), reflecting the recommencement of production from the Chergui gas concession in Tunisia in May 2017, our formal entry onto the Greater Stella Area development (GSA) licence in September 2017 and the migration of Santuario from a PEC to a PSC in December 2017.
In October 2018, we completed the sale of 49% of our operations in Mexico, including the Santuario PSC and Magallanes and Arenque PECs, to Perenco (Oil and Gas) International Limited (see note 11 to the consolidated financial statements).
In December 2018, we completed the sale of our interest in the Greater Stella Area development to Ithaca Energy (UK) Limited and the sale of the Chergui gas concession to Perenco Tunisia Oil and Gas International Limited (see note 11 to the consolidated financial statements).
Production Enhancement ContractsPetrofac earns a tariff per barrel on PECs for an agreed level of baseline production and an enhanced tariff per barrel on incremental production. We earned tariff income on a total of 2.5 mboe in 2018 (2017: 4.8 mboe). The decrease reflects the conversion of Santuario from a PEC to a PSC in December 2017 and the sale of the Pánuco PEC to Schlumberger in August 2017.
Rob JewkesIES Chief Operating Officer
SEGMENTAL PERFORMANCE CONTINUED
INTEGRATED ENERGY SERVICESIntegrated Energy Services (IES) provides an integrated service for clients under flexible commercial models that are aligned with their requirements. Our projects cover upstream developments – both greenfield and brownfield – and related energy infrastructure projects. IES deploys the Group’s capabilities using a range of commercial frameworks, including Production Enhancement Contracts (PECs) and traditional equity upstream investment models including both Production Sharing Contracts (PSCs) and concession agreements. Divestments are considered once assets reach the point in their life cycle when our services contribution is diminished.
Revenue (US$)
24%US$282m
US$271m
US$228m
US$282m
16
17
18
Business performance net profit/(loss) (US$)
286%US$39m
US$(42)m
US$(21)m
US$39m
16
17
18
Business performance net margin (%)
13.8% (15.5)%
(9.2)%
13.8%
16
17
18
Group revenue contribution
IES headcount at 31 December
5% 600(2017: 700)
38 Annual report and accounts 2018 Petrofac

Key IES projects
Magallanes, Mexico
Arenque, Mexico
Production Enhancement Contracts (PEC) End date
2037
2043
2042
2026
2031
Life of field
1 Migrated from PEC to PSC on 18 December 2017.2 Sale completed December 2018.
2020 202120182017 2019
Equity Upstream Investments
Chergui gas concession, Tunisia2
Greater Stella Area development, UK2
Santuario, Mexico1
Block PM304, Malaysia
ResultsRevenue increased 24% to US$282 million (2017: US$228 million). Excluding asset sales, revenue was up 33%, largely reflecting an increase in equity production and higher prices. The average realised price (net of royalties) for the year was US$59 per barrel (2017: US$52) reflecting higher oil prices, production mix and hedging activity.
EBITDA increased 65% to US$160 million (2017: US$97 million). Excluding asset sales, EBITDA was up 66%, reflecting higher production and average realised prices. The contribution from our remaining PECs in Mexico also increased due to higher tariff income and cost recovery.
IES returned to profit in 2018, generating a business performance net profit of US$39 million (2017: US$21 million loss), reflecting the increase in EBITDA, lower depreciation and lower net finance costs, partly offset by higher taxes.
Exceptional items and certain re-measurements totalled US$235 million after tax (2017: US$179 million). These predominantly reflect asset sales during 2018, which triggered US$186 million of post-tax exceptional items and certain re-measurements in relation to the sale of 49% of its Mexico operations, the Chergui gas concession and the Greater Stella Area development (see note 11 to the consolidated financial statements).
In addition, IES recognised an impairment of the deferred consideration from the sale of our interest in the Pánuco Production Enhancement Contract in 2017 of US$43 million (post-tax) due to considerable uncertainty concerning the timing and outcome of migration of the Pánuco PEC to a PSC and whether the contingent consideration pay out conditions will be achieved.
IES headcount stood at 600 at 31 December 2018 (2017: 700).
Annual report and accounts 2018 Petrofac 39
Strateg
ic repo
rtG
overnance
Financial statem
ents

The Group delivered good financial performance in the year, reflecting solid operational performance in all our businesses. Reported revenue was lower at US$5.8 billion (2017: US$6.4 billion), driven by business mix. Business performance net profit decreased 2% to US$353 million (2017 re-presented: US$361 million), benefiting from an increase in net margin.
RevenueRevenue for the year decreased 9% to US$5,829 million (2017: US$6,395 million). Revenue in Engineering & Construction (E&C) decreased 15%, primarily due to project phasing. Revenue in Engineering & Production Services (EPS) increased 6%, driven by strong EPCm growth. Integrated Energy Services’ (IES) revenue increased 24% reflecting production mix, higher average realised prices and asset sales.
The Group implemented IFRS 15 Revenue from Contracts with Customers with effect from 1 January 2018. Prior to the adoption of IFRS 15, revenue from lump-sum engineering, procurement and construction project execution services contracts was recognised using the percentage-of-completion method based on client certified surveys of work performed, once the outcome of the contract could be estimated reliably. From 1 January 2018, the Group has adopted the input method for recognising revenue. At 1 January 2018, the Group recognised a cumulative catch-up adjustment of US$61 million (of which US$40 million is related to the change to the input method), recognised as a reduction to the opening reserves (see note 2 to the consolidated financial statements for further detail). The adoption of IFRS 15 resulted in an increase in revenue in 2018 compared to the pro forma consolidated income statement (see note 35 to the consolidated financial statements).
Alastair Cochran Chief Financial Officer
Revenues down 9% to US$5.8 billion
EBITDA down 10% to US$671 million2
Business performance net profit down 2% to US$353 million1,2
Reported net profit of US$64 million1
Fully diluted EPS of 102.3 cents1,2
Group backlog down 6% to US$9.6 billion
Cash conversion of 101%3
Capital expenditure down 42% to US$98 million
Net cash of US$90 million
Full year dividend unchanged at 38.0 cents per share
Year ended 31 December 2018 Year ended 31 December 2017*
Business performance2
US$m
Exceptional items and
certain re-
measurements US$m
Reported US$m
Business performance
US$m
Exceptional items and certain
re-measurements US$m
Reported US$m
Revenue 5,829 – 5,829 6,395 – 6,395EBITDA 671 n/a n/a 748 n/a n/aNet profit/(loss)1 353 (289) 64 361 (390) (29)
* Re-presented due to the reclassification of an item from exceptional items and certain re-measurements to business performance as set out in note 6 to the consolidated financial statements.
1 Attributable to Petrofac Limited shareholders. 2 Business performance before exceptional items and certain re-measurements. This measurement is shown by
Petrofac as a means of measuring underlying business performance (see note 2 to the consolidated financial statements).
3 Cash conversion is calculated as cash generated from operations divided by business performance EBITDA.
AT A GLANCE
40 Annual report and accounts 2018 Petrofac
FINANCIAL REVIEW

BacklogThe Group’s backlog decreased 6% to US$9.6 billion at 31 December 2018 (2017: US$10.2 billion), reflecting progress delivered on the existing project portfolio and US$5.0 billion of new order intake in 2018.
31 December 2018
US$bn
31 December 2017
US$bn
Engineering & Construction 7.3 7.5Engineering & Production Services 2.3 2.7Group 9.6 10.2
Earnings Before Interest, Tax, Depreciation and Amortisation (EBITDA)Business performance EBITDA decreased 10% to US$671 million (2017 re-presented: US$748 million). Lower EBITDA in E&C, due to project phasing and mix was partly offset by higher EBITDA in IES, due to higher production, average realised prices and cost recovery.
Finance expense/incomeFinance expense for the year increased to US$81 million (2017: US$80 million), reflecting an increase in the cost of variable rate borrowings due to higher average LIBOR rates, which more than offset a reduction in average borrowings. Finance income increased to US$14 million (2017: US$10 million) reflecting the unwinding of the discount on long-term receivables and higher finance income on the Group’s cash and short-term deposits.
TaxationThe Group’s business performance effective tax rate (ETR) for the year was 24.4% (2017 re-presented: 27.5%) and the reported ETR was 43.0% (2017: 160.0%). The 2017 tax charge included a deferred tax asset derecognition of US$39 million resulting from a combination of changes in UK tax loss relief rules and a reassessment of forecast UK profit.
A number of factors have impacted the reported ETR, with key drivers being: the realisation of impairments without tax benefits and certain re-measurements that are not subject to tax; and, expenditure which is not deductible for tax purposes. In line with prior years, the reported ETR is also driven by tax laws in the jurisdictions where the Group operates and generates profits.
Net profit Business performance net profit attributable to Petrofac Limited shareholders decreased 2% to US$353 million (2017 re-presented: US$361 million) driven by business mix, with strong growth in IES more than offset by a decrease in E&C.
The reported net profit attributable to Petrofac Limited shareholders of US$64 million was impacted by post-tax exceptional items and certain re-measurements of US$289 million (2017 re-presented: US$390 million), of which approximately US$265 million were non-cash items (2017 re-presented: US$368 million; see note 6 to the consolidated financial statements):
• Asset sales during 2018 triggered US$196 million (post-tax) of non-cash exceptional items in relation to the JSD6000 installation vessel, a 49% interest in our Mexican operations, the Chergui gas concession and the Greater Stella Area development;
• A downward fair value adjustment of US$43 million (post-tax) due to considerable uncertainty concerning the timing and outcome of migration of the Pánuco Production Enhancement Contract (PEC) to a Production Sharing Contract (PSC) and whether the contingent consideration pay out conditions will be achieved; and,
• Other exceptional net items of US$50 million (post-tax), including onerous leasehold property provisions of US$18 million.
Business performance net margin increased to 6.1% (2017 re-presented: 5.6%), reflecting a return to profitability in IES, partly offset by lower net margins in E&C.
Earnings per shareBusiness performance diluted earnings per share decreased 4% to 102.3 cents per share (2017 re-presented: 106.2 cents per share), in line with the decrease in business performance net profit. Reported diluted earnings per share increased to a profit of 18.6 cents per share (2017: loss of 8.5 cents per share), reflecting lower exceptional items and certain re-measurements.
Operating cash flowThe net cash inflow generated from operating activities in the year was US$484 million (2017: US$422 million). The key components were:
• Operating profit before changes in working capital and other non-current items of US$693 million (2017: US$789 million), reflecting an increase in profit before tax and a decrease in exceptional items and certain re-measurements.
• Net working capital outflows of US$15 million (2017: US$213 million) including:
– An outflow of US$320 million from a reduction in accrued contract expenses, primarily due to higher vendor and subcontractor payment milestones achieved during the year in E&C (see note 32 to the consolidated financial statements);
– An inflow of US$316 million from a reduction in contract assets primarily due to advances received from customers and a reduction in variation orders pending customer approval of US$139 million (see note 21 to the consolidated financial statements);
– An inflow of US$121 million from an increase in contract liabilities, predominantly reflecting an increase in billings in excess of costs and estimated earnings of US$176 million; and,
– An outflow of US$103 million from a reduction in trade and other payables.
• An increase in net income taxes paid to US$104 million (2017: US$69 million), reflecting an increase in current income tax liabilities in 2017.
Annual report and accounts 2018 Petrofac 41
Strateg
ic repo
rtG
overnance
Financial statem
ents

Capital expenditureGroup capital expenditure, on a cash basis, decreased 42% to US$98 million (2017 re-presented: US$168 million), principally reflecting decreases in capital expenditure on the Greater Stella Area development and on the JSD6000 installation vessel (see A5 in Appendix A to the consolidated financial statements).
31 December 2018
US$m
31 December 2017
US$m
Purchase of property, plant and equipment 90 108Payments for intangible oil and gas assets 8 9Loan in respect of the Greater Stella Area development - 51Group capital expenditure 98 168
Free cash flowThe Group defines free cash flow as net cash flows generated from operating activities, net cash flows from investing activities and amounts received from non-controlling interests (see A6 in Appendix A to the consolidated financial statements).
Free cash flow for the year increased to US$921 million (2017: US$281 million) due to: an increase in net cash flows generated from operating activities to US$484 million (2017: US$422 million); net cash from investing activities of US$213 million (2017: US$141 million outflow) following the sale of the JSD6000 installation vessel, the Chergui gas concession and the Greater Stella Area development; and amounts received from a non-controlling interest of US$224 million following the sale of 49% of the Group’s operations in Mexico.
31 December 2018
US$m
31 December 2017
US$m
Net cash flows generated from operating activities 484 422Net cash flows from/(used in) investing activities 213 (141)Amounts received from non-controlling interest 224 -Free cash flow 921 (281)
Balance sheetIES carrying valueDuring the year, the Group sold its interest in the Greater Stella Area development, the Chergui gas concession and 49% of the Group’s operations in Mexico (see note 11 to the consolidated financial statements). As a result, the carrying value of the IES portfolio at 31 December 2018 (including balances within oil & gas assets, intangible assets and interest in associates) decreased to US$490 million (2017: US$1,031 million); balance also includes other financial assets).
31 December 2018
US$m
31 December 2017
US$m
Santuario, Magallanes, Arenque Mexico 248 382PM304 Malaysia 222 286Greater Stella Area development
United Kingdom – 255
Chergui gas concession Tunisia – 47Other (including PetroFirst) – 20 61Total 490 1,031
Working capitalThe net working capital balance at 31 December 2018 decreased US$83 million to US$339 million (2017: US$422 million). The key movements in working capital during the year compared with 31 December 2017 (reclassified under IFRS 15) were:
• A decrease in contract assets of US$416 million primarily due to advances received from customers and a reduction in variation orders pending customer approval of US$139 million;
• An increase in contract liabilities of US$121 million, predominantly reflecting an increase in billings in excess of costs and estimates earnings of US$176 million;
• A decrease in accrued contract expenses of US$311 million primarily due to higher vendor and sub-contractor payment milestones achieved during the year in the E&C division; and,
• A decrease in trade and other payables of US$177 million reflecting a decrease in trade payables of US$83 million and a reduction in accrued expenses of US$68 million.
Finance leasesNet finance lease liabilities decreased 17% to US$138 million at 31 December 2018 (2017: US$166 million; see A10 in Appendix A to the consolidated financial statements) and predominantly relate to two leased floating production facilities on Block PM304 in Malaysia.
42 Annual report and accounts 2018 Petrofac
FINANCIAL REVIEW CONTINUED

1 Net disposal proceeds include cash received upon completion less cash disposal costs (net disposal proceeds therefore excludes operating cashflows received from the effective dates of the transactions to the completion dates). Net disposal proceeds of US$506 million comprises the following items from the Consolidated Statement of Cash Flows: US$152 million of “proceeds from disposal of property, plant and equipment”; US$130 million of “proceeds from disposals of subsidiaries”; and, US$224 million of “amounts received from non-controlling interest”.
Total equityTotal equity at 31 December 2018 was US$1,009 million (2017: US$948 million), reflecting: a reduction in opening reserves of US$113 million on implementation of IFRS 9 and IFRS 15 (see note 2 to the consolidated financial statements); the reported profit for the year of US$61 million; the purchase of the Company’s shares by the Employee Benefit Trust (which are held for the purpose of making awards under the Group’s share schemes) of US$44 million; US$266 million recognised as a non-controlling interest on disposal of 49% of the Group’s operations in Mexico; and, dividends paid of US$129 million.
Of the total equity of US$1,009 million at 31 December 2018, US$707 million (2017: US$912 million) was attributable to Petrofac Limited shareholders and US$302 million (2017: US$36 million) was attributable to non-controlling interests. The increase in equity attributable to non-controlling interests reflects the recognition of a non-controlling interest on disposal of 49% of the Group’s operations in Mexico.
Net cash/(debt), liquidity and return on capital employedNet cash/(debt)The Group had net cash of US$90 million at 31 December 2018 (2017: US$612 million net debt), benefiting from better than expected working capital inflows at the year-end, lower capital expenditure and US$506 million of net divestment proceeds1.
Total gross borrowings less associated debt acquisition costs at 31 December 2018 decreased to US$636 million (2017: US$1,579 million including the discount on senior notes issuance).
31 December 2018
US$m
31 December 2017
US$m
Interest-bearing loans and borrowings (A)
636 1,579
Cash and short-term deposits (B) 726 967Net cash/(debt) (C) = (B) – (A) 90 (612)Equity attributable to Petrofac Limited shareholders (D)
707 912
EBITDA (E) 671 748Gross gearing ratio (A)/(D) 90% 173%Net gearing ratio (C)/(D) n/a 67%Net debt/EBITDA (C)/(E) n/a 82%
LiquidityThe Group’s total available borrowing facilities, excluding bank overdrafts, were US$1,798 million at 31 December 2018 (2017: US$2,210 million). The decrease reflects the repayment of the senior notes in October 2018, partially offset by new term loan and other facilities (see note 27 to the consolidated financial statements). Of the total available borrowing facilities, US$1,178 million was undrawn at 31 December 2018 (2017: US$645 million).
Combined with the Group’s cash balances of US$726 million (2017: US$967 million), the Group had US$1,904 million of liquidity available at 31 December 2018 (2017: US$1,612 million).
None of the Company’s subsidiaries are subject to any material restrictions on their ability to transfer funds in the form of cash dividends, loans or advances to the Company.
Return on capital employedThe Group’s return on capital employed for the year increased to 26% (2017 re-presented: 22%), reflecting a decrease in average capital employed (see A8 in appendix A to the consolidated financial statements).
EmployeesThe Group had approximately 11,500 employees at 31 December 2018, including long-term contractors (2017: 12,500).
DividendsThe Group’s dividend policy targets a dividend cover of between 2.0x and 3.0x business performance net profit and paying an interim dividend each year of approximately 33% of the prior year total dividend.
In line with the policy, the Board is proposing a final dividend of 25.3 cents per share (2017: 25.3 cents). The final dividend will be paid on 24 May 2019 to eligible shareholders on the register at 26 April 2019 (the ‘record date’). Shareholders who have not elected to receive dividends in US dollars will receive a sterling equivalent. Shareholders can elect by close of business on the record date to change their dividend currency election. Together with the interim dividend of 12.7 cents per share (2017: 12.7 cents), this gives a total dividend for the year of 38.0 cents per share (2017: 38.0 cents).
In determining the Company’s capacity to pay dividends, the Board primarily considers the available distributable reserves, the sustainability of the dividend policy and the Company’s financial position. At 31 December 2018, Petrofac Limited had distributable reserves of US$512 million (2017: US$416 million) and the total declared dividends in 2018 amounted to US$130 million (2017: US$130 million). The Company’s distributable reserves therefore support over 3.9 times this dividend. Dividends paid in 2018 were covered by free cash flow.
Alastair Cochran Chief Financial Officer 27 February 2019
Annual report and accounts 2018 Petrofac 43
Strateg
ic repo
rtG
overnance
Financial statem
ents

CORPORATE RESPONSIBILITY
A safe, ethical and responsive business
To achieve sustained commercial success, it is essential for Petrofac to have a strong commitment to corporate responsibility (CR). We remain acutely aware of the changing political, social and economic environment, and we see that our CR capability has a direct impact on our ability to:
• Deliver sustainable value to our stakeholders
• Maintain strong employee engagement• Bid for challenging projects• Optimise the performance of our assets• Operate safe and secure projects• Manage our risks
In 2018, we continued to formalise our approach to CR, with several new initiatives, and improved reporting standards.
Raising our reporting standardsThe better we measure our CR performance, the better we can manage it.
In 2018, we continued to report in accordance with the Global Reporting Initiative (GRI) G4 (core) guidelines, and introduced several new performance indicators.
We continued to publish many of our policy statements at www.petrofac.com.
Enhancing our complianceTo be effective, our CR policies and standards must be clearly understood and actively implemented. To this end, we continued to enhance our compliance function during 2018.
Supporting local suppliers and contractorsOne thing that sets Petrofac apart is the extent to which we support local suppliers and nurture local supply chains. Importantly these partners are expected to abide by all of our CR policies and Code of Conduct. During 2018, we worked harder to enable and monitor their compliance.
Understanding what matters most to our stakeholdersWe make a determined effort to understand the issues that are of most interest to our stakeholders including clients, investors, suppliers, NGOs, Government representatives, employees and industry associations.
In 2018, we continued this process via an online survey of key stakeholder groups and senior managers.
Based on this programme of engagement, we maintain a materiality matrix, which sets out our most important CR topics, and takes account of changing attitudes. To simplify the matrix we have not included issues assessed by our stakeholders as immaterial and of low importance. The matrix is used to inform our approach to CR and guide our CR programmes.
The remainder of this section of the Report is structured around the topics highlighted in the matrix.
44 Annual report and accounts 2018 Petrofac

IMPORTANCE TO PETROFAC
IMP
OR
TAN
CE
TO
EX
TER
NA
L S
TAK
EH
OLD
ER
S
MediumLow High
Hig
hM
ediu
mLo
w
Protecting the environment
A1 Biodiversity and habitat protectionA2 Legacy soil contaminationA3 Energy and climate changeA4 Waste managementA5 Water managementA6 Environmental management systems
Governance and ethical business practices
C1 Trade sanctionsC2 WhistleblowingC3 Anti-bribery and corruptionC4 Ethical conductC5 Responsible governance
Ensuring safety, asset integrity and security
E1 Political riskE2 Security risksE3 Contractor safety managementE4 Major accidents/process safetyE5 Worker safety/fatalitiesE6 Emergency preparedness
Developing our people
G1 Succession and career planningG2 Learning and developmentG3 Diversity and equalityG4 Employee recruitment/retentionG5 Occupational healthG6 Wellbeing and stress management
Generating economic value in-country
B1 ICV/local contentB2 Revenue and tax transparencyB3 Joint venture managementB4 Supporting local suppliers and
contractors
Respecting human rights across our supply chain
D1 Human rightsD2 Modern slaveryD3 Labour rights/worker welfare
See page 49See page 46See page 62
Engaging with local communities
F1 Social licence to operateF2 Land acquisition and resettlementF3 Social investment
See page 52See page 54
See page 57
A7 Environmental incidents
See page 59
D
D1
D2
D3
G
G6 G5
G4G3
G2
G1
B
B1
B2
B3B4
F
Technology and innovation
T1 Technology and innovation
See page 11
H
F2F3
F1
C
C1
C2
C3C4
C5
E
E2
E3
E4 E5
E6
E1
A1
A2
A3
A4A5A6
A7
A
H1
US$1.2mExpenditure on social investments
0.06Recordable incident rate
THE PETROFAC MATERIALITY MATRIX AND ISSUES FOR 2018
Corporate responsibility is key to Petrofac’s business.
A great example is our commitment to our local delivery model. By working with local partners and employing local people, we are more efficient. We also create in-country value, which is a key consideration for many of today’s clients.
By adapting to political, social, economic, and regulatory environments, we are able to build productive relationships, bid for challenging projects, manage our risks, and improve our performance.Ayman Asfari Group Chief Executive
Annual report and accounts 2018 Petrofac 45
Strateg
ic repo
rtG
overnance
Financial statem
ents

16
17
18
0.013
0.009
0.018
16
17
18
0.10
0.05
0.06
16
17
18
244
239
233
CORPORATE RESPONSIBILITY CONTINUED
ENSURING SAFETY, ASSET INTEGRITY AND SECURITY
We are committed to protecting our people, our clients, and the communities we work in, as well as the assets we design, build, operate and maintain. Our aspiration is for zero incidents.
Total man-hours worked by employees and subcontractors
233millions of man-hours
Lost time injury frequency rate
0.018per 200,000 man-hours
Recordable incident frequency rate
0.06per 200,000 man-hours
PRIORITIES AND PERFORMANCE
2018 Priorities 2018 Performance 2019 Priorities
• Conduct a ‘root and branch’ review of 2018’s safety incidents – to ensure that Petrofac remains fully committed to the safety agenda
• A Safety Improvement Plan was defined and implemented – focusing on the effective implementation of existing tools and processes
• Address the risks of complacency – by improving reporting, enhancing the scrutiny of reporting, and ensuring ‘safe’ is a value
• Continue to strengthen the sharing of lessons from incidents (particularly HiPos) across the business
• A new tracking tool was introduced to ensure lessons learned are effectively implemented
• Transition from Golden Rules of Safety to IOGP Life Saving Rules
• Target the common causes of HiPos with action plans to heighten awareness and enhance competency (especially safe lifting and driving)
• The Drive Safe campaign was extended with several new initiatives (like in-vehicle monitoring), and a Rigging Competency Assessment System was introduced
• Develop a consistent methodology for assessing data from in-vehicle monitoring systems and conduct a feasibility study on the utilisation of 5-star NCAP rated vehicles across our business
• Build further in-house HSSEIA capability to support pre-commissioning and commissioning activities
• A new Commissioning Boot Camp was introduced, together with a related handbook
• To enhance the consistent message of living ‘Safety as a value’, supported by training and communications to reinforce the right behaviours
• Enhance the programme of in-depth integrity reviews across our projects
• The integrity review programme was enhanced with a fully-integrated HSSEIA review conducted at all projects
• Introduce into the business a consistent process to carry out last minute risk assessments prior to commencing a task
• Strengthen the active engagement of Technical Authorities in operations activities
• A full programme of visits by Technical Authorities was implemented across all key operations
• Enhance the Asset Integrity Assurance Framework, increasing the level of cross business unit audits
• Improve the visibility and reporting of key integrity risks, and embed into the Enterprise Risk programme
• The Asset Integrity team was more fully integrated in the quarterly review of the Group’s Key Risk Register
• Improve and implement a revised asset integrity KPI dashboard
• Expand Security Focal Point training to include additional site personnel
• Focal Point training was extended to new geographies and additional personnel
• Step-up cyber-security protection with a programme of initiatives and the implementation of new standards
• Update and communicate the Group Crisis Management Standard to reflect 2017 developments
• Alongside a new Crisis Management Standard, emergency response training exercises were implemented
Historically, Petrofac has benefited from a strong safety record.
Despite an impressive safety performance across much of the Group, we regrettably experienced two major incidents in June 2018 that resulted in three fatalities.
A priority for the year was to learn from these events and ensure the entire Group remains committed to the safety agenda. We therefore enhanced our programme of well-established health, safety, security, environment and integrity assurance (HSSEIA) measures with the introduction of a new Safety Improvement Plan.
SafetyReflecting on our safety performanceIn early 2018, for example, the Group surpassed 125 million man-hours without a single lost time injury (LTI), highlighting our previously strong safety record.
However, from mid-2018, these achievements were overshadowed by two incidents, which resulted in three fatalities. In Kuwait, two people died in a scaffolding failure and, in Mexico, an accident involving a below-deck-walkway on an offshore platform resulted in the third fatality.
Both incidents were investigated in forensic detail and reviewed by senior management and, separately, by the Board. For the benefit of our subcontractor community, the incidents were analysed at our annual Safety Forum. They also catalysed the development and implementation of a new Group-wide Safety Improvement Plan.
In terms of broader indicators:
• Lost time injury (LTI) frequency rate – increased to 0.018 per 200,000 man-hours, compared to an industry average of 0.054 (International Association of Oil and Gas Producers, 2017).
• Recordable incident frequency rate – increased to 0.06 per 200,000 man-hours, compared to an industry average of 0.19 (International Association of Oil and Gas Producers, 2017).
Renewing our commitment to safetyThe review of 2018’s safety incidents concluded that the Group benefits from a robust set of policies and systems. However, certain behaviours needed to be developed further, some competencies needed to be enhanced, and reporting needed to be more disciplined. A Safety Improvement Plan was therefore initiated to address the shortcomings. Themes included:
COMMITMENT
46 Annual report and accounts 2018 Petrofac

• Making use of new technology – several new technological tools were introduced, including in-vehicle digital monitoring systems fitted to all Petrofac-owned and leased vehicles, and a mobile phone app was developed to enable site leaders to access and input into the Petrofac Assurance Index electronically.
• Listening to the business needs and setting the tone from the top – following on from previous years, we conducted 25 global ‘Safety Deep Dives’ at all our Business Unit headquarters. The output from these was fed into our annual Safety Leadership Conference attended by our 70 most senior leaders who together established common priorities that would be embedded in the Group HSSEIA Plan for 2019.
Asset integrityEnsuring the integrity of our operating assetsWe are committed to designing, building and operating assets that are safe, reliable and meet or exceed their specified purpose.
Key to this is our Asset Integrity Framework, which enables us to take a structured and consistent approach to integrity across all Group operations. Because we often operate ageing assets, it is particularly important for Petrofac to take a rigorous approach to asset integrity management.
During 2018, the Group was responsible for managing and ensuring the integrity of 19 operating assets. To assist clients with their operations, we also seek to apply these asset integrity principles across the wider Group services.
Reflecting on our asset integrity performanceIn evaluating our asset integrity performance, our main area of focus is managing process safety hazards and reducing high potential incidents.
The most significant incident in 2018 concerned an accident involving a walkway on the Arenque C Platform in Mexico (see above for details of the impact).
Also in Mexico, we continued to have pipeline integrity failures as a result of vandalism (see page 60 for details). For each integrity incident, technical notices were issued, a full remediation plan implemented, and a lesson learned communicated across the Group.
Seeking continuous improvement in asset integrityWe continue to review and enhance our approach to asset integrity and assurance. Developments in 2018 included:
• Reviewing our key performance indicators and enhancing our reporting – we conducted an in-depth review of our existing Asset Integrity KPIs against industry best practice, brought increased consistency and automation to the reporting process, and implemented a new software tool. This has resulted in new-look dashboards to better communicate the true condition of Petrofac-operated assets.
• Providing additional support to the commissioning and early operational phase of projects – increasingly, clients are asking Petrofac to provide commissioning services, and to manage the initial operations of the facilities we build. In response, the Asset Integrity team has been developing guidance to ensure that potential hazards are fully understood and effectively managed by on-site personnel.
SecurityRemaining responsive to a fast-changing security environmentPetrofac works in some challenging environments with fast-changing security issues. Our aim is to protect our employees and assets in a responsible manner, and to prevent any security-related disruption.
Our security team is therefore closely integrated into the wider HSSEIA community, and our Security Policy sets out the responsibilities of our leadership and our business units.
The success of our approach is demonstrated by the fact that, in 2018, there were no major security incidents to report.
Enhancing the protection we provide to our employees, partners and assetsTo reflect the fast changing security environment, we continue to review and refine our security approach. Developments during 2018 included:
• Extending our Security Focal Point training – we run a programme of one-day training courses for personnel at sites where the threat does not warrant a dedicated Project Security Manager. In 2018, this was extended to cover additional site personnel and new geographies (India and Thailand).
• Site safety leadership – it was agreed that existing safety tools and processes (such as the Petrofac Assurance Index, the Golden Hour programme, and quarterly Business Unit Reviews) would be enhanced, to make the responsibilities of site leaders more explicit. Also, the scorecards of site leaders and managers are to be updated to include additional HSSEIA-related accountabilities.
• Enhancing competencies – new requirements were agreed relating to various higher-risk operations and activities. For example, a certified scaffolding manager is to be assigned to support each project, high risk trade-specific competency verification programmes are to be rolled-out across all projects, and additional HSSEIA support is to be provided to all sites entering the pre-commissioning and commissioning phases.
• Addressing the risks of complacency – several measures were agreed to ensure that reporting is further enhanced, that breaches of rules and guidelines are appropriately addressed, that managers and leaders scrutinise the information presented to them, and that all employees and subcontractors continue to treat safety as a value.
Most of these measures were in place by the end of 2018, with the remainder scheduled for completion in early 2019.
Strengthening our safety cultureAlongside the Safety Improvement Plan, initiatives included:
• Continuing to focus on safe driving – driving-related incidents continue to be a major risk factor. Further enhancements were made in 2018 including defensive driver training programmes and journey management assessments.
• Improving lifting safety – a new Rigging Competency Assessment System was introduced to ensure that qualified lifting specialists are available on all sites.
• Supporting pre-commissioning and commissioning – several new process safety measures were introduced, including a new Commissioning HSSE Boot Camp training programme and completions safety guidance handbook.
Annual report and accounts 2018 Petrofac 47
Strateg
ic repo
rtG
overnance
Financial statem
ents

CORPORATE RESPONSIBILITY CONTINUED
• Rolling-out our Managing Our Security Risks Handbook – following the updates to this Handbook, which provides guidance to those people responsible for managing our security risks and protecting our assets, hard copies were distributed across the Group.
• Implementing a series of Security Assurance visits – our central security teams visited all project sites to conduct independent security assurance and validation surveys, and identify improvements.
• Enhancing Emergency Response capabilities – our Group Crisis Management Standard was updated, supported by a programme of Emergency Response and Crisis Preparedness training.
• Implementing new travel policies – new travel policies were developed for roll out across the Group in 2019.
Improving our cyber-security and data protection capabilitiesIn response to rapidly evolving data security risks, and to support Petrofac’s wider digitisation initiatives, a new Chief Information Security Officer was appointed, who led several initiatives, including:
• Enhancing cyber-security governance – a new Information Security Policy was created, supported by a suite of six Information Security Standards. An Information Security Council was also established, and cyber-security became a regular agenda item at all Executive Committee meetings and Board meetings.
• Increasing awareness of cyber-security – to support the new Policy and Standards, a Group-wide cyber-security awareness campaign was introduced.
• Investing in secure infrastructure – as well as replacing ageing equipment and bringing enhanced security to the infrastructure, Petrofac’s back-up capabilities were also improved through the increased use of cloud-based storage systems.
In support of the introduction of the EU General Data Protection Regulation (GDPR) we focused on updating our policies, evaluating systems and processes that we use to handle personal data, and raising staff awareness of their responsibility to adopt compliant practices and behaviours in managing such data.
This programme of initiatives will be stepped up in 2019 and the aim going forward will be to operate at the same standard as ISO270017.
Wanting to raise awareness of heart-related health risks, our UK team developed an innovative educational programme – Healthy Heart – that has now been rolled out globally.
The programme includes specialist medical checks and advice on how to maintain a healthy heart. And, this being Petrofac, engineering themes are used to grab the attention and engage employees.
During 2018, heart health risk assessments were carried out across 85 sites worldwide. In the UK, for example, we teamed up with the British Heart Foundation to show how to spot the signs of a heart attack, administer CPR, and put someone in the recovery position. Meanwhile, in the UAE, more than 300 people attended mini heart health check sessions, which included dietary guidance.
PETROFAC’S GLOBAL TEAMS HAVE A ‘CHANGE OF HEART’Heart-related illness is one of the biggest causes of emergency medical evacuations from our projects. A new initiative is encouraging teams across Petrofac to pay more attention to the health of their hearts.
This has been backed up by a broader range of awareness campaigns. For instance, to mark World Heart Day we encouraged colleagues across the Group to share a ‘heart selfie’ and tell us what they do to keep their hearts healthy. At several sites, clients have also joined in, adapting the Petrofac approach to get the message out to their own employees.
In our operationally-focused environment, the ‘H’ in Health and Safety isn’t always prioritised. Helping our people to stay healthy is an important way to keep them, and our operations, safe.
300+people attended mini heart health check sessions
48 Annual report and accounts 2018 Petrofac

Gender profile (%)
Male
Female
89%
11%
Age profile (%)
Under 30
30 to 40
11%
34%
40 to 50 31%
50 to 60 18%
60 and Over 6%
Grade profile (%)
2%Executive management
9%Managers / Technical experts
28%Supervisors / Senior professionals
45%Professionals / Senior support
General support / Technical support 16%
As a service business, it is our people, their attitude and skills who set us apart from our competitors. We are therefore committed to developing all of our people, identifying and nurturing future leaders, and enabling everyone within the business to perform to their true potential.
DEVELOPING OUR PEOPLETo enable us to attract the right people, support them in their development, and strengthen our leadership capabilities, we employ HR professionals with expertise in a number of related disciplines. They are based in each of our key locations, use common tools, follow consistent processes, and deliver against a business-focused HR strategy.
A key to our distinctive, delivery-focused culture is the strength of our values (safe, ethical, innovative, responsive, quality and cost conscious, and driven to deliver). These values are therefore linked to our Group-wide performance management process and celebrated through our annual EVE (Excellence, Values, Energy) Awards.
Continuing the transition towards a capital-light business As covered elsewhere in this Annual Report, the Group continued to reduce its capital intensity, with further efficiencies and the formal exit from various operations. As a consequence, our headcount reduced to 11,500 by the end of 2018.
Given the business environment, we paused our formal graduate recruitment and development programmes for one more year. However, with an emphasis on building a cadre of future leaders, and with the prospect of improving conditions, we intend to welcome a new graduate intake in 2019. Our aim is to increase diversity – gender and nationality – and support localisation targets.
While the wider business environment is beginning to show signs of improvement, there is still a relative scarcity of oil and gas positions, and voluntary turnover levels are thought to be low throughout the industry. At Petrofac the voluntary staff attrition remains similar to previous years.
Benefiting from new talent management and career progression programmesWith a clear emphasis on identifying and developing talent within our business, we continued to invest in The Learning Hub, an integrated cloud-based system that supports performance, talent, succession and competence management, as well as training management and e-learning.
Following its introduction in 2017, the system saw its first full year of operation in 2018, which brought more consistency to the way people are developed and managed and helps Petrofac to build capability, and drive performance. It also
PRIORITIES AND PERFORMANCE
2018 Priorities 2018 Performance 2019 Priorities
• Creating a degree of consistency with our pay and incentivisation packages across the leadership team
• Continued to cascade objectives from our Leadership Team through the organisation via Individual Scorecards
• Look to further align employee remuneration through our incentive programmes
• Ensuring clear and consistent messages and high quality engagement to drive business performance and motivate employees
• Promoted greater visibility of the leadership team across Petrofac and the need for clarity on our strategy and drivers of business performance
• Another employee engagement survey was conducted
• Appointed new Head of Talent at Group level to drive a consistent and robust global talent management process
• Continue Group-level commitment to deliver quarterly leadership communications and engagement on strategic developments and financial performance
• Engagement survey results to be shared with employees and action plans formulated in response to key findings
• Launching a Petrofac Workforce Forum, comprising 12 elected employees from across the organisation, to enable the Board to understand the views of the Company’s workforce and to take these into consideration during decision making
• Developing a cadre of future leaders, providing them with the opportunities to demonstrate their potential and accelerate their progression
• Conducted regular business unit talent reviews and succession planning discussions
• Formally recognised early career individuals who have made a significant contribution to the business
• Reviewed the talent and succession plans for our Top 1,000 employees with the Nominations Committee
• Continued to build management and leadership capability through the delivery of the Petrofac Pathway programmes
• Intention is for a significant number of our Top 200 leaders to attend a Leadership Excellence programme in 2019 (and the remainder in 2020)
• Our Graduate Development Programme will recommence in 2019. Our intention is to hire around 150 graduates across three main locations (UK, UAE and India)
• Launch a Project Management Capability Development Programme to support a consistent approach to the development of project engineers, managers, directors and project support functions
COMMITMENT
Annual report and accounts 2018 Petrofac 49
Strateg
ic repo
rtG
overnance
Financial statem
ents

CORPORATE RESPONSIBILITY CONTINUED
means employees having direct access to all of their competence, e-learning training, scorecard and appraisal information, and line managers having access to information about those within their teams.
A benefit of The Learning Hub is our ability to track the completion of mid-year and end-of-year reviews, and to monitor completion levels of e-learning undertaken. For example, during 2018 the number of hours of learning completed topped 7,500.
Bringing more discipline to leadership development and succession planningA focus of our HR strategy is to develop the Group’s leadership capabilities and ensure that succession plans are in place across all tiers of management.
In 2018 301 people participated in one or other of our Petrofac Pathway programmes – Supervisor Toolkit, Management Essentials and Management & Leadership Development Programme.
Enhancing our reward and recognition processesA new Centre of Excellence for Compensation and Benefits was established as part of the Global HR team. With this in place, a new Global Reward Strategy was developed, ready for launch and roll-out in 2019. Total Reward Statements were also issued to the top 1,200 employees. These personalised statements detailed the total pay and benefits package each employee received in 2018, providing further transparency and enhancements to our reward and recognition processes.
A set of revised grading descriptors was released, helping everyone understand the expectations for each employee grade.
Aiming for a highly engaged workforce with a sense of ownershipTowards the end of the year, we received the results of our 2018 PetroVoices employee survey and, as anticipated, these reflected the challenges the Group has faced over recent years.
Our PetroVoices survey helps us to monitor employee engagement, build on strengths and address concerns. Several of our 2018 HR initiatives were a direct response to the results of our last survey (conducted in 2016). In early 2019, all business units and functions will be drawing up action plans to address the top priority areas for action identified from the 2018 survey. To monitor engagement levels more closely, the survey will be repeated during 2019 and run annually in the future.
We actively encourage employee share ownership, believing that it builds commitment to the Company’s goals. In 2018, 39% of our employees participated in at least one of the Petrofac employee share schemes.
Improving the consistency and capability of our HR operationsBack in 2017, the structure of the Group’s HR operation was changed, with all HR teams now reporting to the Group HR function. During 2018 further steps were taken to integrate the HR teams and enhance the skills of those within them.
In 2019, the application of digital technology will be a key theme for the HR function. As well as building on The Learning Hub, this will include the further enhancement of the existing Enterprise Resource Planning (ERP) system. We will be taking our Petrofac Academy online – offering at least 40 online training courses, as a first step in digitising our Learning & Development offerings to our employees. The Group will also prepare for a sizeable intake of new graduates and our Global Mobility practices will be reviewed.
CELEBRATING OUR ‘RISING STARS’A new way to recognise the sort of people who make Petrofac special.
At the heart of everything we do, the six Petrofac values guide our decisions and behaviours: safe, ethical, innovative, responsive, quality and cost conscious, and driven to deliver. Each year, these values are celebrated through the Petrofac EVE Awards. We also give special emphasis to the young people who best embody them, and are destined to become the future leaders of the Company.
This is the thinking behind the Rising Star category of the awards, which was introduced in 2017 and repeated in 2018. In total, we received 26 nominations, all of which came from our Managing Directors and were seconded by the nominees’ line managers. Judges were asked to consider how these individuals had lived our values, supported our business, and gone above and beyond what was expected of them.
Three of our brightest young employees were shortlisted from a very competitive field. The winner was Eilidh Snadden, a young engineer from Aberdeen, who narrowly edged ahead of her colleagues Kavita Ramaswamy and Joakim Treider.
This Rising Star award demonstrates how seriously we value the active contribution of our younger talent, and the way we seek to celebrate the sort of people who set Petrofac apart from our competitors.
50 Annual report and accounts 2018 Petrofac

One such attack, originally perpetrated in 2017, went undetected for some time. To make matters worse, a deteriorating relationship with local landowners, communities and unions stalled the clean-up campaign.
Petrofac decided to reach out directly to the interested parties in the local community. A meeting was facilitated with community leaders, landowners, trade unions and a specialist clean-up contractor. Together, they worked out a solution.
An innovative landfarming technique was selected to nurse the land back to good health. Local people, rather than outsiders, were trained to do much of the work, acquiring new skills in the process. As the solution was brokered locally, rather than being imposed, there were no further blockades to contend with.
As a result, the clean-up was completed during the dry season, which avoided the risks of the contamination spreading. The costs of the operation were around 50% lower than initial estimates, and a far more productive relationship was established with nearby communities that will be built on in the coming year.
In addition to building community relationships, engineering remedies were trialled and subsequently introduced to provide yet another line of defence. The Petrofac teams devised and deployed an ingenious new type of back-pressure valve that automatically stops the flow of oil when changes in pressure (resulting from well head vandalism) are detected. The system, which was designed in-house, was fitted to around 70 wells in the oil field, and has prevented several spills.
Innovative remote sensing and surveillance solutions have also been implemented, including use of a Remote Pilot Aircraft System (RPAS – drone), introduced to map the complete field and for real-time aerial monitoring of assets, well heads and pipelines. The objective is to deter vandals and detect any spills early to reduce the environmental impact as the RPAS can fly over the entire length of the pipeline four times a day. As a result of the project there has been a substantial reduction in vandalism activities.
The success of these projects has given confidence to the team to replicate these initiatives at other assets in Mexico. However, scarcity and shortage of petroleum products as well as socio-economic problems continue to drive pipeline vandalism, and mitigating spill risks remain an ongoing challenge in Mexico.
INNOVATIVE WAYSTO MANAGEOIL SPILL RISKSIN MEXICOPetrofac has been finding new ways to prevent and respond to oil spills in Southern Mexico, while improving relationships with the local communities.
Located in Tabasco state, our Santuario asset stretches over 184 square kilometres end to end, encompassing many local communities and a topography that poses extensive operational challenges to cover.
Oil field vandalism has been common practice in Tabasco ranging from theft of metal to damage of oil facilities that creates spills to generate income. Work blockages and restrictions to accessing land, associated with various community and stakeholder issues, have further exacerbated the problems.
c.70wells were fitted with new back-pressure valves, preventing several spills
Annual report and accounts 2018 Petrofac 51
Strateg
ic repo
rtG
overnance
Financial statem
ents

16
17
18
2.7m
3.8m
1.2m
16
17
18
2.3m
2.1m
0.7m
16
17
18
0.3m
1.7m
0.5m
CORPORATE RESPONSIBILITY CONTINUED
ENGAGING WITH LOCAL COMMUNITIES
The Petrofac Social Performance Framework governs the way we approach community engagement. It consists of our Social Performance Standard and a set of guidelines that enable us to meet the commitments set out in the Petrofac Ethical, Social and Regulatory Risk Policy.
Our community engagement initiatives fall into two main categories:
• Community development – where our operations are located close to local communities, we generally work with stakeholders to plan and implement initiatives that will benefit local people, such as skills training, creating opportunities for local labour, and investing in local supply chains.
• Strategic corporate giving – across the Group, we support community-based initiatives, with a particular focus on science, technology, engineering and mathematics (STEM) education. Our social investments are also aligned to the relevant United Nations Sustainable Development Goals.
Reflecting on our 2018 performanceOur overall approach and philosophy remained largely unchanged in 2018. However, the revised contracts and operating arrangements in both Mexico and Tunisia allowed us to refine our long-established programmes, hand over co-ordination where assets have been divested, and work with local communities to agree on activities for 2019.
Meanwhile, our community engagement approach and credentials continue to play a prominent role in the bidding process. Our risk assessment and security teams seek to understand and address any situations where community relations could negatively impact a project.
Ensuring that local communities take the lead on development programmesWe typically conduct community development initiatives when we act as the operator of a client’s assets. In such instances, our ability to operate effectively is often determined by the quality of our relationships with local communities and our understanding of their priorities and expectations. Accordingly, in 2018, a key theme has been to strengthen partnerships with local stakeholders, and encourage local communities to take the lead in development programmes that we fund.
Wherever we work, we are committed to being a good corporate citizen, by helping local communities to be healthier, more prosperous, and more engaged with our work.
In particular, we aim to engage with local stakeholders to understand and manage the social impacts of our business, address any concerns they may have, and maximise the benefits we are able to bring to their communities.
While we often have a contractual or regulatory obligation to manage the social impact of our business, we also encourage a culture of active community engagement and support many related initiatives.
Social investments
US$1.2m
Community development
US$0.7m
Strategic corporate giving
US$0.5m
PRIORITIES AND PERFORMANCE
2018 Priorities 2018 Performance 2019 Priorities
• Review and update our existing social programmes in Mexico to support our changing business operations
• We worked with local communities and stakeholders in Mexico and Oman to update our Social Management Systems and plans, refine our social investment programmes, and increase engagement with government bodies
• Implement and embed social programmes prioritised by communities in our projects in Oman and Thailand
• Support municipalities in Tabasco State (Mexico) to establish and fund their own Municipal Development Plans and promote greater local capability in community development
• Develop a strategy to address land access, blockages and vandalism in Mexico
• A new strategy was implemented to include the local community in our operational work teams
• Incidences of extortion-driven blockages were referred to the legal authorities
• Extend use of remote sensor technology to combat vandalism further
• Strengthen social investment projects in Tunisia to support the drilling campaign planned for late 2018
• Although the drilling campaign was postponed until 2019, social investment projects continued
• Effective handover of social investment programmes as part of the completion of the Chergui asset sale
• Review and update the corporate giving strategy
• Align initiatives across the Group to the revised strategy
• Our approach to social investment was reviewed, with increased emphasis on gender equality
• The social investment process was reviewed and updated, and due diligence screening developed
• Raise awareness of the revised social investment guidance and align initiatives across the Group
• Incorporate due diligence screening into our compliance portal for all third parties undertaking social investment projects
COMMITMENT
52 Annual report and accounts 2018 Petrofac

Aligning our strategic corporate giving programmesDuring 2018, we strengthened our corporate giving strategy, with the roll out of a new Social Investment Guidance document. As before, this focuses on initiatives that promote STEM education and/or improve employability for young people from marginalised groups, but has an increased emphasis on gender equality.
We also support various philanthropic initiatives that enhance employee engagement by working with charities that are relevant to employees or are located close to our offices.
Highlights from 2018 include:
In IndiaThere is a regulatory requirement for us to spend at least 2% of our revenues on social investments, equating to a Petrofac investment of more than US$255,000. In Chennai, for example, we supported a number of projects from the Sevelaya Trust, and around US$65,000 was contributed to school renovations and a sports and fitness centre for vulnerable young people.
Meanwhile, in Mumbai, we continued our partnership with the Social Economic and Educational Development Society, supporting vocational training programmes for 72 young people.
In the UAEAround US$150,000 was contributed to various charities and initiatives, including learning and development events at the American University in Sharjah and support to the Pearl Initiative, a Gulf business–led organisation promoting accountability and transparency in business.
In MalaysiaVarious education-themed initiatives were progressed, including a US$25,000 contribution towards a university-led initiative to encourage more public-private partnerships in research and development.
In the UKWe continued our support of the Connecting STEM Teachers programme, run by the Royal Academy of Engineering which supports a nationwide network of teaching coordinators. In the 2017/18 academic year more than 11,000 secondary school students benefited from our involvement. Meanwhile, in Aberdeen, we marked the 20th anniversary of our continuing support for the Lochside Academy, which encourages students to explore STEM-related subjects.
Looking ahead to 2019In 2019, we will continue with the same overall approach and philosophy.
In Mexico, with the communities in which we work, we have set out a wide-ranging programme of investments. These include cultural and sports initiatives, improved local healthcare facilities, a series of educational investments, and support for local economies through significant skills training programmes.
In our EPC projects in Oman and Thailand we will commence stakeholder engagement programmes to ensure the communities in which we operate are kept informed of project activities and social investment initiatives.
Meanwhile, having completed the sale of the Chergui asset in Tunisia at the end of 2018, community development programmes were temporarily postponed to facilitate a smooth hand over to Perenco (Oil & Gas) International Limited.
For our strategic corporate giving programmes, in the UK we continue to address the engineering skills gap through targeted investment in STEM education with the Royal Academy of Engineering and in Oman we support the development of young engineers through our partnership with the Sultan Qaboos University in Muscat.
Finally, to improve the way we evaluate these social investment initiatives, we plan to incorporate our due diligence screening and project assessment into our Group compliance portal.
In MexicoOur approach to active community engagement was particularly evident in Mexico, where we opened a new field office in Santuario to support our new Production Sharing Contracts and the additional responsibilities entailed. This new open-door facility provides local communities and property owners with up-to-date project information, clarity on grievance procedures, and opportunities for involvement in social programmes.
In Tabasco State, all development programmes are now being determined by local communities, with local authorities partnering on their implementation. In 2019, this approach will be extended, by helping municipalities to establish and fund their own Municipal Development Plans.
Also in Tabasco State, we developed a new online database to improve access to information on issues such as land access rights, land contracts, past incidents, and grievances. This should improve the speed and consistency of our related community engagement.
During 2018, our total community development investment for Mexico amounted to US$400,000 (75% of which is cost recoverable), compared with US$1.8 million in 2017, the reduction reflecting the continued strategy of divesting non-core assets.
In TunisiaWe continued to support a number of public infrastructure, local industry and community projects to support our Tunisian operations, located in the Kerkennah Islands, until handover to their new operator.
The total investment was around US$200,000. This included improvements to 12 local schools, the purchase of new boat engines for 20 local fishermen, and the installation of new photovoltaic street lights across the main island to improve security across several poorly-lit public areas.
Annual report and accounts 2018 Petrofac 53
Strateg
ic repo
rtG
overnance
Financial statem
ents

16
17
18
<5%
14%
40%
16
17
18
38
51
227
16
17
18
<5%
16%
45%
RESPECTING HUMAN RIGHTS ACROSS OUR SUPPLY CHAIN
2018 marked a change in our focus with regard to respecting human rights.
As reported in previous years, our main exposure to potential human rights issues is through our supply chain and, more specifically, its employment of low-skilled migrant workers from ‘high risk’ countries. We had therefore worked to understand the true extent of this exposure, develop our policy framework, and establish our response. We conducted due diligence, developed a Labour Rights Standard, set out our future commitments, and established a Labour Rights Steering Group.
This year, we shifted our attention to awareness raising, training, capacity building, and ensuring that our requirements are understood and implemented across our extended supply chain.
Addressing risks via sustainable remediationThrough our due diligence programmes, we know that the main human rights vulnerability is in the employment of unskilled migrant labour in the supply chain at our large engineering and construction projects, who can be exposed to risks of the charging of excessive recruitment fees, unconsented retention of travel documents and the risk of contract discrepancies, by recruitment agents.
To address this, we have stepped up our scrutiny of subcontractors. For example, as part of the prequalification process, we have included labour rights screening. As part of the ongoing business relationship, we also require them to validate their compliance with all of our rules and standards, including labour rights and worker welfare.
Where we discover an issue, our emphasis is on sustainable remediation – to deal, honestly and openly with our concerns, and agree on a path to the full implementation of our policy requirements and standards.
Petrofac operates in challenging environments where human rights issues can become a source of risk, both for our business and for some of the people who work on our sites.
We are committed to working in partnership with our clients and suppliers to ensure that human rights are respected throughout our business operations and across all of our project sites. We also strive to follow best industry practice, working in accordance with the core conventions of the International Labour Organization (ILO) and the United Nations Global Compact, of which we are a signatory.
Projects completing labour rights assessments
40%new E&C projects assessed
Human rights training (person training hours)
227person training hours completed
CORPORATE RESPONSIBILITY CONTINUED
PRIORITIES AND PERFORMANCE
2018 Priorities 2018 Performance 2019 Priorities
• Launch a training and awareness programme to support implementation of our Labour Rights Standard
• Our new training programme, to support implementation of our Labour Rights and Worker Welfare standards, was launched – commencing with our executive management, cascaded to relevant functions, and extended to projects and key subcontractors
• Progressively extend our awareness and training programme across our new projects and geographies and to key subcontractors and recruiters
• Develop a labour rights subcontractor management process
• A labour rights management toolkit was developed, and human rights issues were included in the compliance portal, through which all of our key suppliers are annually assessed
• Embed the new due diligence processes in our compliance and supply chain systems, and raise awareness with key functions
• Fully integrate our Labour Rights Standard into our digital supplier and vendor management system
• Third party due diligence was extended through our supply chain management system, and labour rights screening was included in the prequalification process for all subcontractors
• Publicly report further progress on our efforts to implement the requirements of the UK Modern Slavery Act (MSA)
• We updated the Executive Committee and Board on progress in meeting our MSA commitments, and issued a public statement
• Adopt into the next public statement all relevant recommendations from the UK Government’s 2018 independent review of the MSA
• Further strengthen our collaboration with industry partners, and share the outcomes of our work with stakeholders
• We continued to engage with the wider industry, engaging in industry bodies, and speaking at relevant industry conferences and events
• Enhance collaboration with country human rights and labour forums and share good practice with wider industry stakeholders
COMMITMENT
Supplier labour rights due diligence screening
45%new and existing suppliers screened
54 Annual report and accounts 2018 Petrofac

Engaging across the sector to respect human rightsWe were, of course, assisted by an increased awareness of human rights issues across our sector, and the emergence of new regulations, such as the UK Modern Slavery Act. As a consequence, we were able to step up our collaboration with industry peers and stakeholders, to adopt common principles, and drive industry-wide improvement in working practices.
For example, we participated in various industry bodies, such as IPIECA, the global oil and gas industry association for environmental and social issues, and Building Responsibly, a global contractor coalition committed to promoting the rights and welfare of workers. We also presented our work at several conferences and events, such as the Society of Petroleum Engineers’ annual conference.
We have also teamed up with clients to emphasise our commitment to human rights. For example, we have been active participants in the Oman Labour Forum, a BP-led stakeholder group which seeks to establish common industry practices. As part of this, we also worked with BP to undertake a mass survey of human rights issues involving 1,200 of our workforce on the US$800 million Khazzan Phase 2 project.
Our commitments for 2019 and beyondFor 2019, our priority will be to continue to roll-out and embed the various initiatives and resources. This will include:
• An update of our Code of Conduct to make human rights more explicit
• Extending our labour rights programme across our new projects and the wider Group
Meanwhile, we will strengthen our subcontractor compliance assurance processes, and will continue with the series of project audits to assess the level of compliance in sites and address any issues encountered.
Looking further ahead, we aim to continue to drive innovation and improvement, and to report on our achievements, incorporating good practice from peer learning.
Implementing a new Worker Welfare StandardTo complement our new Labour Rights Standard, we finalised and launched a new Worker Welfare Standard, covering topics such as accommodation, catering, recreation, healthcare, transportation, working hours, and workforce engagement.
This sets out the minimum requirements for every Petrofac project and asset, and applies to every worker, irrespective of whether they are employed by the Company or through a subcontractor. As well as communicating the Standard to all employees and subcontractors, we also shared it with clients and peers.
Many of the requirements were already well established. What the Standard aims to do is to ensure that they are applied consistently across the Group, and guarantee that everyone on our sites is entitled to safe and healthy working conditions.
This commitment to worker wellbeing not only improves the health and morale of our workers, but also increases efficiency, performance, and safety – and is therefore instrumental to achieving our ultimate goal of zero incidents.
Annual report and accounts 2018 Petrofac 55
Strateg
ic repo
rtG
overnance
Financial statem
ents

CORPORATE RESPONSIBILITY CONTINUED
TURNINGCHALLENGE INTOOPPORTUNITYPartnering with our client to enhance labour rights and worker welfare in Oman.
Aside from being the right thing to do, the commercial case for improving labour rights and worker welfare is compelling. When workers are happy and engaged, they tend to work more safely and efficiently, and the risk of delays and disputes is minimised.
But, with a huge project involving a subcontractor workforce of thousands of people from many different nationalities, it can be a challenge to appreciate the true conditions faced by all workers on the US$800 million project in Oman. We partnered with our client to understand the realities – and address any issues.
For example, as part of the induction programme, we surveyed more than 3,000 workers to find out about possible labour rights breaches. In particular, we wanted to know if anyone had been forced to pay recruitment fees to agents in their home country. Where they said they had, we automatically reimbursed them, and followed up with the employers and their agents to put solutions in place.
By the end of 2018, Employer Pays Principle (for project recruitment) was fully embedded down the supply chain and the project assessed as debt-free, with over 95% of the workforce having no recruitment-related debts at all, and a reimbursement programme in place to resolve the legacy debt of the remaining workers. We also participated in the Oman Labour Forum, an industry stakeholder group which seeks to promote labour welfare improvements and establish common industry practices.
At the Ghazeer site, you can immediately see the commitment to worker welfare, and this is reflected in the quality of the Petrofac-built onsite accommodation. Rooms are spacious and well-equipped, and there are top quality recreational
facilities. So, if you like playing snooker, tennis, or basketball, or just relaxing and watching a movie in the site’s cinema, there is always something to do in your spare time. Also, a wellness programme promotes health awareness, with a focus on diet and nutrition and opportunities to address mental health issues like stress and depression.
Petrofac’s Construction Director, Mohamed Shaheen, says that one of the characteristics of the project is the open culture and close collaboration between teams, “I regularly sit in on the Welfare Committee meetings, which includes representatives from all parts of the project, and they do a great job of addressing concerns and proposing improvements. This shows in how happy the guys are on site and how safely and productively we’re delivering the project.”
95%of the workforce on the project having no recruitment-related debts
56 Annual report and accounts 2018 Petrofac

16
17
18
2.3
1.2
1.1
16
17
18
69,500
75,500
75,500
16
17
18
US$571m
US$422m
US$560m
The support of local economies has always been important to Petrofac.
Wherever the Company operates, we are committed to creating shared value, by supporting local supply chains, employing local people and stimulating local economies.
As well as being the right thing to do, we see the creation of in-country value (ICV) as a source of competitive advantage, helping us to bid on challenging projects, keep costs down, improve the quality and availability of local suppliers, and build stronger relationships with local stakeholders.
We therefore aim to make a positive and measurable contribution to the economies in which we operate.
GENERATING ECONOMIC VALUE IN-COUNTRY
Alongside client value and shareholder value, we consider ICV as one of the three core outcomes of our business model.
In 2018, we continued to enhance and formalise our related initiatives, and align our local employment and procurement programmes with the ICV priorities of our clients and other national stakeholders. We also continued to support suppliers through our training initiatives and our Heath, Safety, Security, Environmental and Integrity Assurance (HSSEIA) programmes.
Reflecting on our 2018 performanceWe continue to purchase a large proportion of goods and services from local vendors and suppliers, and also support a significant number of local jobs. Typically, this goes well beyond our contractual and regulatory obligations regarding local content.
Working with local suppliers In 2018, just taking into account the key projects listed on page 34, we purchased more than US$1.1 billion worth of goods and services. This is slightly down from the US$1.2 billion spent on key projects in 2017. Meanwhile the proportion of locally-sourced goods and services decreased from 50% in 2017 to 31% in 2018.
For various reasons, including the size of the country and the capability of the local supply chain, the level of local content varies by country. For example, on our projects within the United Arab Emirates locally-sourced goods and services accounted for 87% of expenditure during 2018. Meanwhile in Oman, local expenditure on the Rabab Harweel project was 50%. The equivalent figure in Russia on the Sakhalin OPF project was 57%, and in Kuwait on the Lower Fars heavy oil project 51%.
Supporting local employment At the close of 2018, and just taking into account the key projects listed on page 34 we supported almost 75,000 jobs at our project sites. Around 95% of these were through our subcontractors, the remainder being a mix of expatriate and local Petrofac employees and contractors.
The extent to which subcontractor jobs are held by locals or expatriates is determined partly by contractual requirements and partly by the availability of qualified candidates. In some countries, such as Algeria, the percentage of local subcontractor workers can exceed 85%. In others, such as UAE, it can fall below 10%.
PRIORITIES AND PERFORMANCE
2018 Priorities 2018 Performance 2019 Priorities
• Enhance the Oman ICV programme through creation of a centralised function to share learnings between projects
• A central ICV management team was created in Muscat, responsible for implementing and expanding the ICV programme across all new projects
• Develop and deliver project-specific ICV plans linked to national ICV priorities
• Deepen our analysis down the value chain to track and enhance the retained value
• Expand the provision of quality technical training for Omani nationals at the Takatuf Petrofac Oman (TPO) Centre of Excellence
• The TPO facility received its first cadre of students in April 2018, who received operational and maintenance training, including disciplines like HSSE, scaffolding, welding, fabrication, electrical and instrumentation
• Support the Oman Ministry of Commerce Small and Medium Enterprises (SME) programme through capacity building to enhance local SME input on our projects
• Further progress the Saudi localisation strategy towards a 70% IKTVA* by 2021
• For our Fadhili Project in Saudi Arabia:50% of total material ordered to date has been placed with local In-Kingdom (IK) vendors54% of total contract value is placed on vendors and subcontractors
• Further enhance our IKTVA programme through prioritising:Local purchasesIncreased employment opportunities for Saudi graduatesInitiatives to support suppliers to raise their IKTVA
• Continue to enhance our tax risk management and compliance procedures
• We issued our Tax Policy (available in the ‘Responsibility’ section on www.petrofac.com)
• Continue to monitor trends and best practice in tax reporting, and enhance our procedures accordingly
* IKTVA – ‘In Kingdom Total Value Add’ score is Saudi Aramco’s measure of local content
COMMITMENT
Goods and services
US$1.1bn
Key project jobs
75,500
Our worldwide contribution to public finances – total taxes paid
US$560m
Annual report and accounts 2018 Petrofac 57
Strateg
ic repo
rtG
overnance
Financial statem
ents

CORPORATE RESPONSIBILITY CONTINUED
Setting the standard for ICV in Oman In Oman, where our IVC programmes are most mature, we established a central ICV management team, and continued to increase and quantify our impact.
For example, the new Takatuf Petrofac Oman training centre received its first cadre of students. This US$30 million facility is intended to accelerate the training of young Omanis and provide the country’s oil and gas operators with a ready supply of qualified, job-ready graduates (for more information see the case study on page 18). Meanwhile, to support the development of a world-class local workforce, Petrofac signed a postgraduate scholarship agreement with the Sultan Qaboos University. For the 2018-2019 academic year, this will support three Omani students pursuing MSc programmes in mechanical, chemical and process, and civil engineering.
To reflect the Omani government’s emphasis on the small and medium enterprises, we also launched a programme of technical support for smaller suppliers. Initially targeting around 30 companies, the aim is to build local capacity by matching qualified suppliers with project opportunities.
Meanwhile, around 245 Omani nationals (32% of our direct workforce) were employed across our operations. With the start-up of major projects in Salalah and Duqm, we are providing further employment opportunities. Reflecting our achievements, we were awarded “2018 Best ICV Contractor” by Petroleum Development Oman (PDO).
Making a significant contribution to public financesThrough the taxes we pay, Petrofac makes a significant financial contribution to the public finances of the local economies in which we operate.
In 2018, the total amount paid to governments in tax was US$560 million, comprising corporate income tax, employment taxes, other forms of tax and social security contributions.
Transparency in tax reporting Ensuring tax compliance and increasing tax transparency continue to be priorities for governments, regulators and businesses. We therefore continue to monitor regional and global best practice, maintain membership of industry groups, and follow and provide input into tax policy development.
Our tax strategy and tax policy explains how we approach the management of our tax affairs (available in the ‘Responsibility’ section of www.petrofac.com).
The total amount that we pay in taxes is not limited to the corporate income tax disclosed within the financial statements. It also includes employee and employer taxes and social security payments, VAT and sales taxes, and other taxes such as withholding, property and other indirect taxes. The total amount paid by Petrofac to governments worldwide includes those taxes which are borne by Petrofac, as well as taxes collected by Petrofac but which are recoverable from tax authorities or clients and supplies. VAT and sales taxes are shown on an accruals basis.
Priorities for 2019The creation of ICV is intrinsic to the Petrofac business model. We will therefore continue to make a contribution to the economies in which we operate, which tends to be commensurate with the extent of our operations. We aim to develop and deliver more project-specific ICV plans linked to national ICV priorities, while also deepening our analysis down the supply chain to track and enhance the retained value.
58 Annual report and accounts 2018 Petrofac

We are committed to working in an environmentally responsible way and limiting the environmental impact of our operations around the globe. Our target is zero environmental incidents and a progressive reduction in greenhouse gas emissions.
PROTECTING THE ENVIRONMENT
PRIORITIES AND PERFORMANCE
2018 Priorities 2018 Performance 2019 Priorities
• Implement additional new requirements to ensure Group-wide compliance with ISO 14001:2015
• As of 2018, all new projects operate in full compliance with ISO14001:2015
• Develop and roll out an Environmental Toolkit to support the Environment Management System and integrated assurance programme
• Continue to strengthen the environmental assurance programme
• Our environmental assurance programme was strengthened with revised checklists and questionnaires
• Continue to maintain independent third-party verification of reported environmental performance on emissions and spills
• Our emission performance data continues to be third party verified
• Continue to focus on improvements in energy efficiency, including participation in the Energy Saving Opportunity Scheme (ESOS)
• Beyond our ESOS participation, we continued to achieve energy efficiency improvements across several projects. Details provided in case studies on page 61
• Identify further opportunities for improving energy efficiency by conducting a feasibility study on the use of renewable energy in power generation on construction projects
• Ensure all components of the Emergency Response and Crisis Management teams are strengthened through integrated training.
• Integrate environmental, asset integrity and social economic aspects into oil spill risk ranking across the Group
• A new Oil Spill Prevention, Preparedness and Response Standard has been developed
• Work on a Spill Prevention Guidance document, Spill Prevention Inspection Checklist and consequence ranking tool was progressed
• Roll out the Oil Spill Prevention, Preparedness and Response Standard and Inspection Checklist across the Group
• Continue to achieve a reduction in our greenhouse gas intensity (GHG) performance
• We continued to meet our targets for reductions in GHG intensity
• Conduct a gap analysis on information to be included in the Annual Report against TCFD recommendations
• Continue to achieve a reduction in our GHG performance through energy efficiency initiatives
COMMITMENT
Scope 1 Emissions (direct from owned or controlled sources) Tonnes of carbon emissions (000 tCO2e)
244
235
239
16
17
18
Number of spills above one barrel (6 from vandalism)
3
2
7
16
17
18
Hydrocarbon spilled volume in barrels (968 from vandalism)
16
52
970
16
17
18
Scope 2 Emissions (indirect from purchased energy)
18
12
12
16
17
18
GHG Intensity IES 000 tCO2e per million boe production
90
77
56
16
17
18
GHG Intensity E&C/EPS 000 tCO2e per million hours worked
0.30
0.23
0.20
16
17
18
Annual report and accounts 2018 Petrofac 59
Strateg
ic repo
rtG
overnance
Financial statem
ents

CORPORATE RESPONSIBILITY CONTINUED
Reflecting on our overall performanceOverall the trend was generally positive for 2018, with a reduction in our GHG intensity, and a reduced volume of oil spilled from operational incidents. However, there was a 2% increase in absolute GHG emissions, due to a change in reporting boundaries and the addition of emissions from the FPF1 (UK) and Santuario (Mexico) assets, which now fall under our reporting responsibilities and account for 15% of total emissions.
In terms of intensity of emissions, we again improved our performance. Over 2018, we achieved a 55% reduction in GHG intensity in Integrated Energy Services and an 13% reduction in Engineering & Construction.
Improvements were driven by increases in low emission intensity production, new initiatives at individual projects and assets, and improved awareness among the wider workforce. For example: our Chennai office implemented a low energy lighting initiative, and replaced all light fittings with low power LEDs; operational teams in Malaysia reduced emissions by strategically shifting their helicopter base from Kota Bharu to Kerteh; and, in Mexico, our teams initiated a project at the El Golpe facility to reduce flaring. Meanwhile, several of our projects moved from the peak construction to commissioning phases, further reducing fuel consumption.
In terms of spills due to operations, we achieved fewer spills compared to the previous year. There was only one reportable operational spill above one barrel: a pipe burst released two barrels of hydraulic oil into the sea.
However, there has been an increase in overall spill incidents and volumes. The largest proportion of these spills continue to take place onshore in Mexico, often the result of deliberate sabotage. Having entered into a Production Sharing Contract in 2018 with Pemex in Santuario, such incidents are now recorded in our reported total oil spilled. This year alone, there were six reportable spills due to vandalism in the Santuario field, releasing 968 barrels of crude oil to the surroundings.
To address the situation, we continue to invest in physical-safety measures, tamper-proof components, remote-sensing systems, and improved surveillance (see page 51).
Investigation and clean-up of contamination is carried out for each spill. In addition, we continue to work with Pemex, our client, as well as local communities and government authorities to address the root causes.
Finding new ways to reduce our environmental footprintWe continue to raise awareness of environmental issues among our employees, and encourage them to implement local initiatives. Each year, we run a month-long campaign to encourage actions to reduce environment impacts. Also, energy audits are conducted at Petrofac-owned facilities to identify opportunities to reduce energy consumption and enhance energy efficiency.
Continuing improvements in energy efficiencyFor many years, energy efficiency has been an area of focus, as indicated by a large number of local initiatives. This is prominently featured in the Policy Vision of our Environmental Policy, which is intended to guide all of our activities.
As an oilfield services company that designs, develops and operates large-scale facilities, Petrofac’s business is directly linked to environmental considerations. This includes energy and climate change concerns and the risk of environmental incidents, as well as the environmental performance of our own operations.
We conduct comprehensive environmental risk assessments and reviews at all stages of our new projects. We also follow a systematic approach to environmental management, even in places where this is not required by local regulations. In addition, during the design phase, our value engineering process enables us to optimise resources and project footprints, and minimise environmental impacts.
In terms of our emissions performance, for all of our business lines, we aim to achieve a 2% year-on-year reduction in greenhouse gas (GHG) emission intensity over the baseline year of 2015, with a 20% reduction by 2030. These targets are supported by strategies and actions to optimise energy efficiency, implement technical solutions, and encourage employee-led initiatives. We annually participate in the Carbon Disclosure Project (CDP) that is now aligned to the Task Force on Climate-related Financial Disclosures (TCFD) recommendations to publicly disclose our performance and approach towards climate related issues. In 2018 we achieved a CDP rating of ‘C’, which is in line with the average for our direct competitors.
Our energy consumption data and GHG emissions are assured and verified by an independent third party (Ricardo UK), and our spill performance is closely monitored. In addition, we collect data on the waste that leaves our facilities, which is typically segregated, measured and reported by category. The recyclable waste is handed over to approved waste recyclers and the scheduled waste goes to authorised agencies for safe handling and disposal.
60 Annual report and accounts 2018 Petrofac

Adding value to our clients’ operationsOur teams often go beyond client requirements as they seek to optimise energy efficiency and save natural resources. In doing so, they consider the entire lifecycle of a project, and are often able to propose solutions that can have significant long-term environmental benefits.
Minimising fresh water consumption in MexicoThe Magallanes compression station is a mature asset, and its eight compressor engines have traditionally been cooled with fresh water – adding up to some 263 thousand litres a day.
To reduce consumption, the local operations team decided to introduce a closed-loop cooling system. After a successful pilot project, the solution was implemented across the entire station, and is set to save 95 million litres of fresh water annually.
Achieving significant power savings in Kuwait In an LPG plant, the propane chiller tends to be a big consumer of power. So, when designing a new facility in Kuwait, the engineering team proposed a new approach. Rather than having the variable frequency drives running the whole time, they are periodically isolated when the motor reaches its normal operating speed. This innovative approach will bring a significant reduction in power consumption – adding up to 753MWh per year.
In another Kuwaiti project, the engineering team found a way to eliminate 98 agitators from the asset’s design. As well as reducing the construction costs, this will save the client 2,200MWh of energy consumption each year, and avoid 34,400 tonnes of carbon dioxide emissions over the lifetime of the asset.
Reducing resource consumption through value engineeringValue engineering is a discipline followed by Petrofac to routinely reduce the use of commodities like steel and cement, and minimise the environmental footprint of a planned project – without compromising its quality. Multi-disciplinary teams come together to discuss and optimise project layouts and propose alternative approaches. In 2018, there were many examples of substantial resource savings.
These included:
• Kuwait – an optimised pipe rack layout avoided the use of 5,525 tonnes of structural steel (a 35% saving on the original design), and 5,290 cubic metres of reinforced concrete (a 29% saving).
• Russia – by modifying a clamp design, and replacing welds with fittings, the team saved 52.3 tonnes of steel.
• Saudi Arabia – by modifying the design for the facility’s blast-resistant concrete buildings, it was possible to avoid the use of 155 tonnes of steel and 3,500 cubic metres of concrete.
Reducing GHG emissions across our operationsSeveral initiatives enabled us to reduce GHG emissions across the Group. Examples include:
Rationalising helicopter transport in MalaysiaIn Malaysia, a plan was developed to relocate our helicopter base from Kota Bharu to Kerteh. As part of this, we have been able to increase the use of 12-seat aircraft, which has reduced the number of flights by around 25%.
Upgrading to LED lighting in ChennaiIn our Chennai offices we replaced all our existing 1020 light fittings with LED bulbs, which brings a significant energy reduction and improves our related GHG performance – in total, we expect to see a total annual reduction of 280 tonnes of carbon dioxide emissions.
Turning out the lights in MumbaiIn our Mumbai offices, we introduced a new energy efficiency programme, through which we turn out the lights for 30 minutes during every lunchtime. As a result, we are saving almost 17,000 units of electricity a year – equivalent to 14.3 tonnes of carbon dioxide emissions.
Reducing gas flaring in MexicoAt our El Golpe facility in Mexico, we upgraded the flare stack gas venting system with a new type of inlet gas system – and this has been successful in reducing gas flaring by around 1 million standard cubic feet per day.
THE RAINBOW IS BLACK Our Malaysia offshore operations commenced the “Black Rainbow 2018” oil spill exercise in order to review and test the inter-agency oil spill response performance.
Petrofac collaborated with Malaysia Petroleum Management (MPM), PETRONAS, and the Petroleum Industry Malaysia Mutual Aid Group (PIMMAG) in an exercise involving the deployment of specialist equipment like coastal booms and dispersant sprayers. Meanwhile, the on and offshore response teams mobilised 55 people across multiple sites. The exercise was a great way to test and enhance joint preparedness.
“Operational resilience comes from a culture of preparedness; it builds confidence and ensures if we ever need to respond to an emergency, we do so decisively with positive actions.”
Hanif Hashim Petrofac Malaysia General Manager
ENVIRONMENTAL SUCCESSES FOR 2018
Annual report and accounts 2018 Petrofac 61
Strateg
ic repo
rtG
overnance
Financial statem
ents

16
17
18
71
102
81
CORPORATE RESPONSIBILITY CONTINUED
Ethical is a Petrofac value. As a key stakeholder and a significant part of the supply chain in the industries and countries in which we operate, we recognise the responsibility and opportunity we have to enable and embody ethical behaviours. We take this commitment seriously and continue to invest in our people and processes to ensure that we live up to it.
Breaches of the Code of Conduct reported via Speak Up
81
PRIORITIES AND PERFORMANCE
2018 Priorities 2018 Performance 2019 Priorities
• Launch and roll-out a revised Code of Conduct
• The launch was delayed as we conducted a fuller than anticipated review of the Code
• Launch and roll-out of the revised Code of Conduct
• An enhanced and enlarged Group Compliance function, reporting to the Compliance and Ethics Committee, will continue to embed revised policies, standards and processes across the organisation and support our risk-based approach to due diligence of our third-party relationships
• We made several senior-level appointments to our compliance function and relocated the team to our Sharjah offices
• We will continue to invest in and enhance the Group compliance function
• The recently created Third Party Risk Committee will review high-risk relationships
• The Risk Committee commenced the review programme completing reviews of a number of high-risk relationships
• Further enhance the due diligence process and complete Risk Committee screening reviews of all high risk relationships
• An individual with seniority will be appointed as the single-point of responsibility for compliance at each one of our projects to oversee the embedding of the programme
• Project compliance monitoring introduced to 8 of our biggest projects
• Expand project compliance monitoring across all new projects
• Continue to respond to the SFO investigation
• We continued to respond to the SFO investigation
• Continue to respond to the SFO investigation
Our Code of Conduct (Code) sets out our expectations of everyone who works for and with Petrofac. Through our compliance programme, we aim to ensure all our employees and suppliers are aware of the Code and abide by its contents. We continue to increase the scope and reach of the compliance programme, and strengthen the governance that surrounds our approach to ethical business practices.
Investing in our compliance function2018 marked a year of considerable investment and change in the compliance function. In January we appointed a new Group General Counsel and, in December, he was joined by a new Chief Compliance Officer. Both are based in our Sharjah office from where they work closely with the management teams of each of our business units in addressing governance and ethical issues and challenges. We anticipate further additions to this team during 2019 as we continue to invest in this critical aspect of our business.
Refining our compliance processesThroughout 2018, working in conjunction with the Internal Audit team, we tested the effectiveness of our compliance processes. Where opportunities for improvement were identified, we acted on them.
For example, in some areas, we discovered that our due diligence processes were leading to delays in our procurement processes. To address this issue, we developed an integrated solution within our IT systems that significantly streamlines this process whilst further embedding our counterparty due diligence processes into our business systems.
Working with our business partnersMany of our business partners and stakeholders take a keen interest in our ethical credentials, and we work closely with them to share information and provide assurance.
Typically, we see such interest from our clients, finance providers, and export credit agencies. In 2018, we again responded to requests for engagement on ethical issues from across this spectrum.
Operating a confidential reporting hotlineIt is vital that everyone working with or for us has the opportunity to raise any concerns which they might have in a way which is non-retaliatory and, if they wish, confidential. We therefore operate a multi-platform “Speak Up” programme which is multi-lingual and administered by an independent third party.
RESPONSIBLE GOVERNANCE AND ETHICAL BUSINESS PRACTICESCOMMITMENT
62 Annual report and accounts 2018 Petrofac

Enhancing our certification processWhilst following the Code is a requirement of all employees, upholding the Code and looking out for any suspected breaches is a key accountability for all managers. We continue to refine our certification process, which requires managers to confirm annually that they understand and abide by the Code, have completed related training, and have the opportunity to raise any possible violations or conflicts of interest. In 2018, more than 3,000 managers were required to certify and, by the end of the exercise, almost all had done so.
All notifications are reviewed by our investigations team and then allocated to the appropriate department for review. Where necessary remedial action is taken. In 2018 81 notifications were made to the Speak Up system, representing a 21% decrease on 2017.
Meanwhile, we were encouraged to see an increase in the number of issues raised informally and on a non-confidential basis with our governance team. This suggests to us that our people have an increased awareness of the importance we place on these issues, and believe that their discussions will be dealt with in a non-retaliatory manner.
AN ABC CAMPAIGNTO EMPHASISEETHICALBEHAVIOURAs a matter of routine, all Petrofac employees are expected to read our Code of Conduct and complete a related e-learning course, whilst all line-managers are required to confirm that they have complied with its commitments.
In Malaysia, the governance team wanted to take things a step further. They were keen to emphasise that ethical behaviour is everyone’s everyday responsibility. As a result, they decided to put together an Anti-Bribery and Corruption (ABC) campaign to raise awareness of the subject, and encourage employees to think more deeply about its implications.
People from across the business were invited to volunteer as Governance and Compliance (G&C) Partners and act as ethical ambassadors. A full programme of activity was developed – including an educational video, posters, walkabouts, training, and online surveys.
Communicating more actively on our ethical agendaWorking with our business teams to ensure they understand and have the opportunity to engage with the development of our ethical agenda is important to our success. On this basis, senior members of the governance team regularly make presentations and conduct training sessions in a wide variety of settings. Examples include our annual leadership conference, employee town halls and input to the Petrofac Academy training programmes.
The importance of Ethics as a value is also demonstrated through our internal EVE Awards programme.
Soon, the campaign materials were being used in team meetings to stimulate meaningful discussions. The campaign also coincided with a new drilling campaign, through which team members would have additional dealings with outside suppliers and contractors as well as clients, where the highest standards of ethical behaviour would be required.
Engagement levels were very high, and the highly visible publicity materials sent a strong message to visitors as well as employees. Several external stakeholders also commented on the attitude and integrity of the Petrofac team. The campaign won the Ethical category in the Petrofac EVE Awards – an annual event which celebrates the Petrofac values.
Annual report and accounts 2018 Petrofac 63
Strateg
ic repo
rtG
overnance
Financial statem
ents

CHAIRMAN’S INTRODUCTION
During 2018, the Board discussed the new requirements set out in the 2018 UK Corporate Governance Code (new UK Code), which became effective for financial years beginning from 1 January 2019, and consideration has been given to what improvements can be put in place to enhance our governance and internal controls frameworks.
Governance compliance Following the establishment in 2017 of a new Board Committee to oversee our compliance and ethics procedures, we have continued to strengthen and embed our compliance procedures across the Group. The Board remains fully committed to ensuring that robust internal controls are in place throughout Petrofac to mitigate any threats that may be encountered. We believe that the right behaviours and culture can only enhance long-term performance.
Changes to the Board during 2018As we reported last year, Rijnhard van Tets stepped down in May 2018 after 11 years on the Board, most recently as Chairman. We also welcomed two new Directors during 2018. As set out in the Nominations Committee report on page 80, we believe that the appointments of Sara Akbar and David Davies ensure that the Board remains highly competent with the skills and experience to support Petrofac’s future plans.
Board evaluation In compliance with the UK Code, this year’s Board evaluation exercise was internally facilitated and full details of the process and outcome are set out on page 74.
Succession planning Succession planning remained a key priority for the Board throughout 2018. Significant progress has been made to ensure that changes can be managed effectively, core capabilities preserved, while new talent can be attracted, thus enabling us to implement our strategic agenda and position the business for longer term growth.
Stakeholder engagement We endeavour to actively capture the views of our stakeholders and, following my appointment, I met with several key investors to understand their views and discuss any governance concerns. This process was reinforced towards the end of the year with further investor meetings held by me and the Chairman of the Remuneration Committee.
The Board acknowledged the recommendations set out in the new UK Code, recognising the need to develop deeper levels of engagement with our workforce to better understand their views. Further details on our new Workforce Forum are set out on page 79 and a full report on our enhanced engagement activities will be provided in next year’s report.
Looking forward As we enter a new reporting framework under the new UK Code, the Board will remain committed to continuous improvement in governance. We will continue to monitor developments in best practice, giving specific focus to compliance, cyber-security, health and safety, and sustainability matters.
René Médori Chairman 27 February 2019
As a Board, a key priority is to continue to strive to do what is best for our Company, our employees, our clients, and our shareholders.
Dear shareholderI am pleased to present my first governance report as your Chairman. Since joining the Board in 2012, I have seen the Company develop considerably over the years. Great progress has been made in many areas, but the Board acknowledges that a continued rigorous approach to our governance policies remains critical to the long-term success and sustainability of the Company. As a Board, a key priority is to continue to strive to do what is best for our Company, our employees, our clients, and our shareholders.
The Board and I were deeply saddened by the death of three colleagues in two work-related incidents during the year. These tragic events reinforce the importance we place on safety across all our operations and as a result, increased focus was given to our safety improvement plans during the year.
Governance standards As you would expect, governance has remained high on the corporate agenda throughout the year. The Board is committed to maintaining the highest standards of corporate governance across the Group, as it believes this sets the tone as to how the Company operates and behaves, both internally and externally. The Board plays a critical role in defining our behaviours and the ways in which we do business, and our governance framework emphasises the importance of compliance with regulation and guidance. This governance framework also defines the relationships between the Board, senior management, employees and other stakeholders.
This governance report includes details of how governance underpins and supports our business and the decisions we make every day including our ability to deliver our strategy and create long-term value for our shareholders.
René Médori Non-executive Chairman
64 Annual report and accounts 2018 Petrofac

SHAREHOLDERS
BOARDProvides leadership and direction for the Group. Sets
overall strategy and oversees its implementation. Ensures appropriate systems and processes are in place to
monitor and manage Group risk. Responsible for financial performance and corporate governance.
Executive managementResponsible for day-to-day operational management, the communication and implementation of strategic decisions, administrative matters and matters for recommendation to the Board
and its committees. Underpinned by a number of management committees:
Elect the external auditor
Elect the Directors
Ongoing dialogue (see page 77)
Audit CommitteeChaired by David DaviesReviews and monitors the integrity of the Company’s financial statements, reporting processes, financial and regulatory compliance, the systems of internal control and risk management, and the external and internal audit processes.
Committee report on pages 82 to 87
Remuneration CommitteeChaired by Matthias BichselSets remuneration policy for Executive Directors and determines individual compensation levels for Executive Directors, the Chairman and members of senior management. Oversight of the remuneration framework for the Group.
Committee report on pages 90 to 101
Group Risk Committee
Nominations CommitteeChaired by René MédoriReviews the structure, size and composition of the Board and its committees. Takes primary responsibility for succession planning and Director succession. Identifies and nominates suitable candidates for Board appointments. Oversight of leadership pipeline.
Committee report on pages 80 to 81
Compliance and Ethics CommitteeChaired by George PiersonSupports the Board in fulfilling its oversight responsibilities in all respects of compliance and ethics. Provides assurance that the Company’s compliance and ethics policies are adequate.
Committee report on pages 88 to 89
Disclosure Committee
Executive Committee
Guarantee Committee
Third Party Risk Committee
Treasury Committee
Operational Committee
2018 Objectives and highlights
Objectives Achieved
Strategy execution – provided leadership and guidance to support the Company’s strategic priorities, with focus given to driving the delivery of our operational excellence programme
Compliance and risk management – continued to further enhance procedures throughout the organisation, to ensure the Company’s internal controls processes were fully embedded and clearly understood
Succession planning – a new organisational structure was put in place during the year to provide greater oversight. These changes were managed effectively to preserve core capabilities while attracting new talent, thereby implementing the strategic agenda while positioning the business for longer-term growth
Project delivery – this remained a significant area of focus to ensure the execution strategy could enable the Company to secure new awards, while reaching commercial settlements on outstanding projects, thereby reducing net debt
Stakeholder engagement – engagement with investors and other stakeholders followed the Chairman’s appointment, to identify any potential concerns. Further engagement with key stakeholders by the Chairman and the Remuneration Chairman was arranged to understand their views and explain current processes.
Priorities for 2019The Board’s areas of focus in 2019 are expected to include:
Objectives
Continued execution of the Company’s strategic aims and priorities
Consideration of how the Group’s values and culture are embedded
Continued focus on safety, with regular reviews of ongoing safety activities
Implementation of the digital agenda
Continued monitoring of financial and operational performance
Renewed focus on cyber-security
Overseeing the continued development of the internal control and compliance environment
Continued stakeholder engagement, including the implementation of the new Workforce Forum
Application of the new UK Code requirements and a continued review of the developments and changes to the corporate governance landscape
Consideration of the implications, if any, of the United Kingdom’s exit from the European Union (Brexit) on the Group’s activities
To ensure there is a clear division of responsibilities, while retaining control of key decisions, the Board has in place a Schedule of Matters Reserved that sets out items for its consideration and approval. The Board is assisted by four committees – Audit, Compliance and Ethics, Nominations and Remuneration. Matters which the Board considers suitable for delegation are contained in the terms of reference of these committees. Copies of all terms of reference are available on the Company’s website at www.petrofac.com.
The chairman of each committee provides a summary of its activities during scheduled Board meetings and, once approved, the minutes of all committee meetings are circulated to the full Board.
In addition to these Board committees, the Company has a number of executive management committees, which are involved in the day-to-day operational management of Petrofac and have been established to consider various matters for recommendation to the Board and its committees.
The framework is set out below:
CORPORATE STRUCTURE AND FRAMEWORK
Annual report and accounts 2018 Petrofac 65
Go
vernanceS
trategic rep
ort
Financial statem
ents

66 Annual report and accounts 2018 Petrofac
Ayman AsfariRené Médori
Matthias BischselAndrea Abt
George PiersonAlastair Cochran
Sara AkbarDavid Davies
Date of appointment
11 January 200219 January 2012
14 May 201619 May 201619 May 2016
20 October 201601 January 2018
18 May 2018
0 2 4 6 8 10 More than 10 yrs.
Executive Director
3. ALASTAIR COCHRANChief Financial Officer
–
Appointed to the Board October 2016
Key strengthsWide-ranging experience in finance, strategy, M&A, planning and business development. Extensive knowledge of global capital markets, energy and natural resources industries. Deep understanding of corporate finance and investor relations.
Experience Joined Petrofac in October 2016 from BG Group plc, where he had been Transition Head of BG Strategy & Business Development and, prior to that, Group Head of M&A and Corporate Finance. A member of the Institute of Chartered Accountants in England and Wales, he started his career with KPMG before enjoying a successful career in investment banking with Barclays de Zoete Wedd, Credit Suisse First Boston and Morgan Stanley.
External appointmentsNone.
Chairman
1. RENÉ MÉDORINon-executive Chairman
Appointed to the Board January 2012 (September 2017 as Senior Independent Director)May 2018 as Non-executive Chairman
Key strengthsExtensive and current international financial experience, with knowledge of balance sheet strengthening opportunities and financing arrangements. Well-established knowledge of governance and regulatory matters and a good understanding of operational and strategic management.
Experience Stepped down as Finance director of Anglo American plc at the end of April 2017 and retired from the company at the end of January 2018, after more than 12 years. From June 2000 to May 2005 was group finance director of The BOC Group plc. Until June 2012, was a non-executive director of SSE plc and until December 2017 was a non-executive director of De Beers and Anglo Platinum Limited. Was appointed as non-executive Chairman in May 2018.
External appointmentsNon-executive director of Cobham plc, Vinci SA and Newmont Mining Corporation.
Non-executive Director
4. MATTHIAS BICHSELSenior Independent Director
Appointed to the Board May 2015 (May 2018 as Senior Independent Director)
Key strengthsOver 35 years’ experience in the oil and gas industry. Extensive commercial and strategic capabilities. Deep understanding of operational and project management, as well as technology management.
Experience Stepped down from the executive committee of Royal Dutch Shell plc at the end of 2014. Held several roles over his 34-year career with Shell, including director of Petroleum Development Oman; MD of deepwater services in Houston; executive vice president global exploration and executive vice president technical, of Shell Upstream. Ran Shell’s Project and Technology business from 2009.
External appointmentsVice-chairman of Sulzer AG. Non-executive director of Canadian Utilities Limited and South Pole Group. Member of the advisory board of Chrysalix Energy Venture Capital.
Executive Director
2. AYMAN ASFARI1Group Chief Executive
Appointed to the Board January 2002
Key strengthsStrong operational leadership skills and international focus. Significant business development skills, extensive oil and gas industry knowledge, and a clear strategic vision. Entrepreneurial track record.
Experience Joined the Group in 1991 to establish Petrofac International, of which he was CEO. After growing the business, he led a corporate reorganisation in 2002 and became Group Chief Executive. In 2005, he led the successful initial public listing of the Company. He has more than 37 years’ experience in the oil and gas industry. Formerly worked as managing director of a major civil and mechanical construction business in Oman.
External appointmentsFounder and chairman of the Asfari Foundation. Member of the board of trustees of the American University of Beirut. Member of the board of trustees for the Carnegie Endowment for International Peace. Fellow of the Royal Academy of Engineering and member of the Chatham House Panel of Senior Advisers.1 Mr Asfari is a British citizen; he is Syrian born and has dual nationality.
3.
2.
1.
4.
DIRECTORS’ INFORMATION
Committee membership
Audit Committee
Compliance and
Ethics Committee
Nominations
Committee
Remuneration
Committee
Committee
Chairman
Board appointment and tenure
Length of tenure (years) as at 27 February 2019
Gender diversity (Women as a percentage of the total)
Board 25%Group 0%Senior management 5%Graduates 12%

Annual report and accounts 2018 Petrofac 67
Go
vernanceS
trategic rep
ort
Financial statem
ents
Oil and gas experienceEngineeringFinanceInternational experienceRegulatory and governanceLeadershipHSEOperational/strategic management
63%63%
50%100%
88%100%
63%100%
Non-executive Director
8. GEORGE PIERSONNon-executive Director
Appointed to the Board May 2016
Key strengthsA qualified lawyer and engineer. Extensive background in risk management, contracting, construction law, compliance and cost efficiency. Excellent understanding of operational and engineering management.
Experience Appointed as General Counsel and Secretary of Parsons Brinckerhoff in 2006, later becoming chief operating officer of its Americas’ operations. Appointed as President and Chief Executive Officer between 2010 and 2014. Previously non-executive director of WSP Global Inc, Terracon Consultants, Inc. and Railworks LLC. Joined The Kleinfelder Group Inc. in August 2016.
External appointmentsChief Executive Officer of The Kleinfelder Group Inc. and Board director of Lane Power and Energy Solutions, Inc.
Non-executive Director
6. SARA AKBARNon-executive Director
Appointed to the Board January 2018
Key strengthsOver 35 years’ experience in the oil and gas industry with a unique insight into the Middle Eastern environment. Wide-ranging international experience and significant operational and project management capabilities.
Experience Until end 2017, was Chief Executive Officer of Kuwait Energy KSC, which she founded in 2005 to exploit the opportunity for an independent Engineering and Production company in the MENA and Eurasia regions. Was previously New Business Development Manager and Head of Planning for Kuwait Foreign Petroleum Exploration Company and served in various positions in the oil and gas industry in Kuwait and internationally from 1981 to 1999. Holds a BSc in Chemical Engineering.
External appointmentsChairman and CEO of Oil Serve, an oilfield services company operating in the MENA region and Chairperson of the Advisory Board to the American University of Kuwait. Member of the Kuwait Supreme Council for Planning and Development and an active member of the Board of Trustees of Kuwait’s Silk Territory project.
Non-executive Director
7. DAVID DAVIESNon-executive Director
Appointed to the Board May 2018
Key strengthsExtensive and current international financial experience. Chartered Accountant with a BA(Hons) in Economics from the University of Liverpool and an MBA from the Cass Business School. Extensive capital and debt raising experience, as well as managing companies exposed to substantial and rapid change. Served on the boards of listed companies in seven different countries.
Experience Over 35 years’ experience as a financial professional with a successful career as chief financial officer and deputy chairman of the executive board at OMV Aktiengesellschaft, as well as serving as group finance director for both Morgan Crucible Company plc and London International Group plc.
External appointmentsSenior Advisory Board member at First Alpha Energy Capital LLP and a non-executive director of Wienerberger AG, Ophir Energy Plc and Uniper SE.
Non-executive Director
5. ANDREA ABTNon-executive Director
Appointed to the Board May 2016
Key strengthsExtensive background in a variety of functional roles, including sales, finance, procurement and logistics. Specialist knowledge of the European market.
Experience Joined Siemens in 1997 and held various leadership roles, including Head of Supply Chain Management and Chief Procurement Officer for Infrastructure & Cities from 2011 to 2014. She started her career in industry at Dornier Luftfahrt, then a company of the Daimler-Benz Group, where her last role was director, Aircraft Sales Australia/Pacific. She was a non-executive director of Brammer plc until February 2017.
External appointmentsNon-executive director of SIG plc and John Lang Group plc. Member of the supervisory board of Gerresheimer AG.
5.
6.
7.
8.
Board skill set 2018
Female 25% Male 75%
Board gender diversity (%)
Chairman 1 Executive 2 Non-executive 5
Executive/Non-executive

CORPORATE GOVERNANCE REPORT
Corporate Governance complianceThe UK Corporate Governance CodePetrofac Limited is subject to the principles and provisions of the UK Corporate Governance Code 2016 (UK Code). The UK Code underpins the corporate governance framework for premium listed companies and sets out a number of principles of good governance, with compliance with the UK Code resting with the Board. A copy of the UK Code is available at www.frc.org.uk. As a UK listed company, Petrofac is required to explain how the Company has complied with the Code and applied the principles and provisions set out therein. For the year ended 31 December 2018, the Board considers that the Company complied in all material aspects with the principles of the UK Code and this Governance Report details how the main principles of the Code have been applied.
Leadership – the Board sets the tone of the Company with regards to the corporate governance framework and the application of corporate values and behaviours. There is a clear definition of Board responsibilities, with Directors collectively responsible for the development of strategy and the long-term success of the Company.
Effectiveness – the Directors demonstrate the appropriate balance of skills, experience, independence and knowledge and are able to commit sufficient time to undertake their duties and responsibilities effectively. An induction programme is established for all new Directors. The Board carries out its duties with regular meetings focusing on the oversight of strategy, risk and succession planning. It also carries out an annual review into the effectiveness of the Board.
Accountability – the Board maintains sound risk management and internal control systems to ensure the Company’s strategic objectives can be achieved. The Board has well-established committees to assist it in the undertaking of its duties. The Board endeavours to present a fair, balanced and understandable assessment of the Company’s position and prospects on an annual basis.
Remuneration – the Remuneration Committee ensures that there is a formal and transparent process for determining and reporting on Executive Director remuneration. Performance measures are linked to our strategic priorities, with alignment between Director and shareholder interests. Performance-related elements of pay are stretching and rigorously applied. The remuneration policy was approved by shareholders at the May 2017 AGM.
Relations with shareholders – the Board maintains an open dialogue with shareholders. Board members attend investor events throughout the year and encourage participation at the AGM.
LEADERSHIPBoard organisationWe believe the governance framework, as set out on page 65 underpins good governance practices and enables the Board to provide effective stewardship of the Company. The Board is responsible for the Company’s overall conduct, for setting its strategic aims, and for providing leadership and guidance to enable management to achieve the Company’s long-term objectives. The Board sets the ‘tone from the top’ and seeks to ensure there is a strong and effective system of corporate governance throughout the Group. In determining the Group’s strategy, the Board is conscious of its responsibilities not just to shareholders but also to clients, employees and other key stakeholders and seeks to ensure that the necessary corporate and management structures are in place for our strategy to be implemented effectively.
The UK Companies Act 2006 sets out a number of general duties to which all directors are expected to adhere. As a Jersey incorporated company, Petrofac is not required to comply with this legislation. Nevertheless, our Directors are informed by UK practice and, in any event, act in good faith to promote the long-term success of the Company for the benefit of our shareholders and other stakeholders.
The Board has been structured to ensure that no single individual can dominate decision-making processes and we believe all Directors are able to work together in an atmosphere of openness, trust and mutual respect. As a unitary Board, our Directors share equal responsibility for all decisions taken, with Directors collectively responsible for the strategic direction of the Company. It is felt that having an effective working relationship between our Executive and Non-executive Directors provides a robust governance framework that is essential for the progression towards the Company’s strategic aims.
Board rolesOur Chairman is primarily responsible for the leadership and effectiveness of the Board, whilst maintaining a clear structure that permits the Board to both challenge and support management. He is accountable for promoting effective board relationships and the participation of all board members, thereby encouraging a culture of openness and debate, enabling the Board to fulfil all aspects of its role.
It is essential that all Directors see the Chairman as fair and impartial.
The Group Chief Executive is responsible for leadership and day-to-day management of the Group and for the design and execution of Company strategy. He is supported by his senior leadership team, whose details are outlined on pages 12 and 13. Together they are responsible for developing and implementing the Company’s strategic aims, driving execution, growing markets and client-base, and developing our people. Regular meetings between the Chairman and Group Chief Executive are held both before and after scheduled Board meetings, allowing general matters to be discussed and enabling them to reach a mutual understanding of each other’s views.
The Senior Independent Director (SID) is available to shareholders to answer any questions or concerns that cannot be addressed by either the Chairman or the Group Chief Executive. He is also available to gather the opinions and views of the Non-executive Directors and provides additional support to, and acts as a sounding board for, the Chairman on board-related matters. The Chairman and SID maintain regular contact between scheduled Board meetings and time is also set aside at each meeting for the Chairman to meet with the Non-executive Directors without the presence of management.
The relationships between these three roles are of particular importance, as these individuals represent the views of management and Directors, respectively.
The combination of these meetings also ensures that the Chairman is equally informed about the views of Executive Directors, representing management, and Non-executive Directors. This assists in the setting of meeting agendas and ensures all Directors contribute effectively through their individual and collective experiences. Each of our Directors has a varied career history and considerable effort has been taken to ensure that the Board has the right balance of skills, diversity and industry expertise. Our Non-executive Directors are encouraged to share their skills and experience, and each is well positioned to support management, whilst providing constructive challenge. A table setting out the Board’s skill set is on page 67.
68 Annual report and accounts 2018 Petrofac

At the date of this report, the Board has eight Directors comprising the Chairman, five Non-executive Directors and two Executive Directors. Full biographies of each of our Directors in office at the date of this report are shown on pages 66 and 67. Details of those Directors standing for re-election are also included in the 2019 Notice of Annual General Meeting (AGM).
Their key areas of responsibility are as follows:
• Manages the Group’s finances and is responsible for financial planning, and presenting and reporting accurate and timely historical financial information, both internally and externally
• Ensures an effective financial control environment, fully compliant with regulations
• Develops and implements the Group’s finance strategy and funding
• Manages the Group’s financial risks and for mitigating key elements of the Company’s risk profile
• Responsible for the delivery of IT and Communications strategies
• Maintains relationships with key external stakeholders, including shareholders, lenders and credit rating agencies
• Leads the Board and ensures effective communication flows between Directors
• Promotes an open forum to facilitate effective contribution, challenge and debate for all Directors
• Builds a well-balanced Board, with consideration given to succession planning and the Board’s composition
• Responsible for ensuring effective Board governance and oversees the Board evaluation process
• Ensures effective communication with stakeholders, which allows interests to be represented at Board meetings
• Implements agreed strategy and objectives
• Develops attainable goals and priorities
• Provides leadership to the Group and day-to-day management of the Company
• Develops proposals to present to the Board on all areas reserved for its judgement and ensures the Board is fully informed of all key matters
• Develops Group policies for approval by the Board and ensures implementation
• Maintains relationships with key external stakeholders, including investors, clients and government agencies
• Acts as Secretary to the Board and its committees
• Advises the Board on all governance, legislation and regulatory requirements
• Puts in place processes designed to ensure compliance with Board procedures
• Facilitates the Board evaluation, induction and development processes
• Available to individual Directors in respect of Board procedures and provides general support and advice
• Support executive management, whilst providing constructive challenge and rigour
• Monitor the delivery of strategy within the risk management framework as set by the Board
• Bring sound judgement and objectivity to the Board’s decision-making process
• Review the integrity of financial information, controls and risk management processes
• Share skills, experience and knowledge from other industries and environments
• Have prime roles in the Board composition and succession planning processes
• Acts as a sounding board and confidant to the Chairman
• Available to shareholders to answer questions that cannot be addressed by the Chairman or Group Chief Executive
• Meets with other Directors to appraise the Chairman’s performance annually, and on such other occasions as deemed appropriate
• Acts as an intermediary for other independent Directors
BOARD COMPOSITION
CHAIRMAN GROUP CHIEF EXECUTIVE CHIEF FINANCIAL OFFICER
SENIOR INDEPENDENT DIRECTOR NON-EXECUTIVE DIRECTORS SECRETARY TO THE BOARD
Annual report and accounts 2018 Petrofac 69
Go
vernanceS
trategic rep
ort
Financial statem
ents

CORPORATE GOVERNANCE REPORT CONTINUED
BOARD ACTIVITIES DURING 2018
Strategy
29%
• Held formal strategy review days with management, discussing the strategic plan and considering potential strategic initiatives
• Received progress updates on potential business prospects and opportunities at each meeting• Received presentations on new strategic opportunities, including digital transformation initiatives• Received detailed operational updates from each division
Financial matters
26%
• Considered at length the Group’s financial performance, taking into consideration key contract progress and external trading challenges
• Approved the Group’s full and half-year financial statements and considered the Company’s pre-close trading updates
• Kept the Company’s financial reporting obligations under review, including consideration of impairment reviews, going concern and the viability statement
• Approved the budget, three-year business plan and funding plan. Reviewed regular reports on performance against budget, forecast and market expectations
• Reviewed reports on the financial position and prospects of the Group, including treasury management
• Reviewed and approved the refinancing of the Company’s credit facilities, tax policy and tax governance standard
Risk management and internal controls
19%
• Reviewed the Group’s Enterprise Risk Management improvement programme• Reviewed and approved the Company’s revised principal risks and formally articulated
the Company’s risk appetite statements• Reviewed and revised the Board’s Delegated Authority Framework• Regularly reviewed significant enterprise risks, such as those associated with HSSEIA,
Compliance and IT, including cyber-security• Regularly reviewed legal update reports on matters impacting the Group• Consideration of crisis management arrangements
Governance
19%
• Regularly reviewed reports from brokers and received an in-depth presentation from house brokers• Discussed feedback from shareholder meetings held with the CEO, CFO, Chairman and
Remuneration Committee Chairman• Reviewed reports on regulatory and governance matters impacting the Group and the wider
operating environment• Approved the Group’s updated Modern Slavery Act Statement for publication, reaffirming the
Board’s commitment to compliance with the Act throughout the business and our supply chain• Reviewed and acknowledged the changes being introduced by the new UK Code
Leadership & people development 4%
• Approved Non-executive Director appointments, plus role and committee changes, which had been endorsed by the Nominations Committee
• Considered the Board evaluation findings, recommendations and actions to be put in place• Amended the Non-executive Director fee structure and introduced a compulsory fee
withholding arrangement for the quarterly purchase of Petrofac Limited shares• Approved the terms of reference for a Workforce Engagement Forum
Project approvals
3%
• In accordance with our delegated authority framework, several contracts and other matters requiring Board approval were considered during the year. Many of these projects remain at an early/bidding stage and further details will be provided as and when awarded
• Projects that were approved by the Board during the year and which have been awarded include the Thai Oil operations project, three Indian projects awarded at the start of 2018 and an offshore wind contract for TenneT in the Dutch North Sea
• Approval of the disposal of the JSD6000 installation vessel• Considered and approved the IES disposal programme, including the sale of 49% of
the Company’s Mexican operations, the sale of the Company’s interest in the Chergui gas concession in Tunisia, and the sale of the Company’s interest in the Greater Stella Area development
70 Annual report and accounts 2018 Petrofac

Governance matters, including audit tender process 11%
Tax update 7%
Financial reporting 27%
Risk management and internal control systems 35%
External audit, including non-audit services review 15%
Compliance 7%
How the Audit Committee spent its time during the year (%)
Governance/Other 14%
Organisational change/people development 29%
Succession planning 31%
Board composition 26%
How the Nominations Committee spent its time during the year (%)
Review of external environment 3%
Review of share plans and performance conditions 23%
Governance/Other 22%
2018 remuneration arrangements,including grant of awards 47%
Investor Consultation 5%
How the Remuneration Committee spent its time during the year (%)
Governance/Other 10%
Risk management 10%
Compliance strategy 41%
Code of Conduct/Whistleblowing 24%
Functional review 11%
Third Party Risk Committee 4%
How the Compliane & ethicsCommittee spent its time during the year (%)
Board and committee attendance
Director Role
Board appointment
dateBoard
(physical)5
Board (ad hoc/
telephonic) 6Audit
Committee Nominations
CommitteeRemuneration
Committee
Compliance and Ethics Committee
René Médori Chairman January 2012 6/6 3/3 4/4 5/5 – –Andrea Abt Non-executive Director May 2016 6/6 2/3 – 5/5 4/4 5/5Matthias Bichsel Senior Independent Director May 2015 6/6 3/3 4/4 5/5 4/4 5/5Sara Akbar1 Non-executive Director January 2018 5/6 2/3 – 3/4 3/4 –David Davies2 Non-executive Director May 2018 3/4 2/2 2/2 2/3 – –George Pierson Non-executive Director May 2016 6/6 3/3 4/4 5/5 – 5/5Ayman Asfari3 Group Chief Executive January 2002 6/6 3/3 – 3/3 – –Alastair Cochran Chief Financial Officer October 2016 6/6 3/3 – – – –
Former Directors
Rijnhard van Tets4 Chairman May 2007 3/3 1/1 – 3/3 – –
1 Sara Akbar was absent from one scheduled Board, Nominations and Remuneration Committee meeting due to a family bereavement
2 David Davies joined the Board on 18 May 2018. He was absent from one Board meeting and one Nominations Committee meeting as a result of a pre-existing commitment
3 Ayman Asfari was reappointed to the Nominations Committee from 1 March 2018
4 Rijnhard van Tets stepped down from the Board on 18 May 20185 Time is scheduled at every Board meeting for the Chairman to meet with the
Non-executive Directors without the Executive Directors or management present6 Ad hoc meetings are usually held on short notice to discuss matters which cannot
be held over until the next scheduled meeting
COMMITTEE ACTIVITIES DURING 2018
Audit Committee (%)
Remuneration Committee (%)
Nominations Committee (%)
Compliance and Ethics Committee (%)
2018 BOARD CALENDAR
The Board has a full programme of Board meetings and, in addition to the scheduled face-to-face meetings that are arranged each year, telephonic meetings to review any items of business that need to be addressed before the next physical meeting, as well as trading updates, are also included in the corporate calendar. Dedicated strategy days and site visits also form part of our annual programme of events. During 2018, in addition to the six physical meetings, three telephonic meetings were held.
For meetings held outside Jersey, we arrange, where feasible, for the Board to be given the opportunity to meet with employees, clients, suppliers and partners, as it is felt this allows the Board to gain a wider understanding of Petrofac and its operations. Details of the 2018 site visit are set out on page 72.
Board meetingsAs a company incorporated in Jersey under the Companies (Jersey) Law 1991, we endeavour to hold at least half of our physical Board meetings there each year. Scheduled meetings are generally held over two days, where active debate is encouraged before any Board decisions are taken.
Telephonic meetingsDirectors may join meetings as guests if they are in the UK. On such occasions, they are not included in the quorum of the meeting and do not participate in the formal business.
Group Chief Executive’s review See page 10
Group financial statements See page 103
Annual report and accounts 2018 Petrofac 71
Go
vernanceS
trategic rep
ort
Financial statem
ents

CORPORATE GOVERNANCE REPORT CONTINUED
Meeting attendance In addition to the full programme of Board meetings detailed on page 71, Directors are encouraged to be open and forthright in their approach. We believe this boardroom culture helps to forge strong working relationships, whilst enabling Directors to engage fully with the Company, and allowing them to make their best possible contribution. All Directors are invited to attend Audit Committee meetings and the Chairman of the Board and Group Chief Executive are invited to attend Remuneration Committee meetings, where appropriate.
To enhance their knowledge of the business further, and as part of the process of maintaining an awareness of the Company’s strategic activities and assessing the ability of the management team, members of operational and functional management, one and two tiers below director level, are invited to present at Board and committee meetings. It is felt these presentations enable Directors to deepen their understanding of Petrofac at both a local and functional level, while gaining an awareness of specific nuances that may not always be obvious within written reports.
It also affords senior managers the opportunity to bring matters to the attention of the Board and allows the Board to consider key individuals identified through the succession planning process. Management is also given the opportunity to meet the Directors informally during the year as the Board believes these meetings to be valuable for personal development.
Dealing with potential conflicts of interestThe Company’s Articles of Association permit the Board to authorise conflicts which can be limited in scope. During 2018, all conflict management procedures were adhered to, managed and reported effectively.
In the event that any potential conflict arises during a term of appointment, processes and procedures have been put in place for Directors to identify and declare any actual or potential conflict of interest, whether matter-specific or situational. Notifications are required to be made by the Director concerned prior to or at a Board meeting. All Directors have a duty to update the whole Board of any changes in personal circumstances.
EFFECTIVENESSBoard appointments and selectionThe Company has a formal, rigorous and transparent selection procedure for the appointment of new Directors. The Nominations Committee carefully considers Board composition throughout the year to ensure it maintains the right balance and mix of directors, taking into account experience, skills and diversity. Care is taken to understand existing external commitments of all Non-executive Directors, who, on appointment, are each made aware of the need to allocate sufficient time to the Company to discharge their responsibilities effectively. Any changes to a Director’s external commitments following appointment must be notified to the Board immediately in order that any potential conflict of interest, time commitment challenge or residency status issues can be considered. A detailed report on the activities of the Nominations Committee is provided on pages 80 and 81.
In January 2018, the Board and several members of senior management visited the BorWin3 topside platform, which was under construction at the Dubai Drydocks World in UAE.
During the visit, they met with engineering teams and graduates. They also received a presentation from the Project Director, who outlined the project progress and discussed the considerations and risk controls being put in place for project completion, including the sailaway process from UAE to the German North Sea (details of this project are set out on page 8).
The Directors were given a tour of the different areas of the platform and the main hubs of activity and were struck by the sheer scale of the structure and the level of activity taking place on site.
We believe that site visits are an invaluable way of helping members of the Board to put the projects they hear about in the boardroom into perspective.
They give our Directors the opportunity to gain a deeper understanding of project operations and allow them to experience first-hand some of the challenges and extreme working conditions being faced day-to-day by our employees and contractors, in what can sometimes be difficult and remote locations.
It is for these reasons that such visits are included in the Board’s annual corporate calendar and why they are often considered to be one of the highlights of the year.
BOARD SITE VISIT
72 Annual report and accounts 2018 Petrofac

Re-appointment of DirectorsIn accordance with the UK Code, all Directors, other than those who are stepping down immediately after the AGM, offer themselves for reappointment by shareholders at each AGM. Both our Executive Directors have rolling service contracts, containing a notice period provision of 12 months by either party. Our Non-executive Directors have letters of appointment that contain a termination provision of three months’ notice by either party. The terms and conditions of appointment of all Directors are available for inspection by anyone at our registered office in Jersey and at our corporate services office in London. Details of these provisions are also set out in the service contracts and letters of appointment, as detailed in the remuneration policy, which can be found at www.petrofac.com/remuneration.
Director inductionUpon appointment to the Board, the Chairman ensures that all new Directors undertake a comprehensive induction programme. This programme, developed by the Secretary to the Board, is intended to provide a broad introduction to the Group and allows the Company to account for individuals’ differing requirements and to concentrate on key focus areas. This ensures each Director is fully prepared for their new role, taking their background and experience into consideration. All new appointees spend time with each of the
Executive Directors as well as senior members of operational and functional management, both individually and collectively. A comprehensive induction pack, which contains a wide range of materials, is also provided to each new Director prior to them joining the Board.
All Directors visit the Group’s main operating office as part of their induction and they are encouraged to make at least one site visit each year throughout their tenure. Site visits are regarded as an important part of continuing education as well as an essential part of the induction process, as they help Directors understand the Group’s activities through direct experience of seeing operations in action and by having discussions with a range of employees.
Details of the 2018 site visit are set out on page 72. For new Non-executive Directors for whom the appointment is their first to a UK-listed company, the induction programme also includes a compulsory presentation led by our external legal advisers on the duties, responsibilities and obligations of being a UK-listed company director. In addition, depending on which committees they will join, presentations are provided by the Group’s auditors and remuneration consultants.
During 2018, tailored induction programmes were designed for our two newly appointed Non-executive Directors. These programmes were designed to reflect their background, experience, knowledge and committee
appointments. The induction programmes covered the Company’s history, culture, strategy, structure and operations as well as the corporate governance framework and policies, the Board and committee’s process, Code of Conduct and Directors’ duties. Details of their individual programmes are set out below.
Board information and supportAs part of our commitment to best practice, and as recommended by the UK Code, we endeavour to provide information to the Board in a timely manner and in a form and quality appropriate to enable it to discharge its duties effectively. Papers are provided electronically through a dedicated secure application, giving Directors instant access to them, as well as additional reference documentation about the Group.
A tailored approach to developing agendas is adopted for each meeting, with each agenda comprising non-recurring items, such as strategic matters or project specific and investment related opportunities. Operational and financial matters are reviewed and discussed at each meeting. We believe the flexibility of this approach allows Directors to engage effectively and encourages scrutiny and constructive debate, with Non-executive Directors able to seek clarification from management where required. Any actions arising from meetings are overseen by the Company Secretariat and updated action lists inform the agenda for the next scheduled meeting.
Name, position and date of joining the Board Strengths Focus areas Induction programme
Sara AkbarNon-executiveDirector25 January 2018
• Over 35 years’ experience in the oil and gas industry
• Distinct insight into the Middle Eastern environment
• Strong experience of operational and project management
• Increase knowledge of Petrofac
• Meet with senior management teams
• Understand UK governance framework, including Board committee activities and obligations
• Met and received detailed presentations from Group functional heads
• Met and received detailed presentations from operational heads
• Meetings with key advisers, including corporate lawyers, brokers and remuneration consultants
• Site visit to BorWin3 topside platform with the Board
David DaviesNon-executiveDirector18 May 2018
• Broad commercial experience from previous executive and non-executive roles, with significant experience as a director of UK-listed companies
• More than 35 years’ experience as a financial professional
• Deep understanding of the broader industrial sector
• Increase knowledge of Petrofac
• Meet with senior management teams
• Met and received detailed presentations from Group functional heads
• Met and received detailed presentations from operational heads
• Meetings with key advisors, including corporate lawyers, brokers and auditors
• Site visit to Oman to be arranged during 2019
Annual report and accounts 2018 Petrofac 73
Go
vernanceS
trategic rep
ort
Financial statem
ents

CORPORATE GOVERNANCE REPORT CONTINUED
Deeds of indemnityIn accordance with our Articles of Association, and to the maximum extent permitted by Jersey Law, all Directors and Officers of Petrofac Limited are provided with deeds of indemnity in respect of liabilities that may be incurred as a result of their office. In addition, Petrofac has appropriate insurance coverage in respect of legal action that may be brought against its Directors and Officers. Neither the Company’s indemnities nor insurance would provide any cover where a Director or Officer was found to have acted fraudulently or dishonestly.
Director development and trainingThe Board believes in the ongoing education and development of its Directors and is committed to providing continuing personal training opportunities, tailored to each individual. The Company does not run a ‘one-size-fits-all’ training programme but provides Directors with the necessary resources to refresh, update and enhance their skills, knowledge and capabilities, and receive relevant training when necessary. Board members are also encouraged to attend seminars, conferences and training events to keep up-to-date on developments in key areas. In addition to regular updates on legal and regulatory matters, the Board receives briefings from advisors on a variety of topics that are relevant to the Group and its strategy.
During 2018, training was received through a mixture of formal and informal seminars. Directors were also briefed by the Secretary to the Board on the updated requirements of the new UK Code and other key governance matters. All Directors are required to complete the Company’s e-learning training modules, which include the Code of Conduct, Share Dealing Code, Anti-Bribery and Corruption Standard, and Health and Safety Training. Training records for all Directors are maintained by the Company Secretariat and are reviewed during the annual Board evaluation process. Over the course of 2018, more than 200 hours of training were recorded.
Board evaluation The benefits of annual performance evaluations are clearly understood. The Board believes such evaluations can provide a valuable opportunity for recognised strengths to be highlighted and for weaknesses to be identified, thereby improving overall Board effectiveness. The evaluation process is also seen as an important means of monitoring progress against areas previously identified for improvement, recognising any specific training requirements, and identifying areas of expertise or diversity that should be considered in succession plans.
In accordance with the UK Code, the Board undertakes a formal review of its performance each year, ensuring it is externally facilitated at least once every three years and conducted internally in the intervening years by the Chairman and the Secretary to the Board. During 2018, the internal evaluation review was completed using a confidential online self-assessment tool, using the Thinking Board® platform created by Independent Audit, an advisory firm who work with many FTSE companies in numerous areas of governance, including board evaluation. The detailed self-assessment questionnaire focused on matters such as performance, strategy, dynamics, and risk management and aimed to address issues raised in previous evaluations, as well as consider how the Board currently interacts both with other Directors and with management.
The responses were collated and provided on an anonymous basis to the Chairman. This enabled him to discuss the questionnaire outputs with Directors and to assess performance and contribution, identifying development areas for individuals and the Board as a whole. In consultation with the Secretary to the Board, a detailed report was prepared and presented at the February 2019 Board meeting. The process provided the Board with the opportunity to reflect on how it operates and where improvements can be made. Given the Board changes that have taken place during the year, the overall outcome of the evaluation process was positive.
As a result of this year’s evaluation, the Directors remain content that the Board structure, balance of skills, and operation continue to be satisfactory and appropriate for the Group. It was also pleasing to note that the evaluation concluded that the Board continues to function well, with each Director able to allocate sufficient time to discharge his or her responsibilities effectively. While recognising where improvements have been made from prior years, the evaluation identified areas of focus for 2019 and some of the Board’s priorities for the year are set out opposite, with an overview of the progress made against prior actions.
It was suggested that in accordance with best practice, consideration be given to undertaking reviews on the effectiveness of Board committees during the year, ahead of the external evaluation which will be carried out at the end of 2019.
Dr Bichsel, as Senior Independent Director, solicited the views of other Directors on the Chairman’s performance, before carrying out his formal evaluation. The outcome of the evaluation was reported back to the Chairman and it was confirmed to the Board that René’s leadership was effective.
In addition to considering the results of this year’s evaluation, the Directors reviewed progress against the targets previously identified where the Board might improve and these are set out in the charts opposite.
74 Annual report and accounts 2018 Petrofac

2017Internal Board evaluation conducted by Chairman
The Company’s annual evaluation process enables the Chairman to assess individuals’ performance and contribution and identify development areas for individuals and the Board as a whole.
The Board evaluation process was internally led in 2018, ahead of the three-yearly external evaluation which is scheduled to take place towards the end of 2019.
PERFORMANCE EVALUATION PROCESS
2018Internal Board evaluation conducted by Chairman
Areas of focus monitored throughout the year by Chairman and Secretary to the Board
2019Externally facilitated Board evaluation process
Step 1 – PlanThe Chairman and Secretary to the Board considered the approach to be taken
Step 2 – Questionnaire issuedA confidential comprehensive questionnaire was developed and issued to each Director
Step 3 – Compilation of responses The Secretary to the Board analysed Director responses and feedback. A report was provided to the Chairman for consideration, which was subsequently shared with the Board
Step 4 – Actions agreed Following discussions, objectives for the next 12 months were set taking into consideration areas identified for further improvement
Areas of focus highlighted and improvement areas identified
2018 Evaluation – Areas of focus identified Actions to be taken
Strategy – understanding the strategic opportunities and risks arising from emerging technology, and ensuring the Company is able to assess our strength and resilience while focusing on our clients’ changing needs and expectations
Consideration to be given to understanding how market shifts could impact the Company’s strategy and ensuring the Company has the right skills and characteristics in place to underpin the future strategic direction
Succession planning – determine the capabilities and competencies required both on the Board and within the senior management team
Continued focus on talent management processes to ensure clear management succession and development plans are in place. Ongoing focus on diversity and ensuring the Board maintains the right mix of specialisms and experience
Compliance and risk management – understand the risks on major initiatives and projects and consider the interconnectivity of such risks and the impact on the Company
Devote additional time to risk management, including non-operational risk to ensure there remains a line of sight into risks and mitigation actions. Continued focus given to cyber-security risks and any necessary improvements. Roll out the updated Code of Conduct and support the communication of the compliance policies, to ensure greater alignment of the compliance agenda across the Group
Culture and values – understanding how values and culture are embedded across the Group
Ensure the Company’s values, and the behaviours associated with them, are clearly understood, consistently applied and in line with expectations. Find ways in and outside the boardroom to benefit from Non-executive Directors’ experience
2017 Evaluation – Improvement areas identified Actions taken
Strategy – allocate sufficient time for medium and longer-term strategic discussions. Give consideration to the digital agenda and the technological developments being seen across the sector
Deep dives into key areas planned to help define and determine a more focused strategic agenda. A roadmap developed in terms of business direction and geographical concentration, with a continued increase in focus on innovation and digital transformation and preparedness
Succession planning – establish clear plans for the Board and senior management team, ensuring diversity in its widest sense is taken into consideration
Three in-depth talent reviews held to consider the capabilities and competencies required both on the Board and within the senior management team. Progression of emerging talent also reviewed to check processes and monitor future potential leaders
Compliance and risk management – develop risk management processes further and strengthen the compliance framework to ensure it is followed consistently across the business
A formal review of the Key Risk Register and consideration of the Company’s risks appetite was undertaken during the year. The risks and challenges that may affect the business were included on meeting agendas. The further embedding of the compliance agenda took place across the Group
Financial planning – maintain a firm focus on cash generation, working capital management and reducing capital intensity
Focus given to financial planning, such that significant improvements were seen in the Company’s working capital management. Capital and asset intensity reduced in accordance with the Company’s published strategy
Annual report and accounts 2018 Petrofac 75
Go
vernanceS
trategic rep
ort
Financial statem
ents

CORPORATE GOVERNANCE REPORT CONTINUED
ACCOUNTABILITY The Audit CommitteeThe Audit Committee’s report which details the responsibilities and main activities undertaken during 2018 is set out on pages 82 to 87.
Risk management and system of internal controlIn accordance with FRC guidance, the Board is responsible for monitoring and reviewing the effectiveness of Petrofac’s risk management and systems of internal control. Regular management reports are received throughout the year that outline the Group’s material enterprise risks, with additional reports being submitted by internal and external auditors and Group Compliance to assist the Audit Committee, and ultimately the Board, in their annual assessment of the effectiveness of the Group’s risk management and system of internal control. The Board has also established an organisational structure with clear operating procedures and defined delegated authorities.
Petrofac also seeks to ensure that a sound system of internal controls, based on the Group’s policies and guidelines, is in place in all material associate and joint arrangement entities. As with all companies, our systems of internal control and risk management are designed to identify, mitigate and manage rather than eliminate business risk and can only ever provide reasonable, and not absolute, assurance against material financial misstatement or fraud.
Fair, balanced and understandableTo facilitate the year-end process, the Audit Committee has the responsibility of assessing a detailed review of risk management and internal control processes. This provides formal assurance to the Board on the robustness, integrity and effectiveness of these systems and controls in relation to the Group’s principal risks, including those which may threaten the Group’s strategy, business model, future performance, solvency and liquidity.
The reviewed processes enable the Board to consider the adequacy of the systems in place.
The Board is satisfied that sound risk management and systems of internal controls have been in place across the Group throughout 2018 and at the date when the 2018 financial statements were approved.
This review also enables the Board to assess whether the Annual Report and Accounts is fair. balanced and understandable, as required by the UK Code and to consider whether it provides shareholders with the necessary information to determine the Company’s performance, business model and strategy.
Regulatory investigationThe Company reported in the 2018 Annual Report that on 12 May 2017, the Serious Fraud Office (SFO) had commenced an investigation into the activities of Petrofac, its subsidiaries and their officers for suspected bribery, corruption, and/or money laundering. During the year the Board received regular updates on this ongoing investigation.
In February 2019, a former employee of a Petrofac subsidiary admitted offences contrary to the UK Bribery Act 2010. No charges have been brought against any Group company or any other officer or employee to date. Although not charged, a number of Petrofac individuals and entities are alleged to have acted together with the individual concerned. The SFO investigation remains ongoing. The existence, timing and amount of any future financial obligations (such as fines or penalties) or other consequences are unable to be determined at this time and no liability has been recognised in relation to this matter in the consolidated balance sheet at the end of the reporting period.
Code of Conduct and Speak UpThe Compliance and Ethics Committee is responsible for reviewing the adequacy and effectiveness of the Group’s compliance activities, which include the Company’s Speak Up Policy. Further details of our compliance practices are provided on page 62. The Compliance and Ethics Committee reviews the status of all investigations conducted as a result of any alleged Code of Conduct breaches received during the year, and liaises, as required, with the Audit Committee, in the event the alleged breach is of a financial nature. Further details are set out on page 89.
SecurityThe Board has continued to strive for a safe and secure working environment within our geographies, which include a number of areas where low oil prices have meant straitened economies. To this end, a focus on territories in which the security threat may not be obvious but where low level criminality and economic hardship could adversely affect our staff or performance has been critical. The emphasis for this project remains the education and empowerment of all personnel through the representatives of the HSSEIA function in order to provide the most effective impact.
Crisis managementBuilding on two years of focused improvement, the Company intends to increase the testing and exercising of its crisis management systems during 2019 with the aim of consolidating a best-in-class response capability. We will continue to provide training for all three tiers of our command and control structure while further developing our Business Continuity preparedness. The Company also has procedures in place for Directors to have access to independent external advice at the Company’s expense, where they judge it necessary in order to discharge their responsibilities.
76 Annual report and accounts 2018 Petrofac

RELATIONS WITH SHAREHOLDERSStakeholder engagementThe Board recognises the importance of establishing and maintaining good relationships with the Company’s shareholders; as a result, open and constructive engagement is considered vital to understanding shareholders’ views. This helps ensure what we report on is correctly linked to our market risks and opportunities (further details on page 44).
Our Investor Relations team acts as a focal point for contact with investors throughout the year and a programme of meetings with both existing and potential shareholders, as well as analyst and investor meetings, is scheduled annually by the team. This IR programme includes presentations to institutional investors and research analysts, as well as question and answer sessions with stakeholders following the publication of our full and half-year financial results. These presentations are streamed via a live webcast for those unable to attend in person and these continue to be available on our website after broadcast. In addition, management arrange calls and meetings with these groups following the release of any trading updates to the market. Brokers’ research notes are regularly circulated to all Directors and a formal broker’s report is circulated to Directors in advance of each Board meeting.
The Group Chief Executive and Chief Financial Officer maintain a regular dialogue with institutional shareholders through a programme of one-to-one and other meetings throughout the year, primarily focusing on operational matters. More than 46% of the meetings held during the year were attended by the Group Chief Executive and/or the Chief Financial Officer.
Additionally, as detailed further on pages 64 and 90, during 2018 meetings with key stakeholders to discuss governance and remuneration issues were held with the Chairman and/or the Senior Independent Director.
Furthermore, discussions are held throughout the year with our corporate brokers to better understand shareholder sentiment in light of ongoing market pressures and to gain insights into governance matters, in general, and succession planning in particular, from a shareholder perspective. The Board will continue to focus on stakeholder engagement more widely over the next year, continuing to build a comprehensive stakeholder engagement programme.
2018 shareholder meetings calendar
MonthNumber of shareholder
meetings held during the year
January 5
February 81
March 40
April 21
May 13
June 32
July 7
August 141
September 23
October 2
November 34
December 3
Total 202
1 Including Full Year and Half Year Results. Live webcast of analyst/investor presentations (replay available on our website).
Analyst and investor tripDuring 2018, we offered analysts and institutional shareholders the opportunity to visit our operations in Kuwait and UAE. This visit included management presentations (which are available on the Company’s website) on Petrofac’s core business in the MENA region and provided the opportunity for attendees to meet with the local project teams on site at the Clean Fuels Project in Kuwait and at the BorWin3 platform site at the Dubai Drydocks World.
Shareholder distribution
US and Canada
Europe
Other
UK 81.5%
10.5%
7.0%
1.0%
Meetings held with shareholders by country
US and Canada
Rest of Europe
Rest of World
UK 56.0%
23.5%
19.7%
0.8%
Shareholders (ownership) by territory
Major shareholders In accordance with the FCA’s Disclosure Guidance and Transparency Rules (DTR5), as at 31 December 2018, the Company had received notification of the following material interests in voting rights over the Company’s issued ordinary share capital:
Name
Number of ordinary shares notified as at 31 December 2018
Percentage of issued share capital as at
31 December 2018
Ayman Asfari and family 64,982,226 18.79%
Toscafund Asset Management LLP 22,559,813 6.52%
Annual report and accounts 2018 Petrofac 77
Go
vernanceS
trategic rep
ort
Financial statem
ents

CORPORATE GOVERNANCE REPORT CONTINUED
ENGAGEMENT WITH STAKEHOLDERS
Stakeholder Why we engage How we engage Key interests
Employees Our employees, their attitude and skills set us apart from our competitors. We are committed to ensuring we have safe and effective working environments, which can enable everyone within the business to perform to their true potential
• Meeting with employees during site visits• Regular interaction with the management
team during and after Board meetings• Creation of a new Workforce Engagement
Forum from January 2019• Management of townhalls held throughout
the year • Annual employee surveys• Through the internal website
• Career development opportunities
• Business model application• Financial performance• Implementation of the strategic
agenda• Impact of digital initiatives
Investors and shareholders
Delivering a strong return to our investors is a key priority for the Board
• Meetings with key investors to discuss strategy and operational performance; roadshows at full and half year end
• Regular updates from Investor Relations team on investor sentiment, in and after Board meetings
• All shareholders are given an opportunity to pose questions to the Board at our AGM
• Financial performance• Business model application• Implementation of the strategic
agenda• Governance matters
Communities We actively support local communities to develop closer ties and to manage the social and environmental impacts of our business in order to bring long-term sustainability to the communities where we work
• Public consultations• Ad hoc face-to-face meetings • A range of vocational development
programmes with our local partners
• Human Rights matters• Local employment opportunities• STEM education initiatives • Investments in local supply
chains• Supporting infrastructure
improvement programmes
Clients To communicate the various operating issues and concerns so that they are understood and considered and to gain stakeholder feedback and views
• Ad hoc meetings with key clients • At industry events• Through our website
• Operational delivery• Implementation of the strategic
agenda• Ethical credentials
Suppliers Wherever the Company operates, we are committed to employing local people, working with local suppliers and developing local capabilities
• Industry events, such as EIC Connect Oil, Gas & Beyond
• Meetings with our supply chain partners
• Business model application• Implementation of the strategic
agenda• Ethical credentials
Governments and regulators
We work with governments on a range of issues impacting our business to influence policy changes
• Ad hoc meetings with Ministers and civil servants
• Through the UK Regulator Oil and Gas Authority (OGA)
• Responding to consultations with various government departments
• Health and safety• Taxation• The UK’s exit from the
European Union• Governance
Industry associations
We work with our peers to collaborate and address challenges and share best practice
• External representation on committees, e.g. Oil and Gas UK, the Energies Industry Council, and AMEXHI in Mexico
• Attendance at industry conferences and events
• Industry collaboration • Supply chain• Health, safety and
environmental issues
78 Annual report and accounts 2018 Petrofac

Share capitalAs at the date of this report, the Company’s issued share capital consisted of 345,912,747 ordinary shares, carrying one vote each. The total voting rights at the date of this report are accordingly 345,912,747. The Company’s ordinary shares are quoted on the London Stock Exchange. There are no restrictions on the transfer of ordinary shares in the capital of the Company other than certain restrictions which may, from time to time, be imposed by law, for example, insider trading regulations.
In accordance with the EU Market Abuse Regulations certain Company employees, including all Directors, are required to seek approval from the Company to deal in its securities. The Company is not aware of any agreements between shareholders that may result in restrictions on the transfer of securities and/or voting rights.
The Board requires express authorisation from shareholders to issue or purchase ordinary shares in the Company. These authorities were granted by shareholders at the 2018 AGM. The Group has no current plans to exercise either of these authorities and will propose to renew them at the 2019 AGM. The Company’s Articles of Association may only be amended by special resolution at a general meeting of shareholders. Details relating to the rights and obligations attached to the Company’s ordinary shares are set out in the Company’s Articles of Association.
Workforce engagement In light of the changes recommended by the new UK Code, the Board took a significant step towards increasing workforce engagement by establishing a new Workforce Forum. This Forum will meet bi-annually and will be attended by at least two Non-executive Directors. The Forum is intended to supplement the many existing processes of information exchange between the Company and its employees and its purpose will be to enable the Board to better understand the views of the Company’s workforce and take these into consideration during Board discussions and decision making.
Director shareholdingsAs detailed further on page 99, during the year the Chairman and Non-executive Directors used a portion of their quarterly fees to purchase Petrofac Limited shares, further aligning Directors’ interests with those of our shareholders.
Shareholder communicationsThe Board recognises the importance of shareholder communications and considerable emphasis is placed on these communications, whether they are institutional or private shareholders. All financial reports and shareholder documents, regulatory market announcements, together with recorded interviews, are available on our website, which we believe allows shareholders to become more informed investors.
Annual General Meeting (AGM)Full details of this year’s AGM, which will be held in London, are set out in the Notice of Meeting which accompanies this report and which is also available on our website. As a matter of good practice, all resolutions will be conducted on a poll and the results will be announced to the market as soon as practicable after the meeting. All shareholders are invited to attend the Company’s AGM at which they have the opportunity to put questions to the Board and meet with those Directors who are able to attend. Shareholders who are unable to attend the AGM are invited to email questions in advance to [email protected].
I look forward to seeing as many of you as possible at my first AGM as your Chairman, when my colleagues and I will be available to answer your questions.
René Médori Chairman 27 February 2019
Annual report and accounts 2018 Petrofac 79
Go
vernanceS
trategic rep
ort
Financial statem
ents
80 Annual report and accounts 2018 Petrofac
NOMINATIONS COMMITTEE REPORT
Dear shareholderFollowing my appointment to the role of Chairman in May, I am pleased to present my first Nominations Committee report for the year. Having been a Director for over six years, I have seen the Board develop considerably during that time, adapting where required to ensure the appropriate skills, knowledge and experience have been maintained in key positions, despite unexpected changes. As a result, the Board and leadership team have been strengthened to ensure we are able to continue to deliver our strategic goals.
2018 Board changesIn May 2018, Rijnhard van Tets stepped down after 11 years on the Board, most recently as Chairman. Rijnhard saw the Company through a very challenging period and, on behalf of the Board, I would like to thank him for his leadership and, on a personal note, for supporting a smooth transition of the chairmanship. Following my change in role, the Committee reviewed the Senior Independent Director (SID) position and consequently, Matthias Bichsel was appointed as SID in May 2018.
During the year we also welcomed two new Non-executive Directors. Sara Akbar joined the Board with effect from 25 January 2018. Sara is very experienced within the oil and gas industry and has significant operational and project management capabilities. She brings to the boardroom a unique insight into the Middle East environment, along with wide-ranging international experience. David Davies joined the Board with effect from 18 May 2018. David has extensive financial and international experience, having served as a financial professional for more than 35 years. He also brings insight of managing companies exposed to substantial and rapid change. We believe these appointments will ensure that the Board remains highly competent, well-balanced with the multi-disciplinary skills and experience to support Petrofac’s future plans.
To facilitate our external search process, the Committee retained the services of specialist recruitment consultant, Korn Ferry, a firm with which the Company has no other relationship that extends beyond executive searches for Board and senior management positions. As part of our search process, Korn Ferry are instructed to identify Non-executive candidates who meet the skills and experience brief, recognising that the Committee remains committed to ensuring that any appointment is filled by the best available candidate, with complementary skills, capabilities, experience and background to address the Board’s needs, irrespective of any other consideration.
Maintaining a strong Board for the futureAt the start of 2019, and with a view of improving our gender diversity and enhancing overall Board expertise, a further search for a new Non-executive Director was initiated.
The Committee is now delighted to be in a position to recommend to shareholders the appointment of Francesca Di Carlo at our forthcoming AGM in May 2019. Francesca is currently Group Executive Vice President of HR and Organisation at Italian multinational energy company, Enel Spa. She has extensive experience in corporate development, audit and corporate finance and will bring to the boardroom expertise across a range of functional areas, with core strengths in a number of disciplines, including strategy and transformative organisational change. The Board looks forward to working with Francesca.
René MédoriChairman of the Nominations Committee
Role of the Committee
• Review the composition, size and structure of the Board and its committees, taking into consideration the skills, knowledge, experience, diversity of gender, social and ethnic backgrounds and cognitive and personal strengths of Directors
• Identify and recommend for Board approval suitable candidates to be appointed to the Board, fully evaluating the balance of existing skills, knowledge and experience required
• Consider the effectiveness of succession planning processes for the Group and maintain oversight of the development of a diverse pipeline for succession to both Board and senior management roles
Terms of referenceThe Committee reviewed its terms of reference during the year. Amendments were made to incorporate committee membership changes and reflect updates introduced by the 2018 UK Corporate Governance Code. Copies are available on our website at www.petrofac.com.
NOMINATIONS COMMITTEE
Annual report and accounts 2018 Petrofac 81
Go
vernanceS
trategic rep
ort
Financial statem
ents
The Committee is pleased to note that this appointment will bring the female representation on the Board to the 33% target recommendation as set out within the Hampton-Alexander Review, an independent, business led review supported by UK Government.
DiversityThe Committee considers diversity throughout the organisation to be a key factor in the Company’s strategic success.
Progress in overall diversity awareness is being made and it is felt that the promotion of diversity in its widest sense throughout the Company will lead to more balanced decision making and greater engagement, while widening the available talent pool opportunities.
Despite engineering continuing to be a predominantly male-dominated profession, Petrofac is committed to building the diversity pipeline from the bottom up. The Company remains committed to building and developing our female talent pipeline, albeit that women currently only account for 11% of our total workforce.
It should however be said that Petrofac believes diversity to be wider than simply gender and, with more than 80 nationalities employed within the Group, we consider that our business benefits greatly from a varied employee base, with diversity of skills, knowledge, experience, ethnicity, in addition to gender. A Diversity and Inclusion Policy, which is applicable to all employees, has been in place across the Group since August 2016 and its purpose is to ensure equality of opportunity and fairness in all areas of employment. It is believed that our policy allows us to value the diversity of our employees while promoting an inclusive culture across our business.
The ambitions and targets included within the Hampton-Alexander Review and the range of initiatives that may help to increase the number of women in leadership roles were considered by the Board during 2018. Details of our gender diversity statistics for 2018 are set out on page 66.
Our Leadership Development programmes comprise employees from different cultures, backgrounds and nationalities. During the year, the global talent review undertaken by the Committee aimed to ensure that we will have a diverse pipeline for consideration for the Group’s future leaders.
Board evaluationIn compliance with the UK Code, this year’s Board evaluation exercise was internally facilitated and full details of the process and outcome of the evaluation process are set out on pages 74 and 75.
Succession planningThe Committee places considerable importance on succession planning and talent management. This process is integral to the Company’s strategic plans and accordingly a core focus over the last few years has been on succession planning both at Board and senior management level. The Committee spent almost a third of its time discussing succession matters, with a further third dedicated to talent management and people development.
The Committee devoted considerable time reviewing both long and short-term management plans as well as recommending suitable development opportunities to ensure changes could be managed effectively without significant disruption to the Group’s strategy or day-to-day operations.
A new organisational framework was put in place in August 2018, which was devised to create leadership clarity for each of our operational divisions. Additional focus on strengthening the management pipeline was supported further by discussions led by the Group Chief Executive and Group Director of HR, with consideration given to where future leaders of the Company were likely to emerge and what support would be required. The Committee also considered succession planning for the Group Chief Executive, with development profiles reviewed against existing expertise. The Committee reviewed the external market for potential candidates and also used YSC, a leading provider of talent assessment and development, to work with, assess and coach potential internal candidates.
The Committee held three in-depth talent reviews during 2018, covering the top 150 positions, the top 800 positions and then reviewing the top talent of the next 2,000 positions across the Group. The progression of emerging talent is also reviewed on an annual basis, not only to check that appropriate processes are in place to identify and monitor future potential leaders, but also to allow the Committee to discuss such individuals. As a result of the work carried out during 2018, a diverse pipeline was identified and plans are now being put in place to ensure employee skills and capabilities are developed effectively, thereby building a strong talent pipeline for the future.
The Company’s graduate programme was also reviewed by the Committee and it was agreed that up to 150 new graduates would be taken into the business during 2019, in both engineering and functional roles. This is a four-year programme that provides individuals with operational experience in a variety of roles and demonstrates the Company’s commitment to career progression and development opportunities. It was noted that more than 50% of graduates hired since 2014 have been retained within the Group.
Employee engagementDuring 2018 an online survey was issued to all employees (see page 50) and the actions arising from this exercise will be addressed throughout 2019. As noted in the Governance Report on page 79, a new Workforce Forum has also been put in place to assist with increasing our engagement with employees. It is envisaged that this Forum will allow employee views to quickly reach the boardroom, while encouraging Group-wide engagement between colleagues.
Looking forwardI am pleased to report that good progress against our priorities has been made this year, but I recognise we still have work to do, especially in relation to succession planning and diversity. I will report next year on how we are progressing these initiatives.
René MédoriChairman of the Nominations Committee 27 February 2019
AUDIT COMMITTEE REPORT
Dear shareholderHaving joined the Petrofac Board in May 2018, I was pleased to accede the role of Audit Committee Chairman from René Médori. René had effectively led the Committee for six years but was required to step down following his appointment to the role of Company Chairman. It was reassuring to know that I could continue to call upon his guidance in my first few months with the Company and, on behalf of the Committee, I would like to express our gratitude for his valued contribution.
2018 has been a year of delivery for Petrofac. Throughout 2018, the Committee’s focus remained on ensuring the integrity of the Group’s financial reporting and related risk management and internal control activities. I am pleased to report that considerable progress was made during 2018 that has contributed to the ongoing delivery of the Group’s strategic objectives.
Petrofac’s operating environment presents unique and challenging risks. As a result, it is important that the Group maintains a clearly defined and established system of risk management and internal control procedures. The Group regularly tests its approach to risk in order to remain vigilant. The Committee maintains a keen oversight on key areas of risk management and internal controls to ensure that future growth can be supported by a developed and embedded risk management culture, promoting best practice, even in tougher external environments.
During the year, the roles of Group Head of Audit and Group Head of Enterprise Risk were combined. The Committee reviewed this appointment and believes the responsibilities of the combined role will deliver significant improvements to the internal audit planning and risk management processes, with a view to embedding best practice at all levels of the business.
The financial controls improvement programme continued during 2018, the aim of which is to mitigate material financial misstatement risks and fraud through strengthening the Group’s financial controls framework. The Group Financial Controller provided regular updates to the Committee throughout the year, to outline and review the planning and implementation of the project. In conjunction with this programme, considerable work was undertaken during 2018 to understand the implications of implementing International Financial Reporting Standards (IFRS) 9 and 15.
David DaviesChairman of the Audit Committee
Role of the Committee
• Monitor the integrity of the Group’s financial statements, any formal announcements relating to the Group’s financial performance, and review significant financial reporting judgements, estimates or other accounting matters concerning the Group
• Review the effectiveness of risk management and internal control systems, including viability statements, and provide assurance to the Board
• Monitor and review the effectiveness of the Group’s internal audit function
• Manage the appointment, independence, effectiveness and remuneration of the Group’s external auditor, including the policy on the award of non-audit services
• Approve the remuneration and terms of engagement of the external auditor and make recommendations to the Board regarding their re-appointment
• Advise the Board on how it has discharged its responsibilities and consider whether the Annual Report and Accounts, taken as a whole, is fair, balanced and understandable
Terms of referenceThe Committee reviewed its terms of reference during the year, with changes made to incorporate Committee membership changes and other governance amendments. Copies are available on our website at www.petrofac.com.
AUDIT COMMITTEE
82 Annual report and accounts 2018 Petrofac

The Committee is encouraged by the significant advances made during the year and is supportive of the process improvements being introduced across the Group as result of the work completed by both functional and operational management. The Committee is confident that these changes will result in the provision of greater assurance and oversight of project risk throughout the organisation.
During 2019, the Committee will continue to monitor and review the effectiveness of the Group’s risk management and internal control framework in order that appropriate assurance can be provided to the Board.
Recognising the increasing governance requirements being introduced, the Committee will ensure that the provisions of the new UK Corporate Governance Code are met in all aspects and also take into consideration the FRC recommendations in relation to improved corporate reporting and improved corporate governance practice.
The Committee reported to the Board in February 2019, as part of its year-end process, that the Group continues to operate a sound system of controls and, when taken as a whole, confirmed that it considers the Annual Report and Accounts to be fair, balanced and understandable, providing shareholders with the necessary information to assess the Group’s performance and position, business model and strategy. Key issues discussed by the Committee are reported to the Board after each scheduled meeting and this practice will continue, thus ensuring any significant matters are considered and addressed appropriately.
David DaviesChairman of the Audit Committee 27 February 2019
PRINCIPAL MATTERS CONSIDERED DURING THE YEAR BY THE AUDIT COMMITTEE
The Committee met four times during the year, coinciding with key points in the Company’s financial reporting cycle. The principal matters reviewed and considered were as follows:
2018
February • Internal control framework assurance• Code of Conduct Declaration Report• Compliance update, including 2018 plan• Internal audit full year report and proposed 2018 plan• Key Risks Register (KRR) and risk management systems,
including the Principal Risks Report for inclusion in 2017 Annual Report and Accounts
• Ernst & Young (EY) full-year report including letter of representation
• 2017 year-end results and announcement, including all relevant reports
• The Directors’ Remuneration Report • Going concern review• Viability statement review• Non-audit services fees• Treasury Risk Management and Liquidity Policies
May • Internal audit update• KRR review • Enterprise Risk Management Improvement Plan• Group Finance report, including an update on the financial
controls improvement programme • Insurance programme renewal update• EY report on control themes and observations from the audit
for the year ended 31 December 2017• External audit improvement opportunities
August • Internal audit report • Group Finance report, including an update on the financial
controls improvement programme• EY half-year report and audit planning report for the full year• 2018 half-year results and announcement, including all
relevant reports• Proposed interim dividend payment• Principal Risk Review and KRR review• Interim Tax update• Legal entity restructuring project update
November • KRR and risk management systems review• Review of principal risks and consideration of risk appetite• Internal audit progress report• EY report including 2018 audit plan update• Group Finance report, including update on the financial controls
improvement programme• Annual tax review• Review of the Committee’s terms of reference• Review of legal entity restructuring project
Annual report and accounts 2018 Petrofac 83
Go
vernanceS
trategic rep
ort
Financial statem
ents

AUDIT COMMITTEE REPORTCONTINUED
Regular management reports support robust assessments of the principal risks facing the Group, including their impacts on the enterprise and its future sustainability. In order to provide its assurance to the Board, the Committee receives regular updates from the Group Head of Internal Audit and Enterprise Risk, Group Financial Controller and Group Treasurer and Head of Tax. Recognising the need for a systematic approach to be taken for managing risk, additional reports are also provided by senior management, including financial counterparty risk assessments and controls improvement plans. In reviewing each of the submitted reports, the Committee considers how effectively risks have been identified; how they have been mitigated and managed; whether actions are being taken promptly to remedy any failings or weaknesses; and whether the causes of the failing or weakness have indicated poor decision making or a need for more extensive monitoring or a reassessment of process effectiveness. These help to provide the Committee with a balanced assessment of the Group’s principal risks and the effectiveness of the systems of internal control.
The effectiveness of our risk management and internal controls is founded on our Enterprise Risk Management (ERM) and internal control frameworks, which are detailed on page 23. During 2018, we continued to improve our risk management systems by introducing additional controls to our project risk review processes, carrying out a comprehensive review of our principal risks and developing a more formal articulation of the Group’s risk appetite. Throughout the year, the Group’s principal risks have been regularly reviewed by management to provide assurance on the robustness, integrity and effectiveness of the systems in place, including those that would threaten its business model, future performance, solvency and liquidity.
During the year, the Committee has had oversight of a Group entity restructuring project, which is being undertaken to ensure that the Company’s legal structure adequately supports and reflects how the business operates globally. The rationale for the project is to simplify the corporate structure, whilst maximising the efficiency of functional business activities. As part of the exercise, extensive internal due diligence has been conducted, which has contributed to administration improvements across the business. The project is being run in conjunction with our Group Legal and Group Finance teams and regular updates are presented to the Committee.
Internal auditThe Group Head of Internal Audit attends all Committee meetings, during which his reports are considered and discussed in detail. The Committee also meets separately with him without executive management being present to discuss, among other matters, management’s responsiveness to internal audit recommendations and the effectiveness of the internal audit process. The Group Head of Internal Audit also has direct access to the Committee Chairman and meets with the external auditor whenever required.
ACCOUNTABILITYMembership, role and responsibilitiesFollowing the Committee chairmanship changes which took effect in May 2018, there are currently three members on the Committee. The Committee is satisfied that all its members meet the independence and experience parameters required by the UK Corporate Governance Code, with David Davies having significant, recent and relevant financial experience and Matthias Bichsel and George Pierson having competence relevant to the Group’s sector. Furthermore, all members of the Committee have extensive general management and commercial expertise. Their details are set out on pages 66 and 67. The Committee believes it remains well positioned to challenge and debate the performance and relevance of the Group’s financial reporting, risk management and internal controls to safeguard the interests of shareholders.
To assist the Committee during its deliberations, all other Board members are invited to attend Committee meetings. In addition, the Group Head of Internal Audit and Enterprise Risk, Group Treasurer and Head of Tax, and Group Financial Controller, are each invited to attend meetings when required.
The Committee assists the Board in the effective discharge of its responsibilities for financial reporting, internal control and risk management. As set out in our Directors’ statements on page 102, the Directors are responsible for the preparation of Group financial statements, in accordance with IFRS.
The Group has an internal control and risk management framework in place, which includes policies and procedures to ensure that adequate accounting records are maintained, and transactions are accurately recorded. Furthermore, the Committee has oversight of the financial excellence initiatives, which are being developed amongst other items to continue to strengthen our control environment and improve management reporting. This ensures that the Group’s financial reports, including the financial reporting process and communications to the market, give a clear and balanced assessment of the Group’s position. In addition to the principal matters considered during the year, as set out on page 83, the Committee also reviewed the 2018 full-year results and this Annual Report and Accounts, at the beginning of 2019.
Internal controls and risk managementThe Board is responsible for establishing the Group’s overall risk appetite, its enterprise risk arrangements and for ensuring that the Group has in place an adequate system of internal control. However, in accordance with the requirements of the FRC’s Guidance on Risk Management, Internal Control and Related Financial and Business Reporting, the Committee has the delegated responsibility of monitoring and reviewing the integrity and effectiveness of the Group’s overall systems of risk management and internal controls. It also provides the Board with the assurance that risk management and internal control systems as a whole, including strategic, financial, operational, and compliance controls, are sufficiently robust to mitigate the principal and emerging risks which may impact the Company. The Group’s Key Risk Register (KRR) captures and assesses the principal risks facing the Group, which forms part of the Group’s framework for determining risk and risk appetite. This document is updated quarterly and is considered at both Committee and Board level throughout the year. Further details are included within the Strategic Report on pages 22 to 29.
84 Annual report and accounts 2018 Petrofac

The Company’s risk based internal audit programme for 2018 was considered and approved by the Committee in February, and the 2019 programme was considered and approved in November 2018. The 2018 programme was further developed during the year taking into account the Company’s principal and emerging risks and identifying where they primarily occur in the business; through discussions with the Committee and senior management; by recognising changes in the Company and the external environment; and with consideration to prior audit coverage. In approving the 2018 audit programme, the Committee considered the Company’s principal KRR and mapped the proposed audits accordingly. It was agreed that the primary focus should remain on a number of key areas including overarching management controls, such as the legal and tax functions processes; controls designed to prevent non-compliance with laws and regulations, such as bribery, corruption, money laundering and tax evasion; project level controls, such as project set up, completions management and joint ventures; financial controls; and IT resilience and security. Regular progress reports were provided to the Committee, detailing key findings of audits undertaken in the period under review. Where significant areas of concern were highlighted, the Committee challenged management and action plans were agreed to address matters raised, with follow-up reviews arranged.
During 2018, 26 internal audit assignments were carried out, the results of which were included in Internal Audits annual assessment of the audited elements of the system of internal control. Where new audit findings were identified, agreed management actions in response to any Group level findings were reported to the Committee, thus enabling progress to be monitored and any trends to be identified. Weaknesses identified included gaps in some compliance controls, IT system controls, corporate function and project level controls. These findings were carefully considered by the Committee, with management given direction to ensure the necessary steps were taken to mitigate any issues. Reports on the work carried out by Internal Audit were delivered to the Committee throughout the course of the year, with Group, region and project level findings reported accordingly.
To assist Group Compliance, Internal Audit continued to assist in the assessment of allegations raised from the confidential Speak Up line and triaging them to the appropriate teams for investigation. Where allegations related to alleged financial and internal control breaches, Internal Audit conducted the investigations and provided detailed reports to the Compliance and Ethics Committee.
AssuranceAt the year end, and as required by the UK Code, formal assurance is provided to the Board that effective governance, risk management and internal control processes are in place and remain relevant, to ensure that the Group will continue to be viable for at least the next three years. This assurance covers all material controls, including strategic, financial, operational and compliance controls. Further details on the overall control processes are set out on page 84.
TreasuryAs part of its remit, the Committee considers the Company’s compliance with the Sovereign, Counterparty and Financial Market Risk policy, a copy of which is available at www.petrofac.com. The Committee was satisfied that this policy remains appropriate. During the year, the Committee reviewed and approved a revised Liquidity Policy, which included updated liquidity targets for the Group. Commodity price risk and the Company’s hedging policy were also kept under review. The Committee noted the funding initiatives put in place during the year by the Group Treasury department, including the maturity of the Group’s senior notes, utilisation of existing funding facilities and the introduction of new facilities. The Committee noted the priorities for 2019 which include enhancing the analysis, management and reporting of financial risk.
Insurance programmePetrofac procures insurance as a risk mitigation measure and cover is arranged by way of a global insurance programme. This is designed to cover the Group as a whole, against the types of insurable risks normally associated with an oilfield services provider operating in similar challenging territories across the world.
The efficacy of the global insurance policies is continually stress tested. This ensures our cover remains as wide as commonly available across the insurance market, whilst continuing to represent a cost-effective risk transfer solution, considering various factors, including the policy limits, deductible levels and policy conditions.
During 2018, all policies were subjected to a full re-marketing exercise designed to challenge whether they remained both fit-for-purpose and cost effective. Despite difficult insurance market conditions, the renewal outcome was positive and policy limits were maintained. This resulted in a significant saving for the business. The 2019 global insurance programme renewal is expected to be challenging, as certain markets are predicted to reduce their appetite for specific risk. However, a further marketing renewal exercise will be undertaken to ensure that these challenges are managed sufficiently and that any proposed premium increases are limited wherever possible.
There remain several sizeable claims registered against various global insurance policies. These continue to be under investigation and where appropriate, subject to interim payments, specifically where costs are continuing to be incurred.
Annual report and accounts 2018 Petrofac 85
Go
vernanceS
trategic rep
ort
Financial statem
ents

AUDIT COMMITTEE REPORTCONTINUED
External auditorErnst & Young (EY) continued as the Company’s auditor throughout the year. EY were reappointed as external auditor following completion of a formal tender process in 2016. In accordance with regulation and continuing market practice, the lead audit partner responsible for the Group audit was rotated at the end of the 2017 audit, having been in place since 2013. The new lead audit partner will rotate again in five years, as required.
The Committee considers the effectiveness of the external auditor on an ongoing basis, considering its independence, expertise, performance and understanding of the Group, its resourcing capabilities, culture, and objectivity. Through its own observations, as well as the interactions with executive management throughout the year, the Committee remains satisfied with the independence and objectivity of the external auditor and the effectiveness of the audit process. In making this assessment, the Committee gave due consideration to the information and content of reports and the advice provided, the execution of the audit plan, and the robustness of EY’s understanding and challenge to management on key accounting matters.
During the year, the Committee met with the auditor without management present, discussing any significant issues, not least the conduct and quality of the audit, in advance of the full and half-year results. The two Committee Chairmen also maintained regular contact with the lead audit partner during their respective tenures outside the formal meeting schedule, discussing formal agenda items ahead of upcoming meetings and reviewing any other significant matters.
Each year, EY submit their proposed audit strategy and scope, thereby ensuring the audit can be aligned with the Committee’s expectations. This work is carried out with due regard to the identification and assessment of business and financial statement risks that could impact the audit as well as continuing developments within the Group. During 2018, the audit scope included the execution of existing major contracts and judgements thereon; IES impairment assessments and fair value remeasurements, accounting for asset disposals, including tax exposure provisions and recoverability of deferred tax assets; accounting matters arising from the SFO investigation; the implementation of new accounting standards (IFRS 9 and IFRS 15), and impact assessments for IFRS 16. EY also reviewed the work undertaken by Group Finance in relation to the roll out of its Control Improvement Programme, ensuring the identified processes were being embedded within the business and providing feedback to management on the design effectiveness of those controls.
At the year end, a report of the work carried out by the auditor was provided to the Committee detailing areas of audit risk, the findings of which were reviewed and considered by the Committee.
Non-audit servicesThe Committee is conscious of the potential issues of independence arising from using the external auditor for non-audit services. While the Committee recognises that, in some instances, it may be more timely and cost-effective for EY to advise on non-audit matters, given their familiarity with the Group, to safeguard the external auditor’s objectivity and to ensure the independence of the audit is not compromised, the Company has a non-audit services policy.
This policy provides clear definitions of the services that our external auditor may and may not undertake. To ensure compliance, the Committee reviews the Group’s cumulative non-audit spend each year and, should the nature or size of the proposed work require it, gives prior approval to the appointment of EY before any work is carried out. The Committee is satisfied that EY’s objectivity and independence was not impaired during the year by any non-audit work undertaken by them and confirms there were no breaches to the policy during 2018. In addition, EY has confirmed that it was compliant with APB Ethical Standards in relation to the audit engagement.
The Committee acknowledged the FRC Revised Ethical Standards and recommended that our policy be drafted to reflect these standards. A summary of the policy is set out below, while a copy of the full policy can be found on the Company’s website. The non-audit spend for the year, as a percentage of the overall audit fee, was 20.2% (2017: 32.4%), with the majority of costs relating to audit related assurance services, including the Group interim review and other non-audit services, such as two specific corporate projects and agreed upon procedures for operational projects.
Non-audit services policy summary:• The external auditor is automatically prohibited from carrying out
work which might impair its objectivity (as defined by reference to the FRC’s Revised Ethical Standard 2016 Part B Section 5 and the EU regulations
• The Chief Financial Officer (CFO) will seek approval from the Committee before appointing the external auditor to carry out a piece of non-audit work where:
– the fee is US$50,000 or above; or
– total non-audit fees for the year are approaching 50% of the average of the Group fees paid in the last three consecutive financial years
• The external auditor will only be appointed to do types of audit work permitted within and outside the EU as set out in the policy. The Company will not seek, other than in exceptional cases, to rely on the more flexible regime permitted outside the EU
• The CFO may appoint the external auditor to carry out other types of permitted non-audit work as listed in the policy, subject to the policy provisions and provided the fee is below US$50,000.
86 Annual report and accounts 2018 Petrofac

Significant judgementsThe Committee’s role is to assess whether the judgements or estimations made by management in preparing the financial statements are reasonable and appropriate. Set out below are what we consider to be the most significant accounting areas that required a high level of judgement or estimation during the year and how these were addressed:
Focus area Why this area is significant Role of the Committee Conclusion
Revenue and profit recognition on fixed-price engineering, procurement and construction (EPC) contracts
The quantification and timing of revenue and profit recognition from fixed-priced EPC contracts is a material driver of the Group’s financial performance and position, which is subject to significant management judgement and estimation. There is an inherent risk of bias or error in judgements and estimates concerning, for instance: variable consideration e.g. variation orders, liquidated damages; contract contingencies; and estimate to complete forecasts.
The Committee reviewed and challenged the reasonableness of evidence to support judgements and estimates regarding revenue and profit recognition, including non-recognition in certain instances, through regular discussions with executive management. The Committee applied focus on variable considerations; contract contingencies; and estimate to complete forecasts. The external auditor also challenged management on the key drivers of revenue and profit recognition on fixed-price EPC contracts and reported their findings to the Committee.
The Committee concluded after thorough deliberation that the quantification and timing of revenue and profit recognition on fixed-price EPC contracts, as well as associated reporting, was in accordance with the relevant International Reporting Standards and the Group’s accounting policies.
IES disposal transactions and recoverability of IES asset carrying amounts
Several key judgements and estimates, under conditions of significant uncertainty, were required in relation to IES disposal transactions (49% of our Mexican operations, Greater Stella Area development and Chergui gas concession in Tunisia) and in assessing the recoverability of IES asset carrying amounts. Impairment and fair value assessments; discount rates applied to deferred consideration; and risking of contingent consideration, for example, require significant judgements and estimates that have a material impact on the Group’s financial performance and position.
The Committee evaluated the reasonableness and appropriateness of internally generated data used in determining judgements and estimates through reviewing and challenging management papers presented on this focus area. The Committee also examined the notes to the consolidated financial statements to ensure the risks associated with these judgements and estimates were clear and complete.
The Committee was satisfied that reasonable and appropriate judgement and estimates were applied by executive management on IES disposal transactions and in assessing the recoverability of IES asset carrying amounts.
Taxation The wide geographical spread of the Group’s operations and the increasingly complex nature of local tax rules in different jurisdictions increases the risk of misstatement of tax charges. Management is required to make several judgements and estimates around: uncertain tax positions given the commercial structure of individual contracts; the increasing activity of the relevant tax authorities; and the recoverability and valuation of deferred tax assets, which are supported by future taxable profit forecasts.
The Group’s tax positions were reviewed by the Committee to ensure that the effective tax rate, tax provisions and recognition of deferred tax asset assumptions were reasonable and appropriate based on available information. Reports outlining key tax issues were reviewed and discussed with executive management and the external auditor, who also reported to the Committee on its audit procedures and findings in relation to the Group’s tax affairs.
The Committee was satisfied that taxation related judgements and estimates were reasonable and appropriate and that the Group’s tax affairs were being managed, accounted and reported in accordance with the relevant legislation, International Financial Reporting Standards and Group policies.
IFRS 15 ‘Revenue from Contracts with Customers’ implementation
Executive management made several significant judgements and estimates on the implementation of IFRS 15, which impacted the initial transaction method and the subsequent revenue recognition. A non-exhaustive list of the significant judgements and estimates include: deciding the transition method to apply; estimating the cumulative catch-up recognised in opening reserves; assessing the revenue recognition method which most faithfully depicts the Group’s performance in transferring control of the goods and services to the client; applying the higher recognition threshold for variable consideration; and ensuring compliance with the enhanced disclosure obligations.
The Committee requested and received regular briefings from executive management and the external auditor on the IFRS 15 implementation plan and progress. The reasonableness and appropriateness of significant estimates and judgements, for example, the determinants of the cumulative catch-up recognised in opening reserves; the rationale for adopting the input method of revenue recognition in fixed-price engineering, procurement and construction contracts; and the adequacy of disclosure, were assessed based on management papers presented to the Committee.
The Committee concluded that reasonable and appropriate judgements and estimates were applied in implementing IFRS 15 and the initial transition and subsequent financial reporting will be in accordance with IFRS 15’s objective to ensure that the nature, amount, timing and uncertainty of revenue and cash flows arising from contracts with clients are properly reported.
The above description of the significant judgements should be read in conjunction with the Independent Auditor’s Report on page 104 and the significant accounting policies disclosed in the notes to the consolidated financial statements. Further details on significant accounting judgements and estimates can be found in note 2 to the consolidated financial statements on pages 118 to 132.
Annual report and accounts 2018 Petrofac 87
Go
vernanceS
trategic rep
ort
Financial statem
ents
COMPLIANCE AND ETHICS COMMITTEE REPORT
Dear shareholderHaving been established during the second half of 2017, the Committee took a very active approach during 2018, endeavouring to fulfil its duties to oversee the implementation of the principles and rules relating to compliance and ethics.
The Committee plays an important role in assisting the Board in fulfilling its oversight responsibilities and there has been a considerable emphasis on driving enhancements in many aspects of ethical compliance. The Committee is also keen to promote Petrofac’s commitment to compliance and ethical matters to all stakeholders.
As a Committee, we have welcomed the opportunity to support the leadership team as it strives for continuous improvement. The Committee, together with the Board and leadership team, have worked to promote the importance of, and the Company’s commitment to, its compliance and ethical programme and accordingly drive the compliance agenda across the Group.
Ongoing work Much of the Committee’s focus during 2018 has been in overseeing the progress of further embedding existing compliance tools and processes across the Group. New systems were put in place to support the Group’s compliance policies, with good progress made throughout the year. Greater integration has been established between the compliance portal and the Company’s existing ERP system, providing more automation to the process. Where required, additional manual controls have been introduced to improve certain processes. These changes have allowed greater independent oversight on relevant controls to be exercised by Group Compliance.
To enhance the Committee’s ability to monitor and measure the implementation of compliance at both Group and project levels further, it was agreed that a scorecard of measurable Key Performance Indicators (KPIs) be created, incorporating performance elements to each of the service level indicators. It was felt however, that the KPIs initially developed in consultation with the business were overly process driven and the Committee gave consideration as to how to develop KPIs that could better reflect behavioural changes throughout the organisation. The KPIs are now being updated so that residual risks and exposures can be determined and mitigating measures identified. The KPI scorecard is regularly reviewed by the Committee.
At each of our meetings during 2018, reports were received from the Group Head of Compliance on the compliance and ethics processes and procedures being enhanced across the Group. An update was also given by the Group General Counsel on general compliance matters, including the Group’s continuing dialogue and engagement with regulators and government agencies.
It is recognised that Petrofac operates globally in territories with different levels of maturity and sophistication regarding compliance and ethics. As a result, work will continue during 2019 to improve the alignment between functional and operational management to ensure ethical behaviours are consistent with the Committee’s expectations and to demonstrate that effective process changes are fully embedded and understood across the Group and throughout the supply chain.
George PiersonChairman of the Compliance and Ethics Committee
Role of the Committee
• Maintain direct oversight over key compliance and ethical risks and monitor the adequacy and effectiveness of controls in place and any mitigation activities
• Evaluate the compliance and ethical aspects of Company culture and make recommendations to the Board on steps to be taken to ensure a culture of integrity and honesty in the Company’s business dealings
• Ensure that ethical policies and practices are subject to an appropriate level of independent internal scrutiny; overseeing the development of, and amendments to the Group Compliance Charter, its Code of Conduct and other compliance policies, procedures and standards
• Maintain oversight of the Group Compliance function
• Support the Company in any engagement with regulatory bodies, industry groups, advisors and other stakeholders, as necessary and where permitted by law, regarding ethical issues and compliance matters
• Oversee, review and approve the adequacy and security of the Company’s whistleblowing line as a tool available for employees and third parties to raise concerns, in confidence, about possible wrongdoing
• Receive reports and review findings of significant internal and external compliance related to investigations, audits and reviews and exercise oversight, where possible, over any such investigation impacting the Group
Terms of referenceThe Committee reviewed its terms of reference during the year. Copies are available on our website at www.petrofac.com.
COMPLIANCE AND ETHICS COMMITTEE
88 Annual report and accounts 2018 Petrofac

Compliance engagement During 2018 the Committee addressed the need for the leadership team to continue to promote the compliance framework improvements. Several internal presentations and training courses were delivered with an increased emphasis on the commercial benefits of compliance, thereby ensuring the ‘why’ would fully resonate as the right way for the Company to conduct business. By endorsing the right behaviours, as well as promoting the right processes, individuals could be held accountable for their actions, while feeling empowered to speak up in the event of an actual or suspected compliance breach. Specific examples of areas for improvement through additional training and improved processes and controls were discussed for implementation during 2019.
Throughout 2018 the Group Compliance function actively engaged with a number of clients on various enhanced due diligence compliance processes. Several discussions with clients were held resulting in positive feedback on the Company’s compliance systems.
Compliance functionThe resourcing and capabilities of the Group Compliance function were kept under review, both centrally and within the businesses, throughout the year. The Committee was satisfied that the responsibilities of the Group Head of Compliance, who left the business towards the end of the year, had been assumed either by the Group General Counsel or the newly appointed Chief Compliance Officer, who are both based in our Sharjah office. It was recognised that the Compliance function should remain appropriately balanced between central roles and those embedded within the businesses. It was further acknowledged that the function should retain a degree of flexibility to enable adjustments to be made in accordance with business needs. As a result, the Committee will keep the structure under review so that additional support and more external rigour could be provided, as required.
CommunicationsAnother key area of interest for the Committee during the year was the compliance communications programme, aimed at driving the compliance message across the Group and enabling the business to proactively engage on all matters associated with compliance. This had been designed as a phased and targeted communications programme, with the intention of driving behavioural change across the Group. The first phase of the programme underlined the importance of personal responsibility and ownership and sought to socialise ethical issues. Phase two of the programme, which commenced in early 2019, will look at the communication of our compliance policies to enable greater alignment across the Group. The Committee was further encouraged to learn that there would be an increased emphasis on consequence management with regards to compliance.
While it had been the intention to review and update the Group’s Code of Conduct during 2018, it was agreed that this be deferred given that the primary focus had been on tightening processes and controls. It was proposed that the Code of Conduct be comprehensively reviewed with the business as part of the wider compliance engagement process and that a revised Code of Conduct be issued, along with a refreshed Anti-bribery and
Corruption Standard, in early 2019. It was confirmed that the revised Code of Conduct would be supported by new e-learning training modules, which would be simple, understandable and relevant, with a focus on behaviours.
Speak Up programmeAs part of the Company’s new investigations protocol, a Group investigations ‘triage’ committee was established to consider alleged breaches of the Code of Conduct, to determine severity, and to decide on the most appropriate course of action.
During the year, a total of 81 Speak Up reports were received, which were provided to the Committee, categorised by country, severity and status. All high severity cases, of which there were 11 in the year, were considered in detail, with full details of the reports shared with the Committee. These high severity cases were fully investigated, with terms of reference established for each investigation, and progress reports provided to the Committee throughout the year. Many of the calls received by the Speak Up programme were submitted anonymously, and while the reporting helpline would remain confidential, it was acknowledged that the investigation processes could sometimes be hampered if those making reports could not be contacted for further information.
Key themes arising out of the reports were highlighted and grouped together to allow the Committee to identify trends and to better understand some of the issues being raised. The Committee discussed the consequence management processes that could be deployed in respect of the outcome of an investigation, which were considered adequate and appropriate. Further details of our compliance processes, including the Speak Up facility, are provided on page 63.
Third Party Risk CommitteeAs required by the Committee’s terms of reference, minutes of the seven meetings held by the Third Party Risk Committee (TPRC) were reviewed during the year. A brief description of all third party arrangements that are within the TPRC’s remit was considered during the year. It was confirmed that the TPRC was working with the business to ensure the agreed processes were being followed.
Looking forward Overall, this has been a year for the Committee to oversee the implementation of recommended compliance enhancements. There is an understanding that the Board and leadership team must continue to demonstrate ownership of the Group’s ethical standards and the Committee is determined to help embed these standards further into the corporate culture to fully enhance the compliance framework. The Board’s belief remains that the only way the Group can continue to have a licence to operate is by applying sound and ethical business practices wherever it works. During 2019, the Committee will provide continued focus and attention to this significant area, including reviewing the updated Group’s Code of Conduct and employee communications plans.
George PiersonChairman of the Compliance and Ethics Committee 27 February 2019
Annual report and accounts 2018 Petrofac 89
Go
vernanceS
trategic rep
ort
Financial statem
ents

DIRECTORS’ REMUNERATION REPORT
Dear shareholderOn behalf of the Board I am pleased to present the Directors’ Remuneration Report for the year ended 31 December 2018.
As a Committee, we recognise the importance of clear and transparent reporting around our pay arrangements and in respect of the decisions that have been made during the year. To this end, we have added a new ‘At a Glance’ section to our report this year. This summarises how our remuneration policy was implemented during 2018, and how we intend to apply it during 2019. We have also taken on board feedback we received from stakeholders during the year on other aspects of our reporting and have made changes to respond to concerns raised, as outlined in more detail below. We hope that shareholders find the report concise and helpful.
Listening to your feedback While the Committee was pleased that the resolution on the 2017 Annual Remuneration Report (ARR) passed with a majority at our 2018 AGM, we were naturally disappointed that the voting outcome was 80.8%. Having received more than 90% support from shareholders for our ARR for a number of years, we were keen to understand why some shareholders felt unable to support last year’s report.
To this end, during 2018 and in early 2019, I met with a number of key investors and proxy advisory bodies to discuss remuneration at Petrofac and listen to their feedback. These discussions were very insightful and I would like to thank these stakeholders for taking the time to participate in this process. As a result of our engagements, it became clear that shareholders as a whole did not take issue with our remuneration framework itself, but rather would like to see more discussions and explanations of the performance outcomes and decisions taken by the Committee. We have tried to respond to specific concerns in several areas, particularly around disclosure of performance against the non-financial elements of the annual bonus and the use of discretion to modulate pay outcomes.
As a Committee, the alignment of our Executive Directors’ remuneration and that of our wider workforce with our investors is a key consideration. We are proud of the fact that 39% of our employees hold shares in the Company, creating alignment and opportunity to share in success at less senior levels. In addition, alignment is evidenced by the absence of vesting under our Performance Share Plan (PSP) for the last five years, reflecting a period in which Petrofac’s share price performance has been below what we had hoped.
Corporate governanceAs noted in the Governance Report on page 64, the Financial Reporting Council (FRC) published a new UK Corporate Governance Code (new Code) during 2018, which applies to Petrofac with effect from the 2019 financial year. The Committee welcomes the new Code and during the latter half of 2018 discussed at length how the new provisions could be implemented in the most effective manner for the Company and all of our stakeholders.
In response to the new Code, and in light of stakeholder feedback, we have made a number of changes to the way that we operate, and will continue to work towards identifying areas where our processes could be improved:
• While the Committee has always had oversight, it now formally approves remuneration for the Company’s leadership team, in addition to the Executive Directors
• We have implemented new post-employment shareholding requirements for Executive Directors, effective from 1 January 2019 – a year ahead of the regulatory deadline
Matthias BichselChairman of the Remuneration Committee
REMUNERATION COMMITTEE
Role of the Committee
• Determine and review annually, on behalf of the Board, the framework and policy for the remuneration of the Company Chairman, the Executive Directors and other members of executive management. Review the ongoing appropriateness and relevance of the remuneration policy
• Ensure that the objectives of the remuneration policies and practices support the Company’s strategy and promote long-term sustainable success. Approve the design of, and determine targets for, any performance related pay schemes and review the total annual payments made under such schemes
• Review wider workforce remuneration and related policies and the alignment of incentives and rewards with culture, taking these into account when setting the policy for Executive Director remuneration
• Review the design of all share incentive plans for approval by the Board and shareholders
• Ensure that remuneration schemes and policies enable the use of Committee discretion and independent judgement to override formulaic outcomes, taking into account Company and individual performance
• Maintain contact with principal stakeholders, as required, on matters relating to executive remuneration
Terms of referenceThe Committee reviewed and amended its terms of reference during the year to incorporate changes included within the new UK Governance Code published in July 2018. The Committee’s updated terms of reference is available on our website at www.petrofac.com.
How to use this reportWithin the report we have used different colours to differentiate between:
• Fixed elements of remuneration; and
• Variable elements of remuneration
90 Annual report and accounts 2018 Petrofac

• We have reviewed award documentation to ensure that the Committee has full discretion available to adjust pay outcomes where it is considered that they do not align with wider Company performance and circumstances
• In considering pay outcomes for the leadership team, the Committee has access to a broader and more detailed suite of information regarding remuneration-related policies within the wider workforce
• We have decided to publish the pay ratio of the Group Chief Executive to UK employees – a year ahead of the regulatory deadline
• We have agreed a policy whereby future Executive Directors will have any cash allowance in lieu of pension contributions limited to the typical contribution available to the wider workforce in their home country (in the case of the UK, this would currently be 7%)
2018 performance contextDuring 2018, the business delivered very strongly against both cashflow and net income targets, continuing our emphasis on cash conversion, cost control and project profitability. Performance on new order intake reflected the tough and very competitive market conditions. While a healthy business opportunity pipeline and strong win rate was maintained, delivery fell short against the stretching target set by the Committee at the start of the year. Operational excellence was a central theme during 2018 as the Company continued to focus on the execution of projects. The organic growth strategy delivered significant success, including contract wins in Thailand, Turkey and India and the continued focus on adjacent sectors has seen the Company being recognised as a well-established downstream player. While there were many achievements in the year, the deterioration in safety was a real cause for concern and this was taken into consideration by the Committee when determining pay outcomes.
Remuneration outcomes for 2018 – decisions madeThe annual bonus for Executive Directors is based on the achievement of Group financial targets (60%) and individual performance metrics (40%), which are based on HSSEIA and compliance, strategic, operational, and other measures to ensure key business objectives are met.
When coupled with consideration of the Executive Directors’ performance against the targets of their individual performance scorecards, annual bonus outturns for the CEO was 79.9% of maximum and for the CFO was 84.9% of maximum. However, in setting the bonus level, the Committee considered the two work-related incidents experienced in Mexico and Kuwait resulting in the fatality of three colleagues during the year. Petrofac prides itself of its safety record and performance and as a result, the Committee decided to use its discretion to reduce bonus outturns for both Executive Directors, as well as for the senior leadership team and others directly in the management line for those locations.
As a result of these reductions, the CEO was awarded a bonus of £938,000. However, he advised the Committee that taking into account the recent experience of shareholders and in view of current uncertainties, rather than taking the bonus as cash, he should receive the after-tax bonus proceeds in shares in the Company in order to demonstrate his confidence in the future.
The bonuses awarded this year to Executive Directors and members of the leadership team will also be subject to an indefinite clawback provision, in the event of any of the individuals being found guilty of a criminal offence as a result of the SFO investigation.
The performance period for the 2016 PSP cycle ended on 31 December 2018. Based on performance against the three-year relative Total Shareholder Return (TSR) and Earnings per share (EPS) targets, the awards will lapse in full. While this is naturally disappointing for employees, the Committee recognises that the PSP needs to be aligned with the interests and experience of shareholders.
Remuneration for 2019The Committee considers that the overall remuneration framework at Petrofac remains fit for purpose, and therefore we are not proposing to make any significant changes for 2019.
Mr Asfari will receive a salary increase of 3%, in line with the wider UK workforce. The Committee determined that Mr Cochran’s salary should be increased by 5%. This reflects his strong development in the role and overall performance since his appointment in October 2016. The Committee noted that after increase, this remained 6% below the salary received by the previous incumbent. The increase also intends to ensure a package that better reflects Mr Cochran’s leadership across a broader portfolio of responsibilities within Petrofac, which are critical to the Company’s future direction and success.
Recognising the recent reduction of our share price, the Committee has decided to introduce a cap on the value that can be delivered from the 2019 PSP awards. Other than in exceptional circumstances (for which the Committee would provide full justification), it is intended that the maximum value that can be delivered in the year of vesting will be limited to three times the face value of the award at grant (further details are set out on page 100).
Committee focus for 2019Our remuneration policy was approved by shareholders, with 99.6% support, at the 2017 AGM. In accordance with the expected timetable, we intend to submit our remuneration policy for shareholder consideration at the AGM to be held in 2020. In advance of this, the intention is that the Committee will perform a review of the remuneration framework during 2019 with a view to ensuring that it remains appropriate to support and drive delivery of Petrofac’s strategy over the coming years.
Following the informative consultation exercise carried out in 2018 and early 2019, we remain committed to a regular dialogue with key stakeholders and were we to propose to make any major changes to our remuneration policy, we intend to consult with shareholders in advance of the AGM. We will also continue to work through the implications of the new Code and implement any further changes identified accordingly.
The Committee looks forward to continuing engagement and to receiving your support for the Directors’ Remuneration Report at the forthcoming AGM.
Matthias BichselChairman of the Remuneration Committee 27 February 2019
Annual report and accounts 2018 Petrofac 91
Go
vernanceS
trategic rep
ort
Financial statem
ents

The following table sets out a summary of how our remuneration policy was implemented during 2018 and details how it will be implemented during 2019. A copy of the remuneration policy can be found in full on our website at www.petrofac.com.Element/Purpose and link to strategy Operation in 2018 Implementation in 2019
SalaryCore element of remuneration, paid for doing the expected day-to-day job. To attract and retain appropriate talent and to be market competitive
Base salaries for 2018 were: In 2019 Executive Directors will receive a salary increase of 3-5%. Further details are set out on page 99. Base salaries for 2019 will be:
Ayman Asfari £670,000 Ayman Asfari £690,000Alastair Cochran £412,000 Alastair Cochran £432,600
Cash allowance in lieu of pension and other benefitsProvide employees with an allowance for benefits and retirement planning
Cash allowances for 2018 were: Cash allowances for 2019 will be unchanged from 2018.
For future Executive Directors, the cash allowance in lieu of pension will be capped at the level available to Petrofac employees in their home country (in the UK, this would currently be capped at 7% of salary).
Ayman Asfari £70,000Alastair Cochran £70,000
BenefitsProvide employees with market competitive benefits
The benefit framework in 2018 included private health insurance and appropriate life assurance.
There will be no changes to the benefit framework in 2019.
Annual bonusIncentivise delivery of the business plan on an annual basis
Rewards performance against key performance indicators which are critical to the delivery of our business strategy
The maximum annual bonus opportunity for 2018 was 200% of salary. The table below sets out details of the performance measures:
The maximum annual bonus for 2019 will be unchanged at 200% of salary. The performance measures for 2019 will be the same as 2018:
Measure Weighting Performance Measure Weighting
Group Net Income 20% 94.4% Financial measures
Group Net Income 20%
Group Order Intake 20% 30.1% Group Order Intake 20%
Group Free Cash Flow 20% 100% Group Free Cash Flow 20%
Total 60% 74.8% Non-financial measures
Balanced scorecard 40%
The remaining 40% of the annual bonus comprised a balanced scorecard. Further details on some of the individual metrics within the balanced scorecard for the Executive Directors are set out on page 94.
The Committee reviewed outcomes and determined to use its discretion to reduce the formulaic bonus outcomes. Further details are set out on page 94. Resultant individual bonuses for 2018 were 79.9% of maximum and 84.9% of maximum for the CEO and CFO respectively. In line with our shareholding guidelines, Alastair Cochran was required to invest 33% of his post-tax bonus into Petrofac shares. In addition, Ayman Asfari will voluntarily invest his post-tax bonus into Petrofac shares.
Where Executive Directors have not reached their shareholding guideline, they will be required to invest 33% of the post-tax bonus into Petrofac shares.
Performance Share Plan Incentivise Executive Directors’ performance over the longer term
Rewards the delivery of targets linked to the long-term strategy of the business, and the creation of shareholder value over the longer term
Awards grantedIn 2018, Executive Directors received awards of 200% of base salary. Awards will vest depending on the following performance measures:
Awards to be grantedFor 2019, Executive Directors will receive awards of 200% of base salary. Awards will vest depending on the same performance measures:
Measure Weighting Measure Weighting
TSR relative to a comparator group 70% TSR relative to a comparator group 70%
Strategic measures 30% Strategic measures 30%
Any vested post-tax shares will be subject to an additional two-year holding period.
Awards vestingThe performance conditions for the 2016 PSP awards were not achieved and, as a result, the awards will lapse in full on 6 March 2019.
Any vested post-tax shares will be subject to an additional two-year holding period.
In recognition of the Group’s current share price, other than in exceptional circumstances (for which the Committee would provide written justification), the value of any vested shares from this award will be limited to three times the face value of the award at grant.
Shareholding guidelinesAligns Executive Directors withshareholders’ interests
Ayman Asfari has met his shareholding guideline of 300% of base salary.
Alastair Cochran joined the Board in October 2016 and is working towards meeting his shareholding guideline of 200% of base salary.
Employment shareholding guidelines remain unchanged at start of 2019.
Executive Directors will also be subject to post-cessation shareholding guidelines at departure. Further details are set out on page 100.
The Annual Report on Remuneration, beginning on page 93, provides more detail on our policy implementation.
AT A GLANCE
DIRECTORS’ REMUNERATION REPORTCONTINUED
92 Annual report and accounts 2018 Petrofac

Annual Report on Remuneration
Looking backwardsThe information presented from this section, until the relevant note on page 97, represents the audited section of this report.
Single total figure of remunerationThe following table sets out the total remuneration for Executive Directors for the year ended 31 December 2018, with prior year figures also shown. All figures are presented in US dollars.
Executive Director1
Base salary (a)
US$000
Taxable benefits
(b) US$000
Cash in lieu of pension and other benefits
(c) US$000
Annual bonus
(d) US$000
Long-term incentives
(e) US$000
Total US$000
2018 2017 2018 2017 2018 2017 2018 2017 2018 2017 2018 2017
Ayman Asfari 898 840 1 1 94 90 1,257 1,015 – – 2,250 1,946
Alastair Cochran 552 517 1 1 94 90 879 728 – – 1,526 1,336 Notes to the table1 The Executive Directors are paid in sterling. All amounts have been translated to US dollars based on the prevailing rate at the date of payment or award, with the exception of the bonus
amounts, which have been translated using the average exchange rate for 2018 of £1:US$1.33970.
Further notes to the table – methodology(a) Salary and fees – the cash paid in respect of 2018.(b) Benefits – the taxable value of all benefits paid in respect of 2018, including private health insurance and appropriate life assurance.(c) Cash in lieu of pension and other benefits – our Executive Directors receive a cash allowance in place of benefits including pension contributions and car allowances but without an
explicit allocation to each. This reflects the application of the Company’s remuneration policy. Directors do not receive specific pension contributions from the Company.(d) Annual bonus – cash bonus paid in respect of 2018. For Mr Asfari, the full after tax proceeds from this award will be used to purchase shares in the Company on his behalf. (e) Long-term incentives – as a result of the performance over the period 2016-2018, the 2016 PSP will lapse in full on 6 March 2019.
Additional disclosures in respect of the single figure tableAnnual bonusOur annual bonus framework is intended to ensure an increased transparency of outcomes, in line with best practice developments. Financial elements comprise 60% of the framework, while performance against a balanced scorecard of measures comprises the remaining 40%. The table below sets out the outcomes for the Executive Directors against our financial targets:
Performance targets
Measure WeightingThreshold
US$mTargetUS$m
MaximumUS$m
Actual 2018 outcome
US$mPay-out as % of maximum
Group net profit 1 20% 277 321 357 353 94.4%
Group order intake 20% 4,991 6,241 7,241 4,997 30.1%
Group free cash flow2 20% (353) (178) (3) 293 100%
As a % of maximum 74.8%
As a % of salary earned (out of 120% for financial elements)
89.8%
1 Measured as Group business performance before exceptional items and certain re-measurements. 2 The Group free cash flow measure for the purposes of the annual bonus performance target is a management reporting metric calculated as free cash flow (see note A6 in Appendix A to
the consolidated financial statements) minus proceeds from disposals (US$506 million), minus purchase of shares by the Employee Benefit Trust (US$44 million), minus certain other cash flow items (US$78 million).
As the table above highlights, our financial performance resulted in a pay-out against the financial measures of 74.8% of maximum (89.8% of salary).
This annual bonus out-turn reflects the continuing strong progress the business has made on cash conversation and the positive delivery on our net profit goals. The new order intake exceeded the threshold targets that were set at the start of the year and represents a good outcome in absolute terms given the current competitive marketplace and high win rate.
Annual report and accounts 2018 Petrofac 93
Go
vernanceS
trategic rep
ort
Financial statem
ents

The remainder of the annual bonus (40%) is subject to a balanced scorecard of measures, aligned with our business plan and key corporate objectives. The scorecard ensures that the Committee considers not only the financial performance measures achieved but also the wider health of the Company, safeguarding future years’ performance, and the manner and behaviours by which our performance has been delivered. Under each area of the scorecard, performance is assessed against defined measures and outcomes.
Ayman Asfari The individual performance measures (balanced scorecard) for Ayman Asfari was focused on four key measures: HSSEIA and Compliance (15% weighting), Operational and Project delivery, Capability, Strategy and Growth (each with an 8.33% weighting):
• HSSEIA and Compliance: the Compliance and HSSEIA agenda was further embedded across the organisation, with high visibility and determined leadership being demonstrated throughout the year. The environmental performance continued to see improvements. While the safety performance expressed in lost time incidents and restricted work remained level compared with prior years, the year was significantly impacted by three fatalities
• Operations/Project Delivery: The level of variation orders was reduced to a level of US$259m, significantly exceeding expectations through personal interventions and by providing guidance to commercial strategies. Key negotiations with clients were led by Mr Asfari. Furthermore, excellent progress was made in monetising the Company’s non-core assets and reducing the footprint of the IES division
• Capability: Market conditions remained under pressure during 2018 but despite this, and the challenging environment being faced by the Company, the effectiveness of Petrofac’s employees and efficiencies were enhanced through a new streamlined organisation. A strong pipeline of future leaders has been developed
• Strategy and Growth: Through a number of commercial interventions, the Company’s footprint in its core business was widened into new geographies, including wins in Thailand and India, and product offerings were broadened, with more awards in downstream projects. Rapid progress of the digitalisation agenda was seen, with first concepts and products being trialled to demonstrate the extent of the available opportunity. Pilot initiatives have proved successful, resulting in the opportunity of bringing a suite of digital products rapidly to the market and create competitive advantage
Alastair CochranThe individual performance measures (balanced scorecard) for Alastair Cochran was focused on four key measures: HSSEIA and Compliance, Operational and Project delivery, Capability, Strategy and Growth (each with a 10% weighting):.
• HSSEIA and compliance: the Compliance and HSSEIA agenda was further embedded across the organisation, with high visibility and determined leadership being demonstrated throughout the year. The environmental performance continued to see improvements. While the safety performance expressed in lost time incidents and restricted work remained level compared with prior years, the year was significantly impacted by three fatalities
• Operational and project delivery: Drove and achieved the objective of reducing capital intensity. The AVO balance was below target at year end. Significant divestments were delivered, with US$773m achieved from the divestment programme. Mr Cochran had a very good year with strong cash conversion driving the achievement of net cash, two years ahead of schedule. A strong liquidity position was maintained throughout 2018 and the Company’s net debt position was significantly improved
• Capability: Mr Cochran re-engineered and enhanced the Group Finance and Group IT functions, with a number of significant personnel appointments made to ensure robust and effective functions are in place, and to provide greater strength in depth for future succession
• Strategy/growth: Significant improvements achieved throughout the year, including strengthening and enhancing the IT infrastructure, developing a robust defence against cyber-attacks. Enhanced the Company’s digital capabilities for commercial offerings to clients.
The Committee reviewed the final outcomes of bonus against Petrofac’s overall performance and the individual performance of Ayman Asfari and Alastair Cochran, which were assessed as having delivered a very good to outstanding outcome.
Discretion The Committee reviewed the final bonus outcomes against both Petrofac’s overall performance and the Executive Director’s individual performance. Notwithstanding the mathematical outcomes of the strong financial and personal performance measures, the Committee was mindful of the tragic loss of three lives in two accidents during the year. As a result, the Committee determined to use its discretion to reduce the non-financial element of the performance bonus of the Group Chief Executive by £133,832 and that of the Chief Financial Officer by £43,728. This discretion was also applied to members of the leadership team and others directly in the management line for those specific locations. Based on aggregate performance against the financial metrics and their balanced scorecard and reflecting the Committee’s application of discretion, the table below provides an overview of the annual bonuses received by each Executive Director during 2018:
Performance
Director
Financial element
(60%)
Balanced scorecard element
(40%) Overall
Mathematical outcome of bonus
calculation
Discretion adjustment
applied
2018 annual bonus after
discretionAs a % of
base salary
Ayman Asfari 74.8% of maximum 87.5% of maximum 79.9% of maximum £1,070,660 £133,832 £936,828 139.8%
Alastair Cochran 74.8% of maximum 100% of maximum 84.9% of maximum £699,643 £43,728 £655,915 159.2%
The bonuses awarded for 2018 to Executive Directors and to members of the leadership team will also be subject to an indefinite clawback provision in the event of any of the individuals being found guilty of a criminal offence as a result of the SFO investigation.
DIRECTORS’ REMUNERATION REPORTCONTINUED
94 Annual report and accounts 2018 Petrofac

Bonus for Group Chief ExecutiveThe Company issued a press release on 7 February 2019 relating to the UK Serious Fraud Office (SFO) investigation (full details can be found at www.petrofac.com). This announcement had a material adverse impact on the Company’s share price. As a result, the Group Chief Executive proposed that taking into account the experience of shareholders, it would be appropriate for his bonus to be awarded as shares in the Company rather than cash, further demonstrating his confidence in the future of Petrofac. As a result, the Company will use the post-tax proceeds of Mr Asfari’s bonus for 2018 to purchase shares in the Company on his behalf.
Performance Share Plan (PSP)The performance conditions for the 2016 award are set out below. These targets were not achieved and, as a result, the award will lapse in full on 6 March 2019.
EPS Relative TSR 1
Vesting level Target range 2 Outcome Target range 2 Outcome
0% of maximum 0.0% or less
Underperformed by 7.54%
Less than the indexUnderperformed
index by 26%30% of maximum 2.5% Equal to the index
100% of maximum 7.5% or more 25% out-performance of index
Vesting 0% of maximum 0% of maximum
Overall vesting 0% of maximum
1 The comparator group for these awards was Aker Solutions ASA, AMEC Foster Wheeler, Baker Hughes, Chicago Bridge & Iron Co., Fluor Corporation, Halliburton, Jacobs Engineering, JGC, Saipem, Schlumberger, SNC-Lavalin Group, Technip, Tecnicas Reunidas, Wood Group (John) and WorleyParsons.
2 Straight-line vesting operates between these points.
Scheme interests awarded during the financial yearPerformance Share Plan awardsAs detailed in our remuneration policy, PSP awards are granted over Petrofac shares representing an opportunity to receive ordinary shares if performance conditions are met over the relevant three-year period. The number of shares under award is determined by reference to a percentage of base salary. Details of the actual number of shares granted are set out on page 97. The following table provides details of the awards made under the PSP on 27 March 2018. Performance for these awards is measured over the three financial years from 1 January 2018 to 31 December 2020.
Type of award Face value Face value
(% of salary)Threshold vesting
(% of face value)Maximum vesting
(% of face value)End of
performance period
Ayman Asfari Performance shares
£1,339,999 200%25% 100% 31 Dec 20
Alastair Cochran £824,000 200%
Awards were made based on a share price of 517.90 pence, and the face values shown have been calculated on this basis. This share price represents the three-day average share price up to 27 March 2018.
TSR element70% of the 2018 award is based on relative TSR. The comparator group and vesting schedule for 2018 are the same as those used for the 2019 awards, as set out on page 100, with the exception that during 2018 we added McDermott International, Inc. in place of Chicago Bridge & Iron Co. following their merger in May 2018.
Strategic elementThe remaining 30% of the 2018 award is based on a basket of key strategic measures. We believe these measures align our incentives with the delivery of critical long-term strategic goals. For the 2018 awards, the measures focused on (i) protecting our core E&C business; (ii) growing our reimbursable services offering; (iii) reducing capital intensity by improving working capital and cash management; and (iv) delivering “back to our core” strategy. Each measure is subject to stretching underlying financial targets for the three-year period. At this stage, the Committee considers the precise targets for 2018 to be commercially sensitive. However, we intend to provide detailed disclosure of targets and performance against those targets following the end of the performance period.
The key strategic priorities and associated measures for the 2018 award are as follows:
Strategic priorities Performance measure
2018-2020
Protecting our core E&C business E&C net income
Protecting and growing our reimbursable services offering EPS net income
Reducing capital intensity Divestment proceeds
Delivering ‘back to our core’ strategy Cash conversion
Annual report and accounts 2018 Petrofac 95
Go
vernanceS
trategic rep
ort
Financial statem
ents

Single total figure of remuneration for the Chairman and Non-executive DirectorsThe following table sets out the total remuneration for the Chairman and Non-executive Directors for the year ended 31 December 2018, with prior year figures also shown. All figures are presented in US Dollars.
Committee membership and other responsibilitiesFees
US$’000
Audit Committee
Compliance and Ethics Committee
Nominations Committee
Remuneration Committee Other 2018 2017
Non-executive Directors 5
René Médori 1,3 Chairman Chairman of the Board 313 114
Matthias Bichsel 1,3 Member Member Member Chairman Senior Independent Director 132 88
Andrea Abt 1 Member Member Member 100 88
George Pierson Member Chairman Member 120 96
Sara Akbar 2 Member Member 100 –
David Davies 1,2 Chairman Member 73 –
Former Directors
Rijnhard van Tets 1,4 Chairman of the Board 153 381
Notes to the table1 Non-executive Directors are paid in either sterling, euro or US dollars. All amounts above have been translated to US dollars based on the prevailing rate at the date of payment..2 Sara Akbar was appointed as a Director on 25 January 2018. David Davies was appointed as a Director on 18 May 2018. The 2018 figures reflect the period from their respective dates
of appointment to 31 December 2018.3 René Médori was Senior Independent Director (SID) and received the fee for this position from 1 January 2018 until his appointment as Chairman on 18 May 2018. Matthias Bichsel
received the SID fee from 19 May 2018 until the end of the year. 4 Rijnhard van Tets stepped down from the Board and ceased to be Chairman from 18 May 2018. The 2018 figure reflects the period from 1 January 2018 to this date.5 Non-executive Directors receive a basic fee of £75,000 per annum of which £5,000 per quarter is used to purchase Petrofac Limited shares. Additional fees of £15,000 per annum are
paid for acting as either the Chairman of a Board Committee or as the Senior Independent Director. The Chairman, receives a fee of £320,000 per annum of which £20,000 per quarter is used to purchase Petrofac Limited shares. These fees were increased in January 2018 at which time it was agreed that there would be no further increase for the next three years.
Statement of Directors’ shareholding and share interestsDirectors’ shareholdings held during the year and as at 31 December 2018 and share ownership guidelinesThe number of shares held by Directors during the year and as at 31 December 2018 are set out in the table below, along with the progress against their respective shareholding requirements:
% of salary held under shareholding guidelines
Shares owned outright at
31 December 20183
Interests in share incentive schemes,
awarded without performance conditions
at 31 December 2018
Interests in share incentive schemes, awarded subject to
performance conditions at 31 December 2018
Shares owned outright at
31 December 2017
DirectorAyman Asfari 1 > 300% 64,982,226 – 753,166 62,958,426 Alastair Cochran 2 < 200% 40,936 16,140 385,463 –Matthias Bichsel – 2,591 – – –René Médori – 6,110 – – –Andrea Abt – 2,591 – – –George J Pierson – 2,591 – – –Sara Akbar – 2,591 – – –David Davies – 16,823 – – –
Former Director
Rijnhard Van Tets – 100,000 – – 100,000 1 Ayman Asfari is expected to build up a shareholding of three times salary. He substantially exceeds this shareholding requirement.2 Alastair Cochran is expected to build up a shareholding of two times salary. He was appointed as a Director on 20 October 2016 and is yet to fulfil his shareholding guideline obligation in full. 3 Rijnhard van Tets ceased to be a Director on 18 May 2018. The shares owned outright reflect the position on the date he stepped down from the Board.
DIRECTORS’ REMUNERATION REPORTCONTINUED
96 Annual report and accounts 2018 Petrofac

Share interests – share awards at 31 December 2018 Share awards held at the year end, including awards of shares made to Executive Directors during 2018, are shown in the table below:
Director and date of grant Plan
Number of shares under award at
31 December2017 1
Shares granted in year
Dividend shares
grantedin year 2
Shares lapsed in year
Shares vested in year
Total number of shares under award at
31 December 2018 (or at date of leaving)
Dates from which shares ordinarily vest
Ayman Asfari6 March 2015 PSP 176,149 – – 176,149 – – 06 March 20186 March 2016 PSP 159,664 – 7,865 – – 167,529 06 March 201913 September 2017 PSP 299,407 – 14,748 – – 314,155 06 March 202027 March 2018 PSP – 258,737 12,745 – – 271,482 06 March 2021
753,166
Alastair Cochran6 October 2016 RSP 5 46,137 – 1,258 – 31,255 16,140 06 October 20176 October 2016 PSP 24,014 – 1,183 – – 25,197 06 March 201913 September 2017 PSP 184,249 – 9,076 – – 193,325 06 March 202027 March 2018 PSP – 159,104 7,837 – – 166,941 06 March 2021
401,6031 The award amounts disclosed under the PSP are the maximum number that may vest if all performance conditions attached to the awards are satisfied in full.2 Dividends awarded on shares granted under the share plans are reinvested to purchase further shares.3 Following the end of the three-year performance period in respect of the March 2015 PSP award, the performance conditions were not satisfied and the award lapsed in full on 6 March 2018.4 Shares awarded on 6 March 2016 did not satisfy performance conditions and therefore no awards will vest on 6 March 2019.5 Shares awarded under the Restricted Share Plan on 6 October 2016 are not subject to performance conditions and will vest, subject, inter alia, to continued employment, in equal annual
tranches over three years from the date of grant in accordance with the scheme rules and the Company’s Share Dealing Code requirements.
This represents the end of the audited section of the report.
Historical TSR performance and Group Chief Executive remuneration outcomesThe chart below compares the TSR performance of the Company over the past ten years with the TSR of the FTSE 250 Index. This index has been chosen because it is a recognised equity market index of which Petrofac has been a member since December 2014. The table below the chart summarises the Group Chief Executive single figure for total remuneration, annual bonus payouts and LTIP vesting levels as a percentage of maximum opportunity over this period.
TSR chart – one month average basis
2009 2010 2011 2012 2013 2014 2015 2016 2017 20192018
Petrofac FTSE 250
600
500
400
300
200
100
0
TSR
(reb
ased
to 1
00on
1 J
anua
ry 2
009)
Source: Datastream
Group Chief Executive 2009 2010 2011 2012 2013 2014 2015 2016 2017 2018
Group Chief Executive single figure of remuneration (US$’000)
3,501 4,889 6,088 4,663 2,658 1,245 1,162 1,817 1,946 2,250
Annual bonus payout (as a % of maximum opportunity)
100% 100% 75% 81% 59% 0% 0% 47.5% 60.4% 69.9%
PSP vesting out-turn (as a % of maximum opportunity)
100% 100% 100% 100% 13% 0% 0% 0% 0% 0%
Annual report and accounts 2018 Petrofac 97
Go
vernanceS
trategic rep
ort
Financial statem
ents

Pay ratios of Group Chief Executive to UK employeesIn 2018, legislation was introduced in the UK requiring companies to publish information on the pay ratio of the Group Chief Executive to UK employees. We have chosen to voluntarily provide pay ratio data in respect of 2018. The table below illustrates the pay ratio of the Group Chief Executive to the 25th, median and 75th percentile of the total remuneration of the full-time equivalent UK employees.
Financial Year ending Method25th percentile pay ratio
(lower quartile)50th percentile pay ratio
(median)75th percentile pay ratio
(upper quartile)
31 December 2018 Option A 1:33 1:25 1:23
The Group Chief Executive’s total remuneration is calculated on the same basis as the single figure of remuneration table set out on page 93. The lower, median and upper quartile employee’s remuneration was calculated on full-time equivalent data as at 1 December 2018. Option A was chosen as it is considered to be the most accurate way of identifying the best equivalents of 25th, 50th and 75th percentile figures and it is also aligned with best practice and investor expectations. In reviewing the employee pay data, the Committee is satisfied that the individuals identified within each category appropriately reflect the employee pay profile at those quartiles, and that the overall picture presented by the ratios is consistent with our pay, reward and progression policies for UK employees.
The following table provides further information on the total pay figures used for each quartile employee and the salary component within this:
Financial year ending Element of pay CEO remuneration 25th percentile pay ratio
(lower quartile)50th percentile pay ratio
(median)75th percentile pay ratio
(upper quartile)
31 December 2018 Salary £670,000 £47,430 £61,264 £68,201
Total remuneration £1,679,000 £51,239 £66,041 £73,464
In assessing our pay ratio against the wider market and against our industry peers, we would expect that it is currently towards the lower end of the range. We are proud that this reflects both the high-skilled and technically challenging nature of many of our roles, as well as the emphasis that we place on fair pay throughout the Group. The Committee would highlight that the ratio might be expected to increase somewhat in future years should the level of vesting under the PSP increase (the 2016 award lapsed in full).
Percentage change in remuneration of the Group Chief ExecutiveThe table below illustrates the increase in salary, benefits (excluding cash allowance in lieu of pension) and annual bonus for the Group Chief Executive and that of a representative group of the Company’s employees. For these purposes, we have used all UK-based employees as the comparator group, as this represents the most appropriate comparator group for reward purposes for our UK-based Group Chief Executive.
% change in base salary1
2018/2017% change in benefits1
2018/2017 % change in annual bonus2
2018/2017
Group Chief Executive 3% 0% 20%
All UK-based employees 2.5% 0% 269.5%1 Base salary is paid in sterling but translated into US dollars based on the prevailing rate at the date of payment (as set out on page 93). The percentage increase reflects the net sterling
increase year-on-year and excludes FX movements. The 3% paid to the Group Chief Executive was in line with wider workforce increases across the Group. However, the percentage change differential in base salary for the wider UK workforce relates to the predominant UK business unit not meeting its financial targets in 2017.
2 The percentage change differential in annual bonus for the wider UK workforce relates to the predominant UK business unit not meeting its financial targets in 2017.
DIRECTORS’ REMUNERATION REPORTCONTINUED
98 Annual report and accounts 2018 Petrofac
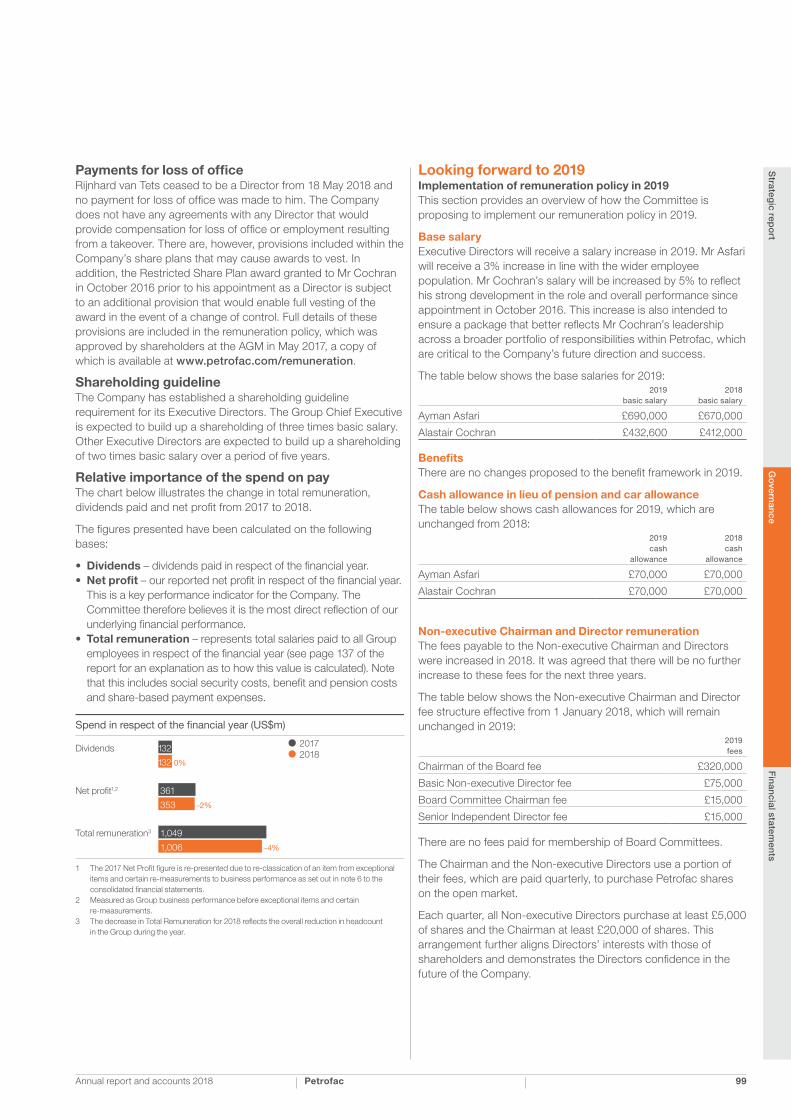
Payments for loss of officeRijnhard van Tets ceased to be a Director from 18 May 2018 and no payment for loss of office was made to him. The Company does not have any agreements with any Director that would provide compensation for loss of office or employment resulting from a takeover. There are, however, provisions included within the Company’s share plans that may cause awards to vest. In addition, the Restricted Share Plan award granted to Mr Cochran in October 2016 prior to his appointment as a Director is subject to an additional provision that would enable full vesting of the award in the event of a change of control. Full details of these provisions are included in the remuneration policy, which was approved by shareholders at the AGM in May 2017, a copy of which is available at www.petrofac.com/remuneration.
Shareholding guideline The Company has established a shareholding guideline requirement for its Executive Directors. The Group Chief Executive is expected to build up a shareholding of three times basic salary. Other Executive Directors are expected to build up a shareholding of two times basic salary over a period of five years.
Relative importance of the spend on payThe chart below illustrates the change in total remuneration, dividends paid and net profit from 2017 to 2018.
The figures presented have been calculated on the following bases:
• Dividends – dividends paid in respect of the financial year.• Net profit – our reported net profit in respect of the financial year.
This is a key performance indicator for the Company. The Committee therefore believes it is the most direct reflection of our underlying financial performance.
• Total remuneration – represents total salaries paid to all Group employees in respect of the financial year (see page 137 of the report for an explanation as to how this value is calculated). Note that this includes social security costs, benefit and pension costs and share-based payment expenses.
132
132
361
353
1,049
1,006
0%
-2%
-4%
Spend in respect of the �nancial year (US$m)
Dividends
Net profit1,2
Total remuneration3
20172018
1 The 2017 Net Profit figure is re-presented due to re-classication of an item from exceptional items and certain re-measurements to business performance as set out in note 6 to the consolidated financial statements.2 Measured as Group business performance before exceptional items and certain re-measurements.3 The decrease in Total Remuneration for 2018 reflects the overall reduction in headcount in the Group during the year.
Looking forward to 2019Implementation of remuneration policy in 2019This section provides an overview of how the Committee is proposing to implement our remuneration policy in 2019.
Base salaryExecutive Directors will receive a salary increase in 2019. Mr Asfari will receive a 3% increase in line with the wider employee population. Mr Cochran’s salary will be increased by 5% to reflect his strong development in the role and overall performance since appointment in October 2016. This increase is also intended to ensure a package that better reflects Mr Cochran’s leadership across a broader portfolio of responsibilities within Petrofac, which are critical to the Company’s future direction and success.
The table below shows the base salaries for 2019:
2019
basic salary 2018
basic salary
Ayman Asfari £690,000 £670,000
Alastair Cochran £432,600 £412,000
BenefitsThere are no changes proposed to the benefit framework in 2019.
Cash allowance in lieu of pension and car allowanceThe table below shows cash allowances for 2019, which are unchanged from 2018:
2019 cash
allowance
2018 cash
allowance
Ayman Asfari £70,000 £70,000
Alastair Cochran £70,000 £70,000
Non-executive Chairman and Director remunerationThe fees payable to the Non-executive Chairman and Directors were increased in 2018. It was agreed that there will be no further increase to these fees for the next three years.
The table below shows the Non-executive Chairman and Director fee structure effective from 1 January 2018, which will remain unchanged in 2019:
2019 fees
Chairman of the Board fee £320,000
Basic Non-executive Director fee £75,000
Board Committee Chairman fee £15,000
Senior Independent Director fee £15,000
There are no fees paid for membership of Board Committees.
The Chairman and the Non-executive Directors use a portion of their fees, which are paid quarterly, to purchase Petrofac shares on the open market.
Each quarter, all Non-executive Directors purchase at least £5,000 of shares and the Chairman at least £20,000 of shares. This arrangement further aligns Directors’ interests with those of shareholders and demonstrates the Directors confidence in the future of the Company.
Annual report and accounts 2018 Petrofac 99
Go
vernanceS
trategic rep
ort
Financial statem
ents

Annual bonusThe maximum annual bonus opportunity for Executive Directors will remain at 200% of base salary for 2019.
The table below sets out the financial elements, which comprise 60% of the total annual bonus: Financial measures Weighting in total bonus
Group Net Income 1 20%
Group Order Intake 20%
Group Free Cash Flow 20%1 Measured as Group business performance before exceptional items and certain
re-measurements.
In line with 2018, the remaining 40% of the annual bonus will comprise a balanced scorecard, providing the Committee with the ability to consider not only financial achievements, but also the wider health of the Company and the manner and behaviours by which our performance has been delivered. The scorecard includes measures related to health & safety and compliance, strategic and growth, operational and project delivery and capability objectives. We will provide disclosure of 2019 targets at the end of the performance year.
Where any participant has not reached the agreed shareholding guideline target, they will be required to invest one-third of their post-tax bonus into Petrofac shares until the guideline is reached. The annual bonus is subject to malus and clawback provisions as set out in more detail in our remuneration policy. The Committee also retains the option to apply an additional discretion as deemed appropriate, based on the performance of the Company or the relevant Director during the financial year under review.
Performance Share PlanFor 2019, it is proposed that both Executive Directors will receive an award of 200% of base salary. Recognising the recent reduction in share price, the Committee has decided to introduce a cap on the value that can be delivered from the 2019 PSP award. Other than in exceptional circumstances (for which the Committee would provide written justification), it is intended that the maximum value that can be delivered in the year of vesting will be limited to three times face value of the award at grant. A similar cap will apply to awards made to the Company’s leadership team.
There are no changes to the PSP framework in 2019. However, the Committee has taken the opportunity to review and update the TSR comparator group as a result of corporate activity during the year. Following the merger of Chicago Bridge & Iron Company and McDermott International, Inc, it was agreed that the newly merged company be added to the TSR group. In addition, new strategic measures are being proposed that are better aligned with the Group’s new strategic priorities.
1) TSR element (70% of award)The tables below set out the TSR comparator group for the purposes of the 2019 awards and the vesting schedule used to determine the performance outcome:
Comparator group
Daelim Industrial Co KBR, Inc. Technip FMC
Fluor Corporation Maire Tecnimont Tecnicas Reunidas
GS Engineering & Construction Corp
McDermott International, Inc
Worley Parsons
Hyundai E&C Saipem Wood Group (John)
JGC Corporation Samsung Engineering Co., Ltd.
Vesting schedule
Three-year performance against the Comparator groupVesting as % of maximum
Performance equal to median 25%
Performance equal to upper quartile 100%
Straight-line vesting operates between the points above
2) Strategic element (30% of award)The remaining 30% of the 2019 PSP award will be subject to three-year strategic performance conditions. For the 2019 awards, the Committee has set stretching targets to five key strategic priorities. The key strategic priorities and associated measures for the 2019 award are as follows:
Strategic priorities Performance measure
2019-2021
Protecting our core E&C business E&C net margin
Best in class delivery Global cost challenge savings
Positioning for a return to growth New orders
Improving operational efficiencies Cash conversion
Enhancing returns ROCE
Under each strategic priority, vesting for threshold performance will be 25% of maximum with straight-line vesting up to 100% of maximum. At this stage, the Committee considers that the precise targets for the 2019-21 period are commercially sensitive. However, we intend to provide detailed disclosure of targets and performance against those targets following the end of the performance period.
Any vested post-tax shares will be subject to an additional two-year holding period. In addition, where participants have not reached the shareholding guideline target they will be required to continue to hold any shares after the holding period until the guideline is reached. PSP awards are subject to malus and clawback provisions as set out in more detail in our remuneration policy.
Post-employment shareholding guidelineIn response to the new UK Corporate Governance Code, the Committee has implemented post-employment shareholding guidelines for its Executive Directors. Effective from 1 January 2019, Executive Directors will be required to maintain a shareholding in the Company for a period of 24 months following departure. The post-employment shareholdings are as follows:
For the first 12 months following departure
100% of their shareholding guideline1
For the second 12 months following departure
50% of their shareholding guideline1
1 or actual shareholding at the point of departure, if lower
DIRECTORS’ REMUNERATION REPORTCONTINUED
100 Annual report and accounts 2018 Petrofac

Awards granted under any Company long-term incentive plan, which have vested but are subject to a holding period, will count towards the guideline (on a net of tax basis). The Company also intends to implement a suitable mechanism by which to enforce the application of these post-employment guidelines.
Consideration by the Directors of matters relating to Directors’ remuneration
Support for the CommitteeDuring the year, the Committee received independent advice on executive remuneration matters from Deloitte LLP (Deloitte). Deloitte were formally appointed as advisers by the Committee in October 2005. Deloitte is a member of the Remuneration Consultants Group and, as such, voluntarily operates under a code of conduct in relation to executive remuneration consulting in the UK.
The Committee has reviewed the advice provided by Deloitte during the year and is satisfied that it has been objective and independent. Total fees received by Deloitte in relation to the remuneration advice provided to the Committee during 2018 amounted to £88,550 based on the required time commitment. During 2018, Deloitte also provided tax services to the Company.
The individuals listed in the table below, none of whom were Committee members, materially assisted the Committee in considering executive remuneration and attended at least part of one meeting, by invitation, during the year:Attendee Position Comments
René Médori Chairman of Board To provide context for matters under discussion
Rijnhard van Tets Former Chairman of Board
Ayman Asfari Group Chief Executive
Alastair Cochran Chief Financial Officer
Des Thurlby Group Director of HR
Alison Broughton Secretary to the Board Secretary to Committee
William Cohen Deloitte LLP Adviser
None of the individuals attended the part of any meeting in which their own compensation was discussed.
GovernanceThe Board and the Committee consider that, throughout 2018 and up to the date of this report, the Company has complied with the provisions set out in the UK Corporate Governance Code relating to Directors’ remuneration. In addition, relevant guidelines issued by prominent investor bodies and proxy voting agencies have been presented to and considered by the Committee during its discussions. The Committee endeavours to consider executive remuneration matters in the context of alignment with risk management and, during the year, had oversight of any related factors to be taken into consideration. The Committee believes that the remuneration arrangements in place do not raise any health and safety, environmental, social or ethical issues, nor inadvertently motivate irresponsible behaviour.
Significant consideration was given during the year to the areas introduced by the new UK Corporate Governance Code published in July 2018. As detailed on page 91, the Committee has committed to bring forward two items ahead of the 2020 implementation deadline – the reporting of the CEO pay ratio and the introduction of a post-employment shareholding requirement for Executive Directors. The Committee will continue to review how the new provisions can be implemented in the most effective manner for the Company and all our stakeholders and what changes, if any, are subsequently required to be made to the remuneration policy.
External board appointmentsExecutive Directors are normally entitled to accept one non-executive appointment outside the Company with the consent of the Board. Any fees received may be retained by the Director. As at the date of this report, no Executive Director holds an externally paid non-executive appointment.
Shareholder votingThe table below outlines the result of the advisory vote of the 2017 Directors’ Remuneration Report at the 2018 AGM.
Annual Report on RemunerationNumber of votes cast excluding abstentions For Against Abstentions
225,338,907 182,236,184 43,102,723 13,826
80.87% 19.13%
The table below outlines the result of the advisory vote of the 2016 Policy Report received at the AGM held on 11 May 2017. The remuneration policy will be subject to shareholder review in 2020.
Remuneration Policy ReportNumber of votes cast (excluding abstentions) For Against Abstentions
236,861,544 236,001,061 860,483 177,699
99.64% 0.36%
Availability of documentationService contracts and letters of appointment for all Directors are available for inspection by any person at our registered office in Jersey and at our corporate services office in London. They will also be available for inspection during the 30 minutes prior to the start of our AGM to be held in London on 3 May 2019.
Annual General MeetingAs set out in my statement on page 90, our Annual Report on Remuneration will be subject to an advisory shareholder vote at the AGM to be held on 3 May 2019.
On behalf of the Board
Matthias BichselChairman of the Remuneration Committee 27 February 2019
Annual report and accounts 2018 Petrofac 101
Go
vernanceS
trategic rep
ort
Financial statem
ents

DIRECTORS’ STATEMENTS
Going concernThe Company’s business activities, together with the factors likely to affect its future development, performance and position, are set out in the Strategic Report on pages 10 to 17. The financial position of the Company, its cash flows, liquidity position and borrowing facilities are described in the Financial Review on pages 40 to 43. In addition, note 33 to the financial statements includes the Company’s objectives, policies and processes for managing its capital; its financial risk management objectives; details of its financial instruments and hedging activities; and its exposures to credit risk and liquidity risk.
The Company has considerable financial resources together with long-term contracts with a number of customers and suppliers across different geographic areas and industries. Consequently, the Directors believe that the Company is well placed to manage its business risks successfully. The Directors have a reasonable expectation that the Company has adequate resources to continue in operational existence for the foreseeable future. Thus they continue to adopt the going concern basis of accounting in preparing the annual financial statements.
Responsibility statement under the Disclosure Guidance and Transparency RulesEach Director listed on pages 66 and 67 confirms that, to the best of their knowledge:
• The Annual Report and Accounts, taken as a whole, is fair, balanced and understandable and provides the information necessary for shareholders to assess the Company’s position and performance, business model and strategy;
• The financial statements, prepared in accordance with IFRS, give a true and fair view of the assets, liabilities, financial position and profit of the Company and the undertakings included in the consolidation taken as a whole; and
• The Strategic Report contained on pages 2 to 65 includes a fair review of the development and performance of the business and the position of the Company and the undertakings included in the consolidation taken as a whole, together with a description of the principal risks and uncertainties that they face.
By order of the Board
Alastair CochranChief Financial Officer
Directors’ responsibilitiesThe Directors are responsible for preparing the Annual Report and the Financial Statements in accordance with applicable law and regulations. The Directors have chosen to prepare the financial statements in accordance with International Financial Reporting Standards (IFRS). The Directors are also responsible for the preparation of the Directors’ remuneration report, which they have chosen to prepare, being under no obligation to do so under Jersey Company Law. The Directors are also responsible for the preparation of the corporate governance report under the UK Listing Rules and FRC regulations.
Jersey Company Law requires the Directors to prepare financial statements for each financial period in accordance with generally accepted accounting principles. The financial statements are required by law to give a true and fair view of the state of affairs of the Company at the period end and of the profit or loss of the Company for the period then ended. In preparing these financial statements, the Directors should:
• Select suitable accounting policies and then apply them consistently
• Make judgements and estimates that are reasonable
• Specify which generally accepted accounting principles have been adopted in their preparation, and
• Prepare the financial statements on a going concern basis unless it is inappropriate to presume that the Company will continue in business
The Directors are responsible for keeping proper accounting records which are sufficient to show and explain the Company’s transactions and to disclose with reasonable accuracy at any time the financial position of the Company and enable them to ensure that the financial statements prepared by the Company comply with the requirements of the Law. They are also responsible for safeguarding the assets of the Group and Company and hence for taking reasonable steps for the prevention and detection of fraud and other irregularities.
The Directors are responsible for the maintenance and integrity of the corporate and financial information included on the Company’s website. Legislation in Jersey governing the preparation and dissemination of financial statements may differ from legislation in other jurisdictions.
Directors’ approachThe Board’s objective is to present a fair, balanced and understandable assessment of the Company’s position and prospects, particularly in the Annual Report and Accounts, half-year results announcement and other published documents and reports to regulators. The Board has established an Audit Committee to assist with this obligation.
102 Annual report and accounts 2018 Petrofac

GROUPFINANCIALSTATEMENTS
103-182
104 Independent auditor’s report to the members of Petrofac Limited
113 Consolidated income statement
114 Consolidated statement of other comprehensive income
115 Consolidated balance sheet
116 Consolidated statement of cash flows
117 Consolidated statement of changes in equity
118 Notes to the consolidated financial statements
118 Note 1 Corporate information
118 Note 2 Summary of significant accounting policies
133 Note 3 Revenue from contracts with customers
134 Note 4 Segment information
136 Note 5 Expenses
137 Note 6 Exceptional items and certain re-measurements
139 Note 7 Finance income/(expense)
139 Note 8 Income tax
141 Note 9 Earnings per share
142 Note 10 Dividends paid and proposed
143 Note 11 Disposals and business combinations
146 Note 12 Property, plant and equipment
147 Note 13 Non-controlling interests
149 Note 14 Goodwill
149 Note 15 Assets held for sale
150 Note 16 Intangible assets
151 Note 17 Investments in associates and joint ventures
153 Note 18 Other financial assets and other financial liabilities
156 Note 19 Inventories
156 Note 20 Trade and other receivables
158 Note 21 Contract assets and contract liabilities
159 Note 22 Cash and short-term deposits
160 Note 23 Share capital
160 Note 24 Employee Benefit Trust (“EBT”) shares
160 Note 25 Share-based payment plans
162 Note 26 Other reserves
163 Note 27 Interest-bearing loans and borrowings
164 Note 28 Provisions
165 Note 29 Trade and other payables
166 Note 30 Commitments and contingent liabilities
167 Note 31 Related party transactions
167 Note 32 Accrued contract expenses
168 Note 33 Risk management and financial instruments
172 Note 34 Subsidiaries, associates and joint arrangements
175 Note 35 Changes in accounting policies and disclosures resulting from adoption of IFRS 15
177 Appendices
Financial statem
entsG
overnance
Strateg
ic repo
rt
Annual report and accounts 2018 Petrofac 103

INDEPENDENT AUDITOR’S REPORT TO THE MEMBERS OF PETROFAC LIMITED
Conclusions relating to principal risks, going concern and viability statementWe have nothing to report in respect of the following information in the annual report, in relation to which the ISAs (UK) require us to report to you whether we have anything material to add or draw attention to:
• the disclosures in the annual report set out on pages 25 to 29 that describe the principal risks and explain how they are being managed or mitigated;
• the directors’ confirmation set out on page 102 in the annual report that they have carried out a robust assessment of the principal risks facing the entity, including those that would threaten its business model, future performance, solvency or liquidity;
• the directors’ statement set out on page 102 in the financial statements about whether they considered it appropriate to adopt the going concern basis of accounting in preparing them, and their identification of any material uncertainties to the entity’s ability to continue to do so over a period of at least twelve months from the date of approval of the financial statements;
• whether the directors’ statement in relation to going concern required under the Listing Rules is materially inconsistent with our knowledge obtained in the audit; or
• the directors’ explanation set out on page 24 in the annual report as to how they have assessed the prospects of the entity, over what period they have done so and why they consider that period to be appropriate, and their statement as to whether they have a reasonable expectation that the entity will be able to continue in operation and meet its liabilities as they fall due over the period of their assessment, including any related disclosures drawing attention to any necessary qualifications or assumptions.
Overview of our audit approach
Key audit matters
• SFO investigation• Revenue and margin recognition on fixed
price Engineering, Procurement and Construction contracts
• Carrying amount of IES assets and asset disposals
• Accounting for disposals• Recoverability of deferred tax assets and
assessment of tax exposure provisions
Audit scope • We performed an audit of the complete financial information of five components, audit procedures on specific balances for a further three components and specified procedures on two components.
• The components where we performed full or specific audit procedures accounted for 89% of business performance profit before tax, 97% of revenue and 96% of total assets.
Materiality • Overall Group materiality of $23m which represents 5% of business performance profit before tax.
OpinionIn our opinion:
• Petrofac Limited’s Group financial statements and parent company financial statements (the “financial statements”) give a true and fair view of the state of the Group’s and of the parent company’s affairs as at 31 December 2018 and of the Group’s profit and parent company’s profit for the year then ended;
• the financial statements have been properly prepared in accordance with International Financial Reporting Standards (“IFRS”); and
• the financial statements have been properly prepared in accordance with the requirements of the Companies (Jersey) Law 1991.
We have audited the financial statements of Petrofac Limited which comprise:
Group Parent company
Consolidated income statement for the year ended 31 December 2018
Company income statement for the year ended 31 December 2018
Consolidated statement of other comprehensive income for the year ended 31 December 2018
Company statement of other comprehensive income for the year ended 31 December 2018
Consolidated balance sheet at 31 December 2018
Company balance sheet as at 31 December 2018
Consolidated statement of cash flows for the year ended 31 December 2018
Company statement of cash flows for the year ended 31 December 2018
Consolidated statement of changes in equity for the year ended 31 December 2018
Company statement of changes in equity for the year ended 31 December 2018
Related notes 1 to 35 to the financial statements, including a summary of significant accounting policies
Related notes 1 to 21 to the financial statements, including a summary of significant accounting policies
We have also audited the part of the Director’s Remuneration Report identified as being audited on pages 93 to 97.
The financial reporting framework that has been applied in their preparation is applicable law and IFRS.
Basis for opinion We conducted our audit in accordance with International Standards on Auditing (UK) (ISAs (UK)) and applicable law. Our responsibilities under those standards are further described in the Auditor’s responsibilities for the audit of the financial statements section of our report below. We are independent of the Group and parent company in accordance with the ethical requirements that are relevant to our audit of the financial statements in the UK, including the FRC’s Ethical Standard as applied to listed entities, and we have fulfilled our other ethical responsibilities in accordance with these requirements.
We believe that the audit evidence we have obtained is sufficient and appropriate to provide a basis for our opinion.
104 Annual report and accounts 2018 Petrofac
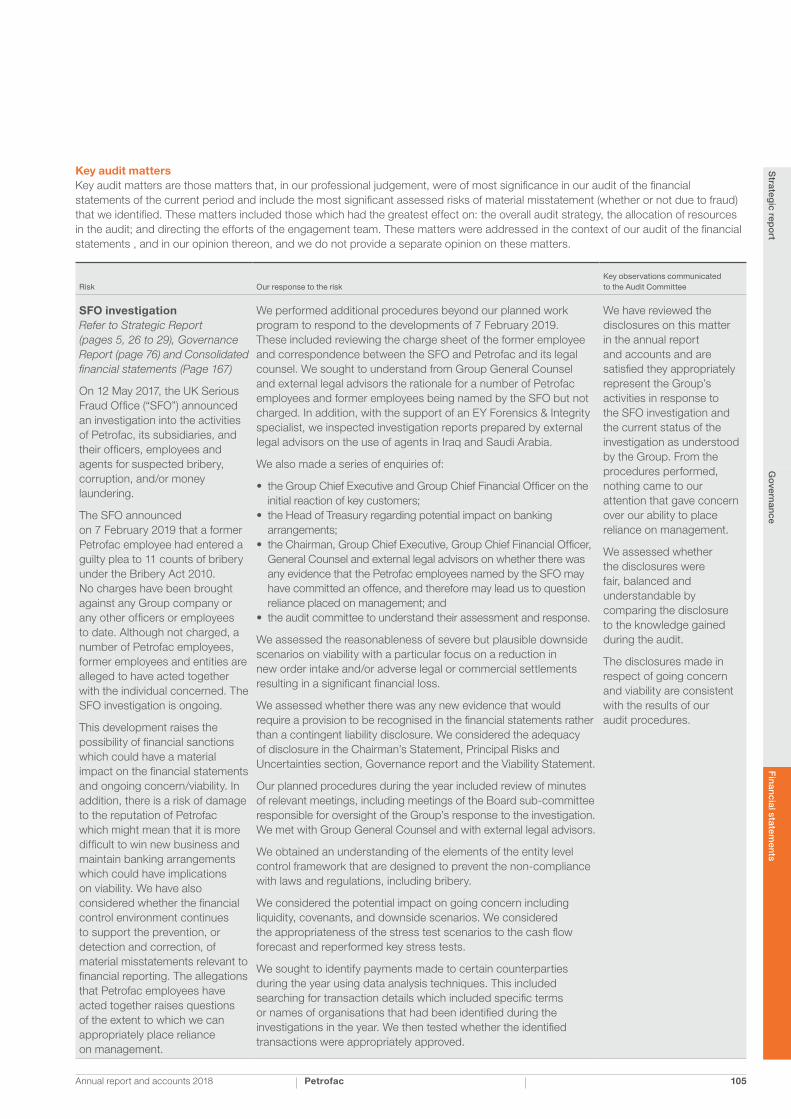
Key audit matters Key audit matters are those matters that, in our professional judgement, were of most significance in our audit of the financial statements of the current period and include the most significant assessed risks of material misstatement (whether or not due to fraud) that we identified. These matters included those which had the greatest effect on: the overall audit strategy, the allocation of resources in the audit; and directing the efforts of the engagement team. These matters were addressed in the context of our audit of the financial statements , and in our opinion thereon, and we do not provide a separate opinion on these matters.
Risk Our response to the riskKey observations communicated to the Audit Committee
SFO investigationRefer to Strategic Report (pages 5, 26 to 29), Governance Report (page 76) and Consolidated financial statements (Page 167)
On 12 May 2017, the UK Serious Fraud Office (“SFO”) announced an investigation into the activities of Petrofac, its subsidiaries, and their officers, employees and agents for suspected bribery, corruption, and/or money laundering.
The SFO announced on 7 February 2019 that a former Petrofac employee had entered a guilty plea to 11 counts of bribery under the Bribery Act 2010. No charges have been brought against any Group company or any other officers or employees to date. Although not charged, a number of Petrofac employees, former employees and entities are alleged to have acted together with the individual concerned. The SFO investigation is ongoing.
This development raises the possibility of financial sanctions which could have a material impact on the financial statements and ongoing concern/viability. In addition, there is a risk of damage to the reputation of Petrofac which might mean that it is more difficult to win new business and maintain banking arrangements which could have implications on viability. We have also considered whether the financial control environment continues to support the prevention, or detection and correction, of material misstatements relevant to financial reporting. The allegations that Petrofac employees have acted together raises questions of the extent to which we can appropriately place reliance on management.
We performed additional procedures beyond our planned work program to respond to the developments of 7 February 2019. These included reviewing the charge sheet of the former employee and correspondence between the SFO and Petrofac and its legal counsel. We sought to understand from Group General Counsel and external legal advisors the rationale for a number of Petrofac employees and former employees being named by the SFO but not charged. In addition, with the support of an EY Forensics & Integrity specialist, we inspected investigation reports prepared by external legal advisors on the use of agents in Iraq and Saudi Arabia.
We also made a series of enquiries of:
• the Group Chief Executive and Group Chief Financial Officer on the initial reaction of key customers;
• the Head of Treasury regarding potential impact on banking arrangements;
• the Chairman, Group Chief Executive, Group Chief Financial Officer, General Counsel and external legal advisors on whether there was any evidence that the Petrofac employees named by the SFO may have committed an offence, and therefore may lead us to question reliance placed on management; and
• the audit committee to understand their assessment and response.
We assessed the reasonableness of severe but plausible downside scenarios on viability with a particular focus on a reduction in new order intake and/or adverse legal or commercial settlements resulting in a significant financial loss.
We assessed whether there was any new evidence that would require a provision to be recognised in the financial statements rather than a contingent liability disclosure. We considered the adequacy of disclosure in the Chairman’s Statement, Principal Risks and Uncertainties section, Governance report and the Viability Statement.
Our planned procedures during the year included review of minutes of relevant meetings, including meetings of the Board sub-committee responsible for oversight of the Group’s response to the investigation. We met with Group General Counsel and with external legal advisors.
We obtained an understanding of the elements of the entity level control framework that are designed to prevent the non-compliance with laws and regulations, including bribery.
We considered the potential impact on going concern including liquidity, covenants, and downside scenarios. We considered the appropriateness of the stress test scenarios to the cash flow forecast and reperformed key stress tests.
We sought to identify payments made to certain counterparties during the year using data analysis techniques. This included searching for transaction details which included specific terms or names of organisations that had been identified during the investigations in the year. We then tested whether the identified transactions were appropriately approved.
We have reviewed the disclosures on this matter in the annual report and accounts and are satisfied they appropriately represent the Group’s activities in response to the SFO investigation and the current status of the investigation as understood by the Group. From the procedures performed, nothing came to our attention that gave concern over our ability to place reliance on management.
We assessed whether the disclosures were fair, balanced and understandable by comparing the disclosure to the knowledge gained during the audit.
The disclosures made in respect of going concern and viability are consistent with the results of our audit procedures.
Annual report and accounts 2018 Petrofac 105
Financial statem
entsG
overnance
Strateg
ic repo
rt

INDEPENDENT AUDITOR’S REPORT TO THE MEMBERS OF PETROFAC LIMITED CONTINUED
Risk Our response to the riskKey observations communicated to the Audit Committee
Revenue and margin recognition on fixed price Engineering, Procurement and Construction contracts
Refer to the Audit Committee Report (page 87); Significant accounting judgements and estimates (pages 123 to 125); and Note 3 of the Consolidated financial statements (pages 133 and 134)
These contracts are reported in the Engineering and Construction (E&C) segment and represent approximately 70% of Group revenue.
Accounting for E&C fixed price contracts requires significant management judgement and estimation, which increases the risk of bias or error and therefore may be subject to management override of controls.
Judgement and estimation is applied in the following areas which directly impact revenue recognition under the percentage of completion (POC) method:
• Percentage of completion calculations applied using the input method under IFRS 15 Revenue from Contracts with Customers;
• Project forecast costs to complete including contingencies;
• Recognition of variation orders and claims in contract value; and
• Estimation of liquidated damages as a deduction to contract value.
We performed audit procedures over revenue in seven locations, which covered 97% of total revenue across the Group.
The component team based in the United Arab Emirates (UAE), with close oversight from the Group audit engagement team, performed the following procedures on the identified risk areas on E&C contracts. Our audit involved detailed testing on 21 contracts covering substantially all the revenue subject to this risk.
We enquired of senior management, project directors and cost controllers to understand the status of the contract, any changes in circumstances from the previous year, the key assumptions underlying revenue and cost, and any disputes, claims or litigation.
Percentage of completion calculationsWe have tested the mathematical accuracy of POC calculations applied using the input method under IFRS 15. We reperformed the calculation of revenue recognised in the year based on POC. For actual costs incurred, a key component of POC, we audited on a sample basis, the appropriate estimation of contract cost accruals on the contracts by testing components of accruals to purchase orders, progress reports and payroll data.
Forecast costs to complete including contingencies We have tested cost to complete estimates through testing relevant components of project materials and subcontractor costs to quotations or rates schedules, and manpower costs to mobilisation reports. We performed variance analysis compared to budgets and prior period estimates and assessed the historical accuracy of the previous forecasts. We also considered management’s assessment and the legal basis for the treatment of subcontractor claims and the ability to impose liquidated damages on suppliers.
We have challenged the reasonableness of the contract contingencies included in the forecast costs to complete with respect to the physical progress on the project and remaining costs to complete based on our understanding of the projects and Petrofac’s past experience. We have analysed the movements throughout the life of the contract, performed analysis against other similar contracts, challenged management as to the basis of the amount recognised in light of remaining contract tenure and the associated risks, and reviewed the relevant approvals by the appropriate level of management for any changes in contingency.
We reported that revenue and margin recognition on fixed price E&C contracts has been appropriately accounted for under IFRS 15. We are satisfied that estimates made in relation to variation orders, liquidated damages, cost accruals and forecast costs to complete were appropriate and in line with IFRS 15 and Group accounting policy.
106 Annual report and accounts 2018 Petrofac

Risk Our response to the riskKey observations communicated to the Audit Committee
Revenue and margin recognition on fixed price Engineering, Procurement and Construction contracts (cont’d)
Following the adoption of IFRS 15 Revenue from Contracts with Customers and the change to using the input method, the Group was required to change a number of accounting policies in relation to variable consideration, cost accruals and contingencies. Our audit involved reviewing these policies for compliance with IFRS 15 and ensuring the policies were applied correctly.
Revenue in this segment totalled $4.1bn in 2018 (2017: $4.8bn).
Variation orders We challenged management and project directors on the basis of their estimates and corroborated these discussions through inspection of minutes of customer meetings, correspondence with the customer and other documentation. We challenged both the likelihood of variations and claims being approved and management’s assessment of the value assigned.
For older claims, we considered the actions being taken to finalise amounts outstanding and challenged the basis for recognising variation orders on long outstanding claims.
For reversals of variation orders in the year, we obtained an understanding of the commercial negotiations that are ongoing with customers and challenged management on recognition of the remaining balance within contract value.
We considered the completeness of variation orders by challenging management on the non-recognition of potential variations due to contract specific factors e.g. early stage of negotiation, or customer specific risks.
Liquidated damagesOur procedures involved assessing past experience with the customer in terms of imposing contractual penalties and corroborating the above through inspection of the relevant documentation. We inspected the project schedule and correspondence with the customer regarding the nature and extent of the delays. Where contractual liquidated damages were not deducted from the contract value, we tested whether the customer had accepted extension of time claims. Where it is management’s expectation that the contract will not be delivered on time, we obtain explanations as to the cause of the delays to determine whether there is any effective mitigation of the liquidated damages risk, for example delays caused and acknowledged by the customer.
We have also ensured the risks associated with revenue recognition have been appropriately disclosed in Note 2 to the financial statements with respect to significant accounting judgements and estimates.
Annual report and accounts 2018 Petrofac 107
Financial statem
entsG
overnance
Strateg
ic repo
rt

INDEPENDENT AUDITOR’S REPORT TO THE MEMBERS OF PETROFAC LIMITED CONTINUED
Risk Our response to the riskKey observations communicated to the Audit Committee
Carrying value of IES assets and asset disposals
Refer to the Audit Committee Report (page 87); Significant accounting judgements and estimates (pages 123 to 125); and Notes 6, 11 and 15 of the Consolidated financial statements (pages 137 to 139, 143 to 145 and 149 and 150)
The Group disposed of its interest in GSA, Chergui, the JSD6000 and 49% of its interest in the holding company for its Mexico assets. In the prior year, the Group disposed of its interest in the Panuco asset in Mexico.
At 31 December 2018, assets related to the IES segment had a total carrying value of $490m excluding working capital (2017: $1bn).
Impairment charges and fair value re-measurements were recorded against IES assets of $209m (2017: $245m). This comprised impairment of GSA $55m, Mexico $111m and the fair value remeasurement loss on Panuco contingent consideration $43m.
Losses on disposal were recognised in the year on GSA ($16m), Chergui ($4m) and the JSD6000 ($8m).
Due to the ongoing commercial re-negotiations with national oil company partners on these assets, the outcome of which are uncertain, there is a risk that the recoverable amount of the remaining PM304 asset in Malaysia and Mexico assets are lower than the carrying amounts and therefore an impairment is required.
Other than Chergui, the disposal transactions included elements of contingent and deferred consideration, which resulted in assets being recognised and measured at fair value.
For each disposal, we inspected the signed sales and purchase agreements (SPA) detailing the key terms and conditions including elements of deferred and contingent consideration. We tested the proceeds received including working capital adjustments to bank statements. We obtained an understanding of the key judgements and estimates regarding the elements of the deferred and contingent consideration for each disposal. We ensured they were appropriately supported, and tested the sensitivity of these estimates to changes in assumptions. We evaluated the discount rates and risking applied to the estimates, and the appropriateness of management’s review and challenge applied to these estimates.
MexicoThe recoverable amount was determined using the fair value less costs of disposal following the sale of the Group’s 49% interest in the year. We inspected the sale and purchase agreement (SPA). We challenged the assumptions made by management in determining the fair value of contingent consideration receivable by inspecting documentation and evaluating the assessment performed to calculate payments under the SPA.
We have performed additional procedures, including press searches and discussions with the in-country audit team regarding the policies of the new government in Mexico and the impact on migrations to PSC type contracts. We have ensured that the significant estimates have been appropriately disclosed.
GSAWe have assessed the impairment recorded during the year as well as the subsequent disposal. The procedures performed in relation to the deferred and contingent consideration were in line with those of Mexico above.
JSD6000We tested the valuation of the deferred consideration being the contractual right to receive a 10% ownership interest in a special purpose vehicle that will own the vessel upon construction. We obtained a revised shipbroker estimate commissioned by management at year end and assessed whether the fair value determined by management appropriately considered the relevant risks including delays to the completion of construction and the future addressable market for the vessel.
PanucoWe obtained management’s revised calculation of the fair value of the contingent consideration receivable, which is primarily driven by assumptions relating to the migration terms (including percentage of working interest in the PSC) expected to be achieved. We inspected correspondence with the asset owner to ensure the latest information regarding the migrations available to management was being used to determine fair value.
We have concluded that the impairment charges on GSA and Mexico, and the fair value re-measurement loss on Panuco contingent consideration were appropriately determined. The recoverable amount of IES assets has been determined at an acceptable point within a range of potential outcomes. We have reviewed and concur with the disclosure of significant estimation uncertainty in relation to the Mexico and Malaysia PM304 assets, presented in Note 2 to the financial statements.
For each of the estimates required to value the deferred and contingent consideration elements of the disposals, we are satisfied that the basis for these estimates are supportable and represent managements best estimate of the eventual outcome.
108 Annual report and accounts 2018 Petrofac

Risk Our response to the riskKey observations communicated to the Audit Committee
Carrying value of IES assets and asset disposals (cont’d)
Deferred and contingent consideration receivable at year end comprise GSA ($78m), Panuco ($45m), Mexico ($42m) and the JSD6000 ($61m).
Estimates are required to determine the fair value of this consideration, both on disposal and each reporting period until the consideration is received.
PM304 Malaysia We obtained management’s impairment testing documentation which demonstrated that the recoverable amount was higher than the carrying amount. We reviewed the fair value less costs to sell methodology and examined key assumptions, used to determine whether the valuation was appropriately supported.
Recoverability of deferred tax assets and assessment of tax exposure provisions
Refer to the Audit Committee report (page 87); Significant accounting judgements and estimates (pages 123 to 125); and note 8 of the Consolidated financial statements (page 141)
The Group operates in multiple tax jurisdictions where uncertain tax positions and treatments may be challenged at a later date by the relevant authorities.
Provisions of $101m (2017: $110m) are held principally in respect of tax deductions previously taken, transfer pricing arrangements and ongoing tax audits. This is an area which requires management to exercise significant judgement.
The recognition of deferred tax assets of $126m requires a forecast of profitability to be performed on the underlying businesses and judgement on whether these future profits are probable.
We utilised taxation specialists in our London team to assist the Group audit team in identifying jurisdictions to be included in audit scope. We also involved local tax specialists in the relevant jurisdictions where we deemed it necessary to address specific local tax matters, including Mexico and the Netherlands.
We understood management’s rationale applied to new contracts and the basis for recognising any tax exposure provisions in relation to these contracts. We further identified tax exposures estimated by management, including those arising on E&C contracts in the Middle East and business disposals. We evaluated the range and quantum of risks associated with these exposures along with claims or assessments made by tax authorities to date. We also considered, through inspecting documentation, whether progress in any ongoing tax audits during the year require a change in estimate on any exposure provision.
We evaluated management’s assessment of the likelihood of the realisation of deferred tax asset balances by obtaining profit forecasts for the relevant businesses, ensuring these were consistent with board approved plans, challenged the past accuracy of forecasts and the implications of non-recurring losses for future profit assumptions. We have challenged management on the assumptions used within the forecast.
We are satisfied that the deferred tax assets are appropriately recognised and presented in the financial statements.
The provision in respect of income tax exposures complies with the requirements of IFRS, and is materially consistent with the Group’s experience in the relevant jurisdictions and historical tax assessments concluded with the tax authorities.
Annual report and accounts 2018 Petrofac 109
Financial statem
entsG
overnance
Strateg
ic repo
rt

INDEPENDENT AUDITOR’S REPORT TO THE MEMBERS OF PETROFAC LIMITED CONTINUED
Of the remaining components that together represent 11% of the Group’s business performance profit before tax, none are individually greater than 1% of the Group’s business performance profit before tax. For these components, we performed other procedures, including analytical review on a component basis using a risk based approach and tested consolidation journals to identify the existence of, and to respond to, any potential risks of material misstatement to the Group financial statements.
Involvement with component teams In establishing our overall approach to the Group audit, we determined the type of work that needed to be undertaken at each of the components by us, as the primary team, or by component teams from other EY global network firms operating under our instruction. Of the five full scope components, audit procedures were performed on two of these directly by the primary team and three by component teams in the UAE, UK and Malaysia. For the three specific scope components, where the work was performed by component teams, we determined the appropriate level of involvement to enable us to determine that sufficient audit evidence had been obtained as a basis for our opinion on the Group as a whole.
The primary team continued to follow a programme of planned visits that has been designed to ensure that the lead audit partner or his designate visits each of the key locations to exercise oversight during key audit activities at planning and execution. The nature and extent of these visits were designed relative to the size of the component, and the division of responsibilities between the local and primary team on the significant risk areas applicable to the component.
During the current year’s audit cycle, visits were undertaken by the primary team to the component teams in the UAE, UK, Mexico and Malaysia. These visits involved discussing the audit approach with the component team and any issues arising from their work, meeting with local management, attending planning and closing meetings and reviewing key audit working papers on risk areas. The primary team attended all interim closing and final closing meetings in person for full and specific scope locations, except in limited circumstances where attendance was by conference call. This, together with the additional procedures performed at Group level, gave us appropriate evidence for our opinion on the Group financial statements.
Our application of materiality We apply the concept of materiality in planning and performing the audit, in evaluating the effect of identified misstatements on the audit and in forming our audit opinion.
MaterialityThe magnitude of an omission or misstatement that, individually or in the aggregate, could reasonably be expected to influence the economic decisions of the users of the financial statements. Materiality provides a basis for determining the nature and extent of our audit procedures.
In determining materiality, audit standards require us to use benchmark measures, such as pre-tax income, gross profit and total revenue. Nevertheless, we have to exercise considerable judgement, including the need to consider which earnings, activity or capital based measure aligns best with the expectations of the users of the Group’s financial statements and the Audit Committee.
There have been no significant changes in our Key Audit Matters from our 2017 auditor’s report.
An overview of the scope of our auditTailoring the scopeOur assessment of audit risk, our evaluation of materiality and our allocation of performance materiality determine our audit scope for each entity within the Group. Taken together, this enables us to form an opinion on the consolidated financial statements. We consider the size, risk profile, the organisation of the Group and effectiveness of Group-wide controls, changes in the business environment and other factors such as recent Internal audit results when assessing the level of work to be performed at each entity.
In assessing the risk of material misstatement to the Group financial statements, and to ensure we had adequate quantitative coverage of significant accounts in the financial statements, we selected components covering entities within the UAE, UK, Malaysia, Mexico and Tunisia which represent the principal business units within the Group. The primary team performs audit procedures on those areas of accounting performed centrally including IES asset impairment testing, asset disposal accounting, taxation, the SFO investigation and consolidation procedures.
Of the ten components selected, we performed an audit of the complete financial information of five components (“full scope components”) which were selected based on their size or risk characteristics. For the three components (“specific scope components”), we performed audit procedures on specific accounts within that component that we considered had the potential for the greatest impact on the significant accounts in the financial statements either because of the size of these accounts or their risk profile (only two of the three had revenue balances). The audit scope of these components may not have included testing of all significant accounts of the component but will have contributed to the coverage of risks tested for the Group.
For the remaining two components (“specified procedures”), the primary team performed procedures over the disposal of the GSA and Chergui IES assets.
The charts below illustrate the coverage obtained from the work performed by our audit teams.
84
511
83
134
92
5 3
Speci�c scope components
Full scope components
Other procedures
Business performance pro�t before tax measure used (%)
Total assets (%)Revenue (%)
110 Annual report and accounts 2018 Petrofac

Reporting thresholdAn amount below which identified misstatements are considered as being clearly trivial.
We agreed with the Audit Committee that we would report to them all uncorrected audit differences in excess of $1.2m (2017: $1.2m), which is set at 5% of planning materiality, as well as differences below that threshold that, in our view, warranted reporting on qualitative grounds. We also agreed that we would report to the Audit Committee any uncorrected classification misstatements above 2% of the any primary financial statement line items to which the misstatement relates.
We evaluate any uncorrected misstatements against both the quantitative measures of materiality discussed above and in light of other relevant qualitative considerations in forming our opinion.
Other information The other information comprises the information included in the annual report other than the financial statements and our auditor’s report thereon. The directors are responsible for the other information.
Our opinion on the financial statements does not cover the other information and, except to the extent otherwise explicitly stated in this report, we do not express any form of assurance conclusion thereon.
In connection with our audit of the financial statements, our responsibility is to read the other information and, in doing so, consider whether the other information is materially inconsistent with the financial statements or our knowledge obtained in the audit or otherwise appears to be materially misstated. If we identify such material inconsistencies or apparent material misstatements, we are required to determine whether there is a material misstatement in the financial statements or a material misstatement of the other information. If, based on the work we have performed, we conclude that there is a material misstatement of the other information, we are required to report that fact.
We have nothing to report in this regard.
In this context, we also have nothing to report in regard to our responsibility to specifically address the following items in the other information and to report as uncorrected material misstatements of the other information where we conclude that those items meet the following conditions:
• Fair, balanced and understandable set out on page 102 – the statement given by the directors that they consider the annual report and financial statements taken as a whole is fair, balanced and understandable and provides the information necessary for shareholders to assess the Group’s performance, business model and strategy, is materially inconsistent with our knowledge obtained in the audit; or
• Audit committee reporting set out on page 86 – the section describing the work of the audit committee does not appropriately address matters communicated by us to the audit committee; or
• Directors’ statement of compliance with the UK Corporate Governance Code set out on page 102 – the parts of the directors’ statement required under the Listing Rules relating to the company’s compliance with the UK Corporate Governance Code containing provisions specified for review by the auditor in accordance with Listing Rule 9.8.10R(2) do not properly disclose a departure from a relevant provision of the UK Corporate Governance Code.
We determined materiality for the Group to be $23m million (2017: $24m), which is 5% (2017: 5%) of business performance profit before tax. This reflects our understanding of the common financial information needs of the users of the Group’s financial statements, which we believe is business performance excluding exceptional items and certain re-measurements. This measure of profit features in Petrofac’s results announcements and other external reporting. The analyst consensus data also supports our judgement that business performance profit, which excludes these items, is the key indicator of performance from an analyst’s perspective. We believe that adjusting for the items described below provides us with a consistent year-on-year basis for determining materiality and is appropriate in the light of the change in Group strategy for IES which is a main driver of the exceptional items and certain re-measurements. For 2018, these related to exceptional items and certain re-measurements of $356m which management consider could not have been reasonably expected to occur in advance of the reporting period (refer to note 6 of the financial statements) which were all subject to full scope audit procedures.
Starting basis• Reported pre-tax profit $107m
Adjustments• Exceptional items and certain re-measurements increase basis by $356m
Materiality• Total business performance profit before tax $463m• Materiality of $23m (5% of materiality basis)
We determined materiality for the Parent Company to be $11.7m (2017: $12.2m), which is 0.5% (2017: 0.5%) of total assets.
Performance materialityThe application of materiality at the individual account or balance level. It is set at an amount to reduce to an appropriately low level the probability that the aggregate of uncorrected and undetected misstatements exceeds materiality.
On the basis of our risk assessments, together with our assessment of the Group’s overall control environment, our judgement was that performance materiality was 50% (2017: 50%) of our planning materiality, namely $11.5m (2017: $12m). We have set performance materiality at this percentage due to our past experience of the audit that indicates a higher risk of misstatements, both corrected and uncorrected.
Audit work at component locations, for the purpose of obtaining audit coverage over significant financial statement accounts, is undertaken based on a percentage of total performance materiality. The performance materiality set for each component is based on the relative scale and risk of the component to the Group as a whole and our assessment of the risk of misstatement at that component. In the current year, the range of performance materiality allocated to components was $3.3m to $9.9m (2017: $2.4m to $10.8m).
Annual report and accounts 2018 Petrofac 111
Financial statem
entsG
overnance
Strateg
ic repo
rt

Auditor’s responsibilities for the audit of the financial statements Our objectives are to obtain reasonable assurance about whether the financial statements as a whole are free from material misstatement, whether due to fraud or error, and to issue an auditor’s report that includes our opinion. Reasonable assurance is a high level of assurance, but is not a guarantee that an audit conducted in accordance with ISAs (UK) will always detect a material misstatement when it exists. Misstatements can arise from fraud or error and are considered material if, individually or in the aggregate, they could reasonably be expected to influence the economic decisions of users taken on the basis of these financial statements.
A further description of our responsibilities for the audit of the financial statements is located on the Financial Reporting Council’s website at: https://www.frc.org.uk/auditorsresponsibilities. This description forms part of our auditor’s report.
Use of our report This report is made solely to the company’s members, as a body, in accordance with Article 113A of the Companies (Jersey) Law 1991 and our engagement letter dated 21 November 2017. Our audit work has been undertaken so that we might state to the company’s members those matters we are required to state to them in an auditor’s report and for no other purpose. To the fullest extent permitted by law, we do not accept or assume responsibility to anyone other than the company and the company’s members as a body, for our audit work, for this report or for the opinions we have formed.
Colin Brownfor and on behalf of Ernst & Young LLP London 27 February 2019
Matters on which we are required to report by exceptionWe have nothing to report in respect of the following matters in relation to which the Companies (Jersey) Law 1991 requires us to report to you if, in our opinion:
• proper accounting records have not been kept by the company, or proper returns adequate for our audit have not been received from branches not visited by us; or
• the financial statements are not in agreement with the company’s accounting records and returns; or
• we have not received all the information and explanations we require for our audit.
Opinion on other matters, as agreed in our Engagement LetterIn our opinion, based on the work undertaken in the course of the audit:
• The part of the Directors’ Remuneration Report to be audited has been properly prepared in accordance with the basis of preparation as described therein;
• The information given in the Strategic Report and Governance Report is consistent with the financial statements and those reports have been prepared in accordance with applicable legal requirements;
• The information about internal control and risk management systems in relation to financial reporting processes and about share capital structures is consistent with the financial statements and has been prepared in accordance with applicable legal requirements; and
• The information about the Company’s corporate governance code and practices and about its administrative, management and supervisory bodies and their committees complies with rules 7.2.2, 7.2.3 and 7.2.7 of the FCA Rules.
Responsibilities of directorsAs explained more fully in the directors’ responsibilities statement set out on page 102, the directors are responsible for the preparation of the financial statements and for being satisfied that they give a true and fair view, and for such internal control as the directors determine is necessary to enable the preparation of financial statements that are free from material misstatement, whether due to fraud or error.
In preparing the financial statements, the directors are responsible for assessing the Group and parent company’s ability to continue as a going concern, disclosing, as applicable, matters related to going concern and using the going concern basis of accounting unless the directors either intend to liquidate the Group or the parent company or to cease operations, or have no realistic alternative but to do so.
INDEPENDENT AUDITOR’S REPORT TO THE MEMBERS OF PETROFAC LIMITED CONTINUED
112 Annual report and accounts 2018 Petrofac
Notes:1. The maintenance and integrity of the Petrofac Limited web site is the responsibility
of the directors; the work carried out by the auditors does not involve consideration of these matters and, accordingly, the auditors accept no responsibility for any changes that may have occurred to the financial statements since they were initially presented on the website.
2. Legislation in the Jersey governing the preparation and dissemination of financial statements may differ from legislation in other jurisdictions.

Notes
Business performance1
US$m
Exceptional items and certain re-measurements
US$m
Reported2018
US$m
*Business performance1
US$m
*Exceptionalitems and certainre-measurements
US$m
*Reported2017
US$m
Revenue 3 5,829 – 5,829 6,395 – 6,395Cost of sales 5a (5,110) – (5,110) (5,610) – (5,610)Gross profit 719 – 719 785 – 785Selling, general andadministration expenses 5b (216) – (216) (235) – (235)Exceptional items and certainre-measurements 6 – (356) (356) – (456) (456)Other operating income 5e 22 – 22 20 – 20Other operating expenses 5f (10) – (10) (10) – (10)Operating profit/(loss) 515 (356) 159 560 (456) 104Finance income 7 14 – 14 10 – 10Finance expense 7 (81) – (81) (80) – (80)Share of net profit of associates and joint ventures 17 15 – 15 11 – 11Profit/(loss) before tax 463 (356) 107 501 (456) 45Income tax (expense)/credit 8a (113) 67 (46) (138) 66 (72)Net profit/(loss) 350 (289) 61 363 (390) (27)
Attributable to:Petrofac Limited shareholders 353 (289) 64 361 (390) (29)Non-controlling interests 13 (3) – (3) 2 – 2
350 (289) 61 363 (390) (27)Earnings/(loss) per share (US cents)
Basic 9 104.4 (85.5) 18.9 106.2 (114.7) (8.5)Diluted 9 102.3 (83.7) 18.6 106.2 (114.7) (8.5)
* Re-presented due to the reclassification of an item from exceptional items and certain re-measurements to business performance as set out in note 6 ‘exceptional items and certain re-measurements’ to the consolidated financial statements.
1 This measurement is shown by the Group as a means of measuring underlying business performance, see note 2 and Appendix A on page 177.
CONSOLIDATED INCOME STATEMENTFOR THE YEAR ENDED 31 DECEMBER 2018
Annual report and accounts 2018 Petrofac 113
Financial statem
entsG
overnance
Strateg
ic repo
rt

Notes2018
US$m2017
US$m
Reported net profit/(loss) 61 (27)
Other comprehensive (loss)/income to be reclassified to consolidated income statement in subsequent periodsNet changes in fair value of derivatives and financial assets designated as cash flow hedges 26 (24) 46Foreign currency translation gains/(losses) 26 17 (9)Other comprehensive (loss)/ income to be reclassified to consolidated income statement in subsequent periods (7) 37
Other comprehensive (loss)/income reclassified to consolidated income statementNet (gains)/losses on maturity of cash flow hedges recycled in the year 26 (3) 13Other comprehensive (loss)/income reclassified to consolidated income statement (3) 13Total comprehensive income for the year 51 23Attributable to:Petrofac Limited shareholders 53 10Non-controlling interests 13 (2) 13
51 23
CONSOLIDATED STATEMENT OF OTHER COMPREHENSIVE INCOMEFOR THE YEAR ENDED 31 DECEMBER 2018
114 Annual report and accounts 2018 Petrofac

Notes2018
US$m2017
US$m
AssetsNon-current assetsProperty, plant and equipment 12 685 1,092Goodwill 14 73 76Intangible assets 16 56 76Investments in associates and joint ventures 17 30 74Other financial assets 18 406 553Contract assets 21 40 –Deferred consideration 15 61 –Deferred tax assets 8c 126 101
1,477 1,972
Current assetsInventories 19 21 8Trade and other receivables 20 1,431 2,020Contract assets 21 1,998 –Work in progress 21 – 2,223Related party receivables 31 1 1Other financial assets 18 144 146Income tax receivable 8 9Cash and short-term deposits 22 726 967
4,329 5,374Assets held for sale 15 – 217
4,329 5,591Total assets 5,806 7,563Equity and liabilities EquityShare capital 23 7 7Share premium 23 4 4Capital redemption reserve 23 11 11Employee Benefit Trust shares 24 (107) (102)Other reserves 26 95 110Retained earnings 697 882Equity attributable to Petrofac Limited shareholders 707 912Non-controlling interests 13 302 36Total equity 1,009 948Non-current liabilities Interest-bearing loans and borrowings 27 376 854Provisions 28 243 269Other financial liabilities 18 341 443Deferred tax liabilities 8c 43 67
1,003 1,633Current liabilitiesTrade and other payables 29 962 1,675Contract liabilities 21 504 –Billings in excess of cost and estimated earnings 21 – 198Interest-bearing loans and borrowings 27 260 725Other financial liabilities 18 139 151Income tax payable 244 251Accrued contract expenses 32 1,645 1,956Provisions 28 40 26
3,794 4,982Liabilities associated with assets held for sale 15 – –
3,794 4,982Total liabilities 4,797 6,615Total equity and liabilities 5,806 7,563
The consolidated financial statements on pages 113 to 176 were approved by the Board of Directors on 27 February 2019 and signed on its behalf by Alastair Cochran – Chief Financial Officer.
CONSOLIDATED BALANCE SHEETAT 31 DECEMBER 2018
Annual report and accounts 2018 Petrofac 115
Financial statem
entsG
overnance
Strateg
ic repo
rt

Notes2018
US$m*2017
US$m
Operating activities Profit before tax 107 45Exceptional items and certain re-measurements 6 356 456Profit before tax, exceptional items and certain re-measurements 463 501Adjustments to reconcile profit before tax, exceptional items and certain re-measurements to net cash flows:Depreciation, amortisation and write-offs 5a, 5b 141 177Expected credit loss allowance recognised during the year 20, 21 1 –Share-based payments 5c 17 19Difference between other long-term employment benefits paid and amounts recognised in the consolidated income statement 28 7 11Net finance expense 7 67 70Provision for onerous contracts and other provisions 28 15 39Share of net profit of associates and joint ventures 17 (15) (11)Net other non-cash items (3) (17)
693 789Working capital adjustments:Inventories (17) –Trade and other receivables (23) (10)Contract assets 316 –Work in progress – (41)Related party receivables – 3Other current financial assets 18 11 67Assets held for sale – (1)Trade and other payables (103) (272)Contract liabilities 121 –Billings in excess of cost and estimated earnings – 154Accrued contract expenses (320) (113)
678 576Net other non-current items 3 (1)Cash generated from operations 681 575Restructuring, redundancy, migration costs and other exceptional items paid (24) (14)Interest paid (69) (70)Net income taxes paid (104) (69)Net cash flows generated from operating activities 484 422Investing activitiesPurchase of property, plant and equipment (90) (108)Payments for intangible assets 16 (8) (9)Dividends received from associates and joint ventures 17 11 4Net loans repaid by/(paid to) associates and joint ventures 17 13 (2)Loans made to joint operation partners 18 – (51)Proceeds from disposal of property, plant and equipment 15 152 12Proceeds from disposal of subsidiaries 11a 130 10Interest received 5 3Net cash flows used in investing activities 213 (141)Financing activitiesInterest-bearing loans and borrowings, net of debt acquisition cost 18 1,858 1,105Repayment of interest-bearing loans, borrowings and finance leases 18 (2,833) (1,346)Amounts received from non-controlling interest 11a 224 –Purchase of Company’s shares by Employee Benefit Trust 24 (44) (39)Dividends paid (128) (192)Net cash flows used in financing activities (923) (472)Net decrease in cash and cash equivalents (226) (191)Net foreign exchange difference (5) 4Cash and cash equivalents at 1 January 936 1,123Cash and cash equivalents at 31 December 22 705 936
* Re-presented due to the reclassification of an item from exceptional items and certain re-measurements to business performance as set out in note 6 ‘exceptional items and certain re-measurements’ to the consolidated financial statements.
CONSOLIDATED STATEMENT OF CASH FLOWSFOR THE YEAR ENDED 31 DECEMBER 2018
116 Annual report and accounts 2018 Petrofac

Attributable to Petrofac Limited shareholders
Issued share
capital US$m
Share premium
US$m
Capital redemption
reserve US$m
Employee Benefit
Trust shares1
US$m (note 24)
Other reserves
US$m (note 26)
Retained earnings
US$mTotal
US$m
Non- controlling
interests US$m
Total equity US$m
Balance at 1 January 2018 7 4 11 (102) 110 882 912 36 948Opening reserve adjustment (note 2) – – – – – (116) (116) 3 (113)Balance at 1 January 2018 (adjusted) 7 4 11 (102) 110 766 796 39 835Net profit/(loss) – – – – – 64 64 (3) 61Other comprehensive loss – – – – (11) – (11) 1 (10)Total comprehensive income – – – – (11) 64 53 (2) 51Purchase of Company’s shares by Employee Benefit Trust (note 24) – – – (44) – – (44) – (44)Issue of Company’s shares by Employee Benefit Trust (note 24) – – – 39 (34) (5) – – –Transfer to share-based payments reserve for Deferred Bonus Share Plan Invested Shares (note 25) – – – – 15 – 15 – 15Credit to equity for share-based payments charge (note 25) – – – – 17 – 17 – 17Income tax on share-based payments reserve – – – – (2) – (2) – (2)Recognised on disposal of 49% non-controlling interest of the Group’s operations in Mexico (note 11a) – – – – – – – 266 266Dividends (note 10 and note 13) – – – – – (128) (128) (1) (129)Balance at 31 December 2018 7 4 11 (107) 95 697 707 302 1,009
Attributable to Petrofac Limited shareholders
Issued share
capital US$m
Share premium
US$m
Capital redemption
reserve US$m
Employee Benefit
Trust shares1
US$m (note 24)
Other reserves
US$m (note 26)
Retained earnings
US$mTotal
US$m
Non- controlling
interests US$m
Total equity US$m
Balance at 1 January 2017 7 4 11 (105) 73 1,107 1,097 26 1,123Net (loss)/profit – – – – – (29) (29) 2 (27)Other comprehensive income – – – – 39 – 39 11 50Total comprehensive income – – – – 39 (29) 10 13 23Purchase of Company’s shares by Employee Benefit Trust (note 24) – – – (39) – – (39) – (39)Issue of Company’s shares to Group’s employees by Employee Benefit Trust (note 24) – – – 42 (38) (4) – – –Transfer to share-based payments reserve for Deferred Bonus Share Plan Invested Shares (note 25) – – – – 16 – 16 – 16 Credit to equity for share-based payments charge (note 25) – – – – 19 – 19 – 19Income tax on share-based payments reserve – – – – 1 – 1 – 1Dividends (note 10 and note 13) – – – – – (192) (192) (3) (195)
Balance at 31 December 2017 7 4 11 (102) 110 882 912 36 948
1 Shares held by Petrofac Employee Benefit Trust.
CONSOLIDATED STATEMENT OF CHANGES IN EQUITYFOR THE YEAR ENDED 31 DECEMBER 2018
Annual report and accounts 2018 Petrofac 117
Financial statem
entsG
overnance
Strateg
ic repo
rt

1 Corporate information
Petrofac Limited (the “Company”) is a limited liability company registered and domiciled in Jersey under the Companies (Jersey) Law 1991 and is the holding company for the international group of Petrofac subsidiaries. Petrofac Limited and its subsidiaries at 31 December 2018 comprise the Petrofac Group (the “Group”). The Group’s principal activity is the provision of services to the oil and gas production and processing industry.
The Group’s consolidated financial statements for the year ended 31 December 2018 were authorised for issue in accordance with a resolution of the Board of Directors on 27 February 2019.
The Company’s 31 December 2018 financial statements are shown on pages 184 to 201. Information on the Group’s subsidiaries, associates and joint arrangements is contained in note 34 to these consolidated financial statements. Information on other related party transactions of the Group is provided in note 31.
2 Summary of significant accounting policies
2.1 Basis of preparationThe consolidated financial statements of the Group have been prepared in accordance with International Financial Reporting Standards (“IFRS”) as issued by the International Accounting Standards Board (“IASB”) and applicable requirements of Jersey law.
The consolidated financial statements have been prepared on a historical cost basis, except for derivative financial instruments, financial assets held at fair value through profit and loss, deferred consideration and contingent consideration that have been measured at fair value. The consolidated financial statements are presented in United States dollars and all values are rounded to the nearest million (“US$m”), except when otherwise indicated.
2.2 Presentation of resultsThe Group uses Alternative Performance Measures (“APMs”) when assessing and discussing the Group’s financial performance, financial position and cash flows that are not defined or specified under IFRS. The Group uses these APMs, which are not considered to be a substitute for or superior to IFRS measures, to provide stakeholders with additional useful information by adjusting for exceptional items and certain re-measurements which impact upon IFRS measures or, by defining new measures, to aid the understanding of the Group’s financial performance, financial position and cash flows (refer note 6 and Appendix A on page 177 for details).
2.3 Adoption of new financial reporting standards, amendments and interpretationsEffective new financial reporting standardsThe Group adopted IFRS 9 ‘Financial Instruments’ and IFRS 15 ‘Revenue from Contracts with Customers’ on 1 January 2018. The nature and effect of the changes are described below.
IFRS 9 ‘Financial Instruments’IFRS 9 replaced IAS 39 ‘Financial Instruments: Recognition and Measurement’ for annual periods beginning on or after 1 January 2018, bringing together all three aspects of the accounting for financial instruments: classification and measurement; impairment; and hedge accounting. Except for hedge accounting, which the Group applied prospectively, the Group applied IFRS 9 retrospectively, with the initial application date of 1 January 2018, without adjusting comparative information. A net cumulative catch-up adjustment of US$52m was recognised as a reduction to the opening balances of retained earnings of US$48m and non-controlling interests of US$4m (together ‘opening reserves’), in the consolidated statement of changes in equity for the year ended 31 December 2018.
Classification and measurementThere was no impact to the consolidated balance sheet resulting from the Group applying the classification and measurement requirements of IFRS 9.
ImpairmentThe adoption of IFRS 9 fundamentally changed the Group’s accounting for impairment losses for financial assets by replacing IAS 39’s incurred loss approach with a forward-looking expected credit loss (“ECL”) approach.
IFRS 9 requires the Group to measure and recognise ECLs on all applicable financial assets and contract assets arising from IFRS 15 ‘Revenue from Contracts with Customers’ (e.g. trade receivables, contract assets, loans and receivables and bank balances), either on a 12-month or lifetime expected loss basis. The Group applied the simplified method and recognised lifetime ECLs on all trade receivables, contract assets, loans and receivables and bank balances.
The adoption of the ECL requirements of IFRS 9 resulted in an increased loss allowance relating to Group’s financial assets and contract assets. The increase in loss allowance resulted in a reduction to opening reserves, at 1 January 2018, as follows:
Impact US$m
Deferred tax assets 1Total non-current assets 1Trade and other receivables (10)Contract assets (43)Cash and short-term deposits (1)Total current assets (54)Total assets (53)Cumulative catch-up adjustmentRetained earnings (48)Non-controlling interests (4)Total equity (opening reserves) (52)Deferred tax liabilities (1)Total liabilities (1)Total equity and liabilities (53)
Hedge accountingThe Group applied the hedge accounting changes of IFRS 9 prospectively. At the date of the initial application, all the Group’s existing hedging relationships were eligible to be treated as continuing hedging relationships. Consistent with prior periods, the Group continued to designate the fair value change of the entire forward contract in the Group’s cash flow hedge relationships and, as such, the adoption of the hedge accounting requirements of IFRS 9 had no impact on transition.
IFRS 15 ‘Revenue from Contracts with Customers’IFRS 15 established a five-step model to account for revenue arising from contracts with customers. Under IFRS 15, revenue is recognised at an amount that reflects the consideration to which an entity expects to be entitled in exchange for transferring goods or services to a customer.
The Group adopted IFRS 15 using the modified retrospective method and elected to apply this method to those contracts that were not substantially completed at the date of initial application. Under this method comparative information was not restated, instead a net cumulative catch-up adjustment of US$61m was recognised as a reduction to the opening balance of retained earnings of US$68m and an increase to non-controlling interests of US$7m (together ‘opening reserves’), in the consolidated statement of changes in equity for the year ended 31 December 2018.
NOTES TO THE CONSOLIDATED FINANCIAL STATEMENTSFOR THE YEAR ENDED 31 DECEMBER 2018
118 Annual report and accounts 2018 Petrofac

Rendering of servicesThe Group provides fixed-price engineering, procurement and construction services and reimbursable engineering and production services to the oil and gas production and processing industry.
Fixed-price engineering, procurement and construction services contactsThe Group’s contracts with customers for the provision of fixed-price engineering, procurement and construction services include a single performance obligation. The Group concluded that revenue from such services should be recognised over time given that the customer simultaneously receives and consumes the benefits provided by the Group.
Applying the input method Prior to the adoption of IFRS 15, revenue from fixed-price engineering, procurement and construction contracts was recognised using the percentage-of-completion method based on client certified surveys of work performed, once the outcome of the contract could be estimated reliably.
IFRS 15 provides two alternative methods for recognising revenue i.e. the output method or the input method. The Group decided to adopt the input method since it faithfully depicts the Group’s performance in transferring control of the goods and services to the customer, provides meaningful information in respect of satisfied and unsatisfied performance obligations towards the customer and also enables Management to better analyse estimation accruals (accrued contract expenses), which prior to the adoption of IFRS 15 was calculated as a difference between actual costs and percentage-of-completion based costs.
At 1 January 2018, the cumulative catch-up adjustment of US$40m, recognised as a reduction to the opening reserves, impacted the following consolidated balance sheet line items as a result of applying the input method to those contracts that were not substantially completed at the date of initial application:
Input method US$m
Variable consideration
US$mTotal impact
US$m
Contract assets (42) (20) (62)Total assets (42) (20) (62)Cumulative catch-up adjustment Retained earnings (47) (21) (68)Non-controlling interests 7 – 7Total equity (opening reserves) (40) (21) (61)Deferred tax liabilities (8) – (8)Total non-current liabilities (8) – (8)Income tax payable (1) (1) (2)Accrued contract expenses 7 2 9Total current liabilities 6 1 7Total liabilities (2) 1 (1)Total equity and liabilities (42) (20) (62)
Variable considerationPrior to the adoption of IFRS 15, variable consideration, e.g. variation orders, incentive income, claims and liquidated damages, were recognised in the consolidated financial statements when it was considered probable that the associated monetary amounts would be settled by the customer using Management’s best estimate with reference to the contract, recent customer communications and other forms of documentary evidence.
Under IFRS 15 Management decided to use the expected value method to assess/re-assess variable consideration at contract inception and at each reporting date. This resulted in recognition of additional liquidated damages of US$2m and reduction in previously recognised variation orders of US$20m from applying the expected value method to those contracts that were not substantially completed at the date of initial application at 1 January 2018.
When assessing the likelihood of settlement with the customer, Management considers all relevant facts and circumstances available with reference to the contract, recent customer communication and other forms of documentary evidence available such that the amount of variable consideration assessed represents Management’s expected value and the estimated variable consideration is not expected to be constrained.
At 1 January 2018, the cumulative catch-up adjustment of US$21m, recognised as a reduction to the opening reserves, impacted the consolidated balance sheet line items in the table above as a result of applying the expected value method to those contracts that were not substantially completed at the date of initial application.
Advance payments received from customersAdvance payments received from customers for fixed-price engineering, procurement and construction contracts are structured primarily for reasons other than the provision of finance to the Group, (e.g. mobilisation costs), and they do not provide customers with an alternative to pay in arrears. In addition, the length of time between when the customer settles amounts to which the Group has an unconditional right to payment and the Group transfers goods and services to the customer is relatively short. Therefore, the Group concluded that there was not a significant financing component within such contracts. Currently, the Group does not have any contracts where payments by a customer are over several years after the Group has transferred goods and services to the customer; if such cases arise in future the transaction price for such contracts will be determined by discounting the amount of promised consideration using an appropriate discount rate. There was no transition impact at 1 January 2018.
Reimbursable engineering and production services contractsThe Group’s contracts with customers for the provision of reimbursable engineering and production services include distinct performance obligations based on the assessment that the service is capable of being distinct both individually and within the context of the contract. The Group concluded that the revenue from such services should be recognised over time given that the customer simultaneously receives and consumes the benefits provided by the Group, using the input method for measuring progress towards complete satisfaction of the performance obligation. Prior to adoption of IFRS 15 cost to cost method was used which is broadly in line with the input method. There is no transition impact at 1 January 2018.
Variable considerationPrior to adoption of IFRS 15 incentive payments were included in revenue when the contract was sufficiently advanced that it was probable that the specified performance standards would be met or exceeded, and the amount of the incentive payments could be measured reliably. Under IFRS 15 variable consideration, e.g. incentive payments, bonuses, etc. are estimated at contract inception and at the end of each reporting period using the single most likely amount method, where the outcome is expected to be binary. The IFRS 15 method is consistent with the previous practice and there was no transition impact at 1 January 2018.
Annual report and accounts 2018 Petrofac 119
Financial statem
entsG
overnance
Strateg
ic repo
rt

2 Summary of significant accounting policies continued
Advance payments received from customersThe Group does not generally receive advances from customers for its reimbursable engineering and production services contracts. If advances are received these are likely to be short term in nature. The Group concluded that in such cases it will use the practical expedient provided in IFRS 15 not to adjust the promised amount of the consideration for the effects when the Group expects at contract inception the period between the transfer of a promised good or service to a customer and when the customer pays for that good or service will be one year or less. Therefore, for short-term advances, the Group will not account for a financing component even if it is a significant amount. There is no transition impact at 1 January 2018.
Sale of goodsThe Group’s contracts with customers for the sale of crude oil and gas generally include one performance obligation. The Group concluded that revenue from the sale of crude oil and gas should be recognised at a point in time when control of the asset is transferred to the customer, generally on delivery of the goods. Therefore, the adoption of IFRS 15 did not have any impact on revenue recognition.
The Group’s Equity Upstream Investments and Production Enhancement Contracts are not impacted by the adoption of IFRS 15.
Warranty obligationsThe Group provides assurance-type warranties to customers that the related product will function as the parties intended due to the product being compliant with contractual specifications. The Group does not provide warranties as a service. Assurance-type warranties which will continue to be accounted for in accordance with IAS 37 ‘Provisions, Contingent Liabilities and Contingent Assets’ consistent with previous practice. There is no transition impact at 1 January 2018.
Principal versus agent considerationsThe Group concluded that it operates as principal in all its contracts with customers. There is no transition impact at 1 January 2018.
Presentation and disclosure requirementsThe Group discloses revenue recognised from contracts with customers disaggregated into categories that depict how the nature, amount, timing and uncertainty of revenue and cash flows are affected by economic factors. The Group also disclosed information about the relationship between the disclosure of disaggregated revenue and revenue information disclosed for each operating segment. Refer to note 3 for the disclosure on disaggregated revenue.
Balance sheet reclassificationIFRS 15 requires contract assets and contract liabilities for individual customer contracts to be presented on a net basis. Prior to the adoption of IFRS 15 such balances were presented gross. IFRS 15 also requires any unconditional rights to consideration to be disclosed as a receivable and any conditional rights to consideration to be disclosed separately as a contract asset.
At the date of initial application, the following presentation and classification changes were made to the consolidated balance sheet line items as a result of applying IFRS 15 (note 21):• ‘Work-in-progress’ was reclassified to ‘Contract assets’• ‘Advances received from customers’ of US$351m classified
within ‘Trade and other payables’ for individual customer contracts were offset against ‘Contract assets’ in the Engineering & Construction operating segment
• ‘Retention receivables’ of US$379m classified within ‘Trade and other receivables’ were reclassified to ‘Contract assets’ mainly relating to the Engineering & Construction operating segment
• ‘Billings in excess of cost and estimated earnings’ was reclassified to ‘Contract liabilities’
• ‘Advances received from customers’ of US$185m classified within ‘Trade and other payables’ for individual customer contracts that do not fully offset ‘Contract assets’ were reclassified to ‘Contract liabilities’
• ‘Trade receivables’ of US$165m representing conditional rights to consideration were reclassified to ‘Contract assets’, of which US$144m related to the Integrated Energy Services operating segment and US$21m related to the Engineering & Production Services operating segment. Also, an amount of US$40m was reclassified from ‘Trade receivables’ to non-current contract assets representing non-current receivables and related to the Engineering & Production Services operating segment
2.4 Financial reporting standards, amendments and interpretations issued but not yet effectiveStandards issued but not yet effective up to the date of issuance of the Group’s consolidated financial statements are listed below and include only those standards and amendments that are likely to have an impact on the financial performance, position and disclosures of the Group at a future date. The Group intends to adopt these standards when they become effective.
IFRS 16 LeasesIFRS 16 was issued in January 2016 and it replaces IAS 17 ‘Leases’, IFRIC 4 ‘Determining whether an Arrangement contains a Lease’, SIC-15 ‘Operating Leases – Incentives’ and SIC-27 ‘Evaluating the Substance of Transactions Involving the Legal Form of a Lease’. IFRS 16 sets out the principles for the recognition, measurement, presentation and disclosure of leases and requires lessees to account for all leases under a single on-balance sheet model similar to the accounting for finance leases under IAS 17. The standard includes two recognition exemptions for lessees – leases of ’low-value’ assets (e.g. personal computers) and short-term leases (i.e. leases with a lease term of 12 months or less). At the commencement date of a lease, a lessee will recognise a liability to make lease payments (i.e. the lease liability) and an asset representing the right to use the underlying asset during the lease term (i.e. the right-of-use asset). Lessees will be required to separately recognise the interest expense on the lease liability and the depreciation expense on the right-of-use asset.
Lessees will be also required to remeasure the lease liability upon the occurrence of certain events (e.g. a change in the lease term, a change in future lease payments resulting from a change in an index or rate used to determine those payments). The lessee will recognise the amount of the remeasurement of the lease liability as an adjustment to the right-of-use asset.
The Group will implement IFRS 16 ‘Leases’ on 1 January 2019 using the modified retrospective method, whereby the Group will measure the lease liability at the present value of the remaining lease payments, discounted using the lessee’s incremental borrowing rate at the date of initial application. A right-of-use asset will be recognised at an amount equal to the lease liability, adjusted by the amount of any prepaid or accrued lease payments, provision for onerous operating leases and rent-free period adjustments relating to that lease recognised in the balance sheet immediately before the date of initial application.
The Group will elect to apply IFRS 16 to contracts that were previously identified as operating leases in accordance with IAS 17 and IFRIC 4. Comparative information will not be restated. The Group will use the applicable exemptions of IFRS 16 and IFRS 16 will be applied to all non-cancellable leases except for those with low value assets or with a lease term of 12 months or less containing no purchase options.
NOTES TO THE CONSOLIDATED FINANCIAL STATEMENTSFOR THE YEAR ENDED 31 DECEMBER 2018CONTINUED
120 Annual report and accounts 2018 Petrofac

On 1 January 2019, the Group expects to recognise right-of-use assets of approximately US$40m – US$45m, within non-current assets in the consolidated balance sheet. These assets will be depreciated on a straight-line basis over the remaining term of each individual lease. There will be a lease liability of approximately US$80m – US$85m recognised at 1 January 2019, the majority of which will be recognised as a non-current liability in the consolidated balance sheet. Onerous operating leases of US$18m at 31 December 2018 and a rent-free period liability of US$9m at 31 December 2018 will be offset against right-of-use asset as at the date of initial application.
The preliminary estimated impact of implementing IFRS 16 on the Group’s 2019 consolidated financial statements is as follows:• A reduction to reported net profit by approximately US$1m
and increase in finance expense by approximately US$1m• With the exception of changes in classification, IFRS 16 will
have no impact on the Group’s reported total net cash flows• An increase in EBITDA by approximately US$10m – US$12m
Implementation of IFRS 16 will depend on the classification of leases as either short term or long term and enforceability of leases as either cancellable or non-cancellable, which will be determined by reference to the contractual terms of each individual lease and is dependent on several factors which may change in future periods. The estimated 2019 consolidated financial statements impact is computed based on the information available to date and the actual impact of IFRS 16 on the Group’s 2019 consolidated financial statements may differ from the estimates provided above.
Lessor accounting under IFRS 16 is substantially unchanged from current accounting under IAS 17 ‘Leases’. IFRS 16, which is effective for annual periods beginning on or after 1 January 2019, requires lessees and lessors to make more extensive disclosures than under IAS 17.
2.5 Basis of consolidationThe consolidated financial statements comprise the financial statements of Petrofac Limited (the “Company”) and entities controlled by the Company (its subsidiaries) as at 31 December 2018. Control is achieved when the Group is exposed, or has rights, to variable returns from its involvement with the investee and has the ability to affect those returns through its power over the investee.
Generally, there is a presumption that a majority of voting rights results in control. To support this presumption, and when the Group has less than a majority of the voting or similar rights of an investee, the Group considers all relevant facts and circumstances in assessing whether it has power over an investee, including:• Contractual arrangements with the other vote holders of the
investee• Rights arising from other contractual arrangements• Voting rights and potential voting rights of the Group
The Group re-assesses whether or not it controls an investee if facts and circumstances indicate that there are changes to one or more of the three elements of control. Consolidation of a subsidiary begins when the Group obtains control over the subsidiary and ceases when the Group loses control of the subsidiary. Assets, liabilities, income and expenses of a subsidiary acquired or disposed of during the reporting period are included in the consolidated statement of other comprehensive income from the date the Group gains control until the date the Group ceases to control the subsidiary.
Net profit or loss and each component of other comprehensive income (“OCI”) are attributed to Petrofac Limited shareholders and to non-controlling interests, even if this results in the non-controlling interests having a deficit balance. When necessary, adjustments are made to the financial statements of subsidiaries to align their accounting policies with the Group’s accounting policies.
All intra-group transactions, balances, income and expenses are eliminated on consolidation.
A change in the ownership interest of a subsidiary, without a loss of control, is accounted for as an equity transaction.
If the Group ceases to control a subsidiary, it derecognises the related assets (including goodwill), liabilities, non-controlling interest and other components of equity while any resultant gain or loss is recognised in the consolidated income statement. Any investment retained is recognised at fair value.
Business combinations and goodwillBusiness combinations are accounted for using the acquisition method. The cost of an acquisition is measured as the aggregate of the consideration transferred, which is measured at acquisition date fair value, and the amount of any non-controlling interests in the acquiree. For each business combination, the Group elects whether to measure the non-controlling interests in the acquiree at fair value or at the proportionate share of the acquiree’s identifiable net assets. All transaction costs associated with business combinations are charged to the consolidated income statement in the reporting period of such combination.
When the Group acquires a business, it assesses the financial assets and liabilities assumed for appropriate classification and designation in accordance with the contractual terms, economic circumstances and pertinent conditions as at the acquisition date. This includes the separation of embedded derivatives in host contracts by the acquiree. If the business combination is achieved in stages, any previously held equity interest is re-measured at its acquisition date fair value and any resulting gain or loss is recognised in the consolidated income statement.
Goodwill is initially measured at cost, being the excess of the aggregate consideration transferred and the fair value of the net assets acquired together with the amount recognised for non-controlling interests, and any previous interest held. If the fair value of the net assets acquired is in excess of the aggregate consideration transferred, the Group reassesses whether it has correctly identified all the assets acquired and all the liabilities assumed and reviews the procedures used to measure the amounts to be recognised at the acquisition date. If the reassessment still results in an excess of the fair value of net assets acquired over the aggregate consideration transferred, then the gain from a bargain purchase is recognised in the consolidated income statement.
Following initial recognition, goodwill is measured at cost less any accumulated impairment losses. Goodwill is reviewed for impairment annually or more frequently if events or changes in circumstances indicate that the carrying amount may be impaired.
For the purpose of impairment testing, goodwill is allocated to the cash-generating units that are expected to benefit from the synergies of the combination. Each unit or units to which goodwill is allocated represents the lowest level within the Group at which the goodwill is monitored for internal management purposes and is not larger than an operating segment determined in accordance with IFRS 8 ‘Operating Segments’.
Annual report and accounts 2018 Petrofac 121
Financial statem
entsG
overnance
Strateg
ic repo
rt

2 Summary of significant accounting policies continued
Impairment is determined by assessing the recoverable amount of the cash-generating units to which the goodwill relates. Where the recoverable amount of the cash-generating units is less than the carrying amount of the cash-generating units and related goodwill, an impairment charge is recognised in the consolidated income statement.
Where goodwill has been allocated to cash-generating units and part of the operation within those units is disposed of, the goodwill associated with the operation disposed of is included in the carrying amount of the operation when determining the gain or loss on disposal of the operation. Goodwill disposed of in this circumstance is measured based on the relative values of the operation disposed of and the value portion of the cash-generating units retained.
Investment in associates and joint venturesAn associate is an entity over which the Group has significant influence. Significant influence is the power to participate in the financial and operating policy decisions of the investee but is not control or joint control over those policies.
Joint control is the contractually agreed sharing of control of an arrangement, which exists only when decisions about the relevant activities require unanimous consent of the parties sharing control. There are two types of joint arrangements: joint venture and joint operation. A joint venture is a type of joint arrangement whereby the parties that have joint control of the arrangement have rights to the net assets of the joint venture. A joint operation is a type of joint arrangement whereby the parties that have joint control of the arrangement have rights to the assets and obligations for the liabilities relating to the joint arrangement.
The considerations made in determining significant influence or joint control are like those necessary to determine control over subsidiaries.
The Group’s investments in its associates and joint ventures are accounted for using the equity method. Under the equity method, the investment in an associate or a joint venture is initially recognised at cost. The carrying amount of the investment is adjusted to recognise changes in the Group’s share of net assets of the associate or joint venture since the acquisition date. Goodwill relating to the associate or joint venture is included in the carrying amount of the investment and is not tested for impairment separately.
The consolidated income statement reflects the Group’s share of the net profits of the associate or joint venture. Any change in other comprehensive income (“OCI”) of those investees is presented as part of the Group’s consolidated statement of other comprehensive income. In addition, when there has been a change recognised directly in the equity of the associate or joint venture, the Group recognises its share of any changes, when applicable, in the consolidated statement of changes in equity.
The Group’s share of net profit or loss of associates and joint ventures is presented separately in the consolidated income statement outside operating profit and represents profit or loss after tax and non-controlling interests.
Any unrealised gains and losses resulting from transactions between the Group and associates and joint ventures are eliminated to the extent of the Group’s ownership interest in these associates and joint ventures.
The financial statements of the associates and joint ventures are prepared for the same reporting period as the Group. When necessary, adjustments are made to align the accounting policies with those of the Group.
At end of each reporting period, the Group determines whether there is objective evidence that its investment in its associates or joint ventures are impaired. If there is such evidence, the Group calculates the amount of impairment as the difference between the recoverable amount of the associate or joint venture and its carrying amount and recognises any impairment loss as an exceptional item in the consolidated income statement.
Upon loss of significant influence over an associate or joint control over a joint venture, the Group measures and recognises any retained investment at fair value. Any difference between the carrying amount of the associate or joint venture upon loss of significant influence or joint control and the fair value of the retained investment and proceeds from disposal is recognised in the consolidated income statement.
Joint operationsThe Group’s interests in joint operations are recognised in relation to its interest in a joint operation’s:• Assets, including its share of any assets held jointly• Liabilities, including its share of any liabilities incurred jointly• Revenue from the sale of its share of the output arising from the
joint operation• Share of the revenue from the sale of the output by the joint
operation• Expenses, including its share of any expenses incurred jointly
Under joint operations, Group incurred expenses and its share of the revenue earned are recognised in the consolidated income statement. Assets controlled and liabilities incurred by the Group are recognised in the consolidated balance sheet.
Foreign currency translationThe Group’s consolidated financial statements are presented in United States dollars (“US$m”), which is also the Company’s functional currency.
Each entity in the Group determines its own functional currency and items included in the financial statements of each entity are measured using that functional currency. Functional currency is defined as the currency of the primary economic environment in which the entity operates. The Group uses the direct method of consolidation and on disposal of a foreign operation, the gain or loss that is reclassified to net profit or loss reflects the amount that arises from using this method.
Transactions and balancesTransactions in foreign currencies are initially recorded by the Group’s entities at their respective functional currency spot rates at the date the transaction first qualifies for recognition.
Monetary assets and liabilities denominated in foreign currencies are translated at the functional currency spot rates of exchange at the reporting date.
Differences arising on settlement or translation of monetary items are recognised in profit or loss with the exception of monetary items that are designated as part of the hedge of the Group’s net investment of a foreign operation. These are recognised in the consolidated statement of other comprehensive income until the net investment is disposed of, at which time the cumulative amount is reclassified to profit or loss. Tax charges and credits attributable to exchange differences on those monetary items are also recognised in the consolidated statement of other comprehensive income.
NOTES TO THE CONSOLIDATED FINANCIAL STATEMENTS FOR THE YEAR ENDED 31 DECEMBER 2018CONTINUED
122 Annual report and accounts 2018 Petrofac

Non-monetary items that are measured at historical cost in a foreign currency are translated using the exchange rates at the dates of the initial transactions. Non-monetary items measured at fair value in a foreign currency are translated using the exchange rates at the date when the fair value is determined. The gain or loss arising on translation of non-monetary items measured at fair value is treated in line with the recognition of the gain or loss on the change in fair value of the item (i.e. translation differences on items whose fair value gain or loss is recognised in the consolidated statement of other comprehensive income or profit or loss are also recognised in the consolidated statement of other comprehensive income or profit or loss, respectively).
Group subsidiariesOn consolidation, the assets and liabilities of subsidiaries with non-United States dollars functional currencies are translated into United States dollars at the rate of exchange prevailing at the reporting date and their income statements are translated at exchange rates prevailing at the transaction dates. The exchange differences arising on translation for consolidation are recognised in the consolidated statement of other comprehensive income. On disposal of a subsidiary with non-United States dollars functional currency, the component of the consolidated statement of other comprehensive income relating to currency translation is recognised in the consolidated income statement.
Any goodwill arising on the acquisition of a subsidiary with non-United States dollars functional currencies and any fair value adjustments to the carrying amounts of assets and liabilities arising on the acquisition are treated as assets and liabilities of the foreign operation and translated at the spot rate of exchange at the reporting date.
2.6 Significant accounting judgements and estimatesJudgementsIn the process of applying the Group’s accounting policies, management has made the following judgements, apart from those involving estimations, which have the most significant effect on the amounts recognised in the consolidated financial statements:• Revenue recognition on fixed-price engineering, procurement
and construction contracts: the Group measures progress and recognises revenue on fixed-price engineering, procurement and construction contracts using the input method, based on the actual cost of work performed at end of the reporting period as a percentage of the estimated total contract costs at completion. The input method faithfully depicts the Group’s performance in transferring control of goods and services to the customer, provides meaningful information in respect of satisfied and unsatisfied performance obligations towards the customer
• Revenue recognition on consortium contracts: the Group recognises its share of revenue from contracts executed as part of a consortium. The Group uses the input method to recognise revenue for the reporting period and recognises its share of revenue and costs in accordance with the agreed consortium contractual arrangement. In selecting the appropriate accounting treatment, the main considerations are: – Determination of whether the joint arrangement is a joint operation or joint venture (though not directly related to revenue recognition this judgement has a material impact on presentation in the consolidated income statement) in accordance with IFRS 11 ‘Joint Arrangements’
In selecting the most relevant and reliable accounting policies in relation to revenue recognition, joint arrangement accounting and capitalisation of assets for contracts executed by the Integrated Energy Services (“IES”) operating segment, the main considerations are as follows:• Determination of whether the joint arrangement is a joint
operation or joint venture (though not directly related to revenue recognition this judgement has a material impact on presentation in the consolidated income statement) in accordance with IFRS 11 ‘Joint Arrangements’
• The nature and extent, if any, of volume and price financial exposures under the terms of the contract
• The extent to which the Group’s capital investment is at risk and the mechanism for recoverability under the terms of the contract
• At what point can the revenues from each type of contract be reliably measured and recognised in accordance with IFRS 15 ‘Revenue from Contracts with Customers’
• Whether there are any other remaining features unique to the contract that are relevant to the assessment of revenue recognition
Revenue recognition of IES contracts:• The Group assesses on a case by case basis the most
appropriate treatment for its various commercial structures which include Production Enhancement Contracts (“PECs”) and Equity Upstream Investments including Production Sharing Contracts (“PSCs”) (see accounting policies note on page 126 for further details)
IES contracts are classified in the consolidated balance sheet as follows:• The Group assesses on a case by case basis the most
appropriate consolidated balance sheet classification of its Production Enhancement Contracts and Equity Upstream Investments (see accounting policy notes on page 126)
• In selecting the most appropriate policies for IES contracts the main judgements are as follows: – The Mexican PEC assets are classified as oil and gas assets within property, plant and equipment in the consolidated balance sheet as there is direct exposure to variable field production levels, and indirect exposure to changes in hydrocarbon prices. These exposures impact the generation of cash from the assets and any financial return thereon, including the risk of negative financial return. Management believes this classification is most appropriate due to the nature of expenditure and it is aligned with our treatment in respect of PSC arrangements where the risk/reward profile is similar
– Upon migration of PEC to PSC arrangements, the existing PEC net assets will be derecognised and an oil and gas asset within property, plant and equipment, representing the Group’s ownership interest in the PSC, will be recognised in the consolidated balance sheet. Any gain or loss arising on the migration will be recognised as an exceptional item in the consolidated income statement. The migrated PSC arrangements will be treated as a joint operation since all the decisions concerning the relevant activities of the unincorporated joint operation will require unanimous consent of the joint operation partners
Annual report and accounts 2018 Petrofac 123
Financial statem
entsG
overnance
Strateg
ic repo
rt

2 Summary of significant accounting policies continued
Estimation uncertaintyThe key assumptions concerning the future and other key sources of estimation uncertainty at the end of the reporting period that have a significant risk of causing a material adjustment to the carrying amounts of assets and liabilities within the next financial year are discussed below:• Liquidated damages (“LDs”): the Group provides for LD
claims, using the expected value approach to assess/re-assess LDs at contract inception and at each reporting date, where the customer has the contractual right to apply LDs and where it is highly probable that a significant reversal in the amount of cumulative revenue recognised will not occur when the uncertainty associated with the LD is subsequently resolved. This requires a probabilistic assessment of the monetary amount of LDs payable which involves a number of Management judgements and assumptions, (e.g. contractual position with the customer, negotiations with the customer specifically relating to extension of time (“EoT”), past experience with the customer, etc.), regarding the amounts to recognise in contract accounting. No additional amounts were provided during the year for LD claims (2017: US$4m)
• Contract costs to complete estimates: at the end of the reporting period the Group is required to estimate costs to complete on fixed-price contracts, based on work to be performed beyond the reporting period. This involves objective evaluation of project progress against the delivery schedule, evaluation of work to be performed and the associated costs to fully deliver the contract to the customer. This estimate will impact revenues, cost of sales, contract assets, contract liabilities and accrued contract expenses
• Recognition of variation orders (“VOs”): the Group recognises revenues and margins from VOs using the expected value approach to assess/re-assess VOs at contract inception and at each reporting date where it is considered highly probable that a significant reversal in the amount of cumulative revenue recognised will not occur when the uncertainty associated with the VO is subsequently resolved. In performing the assessment Management considers the likelihood of such settlement being made by reference to the contract, customer communications and other forms of documentary evidence. At 31 December 2018, the work in progress line item in the consolidated balance sheet includes variation orders of US$235m (2017: US$374m)
• Onerous contract provisions: the Group recognises an onerous contract provision (IAS 37 ‘Provisions, Contingent Liabilities and Contingent Assets’) for future losses on contracts where it is considered probable that contract costs are likely to exceed revenues at contract completion. Estimating future losses involves making a number of assumptions, (e.g. contractual position with the customer, vendors and subcontractors, negotiations with the customer, vendors and subcontractors, cost to complete estimates, past experience with the customer, vendors and subcontractors, etc.), about the achievement of contract performance targets and the likely levels of future cost escalation over time. The carrying amount of onerous contract provisions at 31 December 2018 was US$18m (2017: US$16m). See note 28
• Onerous operating lease provision: the Group provides for future costs on its non-cancellable operating leases where it is considered probable that the leasehold office buildings will remain vacant or underutilised in future years due to reduced business activity. Assumptions involve an estimate of future business growth and the likely levels of occupancy over time. The carrying amount of the onerous operating lease provision at 31 December 2018 was US$18m (2017: US$18m). See note 28
• Impairment of goodwill: the Group determines whether goodwill is impaired at least on an annual basis. This requires an estimation of the value in use of the cash-generating units to which the goodwill is allocated. Estimating the value in use requires the Group to make an estimate of the expected future cash flows from each cash-generating unit and also to determine an appropriate discount rate in order to calculate the present value of those cash flows. The carrying amount of goodwill at 31 December 2018 was US$73m (2017: US$76m). See note 14
• Deferred tax assets: the Group recognises deferred tax assets on all applicable temporary differences where it is probable that the tax assets estimated are realised and future taxable profits will be available for utilisation. This requires Management to make judgements and assumptions regarding the interpretation of tax laws and regulations as they apply to events in the period and the amount of deferred tax that can be recognised based on the magnitude and likelihood of future taxable profits which are estimated from management assumptions with respect to the outcome of future events. The carrying amount of net deferred tax assets at 31 December 2018 was US$128m (2017: US$101m). Included within the gross assets is US$33m (2017: US$33m) on which a management judgement has been made on the probable treatment of the Migration of Santuario Production Enhancement Contract (PEC) to Production Sharing Contract (PSC) for tax purposes, based on professional external advice
• Income tax: Group entities are routinely subject to tax audits and assessments including processes whereby tax return filings are discussed and agreed with the relevant tax authorities. Whilst the ultimate outcome of such tax audits and discussions cannot be determined with certainty, Management estimates the level of tax provisioning required for amounts where there is a probable future outflow, based on the applicable law and regulations, historic outcomes of similar audits and discussions, professional external advice and consideration of the progress on, and nature of, current discussions with the tax authority concerned. The ultimate outcome following resolution of such audits and assessments may be materially higher or lower than the amount provided. The carrying amount of uncertain tax positions (“UTPs”), recognised within income tax payable line item of the consolidated balance sheet at 31 December 2018, was US$101m (2017: US$93m)
• Other taxes payable: the Group accrues indirect taxes, such as value added tax, to the extent it is probable that there will be an associated tax payment or receipt in respect of relevant income and expenses. This requires Management to make judgements and assumptions on the application of tax laws and regulations to events in the period. The ultimate outcome may result in materially higher or lower payments or receipts
• Recoverable amount of property, plant and equipment, intangible assets and other financial assets: the Group determines at the end of the reporting period whether there are indicators of impairment in the carrying amount of its property, plant and equipment, intangible assets and other financial assets. Where indicators exist, an impairment test is undertaken which requires management to estimate the recoverable amount of its assets which is initially based on its value in use. When necessary, fair value less costs of disposal is estimated, for example, by reference to quoted market values, similar arm’s length transactions involving these assets or risk adjusted discounted cash flow models. For the following specific assets, certain assumptions and estimates have been made in determining recoverable amounts. Should any changes occur in these assumptions, further impairment may be required in future periods: – In respect of oil and gas assets in Mexico there were no indicators for impairment at 31 December 2018, mainly relating to the oil price assumptions and the reserves for oil and gas production. The recoverable amount of the assets is influenced
NOTES TO THE CONSOLIDATED FINANCIAL STATEMENTS FOR THE YEAR ENDED 31 DECEMBER 2018CONTINUED
124 Annual report and accounts 2018 Petrofac

by the timing and outcome of ongoing contractual negotiations in respect of the outstanding PECs migration to PSCs. Key judgements include the expected working interest in the PSCs and financial and fiscal terms achieved upon migration. Management considered the impact of delay in migration and believed that the carrying amount of the assets in Mexico of US$526m reflected an expected outcome of a commercial negotiation in respect of migrations.
– Block PM304 oil and gas asset in Malaysia had a carrying amount of US$234m (2017: US$244m); the recoverable amount, which was based on fair value less cost of disposal, was higher than the asset’s carrying amount
• Recoverable amount of contingent consideration: the carrying amount of the Pánuco contingent consideration was US$45m at 31 December 2018, after recognising a fair value loss of US$43m during 2018 as an exceptional item in the consolidated income statement. The downward fair value adjustment was a significant Management estimate in response to considerable uncertainty concerning the timing and outcome of migration of the Pánuco PEC to a PSC and whether the contingent consideration pay out conditions will be achieved. Management considered alternative scenarios to assess the recoverability of the Pánuco contingent consideration, including but not limited to the impact of delay in migration or renegotiation of the contingent consideration in the event of migration to another form of contract. Based on this assessment Management estimated that the carrying amount of the contingent consideration of US$45m reflected an expected outcome of a commercial negotiation in respect of migration or an alternative migration. This was a significant accounting estimate made by Management to determine the fair value of the contingent consideration at 31 December 2018. A fair value loss would be recognised in the consolidated income statement if the actual outcome of the migration or commercial negotiation is different to Management’s current expectation
• Recoverable amount of deferred consideration: the deferred consideration relating to disposal of JSD6000 installation vessel (the “vessel”), representing a contractual right to the Group, was recognised as a non-current asset in the consolidated balance sheet. The deferred consideration was initially measured and recognised at fair value and will be subsequently measured at fair value through profit or loss with any fair value gain and loss recognised as an exceptional item in the consolidated income statement. The fair value of the deferred consideration, with Management’s current involvement and recent discussions with the Group’s partner in the construction of the vessel, is based on the assumption that the Group’s partner has the continued intent and the required capabilities to complete the construction and commissioning of the vessel within the due timeframe. At the end of each reporting date, Management will review its estimate to assess the ability of the Group’s partner to complete the construction and commissioning of the vessel and under such circumstances that may impair the Group’s partner’s ability to complete these activities, a fair value loss would be recognised in the consolidated income statement
In 2018, there were pre-tax impairment charges and fair value re- measurements of US$280m (2017: US$422m), post-tax US$211m (2017: US$367m) which are explained in note 6. The key sources of estimation uncertainty for these measurements are consistent with those disclosed in note 6• Units of production depreciation: estimated proven plus
probable reserves are used in determining the depreciation of oil and gas assets such that the depreciation charge is proportional to the depletion of the remaining reserves over the shorter of: life of the field or the end of the respective licence/concession period. These calculations require the use of estimates including the amount of economically recoverable reserves and future oil and gas capital expenditure (note 12)
• Decommissioning costs: the recognition and measurement of decommissioning provisions involves the use of estimates and assumptions which include the existence of an obligation to dismantle and remove a facility or restore the site on which it is located, the appropriate discount and inflation rates to use in determining the present value of the liability, the estimated costs of decommissioning based on internal and external estimates and the payment dates for expected decommissioning costs. As a result, actual costs could differ from estimated cost estimates used to provide for decommissioning obligations. The provision for decommissioning at 31 December 2018 of US$95m (2017: US$138m) represents management’s best estimate of the present value of future decommissioning costs
2.7 Significant accounting policiesRevenue from contracts with customersThe Group’s principal activity is the provision of services to the oil and gas production and processing industry. Revenue from contracts with customers is recognised when control of the goods or services are transferred to the customer at an amount that reflects the consideration to which the Group expects to be entitled in exchange for those goods or services. The Group has generally concluded that it is the principal in its revenue arrangements, because it typically controls the goods or services before transferring them to the customer.
The Group provides warranties to customers with assurance that the related product will function as the parties intended because it complies with agreed-upon specifications. The Group does not provide warranties as a service, in addition to the assurance that the product complies with agreed-upon specifications, in its contracts with customers. As such, the Group expects that such warranties will be assurance-type warranties which will continue to be accounted for under IAS 37 ‘Provisions, Contingent Liabilities and Contingent Assets’.
Engineering & Construction (E&C)For fixed-price engineering, procurement and construction contracts, the Group measures progress and recognises revenue using the input method, based on the actual cost of work performed at end of the reporting period as a percentage of total contract costs at completion once the outcome of a contract can be estimated reliably. In the early stages of contract completion, (i.e. contract progress up to between 15% to 35% depending on the risk evaluation for each individual contract taking into account contract value, duration and complexities involved in the execution of the contract), when the outcome of a contract cannot be estimated reliably, contract revenues are recognised only to the extent of costs incurred that are expected to be recoverable. The services provided under the contract are satisfied over time rather than at a point in time since the customer simultaneously receives and consumes the benefits provided by the Group.
The fixed-price engineering, procurement and construction contracts contain distinct goods and services but these are not distinct in the context of the contract and are therefore combined into a single performance obligation. At contract inception the Group considers the following factors to determine whether the contract contains a single performance obligation or multiple performance obligations:• It provides a significant service of integrating the goods or
services with other goods or services promised in the contract into a bundle of goods or services that represent the combined output or outputs for which the customer has contracted
• One or more of the goods or services significantly modifies or customises, or are significantly modified or customised by, one or more of the other goods or services promised in the contract
• The goods or services are highly interdependent or highly interrelated
Annual report and accounts 2018 Petrofac 125
Financial statem
entsG
overnance
Strateg
ic repo
rt

2 Summary of significant accounting policies continued
Contract modifications, e.g. variation orders, are accounted for as part of the existing contract, with a cumulative catch up adjustment to revenue. For material contract modifications a separate contract may be recognised, based on Management’s assessment of the following factors:• The scope of the contract increases because of the addition of
promised goods or services that are distinct; and• The price of the contract increases by an amount of
consideration that reflects the Group’s stand-alone selling prices of the additional promised goods or services and any appropriate adjustments to that price to reflect the circumstances of the particular contract
Variable consideration e.g. variation orders, liquidated damages and incentive payments are assessed/re-assessed using the expected value approach or most likely outcome method, as appropriate, at contract inception and at each reporting date where it is considered highly probable that a significant reversal in the amount of cumulative revenue recognised will not occur when the uncertainty associated with the variable consideration is subsequently resolved. In performing the assessment Management considers the likelihood of such settlement being made by reference to the contract, customer communications and other forms of documentary evidence.
Revenues from cost-plus-fee contracts and reimbursable contracts are recognised using the input method for measuring progress towards complete satisfaction of the performance obligation.
An onerous contract provision is recognised for all losses expected to arise on completion of contracts entered into at the reporting date, whether or not work has commenced on these contracts.
Advance payments received from customers for fixed-price engineering, procurement and construction contracts are structured primarily for reasons other than the provision of finance to the Group, (e.g. mobilisation costs), and they do not provide customers with an alternative to pay in arrears. In addition, the length of time between when the customer settles amounts to which the Group has an unconditional right to payment and the Group transfers goods and services to the customer is relatively short. Therefore, the Group has concluded that there is not a significant financing component within such contracts. Currently, the Group does not have any contracts where payments by a customer are over several years after the Group has transferred goods and services to the customer; if such cases arise in future the transaction price for such contracts will be determined by discounting the amount of promised consideration using an appropriate discount rate.
Engineering & Production Services (EPS)The Group’s contracts with customers for the provision of reimbursable engineering and production services include distinct performance obligations based on the assessment that the service is capable of being distinct both individually and within the context of the contract. The services are satisfied over time given that the customer simultaneously receives and consumes the benefits provided by the Group, using the input method for measuring progress towards complete satisfaction of the performance obligation.
Variable consideration, e.g. incentive payments and performance bonuses will be estimated at contract inception and at the end of each reporting period using the single most likely amount approach, where the outcome is expected to be binary and where
it is considered highly probable that a significant reversal in the amount of cumulative revenue recognised will not occur when the uncertainty associated with the variable consideration is subsequently resolved.
Revenues from fixed-price contracts are recognised using the input method, measured by milestones completed or earned value once the outcome of a contract can be estimated reliably. In the early stages of contract completion, when the outcome of a contract cannot be estimated reliably, contract revenues are recognised only to the extent of costs incurred that are expected to be recoverable.
The Group does not generally receive advances from customers for its reimbursable engineering and production services contracts. If advances are received these will only be short term. In such cases the Group applies the practical expedient provided in IFRS 15 ‘Revenue from Contracts with Customers’, and will not adjust the promised amount of the consideration for the effects of a significant financing component in the contracts, where the Group expects at contract inception that the period between the Group transfer of a promised good or service to a customer and when the customer pays for that good or service will be one year or less. Therefore, for short-term advances, the Group will not account for a financing component even if it is a significant amount.
Integrated Energy Services (IES)Production Enhancement Contracts (PEC)Revenue from PECs is recognised based on the volume of hydrocarbons produced in the period and the agreed tariff and the reimbursement arrangement for costs incurred.
Equity Upstream InvestmentsOil and gas revenues comprise the Group’s share of sales from the processing or sale of hydrocarbons from the Group’s Equity Upstream Investments on an entitlement basis, when the significant risks and rewards of ownership have been passed to the buyer.
Property, plant and equipmentProperty, plant and equipment is measured at cost less accumulated depreciation and accumulated impairment charges. Cost comprises the purchase price or construction cost and any costs directly attributable to making that asset capable of operating as intended. The purchase price or construction cost is the aggregate amount paid and the fair value of any other consideration given to acquire the asset. Depreciation is provided on a straight-line basis, other than on oil and gas assets, over the period as follows:
Oil and gas facilities 8 to 10 yearsPlant and equipment 3 to 25 yearsBuildings and leasehold improvements
3 to 20 years (or lease term if shorter)
Office furniture and equipment 2 to 4 yearsVehicles 3 to 5 years
Oil and gas assets are depreciated, on a field-by-field basis, using the unit-of-production method based on entitlement to proven and probable reserves, taking account of estimated future development expenditure relating to those reserves; refer to page 39 for life of these fields.
Each asset’s estimated useful life, residual value and method of depreciation are reviewed and adjusted if appropriate at the end of the reporting period. No depreciation is charged on land or assets under construction.
NOTES TO THE CONSOLIDATED FINANCIAL STATEMENTSFOR THE YEAR ENDED 31 DECEMBER 2018CONTINUED
126 Annual report and accounts 2018 Petrofac

The carrying amount of an item of property, plant and equipment is derecognised on disposal or when no future economic benefits are expected from its use. The gain or loss arising from the derecognition of an item of property, plant and equipment is included in the other operating income line item in the consolidated income statement when the asset is derecognised.
Intangible assets – non oil and gas assetsIntangible assets acquired in a business combination are initially measured at cost being their fair values at the date of acquisition and are recognised separately from goodwill where the asset is separable or arises from a contractual or other legal right and its fair value can be measured reliably. After initial recognition, intangible assets are carried at cost less accumulated amortisation and accumulated impairment charges.
Intangible assets with a finite life are amortised over their useful economic life using a straight-line method unless a better method reflecting the pattern in which the asset’s future economic benefits are expected to be consumed can be determined. The amortisation charge of intangible assets is included in the selling, general and administration expenses line item of the consolidated income statement. The expected useful lives of assets are reviewed on an annual basis. Any change in the useful life or pattern of consumption of the intangible asset is treated as a change in accounting estimate and is accounted for prospectively by changing the amortisation period or method. Intangible assets are tested for impairment whenever there is an indication that the asset may be impaired.
Research and development costsResearch costs are expensed as incurred. Development expenditures are recognised as an intangible asset when the Group can demonstrate:• The technical feasibility of completing the intangible asset so
that the asset will be available for use or sale• Its intention to complete and its ability and intention to use or
sell the asset• How the asset will generate future economic benefits• The availability of resources to complete the asset• The ability to measure reliably the expenditure during
development
Following initial recognition of the development expenditure as an asset, the asset is carried at cost less any accumulated amortisation and accumulated impairment charges. Amortisation of the asset begins when development is complete and the asset is available for use. It is amortised over the period of expected future benefit. Amortisation is included in the selling, general and administration expenses line item of the consolidated income statement. During the period of development, the asset is tested for impairment annually. At 31 December 2018, the carrying amount of capitalised development costs was US$7m (2017: US$nil). This amount relates to investment in the development and implementation of Group-wide cloud-based Enterprise Resource Planning (“ERP”) and digital systems. The useful life of the ERP system when it is available for use is expected to be 4 to 7 years.
Oil and gas assetsCapitalised costsThe Group’s activities in relation to oil and gas assets are limited to assets in the evaluation (or appraisal), development and production phases.
Oil and gas evaluation (or appraisal) and development expenditure is accounted for using the successful efforts method of accounting.
Evaluation expendituresExpenditure directly associated with evaluation (or appraisal) activities is capitalised as an intangible oil and gas asset. Such costs include the costs of acquiring an interest, appraisal well drilling costs, payments to contractors and an appropriate share of directly attributable overheads incurred during the evaluation phase. For such appraisal activity, which may require drilling of further wells, costs continue to be recognised as an asset whilst related hydrocarbons are considered capable of commercial development. Such costs are subject to technical, commercial and management review to confirm the continued intent to develop, or otherwise extract value. When this is no longer the case, the costs are written-off in the consolidated income statement. When such assets are declared part of a commercial development, related costs are transferred to property, plant and equipment. All intangible oil and gas assets are assessed for any impairment prior to transfer and any impairment charge is recognised in the consolidated income statement.
Development expendituresExpenditures relating to the development of assets which includes the construction, installation and completion of infrastructure facilities such as platforms, pipelines and vessels are capitalised within property, plant and equipment as oil and gas facilities. Expenditures relating to the drilling and completion of production wells are capitalised within property, plant and equipment as oil and gas assets.
Changes in unit-of-production factorsChanges in factors which affect unit-of-production calculations are dealt with prospectively in accordance with the treatment of changes in accounting estimates, not by immediate adjustment of amounts recognised in prior reporting periods.
DecommissioningProvision for future decommissioning costs is made in full when the Group has an obligation to dismantle and remove a facility or an item of plant and to restore the site on which it is located, and when a reasonable estimate of that liability can be made. The amount recognised is the present value of the estimated future decommissioning costs. An amount equivalent to the discounted initial provision for decommissioning costs is capitalised and depreciated over the life of the underlying asset on a unit-of-production basis over proven and probable reserves. Any change in the present value of the estimated decommissioning costs is reflected as an adjustment to the provision and the oil and gas asset.
The unwinding of the discount applied to future decommissioning provisions is included in the finance expense line item in the consolidated income statement.
Impairment of non-current assets (excluding goodwill)At each reporting date, the Group reviews the carrying amounts of its property, plant and equipment and intangible assets to assess whether there is an indication that those assets may be impaired. If any such indication exists, the Group makes an estimate of the asset’s recoverable amount. An asset’s recoverable amount is the higher of its fair value less costs of disposal and its value in use. In assessing value in use, the estimated future cash flows attributable to the asset are discounted to their present value using a pre-tax discount rate that reflects current market assessments of the time value of money and the risks specific to the asset. Fair value less costs of disposal is based on the risk-adjusted discounted cash flow models and includes value attributable to contingent resources. A post-tax discount rate is used in such calculations. The Group uses pre-tax discount rate to discount pre-tax cash flows and post-tax discount rate to discount post-tax cash flows.
Annual report and accounts 2018 Petrofac 127
Financial statem
entsG
overnance
Strateg
ic repo
rt

2 Summary of significant accounting policies continued
If the recoverable amount of an asset is estimated to be less than its carrying amount, the carrying amount of the asset is reduced to its recoverable amount. An impairment charge is recognised immediately in the consolidated income statement, unless the relevant asset is carried at a revalued amount, in which case the impairment loss is treated as a revaluation decrease.
Where an impairment loss subsequently reverses, the carrying amount of the asset is increased to the revised estimate of its recoverable amount, but so that the increased carrying amount does not exceed the carrying amount that would have been determined had no impairment loss been recognised for the asset in prior reporting periods. A reversal of an impairment loss is recognised immediately in the consolidated income statement, unless the relevant asset is carried at a revalued amount, in which case the reversal of the impairment is treated as a revaluation increase.
Non-current assets held for saleNon-current assets or disposal groups are classified as held for sale when it is highly probable that the carrying amount of the asset will be recovered principally through a sale transaction rather than through continuing use and the non-current assets or disposal group are available for immediate sale in their present condition. Assets are not depreciated when classified as held for sale.
InventoriesInventories are valued at the lower of cost and net realisable value. Net realisable value is the estimated selling price in the ordinary course of business, less estimated costs of completion and the estimated costs necessary to make the sale. Cost comprises purchase price, cost of production, transportation and other directly allocable expenses.
Costs of inventories, other than raw materials, are determined using the first-in-first-out method. Costs of raw materials are determined using the weighted average method.
Contract assets and contract liabilitiesContract assetsA contract asset is the right to consideration in exchange for goods or services transferred to the customer. If the Group performs by transferring goods or services to a customer before the customer pays consideration or before payment is due, a contract asset is recognised for the earned consideration that is conditional.
Fixed-price engineering, procurement and construction contracts are presented in the consolidated balance sheet as follows:• For each contract, the revenue recognised at the contract’s
measure of progress using input method, after deducting the progress payments received or receivable from the customers, is presented within the contract assets line item in the consolidated balance sheet as work in progress. The amounts recognised as work in progress are adjusted for any expected credit loss allowance using the probability of default of the counter party. The probability of default data for the counter party is sourced from a third-party provider
Contract liabilitiesA contract liability is the obligation to transfer goods or services to a customer for which the Group has received consideration (or an amount of consideration is due) from the customer. If a customer pays consideration before the Group transfers goods or services to the customer, a contract liability is recognised when the payment is made or the payment is due (whichever is earlier).
Contract liabilities are recognised as revenue when the Group performs under the contract.
Fixed-price engineering, procurement and construction contracts are presented in the consolidated balance sheet as follows:• Where the payments received or receivable for any contract
exceed revenue recognised, the excess is presented within the contract liabilities line item in the consolidated balance sheet as billings in excess of cost and estimated earnings
Incremental costs of obtaining a contractThe Group recognises an asset in respect of the incremental costs of obtaining a contract with a customer if the Group expects to recover those costs. Such capitalised costs are expensed over the life of the contract. The Group also applies the practical expedient to recognise the incremental costs of obtaining a contract as an expense when incurred if the amortisation period of the asset that the entity otherwise would have recognised is one year or less. At 31 December 2018, there were no such incremental costs recognised as an asset in the consolidated balance sheet.
Trade receivablesA trade receivable represents the Group’s right to an amount of consideration that is unconditional (i.e. only the passage of time is required before payment of the consideration is due). Refer to accounting policies of financial assets on pages 129 and 130.
Cash and cash equivalentsCash and cash equivalents consist of cash at bank and in hand and short-term deposits with an original maturity of three months or less, including expected credit loss allowance calculated based on the probability of default data for the counterparty sourced from a third-party provider.
For the purpose of the consolidated statement of cash flow, cash and cash equivalents consists of cash and cash equivalents as defined above, including outstanding bank overdrafts.
ProvisionsProvisions are recognised when the Group has a present legal or constructive obligation as a result of past events, it is probable that an outflow of resources will be required to settle the obligation and a reliable estimate can be made of the amount of the obligation. If the time value of money is material, provisions are discounted using a pre-tax rate that reflects, where appropriate, the risks specific to the liability. Where discounting is used, the increase in the provision due to the passage of time is recognised in the consolidated income statement as a finance expense.
Fair value measurementThe Group measures financial instruments, such as derivatives, and contingent consideration receivable at fair value at each reporting date. Fair value related disclosures for financial instruments are disclosed in note 18.
Fair value is the price that would be received to sell an asset or paid to transfer a liability in an orderly transaction between market participants at the measurement date. The fair value measurement is based on the presumption that the transaction to sell the asset or transfer the liability takes place either:• In the principal market for the asset or liability, or• In the absence of a principal market, in the most advantageous
market for the asset or liability
The principal or the most advantageous market must be accessible by the Group.
The fair value of an asset or a liability is measured using the assumptions that market participants would use when pricing the asset or liability, assuming that market participants act in their economic best interest.
NOTES TO THE CONSOLIDATED FINANCIAL STATEMENTSFOR THE YEAR ENDED 31 DECEMBER 2018CONTINUED
128 Annual report and accounts 2018 Petrofac

A fair value measurement of a non-financial asset takes into account a market participant’s ability to generate economic benefits by using the asset in its highest and best use or by selling it to another market participant that would use the asset in its highest and best use.
The Group uses valuation techniques that are appropriate in the circumstances and for which sufficient data is available to measure fair value, maximising the use of relevant observable inputs and minimising the use of unobservable inputs.
All assets and liabilities for which fair value is measured or disclosed in the consolidated financial statements are categorised within the fair value hierarchy, described as follows, based on the lowest level input that is significant to the fair value measurement as a whole:• Level 1 – Unadjusted quoted prices in active markets for
identical financial assets or liabilities• Level 2 – Inputs other than quoted prices included within Level
1 that are observable for the asset or liability, either directly (i.e. as prices) or indirectly (i.e. derived from prices)
• Level 3 – Inputs for the asset or liability that are not based on observable market data (unobservable inputs)
For assets and liabilities that are recognised in the consolidated financial statements on a recurring basis, the Group determines whether transfers have occurred between levels in the hierarchy by re-assessing categorisation (based on the lowest level input that is significant to the fair value measurement as a whole) at the end of each reporting period.
For the purpose of fair value disclosures, the Group has determined classes of assets and liabilities on the basis of the nature, characteristics and risks of the asset or liability and the level of the fair value hierarchy as explained above.
Financial assets and financial liabilitiesA financial instrument is any contract that gives rise to a financial asset of one entity and a financial liability or equity instrument of another entity.
Financial assetsInitial recognition and measurementFinancial assets are classified at initial recognition, as subsequently measured at amortised cost, fair value through other comprehensive income (OCI), fair value through profit or loss, or as derivatives designated as hedging instruments in an effective hedge, as appropriate.
All financial assets are recognised initially at fair value plus, in the case of financial assets not recorded at fair value, transaction costs that are attributable to the acquisition of the financial asset.
The classification of financial assets at initial recognition depends on the financial asset’s contractual cash flow characteristics and the Group’s business model for managing them. With the exception of trade receivables that do not contain a significant financing component, the Group initially measures a financial asset at its fair value plus, in the case of a financial asset not at fair value through profit or loss, transaction costs. Trade receivables that do not contain a significant financing component are measured at the transaction price determined under IFRS 15 ‘Revenue from Contracts with Customers’.
In order for a financial asset to be classified and measured at amortised cost it needs to give rise to cash flows that are ‘solely payments of principal and interest’ (“SPPI”) on the principal amount outstanding. This assessment is referred to as the SPPI test and is performed at an instrument level.
The Group’s business model for managing financial assets refers to how it manages its financial assets in order to generate cash flows. The business model determines whether cash flows will result from collecting contractual cash flows, selling the financial assets, or both.
Subsequent measurementFor purposes of subsequent measurement financial assets are classified in the following categories:• Amortised cost• Financial assets at fair value through profit or loss
Amortised costThis category is the most relevant to the Group and generally applies to trade and other receivables, receivable from joint operation partners for finance leases, deferred consideration receivable and advances relating to provision for decommissioning liability. The Group measures financial assets at amortised cost if both of the following conditions are met:• The financial asset is held within a business model with the
objective to hold financial assets in order to collect contractual cash flows; and
• The contractual terms of the financial asset give rise on specified dates to cash flows that are solely payments of principal and interest on the principal amount outstanding
Financial assets at amortised cost are subsequently measured using the effective interest (‘EIR’) method and are subject to impairment. Gains and losses are recognised in the consolidated income statement when the asset is derecognised, modified or impaired.
Financial assets at fair value through profit or lossFinancial assets at fair value through profit or loss include financial assets held for trading and financial assets designated upon initial recognition at fair value through profit or loss, or financial assets mandatorily required to be measured at fair value. Financial assets are classified as held for trading if they are acquired for the purpose of selling or repurchasing in the near term. Derivatives, including separated embedded derivatives, are also classified as held for trading unless they are designated as effective hedging instruments. Financial assets at fair value through profit or loss are carried in the consolidated balance sheet at fair value with net changes in fair value recognised in the consolidated income statement.
Pánuco contingent consideration, contingent consideration relating to a disposal of 49% non-controlling interest of the Group’s operations in Mexico and contingent consideration relating to a disposal of Group’s shareholding in a wholly owned subsidiary, Petrofac GSA Holdings Limited, which owns a 20% ownership interest in the Greater Stella Area joint operation and a 25% interest in Petrofac FPF1 Limited, were recognised as financial assets at fair value through profit or loss within the other financial assets line item of the consolidated balance sheet. The fair value change relating to Pánuco contingent consideration was recognised as an exceptional item in the consolidated income statement. No other fair value movements occurred during 2018.
The fair value changes to undesignated forward currency contracts are reported within the other operating income/expenses line item in the consolidated income statement.
Annual report and accounts 2018 Petrofac 129
Financial statem
entsG
overnance
Strateg
ic repo
rt

2 Summary of significant accounting policies continued
Impairment of financial assetsThe Group recognises an allowance for expected credit losses (‘ECLs’) for all financial assets not held at fair value through profit or loss. ECLs are based on the difference between the contractual cash flows due in accordance with the contract and all the cash flows that the Group expects to receive, discounted at an approximation of the original effective interest rate. The expected cash flows will include, if any, cash flows from the sale of collateral held or other credit enhancements that are integral to the contractual terms.
For other financial assets measured at amortised cost ECLs are recognised in two stages. For credit exposures for which there has not been a significant increase in credit risk since initial recognition, ECLs are provided for credit losses that result from default events that are possible within the next 12 months (a 12-month ECL). For those credit exposures for which there has been a significant increase in credit risk since initial recognition, a loss allowance is required for credit losses expected over the remaining life of the exposure, irrespective of the timing of the default (a lifetime ECL). There was no significant increase in the credit risk for such financial assets since the initial recognition.
For trade receivables and contract assets, the Group applies a simplified approach in calculating ECLs (a lifetime ECL). Therefore, the Group does not track changes in credit risk, but instead recognises a loss allowance based on lifetime ECLs at each reporting date. An impairment analysis by each operating segment is performed at each reporting date subject to the Group’s established policies and procedures. Engineering & Construction and Integrated Energy Services operating segments that involve low population of high value receivables apply the probability of default data relating to each individual counterparty to calculate expected credit loss provision at each reporting date. The probability of default data for the counterparty is sourced from a third-party provider. Engineering & Production services operating segment that involves high population of low value receivables applies a provision matrix to measure expected credit losses. The provision rates are based on days past due for groupings of various customer segments with similar loss patterns. The expected credit loss calculation reflects the probability-weighted outcome, the time value of money and reasonable and supportable information that is available at the reporting date about past events, current conditions and where possible, forecasts of future economic conditions. The assessment of the correlation between historical observed default rates, forecast economic conditions and ECLs is a significant estimate. The amount of ECLs are sensitive to changes in circumstances and of forecast economic conditions. The Group’s historical credit loss experience and forecast of economic conditions may also not be representative of customer’s actual default in the future.
The Group considers a financial asset to be in default when internal or external information indicates that the Group is unlikely to receive the outstanding contractual amounts in full. A financial asset is written off only when there is no reasonable expectation of recovering the contractual cash flows, based on contractual position agreed with the customer, contract close-out negotiations and objective evidence of the customer’s inability to pay.
Financial liabilitiesInitial recognition and measurementFinancial liabilities are classified, at initial recognition, as financial liabilities at fair value through profit or loss, loans and borrowings, payables, or as derivatives designated as hedging instruments in an effective hedge, as appropriate.
All financial liabilities are recognised initially at fair value and, in the case of loans and borrowings and trade and other payables, net of directly attributable transaction costs.
The Group’s financial liabilities include trade and other payables, loans and borrowings including bank overdrafts and derivative financial instruments.
Subsequent measurementFor purposes of subsequent measurement financial liabilities are classified in the following categories:• Financial liabilities at fair value through profit or loss• Loans and borrowings
Financial liabilities at fair value through profit or lossFinancial liabilities at fair value through profit or loss include financial liabilities held for trading and financial liabilities designated upon initial recognition as at fair value through profit or loss.
Financial liabilities are classified as held for trading if they are incurred for the purpose of repurchasing in the near term. This category also includes derivative financial instruments entered by the Group that are not designated as hedging instruments in hedge relationships. Separated embedded derivatives are also classified as held for trading unless they are designated as effective hedging instruments.
Gains or losses on liabilities held for trading are recognised in the consolidated income statement.
Financial liabilities designated upon initial recognition at fair value through profit or loss are designated at the initial date of recognition, and only if the criteria in IFRS 9 ‘Financial Instruments’ are satisfied. The Group has not designated any financial liability as at fair value through profit or loss.
Loans and borrowingsThis category generally applies to interest-bearing loans and borrowings (note 27). After initial recognition, interest-bearing loans and borrowings are subsequently measured at amortised cost using the EIR method. Gains and losses are recognised in the other operating income/expenses line item in the consolidated income statement when the liabilities are derecognised as well as through the EIR amortisation process.
Amortised cost is calculated by considering any discount or premium on acquisition and fees or costs that are an integral part of the EIR. The EIR amortisation is included as finance expense in the consolidated income statement. This category generally applies to interest-bearing loans and borrowings.
Derecognition of financial assets and liabilitiesFinancial assetsA financial asset (or, where applicable, a part of a financial asset) is derecognised where:• The rights to receive cash flows from the asset have expired• The Group retains the right to receive cash flows from the
asset, but has assumed an obligation to pay them in full without material delay to a third party under a ‘pass-through’ arrangement; or
• The Group has transferred its rights to receive cash flows from the asset and either (a) has transferred substantially all the risks and rewards of the asset, or (b) has neither transferred nor retained substantially all the risks and rewards of the asset, but has transferred control of the asset
Financial liabilitiesA financial liability is derecognised when the obligation under the liability is discharged or cancelled or expires.
NOTES TO THE CONSOLIDATED FINANCIAL STATEMENTSFOR THE YEAR ENDED 31 DECEMBER 2018CONTINUED
130 Annual report and accounts 2018 Petrofac

If an existing financial liability is replaced by another from the same lender, on substantially different terms, or the terms of an existing liability are substantially modified, such an exchange or modification is treated as a derecognition of the original liability and the recognition of a new liability such that the difference in the respective carrying amounts together with any costs or fees incurred are recognised in the consolidated income statement.
Offsetting of financial instrumentsFinancial assets and financial liabilities are offset and the net amount is reported in the consolidated balance sheet if there is a currently enforceable legal right to offset the recognised amounts and there is an intention to settle on a net basis, to realise the assets and settle the liabilities simultaneously.
Derivative financial instruments and hedgingThe Group uses derivative financial instruments such as forward currency contracts and oil price collars and forward contracts to hedge its risks associated with foreign currency and oil price fluctuations. Such derivative financial instruments are initially recognised at fair value on the date on which a derivative contract is entered into and are subsequently re-measured at fair value. Derivatives are carried as assets when the fair value is positive and as liabilities when the fair value is negative.
Any gains or losses arising from changes in the fair value of derivatives that do not qualify for hedge accounting are taken to the consolidated income statement.
The fair value of forward currency contracts is calculated by reference to current forward exchange rates for contracts with similar maturity profiles. The fair value of oil price collar contracts is determined by reference to market values for similar instruments.
For the purposes of hedge accounting, hedges are classified as:• Fair value hedges when hedging the exposure to changes in the
fair value of a recognised asset or liability; or• Cash flow hedges when hedging the exposure to variability
in cash flows that is either attributable to a particular risk associated with a recognised asset or liability or a highly probable forecast transaction
The Group formally designates and documents the relationship between the hedging instrument and the hedged item at the inception of the transaction, as well as its risk management objectives and strategy for undertaking various hedge transactions. The documentation also includes identification of the hedging instrument, the hedged item or transaction, the nature of risk being hedged and how the Group will assess the hedging instrument’s effectiveness in offsetting the exposure to changes in the hedged item’s fair value or cash flows attributable to the hedged risk. The Group also documents its assessment, both at hedge inception and on an ongoing basis, of whether the derivatives that are used in the hedging transactions are highly effective in offsetting changes in fair values or cash flows of the hedged items.
The treatment of gains and losses arising from revaluing derivatives designated as hedging instruments depends on the nature of the hedging relationship, as follows:
Cash flow hedgesFor cash flow hedges, the effective portion of the gain or loss on the hedging instrument is recognised directly in the consolidated statement of other comprehensive income in net unrealised gains/(losses) on derivatives, while the ineffective portion is recognised in the consolidated income statement. Amounts taken to other comprehensive income are transferred to the consolidated income statement when the hedged transaction affects the consolidated income statement.
If the hedging instrument expires or is sold, terminated or exercised without replacement or rollover, or if its designation as a hedge is revoked, any cumulative gain or loss previously recognised in other comprehensive income remains separately in equity until the forecast transaction occurs and affects the consolidated income statement. When a forecast transaction is no longer expected to occur, the cumulative gain or loss that was reported in other comprehensive income is immediately transferred to the consolidated income statement.
Embedded derivativesContracts are assessed for the existence of embedded derivatives at the date that the Group first becomes party to the contract, with reassessment only if there is a change to the contract that significantly modifies the cash flows. Embedded derivatives which are not clearly and closely related to the underlying asset, liability or transaction are separated and accounted for as standalone derivatives.
Petrofac Employee Benefit TrustThe Petrofac Employee Benefit Trust (the “Trust”) has been established with the Group’s discretionary share scheme awards made to the employees of the Group. The Trust issues Company’s shares to Group’s employees on their respective vesting dates subject to satisfying any service and performance conditions of each scheme. The Trust continues to be included in the Group financial statements under IFRS 10 ‘Consolidated Financial Statements’.
Employee Benefit Trust (“EBT”) sharesFor the purpose of making awards under the Group’s employee share schemes, shares in the Company are purchased and held by the Petrofac Employee Benefit Trust. All these shares have been classified in the consolidated balance sheet as EBT shares within equity. Shares vested during the year are satisfied with these shares.
Share-based paymentsEmployees (including Directors) of the Group receive remuneration in the form of share-based payment, whereby employees render services in exchange for shares or rights over shares (‘equity-settled transactions’).
Equity-settled transactionsThe cost of equity-settled transactions with employees is measured by reference to the fair value at the date on which they are granted.
The cost of equity-settled transactions is recognised in the selling, general and administration expenses line item in the consolidated income statement, together with a corresponding increase in other reserves in the consolidated balance sheet, over the period in which the relevant employees become entitled to the award (the ‘vesting period’). The cumulative expense recognised for equity-settled transactions at the end of the reporting period until the vesting date reflects the extent to which the vesting period has expired and the Group’s best estimate of the number of equity instruments that will ultimately vest. The charge or credit to the consolidated income statement for a period represents the movement in cumulative expense recognised from the beginning to the end of the reporting period.
No expense is recognised for awards that do not ultimately vest because non-market performance and/or service conditions have not been met. Where awards include a market or non-vesting condition, the transactions are treated as vested irrespective of whether the market or non-vesting condition is satisfied, provided that all other performance and/or service conditions are satisfied.
Annual report and accounts 2018 Petrofac 131
Financial statem
entsG
overnance
Strateg
ic repo
rt

2 Summary of significant accounting policies continued
Equity awards cancelled, e.g. in case of good leavers, are treated as vesting immediately on the date of cancellation, and any expense not recognised for the award at that date is recognised in the consolidated income statement.
Pensions and other long-term employment benefitsThe Group has various defined contribution pension schemes in accordance with the local conditions and practices in the countries in which it operates. The amount charged to the consolidated income statement in respect of pension costs reflects the contributions payable in the year. Differences between contributions payable during the year and contributions actually paid are shown as either accrued liabilities or prepaid assets in the consolidated balance sheet.
The Group’s other long-term employment benefits are provided in accordance with the labour laws of the countries in which the Group operates, further details of which are given in note 28.
Income taxesIncome tax expense represents the sum of current income tax and deferred tax.
Current income tax assets and liabilities for the current and prior periods are measured at the amount expected to be recovered from or paid to the taxation authorities. Taxable profit differs from profit as reported in the consolidated income statement because it excludes items of income or expense that are taxable or deductible in other years and it further excludes items that are never taxable or deductible. The Group’s liability for current tax is calculated using tax rates that have been enacted or substantively enacted by the balance sheet date.
Deferred tax is recognised on all temporary differences at the balance sheet date between the carrying amounts of assets and liabilities in the financial statements and the corresponding tax bases used in the computation of taxable profit, with the following exceptions:• Where the temporary difference arises from the initial
recognition of goodwill or of an asset or liability in a transaction that is not a business combination that at the time of the transaction affects neither accounting nor taxable profit or loss
• In respect of taxable temporary differences associated with investments in subsidiaries, associates and joint ventures, where the timing of reversal of the temporary differences can be controlled and it is probable that the temporary differences will not reverse in the foreseeable future, and
• Deferred tax assets are recognised only to the extent that it is probable that a taxable profit will be available against which the deductible temporary differences and carried forward tax credits or tax losses can be utilised
The carrying amount of deferred tax assets is reviewed at each balance sheet date and reduced to the extent that it is no longer probable that sufficient taxable profit will be available to allow all or part of the deferred tax assets to be utilised. Unrecognised deferred tax assets are reassessed at each balance sheet date and are recognised to the extent that it has become probable that future taxable profit will allow the deferred tax asset to be recovered.
Deferred tax assets and liabilities are measured on an undiscounted basis at the tax rates that are expected to apply when the asset is realised or the liability is settled, based on tax rates and tax laws enacted or substantively enacted at the balance sheet date.
Current and deferred tax is charged or credited directly to other comprehensive income or equity if it relates to items that are credited or charged to, respectively, other comprehensive income or equity. Otherwise, income tax is recognised in the consolidated income statement.
LeasesThe determination of whether an arrangement is or contains a lease is based on the substance of the arrangement at inception date and whether the fulfilment of the arrangement is dependent on the use of a specific asset or assets or the arrangement conveys the right to use the asset.
Leases are classified as finance leases whenever the terms of the lease transfer substantially all the risks and rewards of ownership to the lessee. All other leases are classified as operating leases.
Assets held under finance leases are recognised as non-current assets of the Group at the lower of their fair value at the date of commencement of the lease and the present value of the minimum lease payments. These assets are depreciated on a straight-line basis over the shorter of the useful life of the asset and the lease term. The corresponding liability to the lessor is included in the consolidated balance sheet as a finance lease obligation. Lease payments are apportioned between finance expense in the consolidated income statement and reduction of the lease obligation to achieve a constant rate of interest on the remaining balance of the liability. The Group entered various operating leases the payments for which are recognised as an expense in the consolidated income statement on a straight-line basis over the lease terms.
NOTES TO THE CONSOLIDATED FINANCIAL STATEMENTSFOR THE YEAR ENDED 31 DECEMBER 2018CONTINUED
132 Annual report and accounts 2018 Petrofac

3 Revenue from contracts with customers2018
US$m2017
US$m
Rendering of services 5,613 6,266Sale of crude oil and gas 216 129
5,829 6,395
Included in revenue from rendering of services are Engineering & Production Services revenue of a “pass-through” nature with zero or low margins amounting to US$366m (2017: US$461m).
Set out below is the disaggregation of the Group’s revenue from contracts with customers:
Year ended 31 December 2018
Engineering & Construction
US$m
Engineering & Production
Services US$m
Integrated Energy
Services US$m
Total US$m
Geographical marketsKuwait 1,648 3 – 1,651Oman 596 343 – 939Saudi Arabia 794 – – 794United Kingdom 2 515 58 575United Arab Emirates 317 85 – 402Turkey – 238 – 238Russia 232 4 – 236Iraq 7 204 – 211Germany 199 – – 199Algeria 156 – – 156Malaysia 54 17 42 113Mexico – 1 101 102India 68 – – 68Singapore – – 48 48Tunisia – 3 28 31Thailand 5 15 5 25Bahrain – 20 – 20Others – 21 – 21Total revenue from contracts with customers 4,078 1,469 282 5,829 Type of goods or serviceFixed-price 4,078 278 – 4,356Reimbursable – 1,191 66 1,257Sale of crude oil and gas – – 216 216Total revenue from contracts with customers 4,078 1,469 282 5,829 Customer typeGovernment 3,295 414 101 3,810Non-government 783 1,055 181 2,019Total revenue from contracts with customers 4,078 1,469 282 5,829 Timing of revenue recognitionServices transferred over time and associated performance obligations satisfied over time 4,078 1,469 66 5,613Goods transferred and associated performance obligations satisfied at a point in time – – 216 216Total revenue from contracts with customers 4,078 1,469 282 5,829
Annual report and accounts 2018 Petrofac 133
Financial statem
entsG
overnance
Strateg
ic repo
rt

3 Revenue from contracts with customers continued
Revenue disclosed in the above tables is based on where the customer is located. Revenue representing greater than 10% of Group revenue arose from two customers amounting to US$2,199m in the Engineering & Construction operating segment (2017: two customers, US$2,756m in the Engineering & Construction operating segment).
The transaction price allocated to the remaining performance obligations (unsatisfied or partially unsatisfied) as at 31 December 2018 is as follows:
Engineering & Construction
US$m
Engineering & Production
Services US$m
Total US$m
Within one year 4,036 1,309 5,345More than one year 3,221 1,004 4,225
7,257 2,313 9,570
4 Segment information
The Group organisational structure comprises the following three operating segments:• Engineering & Construction (E&C), which provides fixed-price engineering, procurement and construction services to the onshore and
offshore oil and gas industry • Engineering & Production Services (EPS), which includes all reimbursable engineering and production services activities to the oil and
gas industry• Integrated Energy Services (IES), which is focused on delivering value from the existing asset portfolio
The Chief Operating Decision Maker (CODM) regularly reviews the performance of the operating segments to make decisions about resource allocations and to assess financial performance. Finance expense and income arising from borrowings and cash balances, which are not directly attributable to individual operating segments, are allocated to Corporate. In addition, certain shareholder services related costs, intra-group financing and consolidation adjustments are managed at Corporate and are not allocated to operating segments.
The Group’s financial performance presented below also separately identifies the effect of exceptional items and certain re-measurements to provide users of the consolidated financial statements with a clear and consistent presentation of the underlying business performance of the Group; refer to note 6 and appendix A on page 177 for details.
The following tables contains financial information relating to the Group’s operating segments for the year ended 31 December 2018 and the comparative information for the year ended 31 December 2017.
Year ended 31 December 2018
Engineering & Construction
US$m
Engineering & Production
Services US$m
Integrated Energy
Services US$m
Corporate & others US$m
Consolidation adjustments
& eliminations US$m
Business performance
US$m
Exceptional items and certain re-
measurements US$m
Reported US$m
RevenueExternal sales 4,078 1,469 282 – – 5,829 – 5,829Inter-segment sales 9 10 – – (19) – – –Total revenue 4,087 1,479 282 – (19) 5,829 – 5,829 Operating profit/(loss) 349 132 51 (17) – 515 (356) 159Finance income – – 8 6 – 14 – 14Finance expense – (4) (16) (61) – (81) – (81)Share of net profit of associates and joint ventures – – 15 – – 15 – 15Profit/(loss) before tax 349 128 58 (72) – 463 (356) 107Income tax (expense)/credit (70) (28) (20) 5 – (113) 67 (46)Net profit/(loss) after tax 279 100 38 (67) – 350 (289) 61Non-controlling interests 6 (4) 1 – – 3 – 3Net profit/(loss) for the year attributable to Petrofac Limited shareholders 285 96 39 (67) – 353 (289) 64EBITDA 1 388 138 160 (15) – 671
1 Earnings before interest, tax, depreciation and amortisation (unaudited).
NOTES TO THE CONSOLIDATED FINANCIAL STATEMENTSFOR THE YEAR ENDED 31 DECEMBER 2018CONTINUED
134 Annual report and accounts 2018 Petrofac

Engineering & Construction
US$m
Engineering & Production
Services US$m
Integrated Energy
Services US$m
Corporate & others US$m
Consolidation adjustments
& eliminations US$m
Total US$m
Other segment informationCapital expenditures:
Property, plant and equipment (note 12) 14 3 43 4 – 64Intangible assets (note 16) – – – 7 – 7Charges:
Depreciation (note 12) 39 5 94 2 – 140Write off (note 12) – 1 – – – 1Exceptional items and certain re-measurements (pre-tax) 8 24 302 22 – 356Other long-term employment benefits (note 28) 19 1 – 1 – 21Share-based payments (note 25) 13 1 1 2 – 17
Year ended 31 December 2017
*Engineering & Construction
US$m
Engineering & Production
Services US$m
Integrated Energy
Services US$m
Corporate & others US$m
Consolidation adjustments
& eliminations US$m
*Business performance
US$m
*Exceptional items and certain re-
measurements US$m
Reported US$m
RevenueExternal sales 4,782 1,385 228 – – 6,395 – 6,395Inter-segment sales 19 7 – – (26) – – –Total revenue 4,801 1,392 228 – (26) 6,395 – 6,395 Operating profit/(loss) 495 117 (38) (13) (1) 560 (456) 104Finance income – – 7 3 – 10 – 10Finance expense – – (21) (59) – (80) – (80)Share of net profit of associates and joint ventures – (1) 12 – – 11 – 11Profit/(loss) before tax 495 116 (40) (69) (1) 501 (456) 45Income tax (expense)/credit (132) (27) 19 2 – (138) 66 (72)Net profit/(loss) after tax 363 89 (21) (67) (1) 363 (390) (27)Non-controlling interests (3) 1 – – – (2) – (2)Net profit/(loss) for the year attributable to Petrofac Limited shareholders 360 90 (21) (67) (1) 361 (390) (29)EBITDA 1 540 123 97 (12) – 748
* Re-presented due to the reclassification of an item from exceptional items and certain re-measurements to business performance relating to the Engineering & Construction operating segment as set out in note 6 ‘exceptional items and certain re-measurements’ to the consolidated financial statements.
1 Earnings before interest, tax, depreciation and amortisation (unaudited).
Engineering & Construction
US$m
Engineering & Production
Services US$m
Integrated Energy
Services US$m
Corporate & others US$m
Consolidation adjustments
& eliminations US$m
Total US$m
Other segment informationCapital expenditures:Property, plant and equipment (note 12) 44 2 66 3 – 115Intangible assets (note 16) – – (1)2 – – (1)Charges:Depreciation (note 12) 45 7 116 1 1 170Amortisation and write off (note 16) – – 7 – – 7Exceptional items and certain re-measurements (pre-tax)1 173 22 245 16 – 456Other long-term employment benefits (note 28) 21 1 – – – 22Share-based payments (note 25) 15 1 1 2 – 19
1 Re-presented due to the reclassification of an item from exceptional items and certain re-measurements to business performance relating to the Engineering & Construction operating segment as set out in note 6 ‘exceptional items and certain re-measurements’ to the consolidated financial statements.
2 Negative capital expenditure includes reversal of excess accruals of US$9m during 2017 (note 16).
Annual report and accounts 2018 Petrofac 135
Financial statem
entsG
overnance
Strateg
ic repo
rt

NOTES TO THE CONSOLIDATED FINANCIAL STATEMENTSFOR THE YEAR ENDED 31 DECEMBER 2018CONTINUED
4 Segment information continued
Geographical segmentsThe following tables present revenue from external customers for the year ended 31 December 2017, based on their location and selected non-current assets by geographical segments for the years ended 31 December 2018 and 2017.
Year ended 31 December 2018
Malaysia US$m
Mexico US$m
United Kingdom
US$m
United Arab Emirates
US$mKuwait US$m
Oman US$m
Other countries
US$mTotal
US$m
Non-current assets:Property, plant and equipment (note 12) 311 242 21 74 26 4 7 685Goodwill (note 14) 3 – 41 29 – – – 73Intangible oil and gas assets (note 16) 43 – – – – – – 43Other intangible assets (note 16) – 5 8 – – – – 13
Year ended 31 December 2017
Kuwait US$m
Saudi Arabia US$m
Oman US$m
United Arab Emirates
US$m
United Kingdom
US$m Algeria US$m
Malaysia US$m
Other countries
US$mTotal
US$m
Revenues from external customers 2,028 1,181 850 562 514 386 231 643 6,395
Malaysia US$m
Mexico US$m
United Kingdom
US$m
United Arab Emirates
US$mTunisia US$m
Kuwait US$m
Other countries
US$mTotal
US$m
Non-current assets:Property, plant and equipment (note 12) 373 389 152 93 42 31 12 1,092Goodwill (note 14) 3 – 44 29 – – – 76Intangible oil and gas assets (note 16) 55 – 11 – 1 – – 67Other intangible assets (note 16) – 9 – – – – – 9
5 Expenses
a. Cost of salesIncluded in cost of sales are depreciation charged on property, plant and equipment of US$125m (2017: US$153m), intangible amortisation of US$nil (2017: US$1m), forward points and ineffective portions on derivatives designated as cash flow hedges of US$5m (2017: US$13m gain re-presented, see note 6). These amounts are an economic hedge of foreign exchange risk but do not meet the recognition criteria within IFRS 9 ‘Financial Instruments’ and are most appropriately recognised in cost of sales.
b. Selling, general and administration expenses2018
US$m2017
US$m
Staff costs 134 151Depreciation (note 12) 15 17Expected credit loss allowance (note 20 and note 21) 1 –Write off property, plant and equipment (note 12) 1 –Other operating expenses 65 67
216 235
Other operating expenses consist mainly of office related costs, travel, professional services fees and contracting staff costs.
c. Staff costs2018
US$m2017
US$m
Total staff costs: Wages and salaries 918 955Social security costs 33 39Defined contribution pension costs 17 14Other long-term employee benefit costs (note 28) 21 22Share-based payments costs (note 25) 17 19
1,006 1,049
136 Annual report and accounts 2018 Petrofac

Of the US$1,006m (2017: US$1,049m) of staff costs shown above, US$872m (2017: US$898m) is included in cost of sales, with US$134m (2017: US$151m) in selling, general and administration expenses.
The average number of staff employed by the Group during the year was 11,500 (2017: 13,000).
d. Auditor’s remunerationThe Group paid the following amounts to its auditor in respect of the audit of the financial statements and for other non-prohibited services provided to the Group:
2018 US$m
2017 US$m
Group audit fee 2 2Audit of subsidiaries’ accounts 1 1Others 1 1
4 4
Others include audit related assurance services of US$437,000 (2017: US$427,000), tax advisory services of US$nil (2017: US$75,000) and other non-audit services of US$241,000 (2017: US$496,000).
e. Other operating income2018
US$m2017
US$m
Foreign exchange gains 4 12Other income 18 8
22 20
Other income mainly comprised US$8m of forward points relating to undesignated forward currency contracts in the Corporate reporting segment; US$3m of scrap sales relating to two contracts in the Engineering & Construction operating segment; and a gain on sale of property, plant and equipment of US$1m relating to a contract in the Engineering & Construction operating segment (2017: US$4m recognised on re-recognition of finance leases relating to Block PM304 in Malaysia, note 12).
f. Other operating expenses2018
US$m2017
US$m
Foreign exchange losses 4 5Other expenses 6 5
10 10
6 Exceptional items and certain re-measurements2018
US$m20171
US$m
Impairment of assets 235 345Fair value re-measurements 45 77Losses on disposal 28 –Restructuring and redundancy costs 8 4Onerous leasehold property provisions 18 12Other exceptional items 22 18
356 456Foreign exchange translation (gains)/losses on deferred tax balances 2 (11)Tax relief on exceptional items and certain re-measurements (69) (55)
(67) (66)Consolidated income statement charge 289 390
See note 2 and appendix A on page 177 for further details on APMs
1Re-presentation of business performance and exceptional items and certain re-measurementsDuring 2018, Management reassessed the reporting of alternative performance measures (“APMs”). This exercise involved re-evaluating the criteria for inclusion within exceptional items and certain re-measurements reporting which is in response to and consistent with the current regulatory focus on the use of APMs. Management applied new criteria, whereby it excluded certain items from exceptional items and certain re-measurements which could have been reasonably expected to occur in advance of the commencement of the reporting period and concluded that such items should be reclassified as business performance. Forward points and ineffectiveness in Kuwaiti dinar currency contracts met this criterion, since these forward points and ineffectiveness unwinds based on percentage-of-completion for each individual customer contract and therefore were excluded from exceptional items and certain re-measurements and were reclassified as business performance instead. Exclusion of forward rate movements in currency contracts from exceptional items and certain re-measurements and inclusion in business performance had no impact on the reliability of financial performance information but enhanced the relevance in measuring underlying business performance.
Annual report and accounts 2018 Petrofac 137
Financial statem
entsG
overnance
Strateg
ic repo
rt

NOTES TO THE CONSOLIDATED FINANCIAL STATEMENTSFOR THE YEAR ENDED 31 DECEMBER 2018CONTINUED
6 Exceptional items and certain re-measurements continued
Consequently, the Group re-presented its 2017 comparative information relating to business performance and exceptional items and certain re-measurements and reclassified forward rate gains relating to Kuwaiti dinar forward currency contracts in the E&C operating segment of US$18m from exceptional items and certain re-measurements line item to cost of sales line item in the consolidated income statement. This resulted in a US$18m decrease in cost of sales, increase in business performance profit by US$18m, increase in exceptional items and certain re-measurements expense by US$18m (post-tax US$18m) and business performance diluted earnings per share increased to 106.2 US cents. The reported loss and reported diluted loss per share remained unaffected. The Group’s reported effective tax rate reduced to 27.5%. The re-presentation had no impact on the consolidated balance sheet. An amount of US$18m was reclassified from exceptional items and certain re-measurements line item to net other non-cash items line item within operating cash flow in the consolidated statement of cash flows. Cash flows from investing activities and cash flows from financing activities remained unaffected.
Impairment of assets On 30 July 2018, the Group signed a Sale and Purchase Agreement (“SPA”) with Perenco (Oil and Gas) International Limited to dispose a 49% non-controlling interest of the Group’s operations in Mexico (note 11a). A pre-tax impairment charge of US$156m (post-tax US$111m), which included disposal costs of US$6m, was recognised as an exceptional item in the consolidated income statement attributable to the Integrated Energy Services operating segment. The impairment charge was allocated proportionately to property, plant and equipment and intangible assets (note 12 and note 16). Of the total post-tax impairment charge of US$111m, the Group recognised US$110m (post-tax) as an exceptional item in the consolidated income statement for the six months ended 30 June 2018. The additional impairment charge of US$1m (post-tax US$1m) was recognised as an exceptional item in the consolidated income statement at completion date, related to an increase in disposal costs.
On 26 August 2018, the Group signed a SPA with Ithaca Energy (UK) Limited to fully dispose of its shareholding in a wholly owned subsidiary, Petrofac GSA Holdings Limited, which owned a 20.0% ownership interest in the Greater Stella Area joint operation and a 24.8% interest in Petrofac FPF1 Limited (note 11a). A pre-tax impairment charge of US$79m (post-tax US$55m), which included disposal costs of US$1m, was recognised as an exceptional item in the consolidated income statement for the six months ended 30 June 2018, attributable to the Integrated Energy Services operating segment. Further, a loss on disposal of US$16m was recognised at completion date, refer losses on disposal section below for details.
Fair value less costs of disposal is determined by discounting the post-tax cash flows expected to be generated from oil and gas production net of disposal costs considering assumptions that market participants would typically use in estimating fair values. Post-tax cash flows are derived from projected production profiles for each asset considering forward market commodity prices over the relevant period and, where external forward prices are not available, the Group’s Board-approved five-year business planning assumptions were used. As each field has different reservoir characteristics and contractual terms the post-tax cash flows for each asset are calculated using individual economic models, which include assumptions around the amount of recoverable reserves, production costs, life of the field/licence period and the selling price of the commodities produced.
Fair value re-measurementsAt 31 December 2018, Management reviewed the carrying amount of the Pánuco contingent consideration and as a result of this review recognised a downward fair value movement of US$43m (post-tax US$43m) in the Integrated Energy Services operating segment. The downward fair value adjustment was a significant Management judgement in response to considerable uncertainty concerning the timing and outcome of the Pánuco Production Enhancement Contract (PEC) migration to a Production Sharing Contract (PSC) and whether the contingent consideration pay out conditions will be achieved. Management considered alternative scenarios to assess the recoverability of the Pánuco contingent consideration, including but not limited to the impact of delay in migration or renegotiation of the contingent consideration in the event of migration to another form of contract. Based on this assessment Management estimated that the carrying amount of the contingent consideration of US$45m (note 18) reflected an expected outcome of a commercial negotiation in respect of migration or an alternative migration. This was a significant accounting estimate made by Management to determine the fair value of the contingent consideration at 31 December 2018. A fair value loss would be recognised in the consolidated income statement if the actual outcome of the migration or commercial negotiation is different to Management’s current expectation.
At 31 December 2018, Management reviewed the carrying amount of the deferred consideration associated with the disposal of JSD6000 installation vessel and as a result of this review recognised a downward fair value movement of US$2m (post-tax US$2m) in the Engineering & Construction operating segment, see note 15 (2017: a downward fair value movement of US$77m, post-tax US$77m was recognised in respect of Greater Stella Area).
Losses on disposalOn 27 June 2018, the Group signed an Asset Purchase Agreement with Perenco Tunisia Oil and Gas Limited to dispose of its oil and gas assets in Tunisia. The disposal, which related to the Integrated Energy Services operating segment, was completed on 13 December 2018 and a loss on disposal of US$4m (post-tax US$4m) was recognised as an exceptional item in the consolidated income statement (note 11a).
On 26 August 2018, the Group signed a Sale and Purchase Agreement with Ithaca Energy UK Ltd for the disposal of its wholly owned subsidiary, Petrofac GSA Holdings Limited, which owned a 20% interest in the Great Stella Area joint operation and a 25% interest in Petrofac FPF1 Limited, previously classified as an investment in associate. The disposal, which related to the Integrated Energy Services operating segment, was completed on 11 December 2018, and a loss on disposal of US$16m (post-tax US$16m) was recognised as an exceptional item in the consolidated income statement (note 11a).
138 Annual report and accounts 2018 Petrofac

On 24 April 2018, the Group signed an Asset Purchase Agreement with Shanghai Zhenhua Heavy Industries Co Ltd, for the disposal of the JSD6000 installation vessel. A loss on disposal of US$8m was recognised as an exceptional item in the consolidated income statement in the Engineering & Construction operating segment (note 15).
Restructuring and redundancy costsThe Group recognised a charge of US$8m (post-tax US$8m) relating to restructuring and staff redundancy mainly attributable to the Engineering & Production Services and Integrated Energy Services operating segments (2017: US$4m, post-tax US$4m).
Onerous leasehold property provisionAn onerous leasehold property provision of US$18m, post-tax US$18m (2017: US$12m, post-tax US$12m) was recognised for the estimated future costs relating to vacant and under-utilised leasehold office buildings in the UK for which the leases expire between 2020 to 2026 (note 28).
Other exceptional itemsOther exceptional items include US$15m, post-tax US$15m (2017: US$16m, post-tax US$16m) of professional fees relating to the Corporate reporting segment; US$6m, post-tax US$3m (2017: US$nil, post-tax US$nil) associated with the debt acquisition cost amortisation for SACE and UKEF Export Credit Agency Funding relating to the Corporate reporting segment (note 27); and Mexican PEC migration costs of US$1m, post-tax US$1m (2017: US$1m, post-tax US$1m) relating to the Integrated Energy Services operating segment.
TaxationUS$2m of foreign exchange loss on the retranslation of deferred tax balances denominated in Malaysian ringgits have been recognised during the year in respect of oil and gas activities in Malaysia, relating to the Integrated Energy Services operating segment, due to an approximate 5% weakening in the Malaysian ringgit against the US dollar (2017: US$11m gain).
7 Finance income/(expense)2018
US$m2017
US$m
Finance incomeBank interest 5 3Unwinding of discount on receivables (note 18 and note 21) 9 7Total finance income 14 10Finance expenseGroup borrowings (60) (59)Finance leases (11) (14)Unwinding of discount on non-current contract assets (4) –Unwinding of discount on provisions (note 28) (6) (7)Total finance expense (81) (80)
8 Income taxa. Tax on ordinary activities The major components of income tax expense/(credit) are as follows:
Businessperformance1
US$m
Exceptional items and
certain re-measurements
US$m
Reported 2018
US$m
Business performance1
US$m
Exceptional items and certain re-
measurements US$m
Reported 2017
US$m
Current income taxCurrent income tax expense 112 – 112 137 (2) 135Adjustments in respect of previous years (3) – (3) (4) – (4)Deferred taxRelating to origination and reversal of temporary differences 8 (67) (59) (34) (64) (98)Derecognition of deferred tax previously recognised (3) – (3) 39 – 39Adjustments in respect of previous years (1) – (1) – – –Income tax expense/(credit) reported in the consolidated income statement 113 (67) 46 138 (66) 72Income tax reported in equityDeferred tax related to items charged directly to equity 2 – 2 – – –Foreign exchange movements on translation 1 – 1 (5) – (5)Income tax reported in equity – – – (1) – (1)
Income tax expense reported in equity 3 – 3 (6) – (6)
1 This measurement is shown by the Group as a means of measuring underlying business performance, see note 2 and appendix A on page 177.
Annual report and accounts 2018 Petrofac 139
Financial statem
entsG
overnance
Strateg
ic repo
rt

8 Income tax continued
The split of the Group’s income tax expense between current and deferred tax varies from year to year depending largely on:• the variance between tax provided on the percentage of completion of contracts compared to that paid on accrued income for fixed-
price engineering, procurement and construction contracts; and • the tax deductions available for expenditure on Production Sharing Contracts (“PSCs”) and Production Enhancement Contracts
(“PECs”), which are partially offset by the creation of losses.
See 8c below for the impact on the movements in the year.
b. Reconciliation of total tax expenseA reconciliation between income tax expense and the product of accounting profit multiplied by the Company’s domestic tax rate is as follows:
Business performance1
US$m
Exceptional items and
certain re-measurements
US$m
Reported 2018
US$m
*Business performance1
US$m
*Exceptional items and certain re-
measurements US$m
Reported 2017
US$m
Profit before tax 463 (356) 107 501 (456) 45At Jersey’s domestic income tax rate of 0.0% (2017: 0.0%) – – – – – –Expected tax charge in higher rate jurisdictions 82 (36) 46 73 (66) 7Expenditure not allowable for income tax purposes 13 19 32 15 10 25Income not subject to tax (2) (57) (59) (4) – (4)Adjustments in respect of previous years (3) – (3) (4) – (4)Adjustments in respect of deferred tax previously recognised/unrecognised (3) – (3) 39 (2) 37Unrecognised deferred tax 21 4 25 21 3 24Other permanent differences 5 3 8 1 (11) (10)Effect of change in tax rates – – – (3) – (3)At the effective income tax rate of 43.0% on reported profit before tax (2017: 160.0%) 113 (67) 46 138 (66) 72
* Re-presented due to the reclassification of an item from exceptional items and certain re-measurements to business performance as set out in note 6 ‘exceptional items and certain re-measurements’ to the consolidated financial statements.
1 This measurement is shown by the Group as a means of measuring underlying business performance, see note 2 and appendix A on page 177.
The Group’s reported effective tax rate on reported profit before tax for the year ended 31 December 2018 was 43.0% (2017: 160.0%). The Group’s business performance effective tax rate for the year ended 31 December 2018 was 24.4% (2017: 27.5%).
A number of factors have impacted the reported effective tax rate, with key drivers being: income not subject to tax and expenditure which is not allowable for tax purposes arising on disposals, impairment and fair value re-measurements of assets as well as the impact of losses created during the year for which the realisation against future taxable profits is not probable.
In line with prior years, the reported effective tax rate is also driven by the tax laws in the jurisdictions where the Group operates and generates profits.
NOTES TO THE CONSOLIDATED FINANCIAL STATEMENTSFOR THE YEAR ENDED 31 DECEMBER 2018CONTINUED
140 Annual report and accounts 2018 Petrofac

c. Deferred taxDeferred tax relates to the following:
Consolidated balance sheet Consolidated income statement
2018 US$m
2017 US$m
2018 US$m
2017 US$m
Deferred tax liabilities
Accelerated depreciation for tax purposes 50 204 (125) (75)Profit recognition 35 42 1 (14)Overseas earnings 10 8 2 2Other temporary differences 2 6 (4) 5Gross deferred tax liabilities 97 260Deferred tax assetsLosses available for offset 117 221 55 34Decelerated depreciation for tax purposes 5 3 (2) –Share-based payment plans 2 4 – –Profit recognition – – – –Decommissioning 25 39 14 (3)Other temporary differences 31 27 (4) (8)Gross deferred tax assets 180 294Net deferred tax asset and income tax credit 83 34 (63) (59)Of which: Deferred tax assets 126 101Deferred tax liabilities 43 67
Included within the deferred tax asset are tax losses of US$384m (2017: $688m). This represents the losses which are expected to be utilised based on Management’s projection of future taxable profits in the jurisdictions in which the losses reside.
The movements in deferred tax balances include balances disposed of during the year (note 11a) and the impact of changes in financial reporting standards (note 2.3) and are therefore not part of the tax expense/(credit) to the consolidated income statement for the year. These include US$39m of net deferred tax assets derecognised relating to the disposal of Petrofac GSA Holdings Limited and US$17m of net deferred tax liabilities derecognised relating to the disposal of oil and gas assets in Tunisia (note 11a).
d. Unrecognised tax losses and tax creditsDeferred tax assets are recognised for tax loss carry forwards and tax credits to the extent that the realisation of the related tax benefit through offset against future taxable profits is probable. The Group did not recognise gross deferred income tax assets on tax losses of US$1,061m (2017: US$1,157m).
2018 US$m
2017 US$m
Expiration dates for tax losses No later than 2025 3 5No expiration date 1,046 1,140
1,049 1,145Tax credits (no expiration date) 12 12
1,061 1,157
During 2018, the Group utilised US$1m of previously unrecognised losses (2017: US$nil).
9 Earnings per shareBasic earnings per share is calculated by dividing the net profit for the year attributable to Petrofac Limited shareholders by the weighted average number of ordinary shares outstanding during the year.
Diluted earnings per share is calculated by dividing the net profit attributable to Petrofac Limited shareholders, after adjusting for any dilutive effect, by the weighted average number of ordinary shares outstanding during the year, adjusted for the effects of ordinary shares granted under the share-based payment plans which are held in the Employee Benefit Trust.
The following reflects the net profit and share data used in calculating basic and diluted earnings per share:
2018 US$m
*2017 US$m
Business performance net profit attributable to Petrofac Limited shareholders for basic and diluted earnings per share 353 361Reported net profit/(loss) attributable to Petrofac Limited shareholders for basic and diluted earnings per share 64 (29)
* Re-presented due to the reclassification of an item from exceptional items and certain re-measurements to business performance as set out in note 6 ‘exceptional items and certain re-measurements’ to the consolidated financial statements.
Annual report and accounts 2018 Petrofac 141
Financial statem
entsG
overnance
Strateg
ic repo
rt
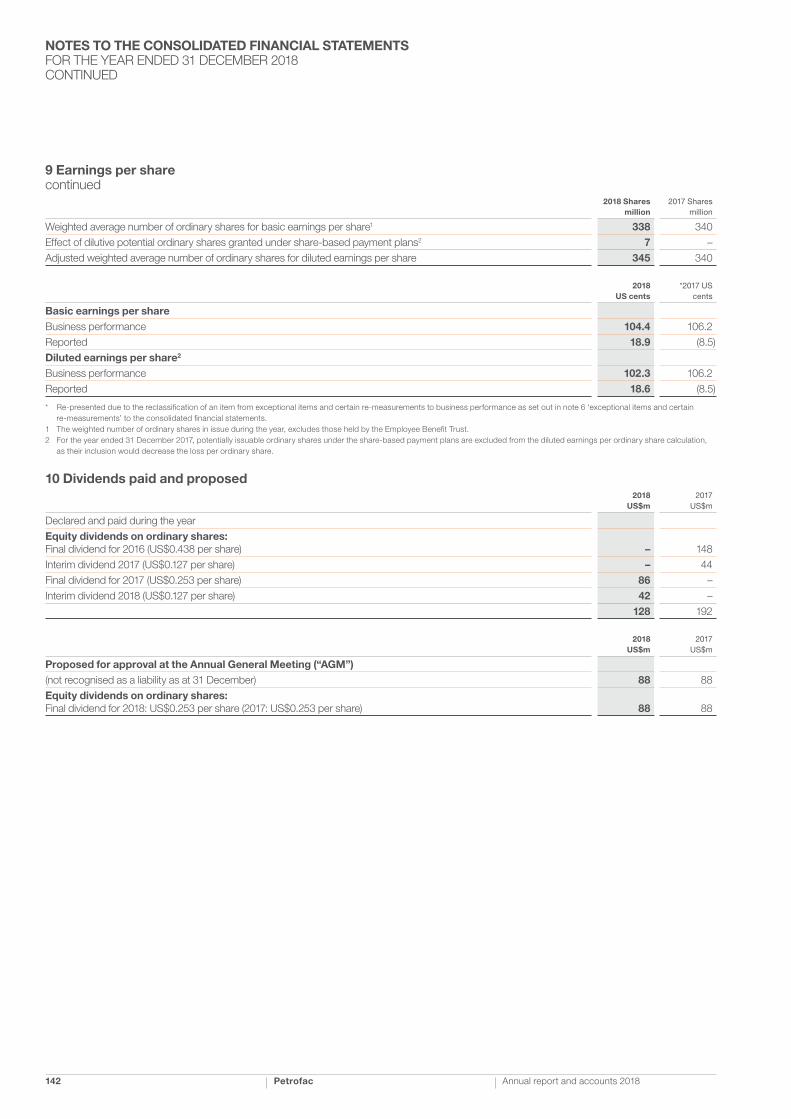
9 Earnings per share continued
2018 Shares million
2017 Shares million
Weighted average number of ordinary shares for basic earnings per share1 338 340Effect of dilutive potential ordinary shares granted under share-based payment plans2 7 –Adjusted weighted average number of ordinary shares for diluted earnings per share 345 340
2018 US cents
*2017 US cents
Basic earnings per share Business performance 104.4 106.2Reported 18.9 (8.5)Diluted earnings per share2
Business performance 102.3 106.2Reported 18.6 (8.5)
* Re-presented due to the reclassification of an item from exceptional items and certain re-measurements to business performance as set out in note 6 ‘exceptional items and certain re-measurements’ to the consolidated financial statements.
1 The weighted number of ordinary shares in issue during the year, excludes those held by the Employee Benefit Trust.2 For the year ended 31 December 2017, potentially issuable ordinary shares under the share-based payment plans are excluded from the diluted earnings per ordinary share calculation,
as their inclusion would decrease the loss per ordinary share.
10 Dividends paid and proposed2018
US$m2017
US$m
Declared and paid during the year Equity dividends on ordinary shares: Final dividend for 2016 (US$0.438 per share) – 148Interim dividend 2017 (US$0.127 per share) – 44Final dividend for 2017 (US$0.253 per share) 86 –Interim dividend 2018 (US$0.127 per share) 42 –
128 192
2018 US$m
2017 US$m
Proposed for approval at the Annual General Meeting (“AGM”)(not recognised as a liability as at 31 December) 88 88Equity dividends on ordinary shares: Final dividend for 2018: US$0.253 per share (2017: US$0.253 per share) 88 88
NOTES TO THE CONSOLIDATED FINANCIAL STATEMENTSFOR THE YEAR ENDED 31 DECEMBER 2018CONTINUED
142 Annual report and accounts 2018 Petrofac

11 Disposals and business combinations
a. DisposalsDuring 2018, the Group entered into the following disposal transactions relating to the Integrated Energy Services operating segment.
Disposal of oil and gas assets in TunisiaOn 27 June 2018, the Group signed an Asset Purchase Agreement with Perenco Tunisia Oil and Gas Limited to dispose of its oil and gas assets in Tunisia. The disposal, which related to the Integrated Energy Services operating segment, was completed on 13 December 2018 and the Group received US$25m cash consideration as at that date. Consequently, a loss on disposal of US$4m was recognised as an exceptional item in the consolidated income statement (note 6), as follows:
US$m
Fair value less cost of disposal 25Net assets derecognised:Property, plant and equipment (note 12) (42)Intangible assets (note 16) (1)Inventories (note 19) (4)Trade and other receivables (note 20) (14)Provisions (note 28) 5Deferred tax liabilities (note 8c) 17Trade and other payables (note 29) 2Income tax payable 8
(29)Loss on disposal (note 6) (4)
Disposal of Petrofac GSA HoldingsOn 26 August 2018, the Group signed a Sale and Purchase Agreement (“SPA”) with Ithaca Energy UK Ltd for the disposal of its wholly owned subsidiary, Petrofac GSA Holdings Limited (“GSA”), which owned a 20% interest in the Great Stella Area joint operation and a 25% interest in Petrofac FPF1 Limited, previously classified as an investment in associate. The disposal, which related to the Integrated Energy Services operating segment, was completed on 11 December 2018, and a loss on disposal of US$16m was recognised as an exceptional item in the consolidated income statement (note 6). The net assets of GSA on the date of completion were US$199m. The fair value of consideration comprised cash consideration of US$106m, deferred consideration of US$59m and contingent consideration of US$19m with associated disposal costs of US$1m.
Cash consideration of US$106m was received by the Group on the date of completion; the deferred consideration of US$59m, recoverable over a period of four years under the terms of the SPA, was initially recognised at fair value using a discount rate of 8.4% and will subsequently be measured at amortised cost as a non-current financial asset in the consolidated balance sheet (note 18). No unwinding of the discount on the deferred consideration was recognised from the date of disposal to the end of the reporting period in the consolidated income statement.
The contingent consideration of US$19m is dependent upon certain performance conditions being satisfied and is recoverable over a period of one year and was recognised as a current financial asset in the consolidated balance sheet (note 18). The contingent consideration was initially measured and recognised at fair value and will subsequently be measured at fair value with any fair value gain and loss recognised as an exceptional item in the consolidated income statement. No fair value movement was recognised from the date of completion to the end of the reporting period. The fair value of the contingent consideration reflected Management’s expectation of meeting certain performance conditions by applying a risk factor (a Level 3 measurement of the ‘fair value hierarchy’ contained within IFRS 13 ‘Fair Value Measurement’) to the maximum contingent consideration receivable. A 10% increase in risk the factor would result in a negative fair value change of US$3m.
A loss on disposal of US$16m (note 6) relating to the Integrated Energy Services operating segment was recognised as an exceptional item in the consolidated income statement as follows:
US$m
Fair value less cost of disposal 183Net assets derecognised:Property, plant and equipment (note 12) (48)Intangible assets (note 16) (11)Investment in associates and joint ventures (note 19) (35)Other financial assets (note 18) (132)Deferred tax assets (note 8c) (39)Trade and other receivables (note 20) (8)Provisions (note 28) 20Trade and other payables (note 29) 154
(199)Loss on disposal (note 6) (16)
1 Includes accrued capital expenditure of US$44m.
Annual report and accounts 2018 Petrofac 143
Financial statem
entsG
overnance
Strateg
ic repo
rt

11 Disposals and business combinations continued
Disposal of 49% non-controlling interest of the Group’s operations in MexicoOn 30 July 2018, the Group signed a Sale and Purchase Agreement (“SPA”) with Perenco (Oil and Gas) International Limited to dispose a 49% non-controlling interest of the Group’s operations in Mexico. A pre-tax impairment charge of US$156m (post-tax US$111m), which included disposal costs of US$6m, was recognised as an exceptional item in the consolidated income statement attributable to the Integrated Energy Services operating segment (note 6). The impairment charge was allocated proportionately to property, plant and equipment and intangible assets (note 12 and note 16). Of the total post-tax impairment charge of US$111m, the Group recognised US$110m (post-tax) as an exceptional item in the consolidated income statement for the six months ended 30 June 2018. The transaction was treated as an adjusting event after the reporting period, since the fair value of consideration receivable under the SPA as at that date provided evidence of the conditions that effected the recoverable amount of the assets at the end of that reporting period. The additional impairment charge of US$1m (post-tax US$1m) was recognised as an exceptional item in the consolidated income statement at completion date, related to an increase in disposal costs.
The disposal, which related to the Integrated Energy Services operating segment, was completed on 18 October 2018 and represented a transaction between equity holders under IFRS 10 ‘Consolidated Financial Statements’. The fair value of consideration received was recognised within equity as a non-controlling interest of US$266m (note 13). Disposal costs of US$6m were incurred which were incremental costs to the Group and were directly attributable to the disposal. The disposal costs primarily related to professional services provided by third parties and remained unpaid at the end of the reporting period (note 29).
The fair value of consideration comprised cash consideration of US$224m which was received by the Group on the date of completion and contingent consideration of US$42m, recoverable over a period of three years, which was recognised as a non-current financial asset in the consolidated balance sheet (note 18). The contingent consideration was initially measured and recognised at fair value and will subsequently be also measured at fair value with any fair value gain and loss recognised as an exceptional item in the consolidated income statement. No fair value movement was recognised from the date of disposal to the end of the reporting period. The fair value of the contingent consideration took into consideration Management’s expectation of future field development programme and migration terms relating to the Group’s Magallanes and Arenque Production Enhancement Contracts by applying a risk factor (a Level 3 measurement of the ‘fair value hierarchy’ contained within IFRS 13 ‘Fair Value Measurement’) to the maximum contingent consideration receivable. A 10% increase in risk factor would result in a negative fair value change of US$7m.
Management also made a judgement on the probable treatment of the disposal proceeds for tax purposes, based on professional external advice. A different treatment could result in an income tax charge of US$10m (2017: US$nil).
b. Business combinationsThe following two business combinations took place during 2017.
Greater Stella Area (GSA) licenceOn 21 September 2017, upon receiving Oil and Gas Authority (“OGA”) approval in the UK, the Group acquired a 20% ownership interest in the GSA field in the North Sea. The transaction was treated as an acquisition of an interest in a joint operation and IFRS 3 ‘Business Combination’ requirements were applied. The interest acquired is classified as a joint operation, as contractually all the decisions concerning the relevant activities of the unincorporated joint arrangement require unanimous consent of the joint arrangement partners. The acquisition during 2017 related to the Integrated Energy Services operating segment.
The Group’s share of the fair value of the identifiable assets and liabilities of the joint operation recognised at the date of acquisition was as follows:
US$m
Property, plant and equipment (note 12) 149Receivable from the Greater Stella Area joint operation partners (note 18) 80
229Less:Provision for decommissioning (note 28) (19)Fair value of net assets acquired 210
At the date of acquisition, the receivable in respect of the GSA development had a carrying amount of US$250m (note 18) of which, US$210m was contributed to acquire a 20% ownership interest in the joint operation which resulted in no gain or loss on the transaction. The remaining US$40m was recognised as a long-term receivable from the GSA joint operation partners (note 18).
The fair value of property, plant and equipment was determined using risk adjusted cash flow projections (Level 3 of the ‘fair value hierarchy’ contained within IFRS 13 ‘Fair Value Measurement’) discounted at a post-tax rate of 9.5%. Management used forward curve oil prices of US$53 per barrel and forward curve gas prices of US$6 per mcf from the date of acquisition until June 2019. For later periods, the long-term planning oil price assumptions used were US$70 per barrel from July 2019 to December 2019, and US$75 per barrel for 2020 and beyond. The long-term planning gas price assumptions used were US$8 per mcf from July 2019 to December 2019, and US$9 per mcf for 2020 and beyond.
NOTES TO THE CONSOLIDATED FINANCIAL STATEMENTSFOR THE YEAR ENDED 31 DECEMBER 2018CONTINUED
144 Annual report and accounts 2018 Petrofac

The financial asset represents the discounted value of the long-term receivables due from the GSA joint operation partners and is accounted for on an amortised cost basis using a contractually agreed discount rate of 8.5% with the unwinding interest income being recognised as finance income in the consolidated income statement.
Migration of Santuario Production Enhancement Contract (“PEC”) to Production Sharing Contract (“PSC”) On 18 December 2017, the Group migrated its existing Santuario PEC to acquire a 36% ownership interest in a PSC. The Group now has a proportional interest in the PSC assets, operates under a different commercial model and acts as an Operator on behalf of the joint arrangement partners. The PSC will run for 25 years, with two optional five-year extensions. The PSC was treated as a joint operation since contractually all the decisions concerning the relevant activities of the unincorporated joint arrangement require unanimous consent of the joint arrangement partners. The transaction was treated as an acquisition of an interest in a joint operation and IFRS 3 ‘Business Combination’ requirements were applied. The acquisition during 2017 related to the Integrated Energy Services operating segment.
At the date of acquisition, the existing oil and gas assets of the Santuario PEC were fair valued using the risk adjusted cash flow projections (Level 3 of the ‘fair value hierarchy’ contained within IFRS 13 ‘Fair Value Measurement’) discounted at a post-tax rate of 9.5%. This resulted in an impairment charge of US$29m (post-tax US$20m) being recognised as an exceptional item in the consolidated income statement (note 6). The carrying amount of the assets and liabilities shown below relating to the Santuario PEC were derecognised from the consolidated balance sheet and represented the fair value of consideration for acquiring a 36% ownership interest in the PSC.
US$m
Property, plant and equipment (note 12) 100Intangible assets (note 16) 5Inventories (note 19) 2Trade and other receivables (note 20) 128Provision for decommissioning (note 28) (10)Deferred tax liabilities (note 8c) (2)Trade and other payables (note 29) (17)Carrying amount of net assets derecognised 206
The Group’s share of fair value of the identifiable assets and liabilities of the PSC at the date of acquisition was as follows:
US$m
Property, plant and equipment (note 12) 213Less:Provision for decommissioning (note 28) (5)Deferred tax liabilities (note 8c) (2)Fair value of net assets acquired 206
The fair value of property, plant and equipment was determined using risk adjusted cash flow projections (Level 3 of the ‘fair value hierarchy’ contained within IFRS 13 ‘Fair Value Measurement’) discounted at a post-tax rate of 9.5%.
Annual report and accounts 2018 Petrofac 145
Financial statem
entsG
overnance
Strateg
ic repo
rt

12 Property, plant and equipment
Oil and gas assets US$m
Oil and gas facilities
US$m
Land, buildings and
leasehold improvements
US$m
Plant and equipment
US$mVehicles
US$m
Office furniture and
equipment US$m
Assets under
construction US$m
Total US$m
Cost
At 1 January 2017 1,146 420 361 40 24 173 359 2,523Recognised on acquisition (note 11b) 362 – – – – – – 362Additions 65 – 7 – – 8 35 115Derecognised on migration of Santuario PEC to PSC (note 11b) (218) – – – – – – (218)Derecognised due to change in finance lease terms (note 18) – (239) – – – – – (239)Re-recognised due to change in finance lease terms (note 18) – 179 – – – – – 179Disposals – (47) – – – (2) – (49)Transfer from intangible oil and gas assets (note 16) (1) – – – – – – (1)Transfer to assets held for sale (note 15) – – – – – – (393) (393)Write off – – – – – (1) – (1)Exchange difference – – 2 1 – 4 – 7At 1 January 2018 1,354 313 370 41 24 182 1 2,285Additions 43 – 8 – 1 11 1 64Change in decommissioning estimates (note 28) (24) – – – – – – (24)Disposals (336) – (6) (3) (2) (8) – (355)Transfer from intangible oil and gas assets (note 16) 12 – – – – – – 12Transfers – – – 2 – (2) – –Write off (note 5) – – – (1) – – (1) (2)Exchange difference – – (1) (1) – (5) – (7)At 31 December 2018 1,049 313 371 38 23 178 1 1,973Depreciation & impairment
At 1 January 2017 (466) (245) (201) (31) (22) (140) – (1,105)Charge for the year (92) (22) (35) (2) (1) (18) – (170)Impairment charge (note 6) (135) (25) – – – – (176) (336)Derecognised on migration of Santuario PEC to PSC (note 11b) 118 – – – – – – 118Derecognised due to change in finance lease terms (note 18) – 91 – – – – – 91Disposals – 37 – – – 2 – 39Transfer to assets held for sale (note 15) – – – – – – 176 176Write off – – – – – 1 – 1Exchange difference – – (2) (1) – (4) – (7)At 1 January 2018 (575) (164) (238) (34) (23) (159) – (1,193)Charge for the year (73) (19) (32) (1) (1) (14) – (140)Impairment charge (note 6) (226) – – – – – – (226)Disposals 246 – 6 3 2 8 – 265Transfers – – – (1) – 1 – –Write off (note 5) – – – 1 – – – 1Exchange difference – – – – – 5 – 5At 31 December 2018 (628) (183) (264) (32) (22) (159) – (1,288)Net carrying amount: 421 130 107 6 1 19 1 685At 31 December 2017 779 149 132 7 1 23 1 1,092
NOTES TO THE CONSOLIDATED FINANCIAL STATEMENTSFOR THE YEAR ENDED 31 DECEMBER 2018CONTINUED
146 Annual report and accounts 2018 Petrofac

AdditionsAdditions to oil and gas assets in the Integrated Energy Services operating segment mainly comprised GSA capital expenditure of US$13m; US$19m related to Santuario Production Sharing Contract (“PSC”) and Magallanes and Arenque Production Enhancement Contracts (“PECs”) in Mexico; and US$11m related to Block PM304 in Malaysia (2017: GSA capital expenditure of US$63m and Santuario PSC and Arenque PEC in Mexico of US$2m). Additions to land, buildings and leasehold improvements of US$8m (2017: US$7m) mainly comprise project camps and temporary facilities associated with the Engineering & Construction operating segment. Additions to office furniture and equipment mainly comprised IT related capital expenditure of US$3m in the Corporate reporting segment.
DisposalsOil and gas assets with a carrying amount of US$90m were derecognised during the year due to the disposal of oil and gas assets in Tunisia and the disposal of Petrofac GSA Holdings Limited (note 11a). During 2017, the disposal of oil and gas facilities having a carrying amount of US$10m related to a disposal of the FPSO Opportunity vessel associated with the Integrated Energy Services operating segment (note 6).
DepreciationThe depreciation charge in the consolidated income statement is split between US$125m (2017: US$153m) in cost of sales and US$15m (2017: US$17m) in selling, general and administration expenses.
Assets under finance lease arrangementIncluded in ‘oil and gas facilities’ and ‘plant and equipment’ is property, plant and equipment under finance lease agreements, for which the net book values are as follows:
Net book value2018
US$m2017
US$m
At 1 January 150 174Derecognised due to change in finance lease terms – (148) Re-recognised due to change in finance lease terms – 179 Impairment – (18) Depreciation (22) (37)At 31 December 128 150
13 Non-controlling interests
Petrofac Emirates LLC, Petrofac Netherlands Holdings B.V. and Petro Oil and Gas Limited, three non-wholly owned subsidiaries, are determined to be material to the Group. The proportion of the nominal value of issued shares controlled by the Group is disclosed in note 34.
Movement of non-controlling interest in Petrofac Emirates LLC, Petrofac Netherland Holding BV and Petro Oil and Gas Limited
2018 US$m
2017 US$m
At 1 January 36 25
(Loss)/profit for the year (3) 3
Opening adjustment relating to adoption of IFRS 9 and IFRS 15 (note 2) 3 –
Disposal of 49% non-controlling interest of the Group’s operations in Mexico (note 11a) 266 –
Net unrealised gains on derivatives 1 11
Dividend paid (1) (3)
At 31 December 302 36
The balance of non-controlling interests relates to other non-wholly owned subsidiaries that are not considered to be material to the Group.
Annual report and accounts 2018 Petrofac 147
Financial statem
entsG
overnance
Strateg
ic repo
rt

13 Non-controlling interestscontinued
Summarised financial information for Petrofac Emirates LLC, Petrofac Netherlands Holdings B.V. and Petro Oil and Gas Limited, three non-wholly owned subsidiaries, which have non-controlling interests that are considered material to the Group is shown below:
Petrofac Netherlands Holdings B.V. and
Petro Oil and Gas Limited Petrofac Emirates LLC
Summarised income statement*2018 US$m
2017 US$m
2018 US$m
2017 US$m
Revenue 34 – 338 534Cost of sales (32) – (329) (495)Gross profit 2 – 9 39Selling, general and administration expenses (1) – (14) (19)Other income 1 – 5 –Finance expense (1) – (11) (8)Income tax expense (1) – – –Net profit/(loss) for the year – – (11) 12Attributable to non-controlling interest – – (3) 3Net unrealised losses on derivatives
Net unrealised losses on derivatives at 1 January – – (5) (48)Other comprehensive income during the year – – 4 43Net unrealised losses on derivatives at 31 December – – (1) (5)Net unrealised losses on derivatives attributable to non-controlling interest (note 26) – – – (1)Total comprehensive (loss)/ income attributable to non-controlling interest – – (2) 14Summarised balance sheet
Non-current assets 315 – 134 200Current assets 351 – 585 592Total assets 666 – 719 792Non-current liabilities 62 – 8 3Current liabilities 61 – 566 646Total liabilities 123 – 574 649Total equity 543 – 145 143Attributable to non-controlling interest 266 – 36 36
Petrofac Netherlands Holdings B.V. and
Petro Oil and Gas Limited Petrofac Emirates LLC
Summarised cash flow statement*2018 US$m
2017 US$m
2018 US$m
2017 US$m
Operating (18) – 258 (187)Investing (6) – 39 (1)Financing 5 – (243) –
(19) – 54 (188)
* The summarised income statement and summarised cash flow statement only present financial performance and cash flow information post non-controlling interest dilution i.e. from 18 October 2018 to the end of the reporting period.
Dividends of US$3m were declared by Petrofac Emirates LLC during 2018 (2017: US$12m), of which US$1m was attributable to the non-controlling interest (2017: US$3m). There was no cash outflow to the non-controlling interest since the dividends were adjusted against the receivable balance included within current assets in the individual financial statements of Petrofac Emirates LLC.
NOTES TO THE CONSOLIDATED FINANCIAL STATEMENTSFOR THE YEAR ENDED 31 DECEMBER 2018CONTINUED
148 Annual report and accounts 2018 Petrofac

14 Goodwill
A summary of the movements in goodwill is presented below:
2018 US$m
2017 US$m
At 1 January 76 72
Exchange difference (3) 4At 31 December 73 76
Goodwill resulting from business combinations has been allocated to two cash-generating units for impairment testing as follows:
• Engineering & Construction• Engineering & Production Services
These cash-generating units represent the lowest level within the Group at which goodwill is monitored for internal management purposes. The Group considers cash-generating units to be individually significant where they represent greater than 25% of the total goodwill balance.
Recoverable amounts have been determined based on value in use calculations, using discounted pre-tax cash flow projections. Management has adopted cash flow projections that are based on a three-year business plan approved by the Board for the Engineering & Construction and Engineering & Production Services cash-generating units.
Carrying amount of goodwill allocated to each group of cash-generating units2018
US$m2017
US$m
Engineering & Construction 32 32Engineering & Production Services 41 44
73 76
Key assumptions used in value in use calculationsMarket share: the key management assumptions relate to maintaining existing levels of business and growing organically in international markets.
Discount rate: Management used a pre-tax discount rate of 11.6% per annum (2017: 11.6% per annum) derived from the estimated weighted average cost of capital of the Group. A 100-basis point increase in the pre-tax discount rate to 12.6% would result in no additional impairment charges.
15 Assets held for sale
JSD6000 installation vesselOn 24 April 2018, the Group signed an Asset Purchase Agreement with Shanghai Zhenhua Heavy Industries Co Ltd (the ‘Purchaser’), for the disposal of the JSD6000 installation vessel (the ‘vessel’). The disposal consideration comprised cash consideration of US$167m and deferred consideration of US$63m representing a 10% ownership interest in a Special Purpose Vehicle that will own the vessel upon construction and commissioning by the Purchaser. It is estimated that construction and commissioning of the vessel will be completed by mid-2021. Disposal costs were estimated to be US$20m, mainly comprising technical assistance to the Purchaser over the construction period and storage costs for the owner furnished equipment. The disposal costs were incremental costs to the Group and were directly attributable to the disposal of the vessel.
Cash consideration of US$162m was received by the Group during 2018; the remaining balance of US$5m will be received upon commissioning of the vessel and was recognised as a non-current financial asset measured at amortised cost in the consolidated balance sheet (note 18).
The deferred consideration of US$63m, being a contractual right to the Group, was recognised as a non-current asset in the consolidated balance sheet. The deferred consideration was initially measured and recognised at fair value and will subsequently be also measured at fair value with any fair value gain and loss recognised as an exceptional item in the consolidated income statement. The fair value of the deferred consideration took into consideration, amongst other factors, an independent broker’s valuation of the vessel (a Level 3 measurement of the ‘fair value hierarchy’ contained within IFRS 13 ‘Fair Value Measurement’). A fair value movement of US$2m was recognised as an exceptional item in the consolidated income statement at the end of the reporting period (note 6) which reduced the deferred consideration to US$61m at 31 December 2018. A 10% decrease in the valuation of the vessel would result in a negative fair value change of US$6m.
The fair value of deferred consideration, with Management’s current involvement and recent discussions with the Purchaser, assumes that the Purchaser has the intent and the required capabilities to complete the construction and commissioning of the vessel within the due timeframe. At each reporting date, Management will continue to review its judgement to assess the ability of the Purchaser to complete the construction and commissioning of the vessel and under such circumstances that may impair the Purchaser’s ability to complete these activities, a fair value loss would be recognised as an exceptional item in the consolidated income statement.
Annual report and accounts 2018 Petrofac 149
Financial statem
entsG
overnance
Strateg
ic repo
rt

15 Assets held for sale continued
A loss on disposal of US$8m relating to the Engineering and Construction operating segment was recognised as an exceptional item in the consolidated income statement as follows:
US$m
Cash consideration received during 2018 162Present value of cash consideration receivable upon commissioning (note 18) 4Fair value of deferred consideration at the time of disposal 63Less: present value of disposal costs1 (20)Fair value less cost of disposal 209Less: carrying amount of asset held for sale derecognised at the date of completion (217)Loss on disposal (note 6) (8)
1 Net disposal costs of US$10m were paid in cash at 31 December 2018. The balance disposal cost of US$10m was recognised as a provision in the consolidated balance sheet (note 28).
16 Intangible assets2018
US$m2017
US$m
Intangible oil and gas assets Cost:
At 1 January 67 80Additions – 8Accrual adjustment – (9)Transfer to oil and gas assets (note 12) (12) 1 Derecognised on disposal (note 11a) (12) – Impairment (note 6) – (7) Write off (note 5a and note 5b) – (6)Net book value of intangible oil and gas assets at 31 December 43 67Other intangible assets Cost:
At 1 January 26 41Additions 7 –Derecognised on Santuario PEC to PSC (note 11) – (6)Impairment (note 6) – (1) Write off – (9) Exchange difference – 1At 31 December 33 26Accumulated amortisation:
At 1 January (17) (25)Amortisation (note 5a and note 5b) (1) (1)Derecognised on Santuario PEC to PSC (note 11) – 1Impairment (note 6) (3) –Write off – 9Exchange difference 1 (1)
At 31 December (20) (17)
Net book value of other intangible assets at 31 December 13 9
Total intangible assets 56 76
Intangible oil and gas assetsIntangible oil and gas assets represents expenditure directly associated with evaluation or appraisal activities related to Block PM304 in Malaysia.
Other intangible assetsOther intangible assets comprised project development expenditure, customer contracts, proprietary software and patent technology. Such intangible assets are amortised over their estimated economic useful life on a straight-line basis and the related amortisation charges included in cost of sales and selling, general and administration expenses (note 5a and 5b). The additions of US$7m (2017: US$nil) relates to investment in the development and implementation of Group-wide cloud-based Enterprise Resource Planning (“ERP”) and digital systems.
NOTES TO THE CONSOLIDATED FINANCIAL STATEMENTSFOR THE YEAR ENDED 31 DECEMBER 2018CONTINUED
150 Annual report and accounts 2018 Petrofac

17 Investments in associates and joint venturesAssociates
US$mJoint ventures
US$mTotal
US$m
As at 1 January 2017 60 5 65Loans (repaid)/advanced by associates and joint ventures (8) 10 2Share of net profit/(loss) 12 (1) 11Dividends received (3) (1) (4)As at 1 January 2018 61 13 74Loans repaid by associates and joint ventures (13) – (13)Disposal of investment in Petrofac FPF1 Limited (note 11a) (35) – (35)Share of net profit/(loss) 15 – 15Dividends received (8) (3) (11)As at 31 December 2018 20 10 30
Dividends received during the year include US$6m received from PetroFirst Infrastructure Limited, US$2m received from PetroFirst Infrastructure 2 Limited, US$2m received from Spiecapag – Petrofac International Limited and US$1m received from TTE Petrofac Limited (2017: US$2m received from PetroFirst Infrastructure Limited, US$1m received from PetroFirst Infrastructure 2 Limited and US$1m received from TTE Petrofac Limited).
Investment in associates2018
US$m2017
US$m
PetroFirst Infrastructure Limited 16 16Petrofac FPF1 Limited – 40PetroFirst Infrastructure 2 Limited 4 5
20 61
Interest in associatesSummarised financial information of associates, based on their IFRS financial statements, and a reconciliation with the carrying amount of the investment in associates in the consolidated balance sheet are set out below:
2018 US$m
2017 US$m
Revenue 105 104Cost of sales (37) (38)Gross profit 68 66Net finance expense (9) (11)Net profit 59 55Group’s share of net profit for the year 15 12 Non-current assets 192 418Current assets 25 39Total assets 217 457 Non-current liabilities 83 123Current liabilities 47 43Total liabilities 130 166Net assets 87 291Group’s share of net assets 20 61Carrying amount of the investment in associates 20 61
A list of all associates is disclosed in note 34.
No associates had contingent liabilities or capital commitments as at 31 December 2018 and 2017.
Investment in joint ventures2018
US$m2017
US$m
Takatuf Petrofac Oman LLC 10 10Spiecapag – Petrofac International Limited – 2TTE Petrofac Limited – 1
10 13
Annual report and accounts 2018 Petrofac 151
Financial statem
entsG
overnance
Strateg
ic repo
rt

17 Investments in associates and joint ventures continued
Interest in joint venturesSummarised financial information of the joint ventures, based on their IFRS financial statements, and a reconciliation with the carrying amount of the investment in joint ventures in the consolidated balance sheet are set out below:
2018 US$m
2017 US$m
Revenue 2 1Cost of sales (2) (1)Gross profit – –Selling, general and administration expenses – (2)Profit/(loss) before tax – (2)Income tax (credit)/expense – –Net profit/(loss) – (2)Group’s share of net profit/(loss) for the year – (1) Non-current assets 26 34Current assets 4 8Total assets 30 42 Non-current liabilities – –Current liabilities 4 11Total liabilities 4 11Net assets 26 31Group’s share of net assets 10 13Carrying amount of the investment in joint ventures 10 13
A list of all joint ventures is disclosed in note 34.
The Group’s share of capital commitments relating to a training centre in Oman was US$2m (2017: US$5m). No joint ventures had contingent liabilities as at 31 December 2018 and 2017. The joint ventures cannot distribute their distributable reserves until they obtain consent from the joint venture partners.
NOTES TO THE CONSOLIDATED FINANCIAL STATEMENTSFOR THE YEAR ENDED 31 DECEMBER 2018CONTINUED
152 Annual report and accounts 2018 Petrofac

18 Other financial assets and other financial liabilities
Other financial assets Classification2018
US$m2017
US$m
Non-current
Receivable from joint operation partners for finance leases Amortised cost 237 305Deferred consideration receivable from Ithaca Energy UK Ltd (note 11a) Amortised cost 59 –Pánuco contingent consideration Fair value through profit and loss 45 49Contingent consideration arising from the disposal of 49% non-controlling interest of Group’s operations in Mexico (note 11a) Fair value through profit and loss 42 –Receivable from Shanghai Zhenhua Heavy Industries Co Ltd (note 15) Amortised cost 4 –Receivable from the Greater Stella Area (GSA) joint operation partners (note 11a) Amortised cost – 124Forward currency contracts designated as hedges (note 33) Designated as cash flow hedges 1 23Restricted cash Amortised cost – 40Advances relating to decommissioning provision Amortised cost 18 12
406 553Current
Receivable from joint operation partners for finance leases Amortised cost 76 76Contingent consideration receivable arising from the disposal of Petrofac GSA Holdings Limited (note 11a) Fair value through profit and loss 19 –Pánuco contingent consideration Fair value through profit and loss – 39Forward currency contracts designated as hedges (note 33) Designated as cash flow hedges 25 21Forward currency contracts undesignated (note 33) Fair value through profit and loss 14 1Restricted cash Amortised cost 10 9
144 146Other financial liabilitiesNon-current
Finance lease creditors (note 30) Loans and borrowings 339 435Forward currency contracts designated as hedges (note 33) Designated as cash flow hedges 2 8
341 443Current
Finance lease creditors (note 30) Loans and borrowings 112 112Forward currency contracts designated as hedges (note 33) Designated as cash flow hedges 17 16Forward currency contracts undesignated (note 33) Fair value through profit and loss 3 9Oil derivative (note 33) Designated as cash flow hedges – 2Interest payable Loans and borrowings 7 12
139 151
Receivable from joint operation partners for finance leasesThe current and non-current receivable from joint operation partners represented 70% of the finance lease liability in respect of oil and gas facilities in Malaysia that are recognised 100% in the Group’s consolidated balance sheet. This treatment is necessary to reflect the legal position of the Group as the contracting counterparty for this lease. The Group’s 30% share of this liability was US$134m (2017: US$163m). At 31 December 2018, Management concluded that no expected credit loss allowance against the receivable from joint operation partners for finance leases was necessary, since under the joint operating agreement any default by the joint arrangement partners is fully recoverable through a recourse available to the non-defaulting partner through a transfer or an assignment of defaulting partner’s equity interest.
Deferred consideration receivable from Ithaca Energy UK LtdThe deferred consideration, recoverable over a period of four years under the terms of the Sales and Purchase Agreement, of US$59m from Ithaca Energy UK Ltd relating to the disposal of Petrofac GSA Holdings Limited, was initially recognised at fair value using a discount rate of 8.4% and will subsequently be measured at amortised cost. No unwinding of the discount on the deferred consideration was recognised from the date of disposal to the end of the reporting period in the consolidated income statement. There was no significant increase in the credit risk for such financial asset since the initial recognition.
Annual report and accounts 2018 Petrofac 153
Financial statem
entsG
overnance
Strateg
ic repo
rt

18 Other financial assets and other financial liabilities continued
Pánuco contingent consideration A reconciliation of the fair value measurement of the Pánuco contingent consideration is presented below:
2018 US$m
2017 US$m
Opening balance 88 –Initial recognition – 85Fair value loss (note 6) (43) –
Unwinding of discount – 3
As at end of the reporting period 45 88
Receivable from Greater Stella Area joint operation partnersOn 26 August 2018, the Group signed a Sale and Purchase Agreement with Ithaca Energy UK Ltd for the disposal of its wholly owned subsidiary, Petrofac GSA Holdings Limited, which owned a 20% interest in the Great Stella Area (GSA) joint operation and a 25% interest in Petrofac FPF1 Limited, previously classified as an investment in associate. As a result, the receivable’s carrying amount of US$132m was derecognised at the completion date (note 11a). During the year, the Group recognised finance income of US$8m, related to discount unwinding, in the consolidated income statement.
Restricted cashThe Group had outstanding letters of guarantee, including performance, advance payments and bid bonds against which the Group had pledged or restricted cash balances.
Advances relating to decommissioning provision Advances relating to decommissioning provision represents advance payments to a customer for settling decommissioning liability, relating to the Group’s assets in Malaysia, when they become due. The advance of US$6m made during the year was presented in the consolidated statement of cash flows as a cash outflow within investing activity.
Changes in liabilities arising from financing activitiesYear ended 31 December 2018
1 January 2018
US$mCash inflows
US$mCash outflows
US$mDerecognised
US$mNew leases
US$m
Cash outflows paid by joint
operation partners
US$m
31 December 2018
US$m
Interest-bearing loans and borrowings1 1,565 1,858 (2,803) – – – 620Finance lease creditors 547 – (30) – – (66) 451At 31 December 2018 2,112 1,858 (2,833) – – (66) 1,071
1 Interest-bearing loans and borrowings excludes overdrafts since these are included within cash and equivalents.
Year ended 31 December 2017
1 January 2017
US$mCash inflows
US$mCash outflows
US$mDerecognised
US$mNew leases
US$m
Cash outflows paid by joint
operation partners
US$m
31 December 2017
US$m
Interest-bearing loans and borrowings1 1,762 1,106 (1,303) – – – 1,565Finance lease creditors 596 – (43) (506) 597 (97) 547At 31 December 2018 2,358 1,106 (1,346) (506) 597 (97) 2,112
1 Interest-bearing loans and borrowings excludes overdrafts since these are included within cash and equivalents. Debt acquisition costs paid during 2017 amounted to US$1m.
The Group recognises the gross liability for finance leases in its financial statements, however the cash flows above represent the Group’s 30% share of the payments.
During 2017, the Group renegotiated its existing finance leases relating to Block PM304 in Malaysia. As a result, the Group derecognised its existing finance lease liabilities of US$506m (Group’s 30% ownership interest US$152m) and re-recognised finance lease liabilities of US$597m (Group’s 30% ownership interest US$179m), under the revised finance lease terms. A net gain of US$4m (note 5d) was recognised on the re-recognition since the gain on re-recognition of finance lease asset was partly offset by a loss on re-recognition of finance lease liability (note 12).
NOTES TO THE CONSOLIDATED FINANCIAL STATEMENTSFOR THE YEAR ENDED 31 DECEMBER 2018CONTINUED
154 Annual report and accounts 2018 Petrofac

Fair value measurementAll assets and liabilities for which fair value is measured or disclosed in the financial statements are categorised within the fair value hierarchy, described as follows, based on the lowest level input that is significant to the fair value measurement as a whole:
Level 1: Unadjusted quoted prices in active markets for identical financial assets or liabilitiesLevel 2: Inputs other than quoted prices included within Level 1 that are observable for the asset or liability, either directly (i.e. as
prices) or indirectly (i.e. derived from prices)Level 3: Valuation techniques for which the lowest level input that is significant to the fair value measurement is unobservable
Set out below is a comparison of the carrying amounts and fair values of financial instruments as at 31 December:
Level Carrying amount Fair value
2018 US$m
2017 US$m
2018 US$m
2017 US$m
Financial assetsMeasured at amortised cost
Cash and short-term deposits Level 2 726 967 726 967Restricted cash Level 2 10 49 10 49Receivable from joint operation partners for finance leases Level 2 313 381 313 381Deferred consideration receivable from Ithaca Energy UK Ltd (note 11a) Level 2 59 – 59 –Receivable from Shanghai Zhenhua Heavy Industries Co Ltd (note 15) Level 3 4 – 4 –Receivable from the Greater Stella Area joint operation partners Level 2 – 124 – 124Advances relating to provision for decommissioning liability Level 2 18 – 18 –Measured at fair value through profit and loss
Pánuco contingent consideration Level 3 45 88 45 88Contingent consideration arising from the disposal of 49% non-controlling interest of Group’s operations in Mexico (note 11a) Level 3 42 – 42 –Contingent consideration receivable arising from the disposal of Petrofac GSA Holdings Limited (note 11a) Level 3 19 – 19 –Sterling forward currency contracts – undesignated Level 2 13 1 13 1Euro forward currency contracts – undesignated Level 2 1 – 1 –Designated as cash flow hedges
Euro forward currency contracts Level 2 25 43 25 43Russian ruble forward currency contracts Level 2 1 – 1 –Sterling forward currency contracts Level 2 – 1 – 1 Financial liabilitiesMeasured at amortised cost
Interest-bearing loans and borrowingsSenior Notes Level 2 – 676 – 677Term loans Level 2 424 198 425 200Revolving Credit Facility Level 2 77 550 80 555
Export Credit Agency funding Level 2 114 124 115 133Bank overdrafts Level 2 21 31 21 31Finance lease creditors Level 2 451 547 451 547Interest payable Level 2 7 12 7 12Measured at fair value through profit and loss
Sterling forward currency contracts – undesignated Level 2 1 9 1 9Euro forward currency contracts – undesignated Level 2 2 – 2 –Designated as cash flow hedges
Euro forward currency contracts Level 2 7 11 7 11Malaysian ringgit forward currency contracts Level 2 – 1 – 1Kuwaiti dinar forward currency contracts Level 2 8 12 8 12Russian ruble forward currency contracts Level 2 3 – 3 –Sterling forward currency contracts Level 2 1 – 1 –Oil derivative Level 2 – 2 – 2
Management assessed the carrying amounts of trade and other receivables and trade and other payables to approximate their fair values largely due to the short-term maturities of these instruments.
Annual report and accounts 2018 Petrofac 155
Financial statem
entsG
overnance
Strateg
ic repo
rt

18 Other financial assets and other financial liabilities continued
When the fair values of financial assets and financial liabilities recognised in the consolidated balance sheet cannot be measured based on quoted prices in active markets, their fair value is measured using valuation techniques including discounted cash flow (“DCF”) model. The inputs to these models are taken from observable markets where possible, but where such information is not available, a degree of judgement is required in establishing fair values. Judgements include considerations of inputs such as liquidity risk, credit risk and volatility. Changes in assumptions relating to these factors could affect the recognised fair value of financial instruments and are discussed further below.
The following methods and assumptions were used to estimate the fair values for material financial instruments:• The Group enters into derivative financial instruments with various counterparties, principally financial institutions with investment
grade credit ratings. Foreign exchange forward contracts and commodity forward contracts are valued using valuation techniques, which employ the use of market observable inputs. The most frequently applied valuation techniques include forward pricing using present value calculations. The models incorporate various inputs including the credit quality of counterparties, foreign exchange spot and forward rates, yield curves of the respective currencies, currency basis spreads between the respective currencies, interest rate curves and forward rate curves of the underlying commodity. The changes in counterparty credit risk had no material effect on the hedge effectiveness assessment for derivatives designated in hedge relationships and other financial instruments recognised at fair value.
• The fair value of deferred consideration receivable from Ithaca Energy UK Ltd is equivalent to its amortised costs determined as the present value of discounted future cash flows using the discount rate of 8.4% which includes the counterparty’s risk of default.
• The Pánuco contingent consideration was fair valued at 31 December 2018, which resulted in a fair value loss of US$43m recognised as an exceptional item in the consolidated income statement. There is considerable uncertainty on the timing and ultimate terms of the Pánuco Production Enhancement Contract (“PEC”) migration to a Production Sharing Contract (“PSC”). Management has considered alternative scenarios to assess the recoverability of the Pánuco contingent consideration including, but not limited to, the impact of delay in migration or renegotiation of the contingent consideration in the event of migration to another form of contract. Based on this assessment a fair value loss of US$43m was recognised reducing the carrying amount of the contingent consideration to US$45m. This is a significant accounting estimate made by Management to determine the fair value of the contingent consideration at 31 December 2018. A further fair value loss could be recognised as an exceptional item in the consolidated income statement if the outcome of the migration is less beneficial to the Group than Management’s current expectation.
• The fair value of contingent consideration arising from the disposal of 49% non-controlling interest of Group’s operations in Mexico and contingent consideration receivable arising from the disposal of Petrofac GSA Holdings Limited is calculated as explained in note 11a.
• The fair value of long-term interest-bearing loans and borrowings, finance lease creditors and receivable from joint operation partners for finance leases are equivalent to their amortised costs determined as the present value of discounted future cash flows using the effective interest rate.
19 Inventories2018
US$m2017
US$m
Unutilised materials relating to a project in the Engineering & Construction operating segment 15 –Crude oil 4 2Stores and raw materials 2 6
21 8
Inventories with a carrying amount of US$4m (note 11a) relating to the disposal of the oil and gas assets in Tunisia were derecognised during the year. Inventories expensed of US$71m (2017: US$97m) were included within cost of sales in the consolidated income statement.
20 Trade and other receivables2018
US$m2017
US$m
Trade receivables 829 1,108Retentions receivables (note 21) – 379Advances provided to vendors and subcontractors 355 261Prepayments and deposits 23 35Receivables from joint operation partners 95 96Other receivables 129 141
1,431 2,020
The decrease in trade receivables is mainly due to a reclassification of US$25m, relating to the Engineering & Production Services operating segment, to non-current contract assets (note 21); US$22m relating to the Integrated Energy Services Operating segment being derecognised upon disposal (note 11a); and a receipt of final settlement relating to two projects in the Engineering & Construction operating segment of US$86m. At 31 December 2018, the Group had an expected credit loss (“ECL”) allowance of US$21m in accordance with IFRS 9 ‘Financial Instruments’ (2017: US$14m in accordance with IAS 39 ‘Financial Instruments: Recognition and Measurement’) against outstanding trade receivable balance of US$850m.
At the date of initial application of IFRS 15 ‘Revenue from Contracts with Customers’ an amount of US$165m representing conditional rights to consideration was reclassified to ‘Contract assets’ line item in the consolidated balance sheet (note 2.3).
NOTES TO THE CONSOLIDATED FINANCIAL STATEMENTSFOR THE YEAR ENDED 31 DECEMBER 2018CONTINUED
156 Annual report and accounts 2018 Petrofac

Trade receivables are non-interest bearing and credit terms are generally granted to customers on 30 to 60 days’ basis. At 31 December 2018, the trade receivables were reported net of ECL allowance in accordance with IFRS 9. At 31 December 2017, the trade receivables were reported net of impairment allowance in accordance with IAS 39. The Group applied IFRS 9 retrospectively, with the initial application date of 1 January 2018, without adjusting the comparative information, therefore the 2018 and 2017 columns in the table below are not comparable.
The movement in ECL allowance during 2018 and movement in impairment allowance during 2017 against trade receivables was as follows:
2018 (calculated
in accordance with IFRS 9) 2017 (calculated in accordance with IAS 39)
ECL allowance
US$m
Specific impairment
US$m
General impairment
US$mTotal
US$m
At 1 January – 11 2 13Impairment allowance under IAS 39 reclassified at the date of initial application of IFRS 9 14 – – –ECL allowance opening transition adjustment (note 2) 10 – – –Reclassified to non-current contract assets (note 21) (4) – – –Disposals (note 11a) (2) – – –Charge/(reversal) during the year 3 3 (1) 2Amounts written off – (1) – (1) At 31 December 21 13 1 14
At 31 December 2018, the analysis of trade receivables is as follows:
Number of days past due
< 30 days US$m
31–60 days US$m
61–90 days US$m
91–120 days US$m
121–360 days US$m
> 360 days US$m
Total US$m
ECL rate 0.3% 0.1% 0.3% 1.9% 6.5% 36.6%Estimated total gross carrying amount 629 76 25 17 62 41 850Less: ECL allowance (2) – – – (4) (15) (21)Net trade receivables at 31 December 2018 627 76 25 17 58 26 829
For accounting policies adopted by the Group for computing the ECL allowance refer note 2 pages 129 and 130.
At 31 December 2017, the analysis of trade receivables is as follows:
Number of days past due
Neither past due nor
impaired US$m
< 30 days US$m
31–60 days US$m
61–90 days US$m
91–120 days US$m
121–360 days2
US$m> 360 days2
US$mTotal
US$m
Unimpaired 769 84 59 19 3 39 110 1,083Impaired – – – – 4 20 15 39
769 84 59 19 7 59 125 1.122Less: impairment provision – – – – – (1) (13) (14)Net trade receivables 2017 769 84 59 19 7 58 112 1,108
1 The credit quality of trade receivables that are neither past due nor impaired was assessed by management with reference to the historic payment track records of the counterparties together with the relevant current information in accordance with IAS 39 ‘Financial Instruments: Recognition and Measurement’.
2 Included within these aged trade receivables at 31 December 2017 are US$96m in the Engineering & Construction operating segment which will be recovered from the customers as part of the final settlement on the projects. Management reviewed the recoverability of these receivables and concluded that these will be recovered in full and no impairment provision is necessary at the end of the reporting period.
Advances provided to vendors and subcontractors represent payments made to certain vendors and subcontractors for projects in progress, that will be adjusted against the future progress billings by the vendors and subcontractors. The increase in advances provided to vendors and subcontractors of US$94m is mainly due to advances of US$102m relating to two projects in the Engineering & Construction operating segment.
Receivables from joint operation partners are recoverable amounts from partners on Block PM304, Santuario PSC and on consortium contracts in the Engineering & Construction operating segment.
Other receivables mainly consist of Value Added Tax recoverable of US$58m (2017: US$77m).
All trade and other receivables except ‘advances provided to vendors and subcontractors’ are expected to be settled in cash. Certain trade and other receivables will be settled in cash using currencies other than the reporting currency of the Group, and will be largely paid in sterling, euros and Kuwaiti dinars.
Annual report and accounts 2018 Petrofac 157
Financial statem
entsG
overnance
Strateg
ic repo
rt

21 Contract assets and contract liabilitiesa. Contract assets
2018 US$m
2017 US$m
Work in progress 1,505 –Retention receivables 308 –Accrued income 185 –
1,998 –
At 31 December 2018, work in progress includes variation orders pending customer approval of US$235m (2017: US$374m).
b. Contract liabilities2018
US$m2017
US$m
Billings in excess of costs and estimated earnings 374 –Advances received from customers 130 –
504 –
c. Expected credit loss (ECL) allowance on contract assetsThe below table provides information on expected credit loss allowance for each contract asset category at 31 December 2018:
Non-current contract
assets US$m
Work in progress
US$m
Retention receivables
US$m
Accrued income US$m
Total current contract
assets US$m
ECL rate 9.0% 0.3% 9.9% 1.1%Estimated total gross carrying amount 44 1,510 342 187 2,039Less: ECL allowance (4) (5) (34) (2) (41)Net contract assets at 31 December 2018 40 1,505 308 185 1,998
The movement in ECL allowance during 2018 against each contract asset category is as follows:
Non-current contract
assets US$m
Work in progress
US$m
Retention receivables
US$m
Accrued income US$m
Total current contract
assets US$m
ECL allowance opening transition adjustment (note 2) – 8 34 1 43ECL allowance relating to non-current receivables reclassified from trade and other receivables (note 20) 4 – – – –Charge/(reversal) for the year – (3) – 1 (2)At 31 December 2018 4 5 34 2 41
d. Contract balances arising from contracts with customersThe Group’s contract balances at the end of 31 December 2018 are as follows:
2018 US$m
Trade receivables (note 20) 829Non-current contract assets 40Current contract assets 1,998Contract liabilities 504
Trade receivables are non-interest bearing and credit terms are generally on terms of 30 to 60 days. Trade receivables represent the Group’s right to consideration that is unconditional (i.e. only the passage of time is required before payment of the consideration is due).
Non-current contract assets represent amounts that were reclassified from trade and other receivables (note 20) and retention receivables (note 21d) due to a commercial settlement agreed with a customer during the year. These amounts are recoverable over a period of two years. The gross receivables of US$44m were discounted using a discount rate of 5.0%, which resulted in an upfront interest charge of US$4m recognised within finance expense line item of the consolidated income statement (note 7).
Contract assets represent right to consideration in exchange for goods or services transferred to the customer. If the Group performs by transferring goods or services to a customer before the customer pays consideration or before payment is due, a contract asset is recognised for the earned consideration that is conditional. Upon achieving billing milestones, if any, in accordance with the contractual terms and acceptance of goods or services received by the customer, the amounts recognised as contract assets are reclassified to trade receivables.
Contract liabilities represent obligation to transfer goods or services to a customer for which the Group has received consideration (or an amount of consideration is due) from the customer. If a customer pays consideration before the Group transfers goods or services to the customer, a contract liability is recognised when the payment is made, or the payment is due (whichever is earlier). Contract liabilities are recognised as revenue when the Group performs under the contract.
NOTES TO THE CONSOLIDATED FINANCIAL STATEMENTSFOR THE YEAR ENDED 31 DECEMBER 2018CONTINUED
158 Annual report and accounts 2018 Petrofac

The Group recognised an ECL allowance on trade receivables and contract assets arising from contracts with customers, included within selling, general and administration expenses in the consolidated income statement, amounting to US$1m for the year ended 31 December 2018.
The table below provides details of key movements to contract assets and contract liabilities during the year:
Contract assets Contract liabilities
Non-current contract
assetsUS$m
Work-in-progress
US$m
Retention receivables
US$m
Accrued income US$m
Billings in excess of cost and estimated
earningsUS$m
Advances received from
customers US$m
Balances reclassified at the date of initial application of IFRS 15 ‘Revenue from Contracts with Customers’ i.e. 1 January 2018 (note 2) – 2,223 379 – 198 536Cumulative catch-up adjustment at the date of initial application of IFRS 15 (note 2) – (62) – – – –Offset of advances received from customers classified within trade and other payables for individual customer contracts against contract assets at the date of initial application of IFRS 15 (note 2) – (351) – – – (351)Trade receivables representing conditional rights to consideration reclassified to contract assets at the date of initial application of IFRS 15 (note 2) – – – 165 – –Expected credit loss allowance recognised at the date of initial application of IFRS 9 ‘Financial Instruments’ i.e. 1 January 2018 (note 2) – (8) (34) (1) – –Revenue recognised during the year from amounts included in contract liabilities at the beginning of the year – – – – (198) (156)Amounts reclassified to non-current contract assets during the year 19 – (19) – – –Amounts reclassified from trade and other receivables (note 20) 25 – – – – –Finance expense associated with discounting (note 7) (4) – – – – –Expected credit loss allowance reversal/(charge) – 3 – (1) – –
Revenue recognised during the year from performance obligations satisfied in previous years, resulting from change in transaction price, amounted to US$254m.
22 Cash and short-term deposits2018
US$m2017
US$m
Cash at bank and in hand 630 808Short-term deposits 97 159ECL allowance (1) –Total cash and short-term deposits 726 967
Short-term deposits are made for varying periods of between one day and three months depending on the immediate cash requirements of the Group and earn interest at respective short-term deposit rates. The fair value of cash and bank balances is US$726m (2017: US$967m).
For the purposes of the consolidated statement of cash flows, cash and cash equivalents comprise the following:
2018 US$m
2017 US$m
Total cash and short-term deposits 726 967
Bank overdrafts (note 27) (21) (31)
705 936
Cash and cash equivalents included amounts totalling US$145m (2017: US$63m) held by Group undertakings in certain countries whose exchange controls significantly restrict or delay the remittance of these amounts to foreign jurisdictions.
The Group applied IFRS 9 retrospectively, with the initial application date of 1 January 2018, and as at that date based on the probability of default data for the counterparties, sourced from a third-party provider, recognised an ECL allowance of US$1m. There was no movement in the expected credit loss allowance during the year.
Annual report and accounts 2018 Petrofac 159
Financial statem
entsG
overnance
Strateg
ic repo
rt

23 Share capital
The share capital of the Company as at 31 December was as follows:
2018 US$m
2017 US$m
Authorised750,000,000 ordinary shares of US$0.020 each (2017: 750,000,000 ordinary shares of US$0.020 each) 15 15Issued and fully paid345,912,747 ordinary shares of US$0.020 each (2017: 345,912,747 ordinary shares of US$0.020 each) 7 7
All the allotted and issued shares, including those held by the Employee Benefit Trust, were fully paid.
There was no movement in the number of issued and fully paid ordinary shares during the year.
The share capital comprises only one class of ordinary shares. The ordinary shares carry a voting right and the right to a dividend.
Share premium: The balance on the share premium account represents the amount received in excess of the nominal value of the ordinary shares.
Capital redemption reserve: The balance on the capital redemption reserve represents the aggregated nominal value of the ordinary shares repurchased and cancelled.
24 Employee Benefit Trust (“EBT”) sharesFor the purpose of making awards under the Group’s share-based payment plans, shares in the Company are purchased and held by the Petrofac Employee Benefit Trust. These shares have been classified in the consolidated balance sheet as EBT shares within equity.
The movements in total EBT shares are shown below:
2018 2017
Number US$m Number US$m
At 1 January 6,226,375 102 5,932,474 105Purchase of Company’s shares by EBT 6,045,843 44 3,406,314 39Issue of Company’s shares by EBT (3,207,299) (39) (3,112,413) (42)At 31 December 9,064,919 107 6,226,375 102
Shares vested during the year include dividend shares of 353,528 shares (2017: 303,554 shares).
25 Share-based payment plansPerformance Share Plan (“PSP”)Under the PSP, share awards are granted to Executive Directors and a restricted number of other senior executives of the Group. The shares vest at the end of three years, subject to continued employment and the achievement of certain pre-defined and independent market and non-market-based performance conditions. The Group revised its PSP during 2017, and the market performance-based element of new awards is 70% dependent on the total shareholder return (TSR) of the Group compared with an index composed of selected relevant companies (for earlier awards TSR was 50%). The fair value of the shares vesting under this portion of the award is determined by an independent valuer using a Monte Carlo simulation model taking into account the terms and conditions of the plan rules and using the following assumptions at the date of grant:
Executive Directors
2018 awards
Other participants
2018 awards
Executive Directors
2017 awards
Other participants
2017 awards
All participants
2016 awards
All participants
2015 awards
Expected share price volatility (based on median of comparator group’s three-year volatilities) 37.7% 37.7% 39.1% 39.1% 31.9% 28.5%
Share price correlation with comparator group 22.3% 22.3% 26.6% 26.6% 28.9% 26.4%
Risk-free interest rate 0.94% 0.94% 0.2% 0.2% 0.6% 0.7%
Expected life of share award 3 years 3 years 3 years 3 years 3 years 3 years
Fair value of TSR portion 285p 356p 99p 124p 747p 562p
The non-market-based condition governing the vesting of the remaining 30% of the 2017 and 2018 awards is subject to achieving certain strategic targets i.e. cumulative Engineering & Construction business performance net profit, cumulative Engineering & Production Services business performance net profit, cumulative divestment proceeds and cumulative cash conversion over a three-year period. Each strategic target accounts for 7.5% for the purposes of awards vesting, save where adjusted by the Remuneration Committee. For earlier awards, 50% of the total award is subject to achieving between 0.0% and 7.5% earnings per share growth targets over a three-year period. The fair value of the equity-settled award relating to the non-market-based condition is estimated, based on the quoted closing market price of the Company’s ordinary shares at the date of grant with an assumed annual vesting rate built into the calculation (subsequently trued up to the end of the reporting period on the actual leaver rate during the period from award date to the end of the reporting period) over the three-year vesting period of the plan.
NOTES TO THE CONSOLIDATED FINANCIAL STATEMENTSFOR THE YEAR ENDED 31 DECEMBER 2018CONTINUED
160 Annual report and accounts 2018 Petrofac

Deferred Bonus Share Plan (“DBSP”)Under the DBSP selected employees are required to defer a proportion of their annual cash bonus into Company shares (“Invested Shares”). Following such an award, the Company will generally grant the participant an additional award of shares (“Matching Shares”) bearing a specified ratio to the number of Invested Shares, typically a 1:1 ratio. Subject to a participant’s continued employment, Invested and Matching Share awards vest one-third on the first anniversary of the grant, one-third on the second anniversary and the final proportion on the third anniversary of the grant date.
At the end of the reporting period the value of bonuses to be settled by shares cannot be determined until the Remuneration Committee has approved the portion of the employee bonuses to be settled in shares. Once the portion of the bonus to be settled in shares is determined, the final bonus liability to be settled in shares is transferred to the share-based payments reserve. The costs relating to Matching Shares are recognised over the corresponding vesting period and the fair values of the equity-settled Matching Shares granted to employees are based on the quoted closing market price at the date of grant with the charge to the consolidated income statement adjusted to reflect the expected vesting rate of the plan.
Share Incentive Plan (“SIP”)All UK employees, including UK Executive Directors, are eligible to participate in the SIP. Employees may invest up to sterling £1,800 per tax year of gross salary (or, if lower, 10% of salary) to purchase ordinary shares in the Company. There is no holding period for these shares.
Restricted Share Plan (“RSP”)Selected employees are allocated grants of shares on an ad hoc basis. The RSP is primarily, but not exclusively, used to make awards to individuals who join the Group part way through the year, having left accrued benefits with a previous employer. The fair values of the awards granted under the RSP at various grant dates during the year are based on the quoted market price at the date of grant adjusted for an assumed vesting rate over the relevant vesting period.
Share-based payment plans informationThe details of the fair values and assumed vesting rates of the share-based payment plans are below:
PSP (non-market based condition) DBSP RSP
Executive Directors Other participants Earlier awards: all participants
Fair value per share
Assumed vesting rate
Fair value per share
Assumed vesting rate
Fair value per share
Assumed vesting rate
Fair value per share
Assumed vesting rate
Fair value per share
Assumed vesting rate
2018 awards 515p 19.9% 515p 19.9% – – 466p 94.6% 560p 95.0%2017 awards 353p 12.3% 441p 12.3% – – 839p 90.1% 572p 95.0%2016 awards – – – – 982p 0.0% 982p 86.6% 859p 90.0%2015 awards – – – – 890p 0.0% 890p 85.4% 927p 95.0%
The following table shows the movements in the number of shares held under the share-based payment plans outstanding but not exercisable:
PSP DBSP RSP Total
2018 Number
2017 Number
2018 Number1
2017 Number1
2018 Number
2017 Number
2018 Number
2017 Number
Outstanding at 1 January 2,267,918 1,457,306 5,160,988 5,055,234 276,272 397,891 7,705,178 6,910,431Granted during the year 1,262,668 1,213,622 4,774,002 3,087,292 736,973 65,983 6,773,643 4,366,897Vested during the year – – (2,676,496) (2,727,254) (127,270) (161,638) (2,803,766) (2,888,892)Forfeited during the year (648,580) (403,010) (370,232) (254,284) (12,924) (25,964) (1,031,736) (683,258)Outstanding at 31 December 2,882,006 2,267,918 6,888,262 5,160,988 873,051 276,272 10,643,319 7,705,178
1 Includes Invested and Matching Shares.
The number of shares still outstanding but not exercisable at 31 December for each award is as follows:
PSP DBSP RSP Total
2018 Number
2017 Number
2018 Number1
2017 Number1
2018 Number
2017 Number
2018 Number
2017 Number
2018 awards 1,250,504 – 4,502,154 – 730,145 – 6,482,803 –2017 awards 1,145,404 1,213,622 1,753,306 2,925,254 48,746 65,983 2,947,456 4,204,8592016 awards 486,098 540,266 632,802 1,406,064 94,160 190,594 1,213,060 2,136,9242015 awards – 514,030 – 829,670 – 19,695 – 1,363,395Total awards 2,882,006 2,267,918 6,888,262 5,160,988 873,051 276,272 10,643,319 7,705,178
1 Includes Invested and Matching Shares.
The average share price of the Company’s shares during 2018 was US$7.44, sterling equivalent of £5.55 (2017: US$7.83, sterling equivalent of £6.06).
Annual report and accounts 2018 Petrofac 161
Financial statem
entsG
overnance
Strateg
ic repo
rt

25 Share-based payment plans continued
The number of outstanding shares excludes the dividend shares shown below:
PSP DBSP RSP Total
2018 Number
2017 Number
2018 Number1
2017 Number1
2018 Number
2017 Number
2018 Number
2017 Number
Dividend shares outstanding at 31 December 238,785 199,135 572,407 573,987 30,182 25,204 841,374 798,326
1 Includes Invested and Matching Shares.
The charge in respect of share-based payment plans recognised in the consolidated income statement is as follows:
PSP DBSP1 RSP Total
2018 US$m
2017 US$m
2018 US$m
2017 US$m
2018 US$m
2017 US$m
2018 US$m
2017 US$m
Share-based payment charge 1 2 14 15 2 2 17 19
1 Represents the charge on Matching Shares only.
The Group recognised a share-based payment charge of US$17m (2017: US$19m) in the consolidated income statement relating to the above employee share-based payment plans (see note 5c) which was transferred to the share-based payments reserve together with US$15m of the accrued bonus liability for the year ended 31 December 2017 (2017: 2016 bonus of US$16m).
For further details on the above employee share-based payment plans refer to pages 92, 95 to 97 and 100 of the Directors’ remuneration report.
26 Other reservesNet unrealised gains/(losses) on derivatives
US$m
Foreign currency
translation US$m
Share-based payments
reserve US$m
Total US$m
Balance at 1 January 2017 (19) (9) 89 61Net losses on maturity of cash flow hedges recycled in the year 13 – – 13Net changes in fair value of derivatives and financial assets designated as cash flow hedges 46 – – 46Foreign currency translation – (9) – (9)Issue of Company’s shares by Employee Benefit Trust – – (38) (38)Transfer to share-based payments reserve for Deferred Bonus Share Plan Invested Shares (note 25) – – 16 16Credit to equity for share-based payments charge (note 25) – – 19 19Income tax on share-based payments reserve – – 1 1Balance at 31 December 2017 40 (18) 87 109Attributable to:Petrofac Limited shareholders 41 (18) 87 110Non-controlling interests (1) – – (1)Balance at 31 December 2017 40 (18) 87 109 Balance at 1 January 2018 40 (18) 87 109Net gains on maturity of cash flow hedges recycled in the year (3) – – (3)Net changes in fair value of derivatives and financial assets designated as cash flow hedges (24) – – (24)Foreign currency translation – 17 – 17Issue of Company’s shares by Employee Benefit Trust – – (34) (34)Transfer to share-based payments reserve for Deferred Bonus Share Plan Invested Shares (note 25) – – 15 15Credit to equity for share-based payments charge (note 25) – – 17 17Income tax on share-based payments reserve – – (2) (2)Balance at 31 December 2018 13 (1) 83 95Attributable to:Petrofac Limited shareholders 13 (1) 83 95Non-controlling interests – – – –Balance at 31 December 2018 13 (1) 83 95
NOTES TO THE CONSOLIDATED FINANCIAL STATEMENTSFOR THE YEAR ENDED 31 DECEMBER 2018CONTINUED
162 Annual report and accounts 2018 Petrofac

Net unrealised gains/(losses) on derivativesThe portion of gains or losses on cash flow hedging instruments that are determined to be effective hedges is included within this reserve net of related deferred tax effects. When the hedged transaction occurs or is no longer forecast to occur, the gain or loss is transferred from equity to the consolidated income statement. Realised net gains amounting to US$3m (2017: US$13m net loss) relating to foreign currency forward contracts and financial instruments designated as cash flow hedges have been recognised in cost of sales line item in the consolidated income statement.
The forward currency points element and ineffective portion of derivative financial instruments relating to forward currency contracts designated as cash flow hedges amounting to US$5m (2017: US$13m gain re-presented, see note 6) were recognised in cost of sales line item in the consolidated income statement.
Foreign currency translation reserveThe assets and liabilities of entities which have a non-United States dollar functional currency are translated into the Group’s reporting currency, United States dollar, at the exchange rate prevailing at the end of the reporting period. The foreign currency differences arising on the translation are recognised in other reserves in equity.
Share-based payments reserveThe share-based payments reserve is used to recognise the value of equity-settled share-based payments awarded to employees and transfers out of this reserve are made upon vesting of the original share awards.
The transfer of US$15m (2017: US$16m) into the share-based payments reserve reflected the transfer from accrued bonus liability within trade and other payables in the consolidated balance sheet which has been voluntarily elected or mandatorily obliged to be settled in shares as part of the Deferred Bonus Share Plan (note 25).
27 Interest-bearing loans and borrowings 2018
US$m2017
US$m
Non-currentRevolving Credit Facility 80 555Export Credit Agency funding (SACE and UKEF facilities) – 115Term loans 300 200
380 870Less: Debt acquisition costs net of accumulated amortisation and effective interest rate adjustments (4) (16)
376 854CurrentSenior Notes – 677Export Credit Agency funding (SACE and UKEF facilities) 115 18Term loans 125 –Bank overdrafts 21 31
261 726Less: Debt acquisition costs net of accumulated amortisation and effective interest rate adjustments (1) (1)
260 725Total interest-bearing loans and borrowings 636 1,579
Details of the Group’s interest-bearing loans and borrowings are as follows:
Revolving Credit FacilityThe Group has a US$1,200m committed Revolving Credit Facility with a syndicate of international banks, which is available for general corporate purposes. US$200m of the facility will mature in June 2020 and the remaining US$1,000m will mature in June 2021. As at 31 December 2018, US$80m was drawn under this facility (2017: US$555m).
Interest is payable on the drawn balance of the facility and in addition utilisation fees are payable depending on the level of utilisation.
Export Credit Agency fundingIn 2015, the Group entered into two term loan facilities guaranteed, respectively, by the Italian Export Credit Agency (SACE) and the UK Export Credit Agency (UKEF). Following the disposal of JSD6000 installation vessel and transfer of associated owner furnished equipment to the Purchaser during 2018 (note 15) the SACE and UKEF facilities will mature in June 2019. At 31 December 2018, the amortised cost of the liability has been adjusted to reflect the revised contractual cash flows, in line with the requirements of IFRS 9 ‘Financial Instruments’, which resulted in a charge of US$6m being recognised as an exceptional item in the consolidated income statement (note 6). As at 31 December 2018, US$43m was drawn under the SACE facility (2017: US$50m) and US$72m was drawn under the UKEF facility (2017: US$83m). No further drawings can be made from these facilities.
In February 2019, after the end of the reporting period, the Group received a pre-payment waiver from the SACE Export Credit Agency facility Lenders (the “Lenders”) and the associated facility will now mature in 2025. The waiver has been treated as a non-adjusting event after the reporting period, since provision of the waiver was at sole discretion of the Lenders.
Term loansAt 31 December 2018, the Group had in place five bilateral term loans with a combined total of approximately US$483m. As at that date, US$425m was drawn under these facilities (2017: US$200m). Of the total, US$25m is scheduled to mature in February 2019 and US$100m is scheduled to mature in August 2019. The balance will mature in 2020.
Annual report and accounts 2018 Petrofac 163
Financial statem
entsG
overnance
Strateg
ic repo
rt

27 Interest-bearing loans and borrowings continued
Senior NotesThe Group repaid aggregate principal amount of US$677m Senior Notes in October 2018.
Bank overdraftsBank overdrafts are drawn down in United States dollar and sterling denominations to meet the Group’s working capital requirements. These are repayable on demand.
Compliance with covenantsThe Revolving Credit Facility, the Export Credit Agency facilities and the term loans (together, the Senior Loans) are subject to two financial covenants relating to leverage and interest cover. The Group was compliant with these covenants for the year ending 31 December 2018.
The Senior Loans are senior unsecured obligations of the Company and will rank equally in right of payment with each other and with the Company’s other existing and future unsecured and unsubordinated indebtedness.
28 ProvisionsNon-current provisions
Other long-term
employment benefits
provision US$m
Provision for decommissioning
US$m
Onerous operating
lease provision
US$m
Other provisions
US$mTotal
US$m
At 1 January 2017 101 116 – 7 224Additions during the year 22 1 12 – 35Recognised on acquisition (note 11) – 24 – – 24Derecognised on migration of existing Santuario PEC to PSC (note 11) – (10) – – (10)Paid during the year (11) – – – (11)Unwinding of discount – 7 – – 7At 1 January 2018 112 138 12 7 269Additions/(net reversals) during the year 21 (24) 18 9 24Disposals (note 11a) – (25) – – (25)Paid during the year (14) – – (1) (15)Transfer (to)/from current – – (15) 1 (14)Unwinding of discount – 6 – – 6Exchange difference – – (2) – (2)At 31 December 2018 119 95 13 16 243
Other long-term employment benefits provisionLabour laws in the United Arab Emirates require employers to provide for other long-term employment benefits. These benefits are payable to employees on being transferred to another jurisdiction or on cessation of employment based on their final salary and number of years’ service. All amounts are unfunded. The long-term employment benefits provision is based on an internal end of service benefits valuation model with the key underlying assumptions being as follows:
Senior employees
Other employees
Average number of years of future service 5 3Average annual % salary increases 2% 2%Discount factor 4% 4%
Senior employees are those earning a base of salary of over US$96,000 per annum.
Discount factor used represents basis yield on US high quality corporate bonds with duration corresponding to the liability at the end of the reporting period.
Provision for decommissioningThe decommissioning provision primarily relates to the Group’s obligation for the removal of facilities and restoration of the sites at the Block PM304 in Malaysia, Santuario Production Sharing Contract (“PSC”) and Magallanes and Arenque Production Enhancement Contracts (“PECs”) in Mexico.
A reversal of US$32m was recognised for Block PM304 in Malaysia due to revised rates provided by the regulator in respect of daily charter rate for the decommissioning rig and support vessels (2017: relating to drilling of new wells of US$1m in respect of Block PM304 in Malaysia). An upward revision of US$8m to provision for decommissioning was recognised in respect of Santuario Production Sharing Contract (“PSC”) and Magallanes and Arenque Production Enhancement Contracts (“PECs”) in Mexico arising from changes to discount rate estimates reflecting current market assessments of the time value of money and the risks specific to the liability (2017: US$nil).
NOTES TO THE CONSOLIDATED FINANCIAL STATEMENTSFOR THE YEAR ENDED 31 DECEMBER 2018CONTINUED
164 Annual report and accounts 2018 Petrofac

The liability is discounted at the rate of 4.1% on Block PM304 (2017: 4.5%), and 5.2% on Santuario PSC, Magallanes and Arenque PECs (2017: 7.5%).
The unwinding of the discount is recognised in the finance expense (note 7) line item of the consolidated income statement. The Group estimates that the cash outflows associated with these provisions will materialise in 2026 on Block PM304; in 2033 on Magallanes PEC; in 2040 on Santuario PSC; and in 2040 on Arenque PEC.
Onerous operating lease provisionOnerous operating lease provision represents the non-current amount of the estimated future costs relating to vacant and underutilised leasehold office buildings in the UK, for which the leases expire between 2020 to 2026. Additions to onerous operating lease provision of US$18m (2017: US$12m) during the year were recognised as an exceptional item in the consolidated income statement and relate to the Engineering & Productions Services operating segment (note 6).
Other provisionsThis represents claim amounts of US$9m (2017: US$7m) against the Group which will be settled through the captive insurance company Jermyn Insurance Company Limited and US$6m (2017: US$nil) represents disposal costs associated with the disposal of JSD6000 installation vessel (note 15).
Current provisionsOnerous operating
lease provision US$m
Onerous contract provisions
US$m
Other provisions
US$mTotal
US$m
Reclassified from accrued contract expenses 9 29 – 38Amounts provided during the year – 35 4 39Utilised during the year (3) (48) – (51)At 1 January 2018 6 16 4 26Amounts provided during the year – 148 26 174Transfer from/(to) non-current 15 – (1) 14Utilised during the year (16) (146) (12) (174)At 31 December 2018 5 18 17 40
Onerous operating lease provisionOnerous operating lease provision represents the current amount of the estimated future costs relating to vacant and underutilised leasehold office buildings in the UK, for which the leases expire between 2020 to 2026.
Onerous contract provisionsThe Group provides for future losses on contracts where it is considered probable that the estimate at completion contract costs are likely to exceed estimate at completion contract revenues in future years. The amount of US$148m provided during the year relates to projects in the Engineering & Construction operating segment (2017: US$35m).
Other provisionsThese include amounts provided by the Group for potential claims from vendors, disputes with customers, provision for disposal costs associated with the disposal of JSD6000 installation vessel and other claims. The amount of US$13m provided during the year relates to projects in the Engineering & Production Services operating segment (2017: US$4m) and US$13m relates to disposal costs associated with the disposal of JSD6000 installation vessel (2017: US$nil).
29 Trade and other payables2018
US$m2017
US$m
Trade payables 336 419Advances received from customers (note 21) – 536Accrued expenses 431 499Other taxes payable 71 67Other payables 124 154
962 1,675
Accrued expenses include capital expenditure accruals relating to property, plant and equipment of US$10m (2017: US$74m) and intangible assets US$1m (2017: US$2m). The balance of accrued expenses primarily represents contract cost accruals relating to the Engineering & Construction operating segment and the Engineering & Production Services operating segment.
Trade and other payables of US$56m were derecognised during the year due to the disposal of oil and gas assets in Tunisia and the disposal of Petrofac GSA Holdings Limited (note 11a).
Other payables mainly consist of retentions held against vendors and subcontractors of US$110m (2017: US$115m).
Certain trade and other payables will be settled in currencies other than the reporting currency of the Group, mainly in sterling, euros and Kuwaiti dinars.
Annual report and accounts 2018 Petrofac 165
Financial statem
entsG
overnance
Strateg
ic repo
rt
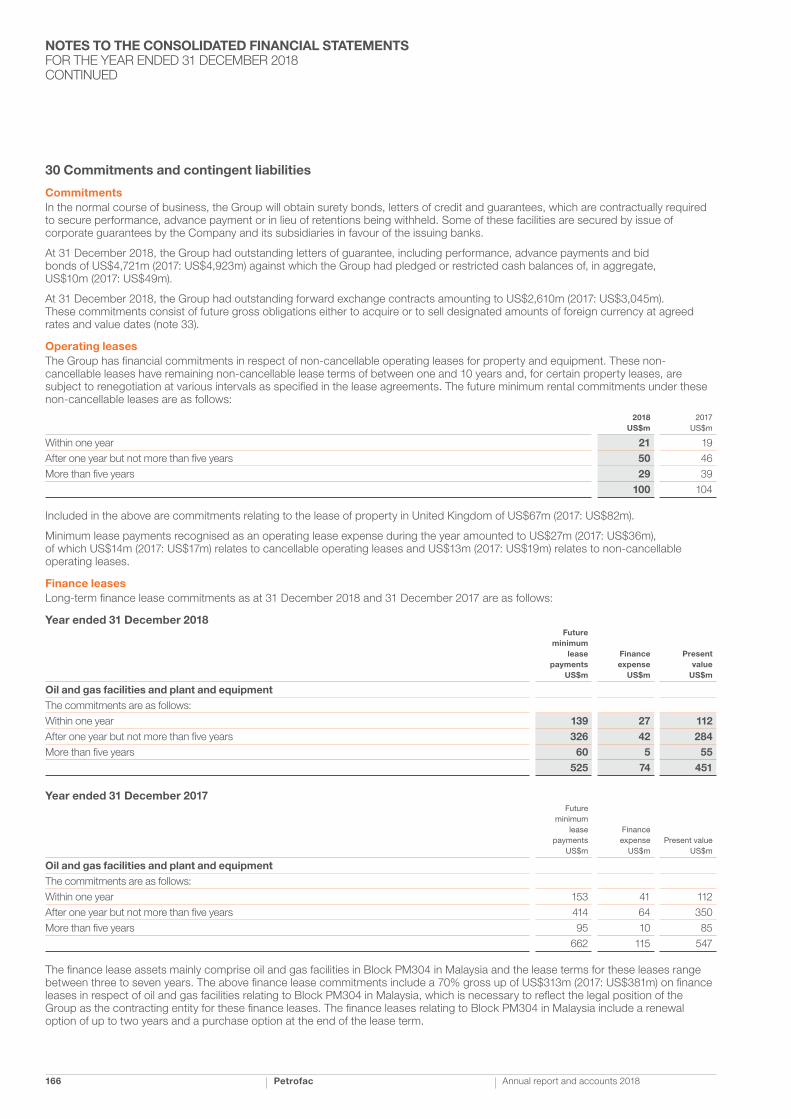
30 Commitments and contingent liabilities
CommitmentsIn the normal course of business, the Group will obtain surety bonds, letters of credit and guarantees, which are contractually required to secure performance, advance payment or in lieu of retentions being withheld. Some of these facilities are secured by issue of corporate guarantees by the Company and its subsidiaries in favour of the issuing banks.
At 31 December 2018, the Group had outstanding letters of guarantee, including performance, advance payments and bid bonds of US$4,721m (2017: US$4,923m) against which the Group had pledged or restricted cash balances of, in aggregate, US$10m (2017: US$49m).
At 31 December 2018, the Group had outstanding forward exchange contracts amounting to US$2,610m (2017: US$3,045m). These commitments consist of future gross obligations either to acquire or to sell designated amounts of foreign currency at agreed rates and value dates (note 33).
Operating leasesThe Group has financial commitments in respect of non-cancellable operating leases for property and equipment. These non-cancellable leases have remaining non-cancellable lease terms of between one and 10 years and, for certain property leases, are subject to renegotiation at various intervals as specified in the lease agreements. The future minimum rental commitments under these non-cancellable leases are as follows:
2018 US$m
2017 US$m
Within one year 21 19After one year but not more than five years 50 46More than five years 29 39
100 104
Included in the above are commitments relating to the lease of property in United Kingdom of US$67m (2017: US$82m).
Minimum lease payments recognised as an operating lease expense during the year amounted to US$27m (2017: US$36m), of which US$14m (2017: US$17m) relates to cancellable operating leases and US$13m (2017: US$19m) relates to non-cancellable operating leases.
Finance leasesLong-term finance lease commitments as at 31 December 2018 and 31 December 2017 are as follows:
Year ended 31 December 2018Future
minimum lease
payments US$m
Finance expense
US$m
Present value
US$m
Oil and gas facilities and plant and equipmentThe commitments are as follows:Within one year 139 27 112After one year but not more than five years 326 42 284More than five years 60 5 55
525 74 451
Year ended 31 December 2017Future
minimum lease
payments US$m
Finance expense
US$mPresent value
US$m
Oil and gas facilities and plant and equipmentThe commitments are as follows:Within one year 153 41 112After one year but not more than five years 414 64 350More than five years 95 10 85
662 115 547
The finance lease assets mainly comprise oil and gas facilities in Block PM304 in Malaysia and the lease terms for these leases range between three to seven years. The above finance lease commitments include a 70% gross up of US$313m (2017: US$381m) on finance leases in respect of oil and gas facilities relating to Block PM304 in Malaysia, which is necessary to reflect the legal position of the Group as the contracting entity for these finance leases. The finance leases relating to Block PM304 in Malaysia include a renewal option of up to two years and a purchase option at the end of the lease term.
NOTES TO THE CONSOLIDATED FINANCIAL STATEMENTSFOR THE YEAR ENDED 31 DECEMBER 2018CONTINUED
166 Annual report and accounts 2018 Petrofac

Capital commitmentsAt 31 December 2018, the Group had capital commitments of US$21m (2017: US$48m) excluding the above lease commitments.
Included in the US$21m of commitments are:
2018 US$m
2017 US$m
Production Enhancement Contracts (PEC) in Mexico 16 18Appraisal and development of wells in Block PM304 in Malaysia 3 13Greater Stella Area field development costs in the North Sea – 12Oman training centre commitments 2 5
Contingent liabilitiesAs described in pages 5, 27 and 76 of the 2018 Annual Report, on 12 May 2017, the UK Serious Fraud Office (“SFO”) announced an investigation into the activities of Petrofac, its subsidiaries, and their officers, employees and agents for suspected bribery, corruption, and/or money laundering. In February 2019 a former employee of a Petrofac subsidiary admitted offences contrary to the UK Bribery Act 2010. No charges have been brought against any Group company or any other officers or employees to date. Although not charged, a number of Petrofac individuals and entities are alleged to have acted together with the individual concerned. The SFO investigation is ongoing. The existence of any possible future financial obligations (such as fines or penalties), or other consequences, is unable to be determined at this time.
The Group is aware of challenges to the historical application of National Insurance Contributions to workers in the UK Continental Shelf. At this point, the Group considers this to be a possible obligation whose existence will be confirmed only by the occurrence or non-occurrence of one or more uncertain future events not wholly within the control of the Group and therefore no provision has been recognised.
31 Related party transactions
The consolidated financial statements include the financial statements of Petrofac Limited and the subsidiaries listed in note 34. Petrofac Limited is the ultimate parent entity of the Group.
The following table provides the total amount of transactions entered with related parties:
Amounts owed by
related parties US$m
Amounts owed to
related parties US$m
Joint ventures 2018 – –
2017 1 –
Associates 2018 1 –
2017 – –
All sales to and purchases from related parties are conducted on an arm’s length basis and are approved by the operating segment’s management.
All related party balances will be settled in cash.
Other Directors’ interests include market-rate services of US$324,000 (2017: US$60,000), incurred in the ordinary course of business by the Engineering & Production Services operating segment. The Group Chief Executive is a beneficiary of a trust which has invested in a fund that has an equity interest in the company which provided the services. In May 2017, the board of directors approved a donation of up to US$5m over the course of 5 years to the American University of Beirut (AUB) to establish the Petrofac Fund for Engineers endowment fund, which will provide scholarships and internships to engineering students in memory of Mr Maroun Semaan, Petrofac’s co-founder. In 2018, a US$1m (2017: US$nil) donation from the approved amount was made to the AUB. The Group Chief Executive is a trustee of the AUB.
Compensation of key management personnelThe following details remuneration of key management personnel of the Group comprising Executive and Non-executive Directors of the Company and other senior personnel. Further information relating to individual Directors of the Company is provided in the Directors’ remuneration report on pages 90 to 101.
2018 US$m
2017 US$m
Short-term employee benefits 13 11Other long-term employment benefits 1 –Share-based payments charge 2 2Fees paid to Non-executive Directors 1 1
17 14
32 Accrued contract expensesThe decrease in accrued contract expenses of US$311m is mainly due to higher vendor and subcontractor payment milestones achieved during the year in the Engineering & Construction operating segment.
Annual report and accounts 2018 Petrofac 167
Financial statem
entsG
overnance
Strateg
ic repo
rt

33 Risk management and financial instruments
Risk management objectives and policiesThe Group’s principal financial assets and liabilities, other than derivatives, comprise trade and other receivables, other financial assets, related party receivables, cash and short-term deposits, interest-bearing loans and borrowings, trade and other payables and other financial liabilities.
The Group’s activities expose it to various financial risks particularly associated with interest rate risk on its variable rate cash and short-term deposits, loans and borrowings and foreign currency risk on conducting business in currencies other than reporting currency as well as translation of the assets and liabilities of foreign operations to the reporting currency. These risks are managed from time to time by using a combination of various derivative instruments, principally forward currency contracts in line with the Group’s hedging policies. The Group has a policy not to enter into speculative trading of financial derivatives.
The Board of Directors of the Company has established an Audit Committee which performs, amongst other roles, reviews on the effectiveness of the risk management and internal control systems to mitigate a range of risks, including financial risks, faced by the Group which is discussed in detail on pages 82 to 87.
The other main risks besides interest rate and foreign currency risk arising from the Group’s financial instruments are credit risk, liquidity risk and commodity price risk and the policies relating to these risks are discussed in detail below:
Interest rate riskInterest rate risk arises from the possibility that changes in interest rates will affect the value of the Group’s interest-bearing financial liabilities and assets.
The Group’s exposure to market risk arising from changes in interest rates relates primarily to the Group’s long-term variable rate debt obligations and its cash and bank balances. The Group’s policy is to manage its interest cost using a mix of fixed and variable rate debt. The Group’s cash and bank balances are at floating rates of interest.
Debt is primarily in US dollars, linked to US dollar LIBOR (London Interbank Offered Rate). The Group uses derivatives to swap between fixed and floating rates. No such derivatives were outstanding at 31 December 2018. At 31 December 2018, the proportion of floating rate debt was 100% of the total financial debt outstanding (2017: 58%).
Interest rate sensitivity analysisThe impact on the Group’s profit before tax and equity due to a reasonably possible change in interest rates on loans and borrowings at the reporting date is demonstrated in the table below. The analysis assumes that all other variables remain constant.
Pre-tax profit Equity
100 basis point
increase US$m
100 basis point
decrease US$m
100 basis point
increase US$m
100 basis point
decrease US$m
31 December 2018 (13) 13 – –31 December 2017 (16) 16 – –
The following table reflects the maturity profile of the financial liabilities and assets that are subject to interest rate risk:
Year ended 31 December 2018
Within 1 year US$m
1–2 years US$m
2–3 years US$m
3–4 years US$m
4–5 years US$m
More than 5 years US$m
Total US$m
Financial liabilities
Floating rates Bank overdrafts (note 27) 21 – – – – – 21Interest-bearing loans and borrowings (note 27) 240 300 80 – – – 620
261 300 80 – – – 641Financial assets
Floating ratesCash and short-term deposits (note 22) 726 – – – – – 726Restricted cash balances (note 18) 10 – – – – – 10
736 – – – – – 736
NOTES TO THE CONSOLIDATED FINANCIAL STATEMENTSFOR THE YEAR ENDED 31 DECEMBER 2018CONTINUED
168 Annual report and accounts 2018 Petrofac

Year ended 31 December 2017
Within 1 year US$m
1–2 years US$m
2–3 years US$m
3–4 years US$m
4–5 years US$m
More than 5 years US$m
Total US$m
Financial liabilities
Floating rates Bank overdrafts (note 27) 31 – – – – – 31Interest-bearing loans and borrowings (note 27) 18 218 572 18 18 44 888
49 218 572 18 18 44 919Financial assets
Floating ratesCash and short-term deposits (note 22) 967 – – – – – 967Restricted cash balances (note 18) 9 39 – – 1 – 49
976 39 – – 1 – 1,016
Financial liabilities in the above table are disclosed gross of debt acquisition costs and effective interest rate adjustments of US$5m (2017: US$16m).
Interest on financial instruments classified as floating rate is re-priced at intervals of less than one year. The other financial instruments of the Group that are not included in the above tables are non-interest bearing and are therefore not subject to interest rate risk.
Foreign currency riskThe Group is exposed to foreign currency risk on sales, purchases, and translation of assets and liabilities that are in a currency other than the functional currency of its operating units. The Group is also exposed to the translation of the functional currencies of its units to the United States dollar reporting currency of the Group.
The following table summarises the percentage of foreign currency denominated revenues, costs, financial assets and financial liabilities, expressed in United States dollar terms, of the Group totals.
2018 % of foreign
currency denominated
items
2017 % of foreign
currency denominated
items
Revenues 44.8% 43.7%Costs 53.5% 43.8%Non-current financial assets 4.4% 4.5%Current financial assets 13.3% 23.0%Non-current financial liabilities 20.9% 0.0%Current financial liabilities 15.4% 26.4%
The Group uses forward currency contracts to manage the currency exposure on transactions significant to its operations. It is the Group’s policy not to enter into forward contracts until a highly probable forecast transaction is in place and to negotiate the terms of the derivative instruments used for hedging to match the terms of the hedged item to maximise hedge effectiveness.
Foreign currency sensitivity analysisThe income statements of foreign operations are translated into the reporting currency using a weighted average exchange rate of conversion. Foreign currency monetary items are translated using the closing rate at the reporting date. Revenues and costs in currencies other than the functional currency of an operating unit are recorded at the prevailing rate at the date of the transaction. The following significant exchange rates applied during the year in relation to United States dollars:
2018 2017
Average rate Closing rate Average rate Closing rate
Sterling 1.34 1.28 1.29 1.35Kuwaiti dinar 3.31 3.29 3.30 3.32Euro 1.18 1.15 1.13 1.20
Annual report and accounts 2018 Petrofac 169
Financial statem
entsG
overnance
Strateg
ic repo
rt
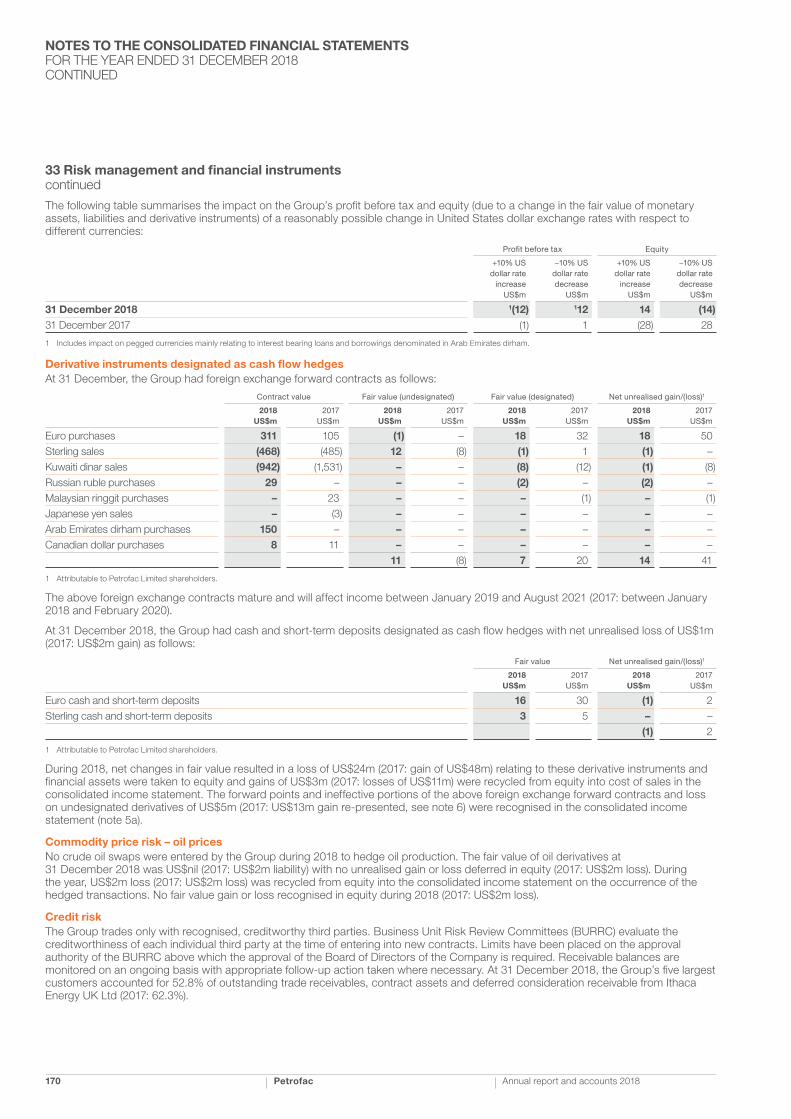
33 Risk management and financial instruments continued
The following table summarises the impact on the Group’s profit before tax and equity (due to a change in the fair value of monetary assets, liabilities and derivative instruments) of a reasonably possible change in United States dollar exchange rates with respect to different currencies:
Profit before tax Equity
+10% US dollar rate
increase US$m
−10% US dollar rate decrease
US$m
+10% US dollar rate
increase US$m
−10% US dollar rate decrease
US$m
31 December 2018 1(12) 112 14 (14)31 December 2017 (1) 1 (28) 28
1 Includes impact on pegged currencies mainly relating to interest bearing loans and borrowings denominated in Arab Emirates dirham.
Derivative instruments designated as cash flow hedgesAt 31 December, the Group had foreign exchange forward contracts as follows:
Contract value Fair value (undesignated) Fair value (designated) Net unrealised gain/(loss)1
2018 US$m
2017 US$m
2018 US$m
2017 US$m
2018 US$m
2017 US$m
2018 US$m
2017 US$m
Euro purchases 311 105 (1) – 18 32 18 50Sterling sales (468) (485) 12 (8) (1) 1 (1) –Kuwaiti dinar sales (942) (1,531) – – (8) (12) (1) (8)Russian ruble purchases 29 – – – (2) – (2) –Malaysian ringgit purchases – 23 – – – (1) – (1)Japanese yen sales – (3) – – – – – –Arab Emirates dirham purchases 150 – – – – – – –Canadian dollar purchases 8 11 – – – – – –
11 (8) 7 20 14 41
1 Attributable to Petrofac Limited shareholders.
The above foreign exchange contracts mature and will affect income between January 2019 and August 2021 (2017: between January 2018 and February 2020).
At 31 December 2018, the Group had cash and short-term deposits designated as cash flow hedges with net unrealised loss of US$1m (2017: US$2m gain) as follows:
Fair value Net unrealised gain/(loss)1
2018 US$m
2017 US$m
2018 US$m
2017 US$m
Euro cash and short-term deposits 16 30 (1) 2Sterling cash and short-term deposits 3 5 – –
(1) 2
1 Attributable to Petrofac Limited shareholders.
During 2018, net changes in fair value resulted in a loss of US$24m (2017: gain of US$48m) relating to these derivative instruments and financial assets were taken to equity and gains of US$3m (2017: losses of US$11m) were recycled from equity into cost of sales in the consolidated income statement. The forward points and ineffective portions of the above foreign exchange forward contracts and loss on undesignated derivatives of US$5m (2017: US$13m gain re-presented, see note 6) were recognised in the consolidated income statement (note 5a).
Commodity price risk – oil pricesNo crude oil swaps were entered by the Group during 2018 to hedge oil production. The fair value of oil derivatives at 31 December 2018 was US$nil (2017: US$2m liability) with no unrealised gain or loss deferred in equity (2017: US$2m loss). During the year, US$2m loss (2017: US$2m loss) was recycled from equity into the consolidated income statement on the occurrence of the hedged transactions. No fair value gain or loss recognised in equity during 2018 (2017: US$2m loss).
Credit riskThe Group trades only with recognised, creditworthy third parties. Business Unit Risk Review Committees (BURRC) evaluate the creditworthiness of each individual third party at the time of entering into new contracts. Limits have been placed on the approval authority of the BURRC above which the approval of the Board of Directors of the Company is required. Receivable balances are monitored on an ongoing basis with appropriate follow-up action taken where necessary. At 31 December 2018, the Group’s five largest customers accounted for 52.8% of outstanding trade receivables, contract assets and deferred consideration receivable from Ithaca Energy UK Ltd (2017: 62.3%).
NOTES TO THE CONSOLIDATED FINANCIAL STATEMENTSFOR THE YEAR ENDED 31 DECEMBER 2018CONTINUED
170 Annual report and accounts 2018 Petrofac

With respect to credit risk arising from the other financial assets of the Group, which comprise cash and cash equivalents, current and non-current receivables from joint operation partners for finance leases and certain derivative instruments, the Group’s exposure to credit risk arises from default of the counterparty, with a maximum exposure equal to the carrying amount of these instruments.
Liquidity riskThe Group’s objective is to ensure sufficient liquidity to support operations and future growth is available. The provision of financial capital and the potential impact on the Group’s capital structure is reviewed regularly. The Group is not exposed to any external capital constraints. The maturity profiles of the Group’s financial liabilities at 31 December are as follows:
Year ended 31 December 2018
6 months or less US$m
6–12 months US$m
1–2 years US$m
2–5 years US$m
More than 5 years US$m
Contractual undiscounted
cash flows US$m
Carrying amount
US$m
Financial liabilitiesInterest-bearing loans and borrowings 161 100 300 80 – 641 636Finance lease creditors 76 63 121 205 60 525 451Trade and other payables (excluding other taxes payable) 780 111 – – – 891 891Derivative instruments 15 5 2 – – 22 22Interest payments 11 8 11 2 – 32 –
1,043 287 434 287 60 2,111 2,000
Year ended 31 December 2017
6 months or less US$m
6–12 months US$m
1–2 years US$m
2–5 years US$m
More than 5 years US$m
Contractual undiscounted
cash flows US$m
Carrying amount
US$m
Financial liabilitiesInterest-bearing loans and borrowings 40 686 218 608 44 1,596 1,579Finance lease creditors 86 67 122 292 95 662 547Trade and other payables (excluding advances from customers and other taxes payable) 1,022 50 – – – 1,072 1,072Derivative instruments 25 2 8 – – 35 35Interest payments 25 20 22 30 1 98 –
1,198 825 370 930 140 3,463 3,233
The Group uses various funded facilities provided by banks and its own financial assets to fund the above-mentioned financial liabilities.
Capital managementThe Group’s policy is to maintain a robust capital base to support future operations, growth and maximise shareholder value.
The Group seeks to optimise shareholder returns by maintaining a balance between debt and equity attributable to Petrofac Limited shareholders and monitors the efficiency of its capital structure on a regular basis. The gearing ratio and return on shareholders’ equity is as follows:
2018 US$m
2017 US$m
Cash and short-term deposits 726 967Interest-bearing loans and borrowings (A) (636) (1,579)Net cash/(debt) (B) 90 (612)Equity attributable to Petrofac Limited shareholders (C) 707 912Reported net profit/(loss) for the year attributable to Petrofac Limited shareholders (D) 64 (29)Gross gearing ratio (A/C) 90.0% 173.1%Net gearing ratio (B/C) Net cash 67.1%
Shareholders’ return on investment (D/C) 9.1% (3.2%)
Annual report and accounts 2018 Petrofac 171
Financial statem
entsG
overnance
Strateg
ic repo
rt

34 Subsidiaries, associates and joint arrangementsAt 31 December 2018, the Group had investments in the following active subsidiaries, associates and joint arrangements:
Proportion of nominal value of issued shares controlled
by the Group
Name of entity Country of incorporation 2018 2017
Active subsidiariesPetrofac Algeria EURL Algeria 100 100Petrofac International (Bahrain) S.P.C. Bahrain 100 100Petrofac South East Asia (B) Sdn Bhd Brunei 100 –Petrofac (Cyprus) Limited Cyprus 100 100Caltec Limited England 100 100Eclipse Petroleum Technology Limited England 100 100K W Limited England 100 100Oilennium Limited England 100 100Petrofac (Malaysia-PM304) Limited England 100 100Petrofac Contracting Limited England 100 100Petrofac Engineering Limited England 100 100Petrofac Services Limited England 1001 1001
Petrofac Treasury UK Limited England 1001 1001
Petrofac UK Holdings Limited England 1001 1001
PetroHealth Limited England 100 100Petrofac Energy Developments UK Limited England – 1001
Petrofac Deutschland GmbH Germany 100 100Jermyn Insurance Company Limited Guernsey 1001 1001
Petrofac Engineering India Private Limited India 100 100Petrofac Engineering Services India Private Limited India 100 100Petrofac Information Services Private Limited India 100 100Petrofac (JSD 6000) Limited Jersey 100 100Petrofac Energy Developments (Ohanet) Jersey Limited Jersey 100 100Petrofac Energy Developments International Limited Jersey 1001 1001
Petrofac Facilities Management International Limited Jersey 1001 1001
Petrofac FPF004 Limited Jersey 100 100Petrofac GSA Holdings Limited Jersey – 1001
Petrofac GSA Limited Jersey – 100Petrofac Integrated Energy Services Limited Jersey 1001 1001
Petrofac International Ltd Jersey 1001 1001
Petrofac Offshore Management Limited Jersey 100 100Petrofac Platform Management Services Limited Jersey 100 100Petrofac Training International Limited Jersey 1001 1001
Petro Oil & Gas Limited (note 13) Jersey 512 –Petroleum Facilities E & C Limited Jersey 1001 1001
Petrofac E&C Sdn Bhd Malaysia 100 100
NOTES TO THE CONSOLIDATED FINANCIAL STATEMENTSFOR THE YEAR ENDED 31 DECEMBER 2018CONTINUED
172 Annual report and accounts 2018 Petrofac

Proportion of nominal value of issued shares controlled
by the Group
Name of entity Country of incorporation 2018 2017
Petrofac Energy Developments Sdn Bhd Malaysia 100 100Petrofac Engineering Services (Malaysia) Sdn Bhd Malaysia 70 70PFMAP Sdn Bhd Malaysia 100 100Petrofac EPS Sdn. Bhd (formerly SPD Well Engineering Sdn Bhd) Malaysia 492 492
H&L/SPD Americas S. de R.L. Mexico 100 100Petrofac Mexico SA de CV Mexico 100 100Petrofac Mexico Servicios SA de CV Mexico 100 100Operadora de Campos del Noreste S.A. de C.V. Mexico – 100Petrofac Kazakhstan B.V. Netherlands 100 100Petrofac Netherlands Coöperatief U.A. Netherlands 100 100Petrofac Netherlands Holdings B.V. (note 13) Netherlands 512 100Petrofac Treasury B.V. Netherlands – 100Petrofac Nigeria B.V. Netherlands 100 100Petrofac Norge B.V. Netherlands 100 100PTS B.V. Netherlands 100 100Petrofac Energy Services Nigeria Limited Nigeria 100 100Petrofac International (Nigeria) Limited Nigeria 100 402
Petrofac Norge AS Norway 100 100Petrofac E&C Oman LLC Oman 100 100PKT Technical Services Ltd Russia 502 502
PKT Training Services Ltd Russia 100 100Sakhalin Technical Training Centre Russia 100 100Petrofac Saudi Arabia Company Limited Saudi Arabia 100 100Atlantic Resourcing Limited Scotland 100 100Petrofac Facilities Management Group Limited Scotland 100 100Petrofac Facilities Management Limited Scotland 100 100Petrofac Training Group Limited Scotland 100 100Petrofac Training Holdings Limited Scotland 100 100Petrofac Training Limited Scotland 100 100Scotvalve Services Limited Scotland 100 100SPD Limited Scotland 100 100Stephen Gillespie Consultants Limited Scotland 100 100Petrofac South East Asia Pte Ltd Singapore 1001 1001
Petrofac E&C International Limited United Arab Emirates 100 100Petrofac Emirates LLC (note 13) United Arab Emirates 75 75Petrofac FZE United Arab Emirates 100 100Petrofac International (UAE) LLC United Arab Emirates 100 100Petrofac Energy Developments (Ohanet) LLC United States – 100
Petrofac Inc. United States 1001 1001
Petrofac Training Inc. United States 100 100
SPD Group Limited British Virgin Islands 100 100
Annual report and accounts 2018 Petrofac 173
Financial statem
entsG
overnance
Strateg
ic repo
rt

34 Subsidiaries, associates and joint arrangementscontinued
Associates
Proportion of nominal value of issued shares controlled
by the Group
Name of associate Principal activities Country of incorporation 2018 2017
PetroFirst Infrastructure Limited Leasing of floating platforms to oil and gas industry Jersey 20 20PetroFirst Infrastructure 2 Limited Leasing of floating platforms to oil and gas industry Jersey 10 10Petrofac FPF1 Limited Leasing of floating platforms to oil and gas industry Jersey – 25Joint arrangements
Joint venturesSocar – Petrofac LLC Training services Azerbaijan 49 –Spiecapag – Petrofac International Limited
Engineering, procurement and construction management services
Jersey – 50
TTE Petrofac Limited Operation and management of a training centre Jersey – 50China Petroleum Petrofac Engineering Services Cooperatief U.A.
Consultancy for Petroleum and chemical engineering Netherlands 49 49
Takatuf Petrofac Oman LLC Construction, operation and management of a training centre
Oman 40 40
Joint operationsPetroAlfa Servicios Integrados de Energia SAPI de CV
Services to oil and gas industry Mexico 503 503
PSS Netherlands B.V. Engineering, procurement, supply of equipment and materials and related services to execute the Company’s scope of work for a project in Thailand
Netherlands 364 –
Bechtel Petrofac JV Engineering, procurement and construction management of a project in UAE
Unincorporated 355 355
NGL 4 JV EPC for a project in UAE Unincorporated 455 455
Petrofac/Black & Veatch JV Tendering and execution of a project in Kazakhstan Unincorporated – 805
Petrofac/Bonatti JV EPC for a project in Algeria Unincorporated 705 705
Petrofac/Daelim JV EPC for a project in Oman Unincorporated 505 505
Petrofac/ETAP JV Oil and gas exploration and production from Chergui concession
Unincorporated – 455
PM304 JV Oil and gas exploration and production in Malaysia Unincorporated 305 305
Petrofac/Samsung/CB&I CFP EPC for a project in Kuwait Unincorporated 475 475
Greater Stella Area joint operation Oil and gas exploration and production in UK Unincorporated – 205
Santuario Production Sharing Contract Oil and gas exploration and production in Mexico Unincorporated 365 365
Please note that only active entities are shown in the above tables. All dormant entities have been omitted.1 Directly held by Petrofac Limited.2 Entities consolidated as subsidiaries on the basis of control.3 Joint arrangement classified as joint operation on the basis of contractual arrangement, whereby the activities of the arrangement are primarily designed for the provision of output to the
venturers; this indicates that the venturers have rights to substantially all the economic benefits of the assets of the arrangement.4 The joint arrangement is classified as a joint operation as, contractually, the joint operation partners have rights to the joint operation’s assets and obligation for the joint operation’s
liabilities.5 The unincorporated arrangement between the venturers is a joint arrangement as, contractually, all the decisions about the relevant activities require unanimous consent by the venturers.
Unincorporated joint arrangements are recognised in the Group’s financial statements as joint operations.
The Group’s ownership interest in associates and joint ventures is disclosed on page 151 and page 152 respectively.
NOTES TO THE CONSOLIDATED FINANCIAL STATEMENTSFOR THE YEAR ENDED 31 DECEMBER 2018CONTINUED
174 Annual report and accounts 2018 Petrofac

35 Changes in accounting policies and disclosures resulting from adoption of IFRS 15Set out below are the amounts by which each line item in the consolidated income statement and consolidated balance sheet were affected as a result of adopting IFRS 15 ‘Revenue from Contracts with Customers’ (note 2.3) as at and for the year ended 31 December 2018. The first column shows amounts prepared in accordance with IFRS 15 and the second column shows amounts that would have been prepared in accordance with the previous standards and the prevailing Group accounting policy. The adoption of IFRS 15 did not have a material impact on the consolidated statement of other comprehensive income nor the consolidated statement of cash flows.
Consolidated income statement for the year ended 31 December 2018Amounts prepared
under IFRS 15
US$mPro forma
US$m
Revenue 5,829 5,494Cost of sales (5,110) (4,844)Gross profit 719 650Selling, general and administration expenses (216) (216)Exceptional items and certain re-measurements (356) (356)Other operating income 22 22Other operating expenses (10) (10)Operating profit 159 90Finance income 14 14Finance expense (81) (81)Share of net profit of associates and joint ventures 15 15Profit/(loss) before tax 107 38Income tax expense (46) (35)Net profit/(loss) 61 3
Attributable to:Petrofac Limited shareholders 64 2Non-controlling interests (3) 1
61 3Earnings/(loss) per share (US cents)
Basic 18.9 0.6Diluted 18.6 0.6
Annual report and accounts 2018 Petrofac 175
Financial statem
entsG
overnance
Strateg
ic repo
rt

Consolidated balance sheet as at 31 December 2018
Amounts prepared
under IFRS 15
US$mPro forma
US$m
AssetsNon-current assetsProperty, plant and equipment 685 685Goodwill 73 73Intangible assets 56 56Investments in associates and joint ventures 30 30Other financial assets 406 406Contract assets 40 –Other non-current assets – 40Deferred consideration 61 61Deferred tax assets 126 126
1,477 1,477Current assetsInventories 21 21Trade and other receivables 1,431 1,924Contract assets 1,998 –Work in progress – 1,533Related party receivables 1 1Other financial assets 144 144Income tax receivable 8 8Cash and short-term deposits 726 726
4,329 4,357Total assets 5,806 5,834Equity and liabilities EquityShare capital 7 7Share premium 4 4Capital redemption reserve 11 11Employee Benefit Trust shares (107) (107)Other reserves 95 95Retained earnings 697 635Equity attributable to Petrofac Limited shareholders 707 645Non-controlling interests 302 306Total equity 1,009 951Non-current liabilities Interest-bearing loans and borrowings 376 376Provisions 243 243Other financial liabilities 341 341Deferred tax liabilities 43 43
1,003 1,003Current liabilitiesTrade and other payables 962 1,324Contract liabilities 504 –Billings in excess of cost and estimated earnings – 507Interest-bearing loans and borrowings 260 260Other financial liabilities 139 139Income tax payable 244 233Accrued contract expenses 1,645 1,377Provisions 40 40
3,794 3,880Total liabilities 4,797 4,883Total equity and liabilities 5,806 5,834
NOTES TO THE CONSOLIDATED FINANCIAL STATEMENTSFOR THE YEAR ENDED 31 DECEMBER 2018CONTINUED
176 Annual report and accounts 2018 Petrofac

Appendix AThe Group references Alternative Performance Measures (“APMs”) when evaluating the Group’s reported financial performance, financial position and cash flows that are not defined or specified under International Financial Reporting Standards (“IFRS”). The Group considers that these APMs, which are not a substitute for or superior to IFRS measures, provide stakeholders with additional useful information by adjusting for certain reported items which impact upon IFRS measures or, by defining new measures, to aid the understanding of the Group’s financial performance, financial position and cash flows.
APM Description Closest equivalent IFRS measureAdjustments to reconcile to primary statements Rationale for adjustments
Group’s business performance net profit attributable to Petrofac Limited shareholders (note A1)
Measures net profitability
Group’s net profit/(loss) Petrofac presents business performance APM in the consolidated income statement as a means of measuring underlying business performance. The business performance net profit measure excludes the contribution of impairments of assets, fair value re-measurements, losses on disposal, restructuring and redundancy costs, onerous leasehold property provision, certain Corporate reporting segment professional services and amortisation of debt acquisition cost, contract migration costs and material deferred tax movements arising due to foreign exchange differences in jurisdictions where tax is computed based on the functional currency of the country
A re-presentation was made to the Group’s business performance APM during the year, refer note 6 for details
The intention of this measure is to provide users of the consolidated financial statements with a clear and consistent presentation of underlying business performance and it excludes the impact of certain items to aid comparability
Business performance basic and diluted earnings per share attributable to Petrofac Limited shareholders (note A2)
Measures net profitability
Basic and diluted earnings per share
Business performance earnings before interest, tax, depreciation and amortisation (“EBITDA”) (note A3)
Measures operating profitability
Operating profit/(loss) Excludes exceptional items and certain re-measurements, depreciation and amortisation and includes share of net profits from associates and joint ventures
The intention of this measure is to provide users of the consolidated financial statements with a clear and consistent presentation of underlying operating performance
Business performance effective tax rate (“ETR”) (note A4)
Measures tax charge
Income tax expense Excludes income tax credit related to exceptional items and certain re-measurements
The intention of this measure is to provide users of the consolidated financial statements with a clear and consistent presentation of underlying business performance ETR
Capital expenditure (note A5)
Measures net cash cost of capital investment
Net cash flows generated from/(used in) investing activities
Excludes dividends received from associates and joint ventures, net loans repaid by/(paid to) associates and joint ventures, proceeds from disposal of property, plant and equipment, proceeds from disposal of subsidiaries and interest received
Excludes items not considered relevant to capital investment
Free cash flow (note A6)
Measures net cash generated after operating and investing activities to finance returns to shareholders
Net cash flows generated from/(used in) operating activities plus net cash flows generated from/(used in) investing activities plus amounts received from non-controlling interest
n/a n/a
APPENDICES
Annual report and accounts 2018 Petrofac 177
Financial statem
entsG
overnance
Strateg
ic repo
rt

APM Description Closest equivalent IFRS measureAdjustments to reconcile to primary statements Rationale for adjustments
Working capital, balance sheet measure (note A7)
Measures the investment in working capital
No direct equivalent. Calculated as inventories plus trade and other receivables plus contract assets minus trade and other payables minus contract liabilities minus accrued contract expenses
n/a n/a
Return on capital employed (“ROCE”) (note A8)
Measures the efficiency of generating operating profits from capital employed
No direct equivalent. Calculated as business performance earnings before interest, tax and amortisation (EBITA) divided by capital employed (average total assets minus average current liabilities after adjusting for certain finance leases)
n/a n/a
Cash conversion (note A9)
Measures the conversion of EBITDA into cash
No direct equivalent. Calculated as cash generated from operations divided by business performance EBITDA
n/a n/a
Net finance lease liabilities (note A10)
Measures net finance lease liabilities
No direct equivalent. Calculated as gross finance lease liabilities minus 70% of finance leases in respect of oil and gas facilities relating to Block PM304 in Malaysia
n/a n/a
Net debt (note A11)
Measures indebtedness
No direct equivalent. Calculated as interest-bearing loans and borrowings minus cash and short-term deposits
n/a n/a
Net debt/EBITDA (note A12)
Measures leverage
No direct equivalent. Calculated as net debt divided by EBITDA
n/a n/a
New order intake (note A13)
Provides visibility of future revenue
No direct equivalent. Calculated as net awards and net variation orders
n/a n/a
APPENDICES CONTINUED
178 Annual report and accounts 2018 Petrofac

A1. Business performance net profit attributable to Petrofac Limited shareholders2018
US$m*2017
US$m
Reported net profit/(loss) (A) 61 (27)Adjustments – exceptional items and certain re-measurements (note 6):Impairment of assets 235 345Fair value re-measurements 45 77Loss on disposal 28 –Group reorganisation and redundancy costs 8 4Onerous leasehold property provisions 18 12Other exceptional items 22 18Pre-tax exceptional items and certain re-measurements (B) 356 456Foreign exchange translation (gains)/losses on deferred tax balances 2 (11)Tax relief on exceptional items and certain re-measurements (69) (55)Tax credit on exceptional items and certain re-measurements (C) (67) (66)Post-tax exceptional items and certain re-measurements (D = B + C) 289 390Group’s business performance net profit (A + D) 350 363Loss/(profit) attributable to non-controlling interest 3 (2)Business performance net profit attributable to Petrofac Limited shareholders 353 361
* Re-presented due to the reclassification of an item from exceptional items and certain re-measurements to business performance as set out in note 6 ‘exceptional items and certain re-measurements’ to the consolidated financial statements.
A2. Business performance basic earnings per share attributable to Petrofac Limited shareholders2018
US$m*2017
US$m
Reported net profit/(loss) attributable to Petrofac Limited shareholders (E) 64 (29)Add: post-tax exceptional items and certain re-measurements (appendix A note A1) 289 390Business performance net profit attributable to Petrofac Limited shareholders (E1) 353 361
* Re-presented due to the reclassification of an item from exceptional items and certain re-measurements to business performance as set out in note 6 ‘exceptional items and certain re-measurements’ to the consolidated financial statements.
2018 Shares million
2017 Shares million
Weighted average number of ordinary shares for basic earnings per share1 (F) (note 9) 338 340Weighted average number of ordinary shares for diluted earnings per share1 (F1) (note 9) 345 340
2018 US cents
*2017 US cents
Basic earnings per share Business performance (E1/ F x 100) 104.4 106.2Reported (E/F x 100) 18.9 (8.5)Diluted earnings per share2
Business performance (E1/F1 x 100) 102.3 106.2Reported (E/F1 x 100) 18.6 (8.5)
* Re-presented due to the reclassification of an item from exceptional items and certain re-measurements to business performance as set out in note 6 ‘exceptional items and certain re-measurements’ to the consolidated financial statements.
1 The weighted number of ordinary shares in issue during the year, excludes those held by the Employee Benefit trust.2 For the year ended 31 December 2017, potentially issuable ordinary shares under the share-based payment plans are excluded from the diluted earnings per ordinary share calculation,
as their inclusion would decrease the loss per ordinary share.
Annual report and accounts 2018 Petrofac 179
Financial statem
entsG
overnance
Strateg
ic repo
rt

A3. Business performance EBITDA2018
US$m*2017
US$m
Reported operating profit/(loss) 159 104Adjustments:Pre-tax exceptional items and certain re-measurements (appendix A note A1) 356 456Share of net profits from associates and joint ventures (note 17) 15 11Depreciation (note 12) 140 170Amortisation and write off (note 5a and note 5b) 1 7Business performance EBITDA 671 748
* Re-presented due to the reclassification of an item from exceptional items and certain re-measurements to business performance as set out in note 6 ‘exceptional items and certain re-measurements’ to the consolidated financial statements.
A4. Business performance ETR2018
US$m*2017
US$m
Reported income tax expense 46 72Add: Tax credit on exceptional items and certain re-measurements (appendix A note A1) 67 66Business performance income tax expense (G) 113 138Group’s business performance net profit (appendix A note A1) 350 363Group’s business performance net profit before tax (H) 463 501Business performance ETR (G/H x 100) 24.4% 27.5%
* Re-presented due to the reclassification of an item from exceptional items and certain re-measurements to business performance as set out in note 6 ‘exceptional items and certain re-measurements’ to the consolidated financial statements.
A5. Capital expenditure2018
US$m2017
US$m
Net cash flows (from)/used in investing activities (213) 141Adjustments:Dividends received from associates and joint ventures 11 4Net loans repaid by/(paid to) associates and joint ventures 13 (2)Proceeds from disposal of property, plant and equipment 152 12Proceeds from disposal of subsidiaries 130 10Interest received 5 3Capital expenditure 98 168
A6. Free cash flow2018
US$m2017
US$m
Net cash flows generated from operating activities 484 422Net cash flows generated from/(used in) investing activities 213 (141)Amounts received from non-controlling interest 224 –Free cash flow 921 281
A7. Working capital2018
US$m2017
US$m
Inventories (note 19) 21 8Trade and other receivables (note 20) 1,431 2,020Contract assets (note 21) 1,998 –Work in progress – 2,223Current Assets (I) 3,450 4,251Trade and other payables (note 29) 962 1,675Contract liabilities (note 21) 504 –Billings in excess of cost and estimated earnings – 198Accrued contract expenses (note 32) 1,645 1,956Current Liabilities (J) 3,111 3,829Working capital (I – J) 339 422
APPENDICES CONTINUED
180 Annual report and accounts 2018 Petrofac

A8. Return on capital employed2018
US$m*2017
US$m
Reported operating profit/(loss) 159 104Adjustments:Pre-tax exceptional items and certain re-measurements (appendix A note A1) 356 456Share of profits from associates and joint ventures (note 17) 15 11Amortisation (note 5a and 5b) – 1Business performance EBITA (K) 530 572Total assets opening balance 7,563 8,241Less: 70% on finance leases in respect of oil and gas facilities relating to Block PM304 in Malaysia (381) (414)Adjusted total assets opening balance (L) 7,182 7,827Total assets closing balance 5,806 7,563Less: 70% on finance leases in respect of oil and gas facilities relating to Block PM304 in Malaysia (note A10) (313) (381)Adjusted total assets closing balance (M) 5,493 7,182Average total assets (N = (L + M)/2) 6,338 7,505Current liabilities opening balance 4,982 5,029Less: 70% on finance leases in respect of oil and gas facilities relating to Block PM304 in Malaysia (note A10) (76) (179)Adjusted current liabilities opening balance (O) 4,906 4,850Current liabilities closing balance 3,794 4,982Less: 70% on finance leases in respect of oil and gas facilities relating to Block PM304 in Malaysia (note A10) (76) (76)Adjusted current liabilities closing balance (P) 3,718 4,906Average current liabilities (Q = (O + P)/2) 4,312 4,878Capital employed (R = N – Q) 2,026 2,627Return on capital employed (K/R x 100) 26.2% 21.8%
* Re-presented due to the reclassification of an item from exceptional items and certain re-measurements to business performance as set out in note 6 ‘exceptional items and certain re-measurements’ to the consolidated financial statements.
A9. Cash conversion2018
US$m*2017
US$m
Cash generated from operations (S) 681 575Business performance EBITDA (T) 671 748Cash conversion (S/T x 100) 101.5% 76.9%
* Re-presented due to the reclassification of an item from exceptional items and certain re-measurements to business performance as set out in note 6 ‘exceptional items and certain re-measurements’ to the consolidated financial statements.
A10. Net finance lease liabilities2018
US$m2017
US$m
Non-current liability for finance leases (note 18) 339 435Current liability for finance leases (note 18) 112 112Total gross liability for finance leases 451 54770% gross up on non-current liability for finance leases in respect of oil and gas facilities relating to Block PM304 in Malaysia (note 18) 237 30570% gross up on current liability for finance leases in respect of oil and gas facilities relating to Block PM304 in Malaysia (note 18) 76 76Total 70% on finance leases in respect of oil and gas facilities relating to Block PM304 in Malaysia 313 381Net non-current liability for finance leases 102 130Net current liability for finance leases 36 36Net liability for finance leases 138 166
Annual report and accounts 2018 Petrofac 181
Financial statem
entsG
overnance
Strateg
ic repo
rt

A11. Net Debt2018
US$m2017
US$m
Interest-bearing loans and borrowings (U) (note 27) 636 1,579Less: Cash and short-term deposits (V) (note 22) (726) (967)Net (cash)/debt (U – V) (90) 612
A12. Net Debt/EBITDA2018
US$m*2017
US$m
Net Debt (W) (appendix A note A11) NA 612Business performance EBITDA (X) (note A3) NA 748Net Debt/EBITDA (W/X) NA 0.82
* Re-presented due to the reclassification of an item from exceptional items and certain re-measurements to business performance as set out in note 6 ‘exceptional items and certain re-measurements’ to the consolidated financial statements.
A13. New order intake2018
US$m2017
US$m
Engineering & Construction operating segmentNet awards 3,308 3,711Net variation orders 527 390
3,835 4,101Engineering & Production Services operating segmentNet awards 1,131 992Net variation orders 74 109
1,205 1,101New order intake 5,040 5,202
APPENDICES CONTINUED
182 Annual report and accounts 2018 Petrofac

COMPANYFINANCIALSTATEMENTS
183-201
184 Company income statement
184 Company statement of other comprehensive income
185 Company balance sheet
186 Company statement of cash flows
187 Company statement of changes in equity
188 Notes to the Company financial statements
188 Note 1 Corporate information
188 Note 2 Summary of significant accounting policies
191 Note 3 Revenue
191 Note 4 General and administration expenses
191 Note 5 Impairment of investments in subsidiaries and net reversal of provision for doubtful debts on amounts due from subsidiaries
191 Note 6 Other operating income
191 Note 7 Other operating expenses
192 Note 8 Finance income/(expense)
192 Note 9 Dividends paid and proposed
193 Note 10 Investments in subsidiaries
193 Note 11 Investments in associates
193 Note 12 Amounts due from/due to subsidiaries
194 Note 13 Cash and short-term deposits
194 Note 14 Employee Benefit Trust (“EBT”) shares
194 Note 15 Share-based payments reserve
195 Note 16 Interest-bearing loans and borrowings
196 Note 17 Other financial assets and other financial liabilities
198 Note 18 Commitments and contingent liabilities
198 Note 19 Risk management and financial instruments
201 Note 20 Related party transactions
201 Note 21 Share capital
202 Shareholder information
203 Glossary
Financial statem
entsG
overnance
Strateg
ic repo
rt
183PetrofacAnnual report and accounts 2018

Notes2018
US$m2017*
US$m
Revenue 3 580 210General and administration expenses 4 (22) (17)Expected credit loss allowance 12 (6) –Impairment of investments in subsidiaries 5 (231) (308)Net reversal of provision for doubtful debts on amounts due from subsidiaries 5 – 252Other operating income 6 10 5Other operating expenses 7 (72) (30)Operating profit 259 112Finance income 8 39 40Finance expense 8 (69) (60)Profit before tax 229 92Income tax expense – –Net profit 229 92
* Re-presented due to the reclassification of ‘impairment of investments in subsidiaries’ and ‘net reversal of provision for doubtful debts on amounts due from subsidiaries’ as set out in note 7 ‘other operating expenses’ to the Company financial statements.
COMPANY STATEMENT OF OTHER COMPREHENSIVE INCOMEFOR THE YEAR ENDED 31 DECEMBER 2018
2018 US$m
2017 US$m
Net profit 229 92Other comprehensive income – –Total comprehensive income 229 92
COMPANY INCOME STATEMENTFOR THE YEAR ENDED 31 DECEMBER 2018
184 Annual report and accounts 2018 Petrofac

Notes2018
US$m2017
US$m
Assets Non-current assets
Investments in subsidiaries 10 220 227Investments in associates 11 7 7Other financial assets 17 60 23
287 257Current assets
Trade and other receivables 1 1Amounts due from subsidiaries 12 1,945 2,105Other financial assets 17 58 21Cash and short-term deposits 13 54 35
2,058 2,162Total assets 2,345 2,419Equity and liabilities Equity attributable to Petrofac Limited shareholders
Share capital 21 7 7Share premium 21 4 4Capital redemption reserve 21 11 11Employee Benefit Trust shares 14 (107) (102)Share-based payments reserve 15 79 81Retained earnings 508 412Total equity 502 413Non-current liabilities
Interest-bearing loans and borrowings 16 376 854Other financial liabilities 17 2 8Long-term employee benefit provisions – 1
378 863Current liabilities
Trade and other payables 3 7Amounts due to subsidiaries 12 1,183 401Interest-bearing loans and borrowings 16 257 702Other financial liabilities 17 22 33
1,465 1,143Total liabilities 1,843 2,006Total equity and liabilities 2,345 2,419
The financial statements on pages 184 to 201 were approved by the Board of Directors on 27 February 2019 and signed on its behalf by Alastair Cochran – Chief Financial Officer.
COMPANY BALANCE SHEETAT 31 DECEMBER 2018
Annual report and accounts 2018 Petrofac 185
Financial statem
entsG
overnance
Strateg
ic repo
rt

Notes2018
US$m2017
US$m
Operating activities Profit before tax 229 92
Adjustments to reconcile profit before tax:Loss on disposal of a subsidiary 7 41 –Impairment of investments in subsidiaries 5 231 308Net reversal of provision for doubtful debts on amounts due from subsidiaries 5 – (252)Net finance expense 8 30 20Expected credit loss allowance recognised during the year 12 6 –Net other non-cash items (1) (8)
536 160Working capital adjustments:Amounts due from subsidiaries (228) 357Trade and other receivables (1) –Trade and other payables (4) 4Amounts due to subsidiaries 769 (69)Cash generated from operations 1,072 452Interest paid 8 (55) (55)Net cash flows generated from operating activities 1,017 397
Investing activities Net proceeds from disposal of a subsidiary 7 105 –Interest received 8 3 2Net cash flows generated from investing activities 108 2
Financing activitiesInterest-bearing loans and borrowings, net of debt acquisition cost 16 1,858 1,105Repayment of interest-bearing loans and borrowings 16 (2,803) (1,303)Purchase of Company’s shares by Employee Benefit Trust 14 (44) (39)Dividends paid1 (127) (189)Net cash flows used in financing activities (1,116) (426)
Net increase/(decrease) in cash and cash equivalents 9 (27)Cash and cash equivalents at 1 January 27 54Cash and cash equivalents at 31 December 13 36 27
1 Dividend payments have been made by both the Company and subsidiary entities.
COMPANY STATEMENT OF CASH FLOWSFOR THE YEAR ENDED 31 DECEMBER 2018
186 Annual report and accounts 2018 Petrofac

Issued share capital US$m
(note 21)
Share premium
US$m
Capital redemption
reserve US$m
Employee Benefit Trust
shares1 US$m
(note 14)
Share-based payments
reserve US$m (note 15)
Retained earnings
US$mTotal equity
US$m
Balance at 1 January 2017 7 4 11 (105) 84 516 517Profit – – – – – 92 92Other comprehensive income – – – – – – –Total comprehensive income – – – – – 92 92Purchase of Company’s shares by Employee Benefit Trust (note 14) – – – (39) – – (39)Issue of Company’s shares by Employee Benefit Trust (note 15) – – – 42 (38) (4) –Credit to equity for share-based payments charge invoiced to subsidiaries (note 15) – – – – 35 – 35Dividends (note 9) – – – – – (192) (192)Balance at 1 January 2018 7 4 11 (102) 81 412 413Profit – – – – – 229 229Other comprehensive income – – – – – – –Total comprehensive income – – – – – 229 229Purchase of Company’s shares by Employee Benefit Trust (note 14) – – – (44) – – (44)Issue of Company’s shares by Employee Benefit Trust (note 15) – – – 39 (34) (5) –Credit to equity for share-based payments charge invoiced to subsidiaries (note 15) – – – – 32 – 32Dividends (note 9) – – – – – (128) (128)Balance at 31 December 2018 7 4 11 (107) 79 508 502
1 Shares held by Petrofac Employee Benefit Trust.
COMPANY STATEMENT OF CHANGES IN EQUITYFOR THE YEAR ENDED 31 DECEMBER 2018
Annual report and accounts 2018 Petrofac 187
Financial statem
entsG
overnance
Strateg
ic repo
rt

1 Corporate information
Petrofac Limited (the “Company”) is a limited liability company registered and domiciled in Jersey under the Companies (Jersey) Law 1991 and is the holding company for the international group of Petrofac subsidiaries. Petrofac Limited and its subsidiaries at 31 December 2018 comprise the Petrofac Group (the “Group”). The Group’s principal activity is the provision of services to the oil and gas production and processing industry.
The financial statements of the Company for the year ended 31 December 2018 were authorised for issue in accordance with a resolution of the Board of Directors on 27 February 2019.
2 Summary of significant accounting policies
Basis of preparationThe separate financial statements have been prepared in accordance with International Financial Reporting Standards (“IFRS”) as issued by the International Accounting Standards Board (“IASB”) and applicable requirements of Jersey law.
The separate financial statements of the Company have been prepared on a historical cost basis, except for derivative financial instruments and contingent consideration that have been measured at fair value. The functional and presentation currency of these separate financial statements is United States dollars and all values in the separate financial statements are rounded to the nearest million (“US$m”) except where otherwise stated.
Adoption of new financial reporting standards, amendments and interpretationsEffective new financial reporting amendmentsThe Company adopted IFRS 9 ‘Financial Instruments’ on 1 January 2018. The nature and effect of the changes are described below.
IFRS 9 ‘Financial Instruments’IFRS 9 replaced IAS 39 ‘Financial Instruments: Recognition and Measurement’ for annual periods beginning on or after 1 January 2018, bringing together all three aspects of the accounting for financial instruments: classification and measurement; impairment; and hedge accounting. Except for hedge accounting, which the Company applied prospectively, the Company has applied IFRS 9 retrospectively, with the initial application date of 1 January 2018, without adjusting the comparative information.
Classification and measurementThere was no impact to the balance sheet resulting from the Company applying the classification and measurement requirements of IFRS 9.
ImpairmentIFRS 9 requires the Company to measure and recognise expected credit losses on all applicable financial assets, amounts due from subsidiaries, loans and receivables and bank balances, either on a 12-month or lifetime expected loss basis. The Company will apply the simplified approach and record lifetime expected losses on all amounts due from subsidiaries, loans and receivables and bank balances.
The adoption of impairment requirements under IFRS 9 had no material impact on the financial performance or position of the Company.
Hedge accountingThe Company had no designated hedges at 31 December 2018, hence the IFRS 9 hedge accounting requirements had no impact on the financial performance or position of the Company.
Investments in subsidiariesInvestments in subsidiaries are stated at cost less any provision for impairment.
Investments in associatesInvestments in associates are stated at cost less any provision for impairment.
Financial assetsInitial recognition and measurementFinancial assets are classified at initial recognition, as subsequently measured at amortised cost, fair value through other comprehensive income (“OCI”), and fair value through profit or loss.
All financial assets are recognised initially at fair value plus, in the case of financial assets not recorded at fair value, transaction costs that are attributable to the acquisition of the financial asset.
Subsequent measurementFor purposes of subsequent measurement financial assets are classified in the following categories:
• Amortised cost• Financial assets at fair value through profit or loss
Amortised costThe Company generally applies this category to trade and other receivables, amounts due from subsidiaries and deferred consideration receivable. The Company measures financial assets at amortised cost if both of the following conditions are met:
• The financial asset is held within a business model with the objective to hold financial assets in order to collect contractual cash flows; and
• The contractual terms of the financial asset give rise on specified dates to cash flows that are solely payments of principal and interest on the principal amount outstanding
Financial assets at amortised cost are subsequently measured using the effective interest (“EIR”) method and are subject to impairment. Gains and losses are recognised in the Company income statement when the asset is derecognised, modified or impaired.
Financial assets at fair value through profit or lossFinancial assets at fair value through profit or loss include financial assets held for trading and financial assets designated upon initial recognition at fair value through profit or loss, or financial assets mandatorily required to be measured at fair value. Financial assets are classified as held for trading if they are acquired for the purpose of selling or repurchasing in the near term. Derivatives, including separated embedded derivatives, are also classified as held for trading unless they are designated as effective hedging instruments. Financial assets at fair value through profit or loss are carried in the Company balance sheet at fair value with net changes in fair value recognised in the Company income statement.
Contingent consideration relating to a disposal of Company’s shareholding in a wholly owned subsidiary, Petrofac GSA Holdings Limited, was recognised as a financial asset at fair value through profit or loss within the other financial assets line item of the Company balance sheet. No fair value movement occurred during 2018.
The fair value changes to undesignated forward currency contracts are reported within the other operating income/expenses line item in the Company income statement.
NOTES TO THE COMPANY FINANCIAL STATEMENTSFOR THE YEAR ENDED 31 DECEMBER 2018
188 Annual report and accounts 2018 Petrofac
Impairment of financial assetsThe Company recognises an allowance for expected credit losses (“ECLs”) for all financial assets not held at fair value through profit or loss. ECLs are based on the difference between the contractual cash flows due in accordance with the contract and all the cash flows that the Company expects to receive, discounted at an approximation of the original effective interest rate. The expected cash flows will include, if any, cash flows from the sale of collateral held or other credit enhancements that are integral to the contractual terms.
For financial assets measured at amortised cost ECLs are recognised in two stages. For credit exposures for which there has not been a significant increase in credit risk since initial recognition, ECLs are provided for credit losses that result from default events that are possible within the next 12 months (a 12-month ECL). For those credit exposures for which there has been a significant increase in credit risk since initial recognition, a loss allowance is required for credit losses expected over the remaining life of the exposure, irrespective of the timing of the default (a lifetime ECL). There was no significant increase in the credit risk for such financial assets since the initial recognition.
The Company considers a financial asset to be in default when available information indicates that the Company is unlikely to receive the outstanding contractual amounts in full.
Financial liabilitiesInitial recognition and measurementFinancial liabilities are classified, at initial recognition, as financial liabilities at fair value through profit or loss, loans and borrowings, payables, or as derivatives designated as hedging instruments in an effective hedge, as appropriate.
All financial liabilities are recognised initially at fair value and, in the case of loans and borrowings and trade and other payables, net of directly attributable transaction costs.
The Company’s financial liabilities include trade and other payables, loans and borrowings including bank overdrafts and derivative financial instruments.
Subsequent measurementFor purposes of subsequent measurement financial liabilities are classified in the following categories:
• Financial liabilities at fair value through profit or loss• Loans and borrowings
Financial liabilities at fair value through profit or lossFinancial liabilities at fair value through profit or loss include financial liabilities held for trading and financial liabilities designated upon initial recognition as at fair value through profit or loss.
Financial liabilities are classified as held for trading if they are incurred for the purpose of repurchasing in the near term. This category also includes derivative financial instruments entered by the Company that are not designated as hedging instruments in hedge relationships.
Gains or losses on liabilities held for trading are recognised in the Company income statement.
Loans and borrowingsThis category generally applies to interest-bearing loans and borrowings (note 16). After initial recognition, interest-bearing loans and borrowings are subsequently measured at amortised cost using the EIR method. The EIR amortisation charge and the gains and losses, upon derecognition, are recognised in the other operating income or expenses line item in the Company income statement.
Amortised cost is calculated by considering any discount or premium on acquisition and fees or costs that are an integral part of the EIR.
Derecognition of financial assets and liabilitiesFinancial assetsA financial asset (or, where applicable, a part of a financial asset) is derecognised where:
• The rights to receive cash flows from the asset have expired• The Company retains the right to receive cash flows from
the asset, but has assumed an obligation to pay them in full without material delay to a third party under a ‘pass-through’ arrangement; or
• The Company has transferred its rights to receive cash flows from the asset and either (a) has transferred substantially all the risks and rewards of the asset, or (b) has neither transferred nor retained substantially all the risks and rewards of the asset, but has transferred control of the asset
Financial liabilitiesA financial liability is derecognised when the obligation under the liability is discharged or cancelled or expires. If an existing financial liability is replaced by another from the same lender, on substantially different terms, or the terms of an existing liability are substantially modified, such an exchange or modification is treated as a derecognition of the original liability and the recognition of a new liability such that the difference in the respective carrying amounts together with any costs or fees incurred are recognised in the Company income statement.
Offsetting of financial instrumentsFinancial assets and financial liabilities are offset and the net amount is reported in the balance sheet if there is a currently enforceable legal right to offset the recognised amounts and there is an intention to settle on a net basis, to realise the assets and settle the liabilities simultaneously.
Derivative financial instruments and hedgingThe Company uses derivative financial instruments such as forward currency contracts to hedge its risks associated with foreign currency. Such derivative financial instruments are initially recognised at fair value on the date on which a derivative contract is entered and are subsequently re-measured at fair value. Derivatives are carried as assets when the fair value is positive and as liabilities when the fair value is negative.
Any gains or losses arising from changes in the fair value of derivatives that do not qualify for hedge accounting are taken to the income statement.
The fair value of forward currency contracts is calculated by reference to current forward exchange rates for contracts with similar maturity profiles.
Cash and cash equivalentsCash and cash equivalents consist of cash at bank and in hand and short-term deposits with an original maturity of three months or less, net of expected credit loss allowance calculated based on the probability of default data for the counterparty sourced from a third-party provider.
For the purpose of the statement of cash flow, cash and cash equivalents consists of cash and cash equivalents as defined above, net of outstanding bank overdrafts.
Annual report and accounts 2018 Petrofac 189
Financial statem
entsG
overnance
Strateg
ic repo
rt

NOTES TO THE COMPANY FINANCIAL STATEMENTSFOR THE YEAR ENDED 31 DECEMBER 2018CONTINUED
2 Summary of significant accounting policiescontinued
Petrofac Employee Benefit TrustThe Petrofac Employee Benefit Trust (the “Trust”) is treated as extension of the activities of the Company and accordingly the Company financial statements include all transactions and balances of the Trust except for transaction and balances between the Company and the Trust.
Employee Benefit Trust (“EBT”) sharesFor the purpose of making awards under the Group’s employee share schemes, shares in the Company are purchased and held by the Petrofac Employee Benefit Trust. All these shares have been classified in the Company balance sheet as EBT shares within equity. Shares vested during the year are satisfied with these shares.
Share-based paymentsEmployees of subsidiaries receive remuneration in the form of share-based payment, whereby employees render services in exchange for Company shares or rights over shares (‘equity-settled transactions’).
Equity-settled transactionsThe cost of equity-settled transactions with employees is measured by reference to the fair value at the date on which they are granted.
The cost of equity-settled transactions is invoiced to subsidiaries and recognised as a receivable within due from subsidiaries line item in the Company balance sheet, together with a corresponding increase in other reserves line item in the Company balance sheet, over the period in which the relevant employees become entitled to the award (the ‘vesting period’).
Significant accounting estimatesSources of estimation uncertaintyThe key assumptions concerning the future and other key sources of estimation uncertainty at the end of the reporting period that have a significant risk of causing a material adjustment to the carrying amounts of assets and liabilities within the next financial year are discussed below:
• Recoverable amount of investments in subsidiaries and ECL allowance on amounts due from subsidiaries: the Company recognises an allowance for ECLs for amounts due from subsidiaries based on the difference between the contractual cash flows due in accordance with the contract and all the cash flows that the Company expects to receive, discounted at an approximation of the original effective interest rate. The expected cash flows will include, if any, cash flows from the sale of collateral held or other credit enhancements that are integral to the contractual terms. For determining the recoverable amount of investments in subsidiaries the Company determines at end of each reporting period whether there is any evidence of indicators of impairment in the carrying amount of its investments in subsidiaries. Where indicators exist, an impairment test is undertaken which requires management to estimate the recoverable amount of its assets which is based on value in use. The value in use calculation is based on output of management’s business planning process which involves assumptions relating to, but not limited to, future profitability, discount rate and inflation. The carrying amount of investments in and amounts due from subsidiaries was US$220m and US$1,945m respectively (2017: US$227m and US$2,105m respectively).
TaxationProfits arising in the Company for the 2018 year of assessment will be subject to Jersey tax at the standard corporate income tax rate of 0%.
190 Annual report and accounts 2018 Petrofac

3 Revenue
Dividends from subsidiaries and associates are recognised when the right to receive payment is established. 2018
US$m2017
US$m
Dividend income from subsidiaries 572 207Dividend income from associates (note 11) 8 3
580 210
4 General and administration expenses
General and administration expenses relate to costs directly incurred by the Company. This also includes re-charged portion of the corporate personnel cost, travelling and entertainment and professional cost by one of its subsidiaries of US$16m (2017: US$14m) recognised within general and administration expenses line item in the Company income statement.
Included in general and administration expenses is auditor’s remuneration of US$50,000 (2017: US$61,000) related to the fee for the audit of the Company’s financial statements. It excludes fees in relation to the audit of the Group financial statements, which are borne by Petrofac Services Limited.
5 Impairment of investments in subsidiaries and net reversal of provision for doubtful debts on amounts due from subsidiaries
2018 US$m
2017 US$m
Impairment of investments in subsidiaries 231 308Net reversal of provision for doubtful debts on amounts due from subsidiaries – (252)
Impairment of investments in subsidiaries of US$231m relates to Petrofac Energy Developments International Limited resulting from the Group’s entity structure reorganisation due to the disposal of the Group’s 49% non-controlling interest of its operations in Mexico, refer note 11a of the Group’s consolidated financial statements (2017: US$239m relating to Petrofac UK Holdings Limited and $69m relating to Petrofac GSA Holdings Limited).
At 31 December 2017, one of the subsidiaries of the Company provided a financial guarantee to Company’s subsidiaries in respect of the amounts owned by these entities to the Company. This resulted in a reversal of earlier impairment provisions booked against amounts due from subsidiaries of US$294m which was offset by a provision for doubtful debts on amounts due from subsidiaries of US$42m.
6 Other operating income2018
US$m2017
US$m
Exchange gain and forward points on undesignated foreign currency contracts 6 4Recharges to subsidiaries 4 –Others – 1
10 5
7 Other operating expenses2018
US$m20171
US$m
Effective interest rate amortisation and losses resulting from changes in interest-bearing loans and borrowings repayment terms (note 16) 12 6Loss on sale of a subsidiary (note 10) 41 7Others 19 17
72 30
1Re-presentation of ‘impairment of investments in subsidiaries’ and ‘net reversal of provision for doubtful debts on amounts due from subsidiaries’During 2018, Management reported material items relating to ‘impairment of investments in subsidiaries’ and ‘net reversal of provision for doubtful debts on amounts due from subsidiaries’ separately in the Company income statement. As a result the comparative information was re-presented and associated amounts were reclassified from ‘other operating expenses’ to separate line items in the Company income statement. This reclassification did not have any impact on the Company balance sheet nor the Company statement of cash flows.
Loss on sale of a subsidiaryOn 26 August 2018, the Company signed a sale and purchase agreement (“SPA”) with Ithaca Energy UK Ltd for the disposal of its wholly owned subsidiary, Petrofac GSA Holdings Limited. The disposal was completed on 11 December 2018, and a loss on disposal of US$41m was recognised in the Company income statement. The carrying amount of GSA investment at the time of the disposal was US$224m. The fair value of consideration comprised cash consideration of US$106m, deferred consideration of US$59m and contingent consideration of US$19m with associated disposal costs of US$1m.
Annual report and accounts 2018 Petrofac 191
Financial statem
entsG
overnance
Strateg
ic repo
rt

7 Other operating expenses continued
Cash consideration of US$106m was received by the Company on the date of completion; the deferred consideration of US$59m, recoverable over a period of four years under the terms of the SPA, was initially recognised at fair value using a discount rate of 8.4% and will subsequently be measured at amortised cost as a non-current financial asset in the Company balance sheet (note 17). No unwinding of the discount on the deferred consideration was recognised from the date of disposal to the end of the reporting period in the Company income statement.
The contingent consideration of US$19m is dependent upon certain performance conditions being satisfied and is recoverable over a period of one year and was recognised as a current financial asset in the Company balance sheet (note 17). The contingent consideration was initially measured and recognised at fair value and will subsequently be measured at fair value with any fair value gain and loss recognised as an expense in the Company income statement. No fair value movement was recognised from the date of disposal to the end of the reporting period. The fair value of the contingent consideration took into consideration Management’s expectation of meeting certain performance conditions by applying a risk factor (a Level 3 measurement of the ‘fair value hierarchy’ contained within IFRS 13 ‘Fair Value Measurement’) to the maximum contingent consideration receivable. A 10% increase in risk the factor would result in a negative fair value change of US$3m.
Other expenses mainly include legal and professional expenses of US$16m (2017: US$16m).
8 Finance income/(expense)2018
US$m2017
US$m
Finance incomeBank interest 3 2On amounts due from subsidiaries 36 38Total finance income 39 40Finance expenseLong-term borrowings (55) (55)On amounts due to subsidiaries (14) (5)Total finance expense (69) (60)
9 Dividends paid and proposed2018
US$m2017
US$m
Declared and paid during the yearEquity dividends on ordinary shares:Final dividend for 2016 (US$0.438 per share) – 148Interim dividend 2017 (US$0.127 per share) – 44Final dividend for 2017 (US$0.253 per share) 86 –Interim dividend 2018 (US$0.127 per share) 42 –
128 192
2018 US$m
2017 US$m
Proposed for approval at the Annual General Meeting(not recognised as a liability as at 31 December)Equity dividends on ordinary shares:Final dividend for 2018: US$0.253 per share (2017: US$0.253 per share) 88 88
NOTES TO THE COMPANY FINANCIAL STATEMENTSFOR THE YEAR ENDED 31 DECEMBER 2018CONTINUED
192 Annual report and accounts 2018 Petrofac

10 Investments in subsidiaries
At 31 December, the Company had investments in the following active subsidiaries:
Proportion of nominal value of issued shares controlled
by the Company
Name of company Country of incorporation 2018 2017
Trading subsidiariesPetrofac Services Limited England 100 100Petrofac UK Holdings Limited England 100 100Jermyn Insurance Company Limited Guernsey 100 100Petrofac International Limited Jersey 100 100Petrofac Energy Developments International Limited Jersey 100 100Petrofac Facilities Management International Limited Jersey 100 100Petrofac GSA Holdings Limited Jersey – 100Petrofac Integrated Energy Services Limited Jersey 100 100Petrofac Training International Limited Jersey 100 100Petroleum Facilities E & C Limited Jersey 100 100Petrofac South East Asia Pte Limited Singapore 99 99Petrofac Treasury UK Limited UK 100 –Petrofac Inc. USA 100 100
11 Investments in associates
At 31 December, the Company had investments in the following active associates:
2018 US$m
2017 US$m
At 1 January 7 –Additions – 7At 31 December 7 7
Dividends received during the year include US$6m received from PetroFirst Infrastructure Limited and US$2m received from PetroFirst Infrastructure 2 Limited (2017: US$2m received from PetroFirst Infrastructure Limited and US$1m received from PetroFirst Infrastructure 2 Limited).
12 Amounts due from/due to subsidiaries
Amounts due from/due to subsidiaries comprise both interest and non-interest bearing short-term loans provided to/received from subsidiaries listed in note 34 of the Group’s consolidated financial statements.
At 31 December 2018, the amounts due from subsidiaries were reported net of expected credit loss (“ECL”) allowance in accordance with IFRS 9 ‘Financial Instruments’. At 31 December 2017, the amounts due from subsidiaries were reported net of impairment allowance in accordance with IAS 39 ‘Financial Instruments: Recognition and Measurement’. The Company applied IFRS 9 retrospectively, with the initial application date of 1 January 2018, without adjusting the comparative information, therefore the 2018 and 2017 columns in the table below are not comparable.
The movement in ECL allowance during 2018 and movement in impairment allowance during 2017 against amounts due from subsidiaries was as follows:
2018 calculated in accordance with IFRS 9)
2017 (calculated in accordance with IAS 39)
ECL allowance
US$mImpairment
US$m
At 1 January – 377Impairment allowance under IAS 39 reclassified at the date of initial application of IFRS 9 125 –Derecognised on disposal (120) –Recognised/(reversed) 6 (252)At 31 December 11 125
Annual report and accounts 2018 Petrofac 193
Financial statem
entsG
overnance
Strateg
ic repo
rt

12 Amounts due from/due to subsidiaries continued
At 31 December 2018, the analysis of amounts due from subsidiaries is as follows:
US$m
Expected credit loss rate 0.6%Total gross carrying amount 1,956Less: ECL allowance (11)Net amounts due from subsidiaries at 31 December 1,945
13 Cash and short-term deposits2018
US$m2017
US$m
Cash at bank and in hand 9 35Short-term deposits 45 –
54 35
The fair value of cash and bank short-term deposit balances is US$54m (2017: US$35m).
For the purposes of the Company statement of cash flows, cash and cash equivalents comprise the following:
2018 US$m
2017 US$m
Cash at bank and in hand 9 35Short-term deposits 45 –Bank overdrafts (note 16) (18) (8)
36 27
The Company applied IFRS 9 retrospectively, with the initial application date of 1 January 2018. No ECL allowance was recognised at the date of initial application or during the year.
14 Employee Benefit Trust (“EBT”) shares
For the purpose of making awards under the Group’s share-based payment plans, shares in the Company are purchased and held by the Petrofac Employee Benefit Trust. These shares have been classified in the Company balance sheet as EBT shares within equity.
The movements in total EBT shares are shown below:
2018 2017
Number US$m Number US$m
At 1 January 6,226,375 102 5,932,474 105Purchase of Company’s shares by Employee Benefit Trust 6,045,843 44 3,406,314 39Issue of Company’s shares by Employee Benefit Trust (3,207,299) (39) (3,112,413) (42)At 31 December 9,064,919 107 6,226,375 102
Shares vested during the year include dividend shares of 353,528 shares (2017: 303,554 shares).
15 Share-based payments reserve Share-based
payments reserve
US$m
Balance at 1 January 2017 84Issue of Company’s shares by Employee Benefit Trust (38)Credit to equity for share-based payments charge invoiced to subsidiaries 35Balance at 1 January 2018 81Issue of Company’s shares by Employee Benefit Trust (34)Credit to equity for share-based payments charge invoiced to subsidiaries 32Balance at 31 December 2018 79
Share-based payments reserveThe share-based payments reserve is used to recognise the value of equity-settled share-based payments awarded to employees of subsidiaries and transfers out of this reserve are made upon vesting of the original share awards.
NOTES TO THE COMPANY FINANCIAL STATEMENTSFOR THE YEAR ENDED 31 DECEMBER 2018CONTINUED
194 Annual report and accounts 2018 Petrofac

16 Interest-bearing loans and borrowings
The Company had the following interest-bearing loans and borrowings outstanding:
2018 US$m
2017 US$m
Non-currentRevolving Credit Facility 80 555Export Credit Agency funding (SACE and UKEF facilities) – 115Term loans 300 200
380 870Less: Debt acquisition costs net of accumulated amortisation and effective interest rate adjustments (4) (16)
376 854Current Senior Notes – 677Export Credit Agency funding (SACE and UKEF facilities) 115 18Term loans 125 –Bank overdrafts 18 8
258 703Less: Debt acquisition costs net of accumulated amortisation and effective interest rate adjustments (1) (1)
257 702Total interest-bearing loans and borrowings 633 1,556
Details of the Company’s interest-bearing loans and borrowings are as follows:
Revolving Credit FacilityThe Company has a US$1,200m committed Revolving Credit Facility with a syndicate of international banks, which is available for general corporate purposes. US$200m of the facility will mature in June 2020 and the remaining US$1,000m will mature in June 2021. As at 31 December 2018, US$80m was drawn under this facility (2017: US$555m).
Interest is payable on the drawn balance of the facility and in addition utilisation fees are payable depending on the level of utilisation.
Export Credit Agency fundingIn 2015, the Company entered into two term loan facilities guaranteed, respectively, by the Italian Export Credit Agency (SACE) and the UK Export Credit Agency (UKEF). Following the disposal of JSD6000 installation vessel and transfer of associated owner furnished equipment to the Purchaser during 2018 the SACE and UKEF facilities will mature in June 2019. At 31 December 2018, the amortised cost of the liability has been adjusted to reflect the revised contractual cash flows, in line with the requirements of IFRS 9 ‘Financial Instruments’, which resulted in an additional charge of US$6m recognised within other operating expense line item in the Company income statement (note 7). As at 31 December 2018, US$43m was drawn under the SACE facility (2017: US$50m) and US$72m was drawn under the UKEF facility (2018: US$83m). No further drawings can be made from these facilities.
In February 2019, after the end of the reporting period, the Company received a pre-payment waiver from the SACE Export Credit Agency facility Lenders (the “Lenders”) and the associated facility will now mature in 2025. The waiver has been treated as a non-adjusting event after the reporting period, since provision of the waiver was at sole discretion of the Lenders.
Term loansAt 31 December 2018, the Company had in place five bilateral term loans with a combined total of approximately US$483m. As at that date, US$425m was drawn under these facilities (2017: US$200m). Of the total, US$25m is scheduled to mature in February 2019 and US$100m is scheduled to mature in August 2019. The balance will mature in 2020.
Senior NotesThe Company repaid aggregate principal amount of US$677m Senior Notes in October 2018.
Bank overdraftsBank overdrafts are drawn down in United States dollar, Arab Emirates dirham and sterling denominations to meet the Company’s working capital requirements. These are repayable on demand.
Compliance with covenantsThe Revolving Credit Facility, the Export Credit Agency facilities and the term loans (together, the Senior Loans) are subject to two financial covenants relating to leverage and interest cover. The Company was compliant with these covenants for the year ending 31 December 2018.
The Senior Loans are senior unsecured obligations of the Company and will rank equally in right of payment with each other and with the Company’s other existing and future unsecured and unsubordinated indebtedness.
Annual report and accounts 2018 Petrofac 195
Financial statem
entsG
overnance
Strateg
ic repo
rt

17 Other financial assets and other financial liabilities
Classification2018
US$m2017
US$m
Other financial assetsNon-current
Forward currency contracts on behalf of subsidiaries Fair value through profit and loss 1 23Deferred consideration receivable from Ithaca Energy UK Ltd (note 7) Amortised cost 59 –
60 23Current
Forward currency contracts on behalf of subsidiaries Fair value through profit and loss 25 20Forward currency contracts undesignated Fair value through profit and loss 14 1Contingent consideration receivable arising from the disposal of Petrofac GSA Holdings Limited (note 7) Fair value through profit and loss 19 –
58 21Other financial liabilitiesNon-current
Forward currency contracts on behalf of subsidiaries Fair value through profit and loss 2 82 8
Current
Forward currency contracts on behalf of subsidiaries Fair value through profit and loss 17 16Forward currency contracts undesignated Fair value through profit and loss 3 9Oil derivative on behalf of subsidiaries Fair value through profit and loss – 2Interest payable Fair value through profit and loss 2 6
22 33
The deferred consideration, recoverable over a period of four years under the terms of the Sales and Purchase Agreement, of US$59m from Ithaca Energy UK Ltd relating to the disposal of Petrofac GSA Holdings Limited, was initially recognised at fair value using a discount rate of 8.4% and will subsequently be measured at amortised cost. No unwinding of the discount on the deferred consideration was recognised from the date of disposal to the end of the reporting period in the Company income statement. There was no significant increase in the credit risk for such financial asset since the initial recognition.
Fair value measurementAll assets and liabilities for which fair value is measured or disclosed in the financial statements are categorised within the fair value hierarchy, described as follows, based on the lowest level input that is significant to the fair value measurement as a whole:
Level 1: Unadjusted quoted prices in active markets for identical financial assets or liabilitiesLevel 2: Inputs other than quoted prices included within Level 1 that are observable for the asset or liability, either directly (i.e. as
prices) or indirectly (i.e. derived from prices)Level 3: Valuation techniques for which the lowest level input that is significant to the fair value measurement is unobservable
NOTES TO THE COMPANY FINANCIAL STATEMENTSFOR THE YEAR ENDED 31 DECEMBER 2018CONTINUED
196 Annual report and accounts 2018 Petrofac

Set out below is a comparison of the carrying amounts and fair values of financial instruments as at 31 December:
Carrying amount Fair value
Level 2018
US$m2017
US$m2018
US$m2017
US$m
Financial assetsMeasured at amortised cost
Cash and short-term deposits (note 13) Level 2 54 35 54 35Deferred consideration receivable from Ithaca Energy UK Ltd (note 17) Level 2 59 – 59 –Measured at fair value through profit and loss
Contingent consideration receivable arising from the disposal of Petrofac GSA Holdings Limited (note 17) Level 3 19 – 19 –Forward currency contracts on behalf of subsidiaries Level 2 26 43 26 43Forward currency contracts undesignated Level 2 14 1 14 1
Financial liabilitiesMeasured at amortised cost
Interest-bearing loans and borrowings (note 16)Senior Notes Level 2 – 677 – 677Term loans Level 2 424 198 425 200Revolving Credit Facility Level 2 77 550 80 555Export Credit Agency funding Level 2 114 124 115 133Bank overdrafts Level 2 18 8 18 8Interest payable Level 2 2 6 2 6Measured at fair value through profit and loss
Forward currency contracts on behalf of subsidiaries Level 2 19 24 19 24Forward currency contracts undesignated Level 2 3 9 3 9Oil derivative on behalf of subsidiaries Level 2 – 2 – 2
Management assessed the carrying amounts of trade and other receivables, amounts due from/due to subsidiaries and trade and other payables to approximate their fair values and are therefore excluded from the above table.
When the fair values of financial assets and financial liabilities recognised in the Company balance sheet cannot be measured based on quoted prices in active markets, their fair value is measured using valuation techniques including discounted cash flow (“DCF”) model. The inputs to these models are taken from observable markets where possible, but where such information is not available, a degree of judgement is required in establishing fair values. Judgements include considerations of inputs such as liquidity risk, credit risk and volatility. Changes in assumptions relating to these factors could affect the recognised fair value of financial instruments and are discussed further below.
The following methods and assumptions were used to estimate the fair values for material financial instruments:
• The Company enters into derivative financial instruments with various counterparties, principally financial institutions with investment grade credit ratings. Foreign exchange forward contracts are valued using valuation techniques, which employ the use of market observable inputs. The most frequently applied valuation techniques include forward pricing using present value calculations. The models incorporate various inputs including the credit quality of counterparties, foreign exchange spot and forward rates, yield curves of the respective currencies, currency basis spreads between the respective currencies, interest rate curves and forward rate curves of the underlying commodity.
• The fair value of deferred consideration receivable from Ithaca Energy UK Ltd is equivalent to its amortised costs determined as the present value of discounted future cash flows using the discount rate of 8.4% which includes the counterparty’s risk of default.
• The fair value of contingent consideration receivable arising from the disposal of Petrofac GSA Holdings Limited is calculated as explained in note 7.
• The fair values of long-term interest-bearing loans and borrowings are equivalent to their amortised costs determined as the present value of discounted future cash flows using the effective interest rate
Changes in liabilities arising from financing activities
1 January 2018
US$m
Cash inflows US$m
Cash outflows
US$m
31 December 2018
US$m
Interest-bearing loans and borrowings1
At 31 December 2018 1,565 1,858 (2,803) 620At 31 December 2017 1,762 1,106 (1,303) 1,565
1 Interest-bearing loans and borrowings excludes overdrafts of $18m since these are included within cash and equivalents. Debt acquisition costs paid during 2017 amounted to US$1m.
Annual report and accounts 2018 Petrofac 197
Financial statem
entsG
overnance
Strateg
ic repo
rt

18 Commitments and contingent liabilitiesCommitmentsIn the normal course of business the Company will obtain surety bonds, letters of credit and guarantees, which are contractually required to secure performance, advance payment or in lieu of retentions being withheld. Some of these facilities are secured by issue of corporate guarantees on behalf of its subsidiaries by the Company in favour of the issuing banks.
At 31 December 2018, the Company had outstanding letters of guarantee, including performance and advance payments of US$752m (2017: US$728m).
At 31 December 2018, the Company had outstanding forward exchange contracts amounting to US$2,610m (2017: US$2,949m). These commitments consist of future obligations either to acquire or to sell designated amounts of foreign currency at agreed rates and value dates (note 19).
Other matterAs described in pages 5, 27 and 76 of the 2018 Annual Report, on 12 May 2017, the UK Serious Fraud Office (“SFO”) announced an investigation into the activities of Petrofac, its subsidiaries, and their officers, employees and agents for suspected bribery, corruption, and/or money laundering. The SFO announced on 7 February 2019 that a former Petrofac employee had entered a guilty plea to 11 counts of bribery under the Bribery Act 2010. No charges have been brought against any Group company or any other officers or employees to date. Although not charged, a number of Petrofac individuals and entities are alleged to have acted together with the individual concerned. The SFO investigation is ongoing. The existence of any possible future financial obligations (such as fines or penalties), or other consequences, is unable to be determined at this time.
19 Risk management and financial instrumentsRisk management objectives and policiesThe Company’s principal financial assets and liabilities are amounts due from and due to subsidiaries, forward currency contracts, cash and short-term deposits and interest-bearing loans and borrowings.
The Company’s activities expose it to various financial risks particularly associated with interest rate risks on its external variable rate loans and borrowings. The Company has a policy not to enter speculative trading of financial derivatives.
The other main risks besides interest rate are foreign currency risk, credit risk and liquidity risk and the policies relating to these risks are discussed in detail below:
Interest rate riskInterest rate risk arises from the possibility that changes in interest rates will affect the value of the Company’s interest-bearing financial liabilities and assets. The Company does not hedge its exposure on its interest-bearing funding to/from subsidiaries.
Interest rate sensitivity analysisThe impact on the Company’s before tax profit and equity due to a reasonably possible change in interest rates is demonstrated in the table below.
The analysis assumes that all other variables remain constant.
Before tax profit Equity
100 basis point
increase US$m
100 basis point
decrease US$m
100 basis point
increase US$m
100 basis point
decrease US$m
31 December 2018 5 (5)31 December 2017 6 (6) – –
NOTES TO THE COMPANY FINANCIAL STATEMENTSFOR THE YEAR ENDED 31 DECEMBER 2018CONTINUED
198 Annual report and accounts 2018 Petrofac

The following table reflects the maturity profile of interest-bearing financial assets and liabilities that are subject to interest rate risk:
Year ended 31 December 2018
Within 1 year US$m
1–2 years US$m
2–3 years US$m
3–4 years US$m
4–5 years US$m
More than 5 years US$m
Total US$m
Financial liabilitiesFloating ratesBank overdrafts 18 – – – – – 18Revolving Credit Facility – – 80 – – – 80Term loans 125 300 – – – – 425Export Credit Agency funding 115 – – – – – 115Amount due to subsidiaries (interest-bearing) 1,142 – – – – – 1,142
1,400 300 80 – – – 1,780Financial assetsFloating rates Cash and short-term deposits (note 13) 54 – – – – – 54Amount due from subsidiaries (interest-bearing) 1,214 – – – – – 1,214
1,268 – – – – – 1,268
Year ended 31 December 2017
Within 1 year US$m
1–2 years US$m
2–3 years US$m
3–4 years US$m
4–5 years US$m
More than 5 years US$m
Total US$m
Financial liabilitiesFloating ratesBank overdrafts 8 – – – – – 8Revolving Credit Facility – – 555 – – – 555Term loans – 200 – – – – 200Export Credit Agency funding 18 18 17 18 18 44 133Amount due to subsidiaries (interest-bearing) 413 – – – – – 413
439 218 572 18 18 44 1,309Financial assetsFloating rates Cash and short-term deposits (note 13) 35 – – – – – 35
Amount due from subsidiaries (interest-bearing) 878 – – – – – 878
913 – – – – – 913
Financial liabilities in the above table are disclosed gross of debt acquisition costs and effective interest rate adjustments of US$5m (2017: US$17m).
Interest on financial instruments classified as floating rate is repriced at intervals of less than one year.
Foreign currency riskThe Company is exposed to foreign currency risk on translation of assets and liabilities that are in a currency other than the United States dollar reporting currency of the Company.
The Company uses forward currency contracts to manage the foreign currency exposure on all amounts due from and due to subsidiaries.
The Company is only exposed to foreign currency exposure relating to cash and bank balances and an amount of sterling £37m payable to a subsidiary.
The following table summarises the impact on the Company’s profit before tax and equity (due to change in the fair value of monetary assets and liabilities) of a reasonably possible change in US dollar exchange rates with respect to different currencies:
Before tax profit Equity
+10% US dollar rate
increase US$m
–10% US dollar rate decrease
US$m
+10% US dollar rate
increase US$m
–10% US dollar rate decrease
US$m
31 December 2018 1(18) 118 – – 31 December 2017 – – – –
1 Includes impact on pegged currencies mainly relating to interest bearing loans and borrowings denominated in Arab Emirates dirham.
Annual report and accounts 2018 Petrofac 199
Financial statem
entsG
overnance
Strateg
ic repo
rt

19 Risk management and financial instruments continued
At 31 December 2018, the Company had foreign exchange forward contracts as follows:
Contract value Fair value (undesignated)
2018 US$m
2017 US$m
2018 US$m
2017 US$m
Euro purchases 311 42 17 31Sterling sales (468) (478) 11 (7)Kuwaiti dinar sales (942) (1,525) (8) (12)Russian Ruble purchases 29 – (2) –Malaysian ringgit purchases – 24 – (1)Japanese yen sales – (3) – –Arab Emirates dirham purchases 150 – – –Canadian dollar purchases 8 11 – –New Zealand dollar purchases – 1 – –
18 11
The above foreign exchange contracts mature and will affect income between January 2019 and August 2021 (2017: between January 2018 and February 2020).
Credit risk
The Company’s principal financial assets are cash and short-term deposits and amounts due from subsidiaries.
The Company manages its credit risk in relation to cash and short-term deposits by only depositing cash with financial institutions that have high credit ratings provided by international credit rating agencies.
Liquidity riskThe Company’s objective is to maintain a balance between continuity of funding and flexibility through the use of Revolving Credit Facility, Export Credit Agency funding and term loans, to reduce its exposure to liquidity risk.
The maturity profiles of the Company’s financial liabilities at 31 December 2018 are as follows:
Year ended 31 December 2018
6 months or less US$m
6–12 months US$m
1–2 years US$m
2–5 years US$m
More than 5 years US$m
Contractual undiscounted
cash flows US$m
Carrying amount
US$m
Financial liabilitiesInterest-bearing loans and borrowings 158 100 300 80 – 638 633Trade and other payables 3 – – – – 3 3Amounts due to subsidiaries – 1,183 – – – 1,183 1,183Derivative instruments 15 5 2 – – 22 22Interest payments 11 8 11 2 – 32 –
187 1,296 313 82 – 1,878 1,841
Year ended 31 December 2017
6 months or less US$m
6–12 months US$m
1–2 years US$m
2–5 years US$m
More than 5 years US$m
Contractual undiscounted
cash flows US$m
Carrying amount
US$m
Financial liabilitiesInterest-bearing loans and borrowings 17 686 218 608 44 1,573 1,556Trade and other payables 7 – – – – 7 7Amounts due to subsidiaries – 401 – – – 401 401Derivative instruments 25 2 8 – – 35 35Interest payments 25 20 22 30 1 98 –
74 1,109 248 638 45 2,114 1.999
The Company uses various funded facilities provided by banks and its own financial assets to fund the above-mentioned financial liabilities.
NOTES TO THE COMPANY FINANCIAL STATEMENTSFOR THE YEAR ENDED 31 DECEMBER 2018CONTINUED
200 Annual report and accounts 2018 Petrofac

Capital managementThe Company’s policy is to maintain a robust capital base using a combination of external and internal financing to support its activities as the holding company for the Group.
The Company’s gearing ratio is as follows:
2018 US$m
2017 US$m
Cash and short-term deposits (note 13) 54 35Interest-bearing loans and borrowings (A) (note 16) (633) (1,556)Net debt (B) (579) (1,521)Total equity (C) 502 413Gross gearing ratio (A/C) 126.1% 376.8%Net gearing ratio (B/C) 115.3% 368.3%
20 Related party transactions
The Company’s related parties consist of its subsidiaries and the transactions and amounts due to/due from them are either of funding or investing nature (note 10). The Company recharged share-based payment costs of US$32m (2017: US$35m) to its subsidiaries in relation to the Group’s share-based payment plans for the Group’s employees. In addition, the Company also obtained letters of guarantees on behalf of its subsidiaries and the cost of US$3m (2017: nil) incurred on such guarantees was recharged by the Company to its subsidiaries. The Company also received dividends from its subsidiaries of US$572m (2017: US$207m), note 3.
The remuneration paid by the Company to its Non-executive Directors was US$1m (2017: US$1m). The Company was also re-charged a portion of the key management personnel cost by one of its subsidiaries. The amount recharged during the year was US$16m (2017: US$14m), of which key management personnel cost was US$2m (2017: US$2m). For further details of the full amount of key management personnel costs refer to note 31 of the Group’s consolidated financial statements.
21 Share capital
There was no movement in the number of issued and fully paid ordinary shares during the year.
The share capital comprises only one class of ordinary shares. The ordinary shares carry a voting right and the right to a dividend.
Share premium: The balance on the share premium account represents the amount received in excess of the nominal value of the ordinary shares.
Capital redemption reserve: The balance on the capital redemption reserve represents the aggregated nominal value of the ordinary shares repurchased and cancelled.
Annual report and accounts 2018 Petrofac 201
Financial statem
entsG
overnance
Strateg
ic repo
rt

SHAREHOLDER INFORMATION AS AT DECEMBER 2018
Shareholder warning Shareholders should be very wary of any unsolicited advice, offers to buy shares at a discount or offers of free company reports on the Company. Fraudsters use persuasive and high pressure tactics to lure investors into scams and they may offer to sell shares that often turn out to be worthless, overpriced or even non-existent. Whilst high returns are promised, those who invest usually end up losing their money.
Please keep in mind that firms authorised by the Financial Conduct Authority (‘FCA’) are unlikely to contact you out of the blue. If you receive any unsolicited investment advice:
• Make sure you get the correct name of the person and organisation and make a record of any other information they give you, e.g. telephone number, address, Ask for their “firm reference number” (FRN)
• Check that they are properly authorised by FCA before getting involved. You can check the FCA register at https://register.fca.org.uk/ or call +44 (0)800 111 6768
• Report approaches to the FCA – a list of unauthorised overseas firms who are targeting, or have targeted, UK investors is maintained. Reporting such organisations means the list can be kept up to date and appropriate action be considered
• Inform Link Market Services (Jersey) Limited, our Registrars. They are not able to investigate such incidents themselves, but will record the details and pass them on to the Company and liaise with the FCA on your behalf
• Consider that if you deal with an unauthorised firm, you would not be eligible to receive payment under the Financial Services Compensation Scheme
If you suspect you have been approached by fraudsters please contact the FCA using the share fraud reporting form at fca.org.uk/scams.
You can also call the FCA Helpline on 0800 111 6768 (freephone), or 0300 500 8082 (UK), or +44 207 066 1000 (outside UK).
If you have already paid money to share fraudsters, you should contact Action Fraud on 0300 123 2040 or online at www.actionfraud.police.uk.
Registrar Link Market Services (Jersey) Limited 12 Castle Street St Helier Jersey JE2 3RT
Auditors Ernst & Young LLP 1 More London Place London SE1 2AF
Corporate Brokers Goldman Sachs Peterborough Court 133 Fleet Street London EC4A 2BB
JP Morgan Cazenove 25 Bank Street Canary Wharf London E14 5JP
Legal Advisers to the Company Linklaters LLP One Silk Street London EC2Y 8HQ
Corporate and Financial PR Tulchan Communications Group 85 Fleet Street London EC4Y 1AE
Company Secretary and registered office Intertrust Corporate Services (Jersey) Limited 44 Esplanade St Helier Jersey JE4 9WG
Stock Exchange Listing Petrofac shares are listed on the London Stock Exchange using code ‘PFC.L’.
Financial Calendar1
3 May 2019 Annual General Meeting
24 May 2019 Final dividend payment
28 August 2019 Half Year Results announcement
October 2019 Interim dividend payment
1 Dates are based on current expectations.
Copies of all announcements will be available on the Company’s website at www.petrofac.com following release.
202 Annual report and accounts 2018 Petrofac

DownstreamThe downstream sector commonly refers to the refining of petroleum crude oil and the processing and purifying of raw natural gas, as well as the marketing and distribution of products derived from crude oil and natural gas
Duty HolderA contracting model under which Petrofac provides a complete managed service, covering production and maintenance work, both offshore and onshore, to reduce the costs of operating and to extend the life of the facilities
EEBITDACalculated as profit before tax and net finance costs and income, but after our share of profits/losses from associates and joint ventures (as per the consolidated income statement), adjusted to add back charges for depreciation and amortisation (as per note 3 to the financial statements)
EBTEmployee Benefit Trust
E&CEngineering & Construction
EPCEngineering, Procurement and Construction
EPCCEngineering, Procurement, Construction and Commissioning
EPCICEngineering, Procurement, Construction, Installation and Commissioning
EPCIEngineering, Procurement, Construction and Installation
EPCmEngineering, Procurement and Construction management
EPSEarnings per share
EPS EastEngineering & Production Services East
EPS WestEngineering & Production Services West
ExComExecutive Committee
FFEEDFront-End Engineering and Design
Field Development Plan (FDP)A document setting out the manner in which a hydrocarbon discovery is to be developed and operated
FIDFinal Investment Decision
FPSOFloating Production, Storage and Offloading vessel
FPFFloating Production Facility
AAGMAnnual General Meeting
AIRBAsset Integrity Review Board
Appraisal WellA well drilled into a discovered accumulation to provide data necessary to define a Field Development Plan for the accumulation
BBacklogBacklog consists of the estimated revenue attributable to the uncompleted portion of lump-sum engineering, procurement and construction contracts and variation orders plus, with regard to engineering, operations, maintenance and Integrated Energy Services contracts, the estimated revenue attributable to the lesser of the remaining term of the contract and five years. Backlog will not be booked on Integrated Energy Services contracts where the Group has entitlement to reserves. The Group uses this key performance indicator as a measure of the visibility of future earnings. Backlog is not an audited measure
BarrelA unit of volume measurement used for petroleum
bblOne barrel of oil
BlockA subdivision of an underground petroleum reservoir, by a resource owner, for the purposes of licensing and administering exploration, appraisal and production of resources, by oil and gas companies
boeBarrel of oil equivalent
bpdBarrel per day
Brownfield DevelopmentFurther investment in a mature field, to enhance its production capacity, thereby increasing recovery and extending field life
CCapexCapital expenditure
CISCommonwealth of Independent States
Cost plus KPIsA reimbursable contract which includes an incentive income linked to the successful delivery of key performance indicators (KPIs)
CRCorporate responsibility
DDBSPDeferred Bonus Share Plan
DECCDepartment of Energy and Climate Change (UK)
DecommissioningThe re-use, recycling and disposal of redundant oil and gas facilities
GLOSSARY
Annual report and accounts 2018 Petrofac 203
Financial statem
entsG
overnance
Strateg
ic repo
rt

GLOSSARY CONTINUED
OOCPOffshore Capital Projects. A service line which specialises in offshore engineering, procurement, installation and construction services for greenfield projects
OECDOrganisation for Economic Cooperation and Development
Oil fieldA geographic area under which an oil reservoir lies
OPECOrganisation of Petroleum Exporting Countries
PPECProduction Enhancement Contract is where Petrofac is paid a tariff per barrel for oil and gas production and therefore has no commodity price exposure. PECs are appropriate for mature fields which have a long production history
PMCProject Management Contractor – managing an external construction contractor to manage construction of a facility
PSCProduction Sharing Contract
PSPPerformance Share Plan
RReimbursable servicesWhere the cost of Petrofac’s services are reimbursed by the customer plus an agreed margin
RIRecordable injury
ROCEReturn on capital employed
RSCRisk Service Contract is where Petrofac develops, operates and maintains a field, while the resource holder retains ownership and control of its reserves
RSPRestricted Share Plan
SSIPShare Incentive Plan
SURFSubsea Umbilicals, Risers and Flowlines
TTSRTotal shareholder return
UUKCSUnited Kingdom Continental Shelf
UNGCUnited Nations Global Compact
UpstreamThe segment of the petroleum industry relating to exploration, development and production of oil and gas resources
GGas fieldA field containing natural gas but no oil
Greenfield developmentDevelopment of a new field
HHSEHealth & Safety Executive (UK)
HSSEIAHealth, safety, security, environment and integrity assurance
HVDCHigh-voltage direct current
HydrocarbonA compound containing only the elements hydrogen and carbon – can be solid, liquid or gas
IIASInternational Accounting Standards
IESIntegrated Energy Services. The IES division harnesses Petrofac’s existing service capabilities and delivers them on an integrated basis to resource holders with the aim of supporting the development of their oil and gas resources, enhancing production from their mature reservoirs and helping them to build national capability
IFRSInternational Financial Reporting Standards
IOCInternational oil company
KKPIKey performance indicator
LLNGLiquefied natural gas
Lump-sum turnkey projectAn agreement in which a contractor designs, constructs, and manages a project until it is ready to be handed over to the customer and operation can begin immediately
LTILost time injury
MMENAMiddle East and North Africa region
mm boeMillion barrels of oil equivalents
mmscfdMillion standard cubic feet per day
MOPUMobile offshore production unit
MOUMemorandum of understanding
NNOCNational oil company
204 Annual report and accounts 2018 Petrofac

Designed and produced by SampsonMay Telephone: 020 7403 4099 www.sampsonmay.com
Printed by PUSH www.push-print.com
This report has been printed on Magno satin which is certified by the Forest Stewardship Council® and contains 10% recovered fibre, diverting waste from landfill. The paper is made at a mill with EMAS and ISO 14001 environmental management system accreditation.
This report has been printed using inks made from non-hazardous vegetable oil derived from renewable sources.
Over 90% of solvents are recycled for further use and recycling initiatives are in place for all other waste associated with this production. The printers are FSC and ISO 14001 certified with strict procedures in place to safeguard the environment throughout all their processes. They have also registered with and have had audits carried out by the Carbon Trust to reduce their carbon footprint.

Petrofac Services Limited 117 Jermyn Street London SW1Y 6HH United Kingdom Tel: +44 20 7811 4900 Fax: +44 20 7811 4901
www.petrofac.com
Petro
fac Annual report and accounts 2018

Petro
fac Annual report and accounts 2018