Delft University of Technology The use of navigation...
20
Delft University of Technology The use of navigation systems in naturalistic driving Knapper, Allert; Nes, Nicole Van; Christoph, Michiel; Hagenzieker, Marjan; Brookhuis, Karel DOI 10.1080/15389588.2015.1077384 Publication date 2016 Document Version Peer reviewed version Published in Traffic Injury Prevention Citation (APA) Knapper, A., Nes, N. V., Christoph, M., Hagenzieker, M., & Brookhuis, K. (2016). The use of navigation systems in naturalistic driving. Traffic Injury Prevention, 17(3), 264-270. DOI: 10.1080/15389588.2015.1077384 Important note To cite this publication, please use the final published version (if applicable). Please check the document version above. Copyright Other than for strictly personal use, it is not permitted to download, forward or distribute the text or part of it, without the consent of the author(s) and/or copyright holder(s), unless the work is under an open content license such as Creative Commons. Takedown policy Please contact us and provide details if you believe this document breaches copyrights. We will remove access to the work immediately and investigate your claim. This work is downloaded from Delft University of Technology. For technical reasons the number of authors shown on this cover page is limited to a maximum of 10.
Transcript of Delft University of Technology The use of navigation...
Delft University of Technology
The use of navigation systems in naturalistic driving
Knapper, Allert; Nes, Nicole Van; Christoph, Michiel; Hagenzieker, Marjan; Brookhuis, Karel
DOI10.1080/15389588.2015.1077384Publication date2016Document VersionPeer reviewed versionPublished inTraffic Injury Prevention
Citation (APA)Knapper, A., Nes, N. V., Christoph, M., Hagenzieker, M., & Brookhuis, K. (2016). The use of navigationsystems in naturalistic driving. Traffic Injury Prevention, 17(3), 264-270. DOI:10.1080/15389588.2015.1077384
Important noteTo cite this publication, please use the final published version (if applicable).Please check the document version above.
CopyrightOther than for strictly personal use, it is not permitted to download, forward or distribute the text or part of it, without the consentof the author(s) and/or copyright holder(s), unless the work is under an open content license such as Creative Commons.
Takedown policyPlease contact us and provide details if you believe this document breaches copyrights.We will remove access to the work immediately and investigate your claim.
This work is downloaded from Delft University of Technology.For technical reasons the number of authors shown on this cover page is limited to a maximum of 10.

1
THE USE OF NAVIGATION SYSTEMS IN NATURALISTIC DRIVING
Allert Knappera*
, Nicole van Nesb, Michiel Christoph
b, Marjan Hagenzieker
b,c, Karel Brookhuis
a,d
a Faculty of Technology, Policy and Management, Delft University of Technology, Delft
b SWOV Institute for Road Safety Research, The Hague
c Faculty of Civil Engineering and Geosciences, Delft University of Technology, Delft
d Faculty of Behavioural and Social Sciences, University of Groningen
* Corresponding author. Present address: Transport and Logistics, Faculty of Technology, Policy and
Management, Delft University of Technology, Jaffalaan 5, PO Box 5015, 2600 GA Delft, The
Netherlands. Tel.: +31 15 27 87269. Fax: +31 15 27 82719.
Email: [email protected].
ABSTRACT
Objective: In this study we assessed the use of portable navigation systems in everyday driving by
applying in-vehicle naturalistic driving.
Method: Experienced users of navigation systems, seven female and fourteen male, were provided
with a specially equipped vehicle for approximately one month. Their trips were recorded using four
cameras, GPS data and other sensor data. The drivers’ navigation-system use data were coded from
the video recordings, which showed how often and for how long the system was activated and how
often and for how long a driver operated the system.
Results: The system was activated for 23% of trips, predominantly on longer and unique trips.
Analyses of the percentage of time for which the speed limit was exceeded showed no evidence of
differences between trips for which the navigation system was used or not used. On trips for which the
navigation system was activated, participants spent about 5% of trip time interacting with the device.
About 40% of interacting behaviour took place in the first 10% of the trip time, and about 35% took
place while the car was standing still or moving at a very low speed, i.e. 0-10 km/h.
Conclusion: These results shed light on how and when drivers use navigation systems. They suggest
that although drivers regulate their use of such systems to some extent, they often perform risky tasks
while driving.
KEYWORDS
Naturalistic driving, distraction, road safety, navigation system

2
INTRODUCTION
Navigation systems have become common in the last decade. They are mainly classified as driver
comfort systems (Brookhuis, De Waard, & Janssen, 2001), but their economic and ecological benefits
(due to shorter routes) are unequivocal. Although we know a lot about how navigation systems affect
driving, their effects on driver and road safety are largely unknown, as experimental studies do not tell
us how drivers use navigation systems. Operating a navigation system, for example, might cause a
driver to become distracted, which in turn could lead to unsafe behaviour in traffic. It is reported that
visual-manual distraction in particular is typically associated with 5-25% (Hurts, Angell, & Perez,
2011), and some believe even up to 80%, of all crashes (Dingus et al., 2006), as well as significant
increases in risk (Klauer, Guo, Sudweeks, & Dingus, 2010).
The current study focuses on the use of nomadic navigation systems: how and when they are
used in naturalistic driving, and whether this can affect driving speed. First, we address the literature
regarding two distinct tasks involved with navigation systems; namely, following route guidance
instructions and operating the system.
Following Route Guidance Instructions
The primary task of a navigation system is to provide the driver with route instructions. Compared to
traditional navigation methods, this is especially helpful when the driver is in unfamiliar surroundings,
in terms of workload and driving errors, for instance (Antin, Stanley, & Cicora, 2009). One clear benefit
of using a navigation system is that it can allow for decreased exposure to traffic by providing a
shorter/faster route (Antin et al., 2009; Feenstra, Hogema, & Vonk, 2008). On the other hand, the fact
that navigating has become so easy may also encourage some drivers to go to places that they would
not otherwise have visited, thus increasing exposure (Emmerson, Guo, Blythe, Namdeo, & Edwards,
2013). Furthermore, having alternative routes may lead drivers off motorways onto access roads,
which reduces safety (SWOV, 2010).
Between 35% and 55% of European drivers own a navigation system (Jamson, 2013) and
roughly 25% of drivers, mostly high mileage drivers (Jamson, 2013), use such systems on a regular
basis (Jamson, 2013; Lansdown, 2012).
Compared to driving with a paper map, driving with a navigation system reduces the driver’s
mental workload (Feenstra et al., 2008). Other differences appear to be small (for example, a slightly
higher mean speed) to non-existent (Feenstra et al., 2008). Olson et al. (2009) report that for
commercial vehicle drivers, looking at paper maps is associated with a substantially increased
likelihood of having a crash or near crash (odds ratio 7.02). In short, the literature seems to suggest
that as long as route guidance instructions are kept simple (Dalton, Agarwal, Fraenkel, Baichoo, &
Masry, 2013) and instructions are reliable (Ma & Kaber, 2007), drivers have sufficient support when
using a navigation system for route guidance.
Operating the Navigation System
Several studies have investigated destination entry by the driver (e.g., Burnett, Summerskill, & Porter,
2004; Chiang, Brooks, & Weir, 2004). The respondents in a study by Lansdown (2012) rated the level

3
of distraction caused by destination entry as ‘medium’ (3 on a 5-point scale). About 35% of
respondents reported that they entered data while driving, while 12% did so on a daily or weekly basis.
Jamson (2013) found that 10-30% of drivers say that they sometimes enter or change a destination
while driving. In a field study by Metz et al. (2014), the drivers reduced their speed just before
operating the navigation system and they maintained a longer headway distance. Furthermore, the
nomadic device used in that study led to deterioration in lateral performance, whereas a built-in
navigation system did not.
Operating a navigation system is a visual-manual task. Another visual-manual task, texting,
increases the risk of being involved in a crash in naturalistic commercial vehicle driving (Olson,
Hanowski, Hickman, & Bocanegra, 2009) and normal car driving (Fitch et al., 2013). It could be argued
that practising visual-manual tasks could help drivers to avoid some of the consequences. Indeed, in a
study by Nowakowski, Utsui, & Green (2000), practice shortened destination entry duration; however,
lateral driving performance in particular still deteriorated.
Whereas voice-controlled destination entry may seem less distracting than manual
programming, drivers still take their eyes off the road, because they seek confirmation that the input is
correct. However, these glances are generally more rapid and the overall eyes-off-road time is shorter
(Tijerina, Parmer, & Goodman, 1998).
In short, although following route guidance instructions may hardly affect driving, it is likely that
operating a navigation system does. The net effect on safety is unclear, however, as we lack
information about how drivers use their systems in practice and how this can affect their driving.
Moreover, as navigation systems are changing rapidly and their use is increasing, past studies may
not accurately represent current experiences.
Study Objectives
The present study assesses how experienced users of recent navigation systems are actually using
such systems in everyday driving. The general research question addressed is: How do drivers use
their navigation systems in real driving? More specifically, we investigated:
1. On what kinds of trips, how often, when and for how long do drivers use navigation systems?
2. What are the effects on speed behaviour of driving with a navigation system?
We analysed patterns of drivers’ use of navigation systems in order to identify behaviour that could
potentially affect safety. Furthermore, as navigation systems often display information regarding speed
(i.e., the current speed, the current speed limit and speed-check information), and speed is an
important driving safety-related measure (Aarts & Van Schagen, 2006), we assessed whether we
could infer the effects of using a system supplying such information on speed behaviour. For instance,
as GPS speed shows a realistic speed (and the speedometer in many motor vehicles, including the
ones used in our project, shows an optimistic speed), it could be the case that drivers drive slightly
faster than they otherwise would when using a navigation system.

4
METHOD
Participants
Drivers were invited to participate by means of posters and digital newsletters distributed at the Delft
University of Technology. Those who expressed an interest were sent a short questionnaire. Drivers
who indicated that they use (1) a mobile phone and (2) a navigation system at least once a week, and
(3) drove at least 200 km per week were selected. The eventual sample consisted of 21 drivers
(fourteen male and seven female) with an average age of 37 (SD=9.7). They had had their driver’s
licences for fifteen years on average (SD=9.4) and reported that they drove an average of 23,226 km
per year (SD = 6,974).
Procedure
Participants were briefed about the project, but not about the research goals. The project included
driving in a vehicle for five to six weeks that had been equipped with a camera and other recording
devices. The participants gave their consent and were asked to use the car as if it were their own. All
participants received financial compensation after completing the study.
Vehicle
Participants were given either one of four Lancia Ypsilons or a Peugeot 207. All five cars were
equipped with a data acquisition system containing several components, including a PC, four cameras
(directed at the driver, the driver’s face, the forward view and the navigation system, all recording at
12.5 Hz) and a 1 Hz GPS/GSM device. The system did not require participants to perform any tasks
extraneous to their normal driving behaviour. Booting took about two minutes and the GPS device took
another four minutes to receive a proper signal (depending on conditions), meaning that speed-related
data were incomplete for some trips. This applied in particular to the beginning of trips, although GPS
reception could sometimes also be distorted during trips.
Participants were provided with a Bluetooth hands-free device and a five-inch touch-screen
TomTom Go Live 1005 navigation system that could be mounted in the car (see Figure A1). In the
Lancia Ypsilons, the navigation system windscreen mount was installed to the left of the steering
wheel, with a camera facing it. In the Peugeot 207, the system was mounted to the right of the steering
wheel. The different vehicle dashboards layouts did not allow for an identical installation set-up. The
navigation system was equipped with modern functions, including real-time traffic information, voice
control, current speed and (mobile) speed camera information, and was fully operable during driving.
One participant used his own navigation system (a different brand).
Data Analyses
Trips in the test vehicles made by drivers other than the registered participants were omitted from the
analyses. Furthermore, each participant’s first week of driving was excluded to ensure that they had
become familiar with the vehicle. This was not communicated to the participants beforehand.
The video data were manually coded by four data reductionists using in-house designed
software that allowed for connecting the numeric data (such as GPS speed) to the video data, and for

5
enriching the data with observations inferred from the video recordings. For each task, the start time
and end time were coded. The navigation system visual-manual tasks were defined as follows:
1. Reaching, grabbing or mounting (all interactions that were needed to make the navigation
system ready for operation). This event would start as soon as the driver started looking for
the device, and ended when the driver was either back in his normal driving position or started
operating the device.
2. Programming a destination, including voice control. Operation would start with the driver’s first
glance at the device (before touching), or the first time the driver’s hand started moving from
its resting position (often the steering wheel). An event ended when the driver’s hand was
back to a normal position, or, when insecure, when the driver looked at the road again.
3. Other operating was coded when the driver was holding the device in his hands while
operating it, as it was not possible to verify whether the operation concerned destination entry.
This code also applied to other functions (volume, map zooming), so the coders were
instructed to watch the navigation screen if available.
Coding always began at the start of a trip in order to record the mounting and destination-entering that
was done before driving. Coding was paused when the car was parked during a trip (e.g., when
waiting for passengers, not participating in traffic). Coding ended at the end of the trip, when the driver
had parked. Hence, coding did not take place when drivers demounted the system at the very end of
the trip, while parked. This avoided the data being contaminated with actions that did not involve any
kind of actual driving.
Trips were randomly assigned to the coders, who watched each trip at a high video speed and
slowed down or paused the video when an event (i.e. a task) occurred. They coded the start and the
end of each event. In order to ensure high-quality data, the coders discussed potentially ambiguous
behaviour on a weekly basis. Inter-coder reliability was assessed by having a total of 50 randomly-
selected trips coded a second time, in addition to normal coding. The duration and presence of all
events coded in those trips were compared and tested statistically using Krippendorff’s α (Hayes &
Krippendorff, 2007). The agreement level for code presence (nominal measurement level) was α =
.89, and for duration (ratio) α = .83, which are both above the recommended level of agreement of α =
.80.
RESULTS
Regarding the route guidance function, we included all trips during which the navigation system was
activated, regardless of whether the destination was set or not. On a general note, the data did not
reveal any crashes or major incidents.
Following Route Guidance Instructions
What kinds of trips? The navigation system was activated for about 23% of trips (300 of a total of
1306 trips). The 21 participants’ general driving behaviour is summarised in Table A1.

6
It was determined whether trips were driven only once or repetitively over the observation
period. Trips were considered repetitive if the start was within 1,000 m, the finish was within 500 m,
and the difference in trip length was shorter than 3 km. A total of 740 (M 35.2, SD = 19.1) trips were
recorded that matched other trips (that is, that were repetitive), and 566 that were unique (M = 27.0,
SD 10.6), including a distinction between long (longer than 5 km) and short trips (shorter than 5 km).
Not surprisingly, navigation systems were used the least for short, repetitive trips, while the average
percentage of trips in which a navigation system was used was highest for unique long trips, which
constituted almost half of the trips (see Table A2). A three-way loglinear analysis (navigation system
use x repetitiveness x trip length) revealed a model that retained the three two-way interactions. The
model’s Likelihood Ratio was χ2(1)= .019, p=.89. The interaction navigation system use x
repetitiveness interaction was significant, χ2(1)= 75.2, p<.001, indicating that participants used the
navigation system less often on repetitive trips (odds = .13) than on unique trips (odds = .60), odds
ratio = 4.53. The navigation system use x trip length interaction was significant, (χ2(1)= 112.3, p<.001.
The odds ratio revealed that the odds of using the system were ten times more likely on long trips (.49)
than on short trips (.049). Finally, the repetitiveness x trip length interaction was significant, (χ2(1)=
38.0, p<.001). This means that short trips had a higher likelihood of being repetitive (2.81) than long
trips (.91), ratio 3.09.
Next, trips for which the navigation system was used were compared to trips with no use, as
depicted in Table 1. Trips for which the navigation system was used were on average longer.
Furthermore, the average speed was considerably higher, which is probably due to the higher
percentage of motorway driving on longer trips. Table 2 shows the mean speed in several speed limit
zones. In order to assess whether the participants on average drove faster with a navigation system
than without, for different speed limits, a 2 (with or without navigation systems) * 5 (50, 70, 80, 100,
120 km/h speed limit sections) factorial repeated measures ANOVA was carried out. Mauchly’s test
indicated that sphericity could be assumed for the navigation system-use main effect. The navigation
system-use main effect was not significant (p=.097, r=.13), meaning that the participants drove slightly
but insignificantly faster during trips for which they were using the navigation system.
Table 3 shows the mean percentage of trips for which participants used a navigation system,
across different temporal units. During the morning peak (excluding weekends), a relatively high
percentage of use was observed compared to during the afternoon peak. Related to this observation,
in the mornings and afternoons (including weekends) the percentage of trips for which the navigation
system was used was relatively high compared to the evenings. Distinguishing between the first trip of
the day, the last trip of the day and other trips (including trips on days when only one trip was made), it
appears that participants used the navigation systems less often for the last trip of the day.
Navigation system use and speeding: We investigated whether navigation system use affects
drivers’ speed, as navigation systems provide information about current speed (based on GPS data),
the current speed limit and speed cameras. Furthermore, drivers who know that GPS provides a
realistic speed measure may drive closer to the limit or exceed the speed limit somewhat more often
when using a navigation system. We compared the percentage of time the speed limit was exceeded

7
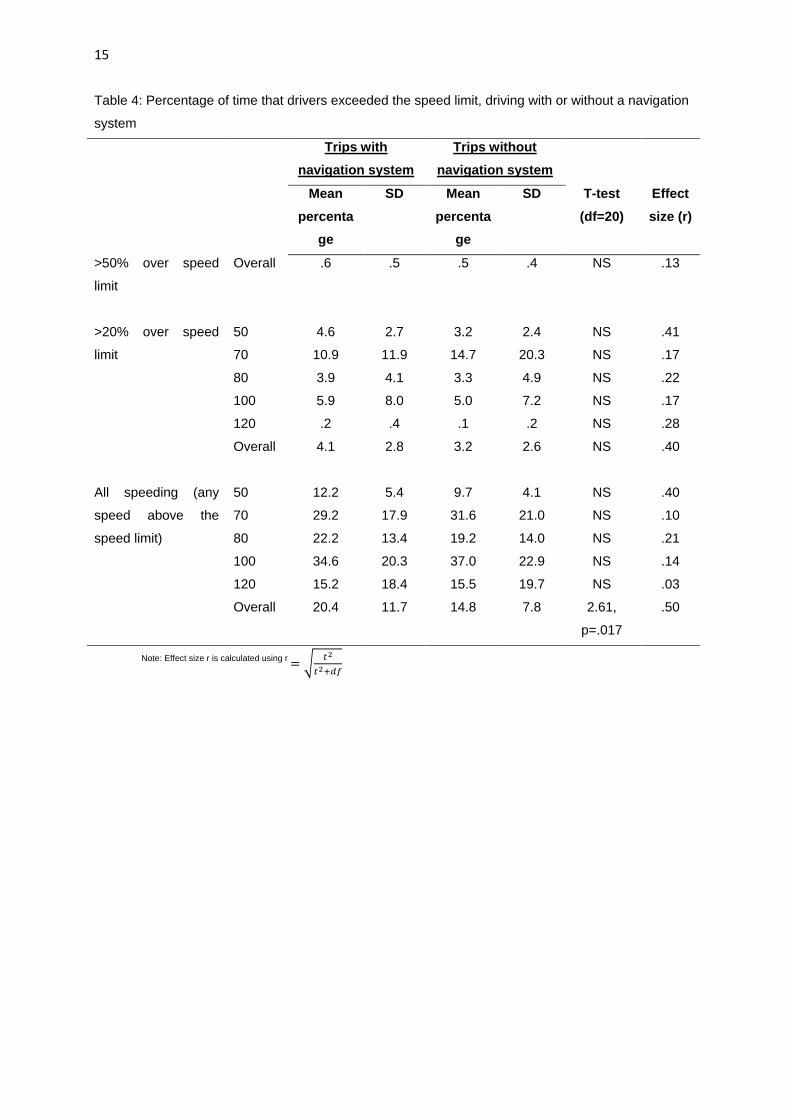
for trips in which a navigation system was used and other trips. Table 4 shows the results for different
speed limits and the extent of speeding. When we compared driving with or without a navigation
system, no significant difference was found for exceeding the speed limit for either 50% or 20% of the
time. The only substantial difference was found when the total percentage of time driving above the
current speed limit (i.e. 50.1 km/h) was compared for trips with and without the navigation system.
Visual-Manual Tasks
When performed? The study distinguished between three visual-manual tasks (see data analyses
section). The results regarding these coded events are presented in Table 5. The table shows that
participants on average operated the device approximately 50 times in total, and that destination entry
required the most time. For about 5% of the driving time, participants were engaged in
operating/installing the device during trips that involved navigation system use, which adds up to about
1% of total driving time. Furthermore, participants showed more navigation system interactions during
unique trips.
For each operating event, we determined for which part of the trip (as a percentage of trip
time) the event started. Figure 1 shows that almost half of all the operating events occurred in the first
10% of the trip durations. The small increase in reaching/grabbing/mounting at the end of the trip (see
the right side of Figure 1) reflects the fact that some drivers removed the navigation system from its
mount near the end of the trip, while they were still driving. Likewise, about 40% of all interactions
were performed at very low speed (up to 10 km/h; see Figure A2).
Figure 1: On which part of the trip did visual-manual tasks start? (See the data analyses section for a
detailed description of these tasks.) To determine the trip time segment to which each operating event
belonged, the following formula was used: event start time in s
total trip time in s∗ 100%.
0%
10%
20%
30%
40%
50%
60%
Perc
en
tag
e o
f n
um
ber
of
tasks p
erf
orm
ed
Trip time segment
Programming a destination
Other operating
Reaching, grabbing or mounting
8
Effects of visual-manual tasks on speeding: The percentage of time (in seconds) that drivers drove
at a speed above the speed limit was calculated for three timeframes: six seconds before operating
the system, during the operation and for six seconds after the operation. Before operating, drivers
drove above the speed limit for 10.3% of the timeframe; during operating, they were above the speed
limit for 9.2% of the timeframe; and after, 13.8%. These differences are statistically significant
(F(2)=3.666, p<.05, no sphericity violations). Comparison revealed no difference between the ‘before’
and ‘during’ conditions (F(1)=.76, p>.05), but in the six seconds after the operation, substantially more
speeding was observed (F(1)=5.51, p<.05) than during the operation. Figure A3 presents these results
as a boxplot.
DISCUSSION
The data reveal that the participants used the navigation system for about a quarter of all trips.
Relatively frequent use was observed for trips that participants made only once during the observation
period and for longer trips, both in terms of distance (over 5 km) and time (more than 40 minutes).
Furthermore, morning peak hours showed higher use than afternoon peak hours, which may be
attributed to the fact that trips home (in the evening, after work) tend to be to familiar destinations. The
trips for which the navigation system was used showed higher percentages of time driving on
motorways. This is probably related to the fact that these trips were longer and motorways are the
fastest way to reach a destination. When controlling for speed limit, we found that drivers did not drive
substantially faster with a navigation system than without.
Next, we compared GPS speed recordings to the posted speed limits, as we suspected that
the drivers might know that the GPS speed shows a more realistic speed than many car
speedometers (that are optimistic about speed, Wikipedia, 2015). During trips in which participants
used a navigation system, we observed a slightly higher percentage of speeding, but only when
including all speeding, including driving slightly above the speed limit (0.1 km/h or more). Several
participants indicated that they knew that GPS data typically provide a lower speed than the car
speedometer. Thus, drivers may drive slightly faster when using the speed information from the
navigation system, which is reflected in the higher percentage of speeding. This effect might be
tempered by the fact that drivers quickly learn how optimistic their vehicle speedometer is and adjust
for it. A study by Feenstra, Hogema & Vonk (2008), also an on-road driving study, likewise found that
somewhat higher speeds were driven while using a navigation system compared to driving with a
conventional map. Note that this might be for another reason: as reading a map is so demanding,
drivers may choose to drive more slowly.
During trips for which they used their navigation system, the participants operated their system
mostly (about 50%) in the first 10% of the trip time. They spent about 5% of trip time mounting or
operating the system, while practically standing still for about 40% of that time. This 5% is probably an
underestimation, since the GPS often took a while to start up. Nevertheless, the results confirm
Funkhouser & Sayer’s (2012) finding that drivers regulate their behaviour to some extent by operating

9
the system while (practically) standing still or driving at low speed, probably recognising the fact that
this is the safest moment to do so. However, drivers still do a relatively large amount of operating
during normal driving. Given the significant impact of operating navigation systems on driving
performance, this may have a considerable effect on safety, certainly when we take into account the
finding by Merat et al. (2005) that drivers have difficulties abandoning a secondary task, including
when circumstances become more demanding. When they operated the navigation system the drivers
slowed down somewhat, as compared to right before and right after operating. It is not uncommon for
drivers to slow down when demands are high, for instance during texting (for an overview, see Caird,
Johnston, Willness, Asbridge, & Steel, 2014; also see Metz et al., 2014). Although not entirely
surprising, these are the first figures that accurately describe how and when drivers use navigation
systems.
Limitations
Several limitations should be noted. Our sample was relatively small and consisted of voluntary
participants, which could have caused self-selection bias. Furthermore, the fact that recruitment took
place at Delft University could mean that the sample is somewhat biased. Our participants were both
frequent drivers and experienced users of navigation systems, however, which may make them
relatively safe users (Dingus, Hulse, & Mollenhauer, 1997). Furthermore, actual use for five weeks is a
relatively long observation period, and this is the first study to report on real-life use in such detail.
Participants were not informed beforehand about the purpose of the study, but they may have
suspected that the navigation system was the target of the investigation when they noticed the camera
pointed at it. In addition, the fact that we provided a windscreen-mounted navigation system may have
added to the ease of using the system, potentially increasing the use.
Another limitation is that the GPS system became active only after several minutes. This
meant that a relatively small amount of valuable information was lost, because the speed, speed limit
and environment could not be determined during the whole period. One important issue affecting the
specific navigation system used in this study was the fact that the power button did not always function
as expected: when pressed for too long, the system would shut down again. Participants were
informed about this issue during the briefing. This did occasionally cause participants to perform
actions that were related only to the specific device, however minor. Furthermore, although
participants reported that they soon forgot that they were being observed, we received some signals
that this may have occasionally influenced participants’ behaviour.
Conclusion
In real-life driving, the participants used their navigation systems predominantly on relatively long,
infrequent trips. During the trips for which they used their navigation systems, there was a mild
increase (approximate 5%) in instances of speeding and they drove at slightly (but insignificantly)
higher speeds. Our general conclusion is that while these effects are small, they have a negative
impact on road safety, as driving at higher speeds increases the risk and severity of crashes (Aarts &
Van Schagen, 2006).

10
In addition, of the time that participants spent operating the navigation system, about half of
this time was spent at the beginning of the trip. During this time, the car was not moving for about 40%
of the time, meaning that the major part of operation was performed while driving. Operating a
navigation system is a visual-manual task. Conducting visual-manual tasks such as texting means
taking one’s eyes off the road, and thus increases the risk of crashing (Klauer et al., 2014).
ACKNOWLEDGEMENTS
The research leading to these results received funding from the European Community’s Seventh
Framework Programme FP7/2007-2013 under the project INTERACTION (grant agreement no.
218560). We would like to thank to three anonymous referees for their helpful comments.
REFERENCES
Aarts, L., & Van Schagen, I. (2006). Driving speed and the risk of road crashes: A review. Accid Anal Prev, 38(2), 215-224.
Antin, J. F., Stanley, L. M., & Cicora, K. F. (2009). Conventional versus moving-map navigation methods. Transp Res Rec, 2138, 34-41.
Brookhuis, K. A., De Waard, D., & Janssen, W. H. (2001). Behavioural impacts of advanced driver assistance systems–an overview. Eur J Transp Infrast Res, 1(3), 245-253.
Burnett, G. E., Summerskill, S. J., & Porter, J. M. (2004). On-the-move destination entry for vehicle navigation systems: Unsafe by any means? Behav Inf Techn, 23(4), 265-272.
Caird, J. K., Johnston, K. A., Willness, C. R., Asbridge, M., & Steel, P. (2014). A meta-analysis of the effects of texting on driving. Accid Anal Prev, 71(0), 311-318. doi: http://dx.doi.org/10.1016/j.aap.2014.06.005
Chiang, D. P., Brooks, A. M., & Weir, D. H. (2004). On the highway measures of driver glance behavior with an example automobile navigation system. Appl Ergon, 35(3), 215-223.
Dalton, P., Agarwal, P., Fraenkel, N., Baichoo, J., & Masry, A. (2013). Driving with navigational instructions: Investigating user behaviour and performance. Accid Anal Prev, 50(0), 298-303. doi: 10.1016/j.aap.2012.05.002
Dingus, T. A., Hulse, M. C., & Mollenhauer, M. A. (1997). Effects of age, system experience, and navigation technique on driving with an advanced traveler information system. Occup Health Indust Med, 37(4), 156-156.
Dingus, T. A., Klauer, S. G., Neale, V. L., Petersen, A., Lee, S. E., Sudweeks, J. D., . . . Knipling, R. R. (2006). The 100-Car Naturalistic Driving Study, Phase II - Results of the 100-Car Field Experiment., 422p.
Emmerson, C., Guo, W., Blythe, P., Namdeo, A., & Edwards, S. (2013). Fork in the road: In-vehicle navigation systems and older drivers. Transp Res Part F Traffic Psychol Behav, 21(0), 173-180. doi: http://dx.doi.org/10.1016/j.trf.2013.09.013
Feenstra, P. J., Hogema, J. H., & Vonk, T. (2008). Traffic safety effects of navigation systems. 2008 IEEE Int Veh Symposium, 1203-1208.
Fitch, G. M., Soccolich, S. A., Guo, F., McClafferty, J., Fang, Y., Olson, R. L., . . . Dingus, T. A. (2013). The impact of hand-held and hands-free cell phone use on driving performance and safety-critical event risk. DOT HS 811 757. Washington, DC: NHTSA.
Funkhouser, D., & Sayer, J. (2012). A naturalistic cell phone use census. Transp Res Rec, 2321, 1-6. Hayes, A. F., & Krippendorff, K. (2007). Answering the call for a standard reliability measure for coding
data. Commun methods meas, 1(1), 77-89. Hurts, K., Angell, L. S., & Perez, M. A. (2011). The distracted driver: Mechanisms, models and
measurement. Rev Hum Fact Ergon, 7(3). doi: DOI: 10.1177/1557234X11410387 Jamson, S. L. (2013). What impact does legislation have on drivers’ in-vehicle use of nomadic
devices? Transp Res Part F Traffic Psychol Behav, 16(0), 138-150. doi: http://dx.doi.org/10.1016/j.trf.2012.08.014
Klauer, S. G., Guo, F., Simons-Morton, B. G., Ouimet, M. C., Lee, S. E., & Dingus, T. A. (2014). Distracted Driving and Risk of Road Crashes among Novice and Experienced Drivers. N Engl J Med, 370(1), 54-59. doi: doi:10.1056/NEJMsa1204142

11
Klauer, S. G., Guo, F., Sudweeks, J. D., & Dingus, T. A. (2010). An analysis of driver inattention using a case-crossover approach on 100-car data: Final report (pp. 148). Washington, DC: VTTI.
Lansdown, T. C. (2012). Individual differences and propensity to engage with in-vehicle distractions – A self-report survey. Transp Res Part F Traffic Psychol Behav, 15(1), 1-8. doi: http://dx.doi.org/10.1016/j.trf.2011.09.001
Ma, R., & Kaber, D. B. (2007). Situation awareness and driving performance in a simulated navigation task. Ergon, 50(8), 1351-1364. doi: 10.1080/00140130701318913
Merat, N., Anttila, V., & Luoma, J. (2005). Comparing the driving performance of average and older drivers: The effect of surrogate in-vehicle information systems. Transp Res Part F Traffic Psychol Behav, 8(2 SPEC. ISS.), 147-166.
Metz, B., Schoch, S., Just, M., & Kuhn, F. (2014). How do drivers interact with navigation systems in real life conditions?: Results of a field-operational-test on navigation systems. Transp Res Part F Traffic Psychol Behav, 24(0), 146-157. doi: http://dx.doi.org/10.1016/j.trf.2014.04.011
Nowakowski, C., Utsui, Y., & Green, P. (2000). Navigation system destination entry: The effects of driver workload and input devices, and implications for SAE recommended practice: Technical Report No. UMTRI-2000-20): The University of Michigan Transportation Research Institute.
Olson, R. L., Hanowski, R. J., Hickman, J. S., & Bocanegra, J. (2009). Driver distraction in commercial vehicle operations. (pp. 285). Washington, DC: Center for Truck and Bus Safety.
SWOV. (2010). Factsheet: Safety effects of navigation systems (pp. 5p). Den Haag: SWOV Institute for Road Safety.
Tijerina, L., Parmer, E., & Goodman, M. J. (1998). Driver workload assessment of route guidance system destination entry while driving: a test track study. Paper presented at the Proceedings of the 5th ITS World Congress, Seoul, Korea.
Wikipedia. (2015). Speedometer. Retrieved Januari 10th, 2015, from http://en.wikipedia.org/wiki/Speedometer

12
Table 1: Characteristics of trips for which participants did or did not use the navigation system
Without
navigation
system
With navigation
system
T-test (df=20)
Trip characteristic: Mean SD Mean SD t P
Number per participant 47.9 20.3 14.3 9.5 -6.32 .00
Distance driven (km) 13.8 8.8 40.7 21.3 -5.79 .00
Duration (s) 1249.0 487.8 2661.4 938.2 -6.48 .00
Mean speed (km/h) 31.7 7.8 52.4 11.2 -7.00 .00
% of time on urban road
64.7 12.8 48.2 15.5 3.93 .00
% of time on rural road 13.0 10.8 16.7 7.6 2.16 .04
% of time on motorway 12.6 9.6 34.4 15.6 -6.34 .00
% of time road type unknown
due to incomplete map
9.7 7.3 0.7 1.8 5.46 .00

13
Table 2: Mean speed for several speed limits, with and without use of navigation system
Trips with
navigation system
Trips without
navigation system
Speed
limit
Mean
speed
SD Mean
speed
SD
50 23.4 4.9 20.1 4.3
70 59.3 13.2 62.6 16.4
80 61.9 10.4 58.3 13.1
100 87.3 11.6 85.7 9.6
120 86.3 17.3 78.2 18.8

14
Table 3: Mean percentage of trips for which the navigation system was used in several time-related
units
Proportion of trips for which
navigation system was used
Temporal unit Mean (%) SD (%)
Week (Mo-Fr) 24.0 17.2
Weekend (Sa, Su) 25.6 19.3
Mondays 23.0 22.7
Tuesdays 25.0 19.7
Wednesdays 28.9 23.9
Thursdays 21.4 25.9
Fridays 19.3 22.2
Saturdays 24.6 25.4
Sundays 34.6 33.7
First trip of the day 26.9 17.6
Last trip of the day 19.0 18.1
Other trips 27.0 20.8
Morning peak (7.00-10.00)a 34.1 29.4
Afternoon peak (16.00-19.00) a 21.2 20.4
Off-peak/other hours a 25.4 19.6
Night (0.00-6.00) n/ab
Morning (6.00-12.00) 29.3 20.9
Afternoon (12.00-18.00) 25.3 18.9
Evening (18.00-24.00) 17.3 17.4
a Excludes weekends
b Only 9 trips fit this criterion
15
Table 4: Percentage of time that drivers exceeded the speed limit, driving with or without a navigation
system
Trips with
navigation system
Trips without
navigation system
Mean
percenta
ge
SD Mean
percenta
ge
SD T-test
(df=20)
Effect
size (r)
>50% over speed
limit
Overall .6 .5 .5 .4 NS .13
>20% over speed
limit
50 4.6 2.7 3.2 2.4 NS .41
70 10.9 11.9 14.7 20.3 NS .17
80 3.9 4.1 3.3 4.9 NS .22
100 5.9 8.0 5.0 7.2 NS .17
120 .2 .4 .1 .2 NS .28
Overall 4.1 2.8 3.2 2.6 NS .40
All speeding (any
speed above the
speed limit)
50 12.2 5.4 9.7 4.1 NS .40
70 29.2 17.9 31.6 21.0 NS .10
80 22.2 13.4 19.2 14.0 NS .21
100 34.6 20.3 37.0 22.9 NS .14
120 15.2 18.4 15.5 19.7 NS .03
Overall 20.4 11.7 14.8 7.8 2.61,
p=.017
.50
Note: Effect size r is calculated using r = √𝑡2
𝑡2+𝑑𝑓

16
Table 5: Visual-manual task characteristics, as coded from the video data (see methods/data analysis
section for definitions)
Reach, grab,
mount
Destination
entry
Other
operating
Mean SD Mean SD Mean SD
Total number of times the task
was performed
11.5 10.3 18.1 14.3 31.9 28.0
- In repetitive trips 2.6 3.6 5.9 8.0 7.1 10.7
- In unique trips 8.9 8.2 12.2 9.2 24.8 22,8
Task completion time (s) 12.0 4.7 26.6 12.9 15.3 9.7
Number of actions performed
in trips for which system was
used
.7 .4 1.3 .4 2.2 1.2
% of driving time engaged in
task (in trips for which system
used)
.8 0.4 2.4 1.1 2.0 1.2
% of driving time engaged in
task (for all trips)
.1 .1 .5 .5 .5 .5

17
APPENDIX
Table A1: General figures relating to participants’ trips, including navigation system use
Total
number
of trips
Number of
trips with
Navigation
System
activated
Total
duration
(h)
Total
duration of
trips with
Navigation
System (h)
Total
distance
driven
(km)
Total
distance
driven
with
Navigation
System
(km)
Total 1306 300 572.3 229.6 26,327.6 12,895.9
Mean per
participant
(M)
62.2 14.3 27.2 10.9 1253.7 614.1
Standard
Deviation
(SD)
21.0 9.5 10.9 8.3 635.6 520.3
Min. 28 3 13.1 1.3 506.2 39.6
Max. 109 35 51.1 31.2 2450.1 2043.7
Table A2: Percentage of trips for which the navigation system was used, distinguishing between
‘repetitive’ and ‘unique and long’ (<5 km) and ‘longer trips’ (>=5 km)
Trip repetitiveness
Trip length: Repetitive Unique
<5 km 3.0% 9.2%
>= 5km 19.0% 45.2%

18
Figure A1: Vehicle cabin layout (Lancia Ypsilon), including a navigation system photo. The navigation
system mount is installed to the left of the steering wheel, with a camera facing it. In the Peugeot 207
the system was mounted to the right of the steering wheel.
Figure A2: Percentage of visual-manual tasks that were performed at 10 km/h speed intervals.
0%
5%
10%
15%
20%
25%
30%
35%
40%
45%
50%
Perc
en
tag
e o
f n
um
ber
of
task p
erf
orm
ed
Speed at which the task was initiated (km/h)
Destination Entries
Other operations
Reach/Grab/Mount

19
Figure A3: Percentage of time participants drove above the speed limit, 6 seconds before, during, and
6 seconds after they visually-manually operated the navigation system. The dots marked ‘17’
represent outliers (by one participant); the boxplots show minimum, first quartile, median, third quartile
and maximum.