Deep Learning based Multi-Source Localization with Source ...
18
Deep Learning based Multi-Source Localization with Source Splitting and its Effectiveness in Multi-Talker Speech Recognition Aswin Shanmugam Subramanian a,* , Chao Weng c , Shinji Watanabe b,a , Meng Yu d , Dong Yu d a Center for Language and Speech Processing, Johns Hopkins University, Baltimore, MD, USA b Language Technologies Institute, Carnegie Mellon University, Pittsburgh, PA, USA c Tencent AI Lab, Shenzhen, China d Tencent AI Lab, Bellevue, WA, USA Abstract Multi-source localization is an important and challenging technique for multi-talker conversation analysis. This paper proposes a novel supervised learning method using deep neural networks to estimate the direction of arrival (DOA) of all the speakers simultaneously from the audio mixture. At the heart of the proposal is a source splitting mechanism that creates source-specific intermediate representations inside the network. This allows our model to give source-specific posteriors as the output unlike the traditional multi-label classification approach. Existing deep learning methods perform a frame level prediction, whereas our approach performs an utterance level prediction by incorporating temporal selection and averaging inside the network to avoid post-processing. We also experiment with various loss functions and show that a variant of earth mover distance (EMD) is very effective in classifying DOA at a very high resolution by modeling inter-class relationships. In addition to using the prediction error as a metric for evaluating our localization model, we also establish its potency as a frontend with automatic speech recognition (ASR) as the downstream task. We convert the estimated DOAs into a feature suitable for ASR and pass it as an additional input feature to a strong multi-channel and multi-talker speech recognition baseline. This added input feature drastically improves the ASR performance and gives a word error rate (WER) of 6.3% on the evaluation data of our simulated noisy two speaker mixtures, while the baseline which doesn’t use explicit localization input has a WER of 11.5%. We also perform ASR evaluation on real recordings with the overlapped set of the MC-WSJ-AV corpus in addition to simulated mixtures. Keywords: source localization, multi-talker speech recognition 1. Introduction Direction of arrival (DOA) estimation is the task of estimating the direction of the sound sources with respect to the microphone array and it is an important aspect of source localization. This localization knowledge can aid many downstream applications. For example, they are used in robot audition systems [1, 2] to facilitate interaction with humans. Source localization is pivotal in making the human-robot communication more natural by rotating the robot’s head. The localization component in the robot audition pipeline also aids in source separation and recognition. Moreover, there is growing interest in using far- field systems to process multi-talker conversations like meeting transcription [3]. Incorporating the source localization functionality can enrich such systems by monitoring the location of speakers and also potentially help improve the performance of the downstream automatic speech recognition (ASR) task. DOA estimation can also be used with smart speaker scenarios [4, 5] and potentially aid with better audio-visual fusion. * Corresponding Author. A part of the work was carried out by this author during an intership at Tencent AI Lab, Bellevue, USA. Email addresses: [email protected] (Aswin Shanmugam Subramanian), [email protected] (Chao Weng), [email protected] (Shinji Watanabe), [email protected] (Meng Yu), [email protected] (Dong Yu) Preprint submitted to Computer Speech & Language November 30, 2021 arXiv:2102.07955v2 [eess.AS] 28 Nov 2021
Transcript of Deep Learning based Multi-Source Localization with Source ...

Deep Learning based Multi-Source Localization with Source Splitting andits Effectiveness in Multi-Talker Speech Recognition
Aswin Shanmugam Subramaniana,∗, Chao Wengc, Shinji Watanabeb,a, Meng Yud, Dong Yud
aCenter for Language and Speech Processing, Johns Hopkins University, Baltimore, MD, USAbLanguage Technologies Institute, Carnegie Mellon University, Pittsburgh, PA, USA
cTencent AI Lab, Shenzhen, ChinadTencent AI Lab, Bellevue, WA, USA
Abstract
Multi-source localization is an important and challenging technique for multi-talker conversation analysis.This paper proposes a novel supervised learning method using deep neural networks to estimate the directionof arrival (DOA) of all the speakers simultaneously from the audio mixture. At the heart of the proposalis a source splitting mechanism that creates source-specific intermediate representations inside the network.This allows our model to give source-specific posteriors as the output unlike the traditional multi-labelclassification approach. Existing deep learning methods perform a frame level prediction, whereas ourapproach performs an utterance level prediction by incorporating temporal selection and averaging insidethe network to avoid post-processing. We also experiment with various loss functions and show that avariant of earth mover distance (EMD) is very effective in classifying DOA at a very high resolution bymodeling inter-class relationships. In addition to using the prediction error as a metric for evaluating ourlocalization model, we also establish its potency as a frontend with automatic speech recognition (ASR)as the downstream task. We convert the estimated DOAs into a feature suitable for ASR and pass it asan additional input feature to a strong multi-channel and multi-talker speech recognition baseline. Thisadded input feature drastically improves the ASR performance and gives a word error rate (WER) of 6.3%on the evaluation data of our simulated noisy two speaker mixtures, while the baseline which doesn’t useexplicit localization input has a WER of 11.5%. We also perform ASR evaluation on real recordings withthe overlapped set of the MC-WSJ-AV corpus in addition to simulated mixtures.
Keywords: source localization, multi-talker speech recognition
1. Introduction
Direction of arrival (DOA) estimation is the task of estimating the direction of the sound sources withrespect to the microphone array and it is an important aspect of source localization. This localizationknowledge can aid many downstream applications. For example, they are used in robot audition systems[1, 2] to facilitate interaction with humans. Source localization is pivotal in making the human-robotcommunication more natural by rotating the robot’s head. The localization component in the robot auditionpipeline also aids in source separation and recognition. Moreover, there is growing interest in using far-field systems to process multi-talker conversations like meeting transcription [3]. Incorporating the sourcelocalization functionality can enrich such systems by monitoring the location of speakers and also potentiallyhelp improve the performance of the downstream automatic speech recognition (ASR) task. DOA estimationcan also be used with smart speaker scenarios [4, 5] and potentially aid with better audio-visual fusion.
∗Corresponding Author. A part of the work was carried out by this author during an intership at Tencent AI Lab, Bellevue,USA.
Email addresses: [email protected] (Aswin Shanmugam Subramanian), [email protected] (Chao Weng),[email protected] (Shinji Watanabe), [email protected] (Meng Yu), [email protected] (Dong Yu)
Preprint submitted to Computer Speech & Language November 30, 2021
arX
iv:2
102.
0795
5v2
[ee
ss.A
S] 2
8 N
ov 2
021
Some of the earlier DOA estimation techniques are based on narrowband subspace methods [6, 7]. Thesimple wideband approximation can be achieved by using the incoherent signal subspace method (ISSM),which uses techniques such as multiple signal classification (MUSIC) independently on narrowband signalsof different frequencies and average their results to obtain the final DOA estimate. Broadband methodswhich better utilize the correlation between different frequencies such as weighted average of signal sub-spaces (WAVES) [8] and test of orthogonality of projected subspaces (TOPS) [9] have shown promisingimprovements. Alternative cross-correlation based methods like steered response power with phase trans-form (SRP-PHAT) [10] have also been proposed. Most subspace methods are not robust to reverberationsas they were developed under a free-field propagation model [11]. Recently, there has been a shift in interestto supervised deep learning methods to make the estimation robust to challenging acoustic conditions.
The initial deep learning methods were developed for single source scenarios [12, 13, 14, 15, 16]. In [13]and [14], features are extracted from MUSIC and GCC-PHAT respectively. The learning is made morerobust in [12, 15, 16] by encapsulating the feature extraction inside the neural network. While [14] treatsDOA estimation as a regression problem, all the other methods formulate it as a classification problem bydiscretizing the possible DOA angles. The modeling resolution which is determined by the output dimensionof the network is quite low in [13], [12], and [16] at 5◦, 45◦, and 5◦ respectively. Although the modelingresolution is high in [15] with classes separated by just 1◦, the evaluation was performed only with a blocksize of 5◦ and it is also shown to be not robust to noise. In [17], it was shown that a classification basedsystem with a grid resolution of 10◦ and a regression based system gives similar performance.
Deep learning based techniques have been shown to be very effective for joint sound event localizationand detection (SELD) of overlapping sources consisting of both speech and non-speech events [18, 19]. In[18], SELD is solved using a multi-task learning approach with DOA estimation treated as a multi-outputregression while in [19], detection and localization is solved jointly using a unified regression based loss. Inthis work, we focus only on localization of speech sources as we are interested in investigating the importanceof DOA estimation as a frontend with speech recognition as the downstream task.
Time-frequency (TF) masks estimated from speech enhancement [20] or separation [21] systems havebeen used for DOA estimation to handle noise, and interference in [22, 23, 24, 25]. The preprocessing speechenhancement system in [22, 23] is used to select time-frequency regions in the single speech source inputsignal that exclude noise and other non-speech interference. In [25] and [26], the interference consists ofa speech source so the preprocessing system takes an auxiliary input to extract the speaker of interest.In [25], a target speech separation system similar to [27] is used and this preprocessing system takes pre-enrollment speech corresponding to the speaker of interest as an auxiliary input. In [26], keywords wereused to identify the target. Although, multiple source inputs are used in these methods, an independentlytrained preprocessing system is used to identify the target input and the source localization system performsa biased estimation based on this identifier.
The speech enhancement systems used in single speech source scenario and target separation systemsused in multi-talker scenario are typically trained with the groundtruth signals as the target and hencecan be trained with only simulated data. Cascading with such a preprocessing system also increases thecomplexity of the overall DOA estimation framework. In [22], a pseudo multi task learning based end-to-endtraining approach was proposed for a single speech source input. In end-to-end training both the speechenhancement network and the DOA estimation network were jointly optimized with only the DOA label(and without using the target clean signal). It was also shown to give comparable performance to a typicalmulti-task learning approach. End-to-end methods are interesting as it has the scope for training with realdata as the DOA labels can be obtained with infrared sensors as used in [28].
The deep learning models were extended to handle simultaneous estimation of multiple sources in an end-to-end manner by treating it as a multi-label classification problem in [29, 11, 30]. These approaches performan unbiased estimation to obtain the DOAs of all the sources. The multi-label classification approach stillgives only a single vector as output with each dimension treated as a separate classification problem. Thisprocedure is not good at capturing the intricate inter-class relationship in our problem. So increasing thenumber of classes to perform classification at a very high resolution will fail. During inference, the outputvector is treated like a spatial spectrum and DOAs are estimated based on its peaks. In [30, 29], the numberof peaks is determined based on a threshold. In [11], the number of sources are assumed to be known based
2

Figure 1: Multi-label Classification Model for 2-source Scenario
on which the peaks are chosen at the output. In [29] and [11], the source locations are restricted to beonly in a spatial grid with a step size of 10◦ and 15◦ respectively. To make the models work on realisticconditions, it is crucial to handle all possible source locations. Moreover, these models perform a frame levelprediction in spite of the sources assumed to be stationary inside an utterance. Hence, post-processing isrequired to get the utterance level DOA estimate.
In this work, we propose a source splitting mechanism, which involves treating the neural network astwo distinct and well defined components. The first component disentangles the input mixture by implicitlysplitting them as source-specific hidden representations to enable tackling of multi-source DOA estimationvia single-source DOA estimation. The second component then maps these features to as many DOAposteriors as the number of sources in the mixture. This makes the number of classification problems tobe only equal to the number of sources and not the number of DOA classes like the existing methods.With the added help of loss functions that can handle the inter-class relationship better, our methods canclassify DOA reliably at a high resolution by performing a fine-grid estimation. Although, source splittingformulates the network as two components, it is optimized end-to-end with only DOA estimation objective.Like [11], we assume the knowledge of number of sources in the utterance but we incorporate it directly inthe architecture of the model instead of using it while post-processing.
We evaluate our proposed localization method both as a standalone task and also based on its effectivenessas a frontend to aid speech recognition. Assuming the DOA to be known, the effectiveness of using featuresextracted from the ground-truth location for target speech recognition was shown in [31, 32] as a proof ofconcept. The importance of localization for multi-talker speech recognition was also shown in our previouswork [33]. In [33], we proposed a model named directional ASR, which can learn to predict DOA withoutexplicit supervision by joint optimization with speech recognition. In the second part of this paper, wedevise an approach that can use localization knowledge to improve multi-talker speech recognition. We usea strong multi-talker speech recognition system called MIMO-Speech [34, 35] as a baseline. MIMO-Speechdoesn’t perform explicit localization of the sources. The DOAs estimated from our proposed models in thefirst part are converted to angle features [31]. The angles features encode DOA information and act as alocalization prior. These angles features are given as additional inputs to the MIMO-Speech model andtested for its effectiveness in improving speech recognition. It is hard to obtain DOA labels for real datasets.We perform DOA estimation for real speech mixtures from multichannel wall street journal audio-visual(MC-WSJ-AV) corpus and evaluate the quality of localization solely based on the downstream ASR metricof word error rate (WER).
2. Deep Learning based Multi-Source Localization
Given a multi-channel input signal with multiple sources, a deep neural network can be trained topredict all the azimuth angles corresponding to each of the sources. Typically it is treated as a multi-labelclassification problem [11, 29], as shown in Figure 1. Here, the network outputs only a single vector whichis supposed to encode the DOA of all the sources. It is possible to have spurious peaks in angle classes thatare in close proximity to any of the target angle classes, especially when the number of classes are increased.
3
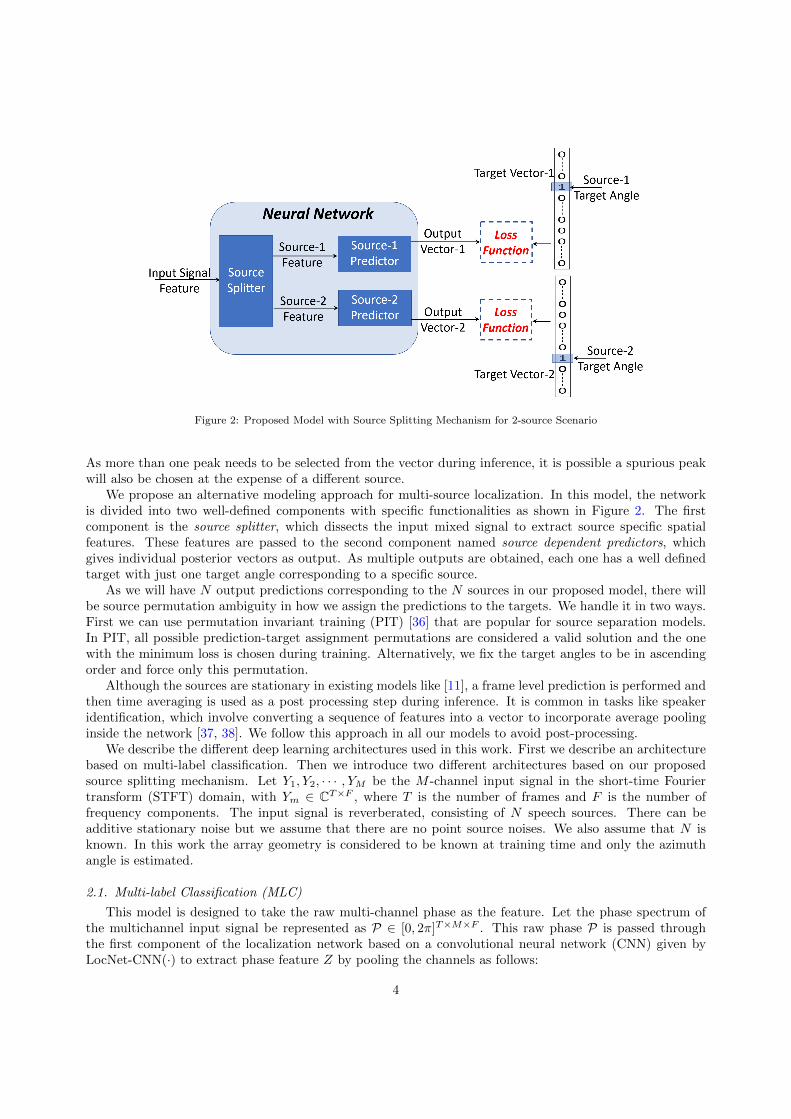
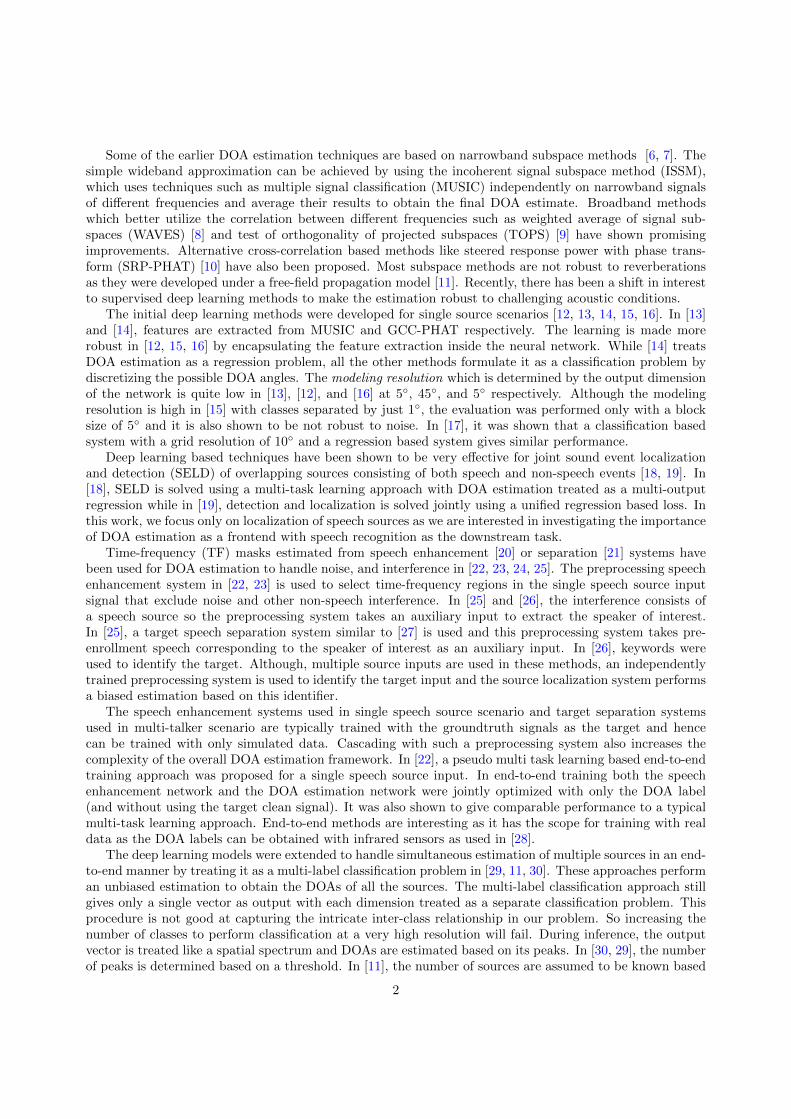
Figure 2: Proposed Model with Source Splitting Mechanism for 2-source Scenario
As more than one peak needs to be selected from the vector during inference, it is possible a spurious peakwill also be chosen at the expense of a different source.
We propose an alternative modeling approach for multi-source localization. In this model, the networkis divided into two well-defined components with specific functionalities as shown in Figure 2. The firstcomponent is the source splitter, which dissects the input mixed signal to extract source specific spatialfeatures. These features are passed to the second component named source dependent predictors, whichgives individual posterior vectors as output. As multiple outputs are obtained, each one has a well definedtarget with just one target angle corresponding to a specific source.
As we will have N output predictions corresponding to the N sources in our proposed model, there willbe source permutation ambiguity in how we assign the predictions to the targets. We handle it in two ways.First we can use permutation invariant training (PIT) [36] that are popular for source separation models.In PIT, all possible prediction-target assignment permutations are considered a valid solution and the onewith the minimum loss is chosen during training. Alternatively, we fix the target angles to be in ascendingorder and force only this permutation.
Although the sources are stationary in existing models like [11], a frame level prediction is performed andthen time averaging is used as a post processing step during inference. It is common in tasks like speakeridentification, which involve converting a sequence of features into a vector to incorporate average poolinginside the network [37, 38]. We follow this approach in all our models to avoid post-processing.
We describe the different deep learning architectures used in this work. First we describe an architecturebased on multi-label classification. Then we introduce two different architectures based on our proposedsource splitting mechanism. Let Y1, Y2, · · · , YM be the M -channel input signal in the short-time Fouriertransform (STFT) domain, with Ym ∈ CT×F , where T is the number of frames and F is the number offrequency components. The input signal is reverberated, consisting of N speech sources. There can beadditive stationary noise but we assume that there are no point source noises. We also assume that N isknown. In this work the array geometry is considered to be known at training time and only the azimuthangle is estimated.
2.1. Multi-label Classification (MLC)
This model is designed to take the raw multi-channel phase as the feature. Let the phase spectrum ofthe multichannel input signal be represented as P ∈ [0, 2π]T×M×F . This raw phase P is passed throughthe first component of the localization network based on a convolutional neural network (CNN) given byLocNet-CNN(·) to extract phase feature Z by pooling the channels as follows:
4

Z = LocNet-CNN(P) ∈ RT×Q, (1)
where Q is the feature dimension. The LocNet-CNN(·) architecture is inspired from [11], which uses convo-lutional filters across the microphone-channel dimension to learn phase difference like features.
The phase feature Z from Eq. (1) is passed through a feedforward layer as follows,
W = ReLU(AffineLayer1(Z)), (2)
where W ∈ RT×Q is an intermediate feature. We consider that the sources are stationary within anutterance. So in the next step a simple time average is performed to obtain a summary vector.
ξ(q) =1
T
T∑t=1
w(t, q), (3)
where ξ(q) is the summary vector at dimension q, and w(t, q) is the intermediate feature at time t andfeature dimension q. The summary vector, represented in vector form as ξ ∈ RQ is passed through alearnable AffineLayer(·) to convert its dimension to b360/γc, where γ is the angle resolution in degrees todiscretize the DOA angle.
κ = σ(AffineLayer2(ξ)). (4)
(5)
where, σ(·) is the sigmoid activation, and κ ∈ (0, 1)b360/γc is the multi-label classification vector. The DOAscan be estimated by finding the indices in κ corresponding to the N largest peaks.
2.2. Convolutional Mapping based Source Splitting Mechanism (Map-Split-C)
This architecture is a simple extension of the MLC model to achieve source splitting. Similar to theMLC model in Section 2.1 raw phase is used as the input and the phase feature Z is extracted using Eq. (1).Z will have DOA information about all the sources in the input signal. Source splitting is achieved througha source dependent affine transformation as follows,
Wn = ReLU(AffineLayer1n(Z)), (6)
Note that the only difference from Eq. (1) is that the affine layer is made to be dependent on thesource n to achieve source splitting. Here, Wn are intermediate representations specific to source n. Theserepresentations are averaged to create the source specific summary vectors in the following way,
ξn(q) =1
T
T∑t=1
wn(t, q), (7)
where ξn(q) is the summary vector for source n at dimension q.The summary vector, represented in vector form as ξn ∈ RQ is passed through a learnable feedforward
layer AffineLayer2(·), which acts as the predictor and converts the summary vector from dimension Q tothe dimension b360/γc, where γ is the angle resolution in degrees to discretize the DOA angle. Based onthis discretization, we can predict the DOA angle as a classifier with the softmax operation. From this, wecan get the source-specific posterior probability for the possible angle classes as follows,
5

[Pr(θn = αi|P)]b360/γci=1 = Softmax(AffineLayer2(ξn)), (8)
αi = ((γ ∗ i)− ((γ − 1)/2)) (π/180) , (9)
Note that the parameters of the predictor are shared across the sources in Eq. (8) but it is also possible
to make this feedforward layer source dependent. The estimated DOA θn for source n is determined byfinding the peak from the corresponding posterior in Eq. (8) as follows,
θn = argmaxαi
Pr(θn = αi|P), (10)
2.3. Masking based Source Splitting Mechanism (Mask-Split)This architecture is inspired from the localization subnetwork used in directional ASR [33]. This model
also uses raw phase as the input and the phase feature Z is extracted in the same way as Section 2.1 usingEq. (1). Z will have DOA information about all the sources in the input signal. It is processed by thenext component LocNet-Mask(·) which consists of BLSTM layers. Source splitting is achieved through thiscomponent which extracts source-specific ratio masks as follows,
[Wn]Nn=1 = σ(LocNet-Mask(Z)), (11)
where Wn ∈ [0, 1]T×Q is the feature mask for source n and σ(·) is the sigmoid activation. This mask segmentsZ into regions that correspond to each source. Note that LocNet-Mask(·) can also implicitly perform voicedactivity detection as it outputs ratio masks.
The extracted phase feature mask from Eq. (11) is used to perform a weighted averaging of the phasefeature from Eq. (1) to get source-specific summary vectors. Here, source splitting is performed by maskinginstead of a direct mapping. Note that this masking is performed in a latent space and not in the frequencydomain like done in cascaded systems like [24, 25]. The summary vector will encode the DOA informationspecific to a source as the masks are used as weights to summarize information only from the correspondingsource regions in the following way,
ξn(q) =
∑Tt=1 w
n(t, q)z(t, q)∑Tt=1 w
n(t, q), (12)
where ξn(q) is the summary vector for source n at dimension q, wn(t, q) ∈ [0, 1] and z(t, q) ∈ R are theextracted feature mask (for source n) and the phase feature, respectively, at time t and feature dimension q.
The summary vector, represented in vector form as ξn ∈ RQ is passed through a learnable source-specific AffineLayern(·), which acts as the predictor and converts the summary vector from dimension Q tothe dimension b360/γc, where γ is the angle resolution in degrees to discretize the DOA angle. Based onthis discretization, we can predict the DOA angle as a classifier with the softmax operation. From this, wecan get the source-specific posterior probability for the possible angle classes as follows,
[Pr(θn = αi|P)]b360/γci=1 = Softmax(AffineLayern(ξn)), (13)
αi = ((γ ∗ i)− ((γ − 1)/2)) (π/180) , (14)
The estimated DOA θn for source n is determined by finding the peak from the corresponding posteriorin Eq. (13) as follows,
θn = argmaxαi
Pr(θn = αi|P), (15)
In this architecture the predictor parameters are not shared across the sources in Eq. (13) but it alsopossible to share them and an experimental comparison is discussed in Section 4.2.1.
6

2.4. Recurrent Mapping based Source Splitting Mechanism (Map-Split-R)
In this model, inter-microphone phase difference (IPD) [39, 40] is computed and passed as a featuredirectly to the model. There are no CNN layers in this model as pre-defined features are used. This modelalso performs a direct mapping like Section 2.2. The IPD features are calculated as,
pi(t, f) =1
M[cos∠(
yi1(t, f)
yi2(t, f)) + j sin∠(
yi1(t, f)
yi2(t, f))], i ∈ {1, . . . , I}, (16)
where ym(t, f) is the input signal at channel m, time t and frequency f , i represents an entry in a microphonepair list defined for calculating the IPD; and i1 and i2 are the index of microphones in each pair. We calculateIPD features for I pairs and then concatenate their real and imaginary parts together. The concatenatedIPD feature is represented as P ∈ RT×I×2F . The magnitude of the input signal at channel 1 i.e. |Y1| isalso added as a feature to give the final input feature Z ∈ RT×(2IF+F ). This feature is passed to a BLSTMcomponent LocNet-BLSTM(·), which is the source splitter, as follows,
[Wn]Nn=1 = σ(LocNet-BLSTM(Z)), (17)
where Wn ∈ RT×Q is the source-specific feature for source n. This model achieves source splitting by a
direct mapping so a simple average is used to extract the summary vector as follows,
ξn(q) =
1
T
T∑t=1
wn(t, q), (18)
The summary vector is used similar to Section 2.3 and the source specific DOAs are obtained by followingEq. (13) and Eq. (15).
2.5. Loss Functions
The multi-label classification model in Section 2.1 is trained with the binary cross entropy (BCE) loss.The models in Section 2.3 and Section 2.4 give source-specific probability distributions at the output. Socross entropy (CE) loss will be the natural choice. This choice will be good for a typical classificationproblem where the inter-class relationship is not important. As we are estimating the azimuth angles, wehave classes that are ordered. So it is better to optimize by taking the class relationships into account asthey are very informative.
Typically a 1-hot vector is given as target to the CE loss. In DOA estimation it is better to predict anearby angle compared to a far away angle. But the typical penalty from the CE loss doesn’t take this intoaccount. A loss function that takes the class ordering into account is the earth mover distance (EMD). EMDis the minimal cost required to transform one distribution to another [41]. As in our problem the classesare naturally in a sorted order, we can use the simple closed-form solution from [42]. The solution is givenby the squared error between the cumulative distribution function(CDF) of the prediction and the targetprobability distributions.
Another way to induce inter-class relationship is by using a soft target probability distribution which isnot as sparse as the 1-hot vector. We use the following target distribution:
χ(i) =
0.4 i = ψ
0.2 i = (ψ ± 1) mod b360/γc0.1 i = (ψ ± 2) mod b360/γc0 elsewhere
(19)
where, χ(i) is the probability weight of the target distribution for class i and ψ is the index correspondingto the target angle class. When this soft target distribution is used with CE, we define it as the soft cross
7

entropy (SCE) loss. Similarly, it can also be used with EMD and we define it as soft earth mover distance(SEMD) loss. By assigning some probability weight to the angle classes in the neighbourhood of the target,the network can be potentially made to learn some inter-class relationship.
3. Integration of Localization with ASR
MIMO-Speech [34, 35] is an end-to-end neural network that can perform simultaneous multi-talker speechrecognition by taking the mixed speech multi-channel signal as the input. MIMO-Speech like typical ASRsystems don’t try to explicitly localize the sources. In this section we propose an extension in which MIMO-Speech uses source localization as a frontend. The azimuth angles of the all the sources estimated using thefrontend is converted to a feature suitable for ASR and passed to MIMO-Speech as a localization prior.
The MIMO-Speech network consists of three main components: (1) The masking subnetwork, (2) dif-ferentiable minimum variance distortionless response (MVDR) beamformer, and (3) the ASR subnetwork.The masking network in MIMO-Speech is monaural and gives channel-dependent time-frequency masks forbeamforming. For this only the magnitude of the corresponding channel is given as input to the mask-ing network. We will modify this masking network to take composite multi-channel input and output achannel-independent mask which will be shared across all channels.
Firstly, it is possible to also get a multi-channel masking network baseline by using Z from Section 2.4as the composite feature which is the concatenation of IPD features from Eq. (16) and the magnitude ofthe first channel. For this to be further extended to take localization knowledge we need to concatenate itwith an additional input feature that can encode the estimated azimuth angle. The groundtruth DOA isencoded as angle features in [31, 32, 40]. We follow the same procedure but use the estimated DOA fromour models proposed in Section 2.
The steering vector dn(f) ∈ CM for source n and frequency f is calculated from estimated DOA θn. Inthis work we have used uniform circular arrays (UCA) and the steering vector is calculated as follows,
τnm =r
ccos(θn − ψm), m = 1 : M (20)
dn(f) = [ej2πfτn1 , ej2πfτ
n2 , ..., ej2πfτ
nM ], (21)
where τnm is the signed time delay between the m-th microphone and the center for source n, ψi is theangular location of microphone m, r is the radius of the UCA and c is the speed of sound (343 m/s).
The calculated steering vector is used to compute the angle features with the following steps,
an(t, f) = |dn(f)Hy(t, f)|2, (22)
an(t, f) = an(t, f) ∗ I(an(t, f)− as(t, f))s=1:N , (23)
where an(t, f) is the angle feature for source n at time t and frequency f , H is conjugate transpose, y(t, f) ∈CM is the multichannel input, N is the number of speakers, and I(.) is the indicator function that outputs0 if the input difference is negative for any of the “s = 1 : N” cases and 1 otherwise.
The computed angle features for all the sources are concatenated and included to the composite featureinput list that is fed to the multi-channel masking network. This subnetwork given by MaskNet(·) givesthe source specific masks Ln ∈ (0, 1)T×F as the output. Rest of the procedure is similar to the originalMIMO-Speech model. The masks are used to compute the source specific spatial covariance matrix (SCM),Φn(f) as follows:
Φn(f) =1∑T
t=1 ln(t, f)
T∑t=1
ln(t, f)y(t, f)y(t, f)H, (24)
8

The interference SCM, Φnintf(f) for source n is approximated as
∑Ni 6=n Φi(f) like [34] (we experiment
only with N = 2, so no summation in that case). From the computed SCMs, the M -dimensional complexMVDR beamforming filter [43] for source n and frequency f , bn(f) ∈ CM is estimated as,
bn(f) =[Φn
intf(f) + Φnoise(f)]−1Φn(f)
Tr([Φnintf(f) + Φnoise(f)]−1Φn(f))
u, (25)
where u ∈ {0, 1}M is a one-hot vector in which the index corresponding to the reference microphone is1, Tr(·) denotes the trace operation, and Φnoise(f) is the noise SCM. The noise SCM can be estimated byobtaining an additional mask from the masking network. However we consider only stationary noise inthis study and we experimentally found that it was better to ignore the noise SCM by considering it as anall-zero matrix.
With the estimated MVDR filter, we can perform speech separation to obtain the n-th separated STFTsignal, xn(t, f) ∈ C as follows:
xn(t, f) = bn(f)Hy(t, f), (26)
This separated signal for source n, represented in matrix form as Xn ∈ CT×F is transformed to a fea-ture suitable for speech recognition by performing log Mel filterbank transformation and utterance basedmean-variance normalization (MVN). The extracted feature On for source n is passed to the speech recog-nition subnetwork ASR(·) to get Cn = (cn1 , c
n2 , · · · ), the token sequence corresponding to source n. The
MIMO-Speech network is optimized with the reference text transcriptions [Ciref ]Ni=1 as the target. The jointconnectionist temporal classification (CTC)/attention loss [44] is used as the ASR optimization criteria.
Here again there is permutation ambiguity as there are multiple output sequences. We can solve it intwo ways. First, we can follow the PIT scheme similar to the original MIMO-Speech model to resolve theprediction-target token sequence assignment problem. This takes additional computation time. When thePIT scheme is used, the order of the sources in the angle features in chosen randomly. We propose to usethe DOA knowledge to resolve the permutation ambiguity in the following way. During training stage, wecan use the groundtruth DOA as input instead of the estimated DOA for computing the angle features. Wedetermine the permutation of the target sequence based on the order of sources in which the angle featuresare concatenated and thereby can eliminate PIT.
4. Experiments
4.1. Data & Setup
We simulated 2-speaker mixtures from WSJCAM0 [45]. A uniform circular array (UCA) was used. Twotypes of mixtures with different array radius, 5cm (UCA-5) and 10cm (UCA-10) respectively, were simulatedto study the impact of array aperture. For UCA-10, background noise was added from REVERB corpus [46]as it matches the array geometry used for recording that corpus and also to match the conditions of the realdata used for evaluation. The signal-to-noise ratio (SNR) was uniformly sampled from the range U(10dB,20dB). The 5k vocabulary subset of the real overlapped data with stationary sources from MC-WSJ-AVwas used just for evaluation with the models trained with the UCA-10 mixtures. Since the aperture cannotbe changed on the real data we also experiment with choosing only the first three microphones of UCA-10.We call this a quadrant array (QA-10) in which the aperture is reduced as only the first quadrant from thecircle is used. For each utterance, we mixed another utterance from a different speaker within the sameset, so the resulting simulated data is the same size as the original clean data. The SMS-WSJ [47] toolkitwas used for creating the simulated data with maximum overlap. Image method [48] was used to createthe room impulse responses (RIR). Room configurations with the size (length-width-height) ranging from5m-5m-2.6m to 11m-11m-3.4m were uniformly sampled while creating the mixtures. Both sources and thearray are always chosen to be at the same height. The other configuration details used for simulation areshown in Table 1. The source positions are randomly sampled and hence not constrained to be on a gridlike [49].
9

Table 1: The configurations used for simulating the 2-speaker mixtures
Simulation corpus WSJCAM0
ASR pretraining corpus WSJ
Sampling rate 16 KHz
Num. of utterancesTrain - 7860Dev - 742Eval - 1088
Num. of RIRTrain - 2620Dev - 742Eval - 1088
T60 U(0.25s, 0.7s)
Num. of channels 8
Source distance from array U(1m, 2m)
A 25 ms window and a 10 ms frame shift with a Hanning window were used to compute STFT. Forthe eight microphone configuration (UCA-10 and UCA-5) the following pair list: (1, 5), (2, 6), (3, 7), (4,8), (1, 3), (3,5), (5,7), and (7, 1) were used to compute the IPD features defined in Eq (16). The pair listfor the three microphone subset (QA-10) was: (1, 2), (2, 3), and (1, 3). Three CNN blocks with rectifiedlinear unit (ReLU) activation after each block followed by a feedforward layer were used as LocNet-CNN(·)defined in Eq. (1). The CNN filters are applied across the microphone-frequency dimensions with a stride of1. The kernel shapes were dependent on the number of input microphones. In the case of 8-mics (UCA-10and UCA-5), kernels of shapes, 4× 1, 3× 3, and 3× 3 were used for the first, second, and third CNN blockrespectively. For the 3-mic QA-10, kernels of shapes, 2× 1, 2× 3, and 1× 3 were used for the first, second,and third CNN block respectively. Padding was not performed for the channel dimension so as to fuse themafter the final CNN block. The number of feature maps were 4 in the first block, 16 in the second block, and32 in the final block. Q was fixed as “2×b360/γc”. One output gate projected bidirectional long short-termmemory (BLSTMP) layer with Q cells was used as LocNet-Mask(·) defined in Eq. (11). All the DNN basedmulti-source localization were optimized with Adam [50] for 50 epochs and a learning rate of 10−3.
The masking network for MIMO-Speech was designed with two BLSTMP layers with 771 cells. Theencoder-decoder ASR network was based on the Transformer architecture [51] and it was initialized witha pretrained model that used single speaker training utterances from both WSJ0 and WSJ1. The samearchitecture as [35] was used for the encoder-decoder ASR model. It has 12 layers in the encoder and 6layers in the decoder. Before the Transformer encoder, the log Mel filterbank features of 80 dimensions areencoded by two CNN blocks. The CNN layers have a kernel size of 3× 3 and the number of feature maps is64 in the first block and 128 in the second block. Attention/CTC joint ASR decoding was performed withscore combination with a word-level recurrent language model from [52] trained on the text data from WSJ.Our implementation was based on the Pytorch backend of ESPnet [53].
The input signal was preprocessed with weighted prediction error (WPE) [54, 55] based dereverberationwith a filter order of 10 and prediction delay 3, only during inference time . The second channel was fixed asthe reference microphone for MVDR in Eq. (25). We evaluate several localization models with the proposedDOA integration with MIMO-Speech. To avoid retraining every time, the groundtruth DOA was usedwhile training the network and DOA estimation was performed only while inference. While PIT training,the order of the angle features was randomly permuted. Subspace DOA estimation was performed with“Pyroomacoustics” toolkit [56].
10

4.2. Multi-Source Localization Performance
Table 2: Mean absolute error (MAE) in degrees on both our UCA-5 and UCA-10 simulated 2-source mixtures comparing ourproposed source-splitting methods with subspace methods, and multi-label classification. The symbol “7” implies that theoption is not used and “3” implies that it is used.
RowMethod γ
LossPIT
UCA-5 (M=8) UCA-10 (M=8)
ID FunctionNo WPE WPE No WPE WPEDev Test Dev Test Dev Test Dev Test
1 MUSIC 1 - - 32.9 28.3 21.0 16.8 17.0 14.1 11.0 8.72 MUSIC-NAM 1 - - 8.7 6.8 6.8 4.8 2.5 2.2 2.1 1.13 TOPS 1 - - 7.9 6.9 7.4 6.3 3.1 2.6 1.9 1.84 MLC 5 BCE - 18.1 18.2 22.0 20.0 19.9 21.6 20.8 20.75 MLC 10 BCE - 10.5 10.9 13.1 12.7 7.8 8.4 9.1 9.0
6 Map-Split-C 10 CE 7 4.6 4.8 4.0 3.9 5.3 5.8 5.3 6.27 Mask-Split 10 CE 7 2.9 3.3 3.1 3.2 4.0 4.7 3.3 3.48 Mask-Split 1 CE 7 28.7 27.0 21.0 19.2 32.9 34.1 28.9 27.49 Mask-Split 1 SCE 7 1.6 1.9 2.4 2.0 3.7 3.6 3.6 3.810 Mask-Split 1 EMD 7 4.7 4.4 4.8 4.7 3.2 3.3 3.6 3.611 Mask-Split 1 SEMD 3 3.0 3.0 4.0 3.9 2.8 2.6 2.8 2.912 Mask-Split 1 SEMD 7 1.4 1.5 1.4 1.4 1.5 1.4 1.1 1.113 Map-Split-C 1 SEMD 3 3.7 4.2 3.8 4.1 3.6 4.0 3.2 3.814 Map-Split-C 1 SEMD 7 3.8 4.5 3.6 4.3 4.0 4.1 3.6 3.915 Map-Split-R 1 SEMD 3 2.7 2.9 2.8 3.1 2.3 2.2 2.2 2.516 Map-Split-R 1 SEMD 7 2.0 2.1 2.2 2.2 2.1 2.0 2.3 2.1
Table 3: Results on the simulated quadrant array (QA-10) 2-source mixtures comparing our proposed source-splitting methodswith subspace methods, and multi-label classification. QA-10 corresponds to using only the first three microphones of the eightmicrophone UCA-10. MAE in degrees is the metric. The signals were preprocessed with WPE to remove late reverberations.The symbol “7” implies that the option is not used and “3” implies that it is used.
Row ID Method γ Loss Function PITQA-10 (M=3)Dev Test
1 MUSIC 1 - - 58.7 57.72 MUSIC-NAM 1 - - 22.7 21.73 TOPS 1 - - 10.6 9.7
4 MLC 10 BCE - 10.1 11.9
5 Mask-Split 1 SEMD 7 2.5 2.86 Map-Split-C 1 SEMD 7 4.0 4.47 Map-Split-R 1 SEMD 7 2.8 3.5
We use three popular subspace-based signal processing methods MUSIC, MUSIC with normalized arith-metic mean fusion (MUSIC-NAM) [57], and TOPS as baselines. Frequencies from 100 Hz to 8000 Hz wereused for the subspace methods. For all three, the spatial response is computed and the top two peaks aredetected to estimate the DOA. The average absolute cyclic angle difference between the predicted angleand the ground-truth angle in degrees is used as the metric. The permutation of the prediction with thereference that gives the minimum error is chosen.
The results with and without WPE preprocessing for both UCA-5 and UCA-10 mixtures are given inTable 2. Most of the supervised deep learning models with different configurations perform significantly
11

better than the subspace methods for UCA-5 but for UCA-10 both MUSIC-NAM and TOPS give verystrong results. The results show that the deep learning methods are robust to reverberations and give goodresults even without the WPE frontend.
The results of the multi-label classification model from Section 2.1 are given in rows 4 & 5. We cansee that a higher resolution of γ = 5 degrades the performance from γ = 10. This is because of spuriouspeaks in nearby angles when the resolution is increased. This shows the need for having separate outputvectors for different sources. Rows 6-16 gives the results of the models with the proposed source splittingmechanism. The results are given with both PIT and also fixing the targets in ascending order. From theresults we can see that fixing the target order works better.
Rows 8-12 use the Mask-Split model proposed in Section 2.3 with phase feature masking. The CE losswith γ = 10 (row 7) works reasonably well and gives an improvement over the multi-label classificationmodel. Increasing the resolution to γ = 1 (rows 8) makes it poor because of its inability to learn inter-classrelationship like explained in Section 2.5. Making the target distribution smoother with SCE loss alleviatesthe problem quite well and we can observe better results in row 9. Using EMD loss also has a similar effect(row 10). Combining both ideas with the SEMD loss gives the best performance with a prediction error ofless than or equal to 1.5◦ when PIT is not used (row 12) for both array configurations. The results of bothMap-Split models (row 13-row16) are a bit worse compared to the Mask-Split model and amongst themMap-Split-R works better.
The results on the quadrant array with WPE preprocessing are shown in Table 3. This again shows thatsubspace methods degrade severely when the aperture is reduced. Here the proposed methods significantlyoutperform both subspace methods and MLC.
4.2.1. Predictor Sharing
Table 4: MAE (degree) on the simulated UCA-10 2-source mixtures demonstrating the effect of sharing the predictor parametersacross both the sources on the three different proposed source-splitting methods. The signals were preprocessed with WPE toremove late reverberations. The symbol “7” implies that the option is not used and “3” implies that it is used.
Method Predictor Sharing PITUCA-10
Dev Test
Map-Split-C 3 3 3.2 3.8Map-Split-C 3 7 3.6 3.9Map-Split-C 7 3 5.2 5.5Map-Split-C 7 7 3.5 4.1
Map-Split-R 3 3 5.7 5.4Map-Split-R 3 7 5.7 5.2Map-Split-R 7 3 2.2 2.5Map-Split-R 7 7 2.3 2.1
Mask-Split 3 3 6.0 6.0Mask-Split 3 7 2.3 2.2Mask-Split 7 3 2.8 2.9Mask-Split 7 7 1.1 1.1
In Table 4, a comparison is made between sharing the parameters of the predictor (source independent)and a source dependent predictor for all the three proposed source splitting methods. The results are shownfor UCA-10 but a similar trend was observed for the other array configurations too. We can see that having asource dependent predictor benefits Mask-Split and Map-Split-R but not Map-Split-C. So by default Mask-Split and Map-Split-R make the predictor feedforward layer dependent on source n as given in Eq (13) butMap-Split-C makes this layer independent of the source as given in Eq (8).
12

4.2.2. Impact of SNR
Table 5: Results on the simulated UCA-10 2-source mixtures demonstrating the effect of SNR. MAE in degrees is the metric.The signals were preprocessed with WPE to remove late reverberations. PIT was not used for the source splitting methods inthese experiments.
Row Method γ Loss PITUCA-10
ID FunctionSNR - 0dB SNR - 30dB
Test Test
1 MUSIC 1 - - 14.2 15.62 MUSIC-NAM 1 - - 1.3 1.13 TOPS 1 - - 2.3 1.6
4 MLC 10 BCE - 8.9 10.3
5 Mask-Split 1 SEMD 7 1.5 1.86 Map-Split-C 1 SEMD 7 6.0 4.07 Map-Split-R 1 SEMD 7 2.8 2.2
Two additional test sets were simulated for the UCA-10 configuration by fixing the SNR as 0 dB and 30dB respectively to see the impact of SNR on DOA estimation. We can see from Table 5 that SNR doesn’tplay a significant role in the DOA estimation performance for most of the DOA estimation methods. Only,Map-Split-C seems to have a notable degradation for the challenging 0 db SNR scenario. The backgroundnoise that we used from REVERB [46] consists mostly of stationary noise so both the baselines and theproposed methods are quite robust to it.
4.2.3. Impact of Angular Distance between Sources on DOA Estimation
Table 6: Results on the simulated UCA-5 2-source mixtures demonstrating the impact of angular distance between the twosources. The results here are divided into four subsets based on the angle difference. MAE in degrees is the metric. Thesignals were preprocessed with WPE to remove late reverberations. PIT was not used for the source splitting methods in theseexperiments.
Row Method γ Loss PITUCA-5
ID FunctionDev Test
10-20 21-45 46-90 91-180 10-20 21-45 46-90 91-180
1 MUSIC 1 - - 42.8 23.9 13.9 6.7 36.0 16.8 14.2 7.02 MUSIC-NAM 1 - - 67.0 8.0 0.4 0.5 65.3 4.7 0.5 0.53 TOPS 1 - - 67.6 8.3 1.3 1.1 67.3 9.2 1.6 1.1
4 MLC 10 BCE - 25.6 12.9 11.0 12.5 19.9 15.4 9.2 12.7
5 Mask-Split 1 SEMD 7 1.6 1.4 1.3 1.4 1.9 1.4 1.2 1.56 Map-Split-C 1 SEMD 7 5.5 4.6 3.3 3.2 5.8 5.0 4.7 3.87 Map-Split-R 1 SEMD 7 3.6 2.5 1.9 2.1 3.4 2.9 2.2 1.9
In [32, 40], it was shown that it is very challenging to separate sources when the angular distancebetween the sources is very small. The results in Table 2 for the UCA-5 array showed that the proposedsource splitting method significantly outperforms the subspace methods. In Table 6, we further investigatethe results on the UCA-5 configuration by checking the performance based on the angular distance betweenthe two sources (speakers). Both the development and test sets were divided into four subsets based onthe angle difference in degrees: (1) “10-20”, (2) “21-45”, (3) “46-90”, and (4) “91-180”. We can see theperformance of all three subspace methods (rows 1-3) are very poor in the most challenging scenario of“10-20” and they also have a significant degradation in the “21-45” cases. The MLC baseline (row 4) alsodegrages when the angle difference is “10-20” but it is relatively better than the subspace methods. The
13

proposed source splitting methods (rows 5-7) are very robust to the angular distance between the sourcesand amongst them Mask-Split is the most robust.
4.3. ASR Performance
Table 7: ASR performance on the simulated 2-speaker mixtures comparing our proposed DOA integration method with vanillaMIMO-Speech. The input signal was preprocessed with WPE to remove late reverberations. Word error rate (WER) is used asthe metric for comparison. For WER, lower the better. The symbol “7” implies that the option is not used and “3” impliesthat it is used.
Row DOA DOA IPD ASR UCA-5 UCA-10 QA-10ID Method PIT for ASR PIT Dev Test Dev Test Dev Test
Clean 1 - - 7 7 13.7 13.6 13.7 13.6 13.7 13.6Input mixture (ch-1) 2 - - 7 7 111.6 115.6 112.1 116.3 112.1 116.3
Oracle binary Mask (IBM) 3 - - 7 7 6.6 6.1 7.1 6.5 12.7 11.8
Baseline MIMO-Speech4 - - 7 3 14.0 12.0 15.1 13.6 24.8 22.25 - - 3 3 10.4 9.2 13.1 11.5 24.0 22.0
MIMO-Speech + Oracle Angle Feature6 - - 3 3 6.0 5.7 6.8 6.0 11.9 10.77 - - 3 7 6.3 5.6 6.6 6.2 12.0 11.1
MIMO-Speech + DOA Estimation
8 MUSIC - 3 7 16.9 14.2 12.9 11.5 27.2 25.29 MUSIC-NAM - 3 7 12.0 9.7 8.6 7.4 25.5 24.110 TOPS - 3 7 12.6 11.3 8.0 7.2 17.3 15.711 MLC - 3 7 13.1 11.3 11.6 11.5 15.5 15.612 Map-Split-C 7 3 7 7.8 7.7 9.1 8.6 14.6 13.313 Map-Split-R 3 3 3 6.9 6.2 7.3 6.8 12.4 11.514 Map-Split-R 7 3 3 6.6 6.2 7.3 6.7 12.6 11.815 Map-Split-R 7 3 7 6.8 6.1 7.2 6.9 12.7 12.116 Mask-Split 7 3 3 6.1 5.9 7.0 6.3 12.5 11.717 Mask-Split 7 3 7 6.3 6.0 7.0 6.3 13.0 11.8
The speech recognition performance of our proposed DOA integration compared with the vanilla MIMO-Speech baseline is given in Table 7. Word error rate (WER) is used as the metric for ASR and the resultsare shown for mixtures from all three array configurations. The results of the clean single-speaker data withthe pretrained ASR model is given in row 1. Note that the results of the clean single-speaker data is notvery good because it is from the British English corpus WSJCAM0 and the pretrained model was trainedwith American English data from WSJ. This accent difference is fixed in the mixed speech models as theASR network will be fine tuned in that case with British English data. The ASR results of the simulatedmixture using the single-speaker model is also shown (WER more than 100% because of too many insertionerrors).
Oracle experiment by directly giving the reference ideal binary masks (IBM) to the beamformer is givenin row 3. Row 4 shows the results of the baseline MIMO-Speech with the architecture originally proposed in[35]. Row 5 shows the modified baseline by adding IPD features and a channel independent masking networkas mentioned in Section 3. This makes the baseline stronger and gives slightly better results. Oracle ASR-DOA integration experiments were performed by using the groundtruth DOA while inference as a proof ofconcept and the results are shown in rows 6 & 7. We can see a very significant improvement in this case withthe word error rates reduced by close to a factor of two. The results are also slightly better than using theoracle binary masks. This proves the importance of feeding localization knowledge to a multi-speaker ASRsystem. We can also see that turning off PIT and fixing the target sequence order based on the DOA ordergives similar performance (row 7) with added benefits. This not only saves computation time while trainingbut also makes the inference more informative by associating the DOA and its corresponding transcription.
In rows 8-17 some of the DOA estimation methods are used to compute the angle features. All themethods except MLC here are high resolution and use γ = 1. For MLC γ = 10 was used. We can seethat using MUSIC, MUSIC-NAM, TOPS, or MLC degrades the ASR performance from the baseline for thelower aperture scenarios of UCA-5 and QA-10. This shows that localization knowledge will be useful onlyif we can estimate with good precision and reliability. The results with the proposed deep learning based
14

DOA estimation and SEMD loss are shown in rows 12-17. With any of these methods we get results closeto using the oracle DOA. We can see the Mask-Split model which gives the best localization performancein Table 2 also gives the best results here (row 14). This result almost matches the performance obtainedwith oracle masks in row 3.
4.3.1. Real Data
Figure 3: Layout of MC-WSJ-AV
The overlapped data from MC-WSJ-AV corpus [58] was also used for ASR evaluation. The positions ofthe speakers are mentioned to be stationary throughout the utterance. A schematic diagram of the recordinglayout redrawn from [58] is shown in Figure 3. There are six possible positions in the room that the speakerswere positioned. As there are two speakers in the mixture, there are fifteen possible position pairs. The realdata has recordings from two arrays with the same configuration placed in different positions. From theschematic diagram we can see that four of the six positions are very close to array-1 and all positions aregenerally far from Array-2. The model trained with the simulated UCA-10 and QA-10 mixtures are usedhere as they follow similar configurations. Although trained with simulated data, it is crucial to see howour methods work on real data. As there are no groundtruth DOA labels, we cannot evaluate the angleprediction error.
Table 8: ASR performance on the real 2-speaker overlapped data from MC-WSJ-AV. The input signal was preprocessed withWPE to remove late reverberations. Word error rate (WER) is used as the metric for comparison. For WER, lower the better.
UCA-10 (M=8) QA-10 (M=3)DOA Method Array-1 Array-2 Array-1 Array-2
MIMO-Speech N/A 34.3 47.6 41.6 55.7MIMO-Speech w/ IPD N/A 20.6 30.7 48.1 63.1
MIMO-Speech + DOA Integration MUSIC-NAM 10.7 17.1 36.4 46.8MIMO-Speech + DOA Integration TOPS 10.6 19.2 20.0 33.4
MIMO-Speech + DOA Integration Mask-Split 14.0 18.2 18.0 28.7MIMO-Speech + DOA Integration Map-Split-R 14.8 22.3 21.2 25.6MIMO-Speech + DOA Integration Map-Split-R (chunking) 12.1 17.3 20.7 25.3
15

The ASR performance is shown in Table 8. The DOA estimation here is performed with γ = 1 and thesource splitting models here are without PIT and with SEMD loss. We also experiment with a chunkingscheme here for Map-Split-R. Here we splice the input audio into 100 ms chunks with 50% overlap. DOAestimation is performed on each of these chunks and their median output is chosen as the estimated DOA.This was done to remove the effect of some bad chunks in the estimation process.
Using estimated DOAs from either the subspace methods or the source splitting models, ASR-DOAintegration significantly outperforms the MIMO-Speech baselines for this data. This further proves theimportance of localization as a very pivotal frontend for ASR. As positions of the sources in this datasetwere chosen to be favorable to array-1 it gives better results. For UCA-10, there is not much differencebetween the subspace methods and the proposed source splitting methods but for QA-10, the proposedmethod outperforms and the margin is significant for array-2. This again shows the effectiveness of thesource splitting approach on challenging conditions and lower aperture.
5. Conclusion & Future Work
We proposed a novel deep learning based model for multi-source localization that can classify DOAswith a high resolution. An extensive evaluation was performed with different choices of architectures,loss functions, classification resolution, and training schemes that handle permutation ambiguity. Ourproposed source splitting model was shown to have a significantly lower prediction error compared to amulti-label classification model. The proposed method also outperforms well known subspace methods.We also proposed a soft earth mover distance (SEMD) loss function for the localization task that modelsinter-class relationship well for DOA estimation and hence predicts near perfect DOA.
We have also devised a method to use the proposed DOA estimation as a frontend for multi-talker ASR.This integration greatly helps speech recognition and shows the importance of using localization priors withfar-field ASR models. Based on this finding, ASR performance was used as the metric of evaluation forDOA estimation in real data where DOA labels are not available to compute prediction errors.
In future, we would like to extend our methods to also handle source counting within the model to makeit work for arbitrary number of sources. One possible approach would be to use a conditional chain modelthat is popular for source separation [59, 60]. The other important extension is adapting our method towork on more challenging and realistic data like CHiME-6 [61] which involves a complicated distributedarray setup with moving sources.
References
[1] K. Nakadai, T. Takahashi, H. Okuno, H. Nakajima, Y. Hasegawa, H. Tsujino, Design and implementation of robot auditionsystem ‘HARK’ - open source software for listening to three simultaneous speakers, Advanced Robotics 24 (5-6) (2010)739–761.
[2] K. Nakadai, K. Hidai, H. Mizoguchi, H. Okuno, H. Kitano, Real-time auditory and visual multiple-object tracking forhumanoids, in: International Joint Conferences on Artificial Intelligence (IJCAI), 2001, pp. 1425–1432.
[3] T. Yoshioka, I. Abramovski, C. Aksoylar, Z. Chen, M. David, D. Dimitriadis, Y. Gong, I. Gurvich, X. Huang, Y. Huang,A. Hurvitz, L. Jiang, S. Koubi, E. Krupka, I. Leichter, C. Liu, P. Parthasarathy, A. Vinnikov, L. Wu, X. Xiao, W. Xiong,H. Wang, Z. Wang, J. Zhang, Y. Zhao, T. Zhou, Advances in online audio-visual meeting transcription, in: IEEE AutomaticSpeech Recognition and Understanding Workshop (ASRU), 2019, pp. 276–283.
[4] J. Barker, S. Watanabe, E. Vincent, J. Trmal, The fifth CHiME speech separation and recognition challenge: Dataset,task and baselines, in: Interspeech, 2018, pp. 1561–1565.
[5] R. Haeb-Umbach, S. Watanabe, T. Nakatani, M. Bacchiani, B. Hoffmeister, M. L. Seltzer, H. Zen, M. Souden, Speechprocessing for digital home assistants: Combining signal processing with deep-learning techniques, IEEE Signal processingmagazine 36 (6) (2019) 111–124.
[6] R. Schmidt, Multiple emitter location and signal parameter estimation, IEEE transactions on antennas and propagation34 (3) (1986) 276–280.
[7] R. Roy, T. Kailath, ESPRIT-estimation of signal parameters via rotational invariance techniques, IEEE Transactions onAcoustics, Speech, and Signal Processing 37 (7) (1989) 984–995.
[8] E. D. Di Claudio, R. Parisi, WAVES: weighted average of signal subspaces for robust wideband direction finding, IEEETransactions on Signal Processing 49 (10) (2001) 2179–2191.
[9] Yeo-Sun Yoon, L. M. Kaplan, J. H. McClellan, TOPS: new DOA estimator for wideband signals, IEEE Transactions onSignal Processing 54 (6) (2006) 1977–1989.
16
[10] J. DiBiase, A high-accuracy, low-latency technique for talker localization in reverberant environments using microphonearrays, PhD Thesis, Brown University.
[11] S. Chakrabarty, E. A. Habets, Multi-speaker DOA estimation using deep convolutional networks trained with noise signals,IEEE Journal of Selected Topics in Signal Processing 13 (1) (2019) 8–21.
[12] T. Hirvonen, Classification of spatial audio location and content using convolutional neural networks, in: 138th AudioEngineering Society Convention, Vol. 2, 2015.
[13] R. Takeda, K. Komatani, Sound source localization based on deep neural networks with directional activate functionexploiting phase information, in: IEEE International Conference on Acoustics, Speech, and Signal Processing (ICASSP),2016, pp. 405–409.
[14] F. Vesperini, P. Vecchiotti, E. Principi, S. Squartini, F. Piazza, A neural network based algorithm for speaker localizationin a multi-room environment, in: 26th IEEE International Workshop on Machine Learning for Signal Processing (MLSP),2016, pp. 1–6.
[15] N. Yalta, K. Nakadai, T. Ogata, Sound source localization using deep learning models, Journal of Robotics and Mecha-tronics 29 (2017) 37–48.
[16] S. Chakrabarty, E. A. Habets, Broadband DOA estimation using convolutional neural networks trained with noise signals,in: IEEE Workshop on Applications of Signal Processing to Audio and Acoustics (WASPAA), 2017, pp. 136–140.
[17] L. Perotin, A. Defossez, E. Vincent, R. Serizel, A. Guerin, Regression versus classification for neural network based audiosource localization, in: IEEE Workshop on Applications of Signal Processing to Audio and Acoustics (WASPAA), 2019,pp. 343–347.
[18] S. Adavanne, A. Politis, J. Nikunen, T. Virtanen, Sound event localization and detection of overlapping sources usingconvolutional recurrent neural networks, IEEE Journal of Selected Topics in Signal Processing 13 (1) (2018) 34–48.
[19] K. Shimada, Y. Koyama, N. Takahashi, S. Takahashi, Y. Mitsufuji, ACCDOA: Activity-coupled cartesian direction ofarrival representation for sound event localization and detection, in: IEEE International Conference on Acoustics, Speechand Signal Processing (ICASSP), 2021, pp. 915–919.
[20] A. Narayanan, D. Wang, Ideal ratio mask estimation using deep neural networks for robust speech recognition, in: IEEEInternational Conference on Acoustics, Speech and Signal Processing (ICASSP), 2013, pp. 7092–7096.
[21] Y. Wang, A. Narayanan, D. Wang, On training targets for supervised speech separation, IEEE/ACM Transactions onAudio, Speech, and Language Processing 22 (12) (2014) 1849–1858.
[22] W. Zhang, Y. Zhou, Y. Qian, Robust DOA estimation based on convolutional neural network and time-frequency masking,in: Interspeech, 2019, pp. 2703–2707.
[23] W. Mack, U. Bharadwaj, S. Chakrabarty, E. A. P. Habets, Signal-aware broadband DOA estimation using attentionmechanisms, in: IEEE International Conference on Acoustics, Speech and Signal Processing (ICASSP), 2020, pp. 4930–4934.
[24] Z.-Q. Wang, X. Zhang, D. Wang, Robust speaker localization guided by deep learning-based time-frequency masking,IEEE/ACM Transactions on Audio, Speech, and Language Processing 27 (1) (2019) 178–188.
[25] Z. Wang, J. Li, Y. Yan, Target speaker localization based on the complex watson mixture model and time-frequencyselection neural network, Applied Sciences 8 (11).
[26] S. Sivasankaran, E. Vincent, D. Fohr, Keyword based speaker localization: Localizing a target speaker in a multi-speakerenvironment, in: Interspeech, 2018, pp. 2703–2707.
[27] M. Delcroix, K. Zmolikova, K. Kinoshita, A. Ogawa, T. Nakatani, Single channel target speaker extraction and recognitionwith speaker beam, in: IEEE International Conference on Acoustics, Speech and Signal Processing (ICASSP), 2018, pp.5554–5558.
[28] H. W. Lollmann, C. Evers, A. Schmidt, H. Mellmann, H. Barfuss, P. A. Naylor, W. Kellermann, The locata Challengedata corpus for acoustic source localization and tracking, in: IEEE 10th Sensor Array and Multichannel Signal ProcessingWorkshop, 2018, pp. 410–414.
[29] S. Adavanne, A. Politis, T. Virtanen, Direction of arrival estimation for multiple sound sources using convolutionalrecurrent neural network, in: European Signal Processing Conference (EUSIPCO), 2018, pp. 1462–1466.
[30] W. He, P. Motlicek, J. Odobez, Deep neural networks for multiple speaker detection and localization, in: IEEE Interna-tional Conference on Robotics and Automation (ICRA), 2018, pp. 74–79.
[31] Z. Chen, X. Xiao, T. Yoshioka, H. Erdogan, J. Li, Y. Gong, Multi-channel overlapped speech recognition with locationguided speech extraction network, in: IEEE Spoken Language Technology Workshop (SLT), 2018, pp. 558–565.
[32] A. S. Subramanian, C. Weng, M. Yu, S. Zhang, Y. Xu, S. Watanabe, D. Yu, Far-field location guided target speechextraction using end-to-end speech recognition objectives, in: IEEE International Conference on Acoustics, Speech, andSignal Processing (ICASSP), 2020, pp. 7299–7303.
[33] A. S. Subramanian, C. Weng, S. Watanabe, M. Yu, Y. Xu, S.-X. Zhang, D. Yu, Directional ASR: A new paradigm for e2emulti-speaker speech recognition with source localization, in: IEEE International Conference on Acoustics, Speech andSignal Processing (ICASSP), 2021, pp. 8433–8437.
[34] X. Chang, W. Zhang, Y. Qian, J. Le Roux, S. Watanabe, MIMO-Speech: End-to-end multi-channel multi-speaker speechrecognition, in: IEEE Automatic Speech Recognition and Understanding Workshop (ASRU), 2019, pp. 237–244.
[35] X. Chang, W. Zhang, Y. Qian, J. Le Roux, S. Watanabe, End-to-end multi-speaker speech recognition with transformer,in: IEEE International Conference on Acoustics, Speech, and Signal Processing (ICASSP), 2020, pp. 6134–6138.
[36] D. Yu, M. Kolbæk, Z. Tan, J. Jensen, Permutation invariant training of deep models for speaker-independent multi-talkerspeech separation, in: IEEE International Conference on Acoustics, Speech, and Signal Processing (ICASSP), 2017, pp.241–245.
[37] D. Snyder, D. Garcia-Romero, G. Sell, D. Povey, S. Khudanpur, X-Vectors: Robust DNN embeddings for speaker recog-
17
nition, in: IEEE International Conference on Acoustics, Speech, and Signal Processing (ICASSP), 2018, pp. 5329–5333.[38] K. Vesely, S. Watanabe, K. Zmolıkova, M. Karafiat, L. Burget, J. H. Cernocky, Sequence summarizing neural network
for speaker adaptation, in: IEEE International Conference on Acoustics, Speech, and Signal Processing (ICASSP), 2016,pp. 5315–5319.
[39] Z.-Q. Wang, J. Le Roux, J. R. Hershey, Multi-channel deep clustering: Discriminative spectral and spatial embeddings forspeaker-independent speech separation, in: IEEE International Conference on Acoustics, Speech and Signal Processing(ICASSP), 2018, pp. 1–5.
[40] F. Bahmaninezhad, J. Wu, R. Gu, S.-X. Zhang, Y. Xu, M. Yu, D. Yu, A comprehensive study of speech separation:Spectrogram vs waveform separation, in: Interspeech, 2019, pp. 4574–4578.
[41] E. Levina, P. Bickel, The earth mover’s distance is the mallows distance: some insights from statistics, in: IEEE Interna-tional Conference on Computer Vision (ICCV), Vol. 2, 2001, pp. 251–256.
[42] L. Hou, C.-P. Yu, D. Samaras, Squared earth mover’s distance-based loss for training deep neural networks, NeurIPSWorkshop - Learning on Distributions, Functions, Graphs and Groups.
[43] M. Souden, J. Benesty, S. Affes, On optimal frequency-domain multichannel linear filtering for noise reduction, IEEETransactions on Audio, Speech, and Language Processing 18 (2) (2010) 260–276.
[44] S. Kim, T. Hori, S. Watanabe, Joint CTC-attention based end-to-end speech recognition using multi-task learning, in:IEEE International Conference on Acoustics, Speech, and Signal Processing (ICASSP), 2017, pp. 4835–4839.
[45] T. Robinson, J. Fransen, D. Pye, J. Foote, S. Renals, WSJCAMO: a British English speech corpus for large vocabularycontinuous speech recognition, in: IEEE International Conference on Acoustics, Speech, and Signal Processing (ICASSP),Vol. 1, 1995, pp. 81–84.
[46] K. Kinoshita, M. Delcroix, S. Gannot, E. A. Habets, R. Haeb-Umbach, W. Kellermann, V. Leutnant, R. Maas, T. Nakatani,B. Raj, et al., A summary of the REVERB challenge: state-of-the-art and remaining challenges in reverberant speechprocessing research, EURASIP Journal on Advances in Signal Processing.
[47] L. Drude, J. Heitkaemper, C. Boeddeker, R. Haeb-Umbach, SMS-WSJ: Database, performance measures, and baselinerecipe for multi-channel source separation and recognition, arXiv preprint arXiv:1910.13934.
[48] J. B. Allen, D. A. Berkley, Image method for efficiently simulating small-room acoustics, The Journal of the AcousticalSociety of America 65 (4) (1979) 943–950.
[49] S. Chakrabarty, E. A. Habets, Multi-speaker localization using convolutional neural network trained with noise, arXivpreprint arXiv:1712.04276.
[50] D. P. Kingma, J. Ba, Adam: A method for stochastic optimization, in: International Conference on Learning Represen-tations (ICLR), 2015.
[51] S. Karita, N. Chen, T. Hayashi, T. Hori, H. Inaguma, Z. Jiang, M. Someki, N. E. Y. Soplin, R. Yamamoto, X. Wang,S. Watanabe, T. Yoshimura, W. Zhang, A comparative study on Transformer vs RNN in speech applications, in: IEEEAutomatic Speech Recognition and Understanding Workshop (ASRU), 2019, pp. 449–456.
[52] T. Hori, J. Cho, S. Watanabe, End-to-end speech recognition with word-based RNN language models, in: IEEE SpokenLanguage Technology Workshop (SLT), 2018, pp. 389–396.
[53] S. Watanabe, T. Hori, S. Karita, T. Hayashi, J. Nishitoba, Y. Unno, N. Enrique Yalta Soplin, J. Heymann, M. Wiesner,N. Chen, A. Renduchintala, T. Ochiai, ESPnet: End-to-end speech processing toolkit, in: Interspeech, 2018, pp. 2207–2211.
[54] T. Nakatani, T. Yoshioka, K. Kinoshita, M. Miyoshi, B. Juang, Speech dereverberation based on variance-normalizeddelayed linear prediction, IEEE Transactions on Audio, Speech, and Language Processing 18 (7) (2010) 1717–1731.
[55] L. Drude, J. Heymann, C. Boeddeker, R. Haeb-Umbach, NARA-WPE: A Python package for weighted prediction errordereverberation in Numpy and Tensorflow for online and offline processing, in: ITG Fachtagung Sprachkommunikation,2018.
[56] R. Scheibler, E. Bezzam, I. Dokmanic, Pyroomacoustics: A python package for audio room simulation and array processingalgorithms, in: IEEE International Conference on Acoustics, Speech, and Signal Processing (ICASSP), 2018, pp. 351–355.
[57] D. Salvati, C. Drioli, G. L. Foresti, Incoherent frequency fusion for broadband steered response power algorithms in noisyenvironments, IEEE Signal Processing Letters 21 (5) (2014) 581–585.
[58] M. Lincoln, I. McCowan, J. Vepa, H. K. Maganti, The multi-channel wall street journal audio visual corpus (MC-WSJ-AV):specification and initial experiments, in: IEEE Workshop on Automatic Speech Recognition and Understanding (ASRU),2005, pp. 357–362.
[59] K. Kinoshita, L. Drude, M. Delcroix, T. Nakatani, Listening to each speaker one by one with recurrent selective hearingnetworks, in: IEEE International Conference on Acoustics, Speech, and Signal Processing (ICASSP), 2018, pp. 5064–5068.
[60] J. Shi, X. Chang, P. Guo, S. Watanabe, Y. Fujita, J. Xu, B. Xu, L. Xie, Sequence to multi-sequence learning via conditionalchain mapping for mixture signals, in: Advances in Neural Information Processing Systems, 2020, pp. 3735–3747.
[61] S. Watanabe, M. Mandel, J. Barker, E. Vincent, A. Arora, X. Chang, S. Khudanpur, V. Manohar, D. Povey, D. Raj,D. Snyder, A. S. Subramanian, J. Trmal, B. B. Yair, C. Boeddeker, Z. Ni, Y. Fujita, S. Horiguchi, N. Kanda, T. Yoshioka,N. Ryant, CHiME-6 challenge: Tackling multispeaker speech recognition for unsegmented recordings, in: 6th InternationalWorkshop on Speech Processing in Everyday Environments, 2020.
18