Decreased light attenuation in cerebral cortex during ... detected using optical coherence...
8
Decreased light attenuation in cerebral cortex during cerebral edema detected using optical coherence tomography Carissa L. R. Rodriguez Jenny I. Szu Melissa M. Eberle Yan Wang Mike S. Hsu Devin K. Binder B. Hyle Park Downloaded From: http://neurophotonics.spiedigitallibrary.org/ on 11/03/2014 Terms of Use: http://spiedl.org/terms
-
Upload
trinhhuong -
Category
Documents
-
view
231 -
download
4
Transcript of Decreased light attenuation in cerebral cortex during ... detected using optical coherence...
Decreased light attenuation incerebral cortex during cerebraledema detected using opticalcoherence tomography
Carissa L. R. RodriguezJenny I. SzuMelissa M. EberleYan WangMike S. HsuDevin K. BinderB. Hyle Park
Downloaded From: http://neurophotonics.spiedigitallibrary.org/ on 11/03/2014 Terms of Use: http://spiedl.org/terms
Decreased light attenuation in cerebral cortexduring cerebral edema detected usingoptical coherence tomography
Carissa L. R. Rodriguez,a Jenny I. Szu,b Melissa M. Eberle,a Yan Wang,c Mike S. Hsu,b,dDevin K. Binder,b,d and B. Hyle Parka,*aUniversity of California Riverside, Department of Bioengineering, 900 University Avenue, Riverside, California 92521, United StatesbUniversity of California Riverside, Division of Biomedical Sciences, School of Medicine, 900 University Avenue, Riverside,California 92521, United StatescMassachusetts General Hospital and Harvard Medical School, Pulmonary and Critical Care Unit, 55 Fruit Street, Boston,Massachusetts 02114, United StatesdUmbrella Neurotechnologies, Irvine, California 92620, United States
Abstract. Cerebral edema develops in response to a variety of conditions, including traumatic brain injury andstroke, and contributes to the poor prognosis associated with these injuries. This study examines the use ofoptical coherence tomography (OCT) for detecting cerebral edema in vivo. Three-dimensional imaging of anin vivo water intoxication model in mice was performed using a spectral-domain OCT system centered at1300 nm. The change in attenuation coefficient was calculated and cerebral blood flow was analyzed usingDoppler OCT techniques. We found that the average attenuation coefficient in the cerebral cortex decreasedover time as edema progressed. The initial decrease began within minutes of inducing cerebral edema and amaximum decrease of 8% was observed by the end of the experiment. Additionally, cerebral blood flow slowedduring late-stage edema. Analysis of local regions revealed the same trend at various locations in the brain,consistent with the global nature of the cerebral edema model used in this study. These results demonstratethat OCT is capable of detecting in vivo optical changes occurring due to cerebral edema and highlights thepotential of OCT for precise spatiotemporal detection of cerebral edema. © The Authors. Published by SPIE under a
Creative Commons Attribution 3.0 Unported License. Distribution or reproduction of this work in whole or in part requires full attribution of the original
publication, including its DOI. [DOI: 10.1117/1.NPh.1.2.025004]
Keywords: cerebral edema; optical coherence tomography; brain swelling.
Paper 14051R received May 20, 2014; revised manuscript received Jul. 24, 2014; accepted for publication Aug. 8, 2014; publishedonline Sep. 2, 2014.
1 IntroductionCerebral edema, an accumulation of excess water in the brain,develops in response to a number of pathological conditionsincluding traumatic brain injury (TBI), stroke, and infection.1,2
Excess water in the brain lead to raised intracranial pressure(ICP), which can cause secondary injuries, such as restrictionof cerebral blood flow and brain herniation, and ultimatelyincreases morbidity and mortality. While osmotherapy hasachieved some success in the treatment of this condition, newapproaches to regulating water influx and accumulation arecontinually being investigated.3
As new potential treatments are developed and undergo invivo testing in animal studies, their effectiveness is largely mea-sured by monitoring ICP and/or brain water content (BWC)analysis. ICP detection of edema operates on the principle thatas brain volume increases due to excess water, ICP will alsoincrease. However, this method suffers from an inherent delaybetween the onset of edema and the rise of ICP. Furthermore, itonly provides a global measure of ICP and does not provide anyspatial information. BWC analysis can be performed to measurethe increase in water content. This can be done for each quadrantof the brain, through wet/dry measurements, or locally by per-forming tissue biopsy and measuring the specific gravity.4 These
measurements, however, are extremely invasive and can onlyprovide a measurement at a single time point.
Real time, continuous monitoring of cerebral edema progres-sion in vivo with high spatial resolution would be highly ben-eficial for studying the effects of possible therapeutic solutions.Optical detection of cerebral edema could potentially offer amore direct and less invasive measure of cerebral edema com-pared to the current detection techniques. The optical scatteringof tissue is influenced by tissue composition and, therefore, willchange as the water content increases. A recent study has dem-onstrated an increase in near-infrared (NIR) light transmittancewhen cerebral edema is present in brain slices in vitro.5 Also,a separate study showed that NIR light reflected from in vivobrain tissue decreased over time with increasing BWC.6
These results clearly indicate a difference in the optical pro-perties of normal versus edematous brain tissue. However,the utility of these methods has been limited by a lack of spatialspecificity.
Optical coherence tomography (OCT), a nondestructive opti-cal imaging technique, is capable of producing cross-sectionalimages of biological tissue with micrometer resolution and animaging depth on the order of millimeters.7,8 The spatial speci-ficity of OCT could be used to monitor the progression of cer-ebral edema throughout space and time, and to locate edematousregions in the brain relative to known brain structures. Addition-ally, changes in cerebral blood flow can be detected using*Address all correspondence to: B. Hyle Park, E-mail: [email protected]
Neurophotonics 025004-1 Oct–Dec 2014 • Vol. 1(2)
Neurophotonics 1(2), 025004 (Oct–Dec 2014)
Downloaded From: http://neurophotonics.spiedigitallibrary.org/ on 11/03/2014 Terms of Use: http://spiedl.org/terms
Doppler OCT (DOCT), a technique which utilizes phase infor-mation contained in the OCT signal to detect flow.9,10
Based on the unique advantages of OCT imaging, we inves-tigated how the optical properties of the edematous tissuechanged over time in an in vivo model of cerebral edema.Sequential three-dimensional (3-D) data were acquired andchanges in the spatially resolved attenuation coefficient wereexamined to study the global nature of the water intoxicationmouse model. BWC measurements were made to additionallyverify the presence of edema. Cerebral blood flow was also ana-lyzed to provide further insight into the evolution of edema andreduction of cerebral blood flow in this model.
2 Experimental Methods
2.1 Preparation and Imaging of Animal Model
Female CD1 WT mice, 6–14 weeks old, were anesthetized withan intraperitoneal (IP) injection of ketamine and xylazine(10 mg∕kg xylazine, 80 mg∕kg ketamine) and prepared with athinned-skull cortical window, approximately 4 × 4 mm2 wide,centered over the right cerebral cortex. The thinned skullallowed for increased light penetration depth while preservingthe natural physiological conditions of the brain.11 The mousewas then secured in a stereotactic frame for stable OCT imagingover a select region of interest within the cortical window.
An acute water intoxication model of cytotoxic cerebraledema, in which water is driven from the vascular system intothe brain by an osmotic gradient, was used.12,13 Twenty minutesof baseline OCT imaging was performed after which an IP injec-tion of water was given (dosage 40% of the animal’s bodyweight). OCT imaging continued for 60 min. One OCT volume
was collected every 3 min and spanned a volume of 4 × 4×2 mm3. Three water intoxication experiments and three controlexperiments (including thin-skull preparation without IPinjection) were performed. All experimental procedures andprotocols were approved by the University of California River-side Institutional Animal Care and Use Committee (protocol2010-0018).
2.2 Brain Water Content Analysis
The presence of cerebral edema was verified by analyzing BWCvia the wet-dry methods. After OCT data collection was com-pleted, animals were sacrificed and the brains were dissected outpost mortem and cut into four pieces (right-left cerebral hemi-spheres, right-left cerebellum). Brains were weighed to obtainthe wet weight and dried for 48 h to determine the dry weight.The percent of water content was calculated with the followingformula: BWC¼ ½ðwet weight−dry weightÞ∕wet weight�×100.
2.3 Optical Coherence Tomography ImageAcquisition
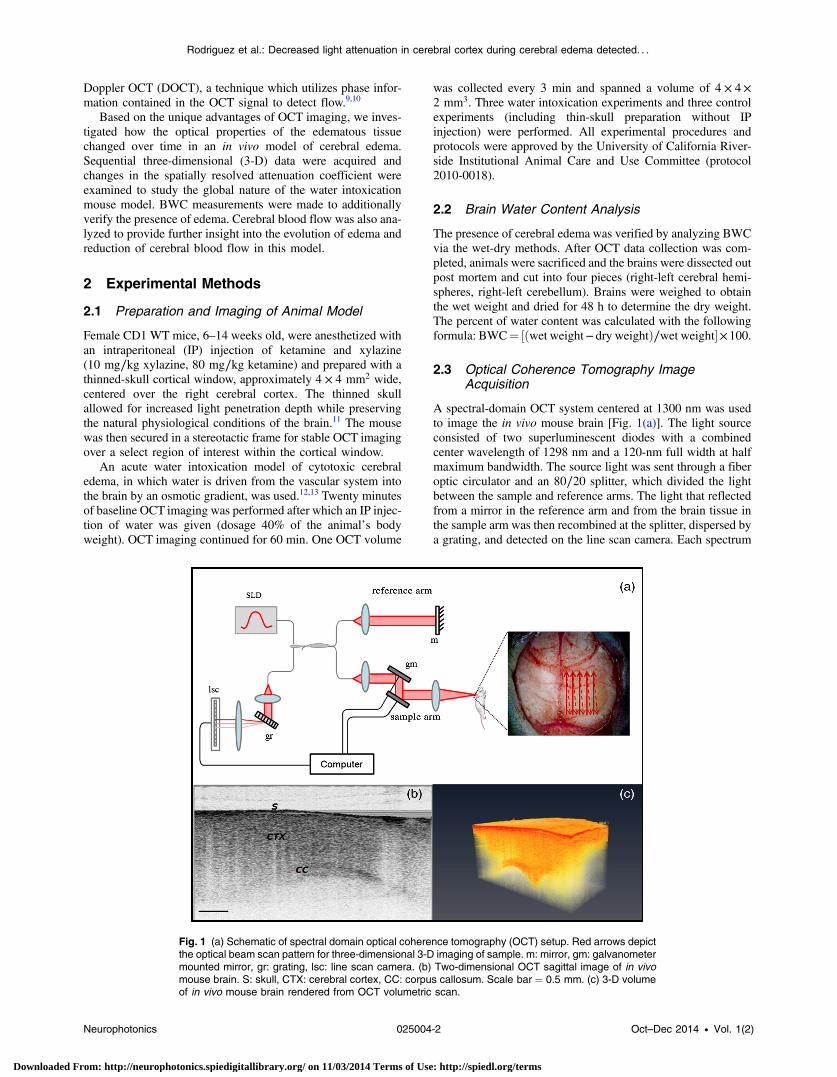
A spectral-domain OCT system centered at 1300 nm was usedto image the in vivo mouse brain [Fig. 1(a)]. The light sourceconsisted of two superluminescent diodes with a combinedcenter wavelength of 1298 nm and a 120-nm full width at halfmaximum bandwidth. The source light was sent through a fiberoptic circulator and an 80∕20 splitter, which divided the lightbetween the sample and reference arms. The light that reflectedfrom a mirror in the reference arm and from the brain tissue inthe sample arm was then recombined at the splitter, dispersed bya grating, and detected on the line scan camera. Each spectrum
Fig. 1 (a) Schematic of spectral domain optical coherence tomography (OCT) setup. Red arrows depictthe optical beam scan pattern for three-dimensional 3-D imaging of sample. m: mirror, gm: galvanometermounted mirror, gr: grating, lsc: line scan camera. (b) Two-dimensional OCT sagittal image of in vivomouse brain. S: skull, CTX: cerebral cortex, CC: corpus callosum. Scale bar ¼ 0.5 mm. (c) 3-D volumeof in vivo mouse brain rendered from OCT volumetric scan.
Neurophotonics 025004-2 Oct–Dec 2014 • Vol. 1(2)
Rodriguez et al.: Decreased light attenuation in cerebral cortex during cerebral edema detected. . .
Downloaded From: http://neurophotonics.spiedigitallibrary.org/ on 11/03/2014 Terms of Use: http://spiedl.org/terms
acquired on the camera contained depth information from a sin-gle location in the sample (known as an A-line or depth profile).3-D imaging was achieved by raster scanning the optical beamacross the sample using two galvanometer mounted mirrors. Thesystem has an axial imaging range of approximately 2 mm inbiological tissue, an axial resolution of 8 μm, and a lateral res-olution of 20 μm.
Each image contained 2048 A-lines, acquired at a rate of15 kHz, and 250 images were used to render a single volume[Figs. 1(b) and 1(c). Real-time visualization of the sample wasachieved using in-house developed software, which utilizeda graphics processing unit (GPU) to process and display theOCT structure and blood flow images in real time.14 Thereal-time display of OCT images allowed structural markerswithin the imaging location to be rapidly identified and ensuredthat the same region of the brain was consistently imaged duringand across all experiments. Depth-resolved structural informa-tion was retrieved from each A-line by applying a Fourier trans-form to the spectrum collected on the camera after linearlyremapping to k-space. The images were displayed on an inverselog scale [Fig. 1(b)].
Images of the cerebral vascular network were generated byutilizing the phase information contained in the OCT signal, amethod known as Doppler OCT (DOCT).9,15,16 This techniqueenables high resolution imaging of motion within the sample bycalculating the Doppler frequency shift caused from reflectionoff of a moving sample. The depth resolved phase differencebetween consecutive A-lines was determined and this phasedifference is directly proportional to the axial component ofthe velocity of the scattering particle. Static tissue introducesminimal phase shifts and is represented by a low intensity inDOCT images while blood flow induces a large phase differ-ence, represented by a high intensity.
2.4 Analysis of Attenuation Coefficient andCerebral Blood Flow
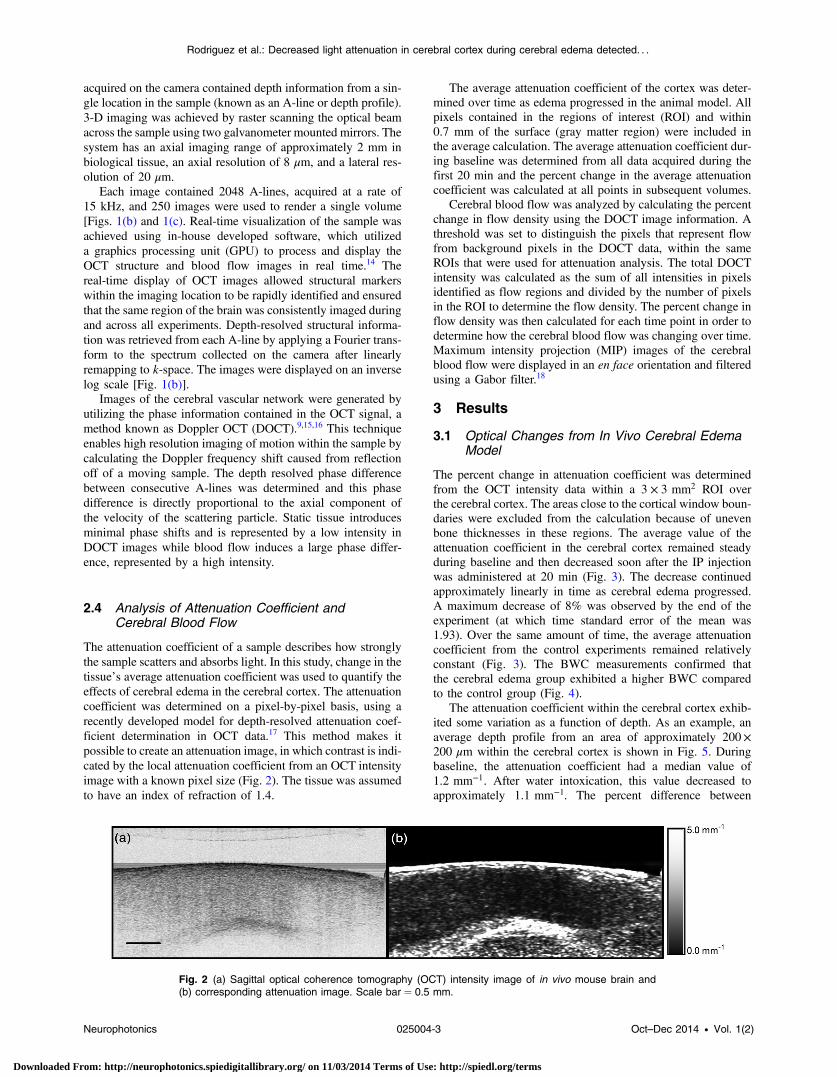
The attenuation coefficient of a sample describes how stronglythe sample scatters and absorbs light. In this study, change in thetissue’s average attenuation coefficient was used to quantify theeffects of cerebral edema in the cerebral cortex. The attenuationcoefficient was determined on a pixel-by-pixel basis, using arecently developed model for depth-resolved attenuation coef-ficient determination in OCT data.17 This method makes itpossible to create an attenuation image, in which contrast is indi-cated by the local attenuation coefficient from an OCT intensityimage with a known pixel size (Fig. 2). The tissue was assumedto have an index of refraction of 1.4.
The average attenuation coefficient of the cortex was deter-mined over time as edema progressed in the animal model. Allpixels contained in the regions of interest (ROI) and within0.7 mm of the surface (gray matter region) were included inthe average calculation. The average attenuation coefficient dur-ing baseline was determined from all data acquired during thefirst 20 min and the percent change in the average attenuationcoefficient was calculated at all points in subsequent volumes.
Cerebral blood flow was analyzed by calculating the percentchange in flow density using the DOCT image information. Athreshold was set to distinguish the pixels that represent flowfrom background pixels in the DOCT data, within the sameROIs that were used for attenuation analysis. The total DOCTintensity was calculated as the sum of all intensities in pixelsidentified as flow regions and divided by the number of pixelsin the ROI to determine the flow density. The percent change inflow density was then calculated for each time point in order todetermine how the cerebral blood flow was changing over time.Maximum intensity projection (MIP) images of the cerebralblood flow were displayed in an en face orientation and filteredusing a Gabor filter.18
3 Results
3.1 Optical Changes from In Vivo Cerebral EdemaModel
The percent change in attenuation coefficient was determinedfrom the OCT intensity data within a 3 × 3 mm2 ROI overthe cerebral cortex. The areas close to the cortical window boun-daries were excluded from the calculation because of unevenbone thicknesses in these regions. The average value of theattenuation coefficient in the cerebral cortex remained steadyduring baseline and then decreased soon after the IP injectionwas administered at 20 min (Fig. 3). The decrease continuedapproximately linearly in time as cerebral edema progressed.A maximum decrease of 8% was observed by the end of theexperiment (at which time standard error of the mean was1.93). Over the same amount of time, the average attenuationcoefficient from the control experiments remained relativelyconstant (Fig. 3). The BWC measurements confirmed thatthe cerebral edema group exhibited a higher BWC comparedto the control group (Fig. 4).
The attenuation coefficient within the cerebral cortex exhib-ited some variation as a function of depth. As an example, anaverage depth profile from an area of approximately 200×200 μm within the cerebral cortex is shown in Fig. 5. Duringbaseline, the attenuation coefficient had a median value of1.2 mm−1. After water intoxication, this value decreased toapproximately 1.1 mm−1. The percent difference between
Fig. 2 (a) Sagittal optical coherence tomography (OCT) intensity image of in vivo mouse brain and(b) corresponding attenuation image. Scale bar ¼ 0.5 mm.
Neurophotonics 025004-3 Oct–Dec 2014 • Vol. 1(2)
Rodriguez et al.: Decreased light attenuation in cerebral cortex during cerebral edema detected. . .
Downloaded From: http://neurophotonics.spiedigitallibrary.org/ on 11/03/2014 Terms of Use: http://spiedl.org/terms

these two profiles as a function of depth is shown of the righty-axis and resulted in an average percent difference of −12%.
The rate of change of the attenuation coefficient was calcu-lated for the baseline (defined as the first 20 min of the edemaexperiment) and for edema (postIP injection) by fitting the datausing linear regression (Fig. 6). These rates of change were alsocompared with the control experiments. A t-distribution test wasperformed to compare the rates of change. Statistical analysisidentified that the rate of change during edema was statisticallysignificant (p < 0.05) from both the control (p ¼ 0.0148) andthe baseline (p ¼ 0.0135). As expected, the rate of the change
in the attenuation coefficient during the control was notstatistically different from baseline. These results indicate thatthe progression of edema can be identified by measuring arate of change in the attenuation coefficient.
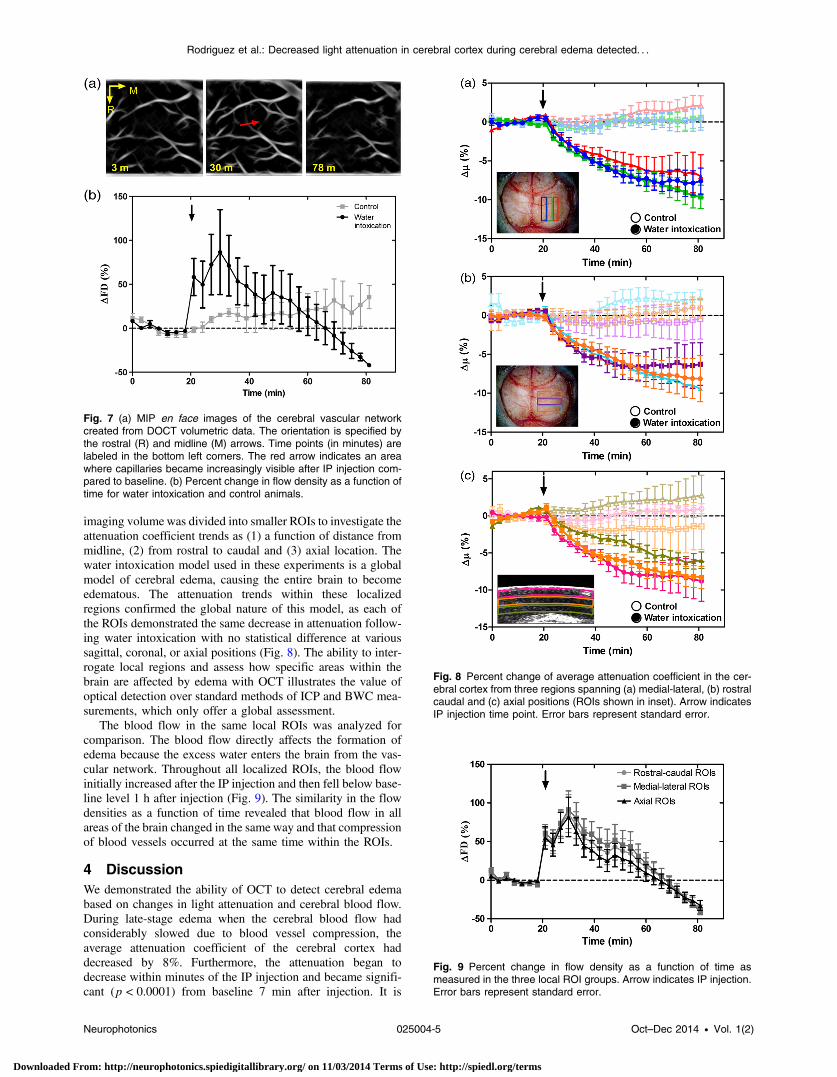
Consistent with previous reports using this mouse model, theseverity of cerebral edema monotonically increased over time.6
Analysis of the cerebral blood flow confirmed that flow decreasednear the end of the experiment before the animal expired (Fig. 7).The flow initially increased quickly after the IP injection wasadministered, presumably due to the injection itself increasing cir-culating blood volume, and small capillaries became increasinglyvisible. After approximately 45 min postIP injection, the flowbegan to slow; at the end of the experiment minimal flow wasvisible in the MIP images (Fig. 7). The decrease in flow is con-sistent with the Monro-Kellie doctrine, which states that the cer-ebral blood volume decreases to compensate for an increase inbrain volume.19 Using DOCT, we are able to detect when thisvolume compensation process is occurring.
3.2 Local Attenuation Coefficient Trends
The spatial specificity afforded by volumetric OCT data allowedfor the optical properties of local regions to be interrogated. The
Fig. 3 Percent change of average attenuation coefficient in thecerebral cortex over time from in vivo cerebral edema mouse model.Arrow indicates IP water injection for water intoxication group. Errorbars represent standard error for n ¼ 3.
Fig. 4 BWC measurements of right cerebral cortex quadrant. Errorbars represent standard error.
Fig. 5 Attenuation depth profile from a small region of cerebral cortex.The gray line represents the values during baseline and the black linerepresents the same depth profile after water intoxication. The percentdifference between the two profiles is shown by the red dotted line onthe right y -axis. The average percent difference over the entire depthis −12%.
Fig. 6 Rate of change in average attenuation coefficient during base-line, edema (postIP injection) and control experiments. Error barsrepresent the standard error.
Neurophotonics 025004-4 Oct–Dec 2014 • Vol. 1(2)
Rodriguez et al.: Decreased light attenuation in cerebral cortex during cerebral edema detected. . .
Downloaded From: http://neurophotonics.spiedigitallibrary.org/ on 11/03/2014 Terms of Use: http://spiedl.org/terms
imaging volumewas divided into smaller ROIs to investigate theattenuation coefficient trends as (1) a function of distance frommidline, (2) from rostral to caudal and (3) axial location. Thewater intoxication model used in these experiments is a globalmodel of cerebral edema, causing the entire brain to becomeedematous. The attenuation trends within these localizedregions confirmed the global nature of this model, as each ofthe ROIs demonstrated the same decrease in attenuation follow-ing water intoxication with no statistical difference at varioussagittal, coronal, or axial positions (Fig. 8). The ability to inter-rogate local regions and assess how specific areas within thebrain are affected by edema with OCT illustrates the value ofoptical detection over standard methods of ICP and BWC mea-surements, which only offer a global assessment.
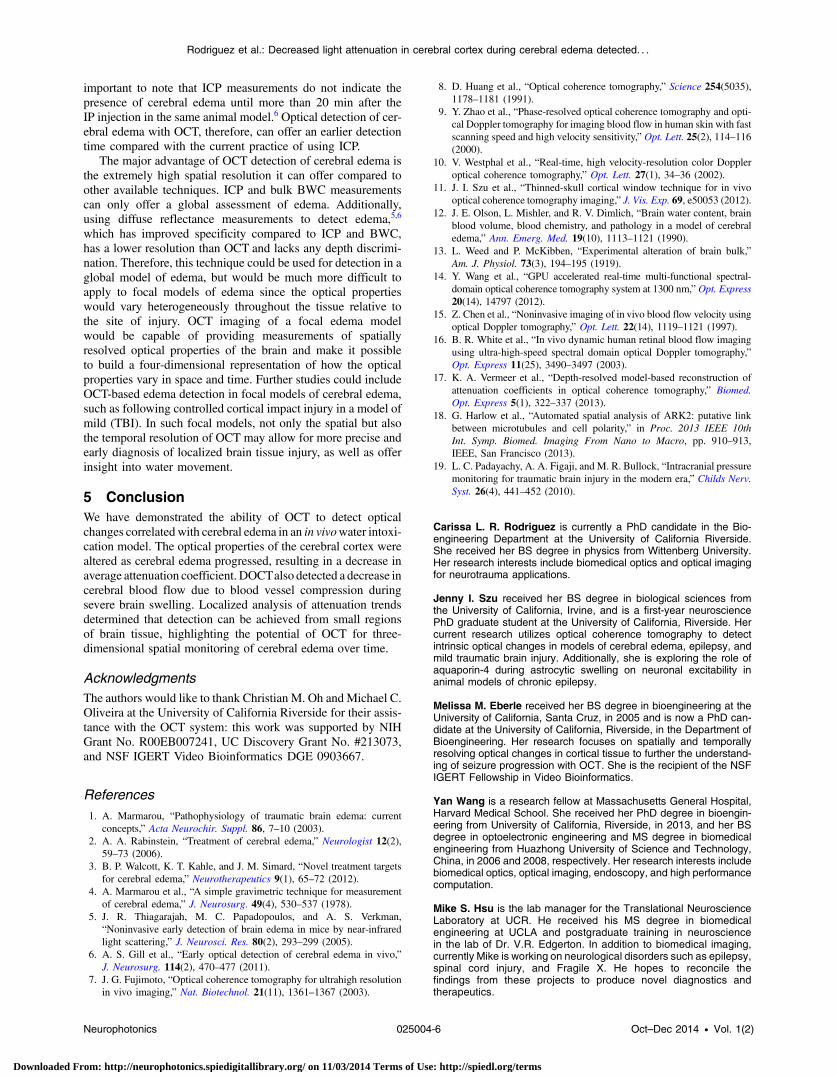
The blood flow in the same local ROIs was analyzed forcomparison. The blood flow directly affects the formation ofedema because the excess water enters the brain from the vas-cular network. Throughout all localized ROIs, the blood flowinitially increased after the IP injection and then fell below base-line level 1 h after injection (Fig. 9). The similarity in the flowdensities as a function of time revealed that blood flow in allareas of the brain changed in the same way and that compressionof blood vessels occurred at the same time within the ROIs.
4 DiscussionWe demonstrated the ability of OCT to detect cerebral edemabased on changes in light attenuation and cerebral blood flow.During late-stage edema when the cerebral blood flow hadconsiderably slowed due to blood vessel compression, theaverage attenuation coefficient of the cerebral cortex haddecreased by 8%. Furthermore, the attenuation began todecrease within minutes of the IP injection and became signifi-cant (p < 0.0001) from baseline 7 min after injection. It is
Fig. 7 (a) MIP en face images of the cerebral vascular networkcreated from DOCT volumetric data. The orientation is specified bythe rostral (R) and midline (M) arrows. Time points (in minutes) arelabeled in the bottom left corners. The red arrow indicates an areawhere capillaries became increasingly visible after IP injection com-pared to baseline. (b) Percent change in flow density as a function oftime for water intoxication and control animals.
Fig. 8 Percent change of average attenuation coefficient in the cer-ebral cortex from three regions spanning (a) medial-lateral, (b) rostralcaudal and (c) axial positions (ROIs shown in inset). Arrow indicatesIP injection time point. Error bars represent standard error.
Fig. 9 Percent change in flow density as a function of time asmeasured in the three local ROI groups. Arrow indicates IP injection.Error bars represent standard error.
Neurophotonics 025004-5 Oct–Dec 2014 • Vol. 1(2)
Rodriguez et al.: Decreased light attenuation in cerebral cortex during cerebral edema detected. . .
Downloaded From: http://neurophotonics.spiedigitallibrary.org/ on 11/03/2014 Terms of Use: http://spiedl.org/terms
important to note that ICP measurements do not indicate thepresence of cerebral edema until more than 20 min after theIP injection in the same animal model.6 Optical detection of cer-ebral edema with OCT, therefore, can offer an earlier detectiontime compared with the current practice of using ICP.
The major advantage of OCT detection of cerebral edema isthe extremely high spatial resolution it can offer compared toother available techniques. ICP and bulk BWC measurementscan only offer a global assessment of edema. Additionally,using diffuse reflectance measurements to detect edema,5,6
which has improved specificity compared to ICP and BWC,has a lower resolution than OCT and lacks any depth discrimi-nation. Therefore, this technique could be used for detection in aglobal model of edema, but would be much more difficult toapply to focal models of edema since the optical propertieswould vary heterogeneously throughout the tissue relative tothe site of injury. OCT imaging of a focal edema modelwould be capable of providing measurements of spatiallyresolved optical properties of the brain and make it possibleto build a four-dimensional representation of how the opticalproperties vary in space and time. Further studies could includeOCT-based edema detection in focal models of cerebral edema,such as following controlled cortical impact injury in a model ofmild (TBI). In such focal models, not only the spatial but alsothe temporal resolution of OCT may allow for more precise andearly diagnosis of localized brain tissue injury, as well as offerinsight into water movement.
5 ConclusionWe have demonstrated the ability of OCT to detect opticalchanges correlated with cerebral edema in an in vivowater intoxi-cation model. The optical properties of the cerebral cortex werealtered as cerebral edema progressed, resulting in a decrease inaverage attenuation coefficient. DOCTalso detected a decrease incerebral blood flow due to blood vessel compression duringsevere brain swelling. Localized analysis of attenuation trendsdetermined that detection can be achieved from small regionsof brain tissue, highlighting the potential of OCT for three-dimensional spatial monitoring of cerebral edema over time.
AcknowledgmentsThe authors would like to thank Christian M. Oh andMichael C.Oliveira at the University of California Riverside for their assis-tance with the OCT system: this work was supported by NIHGrant No. R00EB007241, UC Discovery Grant No. #213073,and NSF IGERT Video Bioinformatics DGE 0903667.
References1. A. Marmarou, “Pathophysiology of traumatic brain edema: current
concepts,” Acta Neurochir. Suppl. 86, 7–10 (2003).2. A. A. Rabinstein, “Treatment of cerebral edema,” Neurologist 12(2),
59–73 (2006).3. B. P. Walcott, K. T. Kahle, and J. M. Simard, “Novel treatment targets
for cerebral edema,” Neurotherapeutics 9(1), 65–72 (2012).4. A. Marmarou et al., “A simple gravimetric technique for measurement
of cerebral edema,” J. Neurosurg. 49(4), 530–537 (1978).5. J. R. Thiagarajah, M. C. Papadopoulos, and A. S. Verkman,
“Noninvasive early detection of brain edema in mice by near-infraredlight scattering,” J. Neurosci. Res. 80(2), 293–299 (2005).
6. A. S. Gill et al., “Early optical detection of cerebral edema in vivo,”J. Neurosurg. 114(2), 470–477 (2011).
7. J. G. Fujimoto, “Optical coherence tomography for ultrahigh resolutionin vivo imaging,” Nat. Biotechnol. 21(11), 1361–1367 (2003).
8. D. Huang et al., “Optical coherence tomography,” Science 254(5035),1178–1181 (1991).
9. Y. Zhao et al., “Phase-resolved optical coherence tomography and opti-cal Doppler tomography for imaging blood flow in human skin with fastscanning speed and high velocity sensitivity,” Opt. Lett. 25(2), 114–116(2000).
10. V. Westphal et al., “Real-time, high velocity-resolution color Doppleroptical coherence tomography,” Opt. Lett. 27(1), 34–36 (2002).
11. J. I. Szu et al., “Thinned-skull cortical window technique for in vivooptical coherence tomography imaging,” J. Vis. Exp. 69, e50053 (2012).
12. J. E. Olson, L. Mishler, and R. V. Dimlich, “Brain water content, brainblood volume, blood chemistry, and pathology in a model of cerebraledema,” Ann. Emerg. Med. 19(10), 1113–1121 (1990).
13. L. Weed and P. McKibben, “Experimental alteration of brain bulk,”Am. J. Physiol. 73(3), 194–195 (1919).
14. Y. Wang et al., “GPU accelerated real-time multi-functional spectral-domain optical coherence tomography system at 1300 nm,” Opt. Express20(14), 14797 (2012).
15. Z. Chen et al., “Noninvasive imaging of in vivo blood flow velocity usingoptical Doppler tomography,” Opt. Lett. 22(14), 1119–1121 (1997).
16. B. R. White et al., “In vivo dynamic human retinal blood flow imagingusing ultra-high-speed spectral domain optical Doppler tomography,”Opt. Express 11(25), 3490–3497 (2003).
17. K. A. Vermeer et al., “Depth-resolved model-based reconstruction ofattenuation coefficients in optical coherence tomography,” Biomed.Opt. Express 5(1), 322–337 (2013).
18. G. Harlow et al., “Automated spatial analysis of ARK2: putative linkbetween microtubules and cell polarity,” in Proc. 2013 IEEE 10thInt. Symp. Biomed. Imaging From Nano to Macro, pp. 910–913,IEEE, San Francisco (2013).
19. L. C. Padayachy, A. A. Figaji, and M. R. Bullock, “Intracranial pressuremonitoring for traumatic brain injury in the modern era,” Childs Nerv.Syst. 26(4), 441–452 (2010).
Carissa L. R. Rodriguez is currently a PhD candidate in the Bio-engineering Department at the University of California Riverside.She received her BS degree in physics from Wittenberg University.Her research interests include biomedical optics and optical imagingfor neurotrauma applications.
Jenny I. Szu received her BS degree in biological sciences fromthe University of California, Irvine, and is a first-year neurosciencePhD graduate student at the University of California, Riverside. Hercurrent research utilizes optical coherence tomography to detectintrinsic optical changes in models of cerebral edema, epilepsy, andmild traumatic brain injury. Additionally, she is exploring the role ofaquaporin-4 during astrocytic swelling on neuronal excitability inanimal models of chronic epilepsy.
Melissa M. Eberle received her BS degree in bioengineering at theUniversity of California, Santa Cruz, in 2005 and is now a PhD can-didate at the University of California, Riverside, in the Department ofBioengineering. Her research focuses on spatially and temporallyresolving optical changes in cortical tissue to further the understand-ing of seizure progression with OCT. She is the recipient of the NSFIGERT Fellowship in Video Bioinformatics.
Yan Wang is a research fellow at Massachusetts General Hospital,Harvard Medical School. She received her PhD degree in bioengin-eering from University of California, Riverside, in 2013, and her BSdegree in optoelectronic engineering and MS degree in biomedicalengineering from Huazhong University of Science and Technology,China, in 2006 and 2008, respectively. Her research interests includebiomedical optics, optical imaging, endoscopy, and high performancecomputation.
Mike S. Hsu is the lab manager for the Translational NeuroscienceLaboratory at UCR. He received his MS degree in biomedicalengineering at UCLA and postgraduate training in neurosciencein the lab of Dr. V.R. Edgerton. In addition to biomedical imaging,currently Mike is working on neurological disorders such as epilepsy,spinal cord injury, and Fragile X. He hopes to reconcile thefindings from these projects to produce novel diagnostics andtherapeutics.
Neurophotonics 025004-6 Oct–Dec 2014 • Vol. 1(2)
Rodriguez et al.: Decreased light attenuation in cerebral cortex during cerebral edema detected. . .
Downloaded From: http://neurophotonics.spiedigitallibrary.org/ on 11/03/2014 Terms of Use: http://spiedl.org/terms

Devin K. Binder attended Harvard University as an undergraduate,where he studied biology, anthropology, and neuroscience. Hereceived his MD and PhD degrees from Duke University in 1999and subsequently completed a surgical internship and neurosurgeryresidency at the University of California, San Francisco. In 2010,he joined the Division of Biomedical Sciences at the University ofCalifornia, Riverside, where he runs the Translational NeuroscienceLaboratory.
B. Hyle Park received his BS in physics from Caltech in 1996.He began his graduate research at the Beckman Laser Institute atUC Irvine, receiving his MS in 2001 before completing his PhD atthe Wellman Center for Photomedicine (Massachusetts GeneralHospital /Harvard Medical School) in 2005. He continued at Wellmanas a postdoctoral fellow and instructor until moving to UC Riverside in2009. His research focuses on OCT development for neuroscienceapplications.
Neurophotonics 025004-7 Oct–Dec 2014 • Vol. 1(2)
Rodriguez et al.: Decreased light attenuation in cerebral cortex during cerebral edema detected. . .
Downloaded From: http://neurophotonics.spiedigitallibrary.org/ on 11/03/2014 Terms of Use: http://spiedl.org/terms