FANTASPORTO FILM FESTIVAL | 2015 | DAILY PROGRAM FROM THE 24th FEB. till MARCH 8th

Date: 24th Feb 2020

2
Page
Equity Research Pick of the Week – Retail Research
Turnaround in operations in Q3FY20 generates confidence
for the future
Reputed promoters and experienced management team
Strong client base, strategic alliances to expand its business
Birlasoft Ltd
INDUSTRY
CMP
RECOMMEND ed
ADD ON DIPS TO
SEQUENTIAL TARGETS
TIME HORIZON ed
IT Consulting and Software
Rs 98.60
Buy in 96-100 band and add on dips
Rs 82-86
Rs 113- 125 Rs 77
4 quarters
Investors may sell 60-65% of their holdings on first target being achieved and later keep a stop loss of first target for the balance holdings, in case the second target takes time to be achieved.
Investors may also maintain Rs 77 as level below which investment position needs to be reviewed, including the possibility to exit
Deal with Invacare to bring revenue visibility
Sound Financial Profile

3
Page
Equity Research Pick of the Week – Retail Research
HDFC Scrip Code BIRSOFEQNR
BSE Code 532400
NSE Code BSOFT
Bloomberg BSOFT IN
CMP Feb 20, 2020 98.6
Equity Capital (cr) 54.9
Face Value (Rs) 2.0
Eq- Share O/S(cr) 27.4
Market Cap(Rs cr) 75446.6
Book Value (Rs) 62.5
Avg.52 Wk Volume 1157021
52 Week High 117.7
52 Week Low 57.4
Shareholding Pattern % (Dec 31, 2019)
Promoters 40.8
Institutions 35.4
Non Institutions 23.8
Total 100.0
Investment rationale: • Turnaround in operations in Q3FY20 generates confidence for the future • Reputed promoters and experienced management team • Strong client base, strategic alliances to expand its business • Deal with Invacare to bring revenue visibility • Sound fundamentals led by robust debt metrics, healthy liquidity and attractive dividend yield
Concerns: • Competition and global slowdown risks • Almost half of its revenue comes from top-15 customers and geographical concentration in revenue • Currency fluctuation risks • Strict US immigration norms
Company profile: Birlasoft (Erstwhile Birlasoft India Ltd) is a CK Birla Group company, incorporated in the year 1995. Birlasoft is a global IT solutions and services provider, across USA, Europe and APAC region. Birlasoft provides services in the areas of software development, Product life cycle management, package implementation, digital transformation, application management and testing. Company leverages its domain knowledge in the areas of banking, financial services, manufacturing, healthcare and ERP implementation. As on Dec 31, 2019, Company has 381 active clients and 10,129 employees. Top-5 clients contribute 28% revenue.
View and valuation: Birlasoft has an established position in the BFSI, Hi-tech & media, energy and utilities and life sciences. It also has a well-established client base, which includes large global organizations. Birlasoft has long track record in IT consulting business, reputed client base and alliances to drive business growth. Higher utilization, pyramid rationalization and cost optimization could help to report strong revenue and profitability growth going forward. Large deal flows and cross selling could provide revenue visibility for the next few years. Recent improvement in margins look sustainable. Turnaround in operations look sustainable. Birlasoft has been working towards enhancing its portfolio of cloud-based technologies to reimagine digital transformation and help raise Enterprises to the Power of Digital. Going forward, the ability of the company to maintain its scale of operations in a highly competitive industry scenario without adversely impacting its profitability margins would be crucial to monitor. We feel at these valuations investors have margin of safety to take that bet. We feel investors could buy the stock in the Rs.96-100 band and add on dips to Rs 82-86 band (6.75x FY22E EPS) for sequential targets of Rs 113 (9.0x FY22E EPS) and Rs 125 (10.0x FY22E EPS) in 4 quarters. At CMP of Rs 98.6 the stock quotes at 7.9x FY22E EPS.
FUNDAMENTAL ANALYST
Abdul Karim
4
Page
Equity Research Pick of the Week – Retail Research
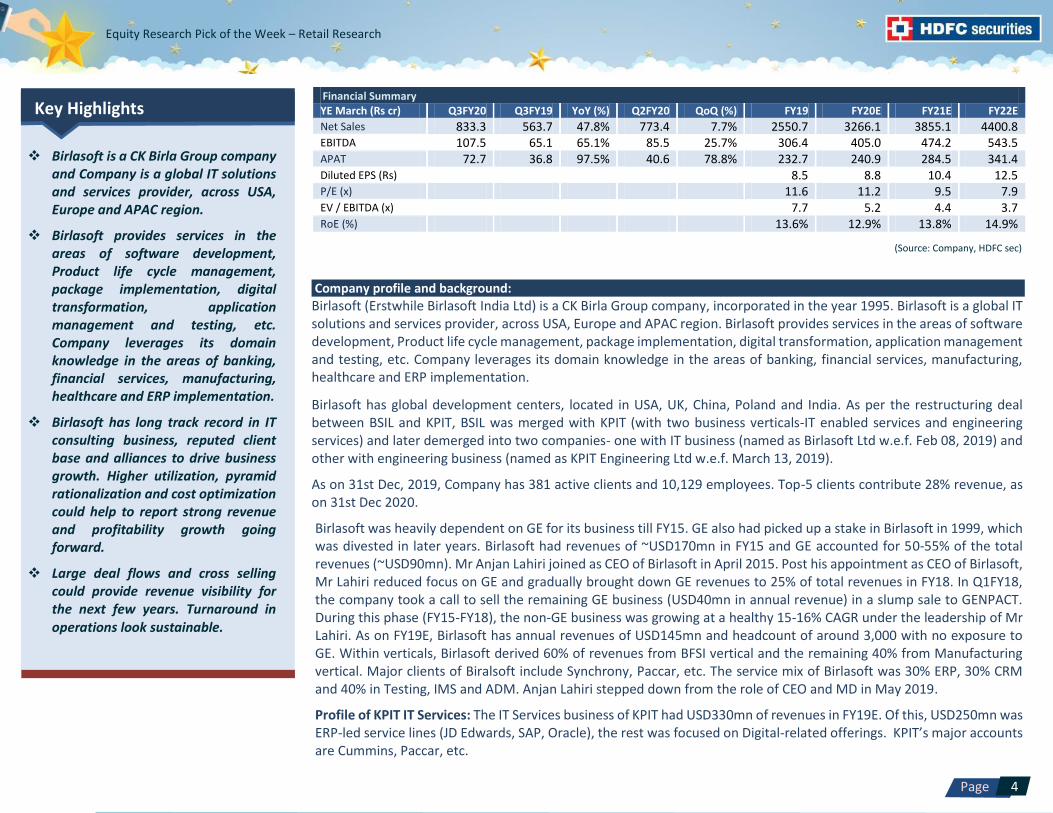
Financial Summary YE March (Rs cr) Q3FY20 Q3FY19 YoY (%) Q2FY20 QoQ (%) FY19 FY20E FY21E FY22E
Net Sales 833.3 563.7 47.8% 773.4 7.7% 2550.7 3266.1 3855.1 4400.8 EBITDA 107.5 65.1 65.1% 85.5 25.7% 306.4 405.0 474.2 543.5 APAT 72.7 36.8 97.5% 40.6 78.8% 232.7 240.9 284.5 341.4 Diluted EPS (Rs) 8.5 8.8 10.4 12.5 P/E (x) 11.6 11.2 9.5 7.9 EV / EBITDA (x) 7.7 5.2 4.4 3.7 RoE (%) 13.6% 12.9% 13.8% 14.9%
Key Highlights
Birlasoft is a CK Birla Group company and Company is a global IT solutions and services provider, across USA, Europe and APAC region.
Birlasoft provides services in the areas of software development, Product life cycle management, package implementation, digital transformation, application management and testing, etc. Company leverages its domain knowledge in the areas of banking, financial services, manufacturing, healthcare and ERP implementation.
Birlasoft has long track record in IT consulting business, reputed client base and alliances to drive business growth. Higher utilization, pyramid rationalization and cost optimization could help to report strong revenue and profitability growth going forward.
Large deal flows and cross selling could provide revenue visibility for the next few years. Turnaround in operations look sustainable.
(Source: Company, HDFC sec)
Company profile and background:
Birlasoft (Erstwhile Birlasoft India Ltd) is a CK Birla Group company, incorporated in the year 1995. Birlasoft is a global IT solutions and services provider, across USA, Europe and APAC region. Birlasoft provides services in the areas of software development, Product life cycle management, package implementation, digital transformation, application management and testing, etc. Company leverages its domain knowledge in the areas of banking, financial services, manufacturing, healthcare and ERP implementation.
Birlasoft has global development centers, located in USA, UK, China, Poland and India. As per the restructuring deal between BSIL and KPIT, BSIL was merged with KPIT (with two business verticals-IT enabled services and engineering services) and later demerged into two companies- one with IT business (named as Birlasoft Ltd w.e.f. Feb 08, 2019) and other with engineering business (named as KPIT Engineering Ltd w.e.f. March 13, 2019).
As on 31st Dec, 2019, Company has 381 active clients and 10,129 employees. Top-5 clients contribute 28% revenue, as on 31st Dec 2020.
Birlasoft was heavily dependent on GE for its business till FY15. GE also had picked up a stake in Birlasoft in 1999, which was divested in later years. Birlasoft had revenues of ~USD170mn in FY15 and GE accounted for 50-55% of the total revenues (~USD90mn). Mr Anjan Lahiri joined as CEO of Birlasoft in April 2015. Post his appointment as CEO of Birlasoft, Mr Lahiri reduced focus on GE and gradually brought down GE revenues to 25% of total revenues in FY18. In Q1FY18, the company took a call to sell the remaining GE business (USD40mn in annual revenue) in a slump sale to GENPACT. During this phase (FY15-FY18), the non-GE business was growing at a healthy 15-16% CAGR under the leadership of Mr Lahiri. As on FY19E, Birlasoft has annual revenues of USD145mn and headcount of around 3,000 with no exposure to GE. Within verticals, Birlasoft derived 60% of revenues from BFSI vertical and the remaining 40% from Manufacturing vertical. Major clients of Biralsoft include Synchrony, Paccar, etc. The service mix of Birlasoft was 30% ERP, 30% CRM and 40% in Testing, IMS and ADM. Anjan Lahiri stepped down from the role of CEO and MD in May 2019.
Profile of KPIT IT Services: The IT Services business of KPIT had USD330mn of revenues in FY19E. Of this, USD250mn was ERP-led service lines (JD Edwards, SAP, Oracle), the rest was focused on Digital-related offerings. KPIT’s major accounts are Cummins, Paccar, etc.

5
Page
Equity Research Pick of the Week – Retail Research
Post the merger in January 2019, the new combined entity has revenues of USD475mn in FY19 and EBITDA margin of 13%. There was limited overlap in clients and service offerings. While FY20E would be a year of transition and integration, the combined entity can pivot in FY21E, according to management.
Shareholding structure: The new entity Birlasoft has 275mn shares (KPIT shareholders own 197mn shares and Birlasoft promoters have 78mn shares). In the combined entity, Birlasoft promoters have 28% and the KPIT promoter group has 13% ownership. This 13% stake has to be bought back by Birlasoft promoters over three years through creeping acquisitions. Subsidiaries: As on March 31, 2019, the Company had 15 subsidiaries, including step-down subsidiaries CK Birla group companies The CK Birla Group is a growing US $2.3 billion conglomerate that has a history of enduring relationships with renowned global companies. With over 25,000 employees, 41 manufacturing facilities, 21 service delivery locations and numerous patents and awards, the Group’s businesses are present across five continents. The Group operates in three industry clusters: technology & automotive, home & building, and healthcare & education.
Business Overview
S
ERV
ICES
DIGITAL
Data Analytics
Connected Products
Intelligent Automation
Cloud
Transformation
Blockchain
ENTERPRISE TECHNOLOGIES AND SERVICES
Oracle and JD Edwards
SAP
Infor
Microsoft
Customer Relationship Management
Manufacturing Execution Systems
Product Lifecycle Management
Supply Chain Management
APPLICATION AND INFRASTRUCTURE
IT Transformation
Applications Management
Testing
Infrastructure & Cloud Technology
(Source: Company, HDFC sec)
SOLU
TIO
NS
TruView™ CLM
TruServ FSM
TruLens
intelliAsset™
iLink™
TruMusic
Producer Workspace
Marketing Cloud
Akoya
ZeROTechDebt
IND
UST
RIE
S F
OR
Automotive
Banking
High Tech
Manufacturing
Capital Markets
Insurance
Media & Entertainment
Energy & Resources
Life Sciences & Healthcare
Utilities

6
Page
Equity Research Pick of the Week – Retail Research Revenue Mix-% Revenue by Geographies (Q3FY20)-% Revenue by Industry Verticals (Q3FY20)-%
Service Offerings (Q3FY20)-% Contract Type (Q3FY20)-%
(Source: Company, HDFC sec)
(Source: Company, HDFC sec)

7
Page
Equity Research Pick of the Week – Retail Research
Onsite and Offshore Mix (Q3FY20)-%
Industry Overview • India's IT industry contributes around ~8% to the country's GDP. The industry added around 1,05,000 jobs in FY18 and ~100,000 jobs in FY19. • The IT sector in India expanded at a CAGR of 10.71% to US$ 167bn in FY18 from US$ 74bn in FY10. It is estimated that the size of the industry could grow to US$ 350 billion by 2025. • Indian IT firms continue to move up the value chain by providing more end-to-end solutions and engaging more closely with clients. The drive towards digital technologies, internal cost optimisation to improve profitability continued in FY18. • The software industry has faced major disruption in traditional business model with the introduction of digital transformation technologies like artificial intelligence, internet of things (IoT), cloud computing, big data and so forth. • Technologies like Artificial Intelligence, Machine Learning, Cloud, Blockchain and many more technologies will continue to impact businesses in 2020 and will certainly become integral parts of companies’ plans to lead in the future. • Now, the Indian IT industry scaling up to the value chain offering more end-to-end solutions, digital revenues and government's scheme like Make in India, Start-Up India, and Digital India. • Momentum for electrification technologies is building among OEMs due to increasing regulatory pressure on emissions and declining battery prices: Scenarios for the share of EV cars in 2025 range from 8-20% in the US, 20-32% in Europe and 29-47% in China.
(Source: Company, HDFC sec)

8
Page
Equity Research Pick of the Week – Retail Research
Investment Rationale Turnaround in operations in Q3FY20 generates confidence for the future. Due to harmonization and integration of the two businesses, the results of BSIL for Q1FY20 and Q2FY20 were below par. It had to spend a lot of time and efforts in unifying the processes, policies and systems. Birlasoft had to take a reversal of revenues of $1.2 mn in Q1FY20.
In Q2, BSIL had an issue of delayed start of Invacare engagement. In Q3, most of the issues were sorted out; in the quarter, the SAP business showed stability and growth for the first time since merger, margins improved, deal wins improved ($278 mn), attrition reduced, annuity revenue improved as a percent of revenues to 58%. It managed to reduce DSO (Debtor Sales Outstanding) from 81 days to 65 days.
The company is focusing a lot on cross sell of its services to its combined existing customers and has achieved some success so far.
With the transition and integration period coming to an end, FY21 could bring in better performance from BSIL. The merger will fuel innovation and provide substantial benefits to the customers and partners, as it combines domain, enterprise and digital technologies to deliver transformative solutions. Now as a result of this merger, BSIL has significant enterprise digital capability in automotive, banking (BFSI), communications, consumer packaged goods, energy, life sciences and manufacturing. Reputed promoters and experienced management Birlasoft is a C.K Birla group company which has diversified business interest in various industry segments including cement, auto components, precision bearing, paper, building materials, Information Technology Enabled Services (ITeS), consumer durables, and heavy engineering equipment. BSIL has been promoted by National Engineering Industries Ltd and the group owns 40.8% stake in the company, as on 31st Dec, 2019. The pledge on promoters’ stake was revoked and from Sept 2019 onwards the promoters’ shares do not carry any pledge.
The company is led by Mrs Amita Birla who is the current chairman of the company and is assisted by a team of qualified professionals headed by Mr. Dharmander Kapoor, MD & CEO. He has 30 years of experience in Leadership, Go-to-market Business Development, Enterprise IT delivery, Consulting/Transformation and Software Product Engineering.
Shreeranganath Kulkarni joined BSIL in Q1 as Chief delivery officer. Earlier he was with Accenture, Infosys and Cognizant. Anjan Sen from Cognizant has joined BSIL as SAP delivery head in US. Roop Singh has been induced as the Chief Business officer based out of New Jersey. He was previously with IBM and Wipro.
However, Mr Rajeev Gupta its CFO has quit from his post on 3rd Jan, 2020 and will be relieved from his duties by end of March, 2020.
Strong client base, strategic alliances to expand its business Birlasoft has 381 active clients across multiple segments, as on 31st Dec, 2019 and these reputed and diversified clients come across various industry verticals ranging from Hitech & Media; BFSI; Energy & Utilities; CPG, Retail & Process Manufacturing, Life science and Automotive. Top 10 clients and Top 20 clients of the company contributes around 38% and 51% of its total revenue.
Birlasoft has overseas branches in Singapore, Australia, Sweden, Switzerland, Canada, Dubai and The Czech Republic. BSIL has a reputed set of clients like Bank of Montreal, Depositary Trust & Clearing Corp (DTCC) USA, Tokyo Marine, Xerox Corporation, American Express, Credit Suisse, Pricewater House Coopers etc. BSIL has entered into strategic alliances with various business partners to widen the gamut of their service offerings.
Birlasoft has strategic alliances with companies like HP, IBM, Microsoft, Oracle and SAP for various services. Company has a well-established client base, including companies such as Cummins Inc, Unilever, and Hewlett-Packard, which have been associated with the group for over five years. The company is also focusing on the digital business as there is sufficient growth prospect in the vertical.

9
Page
Equity Research Pick of the Week – Retail Research Deal with Invacare to bring revenue visibility On 14th Oct, 2019, Birlasoft has signed a deal worth US$ 242 million with Invacare Corporation to deliver IT‐as‐a‐ Service for 10 years. Invacare Corporation is leading manufacturer of wheelchairs, bariatric equipment, disability scooters, respiratory products and other homecare products.
In this deal, Birlasoft will accelerate Invacare’s business transformation by modernizing systems, taking responsibility for the provision of service desk, applications, server, network and telephony support. Further, it will build a new analytics platform and move the Invacare data centre to the cloud. Besides, the company will implement a new Product Lifecycle Management system and Invacare customers will benefit from a new ecommerce portal to access products, spares and supplies.
Birlasoft will support Invacare in global implementation of SAP S/4HANA and associated SAP solutions, harmonizing business processes and information flows worldwide. New systems and processes will help drive innovation and operational excellence, in compliance with regulations. Digital transformation in the industry could bring growth visibility going forward: Birlasoft is focused on the digital business as there is sufficient growth prospect in the vertical. Digital transformation supports organizations in mitigating risks and handling disruption such as marketplace fluctuation, corporate restructuring, and geopolitical environment that are unanticipated, and could lead to unpredictable results. Furthermore, shifting from traditional to new digitalized business models facilitates the introduction of more technologically advanced products and services. U.S. digital transformation market, by solution, 2014 - 2025 (USD Bn)
Digital transformation holds the potential to streamline and integrate all business operations for increasing the business performance efficiency. It helps organizations in streamlining their operations to save time, efforts, and money by replacing traditional processes with automation, thus lowering the rate of errors by users.
Digital transformation supports organizations in improving their brand’s reputation, customer experience, and customer retention ratios through the implementation of software.
For Birlasoft, Digital transformation accounts for 27.7% of sales in Q3FY20.

10
Page
Equity Research Pick of the Week – Retail Research Sound fundamentals led by robust debt metrics, healthy liquidity and attractive dividend yield Birlasoft’s fundamentals are strong, supported by moderate gearing, robust debt protection metrics, and healthy liquidity. Net cash accrual to total debt and interest coverage ratios, at 1.03 times and ~30 times, respectively, in FY19, reflect healthy debt protection metrics. The company has strong liquidity, net Cash and Cash Equivalent of Rs 673.7cr ($ 94.6mn) as on 31st Dec 2019. Further, company is generating healthy accruals and doesn’t have any major capex plans which also aids the liquidity profile of the company. Capital Structure of the company is comfortable characterized by strong net-worth base and zero debt, as on Dec 31, 2019. Current ratio of the company also remains comfortable at 2.9x as on 31st Dec, 2019 (2.7x as on Sep 30, 2019). Operating performance could gradually improve in the medium term with better absorption of employee costs and moderate revenue growth in the coming quarters. Liquidity is expected to remain robust, along with reduction of long-term debt, over the medium term).
Concerns Competition The business environment for the IT industry remains challenging. Indian IT players will need to scale up their operations, primarily due to intense competition among themselves and from multinational corporations that are expanding their offshore operations in India. Other key success factors include acquiring and retaining new customers, maintaining an efficient cost structure, and ensuring effective labour retention and utilisation. The company faces stiff competition from well-established IT companies like I-Gate, Genpact, Tech Mahindra, TCS and Polaris which compete in the same segment. The strategic alliances and intellectual property has enabled the company to build repute and gain customer confidence for service delivery.
Almost half of its revenue comes from top-15 customers and geographical concentration in revenue Birlasoft has a well-established client base, it derived around 51% of revenue from its top 15 customers in Q3FY20. The US market contributed 79.6% of revenue in Q3FY20. Although geographical diversity mitigates business risk, this skew in revenue is unavoidable, as the US is the largest global IT spender.
Currency fluctuation risk The company is exposed to foreign currency fluctuation risk as the company is primarily an export oriented unit with majority (more than 95%) of its revenues being generated from exports. However, the company manages its foreign currency risk for forecasted sales by hedging transactions that are expected to occur within a maximum 12 month period by using foreign currency forward contracts. Strict US immigration norms Protectionist measures as well as strict immigration and visa norms adopted by the US remain yet another business challenge for Indian IT companies. However, players are likely to effectively counter challenges backed by the Indian IT industry's inherent strengths.
Q3FY20 results review Birlasoft reported better earning performance in Q3FY20, revenue was up by 6.6% (QoQ) to US$ 116.8mn and up by 7.7% (QoQ) to Rs 833.3cr led by better order execution. EBIT grew 34.7% (QoQ) to Rs 87.4cr in Q3FY20. PAT grew 78.8% (QoQ) to Rs 73cr in Q3FY20. Company registered 390bps (QoQ) ramp up in EBIT Margin at 12.1% in Q3FY20. Board declared interim dividend of Rs. 1/- per share (Face Value Rs 2).

11
Page
Equity Research Pick of the Week – Retail Research
View and valuation Birlasoft has an established position in the BFSI, Hi-tech & media, energy and utilities and life sciences. It also has a well-established client base, which includes large global organizations. Birlasoft has long track record in IT consulting business, reputed client base and alliances to drive business growth. Higher utilization, pyramid rationalization and cost optimization could help to report strong revenue and profitability growth going forward. Large deal flows and cross selling could provide revenue visibility for the next few years. Recent improvement in margins look sustainable. Turnaround in operations look sustainable. Birlasoft has been working towards enhancing its portfolio of cloud-based technologies to reimagine digital transformation and help raise Enterprises to the Power of Digital. Going forward, the ability of the company to maintain its scale of operations in a highly competitive industry scenario without adversely impacting its profitability margins would be crucial to monitor. We feel at these valuations investors have margin of safety to take that bet. We feel investors could buy the stock in the Rs.96-100 band and add on dips to Rs 82-86 band (6.75x FY22E EPS) for sequential targets of Rs 113 (9.0x FY22E EPS) and Rs 125 (10.0x FY22E EPS) in 4 quarters. At CMP of Rs 98.6 the stock quotes at 7.9x FY22E EPS.
Particulars (Rs Cr) Q3FY20 Q3FY19 YoY (%) Q2FY20 QoQ (%)
Net Sales 833.3 563.7 47.8% 773.4 7.7%
Employee Expenses 498.8 340.8 46.3% 481.7 3.6%
Other Expenses 227.1 157.8 43.9% 206.2 10.1%
Total Expenditure 725.8 498.6 45.6% 687.9 5.5%
EBITDA 107.5 65.1 65.1% 85.5 25.7%
Depreciation and Amort- 20.1 10.2 97.3% 20.6 -2.6%
EBIT 87.4 54.9 59.1% 64.9 34.7%
Other Income 17.8 3.0 492.8% 2.9 521.1%
Finance Cost 4.0 2.8 46.9% 4.1 -1.1%
EBT 101.1 55.2 83.3% 63.7 58.9%
Tax 28.5 17.4 64.0% 23.0 23.6%
Reported PAT 72.7 37.8 92.1% 40.6 78.8%
Minority Interest After NP 0.0 1.0 -100.0% 0.0 -
PAT before EOI 72.7 36.8 97.5% 40.6 78.8%
Adjusted PAT 72.7 36.8 97.5% 40.6 78.8%
EPS (Adj) (Unit Curr.) 2.7 1.3 97.5% 1.5 78.8%
Quarterly Financials: Income Statement

12
Page
Equity Research Pick of the Week – Retail Research
Particulars Q3FY19 Q4FY19 Q1FY20 Q2FY20 Q3FY20
Revenue by Geography
America 79.0% 77.8% 76.3% 78.4% 79.6%
Europe 11.1% 12.1% 12.4% 11.0% 10.6%
Rest of the World 9.9% 10.1% 11.3% 10.5% 9.8%
Industry Verticals
Discrete Manuf, Hitech &Media 19.6% 19.4% 19.2% 19.8% 17.4%
BFSI 20.2% 20.2% 19.3% 19.9% 18.8%
Energy Utilities 18.9% 18.5% 18.1% 17.8% 18.3%
CPG, Retail & Process Mfg 15.2% 13.5% 14.3% 11.6% 12.4%
Life sciences 13.6% 15.2% 14.6% 16.9% 19.6%
Automotive 12.6% 13.1% 14.5% 14.1% 13.5%
Service Offerings
Integrated Enterprise Solution (IES) 31.1% 31.4% 33.0% 32.5% 32.6%
SAP 20.5% 20.4% 19.2% 16.8% 16.8%
Digital Transformation (DT) 30.0% 29.1% 28.6% 28.4% 27.7%
Custom Application Development 10.2% 10.9% 10.8% 13.0% 13.0%
Other horizontals 8.2% 8.2% 8.4% 8.4% 9.9%
Contact Type
Time & Materials 55.6% 57.0% 54.8% 58.0% 53.3%
Fixed 44.4% 43.0% 45.0% 42.0% 46.7%
Revenue Mix-%
Onsite 57.3% 56.9% 55.0% 54.7% 58.2%
Offshore 42.7% 43.1% 45.0% 45.3% 41.8%
Currency Mix-%
USD 78.5% 79.1% 77.1% 78.0% 78.2%
GBP 2.6% 2.6% 2.6% 2.8% 2.5%
Europe 6.2% 2.3% 6.8% 6.8% 6.3%
Others 12.7% 13.0% 13.5% 13.7% 13.0%
Particulars Q3FY19 Q4FY19 Q1FY20 Q2FY20 Q3FY20
No of Active Clients 400.0 401.0 398.0 381.0 381.0
No of Million Client (LTM)
US$ 1Mn+ Cleint 82.0 84.0 86.0 86.0 85.0
US$ 5Mn+ Cleint 16.0 16.0 16.0 16.0 15.0
US$ 10Mn+ Cleint 4.0 5.0 5.0 5.0 6.0
Client Contribution to revenue
Top -5 27.0% 26.4% 26.0% 27.1% 28.0%
Top - 10 36.8% 36.2% 36.5% 37.1% 38.4%
Top -15 49.7% 48.8% 49.0% 49.9% 50.8%
Operating Metrics
Client Metrics

13
Page
Equity Research Pick of the Week – Retail Research
Particulars Q3FY19 Q4FY19 Q1FY20 Q2FY20 Q3FY20
Employees 9953.0 10061.0 10085.0 9994.0 10129.0
-Technical 8906.0 9013.0 8884.0 8947.0 9046.0
-Sales and Support Team 1047.0 1048.0 1201.0 1047.0 1083.0
Women Employees 2159.0 2203.0 2257.0 2252.0 2240.0
Attrition 19.0% 19.9% 21.7% 22.5% 20.3%
DSO 84.0 79.0 81.0 81.0 65.0
Particulars, Rs in Cr FY18 FY19 FY20E FY21E FY22E
Net Sales 2249.8 2550.7 3266.1 3855.1 4400.8
Employee Expenses 1347.7 1535.2 1984.2 2338.1 2662.5
Other Expenses 618.7 709.1 876.9 1042.8 1194.8
Total Expenditure 1966.4 2244.3 2861.1 3381.0 3857.3
EBITDA 283.4 306.4 405.0 474.2 543.5
Depreciation and Amort- 40.2 49.9 82.3 81.8 80.8
EBIT 243.2 256.5 322.7 392.4 462.7
Other Income 23.9 26.1 32.7 28.9 33.0
Finance Cost 8.1 10.8 17.0 16.0 15.0
EBT 258.9 271.7 338.3 405.3 480.7
Tax 67.6 53.9 94.7 117.5 135.3
Reported PAT 191.3 217.8 243.6 287.8 345.4
Minority Interest After NP 0.2 2.7 2.7 3.3 4.0
PAT before EOI 191.1 215.1 240.9 284.5 341.4
Extra-ordinary Items 0.0 -17.6 0.0 0.0 0.0
Adjusted PAT 191.1 232.7 240.9 284.5 341.4
EPS (Adj) (Unit Curr.) 7.0 8.5 8.8 10.4 12.5
Particulars, Rs in Cr FY18 FY19 FY20E FY21E FY22E EBT 254.4 292.2 338.3 405.3 480.7 Depreciation and Amortization 84.3 105.5 82.3 81.8 80.8 Interest /Dividend paid 10.3 18.9 17.0 16.0 15.0 Other Adjustment 129.8 86.7 -6.1 -4.8 -12.9 (Inc)/Dec in working Capital -12.8 -537.0 81.9 -193.0 -166.7 Tax Paid -58.6 -37.9 -94.7 -117.5 -135.3 CF from Operating Activities 407.4 -71.6 418.7 187.7 261.6 Capital expenditure -115.9 -89.8 -70.0 -75.0 -75.0
Financials: Income Statement
Cash Flow
(Source: Company, HDFC sec)
Headcount Metrics

14
Page
Equity Research Pick of the Week – Retail Research
Proceeds from sale of fixed assets 0.2 0.1 0.1 0.9 1.1
(Purchase)/Sale of Investment -86.1 194.8 -9.5 -10.0 -10.5 Others 9.1 19.7 32.7 28.9 33.0 CF from Investing Activities -192.7 124.8 -46.8 -55.3 -51.5 Inc/(Dec) in Share capital 11.2 1.7 0.1 0.0 0.0 Inc/(Dec) in Debt -79.6 -44.6 -10.0 -5.0 -5.0 Dividend and Interest Paid -60.0 -73.2 -99.2 -114.7 -130.1 CF from Financing Activities -128.4 -116.2 -109.2 -119.7 -135.1 Net Cash Flow 86.4 -62.9 262.7 12.7 75.0 Opening Balance 292.7 379.1 355.1 617.9 630.6
Adjustment, Effect of exchange rate, 0.0 -39.0 0.0 0.0 0.0
Closing Balance 379.1 355.1 617.9 630.6 705.6
Particulars, Rs in cr FY18 FY19 FY20E FY21E FY22E EQUITY & LIABILITIES Share Capital 37.9 54.8 54.9 54.9 54.9 Reserves & Surplus 1779.0 1658.7 1817.4 2003.2 2229.5 Shareholders Fund 1816.9 1713.6 1872.3 2058.1 2284.3 Minority Interest 3.6 0.0 0.0 0.0 0.0 Long Term Borrowings 66.2 0.0 0.0 0.0 0.0 Deferred Tax Liabilities(Net) 0.0 0.0 0.0 0.0 0.0 Other Long Term Liabilities 15.6 5.9 6.5 7.1 7.8 Long Term Provisions 68.7 63.7 60.6 63.6 66.8 Total Non Current Liabilities 150.6 69.6 67.0 70.7 74.6 Short Term Borrowings 210.9 38.1 28.1 23.1 18.1 Trade Payables 158.7 214.8 223.7 253.5 277.3 Other Current Liabilities 355.1 444.1 390.8 351.7 316.5 Short Term Provisions 37.1 17.4 22.6 24.9 27.4 Total Current Liabilities 761.8 714.4 665.2 653.2 639.3 TOTAL EQUITY & LIABILITIES 2732.9 2497.6 2604.5 2782.0 2998.3 ASSETS
Fixed Assets(incl. Capital Work in Progress) 861.0 588.1 575.8 569.0 563.2
Non Current Investments 10.8 0.0 0.0 0.0 0.0 Deferred Tax Asset(Net) 94.4 143.3 137.5 116.9 99.4 Long Term Loans & Advances 17.6 10.0 12.0 14.4 17.3 Other Non Current Assets 92.0 82.7 78.6 74.6 70.9 Total Non Current Assets 1075.7 824.1 803.9 775.0 750.8 Current Investments 118.5 190.9 200.4 210.5 221.0 Inventories 23.9 0.0 0.0 0.0 0.0 Trade Receivables 805.7 710.8 626.4 792.2 928.4 Cash & Cash Equivalents 504.9 377.2 617.9 630.6 705.6
Balance Sheet

15
Page
Equity Research Pick of the Week – Retail Research
Short Term Loans & Advances 10.6 4.8 5.1 5.3 5.6 Other Current Assets 193.7 389.9 350.9 368.4 386.8 Total Current Assets 1657.2 1673.5 1800.6 2007.0 2247.5 TOTAL ASSETS 2732.9 2497.6 2604.5 2782.0 2998.3
Particulars, Rs in Cr FY18 FY19 FY20E FY21E FY22E
No of Equity Shares-cr 27.4 27.4 27.4 27.4 27.4
Enterprise Value-cr 2475.2 2364.0 2113.3 2095.6 2015.5
EPS 7.0 8.5 8.8 10.4 12.5
Cash EPS (PAT + Depreciation) 8.4 10.3 11.8 13.4 15.4
Book Value Per Share(Rs.) 66.3 62.5 68.3 75.1 83.3
Cash & Cash Equ Per Share 22.7 20.7 29.8 30.7 33.8
PE(x) 14.1 11.6 11.2 9.5 7.9
P/BV (x) 1.5 1.6 1.4 1.3 1.2
Mcap/Sales(x) 1.2 1.1 0.8 0.7 0.6
EV/EBITDA 8.7 7.7 5.2 4.4 3.7
EBITDAM (%) 12.6% 12.0% 12.4% 12.3% 12.4%
EBITM (%) 10.8% 10.1% 9.9% 10.2% 10.5%
PATM (%) 8.5% 9.1% 7.4% 7.4% 7.8%
ROCE (%) 12.8% 16.1% 18.7% 20.2% 21.5%
RONW (%) 10.5% 13.6% 12.9% 13.8% 14.9%
Div Payout-% 41.3% 28.3% 34.1% 34.7% 33.7%
Div Yield-% 2.4% 2.0% 2.5% 3.0% 3.5%
Current Ratio 2.2 2.3 2.7 3.1 3.5
Quick Ratio 2.1 2.3 2.7 3.1 3.5
Debt-Equity (x) 0.2 0.0 0.0 0.0 0.0
Key Ratios

16
Page
Equity Research Pick of the Week – Retail Research
One Year Daily Closing Price Chart
(Source: Company, HDFC sec)

17
Page
Equity Research Pick of the Week – Retail Research
Fundamental Research Analyst: Abdul Karim ([email protected])
Disclosure: I, Abdul Karim, MBA, authors and the names subscribed to this report, hereby certify that all of the views expressed in this research report accurately reflect our views about the subject issuer(s) or securities. HSL has no material adverse disciplinary history as on the date of publication of this report. We also certify that no part of our compensation was, is, or will be directly or indirectly related to the specific recommendation(s) or view(s) in this report. Research Analyst or his/her relative or HDFC Securities Ltd. does not have any financial interest in the subject company. Also Research Analyst or his relative or HDFC Securities Ltd. or its Associate does not have beneficial ownership of 1% or more in the subject company at the end of the month immediately preceding the date of publication of the Research Report. Further Research Analyst or his relative or HDFC Securities Ltd. or its associate does not have any material conflict of interest. Any holding in stock – No HDFC Securities Limited (HSL) is a SEBI Registered Research Analyst having registration no. INH000002475. Disclaimer: This report has been prepared by HDFC Securities Ltd and is meant for sole use by the recipient and not for circulation. The information and opinions contained herein have been compiled or arrived at, based upon information obtained in good faith from sources believed to be reliable. Such information has not been independently verified and no guaranty, representation of warranty, express or implied, is made as to its accuracy, completeness or correctness. All such information and opinions are subject to change without notice. This document is for information purposes only. Descriptions of any company or companies or their securities mentioned herein are not intended to be complete and this document is not, and should not be construed as an offer or solicitation of an offer, to buy or sell any securities or other financial instruments.
This report is not directed to, or intended for display, downloading, printing, reproducing or for distribution to or use by, any person or entity who is a citizen or resident or located in any locality, state, country or other jurisdiction where such distribution, publication, reproduction, availability or use would be contrary to law or regulation or what would subject HSL or its affiliates to any registration or licensing requirement within such jurisdiction. If this report is inadvertently sent or has reached any person in such country, especially, United States of America, the same should be ignored and brought to the attention of the sender. This document may not be reproduced, distributed or published in whole or in part, directly or indirectly, for any purposes or in any manner. Foreign currencies denominated securities, wherever mentioned, are subject to exchange rate fluctuations, which could have an adverse effect on their value or price, or the income derived from them. In addition, investors in securities such as ADRs, the values of which are influenced by foreign currencies effectively assume currency risk. It should not be considered to be taken as an offer to sell or a solicitation to buy any security. HSL may from time to time solicit from, or perform broking, or other services for, any company mentioned in this mail and/or its attachments. HSL and its affiliated company(ies), their directors and employees may; (a) from time to time, have a long or short position in, and buy or sell the securities of the company(ies) mentioned herein or (b) be engaged in any other transaction involving such securities and earn brokerage or other compensation or act as a market maker in the financial instruments of the company(ies) discussed herein or act as an advisor or lender/borrower to such company(ies) or may have any other potential conflict of interests with respect to any recommendation and other related information and opinions. HSL, its directors, analysts or employees do not take any responsibility, financial or otherwise, of the losses or the damages sustained due to the investments made or any action taken on basis of this report, including but not restricted to, fluctuation in the prices of shares and bonds, changes in the currency rates, diminution in the NAVs, reduction in the dividend or income, etc. HSL and other group companies, its directors, associates, employees may have various positions in any of the stocks, securities and financial instruments dealt in the report, or may make sell or purchase or other deals in these securities from time to time or may deal in other securities of the companies / organizations described in this report. HSL or its associates might have managed or co-managed public offering of securities for the subject company or might have been mandated by the subject company for any other assignment in the past twelve months. HSL or its associates might have received any compensation from the companies mentioned in the report during the period preceding twelve months from t date of this report for services in respect of managing or co-managing public offerings, corporate finance, investment banking or merchant banking, brokerage services or other advisory service in a merger or specific transaction in the normal course of business. HSL or its analysts did not receive any compensation or other benefits from the companies mentioned in the report or third party in connection with preparation of the research report. Accordingly, neither HSL nor Research Analysts have any material conflict of interest at the time of publication of this report. Compensation of our Research Analysts is not based on any specific merchant banking, investment banking or brokerage service transactions. HSL may have issued other reports that are inconsistent with and reach different conclusion from the information presented in this report. Research entity has not been engaged in market making activity for the subject company. Research analyst has not served as an officer, director or employee of the subject company. We have not received any compensation/benefits from the subject company or third party in connection with the Research Report.
HDFC securities Limited, I Think Techno Campus, Building - B, "Alpha", Office Floor 8, Near Kanjurmarg Station, Opp. Crompton Greaves, Kanjurmarg (East), Mumbai 400 042 Phone: (022) 3075 3400 Fax: (022) 2496 5066 Compliance Officer: Binkle R. Oza Email: [email protected] Phone: (022) 3045 3600 HDFC Securities Limited, SEBI Reg. No.: NSE, BSE, MSEI, MCX: INZ000186937; AMFI Reg. No. ARN: 13549; PFRDA Reg. No. POP: 11092018; IRDA Corporate Agent License No.: CA0062; SEBI Research Analyst Reg. No.: INH000002475; SEBI Investment Adviser Reg. No.: INA000011538; CIN - U67120MH2000PLC152193