Daiwa Office Investment Corporation
60
Daiwa Office Investment Corporation Earnings Announcement for the 15th Fiscal Period (Fiscal Period ended May 2013)
Transcript of Daiwa Office Investment Corporation

Daiwa Office Investment Corporation
Earnings Announcement for the 15th Fiscal Period (Fiscal Period ended May 2013)
This document is not material disclosed in compliance with the Financial Instruments and Exchange Law or any regulation of similar nature,nor is it intended for the purposes of solicitation. Daiwa Office Investment Corporation advises reader to make investment decisions at their own judgment. 1
Contents
15th Fiscal Period Topics 4Highlights of the 15th Fiscal Period 5Highlights of Forecasts for the 16th and 17th Fiscal Periods 6Changes in Dividends and Appraisal Value 7Issues and Activities of the Investment Corporation 8
Leasing Market of Tokyo Office Buildings 10Analyses of Leasing Income 11Performance of Shinjuku Maynds Tower & E SPACE TOWER 16Internal Growth Strategies 17Occupancy Rate of the Properties Subject to Leasing Improvement in the 15th FP 18Properties Subject to Leasing Improvement in the 16th FP 19Energy-Saving Measures, Disaster Prevention Measures, CS Improving Measures, etc. 20Actions Taken for Environmental Efforts 21
External GrowthSection 3
The Real Estate Market and Trading Performance 23Portfolio and Acquisition Policy 24Property Review for Acquisition 2515th FP Property Acquisition 2616th FP Property Acquisition 28Properties Acquired after Sponsor Change 30
Financial StrategySection 4
Status of Interest-bearing Liabilities 32Unitholders 36Activities in the 16th Fiscal Period 37
Appendix
Section 2Internal Growth
Section 115th Fiscal Period Performance Highlights and Forecasts
This document is not material disclosed in compliance with the Financial Instruments and Exchange Law or any regulation of similar nature,nor is it intended for the purposes of solicitation. Daiwa Office Investment Corporation advises reader to make investment decisions at their own judgment. 2
This document is provided for informational purposes and should not be construed as an offer or solicitation of an offer to buy or sell any specific product, including investment units. We advise you to inquire with each securities company with regards to the purchase of Daiwa Office Investment Corporation’s investment units.
This document is not intended to provide information meeting the requirements of Japan’s new Financial Instruments and Exchange Law or Investment Trust and Investment Corporation Law, or by the associated cabinet orders, cabinet office ordinances, or rules, or by the rules governing companies listed on the Tokyo Stock Exchange, or any other applicable rules, nor is it a disclosure document or statement of financial performance prepared in accordance with the provisions of any of the foregoing.
This document contains forward-looking statements. However, these forward-looking statements are based on certain assumptions and judgments made using currently available information, and there are a number of known and unknown risks and uncertainties. These forward-looking statements are not a guarantee of future performance or management results, and actual results may differ materially from any explicit or implicit forecasts contained herein.
Although the information contained in this document is the best available at the time of publication, no assurances can be given regarding the accuracy and certainty of this information. The content of this document can be modified or withdrawn without prior notice.

15th Fiscal Period Performance Highlights and Forecasts
Section 1
This document is not material disclosed in compliance with the Financial Instruments and Exchange Law or any regulation of similar nature,nor is it intended for the purposes of solicitation. Daiwa Office Investment Corporation advises reader to make investment decisions at their own judgment. 4
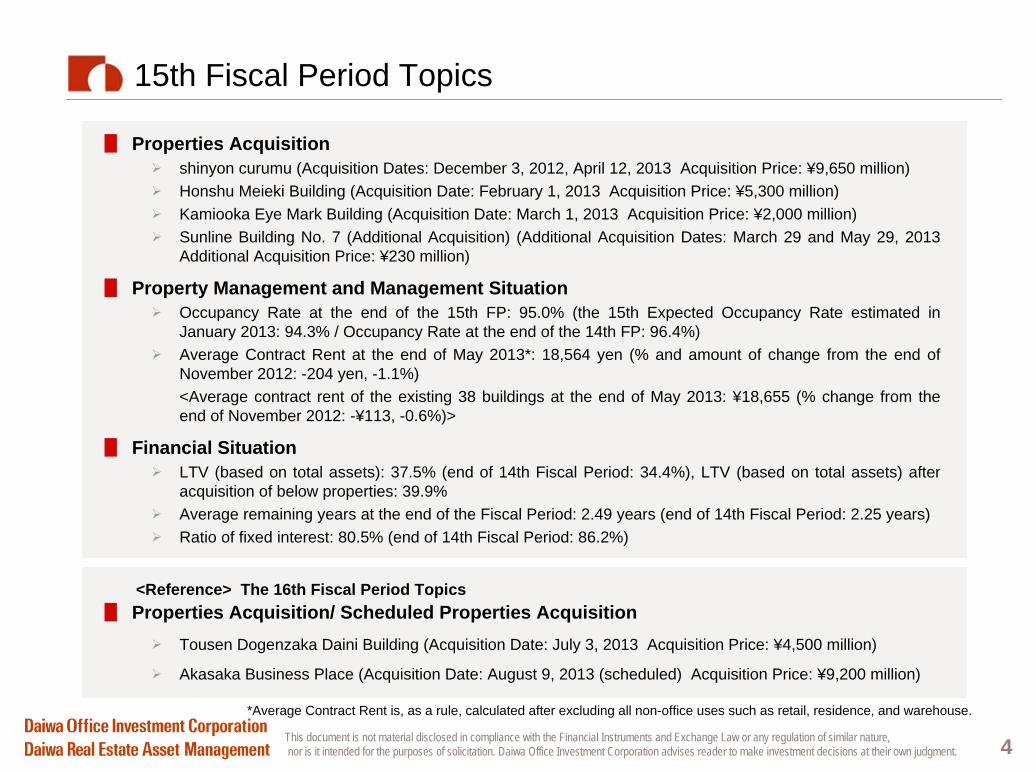
█ Properties Acquisition/ Scheduled Properties AcquisitionTousen Dogenzaka Daini Building (Acquisition Date: July 3, 2013 Acquisition Price: ¥4,500 million)
Akasaka Business Place (Acquisition Date: August 9, 2013 (scheduled) Acquisition Price: ¥9,200 million)
15th Fiscal Period Topics
█ Properties Acquisitionshinyon curumu (Acquisition Dates: December 3, 2012, April 12, 2013 Acquisition Price: ¥9,650 million)Honshu Meieki Building (Acquisition Date: February 1, 2013 Acquisition Price: ¥5,300 million)Kamiooka Eye Mark Building (Acquisition Date: March 1, 2013 Acquisition Price: ¥2,000 million)Sunline Building No. 7 (Additional Acquisition) (Additional Acquisition Dates: March 29 and May 29, 2013 Additional Acquisition Price: ¥230 million)
█ Property Management and Management SituationOccupancy Rate at the end of the 15th FP: 95.0% (the 15th Expected Occupancy Rate estimated in January 2013: 94.3% / Occupancy Rate at the end of the 14th FP: 96.4%)Average Contract Rent at the end of May 2013*: 18,564 yen (% and amount of change from the end of November 2012: -204 yen, -1.1%) <Average contract rent of the existing 38 buildings at the end of May 2013: ¥18,655 (% change from the end of November 2012: -¥113, -0.6%)>
█ Financial SituationLTV (based on total assets): 37.5% (end of 14th Fiscal Period: 34.4%), LTV (based on total assets) after acquisition of below properties: 39.9%Average remaining years at the end of the Fiscal Period: 2.49 years (end of 14th Fiscal Period: 2.25 years) Ratio of fixed interest: 80.5% (end of 14th Fiscal Period: 86.2%)
<Reference> The 16th Fiscal Period Topics
*Average Contract Rent is, as a rule, calculated after excluding all non-office uses such as retail, residence, and warehouse.
This document is not material disclosed in compliance with the Financial Instruments and Exchange Law or any regulation of similar nature,nor is it intended for the purposes of solicitation. Daiwa Office Investment Corporation advises reader to make investment decisions at their own judgment.
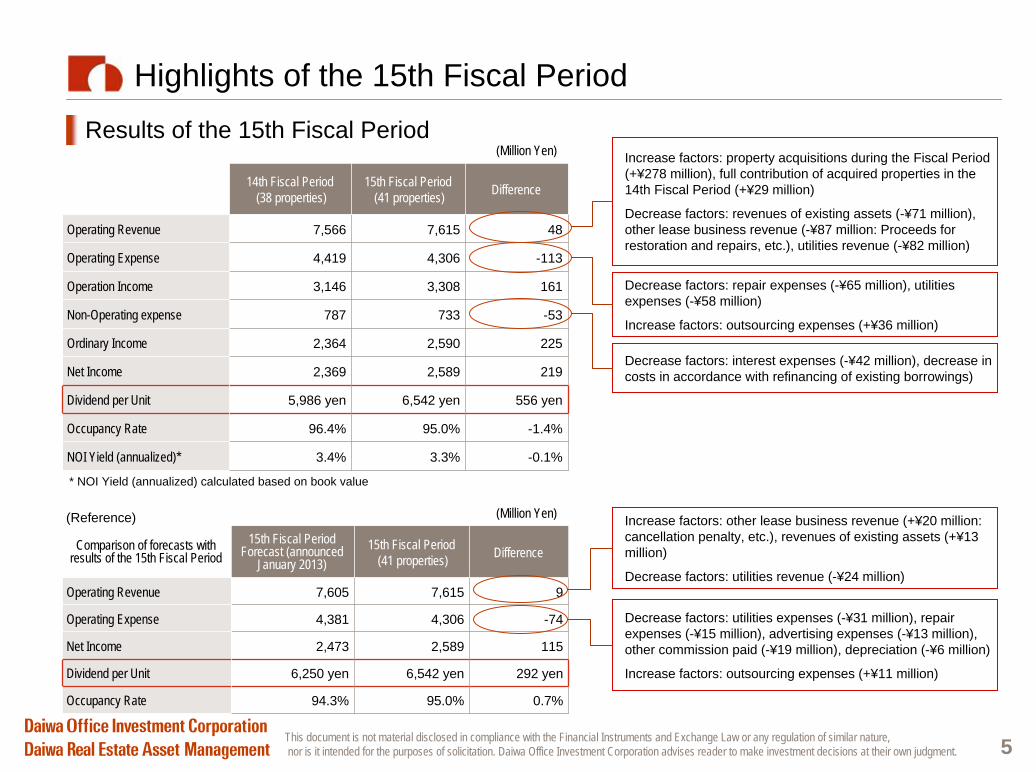
14th Fiscal Period(38 properties)
15th Fiscal Period(41 properties) Difference
Operating Revenue 7,566 7,615 48
Operating Expense 4,419 4,306 -113
Operation Income 3,146 3,308 161
Non-Operating expense 787 733 -53
Ordinary Income 2,364 2,590 225
Net Income 2,369 2,589 219
Dividend per Unit 5,986 yen 6,542 yen 556 yen
Occupancy Rate 96.4% 95.0% -1.4%
NOI Yield (annualized)* 3.4% 3.3% -0.1%
5
Highlights of the 15th Fiscal PeriodResults of the 15th Fiscal Period
Increase factors: property acquisitions during the Fiscal Period (+¥278 million), full contribution of acquired properties in the 14th Fiscal Period (+¥29 million)
Decrease factors: revenues of existing assets (-¥71 million), other lease business revenue (-¥87 million: Proceeds for restoration and repairs, etc.), utilities revenue (-¥82 million)
Decrease factors: repair expenses (-¥65 million), utilities expenses (-¥58 million)
Increase factors: outsourcing expenses (+¥36 million)
Decrease factors: interest expenses (-¥42 million), decrease in costs in accordance with refinancing of existing borrowings)
* NOI Yield (annualized) calculated based on book value
(Reference) Increase factors: other lease business revenue (+¥20 million: cancellation penalty, etc.), revenues of existing assets (+¥13 million)
Decrease factors: utilities revenue (-¥24 million)
Decrease factors: utilities expenses (-¥31 million), repair expenses (-¥15 million), advertising expenses (-¥13 million), other commission paid (-¥19 million), depreciation (-¥6 million)
Increase factors: outsourcing expenses (+¥11 million)
Comparison of forecasts with results of the 15th Fiscal Period
15th Fiscal Period Forecast (announced
January 2013)15th Fiscal Period
(41 properties) Difference
Operating Revenue 7,605 7,615 9
Operating Expense 4,381 4,306 -74
Net Income 2,473 2,589 115
Dividend per Unit 6,250 yen 6,542 yen 292 yen
Occupancy Rate 94.3% 95.0% 0.7%
(Million Yen)
(Million Yen)
This document is not material disclosed in compliance with the Financial Instruments and Exchange Law or any regulation of similar nature,nor is it intended for the purposes of solicitation. Daiwa Office Investment Corporation advises reader to make investment decisions at their own judgment.
17th FP Forecast Ending May 2014
(43 properties)
Difference comparedto 16th FP
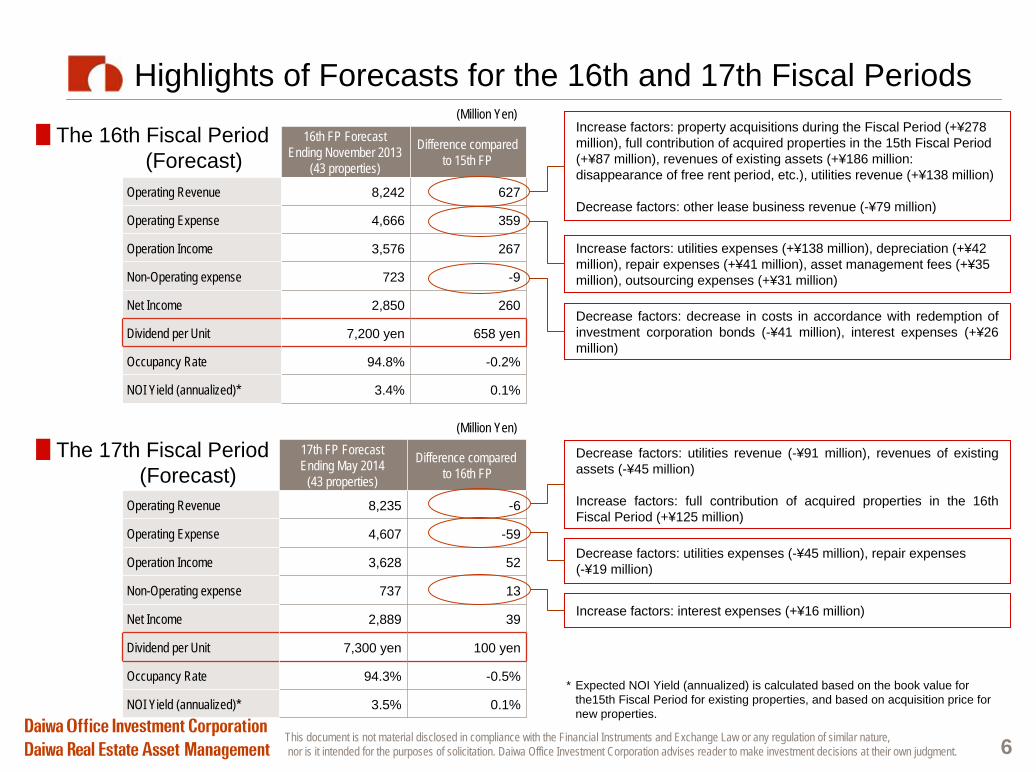
Operating Revenue 8,235 -6
Operating Expense 4,607 -59
Operation Income 3,628 52
Non-Operating expense 737 13
Net Income 2,889 39
Dividend per Unit 7,300 yen 100 yen
Occupancy Rate 94.3% -0.5%
NOI Yield (annualized)* 3.5% 0.1%
16th FP Forecast Ending November 2013
(43 properties)
Difference compared to 15th FP
Operating Revenue 8,242 627
Operating Expense 4,666 359
Operation Income 3,576 267
Non-Operating expense 723 -9
Net Income 2,850 260
Dividend per Unit 7,200 yen 658 yen
Occupancy Rate 94.8% -0.2%
NOI Yield (annualized)* 3.4% 0.1%
6
Highlights of Forecasts for the 16th and 17th Fiscal Periods
Decrease factors: decrease in costs in accordance with redemption of investment corporation bonds (-¥41 million), interest expenses (+¥26 million)
Increase factors: utilities expenses (+¥138 million), depreciation (+¥42 million), repair expenses (+¥41 million), asset management fees (+¥35 million), outsourcing expenses (+¥31 million)
Increase factors: property acquisitions during the Fiscal Period (+¥278 million), full contribution of acquired properties in the 15th Fiscal Period (+¥87 million), revenues of existing assets (+¥186 million: disappearance of free rent period, etc.), utilities revenue (+¥138 million)
Decrease factors: other lease business revenue (-¥79 million)
Decrease factors: utilities expenses (-¥45 million), repair expenses (-¥19 million)
Decrease factors: utilities revenue (-¥91 million), revenues of existing assets (-¥45 million)
Increase factors: full contribution of acquired properties in the 16th Fiscal Period (+¥125 million)
* Expected NOI Yield (annualized) is calculated based on the book value for the15th Fiscal Period for existing properties, and based on acquisition price for new properties.
Increase factors: interest expenses (+¥16 million)
█ The 16th Fiscal Period(Forecast)
█ The 17th Fiscal Period (Forecast)
(Million Yen)
(Million Yen)
This document is not material disclosed in compliance with the Financial Instruments and Exchange Law or any regulation of similar nature,nor is it intended for the purposes of solicitation. Daiwa Office Investment Corporation advises reader to make investment decisions at their own judgment. 7
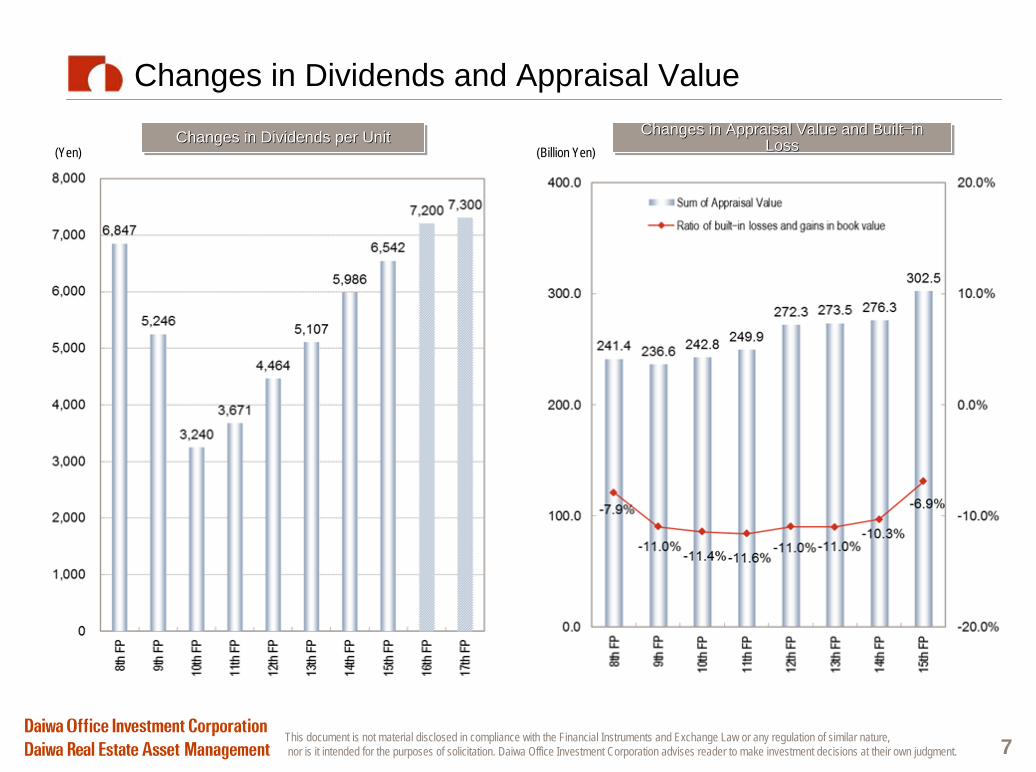
Changes in Dividends and Appraisal ValueChanges in Appraisal Value and Built−in
Loss Changes in Appraisal Value and BuiltChanges in Appraisal Value and Built−−in in
LossLossChanges in Dividends per UnitChanges in Dividends per UnitChanges in Dividends per Unit(Yen) (Billion Yen)
This document is not material disclosed in compliance with the Financial Instruments and Exchange Law or any regulation of similar nature,nor is it intended for the purposes of solicitation. Daiwa Office Investment Corporation advises reader to make investment decisions at their own judgment. 8
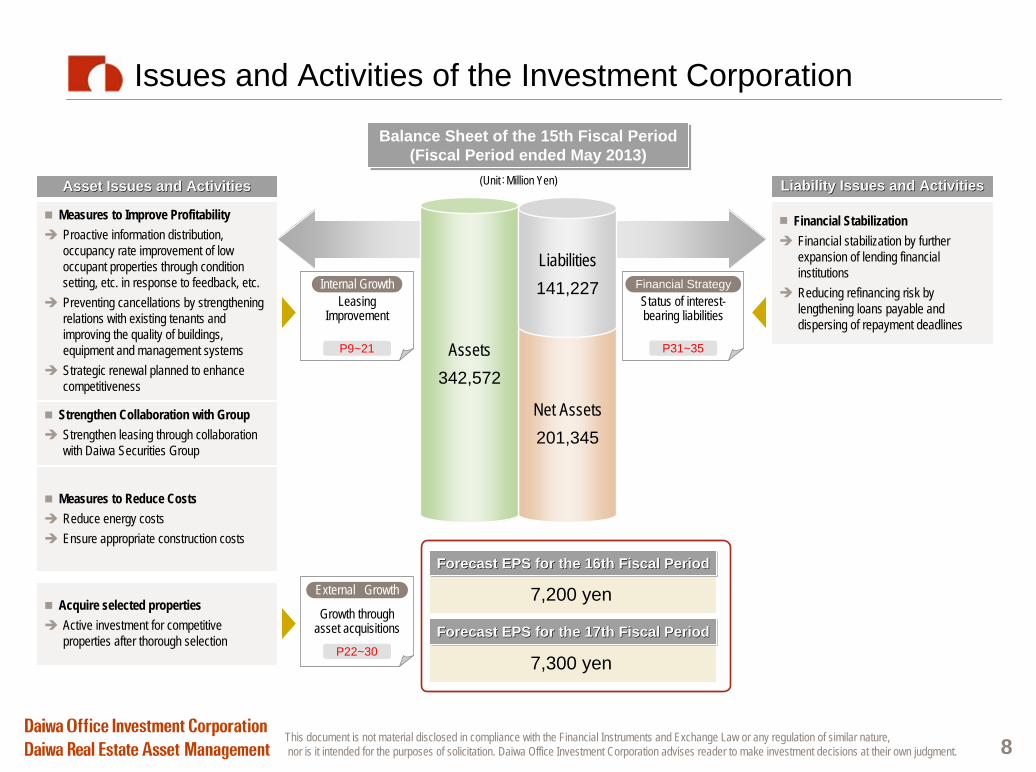
Issues and Activities of the Investment Corporation
7,300 yen
Net Assets201,345
Balance Sheet of the 15th Fiscal Period(Fiscal Period ended May 2013)
Balance Sheet of the 15th Fiscal Period(Fiscal Period ended May 2013)
Assets342,572
Liabilities141,227
(Unit:Million Yen)
7,200 yenForecast EPS for the 16th Fiscal PeriodForecast EPS for the 16th Fiscal PeriodForecast EPS for the 16th Fiscal Period
Asset Issues and ActivitiesAsset Issues and Activities
Forecast EPS for the 17th Fiscal PeriodForecast EPS for the 17th Fiscal PeriodForecast EPS for the 17th Fiscal Period
Liability Issues and ActivitiesLiability Issues and Activities
Status of interest- bearing liabilities
Financial Strategy
P31~35
Leasing Improvement
Internal Growth
P9~21
Growth through asset acquisitions
External Growth
P22~30
Financial StabilizationFinancial stabilization by further expansion of lending financial institutionsReducing refinancing risk by lengthening loans payable and dispersing of repayment deadlines
Acquire selected propertiesActive investment for competitive properties after thorough selection
Measures to Improve ProfitabilityProactive information distribution, occupancy rate improvement of low occupant properties through condition setting, etc. in response to feedback, etc. Preventing cancellations by strengthening relations with existing tenants and improving the quality of buildings, equipment and management systemsStrategic renewal planned to enhance competitiveness
Strengthen Collaboration with GroupStrengthen leasing through collaboration with Daiwa Securities Group
Measures to Reduce CostsReduce energy costsEnsure appropriate construction costs

Internal GrowthSection 2
This document is not material disclosed in compliance with the Financial Instruments and Exchange Law or any regulation of similar nature,nor is it intended for the purposes of solicitation. Daiwa Office Investment Corporation advises reader to make investment decisions at their own judgment. 10
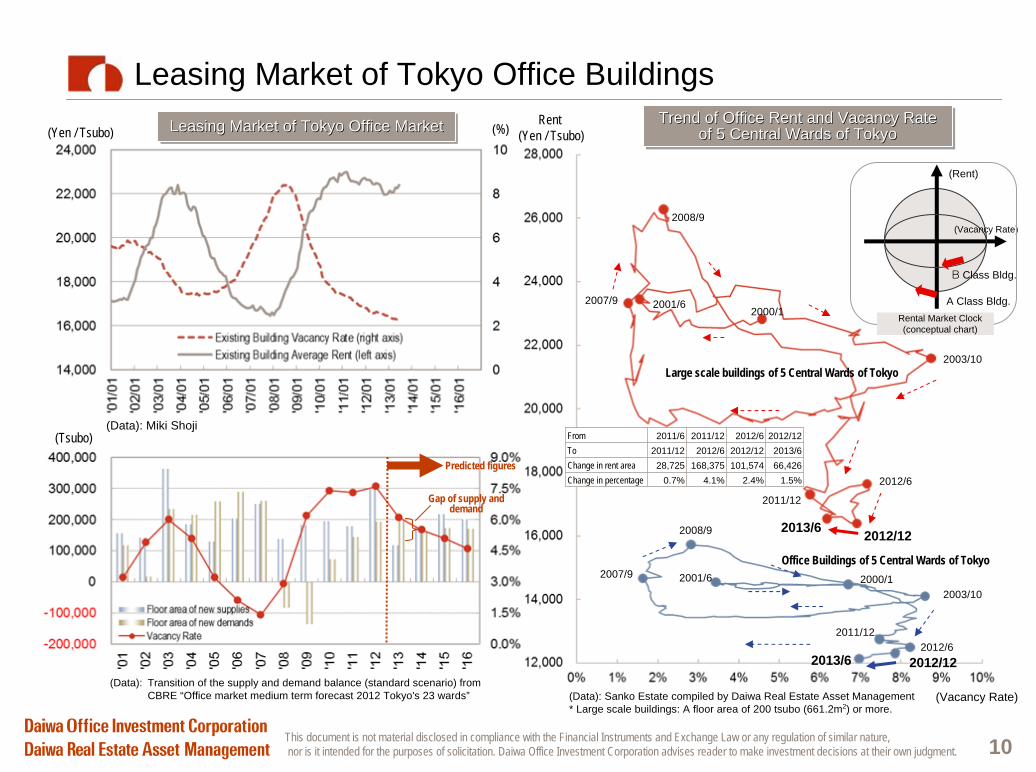
Leasing Market of Tokyo Office Buildings
2003/10
2001/62007/9
2008/9
2000/1
2001/62007/9
2008/9
2000/1
2011/12
2003/10
2012/6
(Rent)
(Vacancy Rate)
A Class Bldg.
B
Class Bldg.
Large scale buildings of 5 Central Wards of Tokyo
Office Buildings of 5 Central Wards of Tokyo
Rental Market Clock(conceptual chart)
(Vacancy Rate)
2012/12
2012/12
2013/6
2013/6
(Data): Sanko Estate compiled by Daiwa Real Estate Asset Management* Large scale buildings: A floor area of 200 tsubo (661.2m2) or more.
(Data): Miki Shoji
Predicted figures
Gap of supply and demand
(Data): Transition of the supply and demand balance (standard scenario) from CBRE “Office market medium term forecast 2012 Tokyo's 23 wards”
(Tsubo) From 2011/6 2011/12 2012/6 2012/12To 2011/12 2012/6 2012/12 2013/6Change in rent area 28,725 168,375 101,574 66,426Change in percentage 0.7% 4.1% 2.4% 1.5%
2011/12
2012/6
(%)Leasing Market of Tokyo Office MarketLeasing Market of Tokyo Office MarketLeasing Market of Tokyo Office Market Trend of Office Rent and Vacancy Rate of 5 Central Wards of Tokyo
Trend of Office Rent and Vacancy Rate Trend of Office Rent and Vacancy Rate of 5 Central Wards of Tokyoof 5 Central Wards of Tokyo
Rent (Yen / Tsubo)(Yen / Tsubo)
This document is not material disclosed in compliance with the Financial Instruments and Exchange Law or any regulation of similar nature,nor is it intended for the purposes of solicitation. Daiwa Office Investment Corporation advises reader to make investment decisions at their own judgment. 11
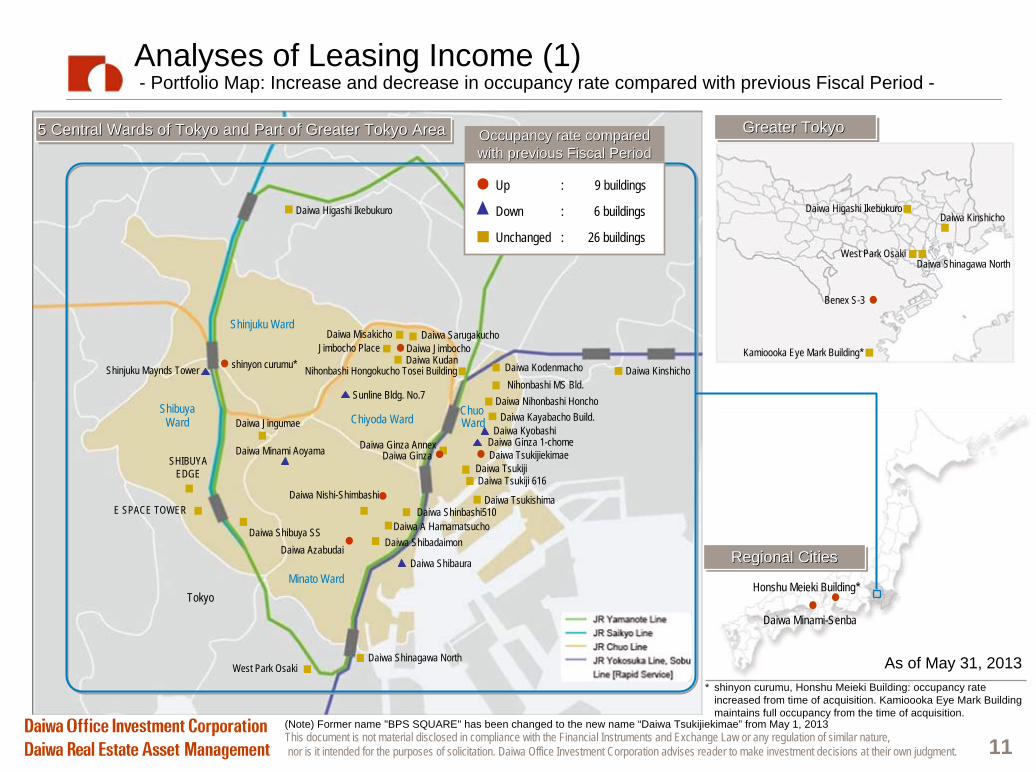
Analyses of Leasing Income (1) - Portfolio Map: Increase and decrease in occupancy rate compared with previous Fiscal Period -
Daiwa Minami-Senba
Daiwa Misakicho Daiwa Sarugakucho
Nihonbashi MS Bld.
Daiwa Tsukiji 616
Daiwa Ginza
Daiwa Tsukishima
Daiwa Shibaura
Daiwa ShibadaimonDaiwa Azabudai
Daiwa A HamamatsuchoDaiwa Shinbashi510
Daiwa Ginza Annex
Daiwa TsukijiDaiwa Tsukijiekimae
Daiwa JingumaeShibuya
Ward
Daiwa Shibuya SS
Daiwa Nihonbashi Honcho
Daiwa KyobashiDaiwa Ginza 1-chome
Sunline Bldg. No.7
Daiwa Minami AoyamaSHIBUYA
EDGE
Daiwa Shinagawa North
Shinjuku Maynds Tower Daiwa Kodenmacho
Daiwa Higashi Ikebukuro
Daiwa Kinshicho
As of May 31, 2013
Daiwa Kudan
Daiwa Nishi-Shimbashi
Daiwa JimbochoJimbocho Place
E SPACE TOWER
Daiwa Kayabacho Build.
Nihonbashi Hongokucho Tosei Building
West Park Osaki
Occupancy rate compared Occupancy rate compared with previous Fiscal Periodwith previous Fiscal Period
Daiwa Kinshicho
Benex S-3
Kamioooka Eye Mark Building*
Daiwa Higashi Ikebukuro
Daiwa Shinagawa NorthWest Park Osaki
Honshu Meieki Building*
shinyon curumu*
* shinyon curumu, Honshu Meieki Building: occupancy rate increased from time of acquisition. Kamioooka Eye Mark Building maintains full occupancy from the time of acquisition.
(Note) Former name "BPS SQUARE" has been changed to the new name “Daiwa Tsukijiekimae” from May 1, 2013
Shinjuku Ward
Minato Ward
Chiyoda WardChuo Ward
Tokyo
Up : 9 buildings
Down : 6 buildings
Unchanged : 26 buildings
5 Central Wards of Tokyo and Part of Greater Tokyo Area 5 Central Wards of Tokyo and Part of Greater Tokyo Area 5 Central Wards of Tokyo and Part of Greater Tokyo Area
Regional CitiesRegional CitiesRegional Cities
Greater Tokyo Greater Tokyo Greater Tokyo
This document is not material disclosed in compliance with the Financial Instruments and Exchange Law or any regulation of similar nature,nor is it intended for the purposes of solicitation. Daiwa Office Investment Corporation advises reader to make investment decisions at their own judgment. 12
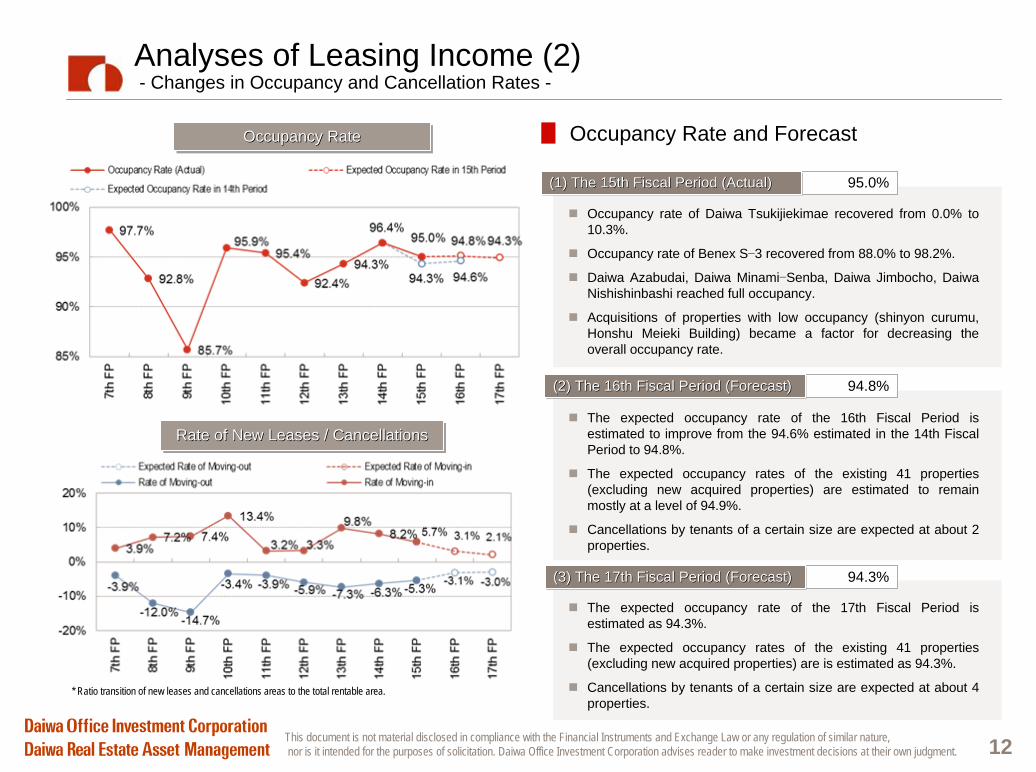
Analyses of Leasing Income (2) - Changes in Occupancy and Cancellation Rates -
Occupancy RateOccupancy RateOccupancy Rate
Rate of New Leases / CancellationsRate of New Leases / CancellationsRate of New Leases / Cancellations
Occupancy rate of Daiwa Tsukijiekimae recovered from 0.0% to 10.3%.
Occupancy rate of Benex S−3 recovered from 88.0% to 98.2%.
Daiwa Azabudai, Daiwa Minami−Senba, Daiwa Jimbocho, Daiwa Nishishinbashi reached full occupancy.
Acquisitions of properties with low occupancy (shinyon curumu, Honshu Meieki Building) became a factor for decreasing the overall occupancy rate.
95.0%(1) The 15th Fiscal Period (Actual)(1) The 15th Fiscal Period (Actual)(1) The 15th Fiscal Period (Actual)
The expected occupancy rate of the 16th Fiscal Period is estimated to improve from the 94.6% estimated in the 14th FiscalPeriod to 94.8%.
The expected occupancy rates of the existing 41 properties (excluding new acquired properties) are estimated to remain mostly at a level of 94.9%.
Cancellations by tenants of a certain size are expected at about 2 properties.
94.8%(2) The 16th Fiscal Period (Forecast)(2) The 16th Fiscal Period (Forecast)(2) The 16th Fiscal Period (Forecast)
The expected occupancy rate of the 17th Fiscal Period is estimated as 94.3%.
The expected occupancy rates of the existing 41 properties (excluding new acquired properties) are is estimated as 94.3%.
Cancellations by tenants of a certain size are expected at about 4 properties.
94.3%(3) The 17th Fiscal Period (Forecast)(3) The 17th Fiscal Period (Forecast)(3) The 17th Fiscal Period (Forecast)
█ Occupancy Rate and Forecast
* Ratio transition of new leases and cancellations areas to the total rentable area.
This document is not material disclosed in compliance with the Financial Instruments and Exchange Law or any regulation of similar nature,nor is it intended for the purposes of solicitation. Daiwa Office Investment Corporation advises reader to make investment decisions at their own judgment. 13
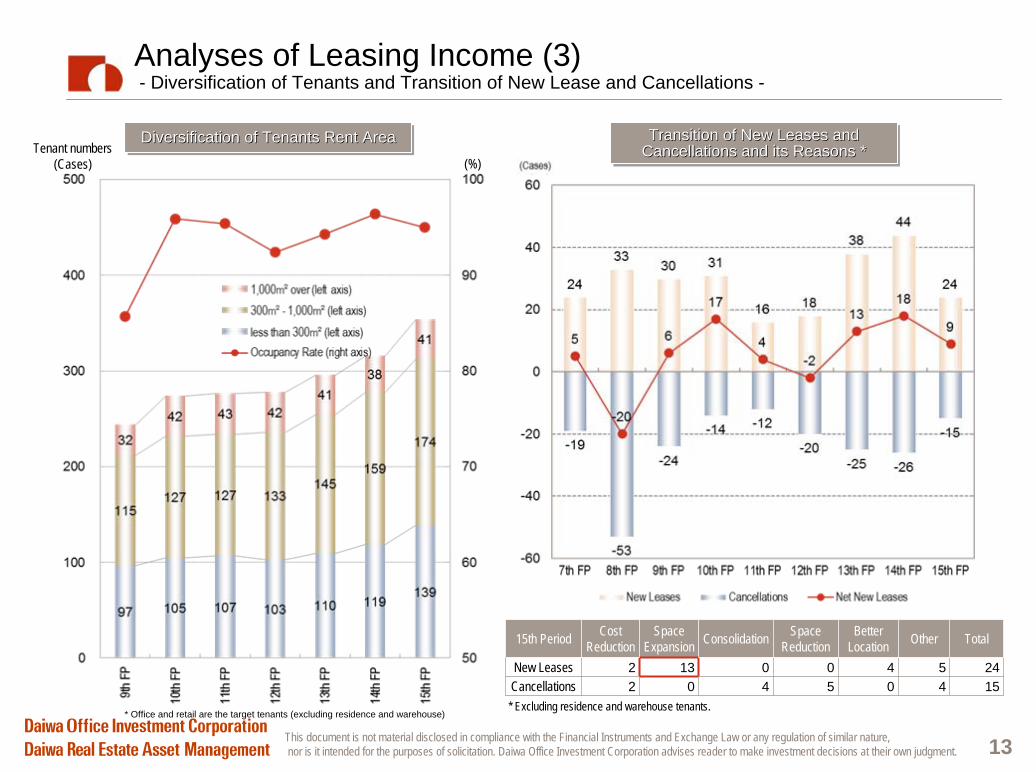
Analyses of Leasing Income (3) - Diversification of Tenants and Transition of New Lease and Cancellations -
Transition of New Leases and Cancellations and its Reasons * Transition of New Leases and Transition of New Leases and
Cancellations and its Reasons *Cancellations and its Reasons *(件)
Diversification of Tenants Rent AreaDiversification of Tenants Rent AreaDiversification of Tenants Rent AreaTenant numbers
(Cases)
15th Period Cost Reduction
Space Expansion Consolidation Space
ReductionBetter
Location Other Total
New Leases 2 13 0 0 4 5 24Cancellations 2 0 4 5 0 4 15
(%)
* Excluding residence and warehouse tenants.* Office and retail are the target tenants (excluding residence and warehouse)
This document is not material disclosed in compliance with the Financial Instruments and Exchange Law or any regulation of similar nature,nor is it intended for the purposes of solicitation. Daiwa Office Investment Corporation advises reader to make investment decisions at their own judgment. 14
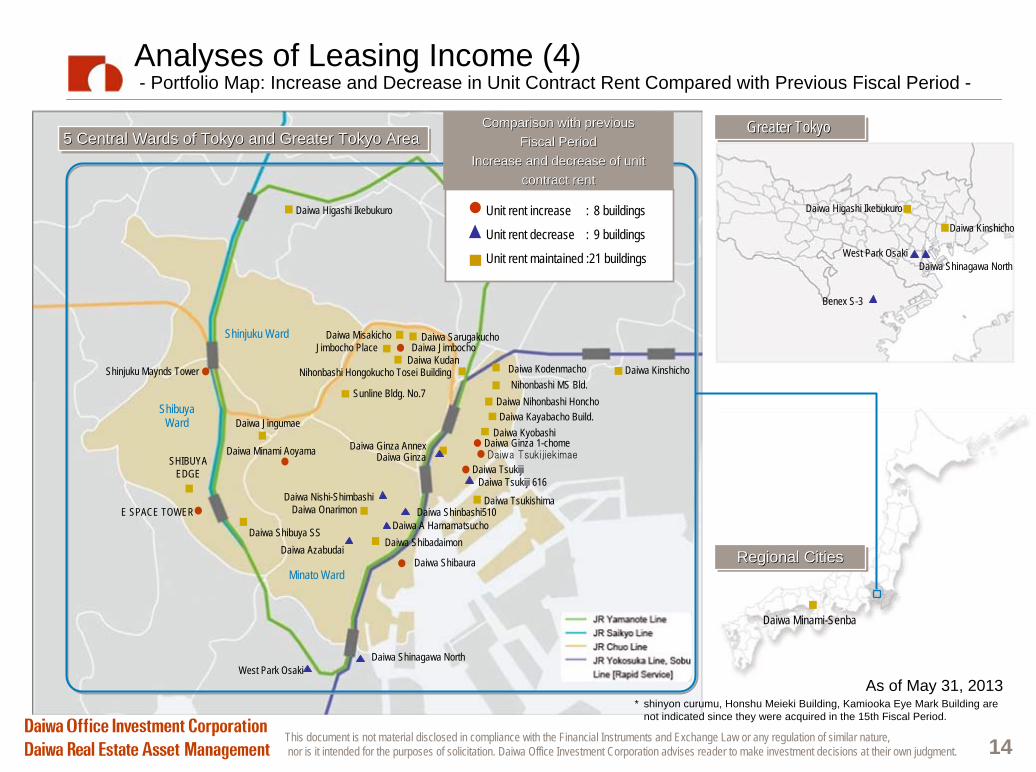
Analyses of Leasing Income (4) - Portfolio Map: Increase and Decrease in Unit Contract Rent Compared with Previous Fiscal Period -
Daiwa Minami-Senba
Daiwa Misakicho Daiwa Sarugakucho
Nihonbashi MS Bld.
Daiwa Tsukiji 616
Daiwa Ginza
Daiwa Tsukishima
Daiwa Shibaura
Daiwa ShibadaimonDaiwa Azabudai
Daiwa A HamamatsuchoDaiwa Shinbashi510
Daiwa Ginza Annex
Daiwa TsukijiDaiwa Tsukijiekimae
Daiwa Jingumae
Daiwa Minami Aoyama
Daiwa Shibuya SS
Daiwa Nihonbashi Honcho
Daiwa KyobashiDaiwa Ginza 1-chome
Sunline Bldg. No.7
Daiwa Onarimon
SHIBUYA EDGE
Daiwa Shinagawa North
Shinjuku Maynds Tower Daiwa Kodenmacho
5 Central Wards of Tokyo and Greater Tokyo Area 5 Central Wards of Tokyo and Greater Tokyo Area 5 Central Wards of Tokyo and Greater Tokyo Area
Regional CitiesRegional CitiesRegional Cities
Daiwa Higashi Ikebukuro
Daiwa Kinshicho
As of May 31, 2013
Daiwa Kudan
Daiwa Nishi-Shimbashi
Daiwa JimbochoJimbocho Place
E SPACE TOWER
Daiwa Kayabacho Build.
Nihonbashi Hongokucho Tosei Building
West Park Osaki
Comparison with previous Comparison with previous Fiscal Period Fiscal Period
Increase and decrease of unit Increase and decrease of unit contract rentcontract rent
Greater Tokyo Greater Tokyo Greater Tokyo
* shinyon curumu, Honshu Meieki Building, Kamiooka Eye Mark Building are not indicated since they were acquired in the 15th Fiscal Period.
Shinjuku Ward
ShibuyaWard
Minato Ward
Daiwa Kinshicho
Benex S-3
Daiwa Higashi Ikebukuro
Daiwa Shinagawa NorthWest Park Osaki
Unit rent increase : 8 buildings
Unit rent decrease : 9 buildings
Unit rent maintained :21 buildings
This document is not material disclosed in compliance with the Financial Instruments and Exchange Law or any regulation of similar nature,nor is it intended for the purposes of solicitation. Daiwa Office Investment Corporation advises reader to make investment decisions at their own judgment. 15
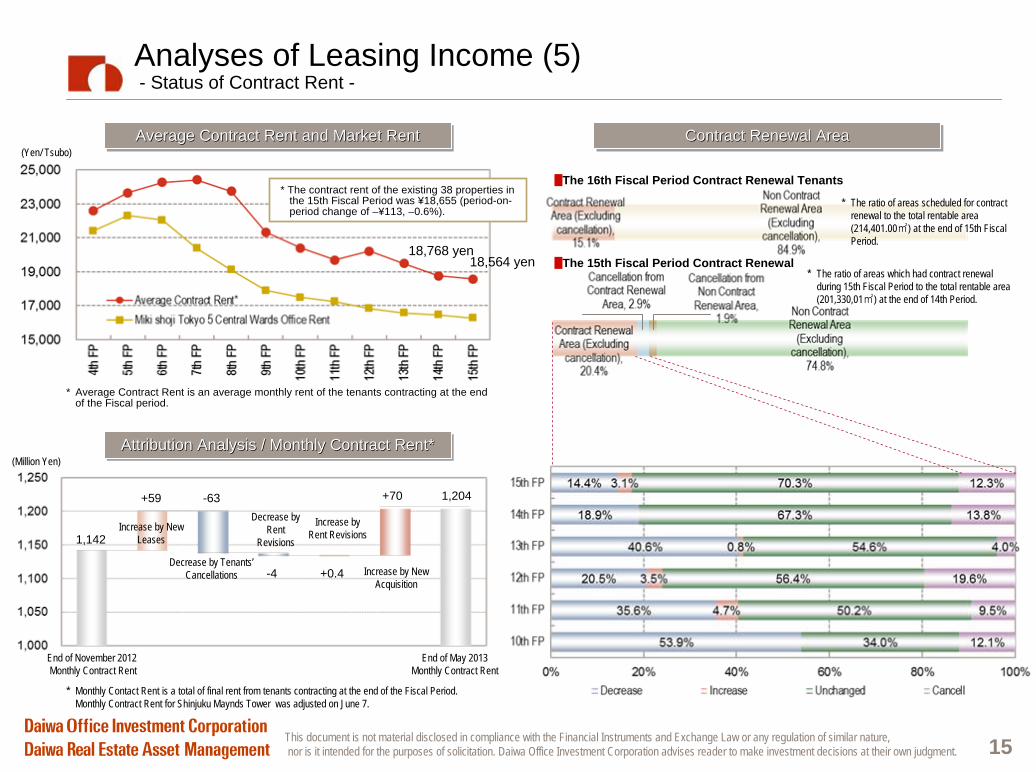
Analyses of Leasing Income (5) - Status of Contract Rent -
Average Contract Rent and Market RentAverage Contract Rent and Market RentAverage Contract Rent and Market Rent(Yen/ Tsubo)
Contract Renewal AreaContract Renewal AreaContract Renewal Area
* Average Contract Rent is an average monthly rent of the tenants contracting at the end of the Fiscal period.
█The 16th Fiscal Period Contract Renewal Tenants
█The 15th Fiscal Period Contract Renewal18,564 yen
* The contract rent of the existing 38 properties in the 15th Fiscal Period was ¥18,655 (period-on- period change of –¥113, –0.6%).
End of May 2013Monthly Contract Rent
Attribution Analysis / Monthly Contract Rent*Attribution Analysis / Monthly Contract Rent*Attribution Analysis / Monthly Contract Rent*
Increase by New Leases
Decrease by Tenants’ Cancellations Increase by New
Acquisition
* The ratio of areas scheduled for contract renewal to the total rentable area (214,401.00㎡) at the end of 15th Fiscal Period.
* The ratio of areas which had contract renewal during 15th Fiscal Period to the total rentable area (201,330,01㎡) at the end of 14th Period.
Increase by Rent Revisions
18,768 yen
End of November 2012 Monthly Contract Rent
+59 -63
-4 +0.4
+70
1,142
1,204
(Million Yen)
Decrease by Rent
Revisions
* Monthly Contact Rent is a total of final rent from tenants contracting at the end of the Fiscal Period.Monthly Contract Rent for Shinjuku Maynds Tower was adjusted on June 7.
This document is not material disclosed in compliance with the Financial Instruments and Exchange Law or any regulation of similar nature,nor is it intended for the purposes of solicitation. Daiwa Office Investment Corporation advises reader to make investment decisions at their own judgment. 16
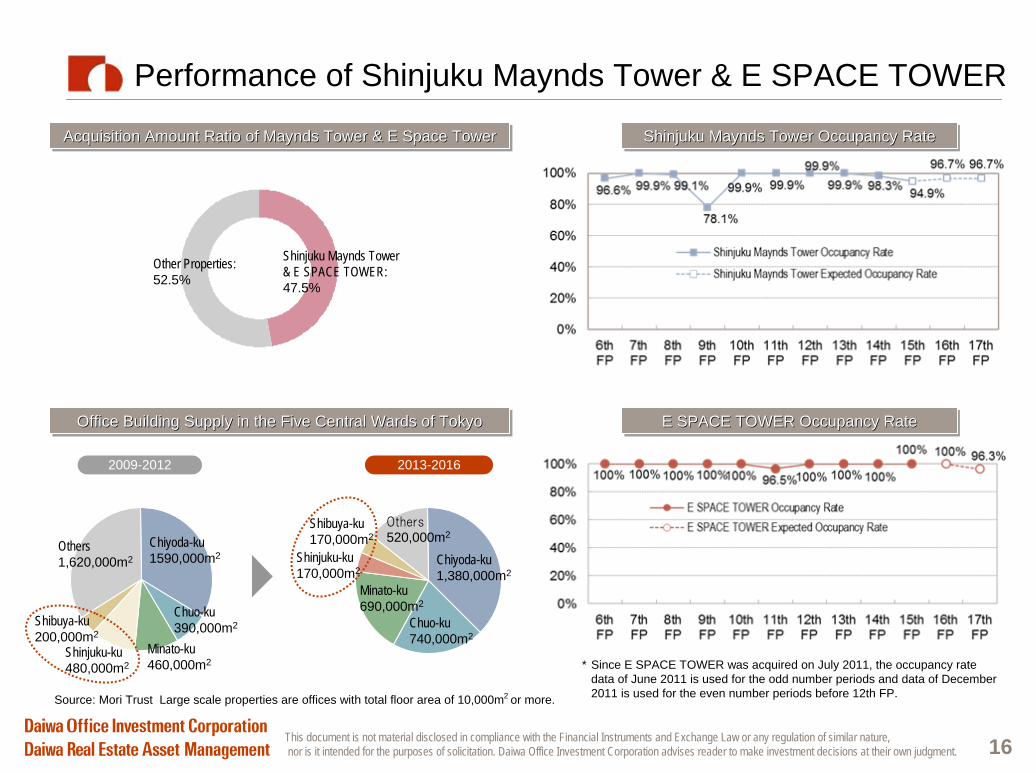
Performance of Shinjuku Maynds Tower & E SPACE TOWER
E SPACE TOWER Occupancy RateE SPACE TOWER Occupancy RateE SPACE TOWER Occupancy Rate
Shinjuku Maynds Tower Occupancy RateShinjuku Maynds Tower Occupancy RateShinjuku Maynds Tower Occupancy Rate
* Since E SPACE TOWER was acquired on July 2011, the occupancy rate data of June 2011 is used for the odd number periods and data of December 2011 is used for the even number periods before 12th FP.
Acquisition Amount Ratio of Maynds Tower & E Space TowerAcquisition Amount Ratio of Maynds Tower & E Space TowerAcquisition Amount Ratio of Maynds Tower & E Space Tower
Source: Mori Trust Large scale properties are offices with total floor area of 10,000m2 or more.
Office Building Supply in the Five Central Wards of TokyoOffice Building Supply in the Five Central Wards of TokyoOffice Building Supply in the Five Central Wards of Tokyo
Shinjuku Maynds Tower& E SPACE TOWER:47.5%
2009-2012 2013-2016
Chuo-ku740,000m2
Minato-ku690,000m2
Shinjuku-ku170,000m2
Others520,000m2
Chiyoda-ku1,380,000m2
Shibuya-ku170,000m2
Chuo-ku390,000m2
Minato-ku460,000m2
Shinjuku-ku480,000m2
Others1,620,000m2
Chiyoda-ku1590,000m2
Shibuya-ku200,000m2
Other Properties:52.5%
This document is not material disclosed in compliance with the Financial Instruments and Exchange Law or any regulation of similar nature,nor is it intended for the purposes of solicitation. Daiwa Office Investment Corporation advises reader to make investment decisions at their own judgment. 17
Internal Growth Strategies
(Cases)
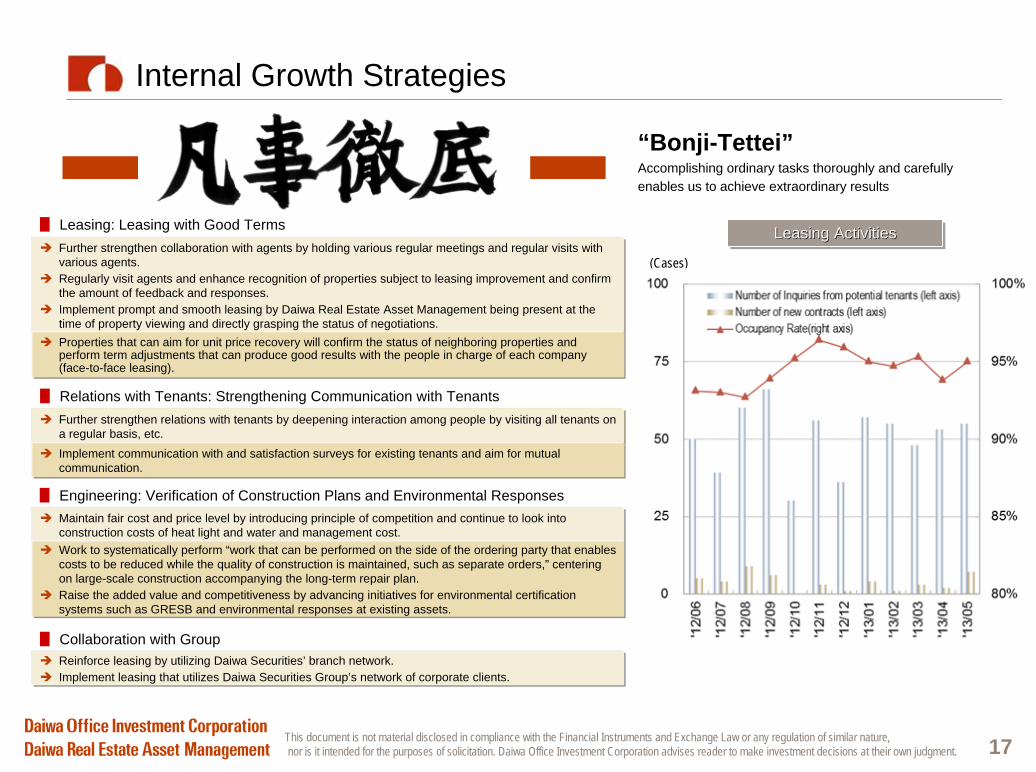
Leasing ActivitiesLeasing ActivitiesLeasing Activities
█ Collaboration with Group
█ Leasing: Leasing with Good Terms
█ Relations with Tenants: Strengthening Communication with Tenants
█ Engineering: Verification of Construction Plans and Environmental Responses
Further strengthen collaboration with agents by holding various regular meetings and regular visits with various agents.Regularly visit agents and enhance recognition of properties subject to leasing improvement and confirm the amount of feedback and responses.Implement prompt and smooth leasing by Daiwa Real Estate Asset Management being present at the time of property viewing and directly grasping the status of negotiations.Properties that can aim for unit price recovery will confirm the status of neighboring properties and perform term adjustments that can produce good results with the people in charge of each company (face-to-face leasing).
Further strengthen relations with tenants by deepening interaction among people by visiting all tenants on a regular basis, etc.Implement communication with and satisfaction surveys for existing tenants and aim for mutual communication.
Maintain fair cost and price level by introducing principle of competition and continue to look into construction costs of heat light and water and management cost.Work to systematically perform “work that can be performed on the side of the ordering party that enables costs to be reduced while the quality of construction is maintained, such as separate orders,” centering on large-scale construction accompanying the long-term repair plan.Raise the added value and competitiveness by advancing initiatives for environmental certification systems such as GRESB and environmental responses at existing assets.
Reinforce leasing by utilizing Daiwa Securities’ branch network.Implement leasing that utilizes Daiwa Securities Group’s network of corporate clients.
“Bonji-Tettei”Accomplishing ordinary tasks thoroughly and carefully enables us to achieve extraordinary results
This document is not material disclosed in compliance with the Financial Instruments and Exchange Law or any regulation of similar nature,nor is it intended for the purposes of solicitation. Daiwa Office Investment Corporation advises reader to make investment decisions at their own judgment. 18
Occupancy Rate of the Properties Subject to Leasing Improvement in the 15th FP
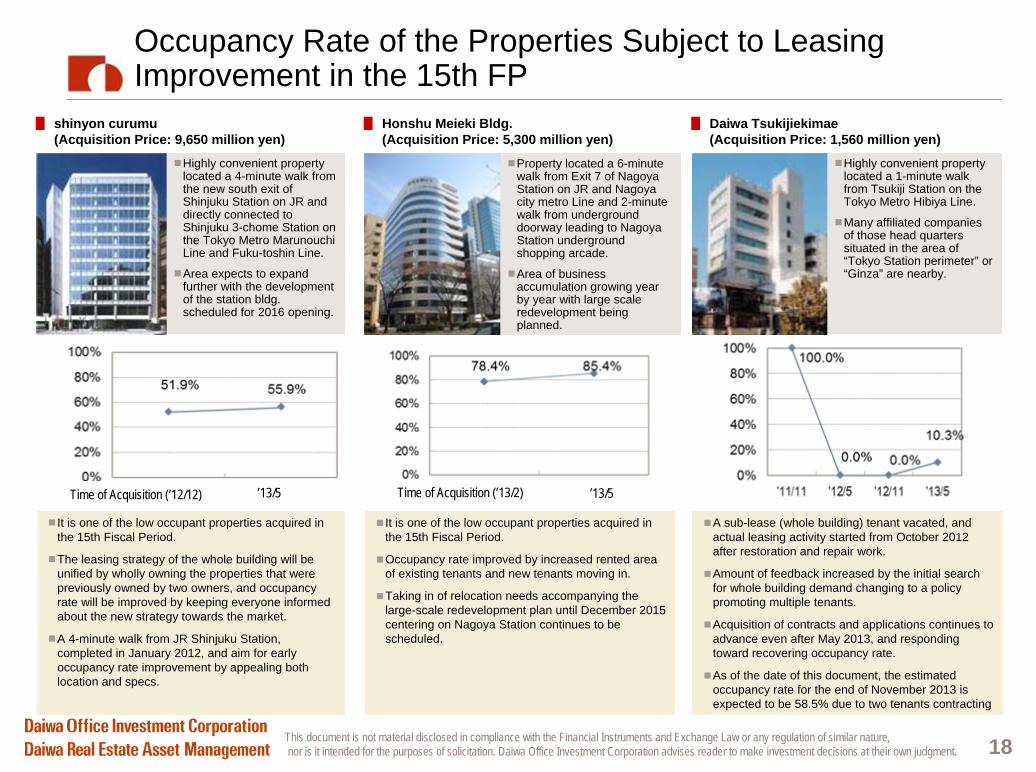
It is one of the low occupant properties acquired in the 15th Fiscal Period.
The leasing strategy of the whole building will be unified by wholly owning the properties that were previously owned by two owners, and occupancy rate will be improved by keeping everyone informed about the new strategy towards the market.
A 4-minute walk from JR Shinjuku Station, completed in January 2012, and aim for early occupancy rate improvement by appealing both location and specs.
It is one of the low occupant properties acquired in the 15th Fiscal Period.
Occupancy rate improved by increased rented area of existing tenants and new tenants moving in.
Taking in of relocation needs accompanying the large-scale redevelopment plan until December 2015 centering on Nagoya Station continues to be scheduled.
A sub-lease (whole building) tenant vacated, and actual leasing activity started from October 2012 after restoration and repair work.
Amount of feedback increased by the initial search for whole building demand changing to a policy promoting multiple tenants.
Acquisition of contracts and applications continues to advance even after May 2013, and responding toward recovering occupancy rate.
As of the date of this document, the estimated occupancy rate for the end of November 2013 is expected to be 58.5% due to two tenants contracting
█
shinyon curumu (Acquisition Price: 9,650 million yen)
Highly convenient property located a 4-minute walk from the new south exit of Shinjuku Station on JR and directly connected to Shinjuku 3-chome Station on the Tokyo Metro Marunouchi Line and Fuku-toshin Line.
Area expects to expand further with the development of the station bldg. scheduled for 2016 opening.
█
Honshu Meieki Bldg. (Acquisition Price: 5,300 million yen)
Property located a 6-minute walk from Exit 7 of Nagoya Station on JR and Nagoya city metro Line and 2-minute walk from underground doorway leading to Nagoya Station underground shopping arcade.
Area of business accumulation growing year by year with large scale redevelopment being planned.
Highly convenient property located a 1-minute walk from Tsukiji Station on the Tokyo Metro Hibiya Line.
Many affiliated companies of those head quarters situated in the area of “Tokyo Station perimeter” or “Ginza” are nearby.
█
Daiwa Tsukijiekimae(Acquisition Price: 1,560 million yen)
Time of Acquisition (’12/12) ’13/5 Time of Acquisition (’13/2) ’13/5
This document is not material disclosed in compliance with the Financial Instruments and Exchange Law or any regulation of similar nature,nor is it intended for the purposes of solicitation. Daiwa Office Investment Corporation advises reader to make investment decisions at their own judgment. 19
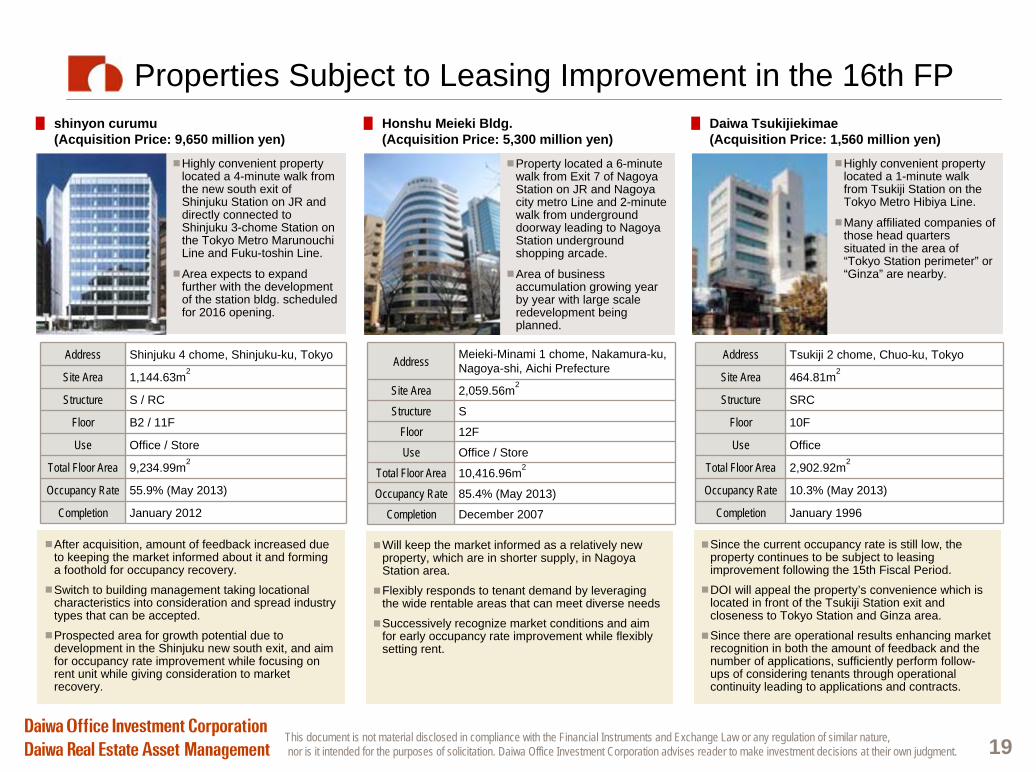
After acquisition, amount of feedback increased due to keeping the market informed about it and forming a foothold for occupancy recovery.
Switch to building management taking locational characteristics into consideration and spread industry types that can be accepted.
Prospected area for growth potential due to development in the Shinjuku new south exit, and aim for occupancy rate improvement while focusing on rent unit while giving consideration to market recovery.
Properties Subject to Leasing Improvement in the 16th FP
Address Shinjuku 4 chome, Shinjuku-ku, Tokyo
Site Area 1,144.63m2
Structure S / RC
Floor B2 / 11F
Use Office / Store
Total Floor Area 9,234.99m2
Occupancy Rate 55.9% (May 2013)
Completion January 2012
Address Meieki-Minami 1 chome, Nakamura-ku,Nagoya-shi, Aichi Prefecture
Site Area 2,059.56m2
Structure S
Floor 12F
Use Office / Store
Total Floor Area 10,416.96m2
Occupancy Rate 85.4% (May 2013)
Completion December 2007
Will keep the market informed as a relatively new property, which are in shorter supply, in Nagoya Station area.
Flexibly responds to tenant demand by leveraging the wide rentable areas that can meet diverse needs
Successively recognize market conditions and aim for early occupancy rate improvement while flexibly setting rent.
Since the current occupancy rate is still low, the property continues to be subject to leasing improvement following the 15th Fiscal Period.
DOI will appeal the property’s convenience which is located in front of the Tsukiji Station exit and closeness to Tokyo Station and Ginza area.
Since there are operational results enhancing market recognition in both the amount of feedback and the number of applications, sufficiently perform follow-ups of considering tenants through operational continuity leading to applications and contracts.
Address Tsukiji 2 chome, Chuo-ku, Tokyo
Site Area 464.81m2
Structure SRC
Floor 10F
Use Office
Total Floor Area 2,902.92m2
Occupancy Rate 10.3% (May 2013)
Completion January 1996
█
shinyon curumu (Acquisition Price: 9,650 million yen)
Highly convenient property located a 4-minute walk from the new south exit of Shinjuku Station on JR and directly connected to Shinjuku 3-chome Station on the Tokyo Metro Marunouchi Line and Fuku-toshin Line.
Area expects to expand further with the development of the station bldg. scheduled for 2016 opening.
█
Honshu Meieki Bldg. (Acquisition Price: 5,300 million yen)
Property located a 6-minute walk from Exit 7 of Nagoya Station on JR and Nagoya city metro Line and 2-minute walk from underground doorway leading to Nagoya Station underground shopping arcade.
Area of business accumulation growing year by year with large scale redevelopment being planned.
Highly convenient property located a 1-minute walk from Tsukiji Station on the Tokyo Metro Hibiya Line.
Many affiliated companies of those head quarters situated in the area of “Tokyo Station perimeter” or “Ginza” are nearby.
█
Daiwa Tsukijiekimae(Acquisition Price: 1,560 million yen)
This document is not material disclosed in compliance with the Financial Instruments and Exchange Law or any regulation of similar nature,nor is it intended for the purposes of solicitation. Daiwa Office Investment Corporation advises reader to make investment decisions at their own judgment.
Energy–Saving Measures, Disaster Prevention Measures, CS Improving Measures, etc.
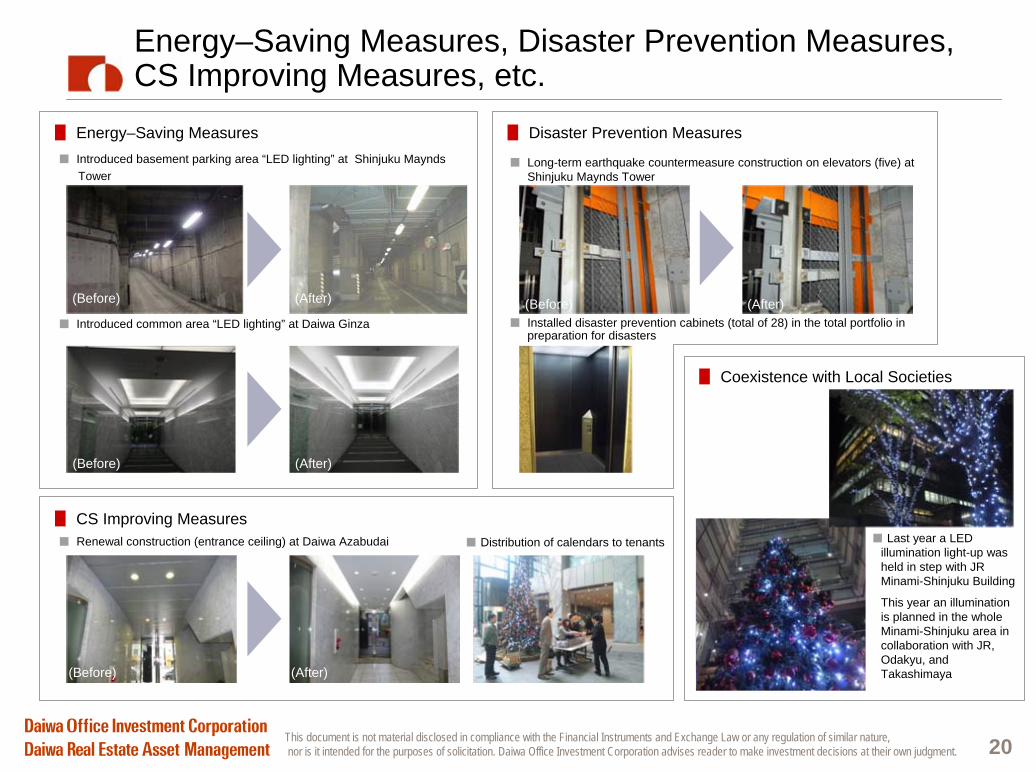
█ Energy–Saving Measures■
Introduced basement parking area “LED lighting” at Shinjuku MayndsTower
■
Introduced common area “LED lighting” at Daiwa Ginza
█ Disaster Prevention Measures
■
Long-term earthquake countermeasure construction on elevators (five) at Shinjuku Maynds Tower
■
Installed disaster prevention cabinets (total of 28) in the total portfolio in preparation for disasters
(After)(Before)
(After)(Before)
█ CS Improving Measures■ Last year a LED
illumination light-up was held in step with JR Minami-Shinjuku Building
This year an illumination is planned in the whole Minami-Shinjuku area in collaboration with JR, Odakyu, and Takashimaya
■ Distribution of calendars to tenants ■
Renewal construction (entrance ceiling) at Daiwa Azabudai
(After)(Before)
(After)(Before)
█ Coexistence with Local Societies
20
This document is not material disclosed in compliance with the Financial Instruments and Exchange Law or any regulation of similar nature,nor is it intended for the purposes of solicitation. Daiwa Office Investment Corporation advises reader to make investment decisions at their own judgment. 21
Actions Taken for Environmental Efforts
(Photo) Daiwa Ginza
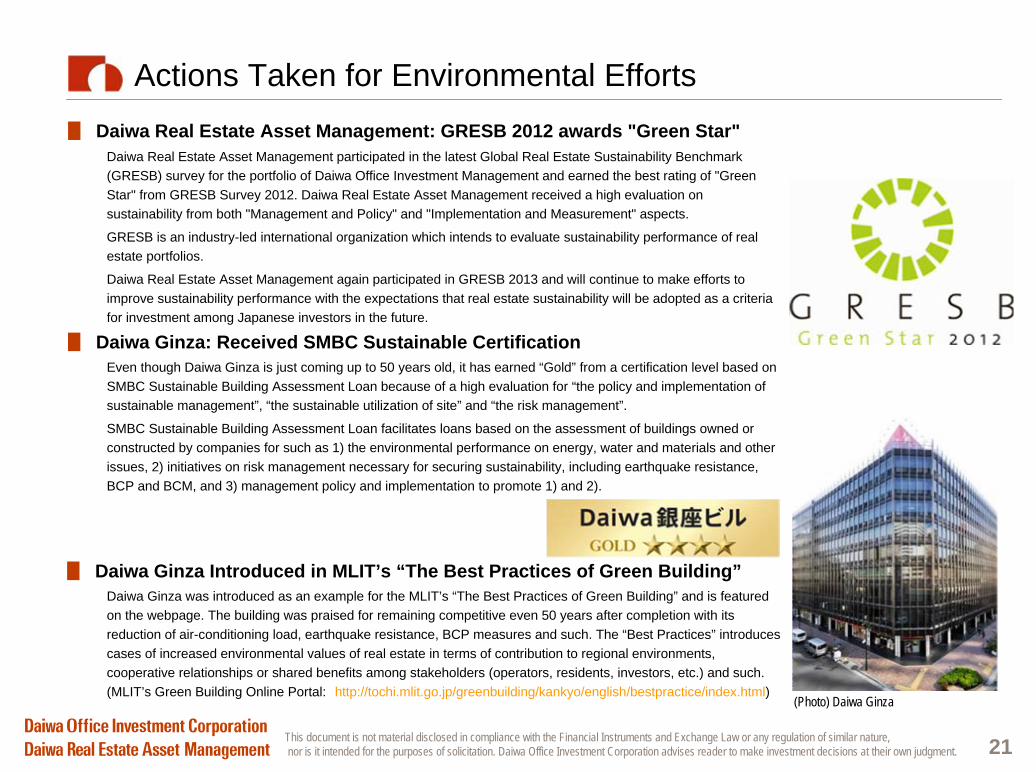
█ Daiwa Ginza: Received SMBC Sustainable CertificationEven though Daiwa Ginza is just coming up to 50 years old, it has earned “Gold” from a certification level based on SMBC Sustainable Building Assessment Loan because of a high evaluation for “the policy and implementation of sustainable management”, “the sustainable utilization of site” and “the risk management”.
SMBC Sustainable Building Assessment Loan facilitates loans based on the assessment of buildings owned or constructed by companies for such as 1) the environmental performance on energy, water and materials and other issues, 2) initiatives on risk management necessary for securing sustainability, including earthquake resistance, BCP and BCM, and 3) management policy and implementation to promote 1) and 2).
█ Daiwa Real Estate Asset Management: GRESB 2012 awards "Green Star"Daiwa Real Estate Asset Management participated in the latest Global Real Estate Sustainability Benchmark (GRESB) survey for the portfolio of Daiwa Office Investment Management and earned the best rating of "Green Star" from GRESB Survey 2012. Daiwa Real Estate Asset Management received a high evaluation on sustainability from both "Management and Policy" and "Implementation and Measurement" aspects.
GRESB is an industry-led international organization which intends to evaluate sustainability performance of real estate portfolios.
Daiwa Real Estate Asset Management again participated in GRESB 2013 and will continue to make efforts to improve sustainability performance with the expectations that real estate sustainability will be adopted as a criteria for investment among Japanese investors in the future.
█ Daiwa Ginza Introduced in MLIT’s “The Best Practices of Green Building”Daiwa Ginza was introduced as an example for the MLIT’s “The Best Practices of Green Building” and is featured on the webpage. The building was praised for remaining competitive even 50 years after completion with its reduction of air-conditioning load, earthquake resistance, BCP measures and such. The “Best Practices” introduces cases of increased environmental values of real estate in terms of contribution to regional environments, cooperative relationships or shared benefits among stakeholders (operators, residents, investors, etc.) and such. (MLIT’s Green Building Online Portal: http://tochi.mlit.go.jp/greenbuilding/kankyo/english/bestpractice/index.html)
External GrowthSection 3
This document is not material disclosed in compliance with the Financial Instruments and Exchange Law or any regulation of similar nature,nor is it intended for the purposes of solicitation. Daiwa Office Investment Corporation advises reader to make investment decisions at their own judgment. 23
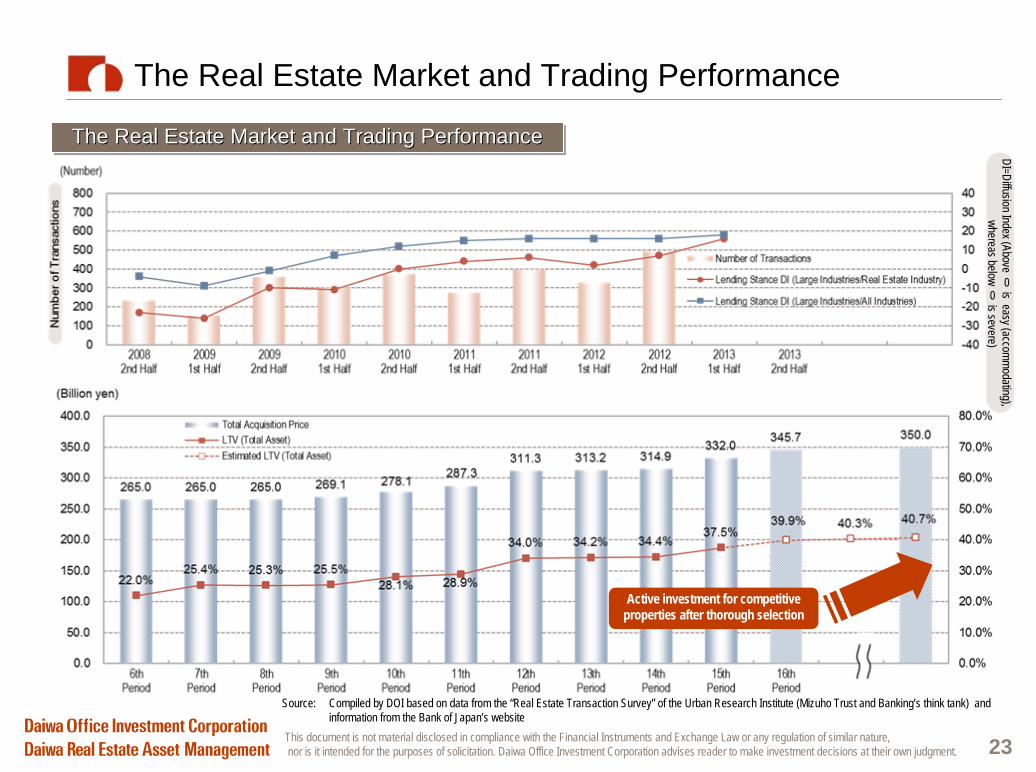
The Real Estate Market and Trading Performance
The Real Estate Market and Trading PerformanceThe Real Estate Market and Trading PerformanceThe Real Estate Market and Trading Performance
DI=Diffusion Index (Above
0 is easy (accommodating),whereas below
0 is severe)
Active investment for competitiveproperties after thorough selection
Source: Compiled by DOI based on data from the “Real Estate Transaction Survey” of the Urban Research Institute (Mizuho Trust and Banking’s think tank) and information from the Bank of Japan’s website
This document is not material disclosed in compliance with the Financial Instruments and Exchange Law or any regulation of similar nature,nor is it intended for the purposes of solicitation. Daiwa Office Investment Corporation advises reader to make investment decisions at their own judgment. 24
Portfolio and Acquisition Policy
End of the 15th FP After acquisition
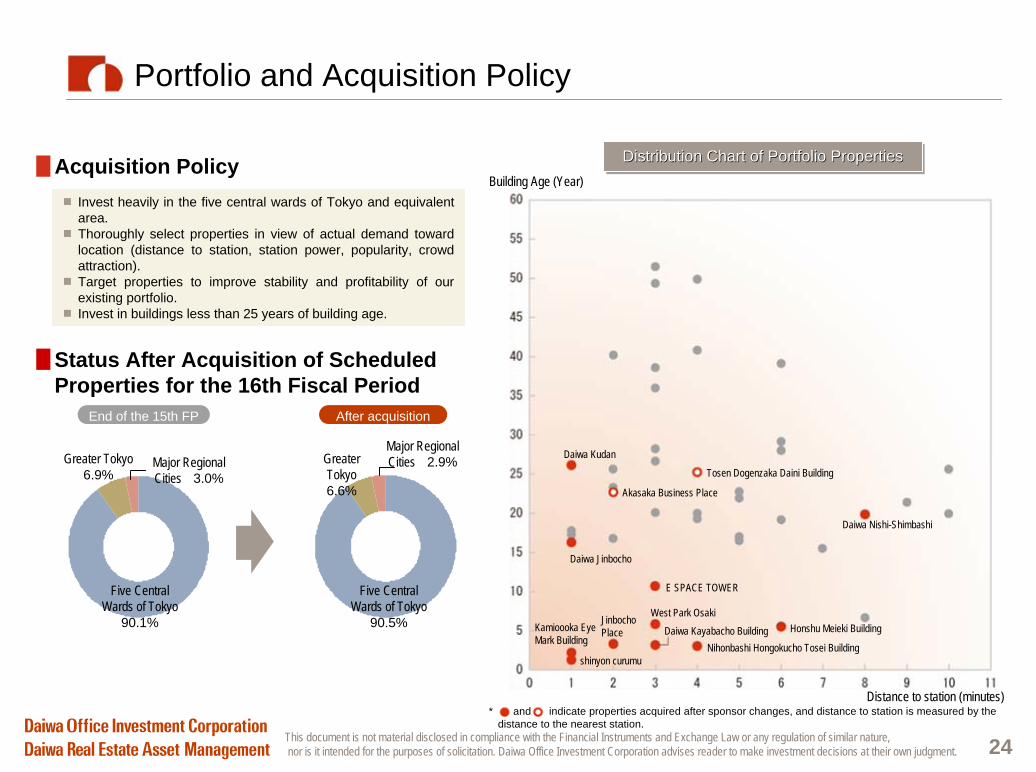
Invest heavily in the five central wards of Tokyo and equivalentarea.Thoroughly select properties in view of actual demand toward location (distance to station, station power, popularity, crowd attraction).Target properties to improve stability and profitability of our existing portfolio.Invest in buildings less than 25 years of building age.
█Acquisition Policy
█Status After Acquisition of Scheduled Properties for the 16th Fiscal Period
Five Central Wards of Tokyo
90.1%
Five Central Wards of Tokyo
90.5%
Greater Tokyo 6.9%
Major Regional Cities 3.0%
Greater Tokyo 6.6%
Major Regional Cities 2.9%
Distribution Chart of Portfolio PropertiesDistribution Chart of Portfolio PropertiesDistribution Chart of Portfolio Properties
Distance to station (minutes)
Building Age (Year)
Akasaka Business Place
Tosen Dogenzaka Daini Building
Daiwa Kudan
Daiwa Nishi-Shimbashi
Kamioooka Eye Mark Building
shinyon curumu
E SPACE TOWER
Honshu Meieki BuildingJinbocho Place
Nihonbashi Hongokucho Tosei Building
West Park Osaki
Daiwa Jinbocho
Daiwa Kayabacho Building
* and indicate properties acquired after sponsor changes, and distance to station is measured by the distance to the nearest station.
This document is not material disclosed in compliance with the Financial Instruments and Exchange Law or any regulation of similar nature,nor is it intended for the purposes of solicitation. Daiwa Office Investment Corporation advises reader to make investment decisions at their own judgment. 25
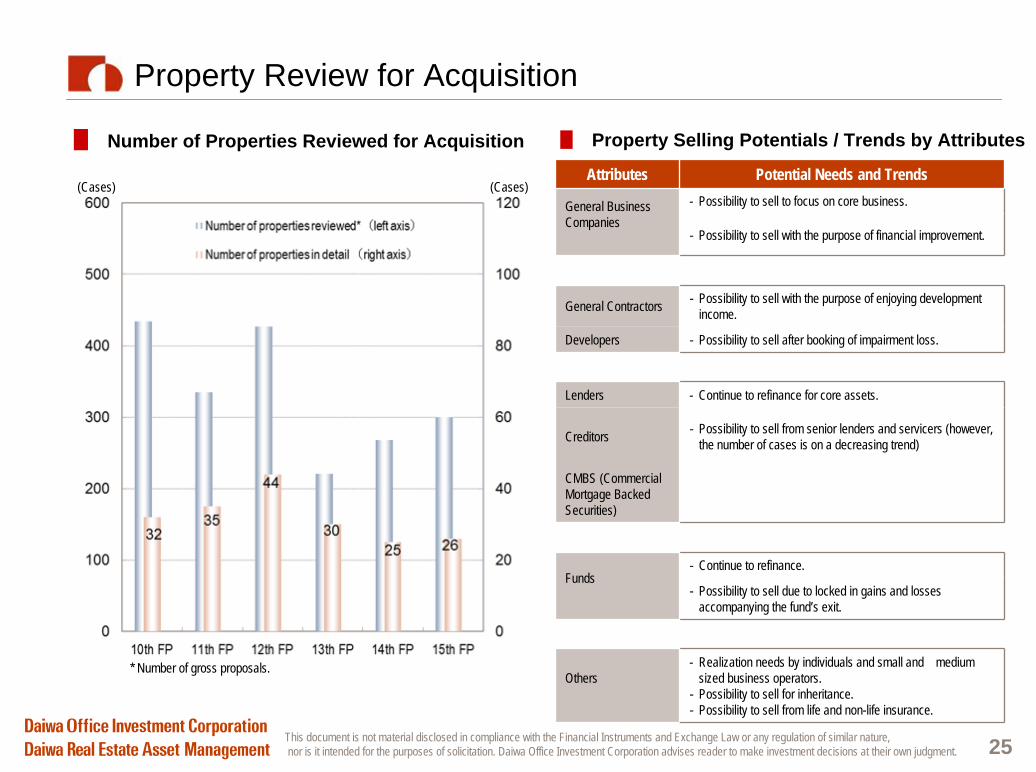
Property Review for Acquisition
█ Property Selling Potentials / Trends by Attributes█ Number of Properties Reviewed for Acquisition
(件) (件) Attributes Potential Needs and Trends
General Business Companies
- Possibility to sell to focus on core business.
- Possibility to sell with the purpose of financial improvement.
General Contractors - Possibility to sell with the purpose of enjoying development income.
Developers - Possibility to sell after booking of impairment loss.
Lenders - Continue to refinance for core assets.
Creditors - Possibility to sell from senior lenders and servicers (however, the number of cases is on a decreasing trend)
CMBS (Commercial Mortgage Backed Securities)
Funds- Continue to refinance.
- Possibility to sell due to locked in gains and losses accompanying the fund’s exit.
Others- Realization needs by individuals and small and medium
sized business operators.- Possibility to sell for inheritance.- Possibility to sell from life and non-life insurance.
* 物件数は情報を入手した延べ件数
(Cases)(Cases)
* Number of gross proposals.
This document is not material disclosed in compliance with the Financial Instruments and Exchange Law or any regulation of similar nature,nor is it intended for the purposes of solicitation. Daiwa Office Investment Corporation advises reader to make investment decisions at their own judgment. 26
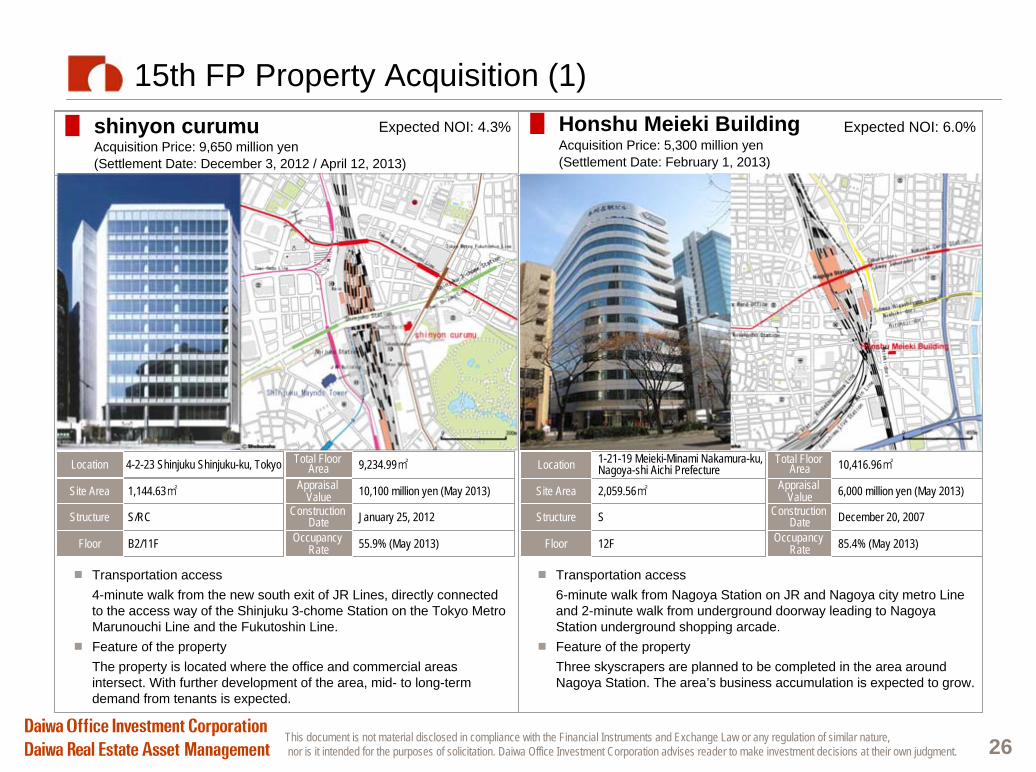
15th FP Property Acquisition (1)
Transportation access4-minute walk from the new south exit of JR Lines, directly connected to the access way of the Shinjuku 3-chome Station on the Tokyo Metro Marunouchi Line and the Fukutoshin Line.Feature of the propertyThe property is located where the office and commercial areas intersect. With further development of the area, mid- to long-term demand from tenants is expected.
█ shinyon curumuAcquisition Price: 9,650 million yen (Settlement Date: December 3, 2012 / April 12, 2013)
Expected NOI: 4.3%
Transportation access6-minute walk from Nagoya Station on JR and Nagoya city metro Line and 2-minute walk from underground doorway leading to Nagoya Station underground shopping arcade.Feature of the propertyThree skyscrapers are planned to be completed in the area around Nagoya Station. The area’s business accumulation is expected to grow.
█ Honshu Meieki BuildingAcquisition Price: 5,300 million yen(Settlement Date: February 1, 2013)
1-21-19 Meieki-Minami Nakamura-ku,Nagoya-shi Aichi Prefecture
2,059.56㎡
S
12F
Location
Site Area
Structure
Floor 85.4% (May 2013)
10,416.96㎡
6,000 million yen (May 2013)
December 20, 2007
Total Floor Area
Appraisal Value
Construction Date
Occupancy Rate
10,100 million yen (May 2013)Appraisal Value
55.9% (May 2013)
9,234.99㎡
January 25, 2012
Total Floor Area
Construction Date
Occupancy Rate
1,144.63㎡Site Area
4-2-23 Shinjuku Shinjuku-ku, Tokyo
S/RC
B2/11F
Location
Structure
Floor
Expected NOI: 6.0%
This document is not material disclosed in compliance with the Financial Instruments and Exchange Law or any regulation of similar nature,nor is it intended for the purposes of solicitation. Daiwa Office Investment Corporation advises reader to make investment decisions at their own judgment. 27
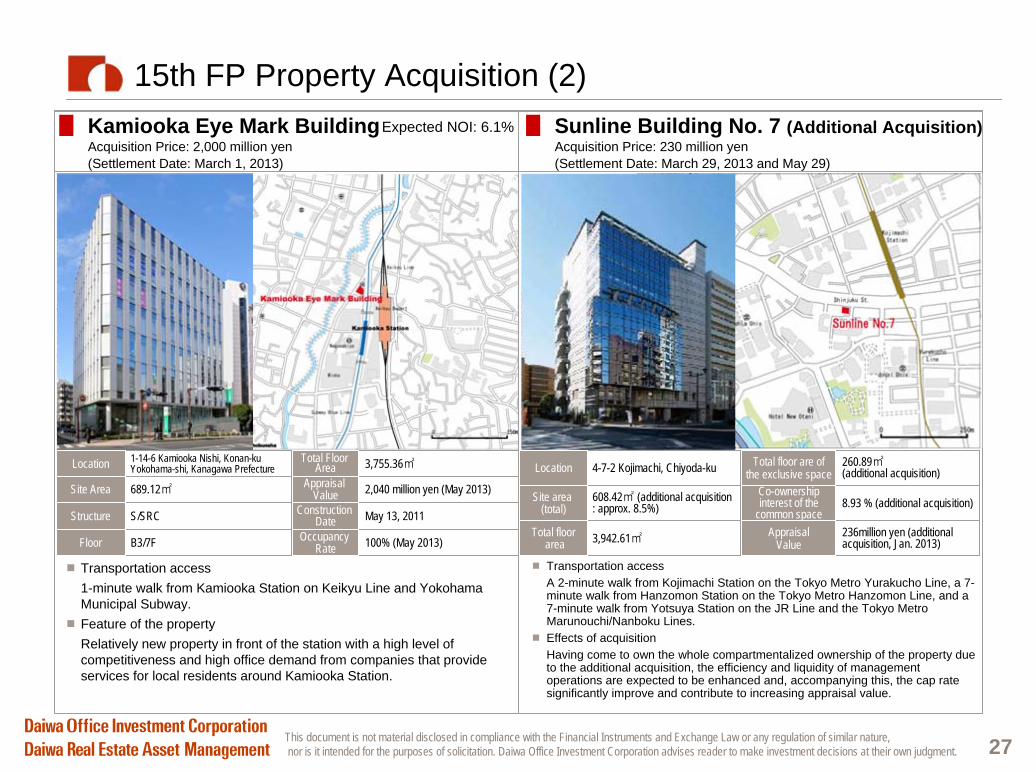
15th FP Property Acquisition (2)
Transportation accessA 2-minute walk from Kojimachi Station on the Tokyo Metro Yurakucho Line, a 7- minute walk from Hanzomon Station on the Tokyo Metro Hanzomon Line, and a 7-minute walk from Yotsuya Station on the JR Line and the Tokyo Metro Marunouchi/Nanboku Lines.Effects of acquisitionHaving come to own the whole compartmentalized ownership of the property due to the additional acquisition, the efficiency and liquidity of management operations are expected to be enhanced and, accompanying this, the cap rate significantly improve and contribute to increasing appraisal value.
█ Sunline Building No. 7 (Additional Acquisition)Acquisition Price: 230 million yen (Settlement Date: March 29, 2013 and May 29)
Transportation access1-minute walk from Kamiooka Station on Keikyu Line and Yokohama Municipal Subway.Feature of the propertyRelatively new property in front of the station with a high level of competitiveness and high office demand from companies that provide services for local residents around Kamiooka Station.
█ Kamiooka Eye Mark BuildingAcquisition Price: 2,000 million yen(Settlement Date: March 1, 2013)
Expected NOI: 6.1%
100% (May 2013)
3,755.36㎡
2,040 million yen (May 2013)
May 13, 2011
Total Floor Area
Appraisal Value
Construction Date
Occupancy Rate
1-14-6 Kamiooka Nishi, Konan-kuYokohama-shi, Kanagawa Prefecture
689.12㎡
S/SRC
B3/7F
Location
Site Area
Structure
Floor
4-7-2 Kojimachi, Chiyoda-ku
608.42㎡ (additional acquisition: approx. 8.5%)
3,942.61㎡
Location
Site area (total)
Total floorarea
260.89㎡(additional acquisition)
8.93 % (additional acquisition)
236million yen (additional acquisition, Jan. 2013)
Total floor are of the exclusive space
Co-ownership interest of the
common spaceAppraisal
Value
This document is not material disclosed in compliance with the Financial Instruments and Exchange Law or any regulation of similar nature,nor is it intended for the purposes of solicitation. Daiwa Office Investment Corporation advises reader to make investment decisions at their own judgment. 28
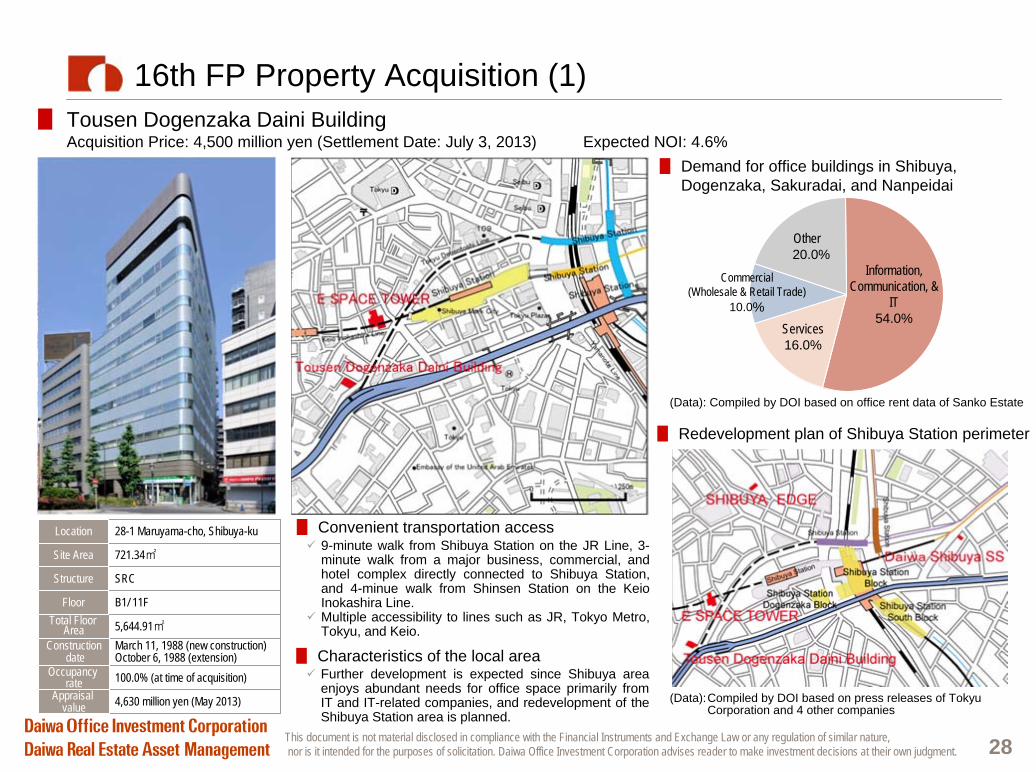
16th FP Property Acquisition (1)█ Tousen Dogenzaka Daini Building
Acquisition Price: 4,500 million yen (Settlement Date: July 3, 2013) Expected NOI: 4.6%
9-minute walk from Shibuya Station on the JR Line, 3-minute walk from a major business, commercial, and hotel complex directly connected to Shibuya Station, and 4-minue walk from Shinsen Station on the Keio Inokashira Line.Multiple accessibility to lines such as JR, Tokyo Metro, Tokyu, and Keio.
█ Convenient transportation access
█ Redevelopment plan of Shibuya Station perimeter
Information, Communication, &
IT54.0%
Services16.0%
Commercial (Wholesale & Retail Trade)
10.0%
Other20.0%
Further development is expected since Shibuya area enjoys abundant needs for office space primarily from IT and IT-related companies, and redevelopment of the Shibuya Station area is planned.
█ Characteristics of the local area
(Data):Compiled by DOI based on press releases of Tokyu Corporation and 4 other companies
█ Demand for office buildings in Shibuya, Dogenzaka, Sakuradai, and Nanpeidai
(Data): Compiled by DOI based on office rent data of Sanko Estate
March 11, 1988 (new construction)October 6, 1988 (extension)
Constructiondate
4,630 million yen (May 2013)
5,644.91㎡
100.0% (at time of acquisition)
Total Floor Area
Occupancy rate
Appraisal value
721.34㎡Site Area
28-1 Maruyama-cho, Shibuya-ku
SRC
B1/ 11F
Location
Structure
Floor
This document is not material disclosed in compliance with the Financial Instruments and Exchange Law or any regulation of similar nature,nor is it intended for the purposes of solicitation. Daiwa Office Investment Corporation advises reader to make investment decisions at their own judgment. 29
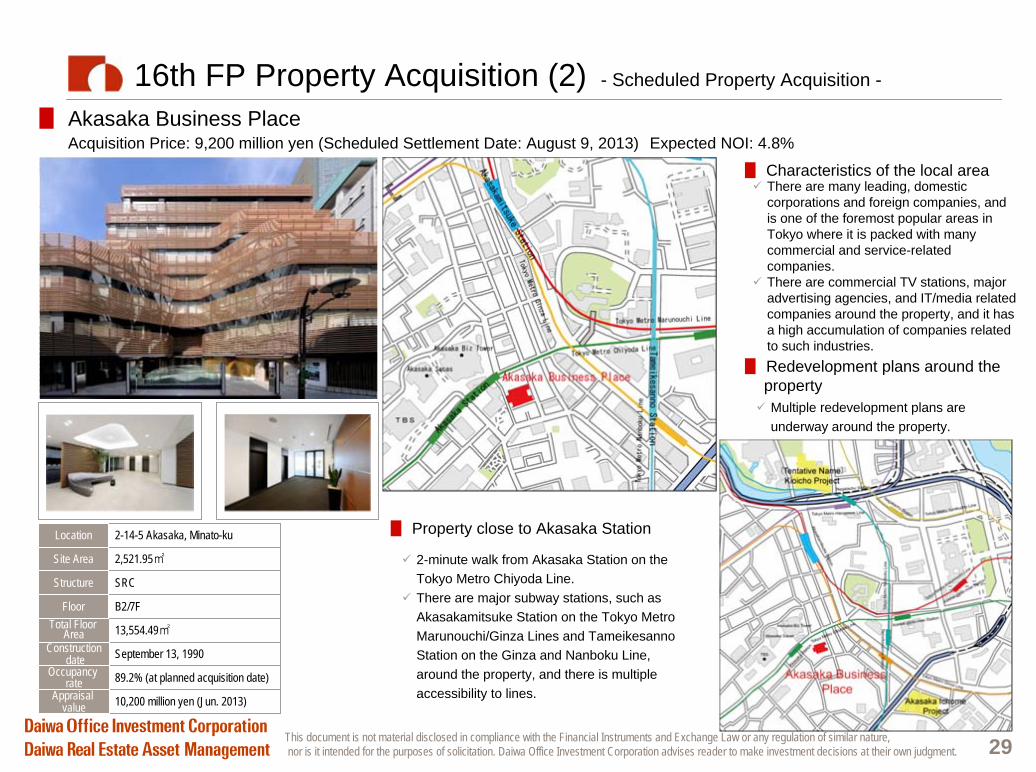
16th FP Property Acquisition (2) - Scheduled Property Acquisition -
█ Akasaka Business PlaceAcquisition Price: 9,200 million yen (Scheduled Settlement Date: August 9, 2013) Expected NOI: 4.8%
2-minute walk from Akasaka Station on the Tokyo Metro Chiyoda Line. There are major subway stations, such as Akasakamitsuke Station on the Tokyo Metro Marunouchi/Ginza Lines and Tameikesanno Station on the Ginza and Nanboku Line, around the property, and there is multiple accessibility to lines.
Multiple redevelopment plans are underway around the property.
█ Redevelopment plans around the property
█ Property close to Akasaka Station
There are many leading, domestic corporations and foreign companies, and is one of the foremost popular areas in Tokyo where it is packed with many commercial and service-related companies.There are commercial TV stations, major advertising agencies, and IT/media related companies around the property, and it has a high accumulation of companies related to such industries.
█ Characteristics of the local area
September 13, 1990Constructiondate
10,200 million yen (Jun. 2013)
13,554.49㎡
89.2% (at planned acquisition date)
Total Floor Area
Occupancy rate
Appraisal value
2,521.95㎡Site Area
2-14-5 Akasaka, Minato-ku
SRC
B2/7F
Location
Structure
Floor

This document is not material disclosed in compliance with the Financial Instruments and Exchange Law or any regulation of similar nature,nor is it intended for the purposes of solicitation. Daiwa Office Investment Corporation advises reader to make investment decisions at their own judgment.
Acquisition Period 14th Fiscal Period 15th Fiscal Period 16th Fiscal Period
Total
Property name West Park Osaki shinyon curumu Hoshu Meieki Building Kamiooka Eye Mark Building
Tousen Dogenzaka Daini Building Akasaka Business Place
Address Osaki Shinagawa-ku, Tokyo
Shinjuku Shinjuku-ku, Tokyo
Meieki-Minami Nakamura- ku, Nagoya-shi Aichi
Kamiooka Nishi, Konan-ku Yokohama-shi, Kanagawa Shibuya-ku, Tokyo Minato-ku, Tokyo -
Acquisition Price 1,650 million yen 9,650 million yen 5,300 million yen 2,000 million yen 4,500 million yen 9,200 million yen 80,321 million yen
Seller MCR Six GK Two domesticindustrial companies
Domestic specialpurpose company Shimizu Corporation Domestic special purpose
company Hakuba Capital 1 TMK -
Acquisition date September 18, 2012 December 3, 2012 /April 12, 2013 February 1, 2013 March 1,2013 July 3, 2013 August 9, 2013 (scheduled) -
Age of bldg. * 5.0 years 1.0 years 5.1 years 1.8 years 25.3 years 22.9 years 10.9 years **NOI yield * 6.1% 4.3% 6.0% 6.1% 4.6% 4.8% -
Properties Acquired after Sponsor ChangeAcquisition Period 9th Fiscal Period 10th Fiscal Period 11th Fiscal Period 12th Fiscal Period 13th Fiscal Period
Property name Daiwa Jimbocho Daiwa Nishi-Shimbashi Daiwa Kudan Daiwa Kayabacho Building Jimbocho Place E SPACE TOWER Nihonbashi-Hongokucho Tosei Build
Address Kanda Jimbocho, Chiyoda-ku, Tokyo
Nishi-Shimbashi,Minato-ku, Tokyo
Kudan Minami, Chiyoda-ku, Tokyo
Nihonbashi-Kayabacho, Chuo-ku, Tokyo
Kanda Jimbocho, Chiyoda-ku, Tokyo
Maruyamacho, Shibuya-ku, Tokyo
Nihonbashi-Hongokucho, Chuo-ku, Tokyo
Acquisition Price 4,150 million yen 5,000 million yen 4,000 million yen 5,600 million yen 3,550 million yen 24,000 million yen 1,721 million yen
Seller ORIX JREIT Inc. Japan Core Asset II Ltd. Shining Nova the Fifth B TMK Daiwa Property Co., Ltd. Tokyu Land Corporation Endeavor Realty Fund Ltd. Tosei Corporation
Acquisition date March 10, 2010 August 13, 2010 September. 2, 2010 March 25, 2011 March 29, 2011 July 8, 2011 May 11,2012Age of bldg. * 13.0 years 17.0 years 23.4 years 0.9 years 1.1 years 8.7 years 2.0 yearsNOI yield * 6.0% 5.5% 5.3% 5.1% 5.1% 4.8% 5.3%
* Numbers of the building age and NOI yield are based on the time of acquisition.** The building age is calculated by weighted average of the acquisition price.
30

Financial Strategy
Section 4
This document is not material disclosed in compliance with the Financial Instruments and Exchange Law or any regulation of similar nature,nor is it intended for the purposes of solicitation. Daiwa Office Investment Corporation advises reader to make investment decisions at their own judgment.
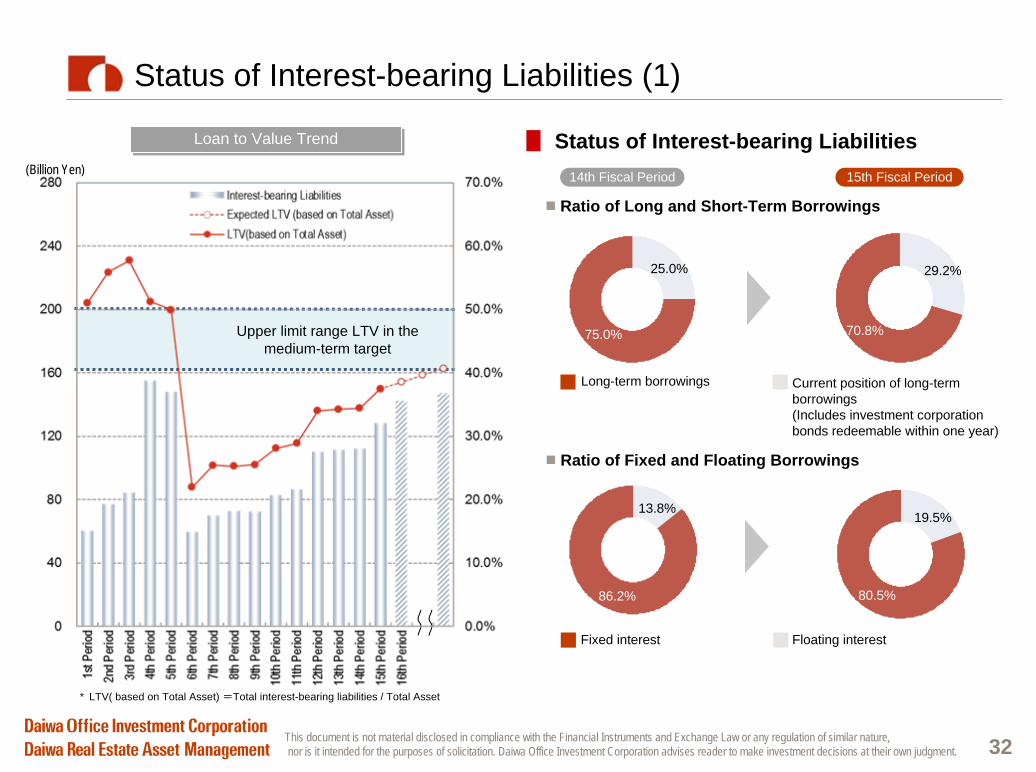
19.5%
80.5%
29.2%
70.8%
25.0%
75.0%
13.8%
86.2%
32
Status of Interest-bearing Liabilities (1)
Loan to Value TrendLoan to Value Trend
14th Fiscal Period 15th Fiscal Period
Current position of long-term borrowings(Includes investment corporation bonds redeemable within one year)
Long-term borrowings
Fixed interest Floating interest
(Billion Yen)
Ratio of Long and Short-Term Borrowings
Ratio of Fixed and Floating Borrowings
█ Status of Interest-bearing Liabilities
Upper limit range LTV in the medium-term target
* LTV( based on Total Asset) =Total interest-bearing liabilities / Total Asset
This document is not material disclosed in compliance with the Financial Instruments and Exchange Law or any regulation of similar nature,nor is it intended for the purposes of solicitation. Daiwa Office Investment Corporation advises reader to make investment decisions at their own judgment. 33
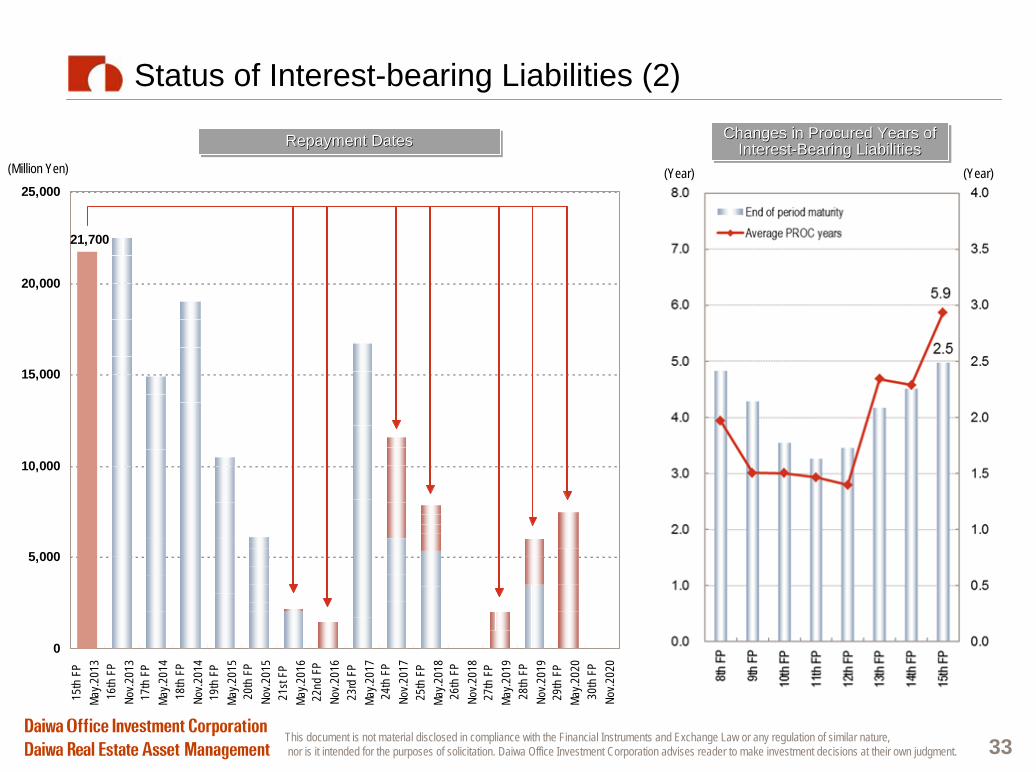
Status of Interest-bearing Liabilities (2)
Repayment DatesRepayment DatesRepayment Dates Changes in Procured Years of Interest-Bearing Liabilities
Changes in Procured Years of Changes in Procured Years of InterestInterest--Bearing LiabilitiesBearing Liabilities
(Million Yen) (Year) (Year)
21,700
0
5,000
10,000
15,000
20,000
25,000
15th
FP
May.2
013
16th
FP
Nov.2
013
17th
FP
May.2
014
18th
FP
Nov.2
014
19th
FP
May.2
015
20th
FP
Nov.2
015
21st
FPMa
y.201
622
nd F
PNo
v.201
623
rd F
PMa
y.201
724
th F
PNo
v.201
725
th F
PMa
y.201
826
th F
PNo
v.201
827
th F
PMa
y.201
928
th F
PNo
v.201
929
th F
PMa
y.202
030
th F
PNo
v.202
0
This document is not material disclosed in compliance with the Financial Instruments and Exchange Law or any regulation of similar nature,nor is it intended for the purposes of solicitation. Daiwa Office Investment Corporation advises reader to make investment decisions at their own judgment. 34
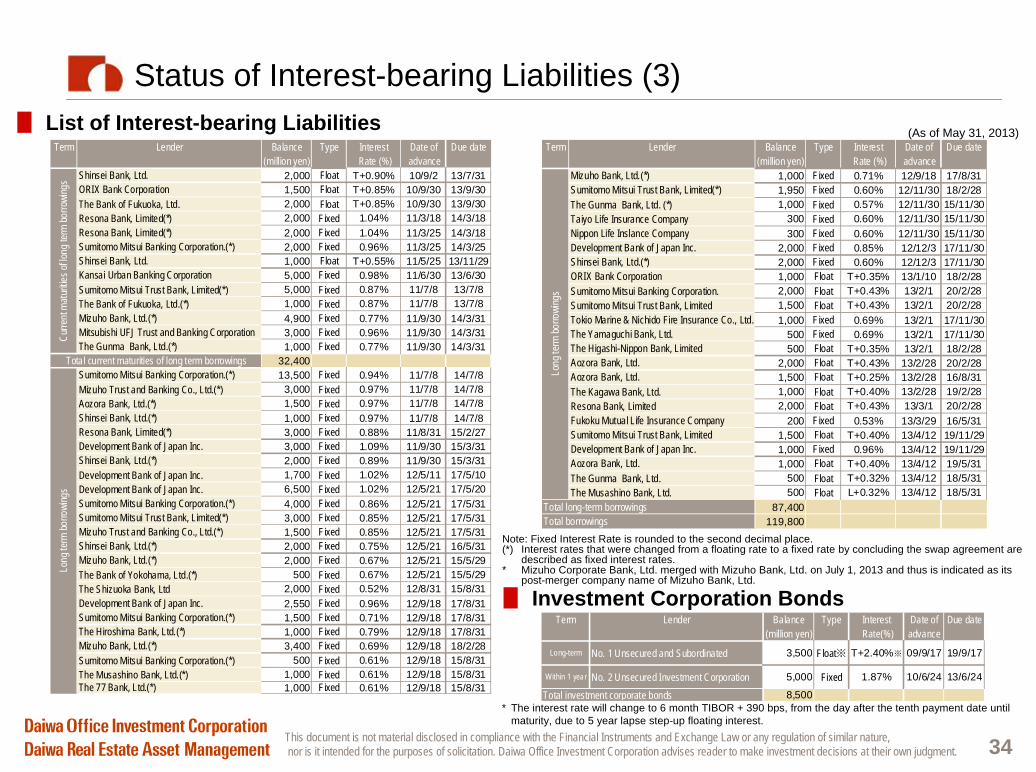
Status of Interest-bearing Liabilities (3)█ List of Interest-bearing Liabilities
█ Investment Corporation Bonds
Note: Fixed Interest Rate is rounded to the second decimal place. (*) Interest rates that were changed from a floating rate to a fixed rate by concluding the swap agreement are
described as fixed interest rates.* Mizuho Corporate Bank, Ltd. merged with Mizuho Bank, Ltd. on July 1, 2013 and thus is indicated as its
post-merger company name of Mizuho Bank, Ltd.
* The interest rate will change to 6 month TIBOR + 390 bps, from the day after the tenth payment date until maturity, due to 5 year lapse step-up floating interest.
(As of May 31, 2013)Term Lender Balance Type Interest Date of Due date
(million yen) Rate (%) advanceShinsei Bank, Ltd. 2,000 Float T+0.90% 10/9/2 13/7/31ORIX Bank Corporation 1,500 Float T+0.85% 10/9/30 13/9/30The Bank of Fukuoka, Ltd. 2,000 Float T+0.85% 10/9/30 13/9/30Resona Bank, Limited(*) 2,000 Fixed 1.04% 11/3/18 14/3/18Resona Bank, Limited(*) 2,000 Fixed 1.04% 11/3/25 14/3/18Sumitomo Mitsui Banking Corporation.(*) 2,000 Fixed 0.96% 11/3/25 14/3/25Shinsei Bank, Ltd. 1,000 Float T+0.55% 11/5/25 13/11/29Kansai Urban Banking Corporation 5,000 Fixed 0.98% 11/6/30 13/6/30Sumitomo Mitsui Trust Bank, Limited(*) 5,000 Fixed 0.87% 11/7/8 13/7/8The Bank of Fukuoka, Ltd.(*) 1,000 Fixed 0.87% 11/7/8 13/7/8Mizuho Bank, Ltd.(*) 4,900 Fixed 0.77% 11/9/30 14/3/31Mitsubishi UFJ Trust and Banking Corporation 3,000 Fixed 0.96% 11/9/30 14/3/31The Gunma Bank, Ltd.(*) 1,000 Fixed 0.77% 11/9/30 14/3/31
32,400Sumitomo Mitsui Banking Corporation.(*) 13,500 Fixed 0.94% 11/7/8 14/7/8Mizuho Trust and Banking Co., Ltd.(*) 3,000 Fixed 0.97% 11/7/8 14/7/8Aozora Bank, Ltd.(*) 1,500 Fixed 0.97% 11/7/8 14/7/8Shinsei Bank, Ltd.(*) 1,000 Fixed 0.97% 11/7/8 14/7/8Resona Bank, Limited(*) 3,000 Fixed 0.88% 11/8/31 15/2/27Development Bank of Japan Inc. 3,000 Fixed 1.09% 11/9/30 15/3/31Shinsei Bank, Ltd.(*) 2,000 Fixed 0.89% 11/9/30 15/3/31Development Bank of Japan Inc. 1,700 Fixed 1.02% 12/5/11 17/5/10Development Bank of Japan Inc. 6,500 Fixed 1.02% 12/5/21 17/5/20Sumitomo Mitsui Banking Corporation.(*) 4,000 Fixed 0.86% 12/5/21 17/5/31Sumitomo Mitsui Trust Bank, Limited(*) 3,000 Fixed 0.85% 12/5/21 17/5/31Mizuho Trust and Banking Co., Ltd.(*) 1,500 Fixed 0.85% 12/5/21 17/5/31Shinsei Bank, Ltd.(*) 2,000 Fixed 0.75% 12/5/21 16/5/31Mizuho Bank, Ltd.(*) 2,000 Fixed 0.67% 12/5/21 15/5/29The Bank of Yokohama, Ltd.(*) 500 Fixed 0.67% 12/5/21 15/5/29The Shizuoka Bank, Ltd 2,000 Fixed 0.52% 12/8/31 15/8/31Development Bank of Japan Inc. 2,550 Fixed 0.96% 12/9/18 17/8/31Sumitomo Mitsui Banking Corporation.(*) 1,500 Fixed 0.71% 12/9/18 17/8/31The Hiroshima Bank, Ltd.(*) 1,000 Fixed 0.79% 12/9/18 17/8/31Mizuho Bank, Ltd.(*) 3,400 Fixed 0.69% 12/9/18 18/2/28Sumitomo Mitsui Banking Corporation.(*) 500 Fixed 0.61% 12/9/18 15/8/31The Musashino Bank, Ltd.(*) 1,000 Fixed 0.61% 12/9/18 15/8/31The 77 Bank, Ltd.(*) 1,000 Fixed 0.61% 12/9/18 15/8/31
Long
term
borro
wing
sCu
rrent
mat
uritie
s of lo
ng te
rm bo
rrowi
ngs
Total current maturities of long term borrowings
Term Lender Balance Type Interest Date of Due date(million yen) Rate (%) advance
Mizuho Bank, Ltd.(*) 1,000 Fixed 0.71% 12/9/18 17/8/31Sumitomo Mitsui Trust Bank, Limited(*) 1,950 Fixed 0.60% 12/11/30 18/2/28The Gunma Bank, Ltd. (*) 1,000 Fixed 0.57% 12/11/30 15/11/30Taiyo Life Insurance Company 300 Fixed 0.60% 12/11/30 15/11/30Nippon Life Inslance Company 300 Fixed 0.60% 12/11/30 15/11/30Development Bank of Japan Inc. 2,000 Fixed 0.85% 12/12/3 17/11/30Shinsei Bank, Ltd.(*) 2,000 Fixed 0.60% 12/12/3 17/11/30ORIX Bank Corporation 1,000 Float T+0.35% 13/1/10 18/2/28Sumitomo Mitsui Banking Corporation. 2,000 Float T+0.43% 13/2/1 20/2/28Sumitomo Mitsui Trust Bank, Limited 1,500 Float T+0.43% 13/2/1 20/2/28Tokio Marine & Nichido Fire Insurance Co., Ltd. 1,000 Fixed 0.69% 13/2/1 17/11/30The Yamaguchi Bank, Ltd. 500 Fixed 0.69% 13/2/1 17/11/30The Higashi-Nippon Bank, Limited 500 Float T+0.35% 13/2/1 18/2/28Aozora Bank, Ltd. 2,000 Float T+0.43% 13/2/28 20/2/28Aozora Bank, Ltd. 1,500 Float T+0.25% 13/2/28 16/8/31The Kagawa Bank, Ltd. 1,000 Float T+0.40% 13/2/28 19/2/28Resona Bank, Limited 2,000 Float T+0.43% 13/3/1 20/2/28Fukoku Mutual Life Insurance Company 200 Fixed 0.53% 13/3/29 16/5/31Sumitomo Mitsui Trust Bank, Limited 1,500 Float T+0.40% 13/4/12 19/11/29Development Bank of Japan Inc. 1,000 Fixed 0.96% 13/4/12 19/11/29Aozora Bank, Ltd. 1,000 Float T+0.40% 13/4/12 19/5/31The Gunma Bank, Ltd. 500 Float T+0.32% 13/4/12 18/5/31The Musashino Bank, Ltd. 500 Float L+0.32% 13/4/12 18/5/31
Total long-term borrowings 87,400Total borrowings 119,800
Long
term
borro
wing
s
Term Lender Balance Type Interest Date of Due date(million yen) Rate(%) advance
Long-term No. 1 Unsecured and Subordinated 3,500 Float※ T+2.40%※ 09/9/17 19/9/17
Within 1 year No. 2 Unsecured Investment Corporation 5,000 Fixed 1.87% 10/6/24 13/6/24
Total investment corporate bonds 8,500
This document is not material disclosed in compliance with the Financial Instruments and Exchange Law or any regulation of similar nature,nor is it intended for the purposes of solicitation. Daiwa Office Investment Corporation advises reader to make investment decisions at their own judgment. 35
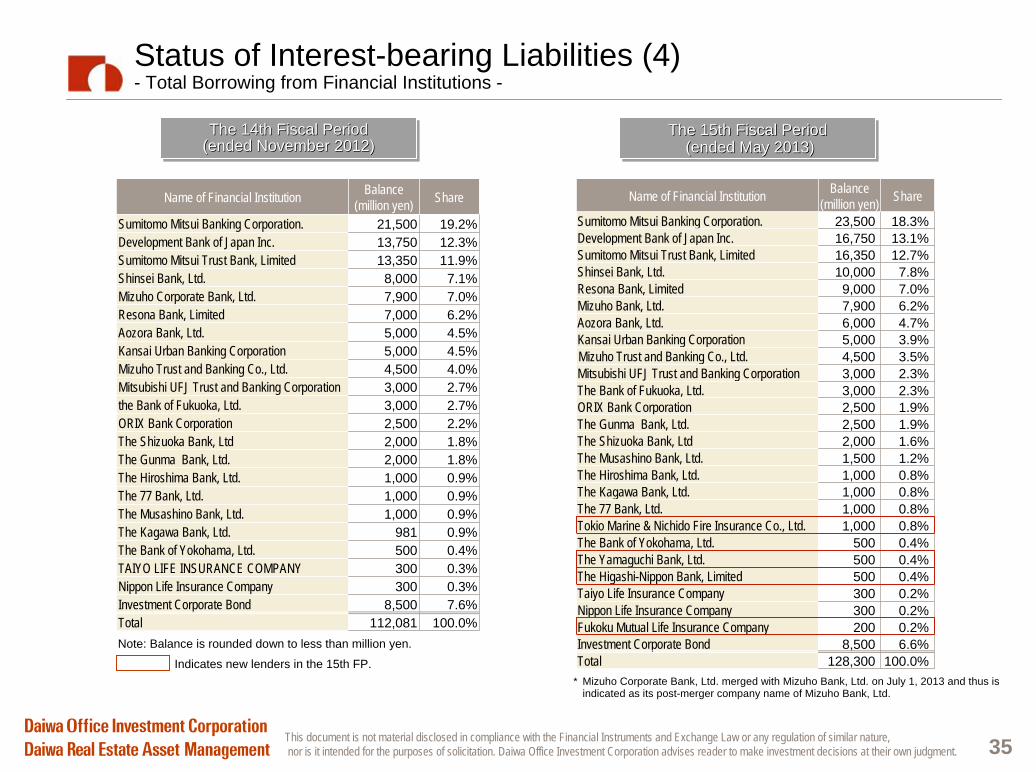
Status of Interest-bearing Liabilities (4) - Total Borrowing from Financial Institutions -
The 14th Fiscal Period(ended November 2012)The 14th Fiscal PeriodThe 14th Fiscal Period
(ended November 2012)(ended November 2012)The 15th Fiscal Period
(ended May 2013)The 15th Fiscal PeriodThe 15th Fiscal Period
(ended May 2013)(ended May 2013)
Indicates new lenders in the 15th FP.* Mizuho Corporate Bank, Ltd. merged with Mizuho Bank, Ltd. on July 1, 2013 and thus is
indicated as its post-merger company name of Mizuho Bank, Ltd.
Name of Financial Institution Balance (million yen) Share
Sumitomo Mitsui Banking Corporation. 21,500 19.2%Development Bank of Japan Inc. 13,750 12.3%Sumitomo Mitsui Trust Bank, Limited 13,350 11.9%Shinsei Bank, Ltd. 8,000 7.1%Mizuho Corporate Bank, Ltd. 7,900 7.0%Resona Bank, Limited 7,000 6.2%Aozora Bank, Ltd. 5,000 4.5%Kansai Urban Banking Corporation 5,000 4.5%Mizuho Trust and Banking Co., Ltd. 4,500 4.0%Mitsubishi UFJ Trust and Banking Corporation 3,000 2.7%the Bank of Fukuoka, Ltd. 3,000 2.7%ORIX Bank Corporation 2,500 2.2%The Shizuoka Bank, Ltd 2,000 1.8%The Gunma Bank, Ltd. 2,000 1.8%The Hiroshima Bank, Ltd. 1,000 0.9%The 77 Bank, Ltd. 1,000 0.9%The Musashino Bank, Ltd. 1,000 0.9%The Kagawa Bank, Ltd. 981 0.9%The Bank of Yokohama, Ltd. 500 0.4%TAIYO LIFE INSURANCE COMPANY 300 0.3%Nippon Life Insurance Company 300 0.3%Investment Corporate Bond 8,500 7.6%Total 112,081 100.0%
Name of Financial Institution Balance (million yen) Share
Sumitomo Mitsui Banking Corporation. 23,500 18.3%Development Bank of Japan Inc. 16,750 13.1%Sumitomo Mitsui Trust Bank, Limited 16,350 12.7%Shinsei Bank, Ltd. 10,000 7.8%Resona Bank, Limited 9,000 7.0%Mizuho Bank, Ltd. 7,900 6.2%Aozora Bank, Ltd. 6,000 4.7%Kansai Urban Banking Corporation 5,000 3.9%Mizuho Trust and Banking Co., Ltd. 4,500 3.5%Mitsubishi UFJ Trust and Banking Corporation 3,000 2.3%The Bank of Fukuoka, Ltd. 3,000 2.3%ORIX Bank Corporation 2,500 1.9%The Gunma Bank, Ltd. 2,500 1.9%The Shizuoka Bank, Ltd 2,000 1.6%The Musashino Bank, Ltd. 1,500 1.2%The Hiroshima Bank, Ltd. 1,000 0.8%The Kagawa Bank, Ltd. 1,000 0.8%The 77 Bank, Ltd. 1,000 0.8%Tokio Marine & Nichido Fire Insurance Co., Ltd. 1,000 0.8%The Bank of Yokohama, Ltd. 500 0.4%The Yamaguchi Bank, Ltd. 500 0.4%The Higashi-Nippon Bank, Limited 500 0.4%Taiyo Life Insurance Company 300 0.2%Nippon Life Insurance Company 300 0.2%Fukoku Mutual Life Insurance Company 200 0.2%Investment Corporate Bond 8,500 6.6%Total 128,300 100.0%
Note: Balance is rounded down to less than million yen.

This document is not material disclosed in compliance with the Financial Instruments and Exchange Law or any regulation of similar nature,nor is it intended for the purposes of solicitation. Daiwa Office Investment Corporation advises reader to make investment decisions at their own judgment. 36
Unitholders
█ List of Top 10 Investors █ Unitholders’ Share by Investor Type
Investor Type
14th Fiscal Period
Number of Unit
15th Fiscal Period
Number of Unit
Change of Unit Rate*
Individuals 34,742 31,108 -3,634 7.86%
Financial Institutions 148,487 143,739 -4,748 36.32%
Commercial Bank 0 0 0 0.00%
Regional Bank 1,452 1,158 -294 0.29%
Trust Bank 145,839 141,596 -4,243 35.77%
Life Insurance 498 461 -37 0.12%
Non-life Insurance 0 0 0 0.00%
Other Financial Institutions 698 524 -174 0.13%
Other Domestic Corporation 183,787 191,238 7,451 48.32%
Foreigner 27,016 28,192 1,176 7.12%
Securities 1,766 1,521 -245 0.38%
Total 395,798 395,798 0 100.00%
No. Investor Name
14th Fiscal Period
Number of Unit
15th Fiscal Period
Number of Unit
Change of Unit Rate*
1 Daiwa Investment Management Inc. 128,905 128,905 0 32.57%
2 Japan trustee Services Bank, Ltd. (Trust Account) 82,708 67,897 -14,811 17.15%
3 Daiwa Securities Group Inc. 51,893 59,321 7,428 14.99%
4 Trust&Custody Services Bank, Ltd. (Securities Investment Trust Account) 23,769 28,640 4,871 7.24%
5 The Master Trust Bank of Japan, Ltd. (Investment Trust Account) 19,212 23,543 4,331 5.95%
6 The Nomura Trust and Banking Co,. Ltd. (Investment Trust Account) 20,150 20,681 531 5.23%
7 Nomura Bank (Luxembourg) S.A. 7,359 3,686 -3,673 0.93%
8 MSIP CLIENT SECURITIES 10 2,265 2,255 0.57%
9 Individuals 2,520 1,940 -580 0.49%
10 State Street Bank and Trust Company 505223 1,593 1,789 196 0.45%
(*) Rounded to the second decimal place. (*) Rounded to the second decimal place.
This document is not material disclosed in compliance with the Financial Instruments and Exchange Law or any regulation of similar nature,nor is it intended for the purposes of solicitation. Daiwa Office Investment Corporation advises reader to make investment decisions at their own judgment. 37
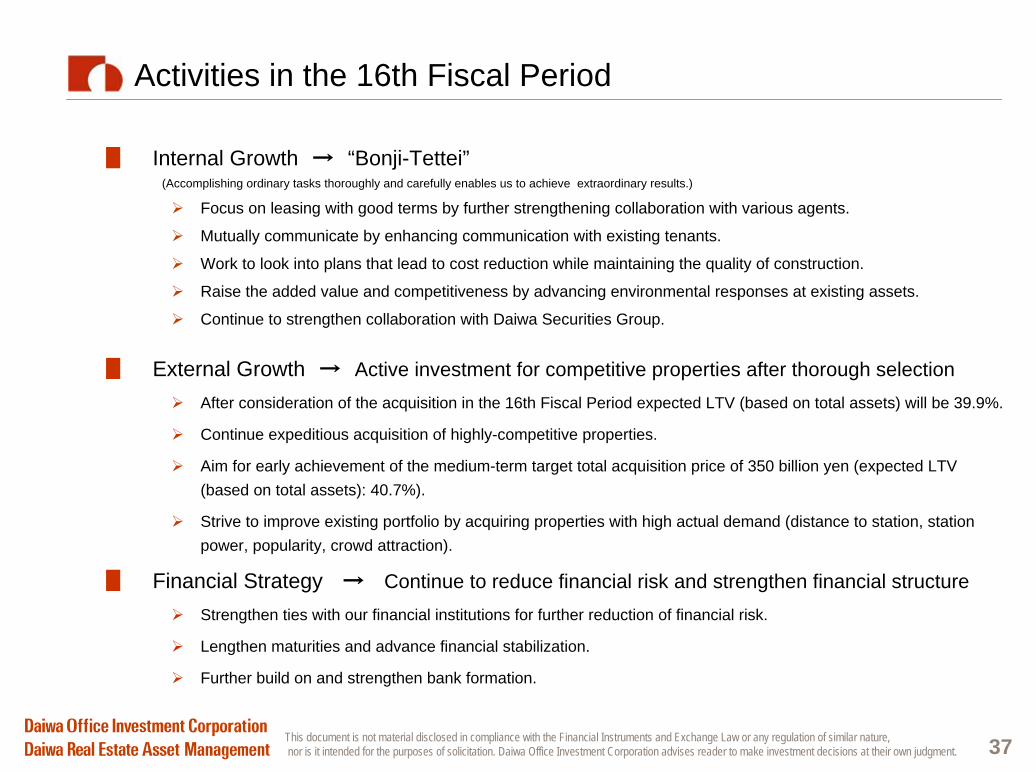
█ Internal Growth → “Bonji-Tettei”(Accomplishing ordinary tasks thoroughly and carefully enables us to achieve extraordinary results.)
Focus on leasing with good terms by further strengthening collaboration with various agents.
Mutually communicate by enhancing communication with existing tenants.
Work to look into plans that lead to cost reduction while maintaining the quality of construction.
Raise the added value and competitiveness by advancing environmental responses at existing assets.
Continue to strengthen collaboration with Daiwa Securities Group.
Activities in the 16th Fiscal Period
█ External Growth → Active investment for competitive properties after thorough selectionAfter consideration of the acquisition in the 16th Fiscal Period expected LTV (based on total assets) will be 39.9%.
Continue expeditious acquisition of highly-competitive properties.
Aim for early achievement of the medium-term target total acquisition price of 350 billion yen (expected LTV (based on total assets): 40.7%).
Strive to improve existing portfolio by acquiring properties with high actual demand (distance to station, station power, popularity, crowd attraction).
█ Financial Strategy → Continue to reduce financial risk and strengthen financial structure Strengthen ties with our financial institutions for further reduction of financial risk.
Lengthen maturities and advance financial stabilization.
Further build on and strengthen bank formation.

Appendix

This document is not material disclosed in compliance with the Financial Instruments and Exchange Law or any regulation of similar nature,nor is it intended for the purposes of solicitation. Daiwa Office Investment Corporation advises reader to make investment decisions at their own judgment. 39
Summary of Results for the 15th Fiscal Period (1) - Balance Sheet -
█ Comparison with Results of the 14th Fiscal Period

This document is not material disclosed in compliance with the Financial Instruments and Exchange Law or any regulation of similar nature,nor is it intended for the purposes of solicitation. Daiwa Office Investment Corporation advises reader to make investment decisions at their own judgment. 40
Summary of Results for the 15th Fiscal Period (2) - Income Statement -
█ Comparison with Results of the 14th Fiscal Period █ Comparison with the 15th Fiscal Period Forecasts
14th Fiscal Period 15th Fiscal PeriodChange
Number of Properties (at period-end) 38 41Effective Number of Days of Investment 183 182
Operating Revenues (A) 7,566 7,615 +48Gain on Sale ― ― ―
Operating Expenses (B) 4,419 4,306 -113Expenses related to Rental Business (excluding depreciation) 2,296 2,219 -76
Depreciation 1,305 1,280 -25Gain and Loss from Rental Operations (excluding gain on sale) 3,964 4,115 +151
Operating Income (A-B) 3,146 3,308 +161
Non-operating Expenses 787 733 -53Interest Expense (including cap amortization) 631 587 -44
Ordinary Income 2,364 2,590 +225
Extraordinary Income 5 ― -5
Extraordinary Expenses ― ― ―
Net Income 2,369 2,589 +219
Investment Units Issued and Outstanding 395,798 395,798 ―
Dividend per Unit (Unit: Yen) 5,986 6,542 +556
15th Fiscal Period (January 16, 2013) 15th Fiscal Period
ChangeNumber of Properties (at period-end) 41 41
Effective Number of Days of Investment 182 182Operating Revenues (A) 7,605 7,615 +9
Gain on Sale ― ― ―
Operating Expenses (B) 4,381 4,306 -74
Expenses related to Rental Business (excluding depreciation) 2,257 2,219 -38
Depreciation 1,286 1,280 -6
Gain and Loss from Rental Operations (excluding gain on sale) 4,061 4,115 +53
Operating Income (A-B) 3,224 3,308 +84
Non-operating Expenses 748 733 -15
Interest Expense (including cap amortization) 601 587 -13
Ordinary Income 2,475 2,590 +114
Extraordinary Income ― ― ―
Extraordinary Expenses ― ― ―
Net Income 2,473 2,589 +115
Investment Units Issued and Outstanding 395798 395798 ―
Dividend per Unit (Unit: Yen) 6,250 6,542 +292
Unit: Million Yen Unit: Million Yen

This document is not material disclosed in compliance with the Financial Instruments and Exchange Law or any regulation of similar nature,nor is it intended for the purposes of solicitation. Daiwa Office Investment Corporation advises reader to make investment decisions at their own judgment. 41
Forecasts (16th and 17th Fiscal Periods)
█ Forecast for the 16th and 17th Fiscal Period
* Although we assume that rents will remain at the current level, actual rents may differ from the assumption depending on the status of assets under management.
15th Fiscal Period 16th Fiscal Period Forecast 17th Fiscal Period Forecast
Number of Properties (at period-end) 41 43 43
Effective Number of Days of Investment 182 183 182
Operating Revenues (A) 7,615 8,242 8,235
Gain on Sale ― ― ―
Operating Expenses (B) 4,306 4,666 4,607
Expenses related to Rental Business (excluding depreciation) 2,219 2,457 2,394
Depreciation 1,280 1,323 1,334
Gain and Loss from Rental Operations (excluding gain on sale) 4,115 4,462 4,506
Operating Income (A-B) 3,308 3,576 3,628
Non-operating Expenses 733 723 737
Interest Expense (including cap amortization) 587 573 583
Ordinary Income 2,590 2,852 2,891
Extraordinary Income ― ― ―
Extraordinary Expenses ― ― ―
Net Income 2,589 2,850 2,889
Investment Units Issued and Outstanding 395798 395798 395798
Dividend per Unit (Unit: Yen) 6,542 7,200 7,300
Unit: Million Yen
This document is not material disclosed in compliance with the Financial Instruments and Exchange Law or any regulation of similar nature,nor is it intended for the purposes of solicitation. Daiwa Office Investment Corporation advises reader to make investment decisions at their own judgment. 42
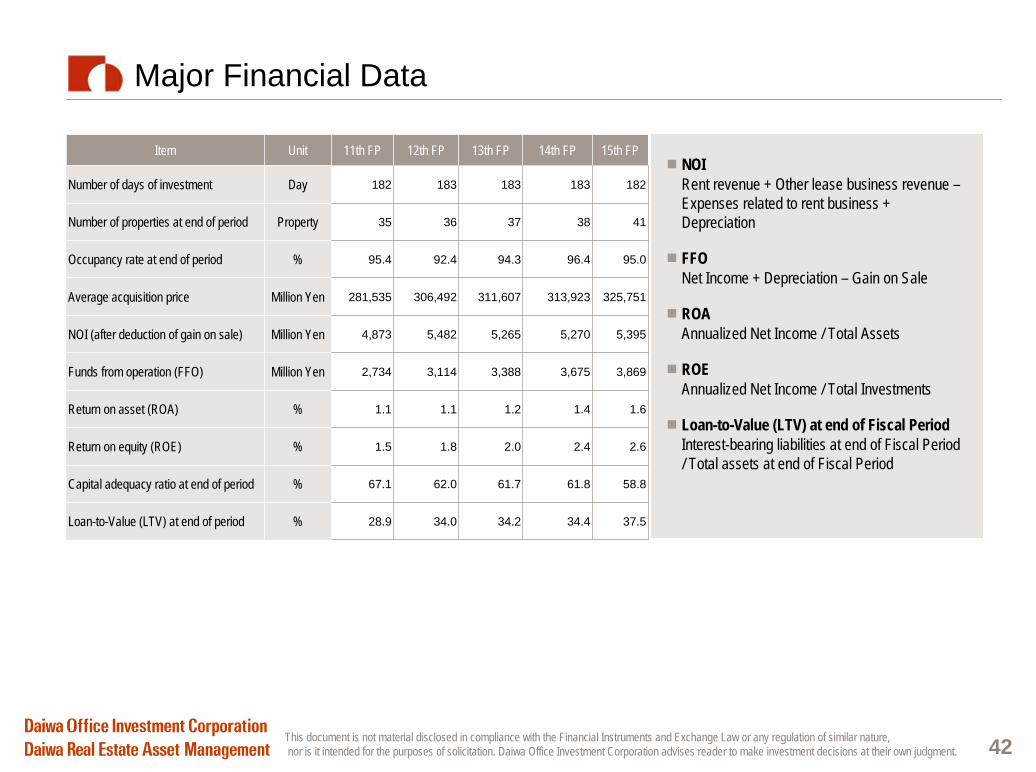
Major Financial Data
Item Unit 11th FP 12th FP 13th FP 14th FP 15th FP
Number of days of investment Day 182 183 183 183 182
Number of properties at end of period Property 35 36 37 38 41
Occupancy rate at end of period % 95.4 92.4 94.3 96.4 95.0
Average acquisition price Million Yen 281,535 306,492 311,607 313,923 325,751
NOI (after deduction of gain on sale) Million Yen 4,873 5,482 5,265 5,270 5,395
Funds from operation (FFO) Million Yen 2,734 3,114 3,388 3,675 3,869
Return on asset (ROA) % 1.1 1.1 1.2 1.4 1.6
Return on equity (ROE) % 1.5 1.8 2.0 2.4 2.6
Capital adequacy ratio at end of period % 67.1 62.0 61.7 61.8 58.8
Loan-to-Value (LTV) at end of period % 28.9 34.0 34.2 34.4 37.5
NOIRent revenue + Other lease business revenue – Expenses related to rent business + Depreciation
FFONet Income + Depreciation – Gain on Sale
ROAAnnualized Net Income / Total Assets
ROEAnnualized Net Income / Total Investments
Loan-to-Value (LTV) at end of Fiscal PeriodInterest-bearing liabilities at end of Fiscal Period / Total assets at end of Fiscal Period
This document is not material disclosed in compliance with the Financial Instruments and Exchange Law or any regulation of similar nature,nor is it intended for the purposes of solicitation. Daiwa Office Investment Corporation advises reader to make investment decisions at their own judgment. 43
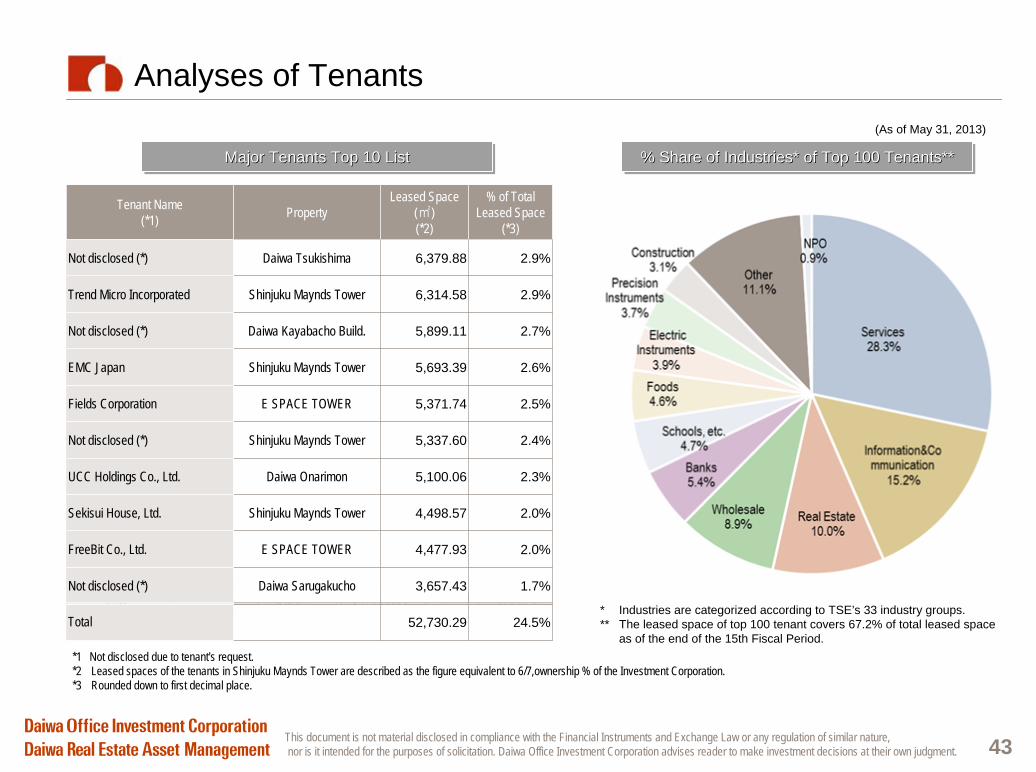
Analyses of Tenants
Major Tenants Top 10 ListMajor Tenants Top 10 ListMajor Tenants Top 10 List % Share of Industries* of Top 100 Tenants** % Share of Industries* of Top 100 Tenants** % Share of Industries* of Top 100 Tenants**
* Industries are categorized according to TSE’s 33 industry groups.** The leased space of top 100 tenant covers 67.2% of total leased space
as of the end of the 15th Fiscal Period.
*1 当該テナント名を開示することについて承諾が得られていないため記載せず*2 新宿マインズタワーのテナントは、本投資法人が保有する持分(6/7)に相当する面積を記載*3 全賃貸面積に占める割合は少数第2位以下を切り捨て
(As of May 31, 2013)
Tenant Name (*1) Property
Leased Space (㎡) (*2)
% of Total Leased Space
(*3)
Not disclosed (*) Daiwa Tsukishima 6,379.88 2.9%
Trend Micro Incorporated Shinjuku Maynds Tower 6,314.58 2.9%
Not disclosed (*) Daiwa Kayabacho Build. 5,899.11 2.7%
EMC Japan Shinjuku Maynds Tower 5,693.39 2.6%
Fields Corporation E SPACE TOWER 5,371.74 2.5%
Not disclosed (*) Shinjuku Maynds Tower 5,337.60 2.4%
UCC Holdings Co., Ltd. Daiwa Onarimon 5,100.06 2.3%
Sekisui House, Ltd. Shinjuku Maynds Tower 4,498.57 2.0%
FreeBit Co., Ltd. E SPACE TOWER 4,477.93 2.0%
Not disclosed (*) Daiwa Sarugakucho 3,657.43 1.7%
Total 52,730.29 24.5%
*1 Not disclosed due to tenant's request.*2* Leased spaces of the tenants in Shinjuku Maynds Tower are described as the figure equivalent to 6/7,ownership % of the Investment Corporation.*3 Rounded down to first decimal place.

This document is not material disclosed in compliance with the Financial Instruments and Exchange Law or any regulation of similar nature,nor is it intended for the purposes of solicitation. Daiwa Office Investment Corporation advises reader to make investment decisions at their own judgment. 44
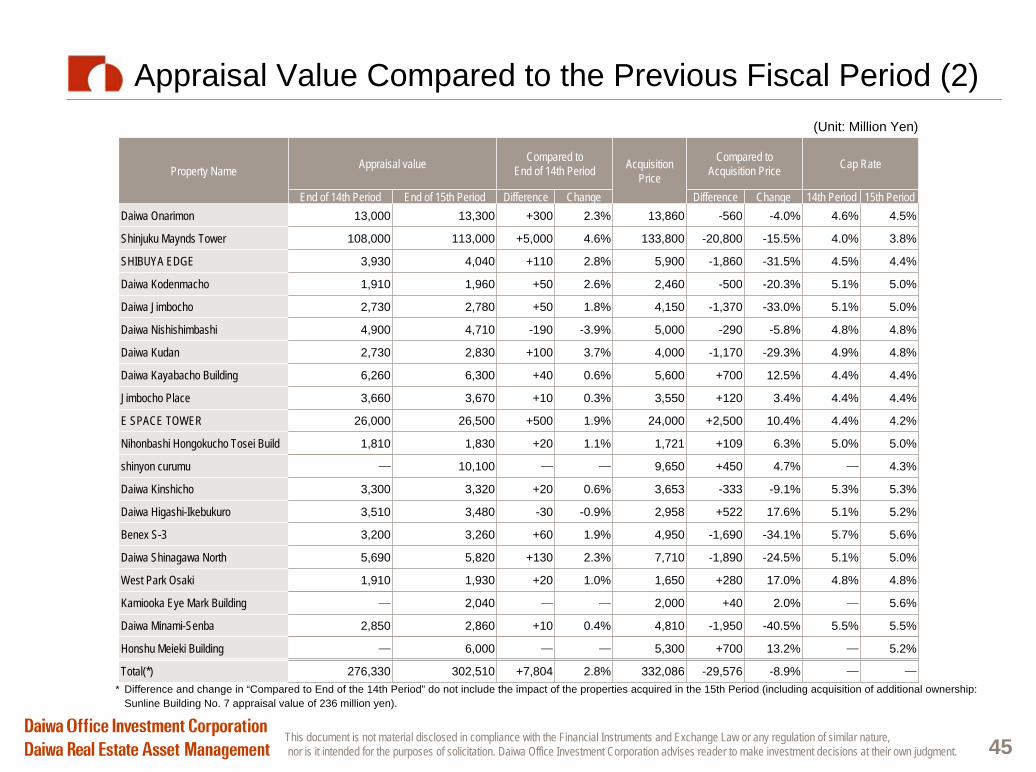
Appraisal Value Compared to the Previous Fiscal Period (1)
* Difference and change in “Compared to End of the 14th Period” do not include the impact of the properties acquired in the 15th Period (including acquisition of additional ownership: Sunline Building No. 7 appraisal value of 236 million yen).
Property NameAppraisal value Compared to
End of 14th Period Acquisition Price
Compared to Acquisition Price Cap Rate
End of 14th Period End of 15th Period Difference Change Difference Change 14th Period 15th Period
Daiwa Ginza 14,300 14,700 +400 2.8% 14,100 +600 4.3% 4.4% 4.3%
Daiwa Ginza Annex 3,010 3,100 +90 3.0% 3,050 +50 1.6% 4.3% 4.2%
Daiwa Shibaura 7,470 7,470 ― 0.0% 8,265 -795 -9.6% 5.0% 5.0%
Daiwa Minami Aoyama 3,950 4,010 +60 1.5% 4,550 -540 -11.9% 4.7% 4.6%
Daiwa Sarugakucho 2,980 3,090 +110 3.7% 3,190 -100 -3.1% 5.2% 5.1%
Daiwa A Hamamatsucho 2,830 2,830 ― 0.0% 2,865 -35 -1.2% 4.7% 4.7%
Daiwa Jingumae 1,990 2,050 +60 3.0% 2,800 -750 -26.8% 4.6% 4.5%
Daiwa Shibadaimon 2,620 2,640 +20 0.8% 2,578 +62 2.4% 4.6% 4.6%
Daiwa Misakicho 2,470 2,480 +10 0.4% 2,346 +134 5.7% 5.1% 5.1%
Daiwa Shimbashi 510 2,340 2,310 -30 -1.3% 2,080 +230 11.1% 4.9% 4.8%
Daiwa Tsukijiekimae 1,430 1,400 -30 -2.1% 1,560 -160 -10.3% 5.2% 5.1%
Daiwa Tsukiji 1,420 1,420 ― 0.0% 1,240 +180 14.5% 5.1% 5.0%
Daiwa Tsukiji 616 2,320 2,370 +50 2.2% 2,440 -70 -2.9% 4.9% 4.9%
Daiwa Tsukishima Bldg. 7,810 7,850 +40 0.5% 7,840 +10 0.1% 5.1% 5.1%
Nihombashi MS Bldg. 2,380 2,410 +30 1.3% 2,520 -110 -4.4% 4.8% 4.8%
Daiwa Azabudai 1,740 1,730 -10 -0.6% 1,600 +130 8.1% 4.7% 4.6%
Daiwa Shibuya SS 3,710 3,830 +120 3.2% 3,930 -100 -2.5% 4.7% 4.6%
Daiwa Nihombashi Honcho 6,790 6,980 +190 2.8% 7,420 -440 -5.9% 4.8% 4.7%
Daiwa Ginza 1-chome 4,340 4,480 +140 3.2% 4,620 -140 -3.0% 4.6% 4.5%
Daiwa Kyobashi 2,930 3,030 +100 3.4% 3,460 -430 -12.4% 4.8% 4.7%
Sunline Building No. 7 2,110 2,600 +254 12.0% 2,910 -310 -10.7% 4.7% 4.4%
(Unit: Million Yen)
This document is not material disclosed in compliance with the Financial Instruments and Exchange Law or any regulation of similar nature,nor is it intended for the purposes of solicitation. Daiwa Office Investment Corporation advises reader to make investment decisions at their own judgment. 45
Appraisal Value Compared to the Previous Fiscal Period (2)
Property Name Appraisal value Compared to End of 14th Period Acquisition
Price
Compared to Acquisition Price Cap Rate
End of 14th Period End of 15th Period Difference Change Difference Change 14th Period 15th PeriodDaiwa Onarimon 13,000 13,300 +300 2.3% 13,860 -560 -4.0% 4.6% 4.5%
Shinjuku Maynds Tower 108,000 113,000 +5,000 4.6% 133,800 -20,800 -15.5% 4.0% 3.8%
SHIBUYA EDGE 3,930 4,040 +110 2.8% 5,900 -1,860 -31.5% 4.5% 4.4%
Daiwa Kodenmacho 1,910 1,960 +50 2.6% 2,460 -500 -20.3% 5.1% 5.0%
Daiwa Jimbocho 2,730 2,780 +50 1.8% 4,150 -1,370 -33.0% 5.1% 5.0%
Daiwa Nishishimbashi 4,900 4,710 -190 -3.9% 5,000 -290 -5.8% 4.8% 4.8%
Daiwa Kudan 2,730 2,830 +100 3.7% 4,000 -1,170 -29.3% 4.9% 4.8%
Daiwa Kayabacho Building 6,260 6,300 +40 0.6% 5,600 +700 12.5% 4.4% 4.4%
Jimbocho Place 3,660 3,670 +10 0.3% 3,550 +120 3.4% 4.4% 4.4%
E SPACE TOWER 26,000 26,500 +500 1.9% 24,000 +2,500 10.4% 4.4% 4.2%
Nihonbashi Hongokucho Tosei Build 1,810 1,830 +20 1.1% 1,721 +109 6.3% 5.0% 5.0%
shinyon curumu ― 10,100 ― ― 9,650 +450 4.7% ― 4.3%
Daiwa Kinshicho 3,300 3,320 +20 0.6% 3,653 -333 -9.1% 5.3% 5.3%
Daiwa Higashi-Ikebukuro 3,510 3,480 -30 -0.9% 2,958 +522 17.6% 5.1% 5.2%
Benex S-3 3,200 3,260 +60 1.9% 4,950 -1,690 -34.1% 5.7% 5.6%
Daiwa Shinagawa North 5,690 5,820 +130 2.3% 7,710 -1,890 -24.5% 5.1% 5.0%
West Park Osaki 1,910 1,930 +20 1.0% 1,650 +280 17.0% 4.8% 4.8%
Kamiooka Eye Mark Building ― 2,040 ― ― 2,000 +40 2.0% ― 5.6%
Daiwa Minami-Senba 2,850 2,860 +10 0.4% 4,810 -1,950 -40.5% 5.5% 5.5%
Honshu Meieki Building ― 6,000 ― ― 5,300 +700 13.2% ― 5.2%
Total(*) 276,330 302,510 +7,804 2.8% 332,086 -29,576 -8.9% ― ―
(Unit: Million Yen)
* Difference and change in “Compared to End of the 14th Period” do not include the impact of the properties acquired in the 15th Period (including acquisition of additional ownership: Sunline Building No. 7 appraisal value of 236 million yen).
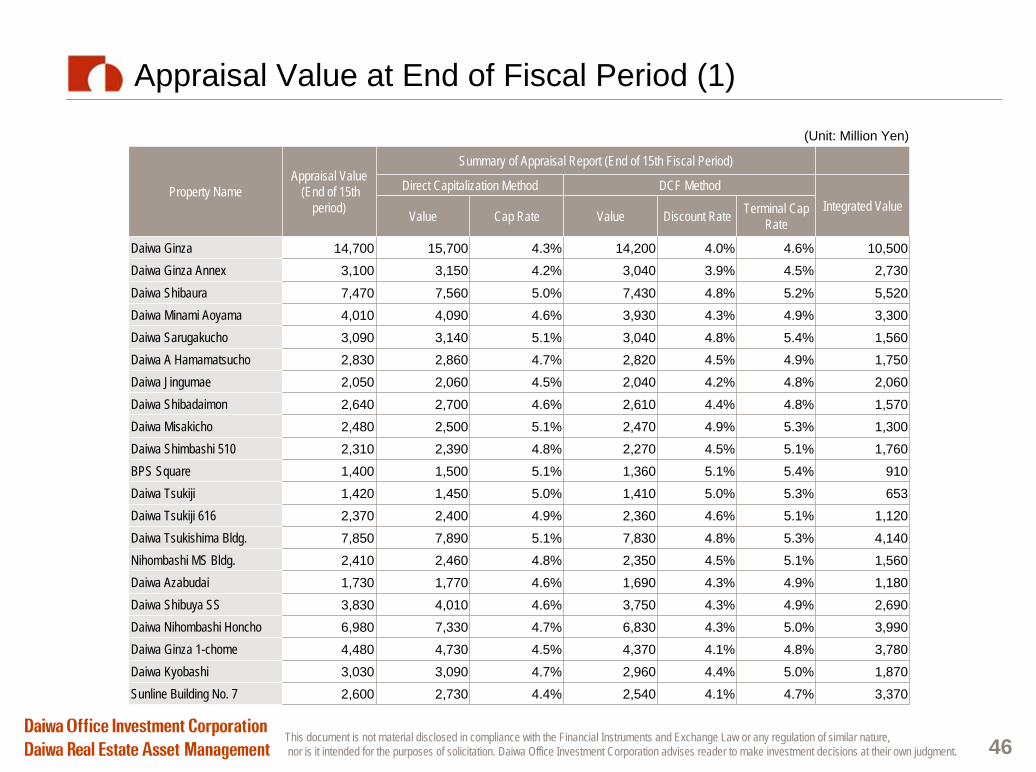
This document is not material disclosed in compliance with the Financial Instruments and Exchange Law or any regulation of similar nature,nor is it intended for the purposes of solicitation. Daiwa Office Investment Corporation advises reader to make investment decisions at their own judgment. 46
Appraisal Value at End of Fiscal Period (1)
Property NameAppraisal Value
(End of 15th period)
Summary of Appraisal Report (End of 15th Fiscal Period)
Direct Capitalization Method DCF MethodIntegrated Value
Value Cap Rate Value Discount Rate Terminal Cap Rate
Daiwa Ginza 14,700 15,700 4.3% 14,200 4.0% 4.6% 10,500
Daiwa Ginza Annex 3,100 3,150 4.2% 3,040 3.9% 4.5% 2,730
Daiwa Shibaura 7,470 7,560 5.0% 7,430 4.8% 5.2% 5,520
Daiwa Minami Aoyama 4,010 4,090 4.6% 3,930 4.3% 4.9% 3,300
Daiwa Sarugakucho 3,090 3,140 5.1% 3,040 4.8% 5.4% 1,560
Daiwa A Hamamatsucho 2,830 2,860 4.7% 2,820 4.5% 4.9% 1,750
Daiwa Jingumae 2,050 2,060 4.5% 2,040 4.2% 4.8% 2,060
Daiwa Shibadaimon 2,640 2,700 4.6% 2,610 4.4% 4.8% 1,570
Daiwa Misakicho 2,480 2,500 5.1% 2,470 4.9% 5.3% 1,300
Daiwa Shimbashi 510 2,310 2,390 4.8% 2,270 4.5% 5.1% 1,760
BPS Square 1,400 1,500 5.1% 1,360 5.1% 5.4% 910
Daiwa Tsukiji 1,420 1,450 5.0% 1,410 5.0% 5.3% 653
Daiwa Tsukiji 616 2,370 2,400 4.9% 2,360 4.6% 5.1% 1,120
Daiwa Tsukishima Bldg. 7,850 7,890 5.1% 7,830 4.8% 5.3% 4,140
Nihombashi MS Bldg. 2,410 2,460 4.8% 2,350 4.5% 5.1% 1,560
Daiwa Azabudai 1,730 1,770 4.6% 1,690 4.3% 4.9% 1,180
Daiwa Shibuya SS 3,830 4,010 4.6% 3,750 4.3% 4.9% 2,690
Daiwa Nihombashi Honcho 6,980 7,330 4.7% 6,830 4.3% 5.0% 3,990
Daiwa Ginza 1-chome 4,480 4,730 4.5% 4,370 4.1% 4.8% 3,780
Daiwa Kyobashi 3,030 3,090 4.7% 2,960 4.4% 5.0% 1,870
Sunline Building No. 7 2,600 2,730 4.4% 2,540 4.1% 4.7% 3,370
(Unit: Million Yen)
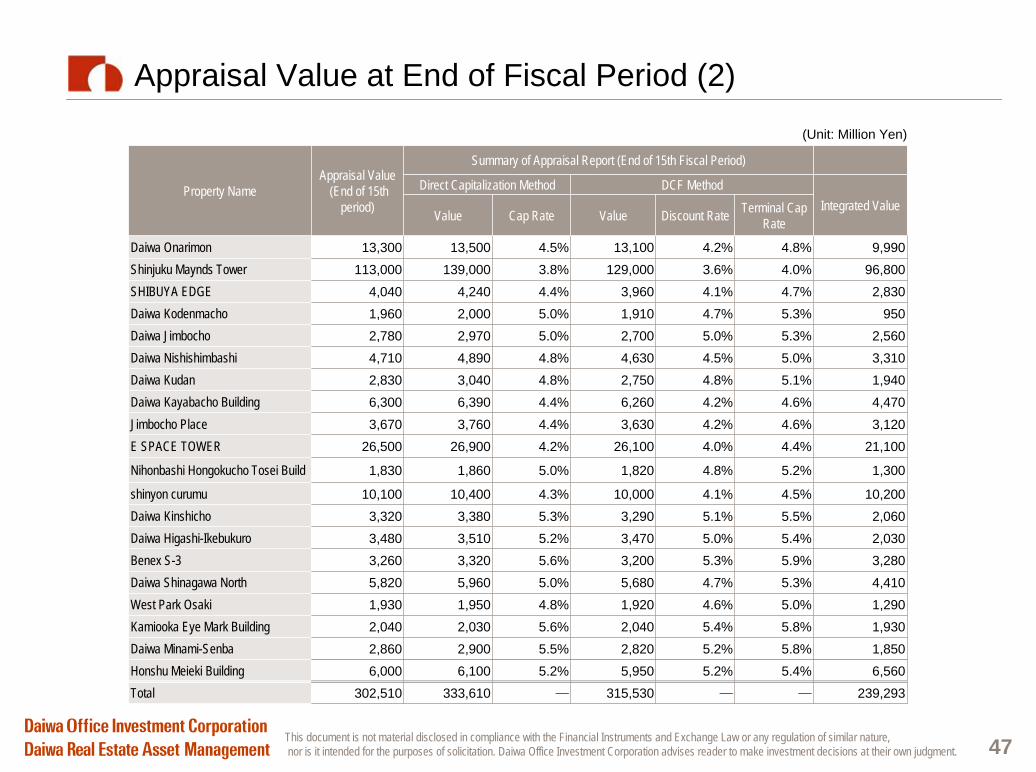
This document is not material disclosed in compliance with the Financial Instruments and Exchange Law or any regulation of similar nature,nor is it intended for the purposes of solicitation. Daiwa Office Investment Corporation advises reader to make investment decisions at their own judgment. 47
Appraisal Value at End of Fiscal Period (2)
Property NameAppraisal Value
(End of 15th period)
Summary of Appraisal Report (End of 15th Fiscal Period)
Direct Capitalization Method DCF MethodIntegrated Value
Value Cap Rate Value Discount Rate Terminal Cap Rate
Daiwa Onarimon 13,300 13,500 4.5% 13,100 4.2% 4.8% 9,990 Shinjuku Maynds Tower 113,000 139,000 3.8% 129,000 3.6% 4.0% 96,800 SHIBUYA EDGE 4,040 4,240 4.4% 3,960 4.1% 4.7% 2,830 Daiwa Kodenmacho 1,960 2,000 5.0% 1,910 4.7% 5.3% 950 Daiwa Jimbocho 2,780 2,970 5.0% 2,700 5.0% 5.3% 2,560 Daiwa Nishishimbashi 4,710 4,890 4.8% 4,630 4.5% 5.0% 3,310 Daiwa Kudan 2,830 3,040 4.8% 2,750 4.8% 5.1% 1,940 Daiwa Kayabacho Building 6,300 6,390 4.4% 6,260 4.2% 4.6% 4,470 Jimbocho Place 3,670 3,760 4.4% 3,630 4.2% 4.6% 3,120 E SPACE TOWER 26,500 26,900 4.2% 26,100 4.0% 4.4% 21,100
Nihonbashi Hongokucho Tosei Build 1,830 1,860 5.0% 1,820 4.8% 5.2% 1,300
shinyon curumu 10,100 10,400 4.3% 10,000 4.1% 4.5% 10,200 Daiwa Kinshicho 3,320 3,380 5.3% 3,290 5.1% 5.5% 2,060 Daiwa Higashi-Ikebukuro 3,480 3,510 5.2% 3,470 5.0% 5.4% 2,030 Benex S-3 3,260 3,320 5.6% 3,200 5.3% 5.9% 3,280 Daiwa Shinagawa North 5,820 5,960 5.0% 5,680 4.7% 5.3% 4,410 West Park Osaki 1,930 1,950 4.8% 1,920 4.6% 5.0% 1,290 Kamiooka Eye Mark Building 2,040 2,030 5.6% 2,040 5.4% 5.8% 1,930 Daiwa Minami-Senba 2,860 2,900 5.5% 2,820 5.2% 5.8% 1,850 Honshu Meieki Building 6,000 6,100 5.2% 5,950 5.2% 5.4% 6,560 Total 302,510 333,610 ― 315,530 ― ― 239,293
(Unit: Million Yen)
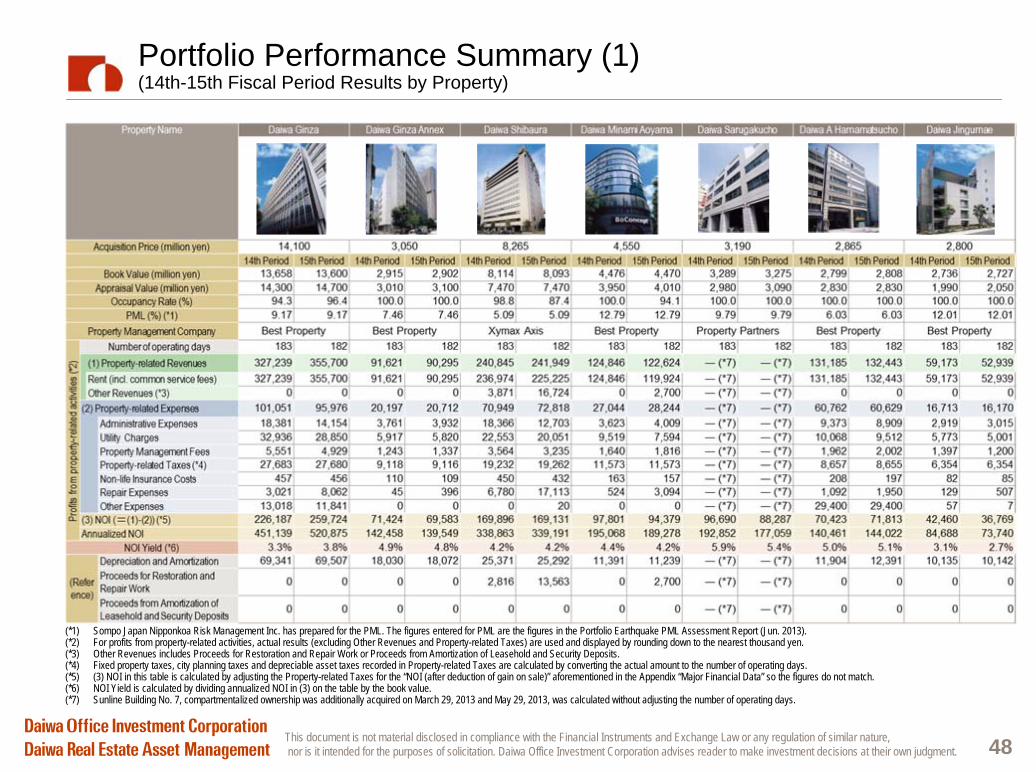
This document is not material disclosed in compliance with the Financial Instruments and Exchange Law or any regulation of similar nature,nor is it intended for the purposes of solicitation. Daiwa Office Investment Corporation advises reader to make investment decisions at their own judgment. 48
Portfolio Performance Summary (1) (14th-15th Fiscal Period Results by Property)
(*1) Sompo Japan Nipponkoa Risk Management Inc. has prepared for the PML. The figures entered for PML are the figures in the Portfolio Earthquake PML Assessment Report (Jun. 2013). (*2) For profits from property-related activities, actual results (excluding Other Revenues and Property-related Taxes) are used and displayed by rounding down to the nearest thousand yen.(*3) Other Revenues includes Proceeds for Restoration and Repair Work or Proceeds from Amortization of Leasehold and Security Deposits.(*4) Fixed property taxes, city planning taxes and depreciable asset taxes recorded in Property-related Taxes are calculated by converting the actual amount to the number of operating days. (*5) (3) NOI in this table is calculated by adjusting the Property-related Taxes for the “NOI (after deduction of gain on sale)” aforementioned in the Appendix “Major Financial Data” so the figures do not match.(*6) NOI Yield is calculated by dividing annualized NOI in (3) on the table by the book value.(*7) Sunline Building No. 7, compartmentalized ownership was additionally acquired on March 29, 2013 and May 29, 2013, was calculated without adjusting the number of operating days.
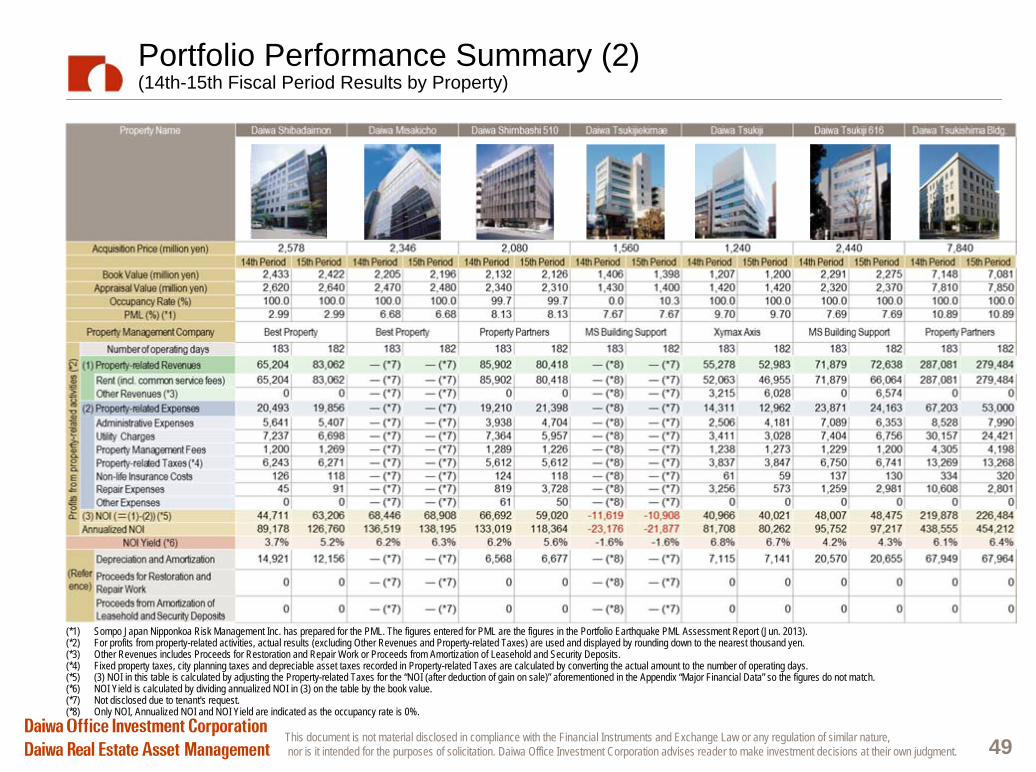
This document is not material disclosed in compliance with the Financial Instruments and Exchange Law or any regulation of similar nature,nor is it intended for the purposes of solicitation. Daiwa Office Investment Corporation advises reader to make investment decisions at their own judgment. 49
Portfolio Performance Summary (2) (14th-15th Fiscal Period Results by Property)
(*1) Sompo Japan Nipponkoa Risk Management Inc. has prepared for the PML. The figures entered for PML are the figures in the Portfolio Earthquake PML Assessment Report (Jun. 2013). (*2) For profits from property-related activities, actual results (excluding Other Revenues and Property-related Taxes) are used and displayed by rounding down to the nearest thousand yen.(*3) Other Revenues includes Proceeds for Restoration and Repair Work or Proceeds from Amortization of Leasehold and Security Deposits.(*4) Fixed property taxes, city planning taxes and depreciable asset taxes recorded in Property-related Taxes are calculated by converting the actual amount to the number of operating days. (*5) (3) NOI in this table is calculated by adjusting the Property-related Taxes for the “NOI (after deduction of gain on sale)” aforementioned in the Appendix “Major Financial Data” so the figures do not match.(*6) NOI Yield is calculated by dividing annualized NOI in (3) on the table by the book value.(*7) Not disclosed due to tenant's request.(*8) Only NOI, Annualized NOI and NOI Yield are indicated as the occupancy rate is 0%.
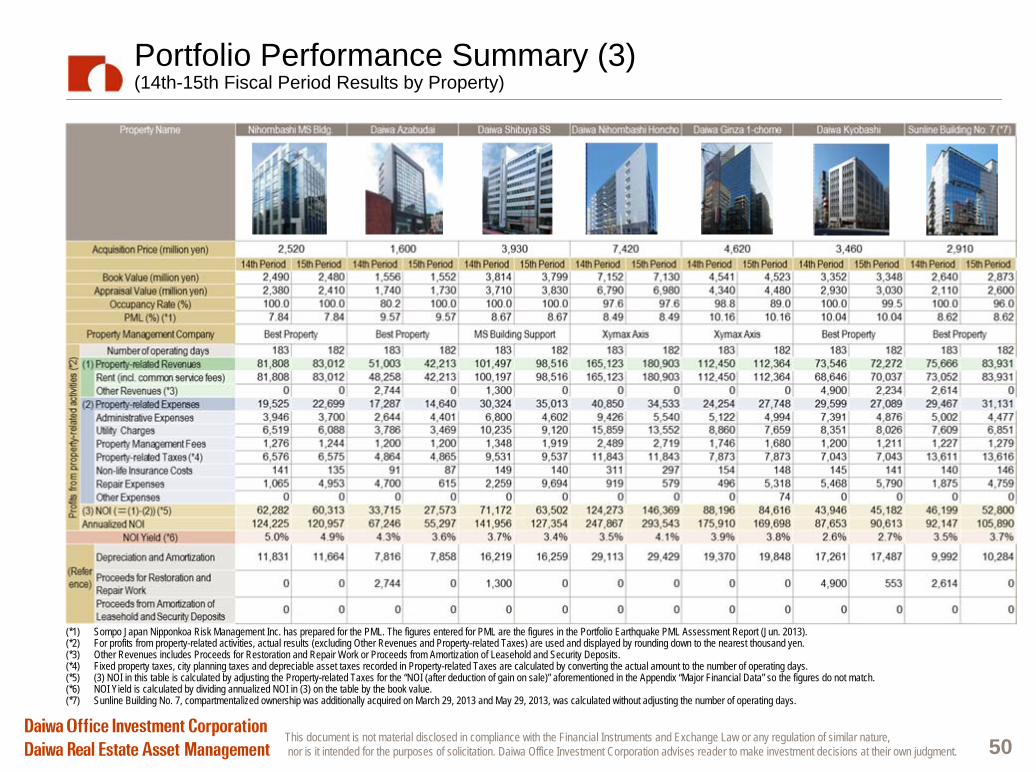
This document is not material disclosed in compliance with the Financial Instruments and Exchange Law or any regulation of similar nature,nor is it intended for the purposes of solicitation. Daiwa Office Investment Corporation advises reader to make investment decisions at their own judgment. 50
(*1) Sompo Japan Nipponkoa Risk Management Inc. has prepared for the PML. The figures entered for PML are the figures in the Portfolio Earthquake PML Assessment Report (Jun. 2013). (*2) For profits from property-related activities, actual results (excluding Other Revenues and Property-related Taxes) are used and displayed by rounding down to the nearest thousand yen.(*3) Other Revenues includes Proceeds for Restoration and Repair Work or Proceeds from Amortization of Leasehold and Security Deposits.(*4) Fixed property taxes, city planning taxes and depreciable asset taxes recorded in Property-related Taxes are calculated by converting the actual amount to the number of operating days. (*5) (3) NOI in this table is calculated by adjusting the Property-related Taxes for the “NOI (after deduction of gain on sale)” aforementioned in the Appendix “Major Financial Data” so the figures do not match.(*6) NOI Yield is calculated by dividing annualized NOI in (3) on the table by the book value.(*7) Sunline Building No. 7, compartmentalized ownership was additionally acquired on March 29, 2013 and May 29, 2013, was calculated without adjusting the number of operating days.
Portfolio Performance Summary (3) (14th-15th Fiscal Period Results by Property)
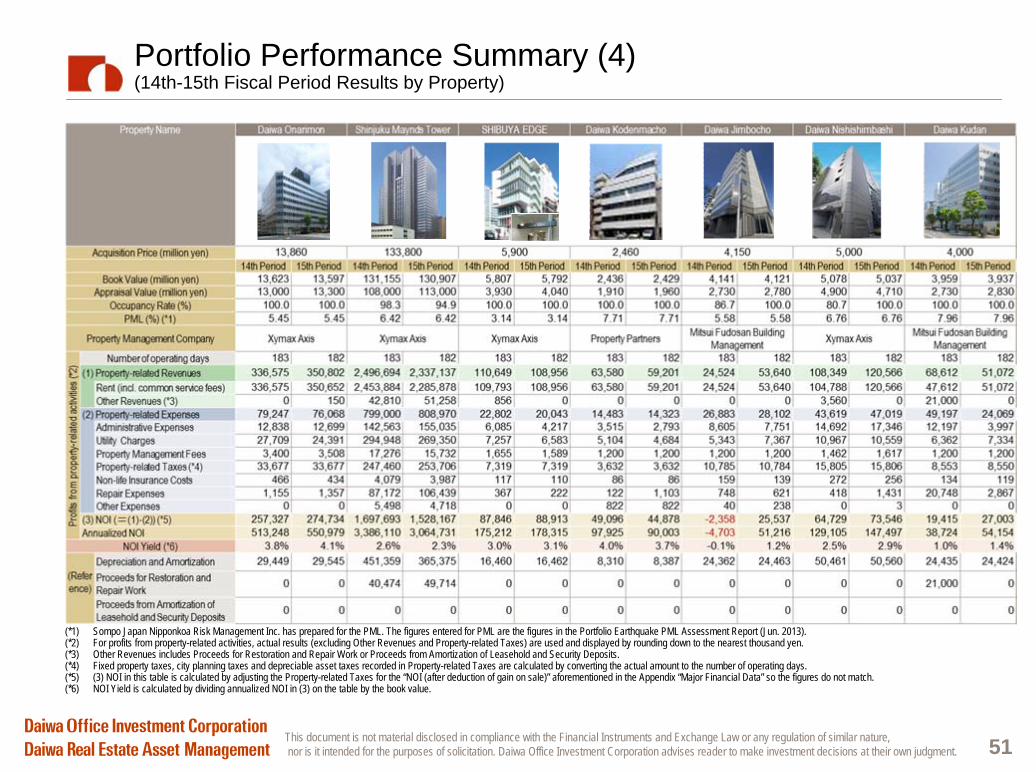
This document is not material disclosed in compliance with the Financial Instruments and Exchange Law or any regulation of similar nature,nor is it intended for the purposes of solicitation. Daiwa Office Investment Corporation advises reader to make investment decisions at their own judgment. 51
Portfolio Performance Summary (4) (14th-15th Fiscal Period Results by Property)
(*1) Sompo Japan Nipponkoa Risk Management Inc. has prepared for the PML. The figures entered for PML are the figures in the Portfolio Earthquake PML Assessment Report (Jun. 2013). (*2) For profits from property-related activities, actual results (excluding Other Revenues and Property-related Taxes) are used and displayed by rounding down to the nearest thousand yen.(*3) Other Revenues includes Proceeds for Restoration and Repair Work or Proceeds from Amortization of Leasehold and Security Deposits.(*4) Fixed property taxes, city planning taxes and depreciable asset taxes recorded in Property-related Taxes are calculated by converting the actual amount to the number of operating days. (*5) (3) NOI in this table is calculated by adjusting the Property-related Taxes for the “NOI (after deduction of gain on sale)” aforementioned in the Appendix “Major Financial Data” so the figures do not match.(*6) NOI Yield is calculated by dividing annualized NOI in (3) on the table by the book value.
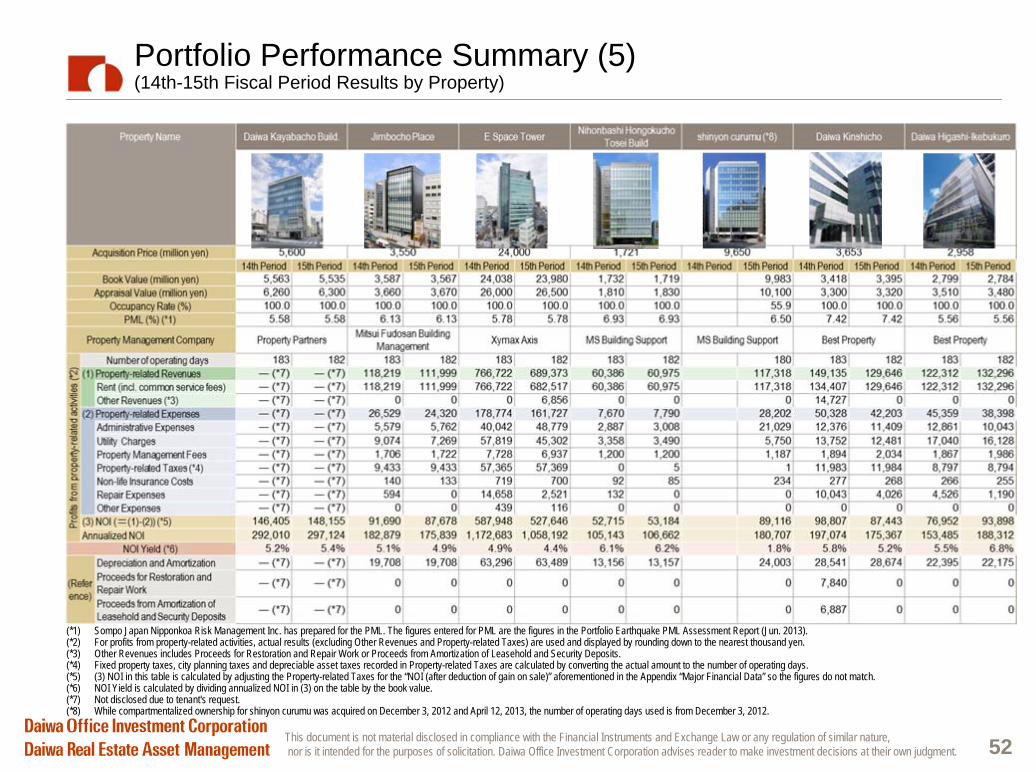
This document is not material disclosed in compliance with the Financial Instruments and Exchange Law or any regulation of similar nature,nor is it intended for the purposes of solicitation. Daiwa Office Investment Corporation advises reader to make investment decisions at their own judgment. 52
Portfolio Performance Summary (5) (14th-15th Fiscal Period Results by Property)
(*1) Sompo Japan Nipponkoa Risk Management Inc. has prepared for the PML. The figures entered for PML are the figures in the Portfolio Earthquake PML Assessment Report (Jun. 2013). (*2) For profits from property-related activities, actual results (excluding Other Revenues and Property-related Taxes) are used and displayed by rounding down to the nearest thousand yen.(*3) Other Revenues includes Proceeds for Restoration and Repair Work or Proceeds from Amortization of Leasehold and Security Deposits.(*4) Fixed property taxes, city planning taxes and depreciable asset taxes recorded in Property-related Taxes are calculated by converting the actual amount to the number of operating days. (*5) (3) NOI in this table is calculated by adjusting the Property-related Taxes for the “NOI (after deduction of gain on sale)” aforementioned in the Appendix “Major Financial Data” so the figures do not match.(*6) NOI Yield is calculated by dividing annualized NOI in (3) on the table by the book value.(*7) Not disclosed due to tenant's request.(*8) While compartmentalized ownership for shinyon curumu was acquired on December 3, 2012 and April 12, 2013, the number of operating days used is from December 3, 2012.
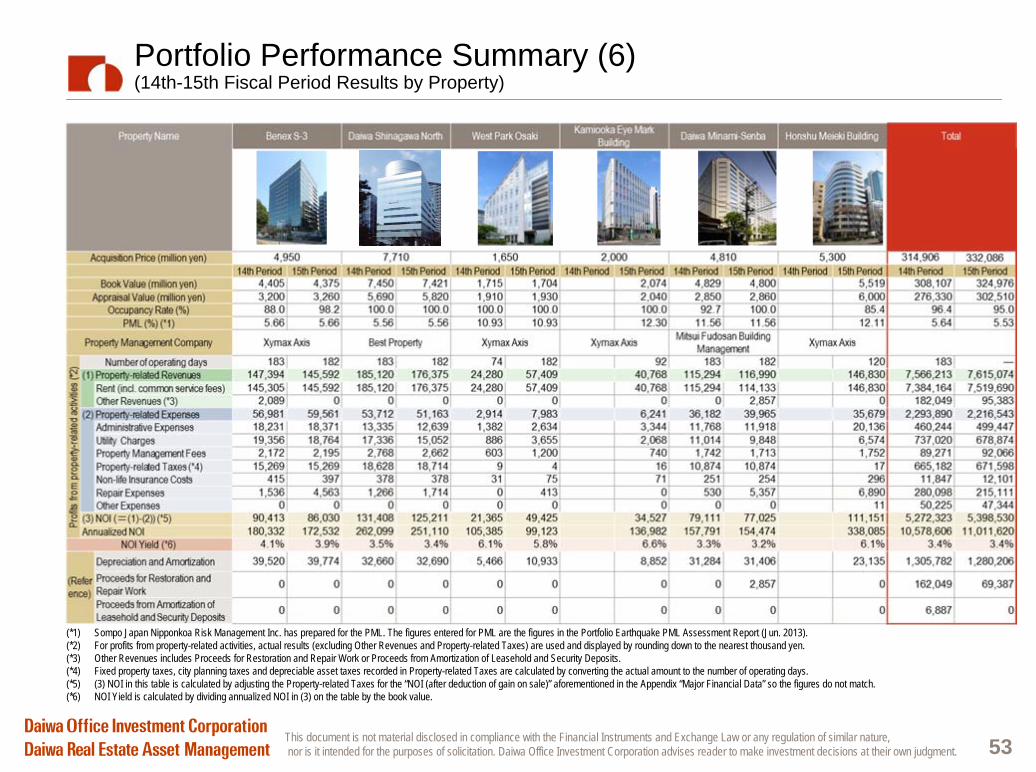
This document is not material disclosed in compliance with the Financial Instruments and Exchange Law or any regulation of similar nature,nor is it intended for the purposes of solicitation. Daiwa Office Investment Corporation advises reader to make investment decisions at their own judgment. 53
Portfolio Performance Summary (6) (14th-15th Fiscal Period Results by Property)
(*1) Sompo Japan Nipponkoa Risk Management Inc. has prepared for the PML. The figures entered for PML are the figures in the Portfolio Earthquake PML Assessment Report (Jun. 2013). (*2) For profits from property-related activities, actual results (excluding Other Revenues and Property-related Taxes) are used and displayed by rounding down to the nearest thousand yen.(*3) Other Revenues includes Proceeds for Restoration and Repair Work or Proceeds from Amortization of Leasehold and Security Deposits.(*4) Fixed property taxes, city planning taxes and depreciable asset taxes recorded in Property-related Taxes are calculated by converting the actual amount to the number of operating days. (*5) (3) NOI in this table is calculated by adjusting the Property-related Taxes for the “NOI (after deduction of gain on sale)” aforementioned in the Appendix “Major Financial Data” so the figures do not match.(*6) NOI Yield is calculated by dividing annualized NOI in (3) on the table by the book value.

This document is not material disclosed in compliance with the Financial Instruments and Exchange Law or any regulation of similar nature,nor is it intended for the purposes of solicitation. Daiwa Office Investment Corporation advises reader to make investment decisions at their own judgment. 54
Organization of the Asset Management Company
Advisory concerning managements for customers’assets
Analysis of real estate market, retail industry trends and the real estate investment trust marketAnalysis and management of the investment corporations’managerial issuesDevelopment and revision of the investment corporations’ annual asset management plans and medium-term asset management plansDevelopment and revision of the investment corporations’Investment GuidelinesProvision of new businessesGeneral risk management of the Investment Corporation
Management of executive officers’ meeting for the Investment CorporationOperation of the general meeting of shareholders, the board of directors and committees of the Asset ManagerRevision/elimination of regulations, management of documents, information management and systems managementLicensing, approval, registration and reporting stipulated by laws and regulations Litigation and handling of complaintsHuman resources and labor service
Company Name Daiwa Real Estate Asset Management Co. LtdAddress 6-2-1 Ginza, Chuo-ku, TokyoEstablished October 21, 2004Capitalization 200 million yenRepresentative Director Akira YamanouchiDirectors 7 (4 executive, 2 non-executive, 1 auditor)Employees 47Registered Financial Instruments Firm
No. 355 (Financial Instruments), Director, Kanto Local Finance Bureau
Building Lots and Buildings Transaction Business License
No. (2)-83920, Governor of Tokyo
Discretionary Agent for Real Estate Transaction Approval
No. 34, Minister of Land, Infrastructure, Transport and Tourism
Association MembershipA member of the Investment Trusts Association of JapanA member of Japan Securities Investment Advisers Association
Board of Directors and Auditors█ Company Overview█ Organization Chart
Shareholders’ MeetingShareholders’ Meeting
Board of DirectorsBoard of Directors
Representative DirectorRepresentative Director
AuditorsAuditors
Compliance CommitteeCompliance Committee
Investment CommitteeInvestment Committee
Internal Control OfficeInternal Control Office
Compliance OfficerCompliance Officer
Marketing activities for the Asset Management Company’s entrustment businessInvestor marketing for private placement productsDisclosure, IR and public relations for the investment corporationsOperation of the investment corporations’ general meeting of unitholdersFund procurement (investment units) for the investment corporations
President and Representative Director Akira Yamanouchi
Vice President and Representative Director
Yuji Shinotsuka(Head of Business Planning
Vice President and Representative Director
Yoshiki Nishigaki(Head of Private Fund Management
Director Naoyuki Owa (Head of Administration
Director (non-executive) Toshihiro Matsui
Director (non-executive) Mikita Komatsu
Auditor (non-executive Masaru Shirataki
Planning and formulation of policies concerning DOI’s (*) investmentAsset acquisition and disposal for DOI’s investment management business
Advisory Team
(As of June 26, 2013)
Planning and formulation of policies concerning the leasing, management and disposal of DOI’s assets
Fund procurement (investment corporation bonds), ALM, surplus management and fund management for the Investment Corporation
Finance Team
Financial results and accounting, cash allotment, accounting audit, budgetAccounting and finance of the Asset Manager
Accounting Team
Management for the customers of the “Private Fund Management Dept.”Issuance and underwriting of DRP’s investment securities
Management Team
(*) DOI stands for Daiwa Office Investment Corporation.
(**) DRP stands for Daiwa Residential Private Investment Corporation.
Office Investment Team
Planning and formulation of policies concerning DRP’s(**) investmentAsset acquisition and disposal for DRP’s investment management business
Residential Investment Team
Office Management Team
Planning and formulation of policies concerning the leasing, management and disposal of DRP’s assets
Residential Management Team
Budget and performance management for the investment corporations’ portfolios
Management Planning Team
Formulation and implementation of construction planning of the investment corporations’ assets
Construction Management Team
Formulation of investment policies for discretionary fundsAcquisition, disposal, leasing and management of assets of discretionary funds
Operational Team
General AdministrativeDepartment
General AdministrativeDepartment
Business Planning Department
Business Planning Department
Private Fund ManagementDepartment
Private Fund ManagementDepartmentMarketing DepartmentMarketing DepartmentAsset Management DepartmentAsset Management Department Finance DepartmentFinance DepartmentInvestment Planning DepartmentInvestment Planning Department
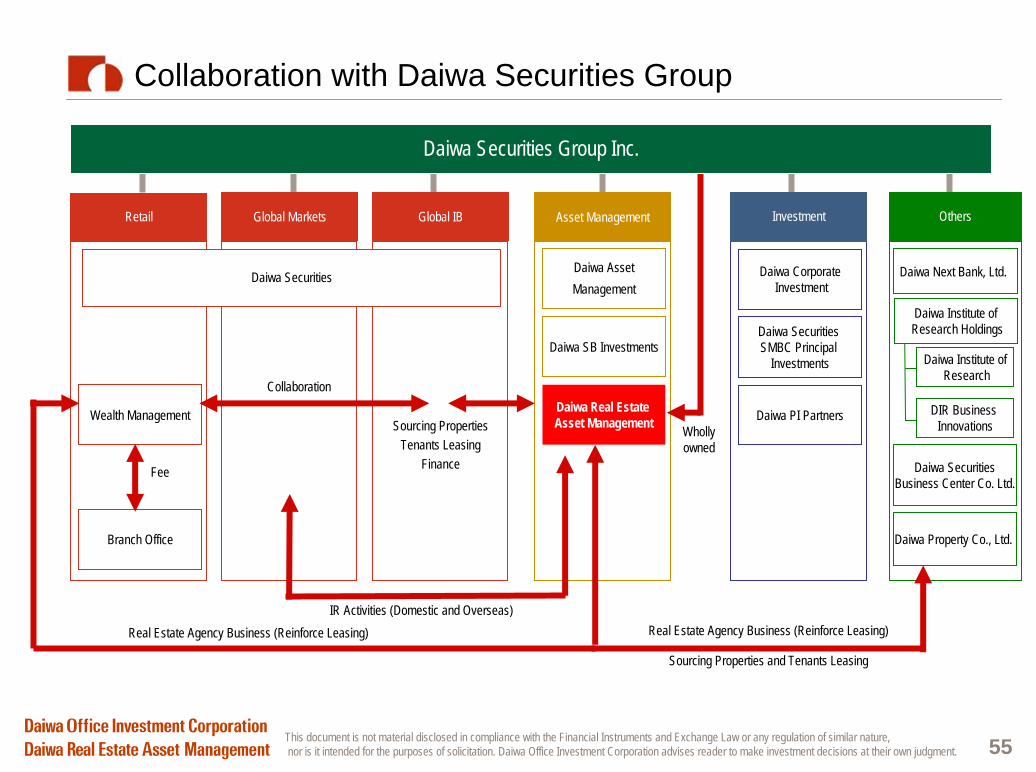
This document is not material disclosed in compliance with the Financial Instruments and Exchange Law or any regulation of similar nature,nor is it intended for the purposes of solicitation. Daiwa Office Investment Corporation advises reader to make investment decisions at their own judgment. 55
Collaboration with Daiwa Securities Group
Retail Global Markets
Daiwa AssetManagement
Daiwa SB Investments
Daiwa Real Estate Asset Management
Asset Management
Daiwa CorporateInvestment
Investment
Daiwa Securities SMBC Principal
Investments
Daiwa PI Partners
Daiwa Securities
Global IB
Daiwa Institute ofResearch
DIR Business Innovations
Others
Daiwa Next Bank, Ltd.
Daiwa Institute ofResearch Holdings
Daiwa SecuritiesBusiness Center Co. Ltd.
Daiwa Property Co., Ltd.
Wealth Management
Branch Office
Wholly owned
Collaboration
Sourcing PropertiesTenants Leasing
FinanceFee
Real Estate Agency Business (Reinforce Leasing)IR Activities (Domestic and Overseas)
Sourcing Properties and Tenants Leasing
Real Estate Agency Business (Reinforce Leasing)
Daiwa Securities Group Inc.
This document is not material disclosed in compliance with the Financial Instruments and Exchange Law or any regulation of similar nature,nor is it intended for the purposes of solicitation. Daiwa Office Investment Corporation advises reader to make investment decisions at their own judgment. 56
Competitive Edge
Strictly control conflicts of interest with sponsor
Introduce financial institutions’ rigorous compliance framework
Ensure high transparency and establish disciplined investment process
Develop team of outstanding professional staff by capitalizing on the human resources of the Daiwa Securities Group
Employ excellent human resources from outside by drawing on the Daiwa Securities Group’s brand power
Increase number of employees with a high level of motivation to challenge new business stages
█ Secure well-experienced, highly-professional human resources
█ Establish highly-transparent business structure
Remarkably expand financing capacity by capitalizing on the credit capability of the Daiwa Securities Group
Reinforce leasing activities by capitalizing on the network of the Daiwa Securities Group
Reinforce sourcing activities by capitalizing on the network of the Daiwa Securities Group
█ Expand net work of collaboration with the Daiwa Securities Group

This document is not material disclosed in compliance with the Financial Instruments and Exchange Law or any regulation of similar nature,nor is it intended for the purposes of solicitation. Daiwa Office Investment Corporation advises reader to make investment decisions at their own judgment.
[ Memorandum ]

This document is not material disclosed in compliance with the Financial Instruments and Exchange Law or any regulation of similar nature,nor is it intended for the purposes of solicitation. Daiwa Office Investment Corporation advises reader to make investment decisions at their own judgment. 59