Daimler Fact Sheet for Q4 and Full Year 2016 · PDF fileFree Cash Flow and Net Liquidity of...
28
Fact Sheet for Q4 and Full Year 2016 February 2, 2017
Transcript of Daimler Fact Sheet for Q4 and Full Year 2016 · PDF fileFree Cash Flow and Net Liquidity of...
Fact Sheet for Q4 and Full Year 2016
February 2, 2017
Contents
Daimler Group
Stock Market Information 3
Earnings and Financial Situation 4 - 13
Information for Divisions
Mercedes-Benz Cars 14 - 17
Daimler Trucks 18 - 22
Mercedes-Benz Vans 23 - 25
Daimler Buses 26 - 27
Daimler Financial Services 28
2
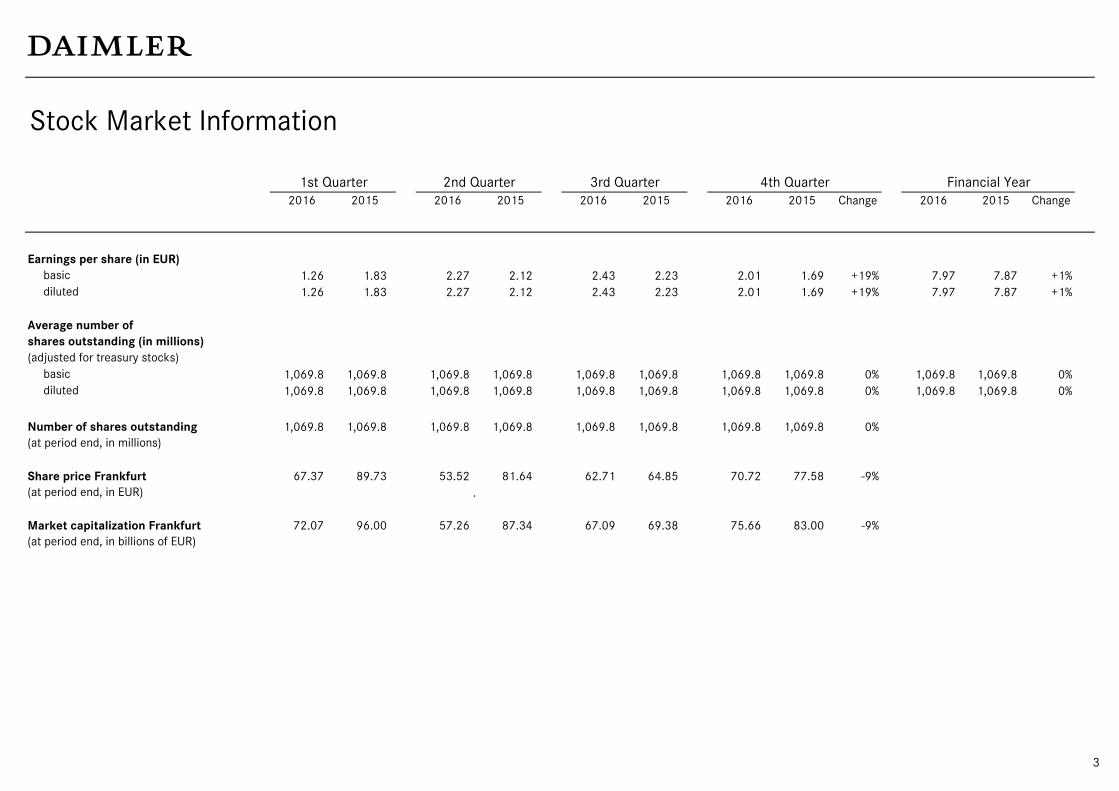
Stock Market Information
1st Quarter 2nd Quarter 3rd Quarter 4th Quarter Financial Year
2016 2015 2016 2015 2016 2015 2016 2015 Change 2016 2015 Change
Earnings per share (in EUR)
basic 1.26 1.83 2.27 2.12 2.43 2.23 2.01 1.69 +19% 7.97 7.87 +1%
diluted 1.26 1.83 2.27 2.12 2.43 2.23 2.01 1.69 +19% 7.97 7.87 +1%
Average number of
shares outstanding (in millions)
(adjusted for treasury stocks)
basic 1,069.8 1,069.8 1,069.8 1,069.8 1,069.8 1,069.8 1,069.8 1,069.8 0% 1,069.8 1,069.8 0%
diluted 1,069.8 1,069.8 1,069.8 1,069.8 1,069.8 1,069.8 1,069.8 1,069.8 0% 1,069.8 1,069.8 0%
Number of shares outstanding 1,069.8 1,069.8 1,069.8 1,069.8 1,069.8 1,069.8 1,069.8 1,069.8 0%
(at period end, in millions)
Share price Frankfurt 67.37 89.73 53.52 81.64 62.71 64.85 70.72 77.58 -9%
(at period end, in EUR) .
Market capitalization Frankfurt 72.07 96.00 57.26 87.34 67.09 69.38 75.66 83.00 -9%
(at period end, in billions of EUR)
3
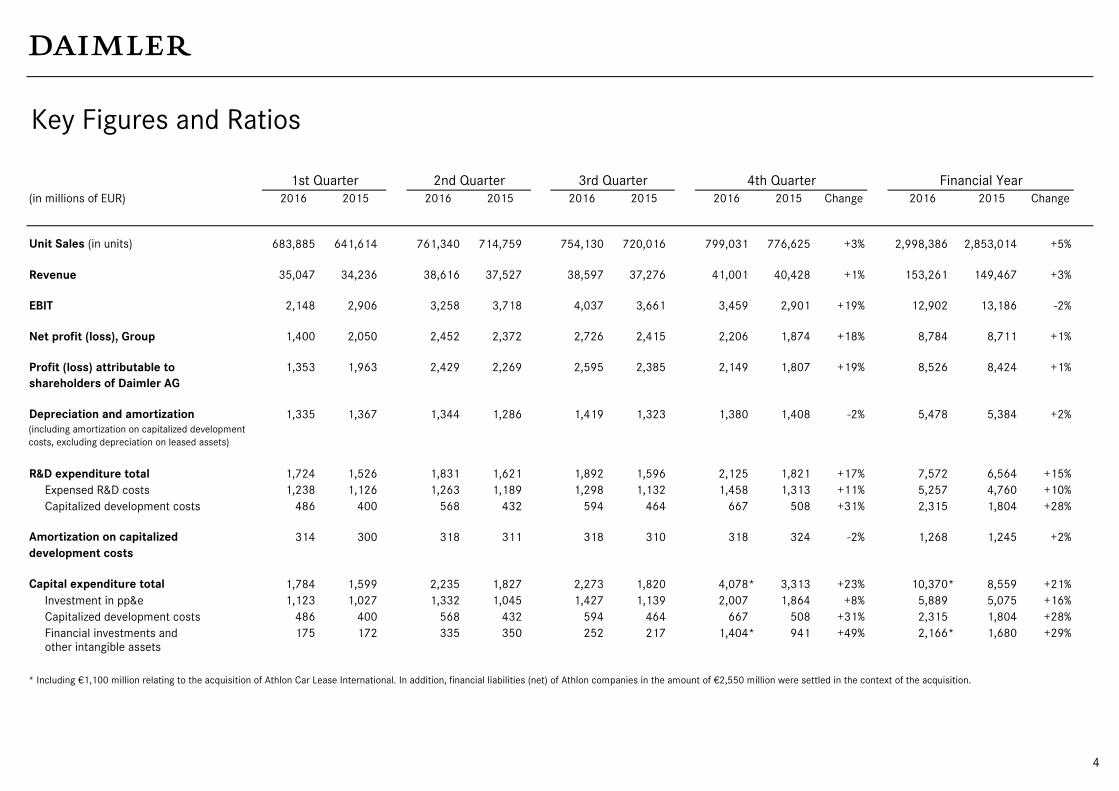
Key Figures and Ratios
1st Quarter 2nd Quarter 3rd Quarter 4th Quarter Financial Year
(in millions of EUR) 2016 2015 2016 2015 2016 2015 2016 2015 Change 2016 2015 Change
Unit Sales (in units) 683,885 641,614 761,340 714,759 754,130 720,016 799,031 776,625 +3% 2,998,386 2,853,014 +5%
Revenue 35,047 34,236 38,616 37,527 38,597 37,276 41,001 40,428 +1% 153,261 149,467 +3%
EBIT 2,148 2,906 3,258 3,718 4,037 3,661 3,459 2,901 +19% 12,902 13,186 -2%
Net profit (loss), Group 1,400 2,050 2,452 2,372 2,726 2,415 2,206 1,874 +18% 8,784 8,711 +1%
Profit (loss) attributable to 1,353 1,963 2,429 2,269 2,595 2,385 2,149 1,807 +19% 8,526 8,424 +1%
shareholders of Daimler AG
Depreciation and amortization 1,335 1,367 1,344 1,286 1,419 1,323 1,380 1,408 -2% 5,478 5,384 +2%
R&D expenditure total 1,724 1,526 1,831 1,621 1,892 1,596 2,125 1,821 +17% 7,572 6,564 +15%
Expensed R&D costs 1,238 1,126 1,263 1,189 1,298 1,132 1,458 1,313 +11% 5,257 4,760 +10%
Capitalized development costs 486 400 568 432 594 464 667 508 +31% 2,315 1,804 +28%
Amortization on capitalized 314 300 318 311 318 310 318 324 -2% 1,268 1,245 +2%
development costs
Capital expenditure total 1,784 1,599 2,235 1,827 2,273 1,820 4,078* 3,313 +23% 10,370* 8,559 +21%
Investment in pp&e 1,123 1,027 1,332 1,045 1,427 1,139 2,007 1,864 +8% 5,889 5,075 +16%
Capitalized development costs 486 400 568 432 594 464 667 508 +31% 2,315 1,804 +28%
Financial investments and 175 172 335 350 252 217 1,404* 941 +49% 2,166* 1,680 +29% other intangible assets
* Including €1,100 million relating to the acquisition of Athlon Car Lease International. In addition, financial liabilities (net) of Athlon companies in the amount of €2,550 million were settled in the context of the acquisition.
(including amortization on capitalized development
costs, excluding depreciation on leased assets)
4
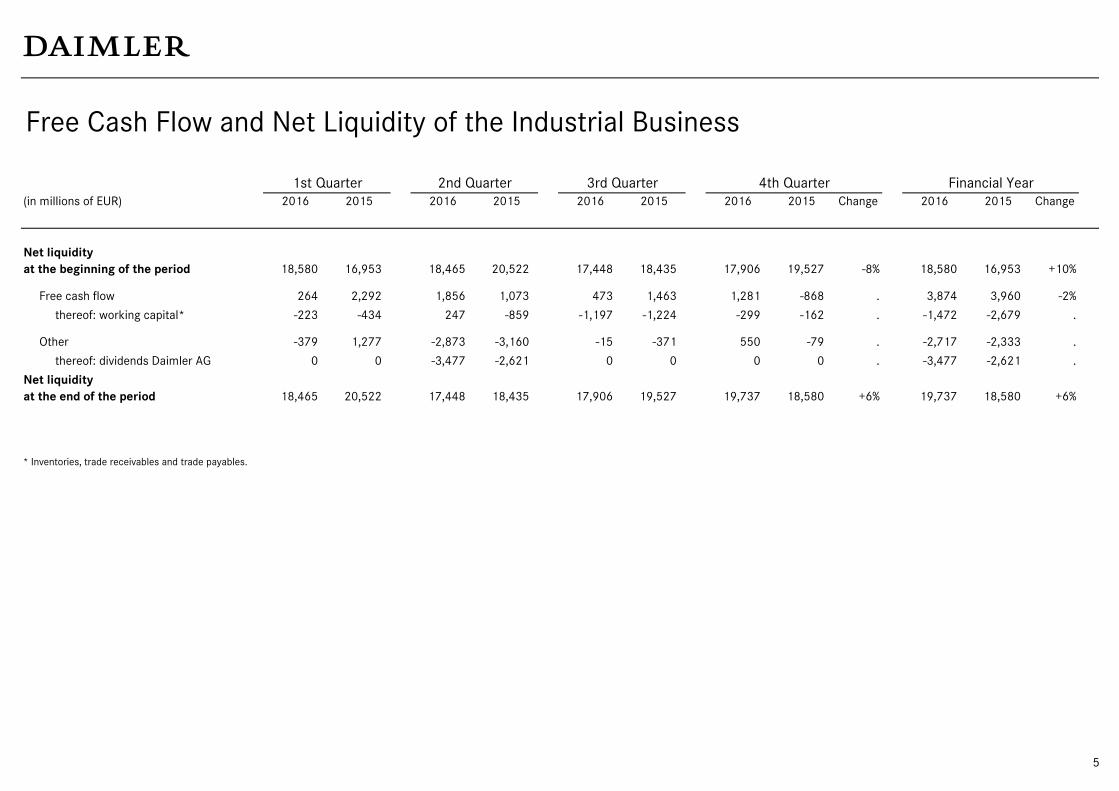
Free Cash Flow and Net Liquidity of the Industrial Business
1st Quarter 2nd Quarter 3rd Quarter 4th Quarter Financial Year
(in millions of EUR) 2016 2015 2016 2015 2016 2015 2016 2015 Change 2016 2015 Change
Net liquidity
at the beginning of the period 18,580 16,953 18,465 20,522 17,448 18,435 17,906 19,527 -8% 18,580 16,953 +10%
Free cash flow 264 2,292 1,856 1,073 473 1,463 1,281 -868 . 3,874 3,960 -2%
thereof: working capital* -223 -434 247 -859 -1,197 -1,224 -299 -162 . -1,472 -2,679 .
Other -379 1,277 -2,873 -3,160 -15 -371 550 -79 . -2,717 -2,333 .
thereof: dividends Daimler AG 0 0 -3,477 -2,621 0 0 0 0 . -3,477 -2,621 .
Net liquidity
at the end of the period 18,465 20,522 17,448 18,435 17,906 19,527 19,737 18,580 +6% 19,737 18,580 +6%
* Inventories, trade receivables and trade payables.
1) 1)
5
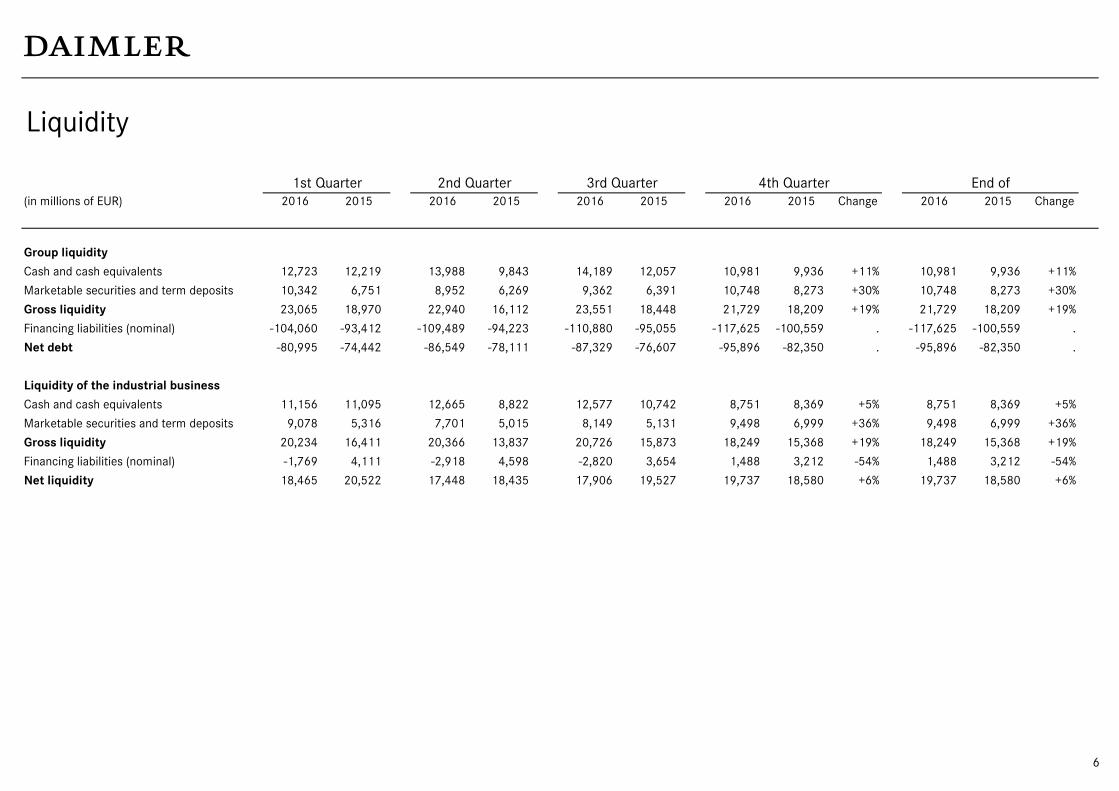
Liquidity
1st Quarter 2nd Quarter 3rd Quarter 4th Quarter End of
(in millions of EUR) 2016 2015 2016 2015 2016 2015 2016 2015 Change 2016 2015 Change
Group liquidity
Cash and cash equivalents 12,723 12,219 13,988 9,843 14,189 12,057 10,981 9,936 +11% 10,981 9,936 +11%
Marketable securities and term deposits 10,342 6,751 8,952 6,269 9,362 6,391 10,748 8,273 +30% 10,748 8,273 +30%
Gross liquidity 23,065 18,970 22,940 16,112 23,551 18,448 21,729 18,209 +19% 21,729 18,209 +19%
Financing liabilities (nominal) -104,060 -93,412 -109,489 -94,223 -110,880 -95,055 -117,625 -100,559 . -117,625 -100,559 .
Net debt -80,995 -74,442 -86,549 -78,111 -87,329 -76,607 -95,896 -82,350 . -95,896 -82,350 .
Liquidity of the industrial business
Cash and cash equivalents 11,156 11,095 12,665 8,822 12,577 10,742 8,751 8,369 +5% 8,751 8,369 +5%
Marketable securities and term deposits 9,078 5,316 7,701 5,015 8,149 5,131 9,498 6,999 +36% 9,498 6,999 +36%
Gross liquidity 20,234 16,411 20,366 13,837 20,726 15,873 18,249 15,368 +19% 18,249 15,368 +19%
Financing liabilities (nominal) -1,769 4,111 -2,918 4,598 -2,820 3,654 1,488 3,212 -54% 1,488 3,212 -54%
Net liquidity 18,465 20,522 17,448 18,435 17,906 19,527 19,737 18,580 +6% 19,737 18,580 +6%
6
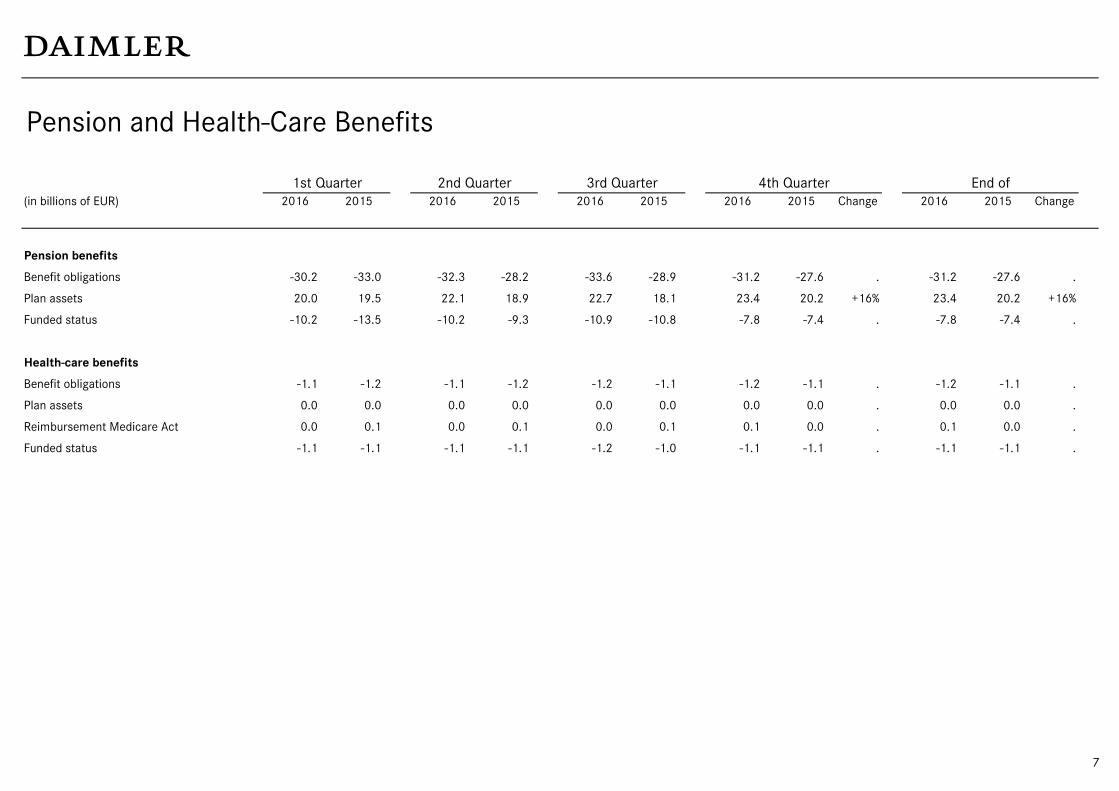
Pension and Health-Care Benefits
1st Quarter 2nd Quarter 3rd Quarter 4th Quarter End of
(in billions of EUR) 2016 2015 2016 2015 2016 2015 2016 2015 Change 2016 2015 Change
Pension benefits
Benefit obligations -30.2 -33.0 -32.3 -28.2 -33.6 -28.9 -31.2 -27.6 . -31.2 -27.6 .
Plan assets 20.0 19.5 22.1 18.9 22.7 18.1 23.4 20.2 +16% 23.4 20.2 +16%
Funded status -10.2 -13.5 -10.2 -9.3 -10.9 -10.8 -7.8 -7.4 . -7.8 -7.4 .
Health-care benefits
Benefit obligations -1.1 -1.2 -1.1 -1.2 -1.2 -1.1 -1.2 -1.1 . -1.2 -1.1 .
Plan assets 0.0 0.0 0.0 0.0 0.0 0.0 0.0 0.0 . 0.0 0.0 .
Reimbursement Medicare Act 0.0 0.1 0.0 0.1 0.0 0.1 0.1 0.0 . 0.1 0.0 .
Funded status -1.1 -1.1 -1.1 -1.1 -1.2 -1.0 -1.1 -1.1 . -1.1 -1.1 .
7
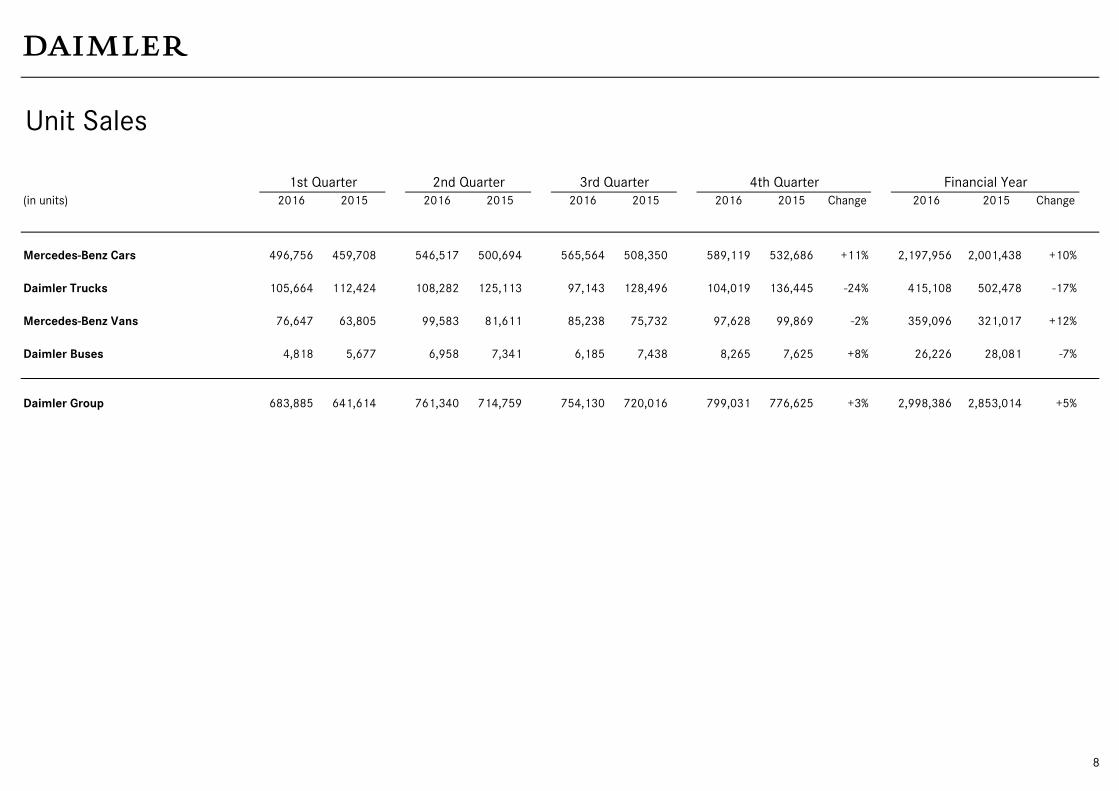
Unit Sales
1st Quarter 2nd Quarter 3rd Quarter 4th Quarter Financial Year
(in units) 2016 2015 2016 2015 2016 2015 2016 2015 Change 2016 2015 Change
Mercedes-Benz Cars 496,756 459,708 546,517 500,694 565,564 508,350 589,119 532,686 +11% 2,197,956 2,001,438 +10%
Daimler Trucks 105,664 112,424 108,282 125,113 97,143 128,496 104,019 136,445 -24% 415,108 502,478 -17%
Mercedes-Benz Vans 76,647 63,805 99,583 81,611 85,238 75,732 97,628 99,869 -2% 359,096 321,017 +12%
Daimler Buses 4,818 5,677 6,958 7,341 6,185 7,438 8,265 7,625 +8% 26,226 28,081 -7%
Daimler Group 683,885 641,614 761,340 714,759 754,130 720,016 799,031 776,625 +3% 2,998,386 2,853,014 +5%
8
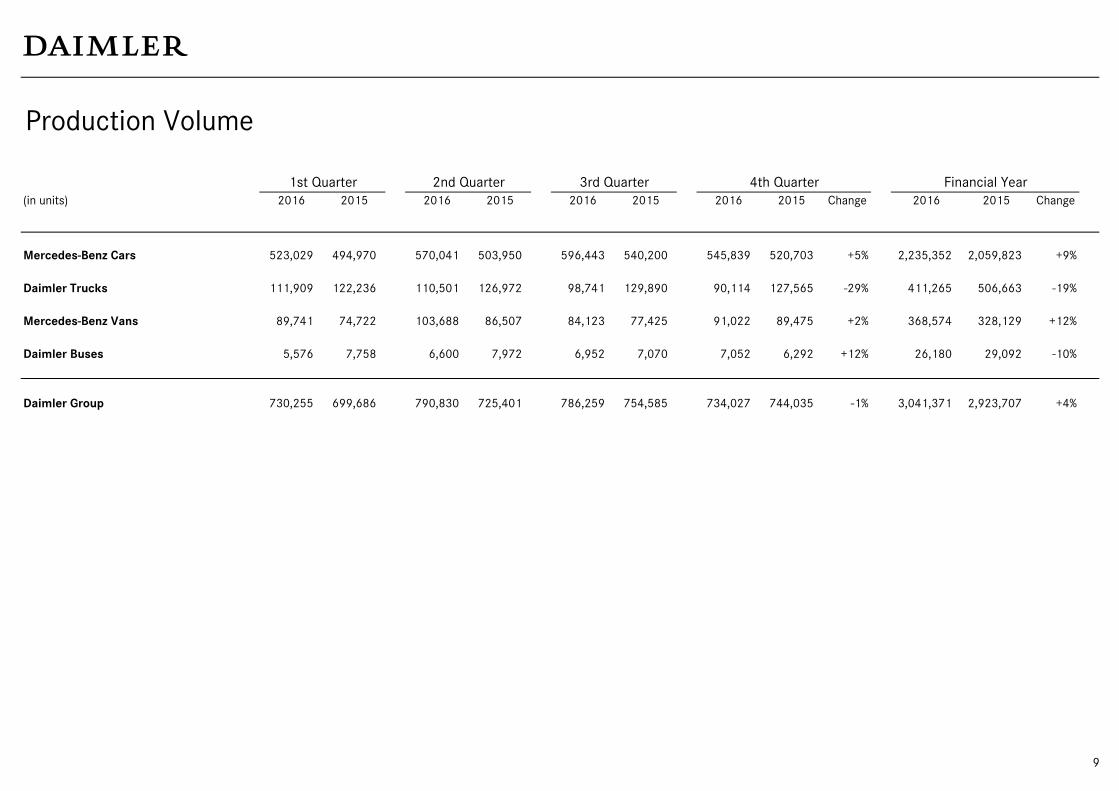
Production Volume
1st Quarter 2nd Quarter 3rd Quarter 4th Quarter Financial Year
(in units) 2016 2015 2016 2015 2016 2015 2016 2015 Change 2016 2015 Change
Mercedes-Benz Cars 523,029 494,970 570,041 503,950 596,443 540,200 545,839 520,703 +5% 2,235,352 2,059,823 +9%
Daimler Trucks 111,909 122,236 110,501 126,972 98,741 129,890 90,114 127,565 -29% 411,265 506,663 -19%
Mercedes-Benz Vans 89,741 74,722 103,688 86,507 84,123 77,425 91,022 89,475 +2% 368,574 328,129 +12%
Daimler Buses 5,576 7,758 6,600 7,972 6,952 7,070 7,052 6,292 +12% 26,180 29,092 -10%
Daimler Group 730,255 699,686 790,830 725,401 786,259 754,585 734,027 744,035 -1% 3,041,371 2,923,707 +4%
9
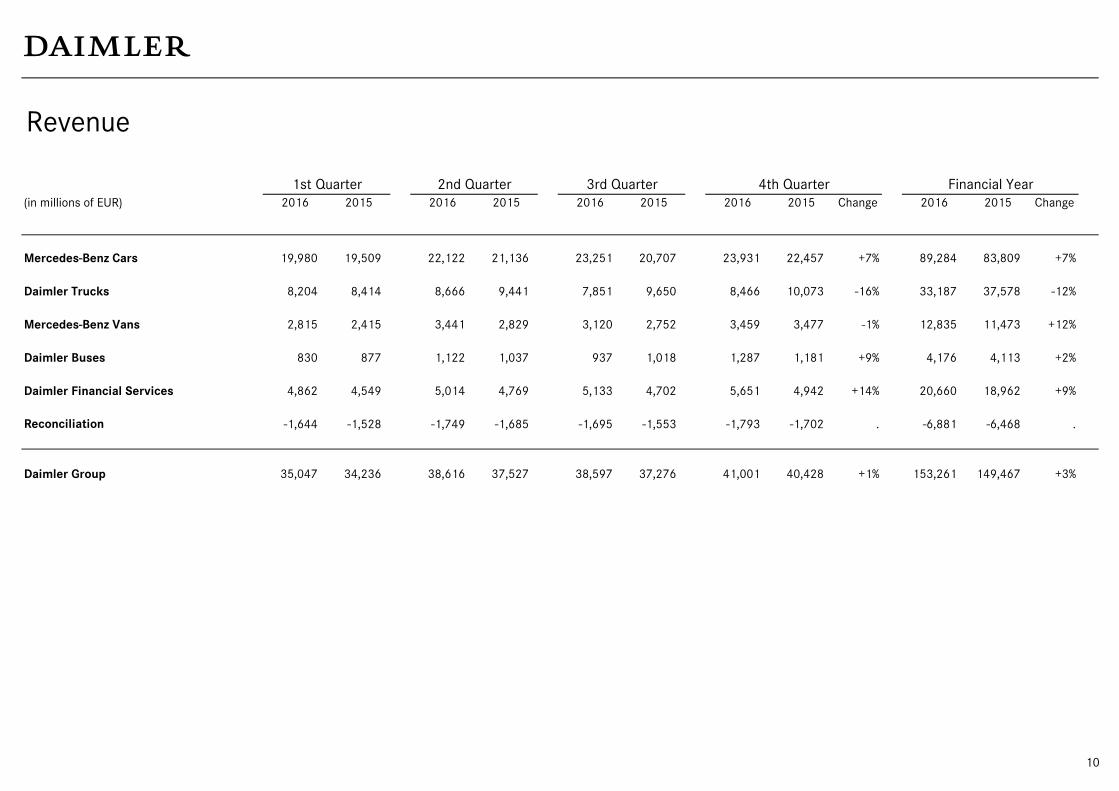
Revenue
1st Quarter 2nd Quarter 3rd Quarter 4th Quarter Financial Year
(in millions of EUR) 2016 2015 2016 2015 2016 2015 2016 2015 Change 2016 2015 Change
Mercedes-Benz Cars 19,980 19,509 22,122 21,136 23,251 20,707 23,931 22,457 +7% 89,284 83,809 +7%
Daimler Trucks 8,204 8,414 8,666 9,441 7,851 9,650 8,466 10,073 -16% 33,187 37,578 -12%
Mercedes-Benz Vans 2,815 2,415 3,441 2,829 3,120 2,752 3,459 3,477 -1% 12,835 11,473 +12%
Daimler Buses 830 877 1,122 1,037 937 1,018 1,287 1,181 +9% 4,176 4,113 +2%
Daimler Financial Services 4,862 4,549 5,014 4,769 5,133 4,702 5,651 4,942 +14% 20,660 18,962 +9%
Reconciliation -1,644 -1,528 -1,749 -1,685 -1,695 -1,553 -1,793 -1,702 . -6,881 -6,468 .
Daimler Group 35,047 34,236 38,616 37,527 38,597 37,276 41,001 40,428 +1% 153,261 149,467 +3%
10
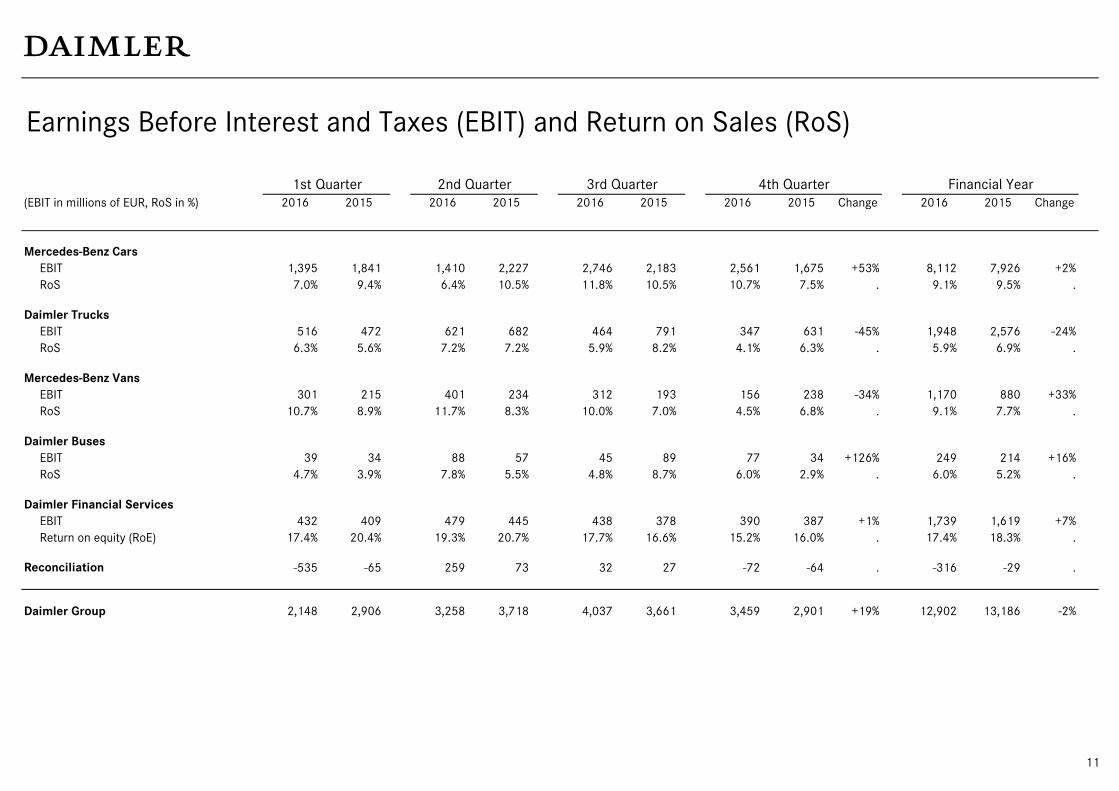
Earnings Before Interest and Taxes (EBIT) and Return on Sales (RoS)
1st Quarter 2nd Quarter 3rd Quarter 4th Quarter Financial Year
(EBIT in millions of EUR, RoS in %) 2016 2015 2016 2015 2016 2015 2016 2015 Change 2016 2015 Change
Mercedes-Benz Cars
EBIT 1,395 1,841 1,410 2,227 2,746 2,183 2,561 1,675 +53% 8,112 7,926 +2%
RoS 7.0% 9.4% 6.4% 10.5% 11.8% 10.5% 10.7% 7.5% . 9.1% 9.5% .
Daimler Trucks
EBIT 516 472 621 682 464 791 347 631 -45% 1,948 2,576 -24%
RoS 6.3% 5.6% 7.2% 7.2% 5.9% 8.2% 4.1% 6.3% . 5.9% 6.9% .
Mercedes-Benz Vans
EBIT 301 215 401 234 312 193 156 238 -34% 1,170 880 +33%
RoS 10.7% 8.9% 11.7% 8.3% 10.0% 7.0% 4.5% 6.8% . 9.1% 7.7% .
Daimler Buses
EBIT 39 34 88 57 45 89 77 34 +126% 249 214 +16%
RoS 4.7% 3.9% 7.8% 5.5% 4.8% 8.7% 6.0% 2.9% . 6.0% 5.2% .
Daimler Financial Services
EBIT 432 409 479 445 438 378 390 387 +1% 1,739 1,619 +7%
Return on equity (RoE) 17.4% 20.4% 19.3% 20.7% 17.7% 16.6% 15.2% 16.0% . 17.4% 18.3% .
Reconciliation -535 -65 259 73 32 27 -72 -64 . -316 -29 .
Daimler Group 2,148 2,906 3,258 3,718 4,037 3,661 3,459 2,901 +19% 12,902 13,186 -2%
11
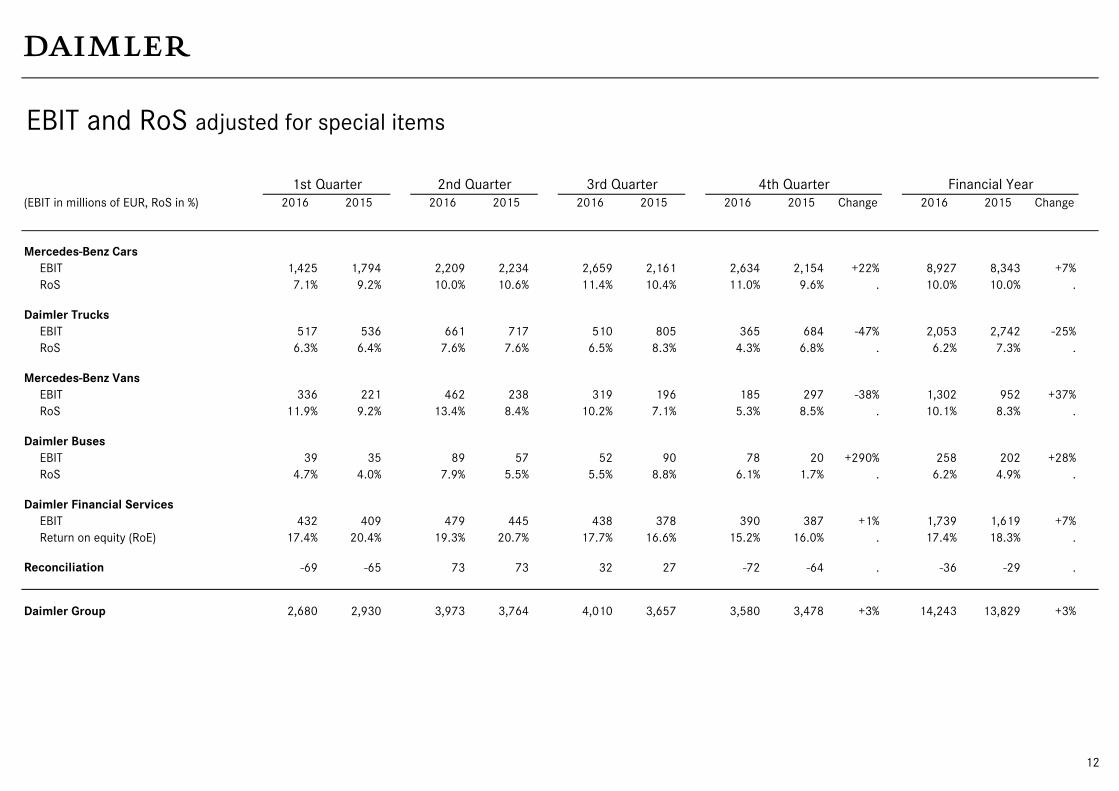
EBIT and RoS adjusted for special items
1st Quarter 2nd Quarter 3rd Quarter 4th Quarter Financial Year
(EBIT in millions of EUR, RoS in %) 2016 2015 2016 2015 2016 2015 2016 2015 Change 2016 2015 Change
Mercedes-Benz Cars
EBIT 1,425 1,794 2,209 2,234 2,659 2,161 2,634 2,154 +22% 8,927 8,343 +7%
RoS 7.1% 9.2% 10.0% 10.6% 11.4% 10.4% 11.0% 9.6% . 10.0% 10.0% .
Daimler Trucks
EBIT 517 536 661 717 510 805 365 684 -47% 2,053 2,742 -25%
RoS 6.3% 6.4% 7.6% 7.6% 6.5% 8.3% 4.3% 6.8% . 6.2% 7.3% .
Mercedes-Benz Vans
EBIT 336 221 462 238 319 196 185 297 -38% 1,302 952 +37%
RoS 11.9% 9.2% 13.4% 8.4% 10.2% 7.1% 5.3% 8.5% . 10.1% 8.3% .
Daimler Buses
EBIT 39 35 89 57 52 90 78 20 +290% 258 202 +28%
RoS 4.7% 4.0% 7.9% 5.5% 5.5% 8.8% 6.1% 1.7% . 6.2% 4.9% .
Daimler Financial Services
EBIT 432 409 479 445 438 378 390 387 +1% 1,739 1,619 +7%
Return on equity (RoE) 17.4% 20.4% 19.3% 20.7% 17.7% 16.6% 15.2% 16.0% . 17.4% 18.3% .
Reconciliation -69 -65 73 73 32 27 -72 -64 . -36 -29 .
Daimler Group 2,680 2,930 3,973 3,764 4,010 3,657 3,580 3,478 +3% 14,243 13,829 +3%
12
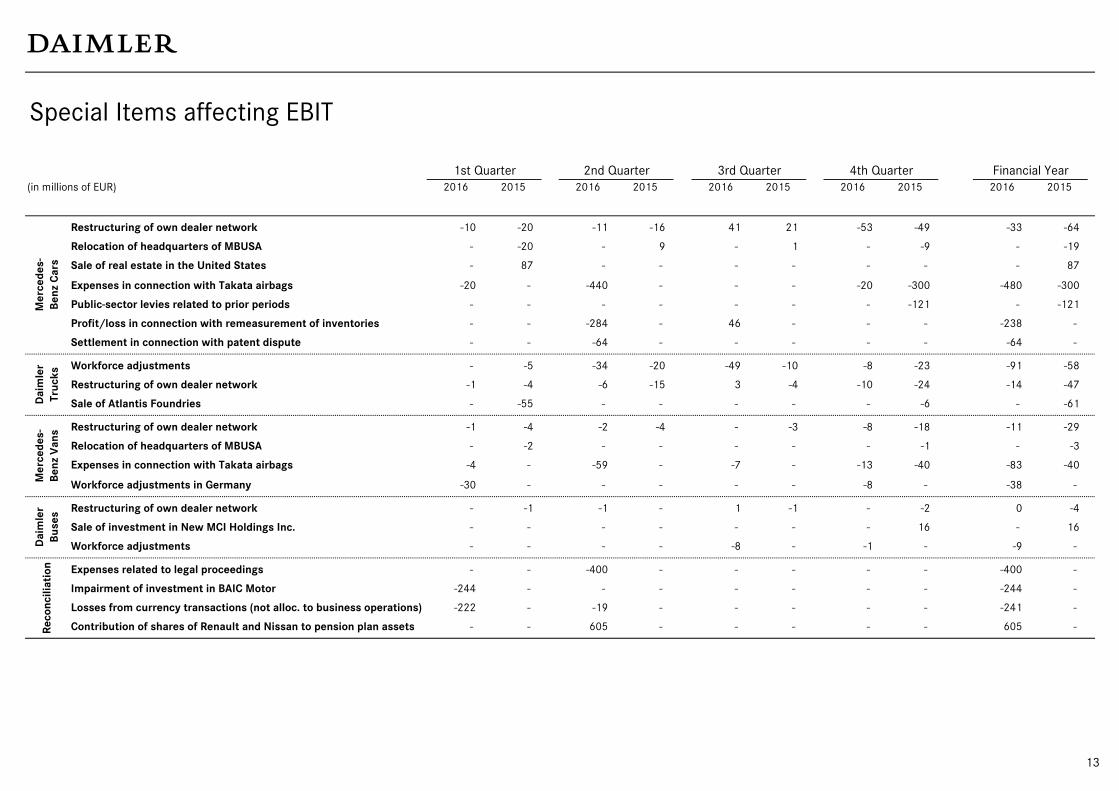
Special Items affecting EBIT
1st Quarter 2nd Quarter 3rd Quarter 4th Quarter Financial Year
(in millions of EUR) 2016 2015 2016 2015 2016 2015 2016 2015 2016 2015
Restructuring of own dealer network -10 -20 -11 -16 41 21 -53 -49 -33 -64
Relocation of headquarters of MBUSA - -20 - 9 - 1 - -9 - -19
Sale of real estate in the United States - 87 - - - - - - - 87
Expenses in connection with Takata airbags -20 - -440 - - - -20 -300 -480 -300
Public-sector levies related to prior periods - - - - - - - -121 - -121
Profit/loss in connection with remeasurement of inventories - - -284 - 46 - - - -238 -
Settlement in connection with patent dispute - - -64 - - - - - -64 -
Workforce adjustments - -5 -34 -20 -49 -10 -8 -23 -91 -58
Restructuring of own dealer network -1 -4 -6 -15 3 -4 -10 -24 -14 -47
Sale of Atlantis Foundries - -55 - - - - - -6 - -61
Restructuring of own dealer network -1 -4 -2 -4 - -3 -8 -18 -11 -29
Relocation of headquarters of MBUSA - -2 - - - - - -1 - -3
Expenses in connection with Takata airbags -4 - -59 - -7 - -13 -40 -83 -40
Workforce adjustments in Germany -30 - - - - - -8 - -38 -
Restructuring of own dealer network - -1 -1 - 1 -1 - -2 0 -4
Sale of investment in New MCI Holdings Inc. - - - - - - - 16 - 16
Workforce adjustments - - - - -8 - -1 - -9 -
Expenses related to legal proceedings - - -400 - - - - - -400 -
Impairment of investment in BAIC Motor -244 - - - - - - - -244 -
Losses from currency transactions (not alloc. to business operations) -222 - -19 - - - - - -241 -
Contribution of shares of Renault and Nissan to pension plan assets - - 605 - - - - - 605 -
Da
imle
r
Tru
ck
sR
eco
ncil
iati
on
Da
imle
r
Bu
se
s
Me
rce
de
s-
Be
nz
Va
ns
Me
rce
de
s-
Be
nz
Ca
rs
13
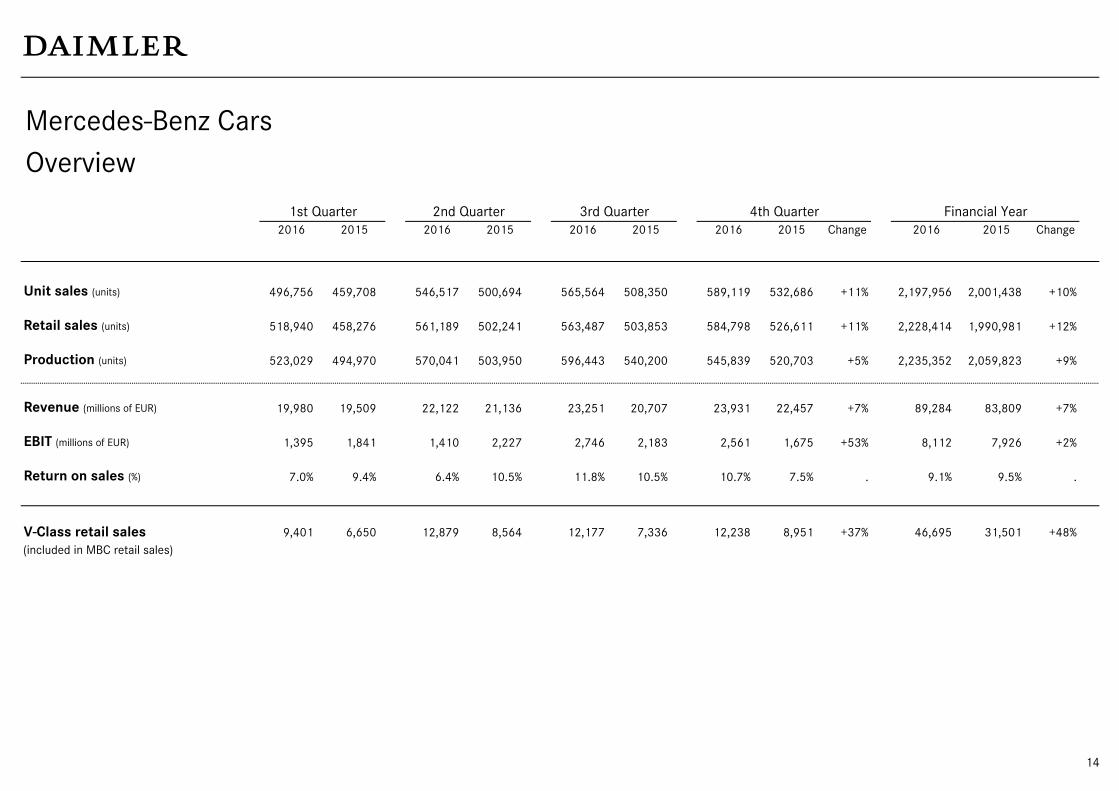
Mercedes-Benz Cars
Overview
1st Quarter 2nd Quarter 3rd Quarter 4th Quarter Financial Year
2016 2015 2016 2015 2016 2015 2016 2015 Change 2016 2015 Change
Unit sales (units) 496,756 459,708 546,517 500,694 565,564 508,350 589,119 532,686 +11% 2,197,956 2,001,438 +10%
Retail sales (units) 518,940 458,276 561,189 502,241 563,487 503,853 584,798 526,611 +11% 2,228,414 1,990,981 +12%
Production (units) 523,029 494,970 570,041 503,950 596,443 540,200 545,839 520,703 +5% 2,235,352 2,059,823 +9%
Revenue (millions of EUR) 19,980 19,509 22,122 21,136 23,251 20,707 23,931 22,457 +7% 89,284 83,809 +7%
EBIT (millions of EUR) 1,395 1,841 1,410 2,227 2,746 2,183 2,561 1,675 +53% 8,112 7,926 +2%
Return on sales (%) 7.0% 9.4% 6.4% 10.5% 11.8% 10.5% 10.7% 7.5% . 9.1% 9.5% .
V-Class retail sales 9,401 6,650 12,879 8,564 12,177 7,336 12,238 8,951 +37% 46,695 31,501 +48%
(included in MBC retail sales)
14
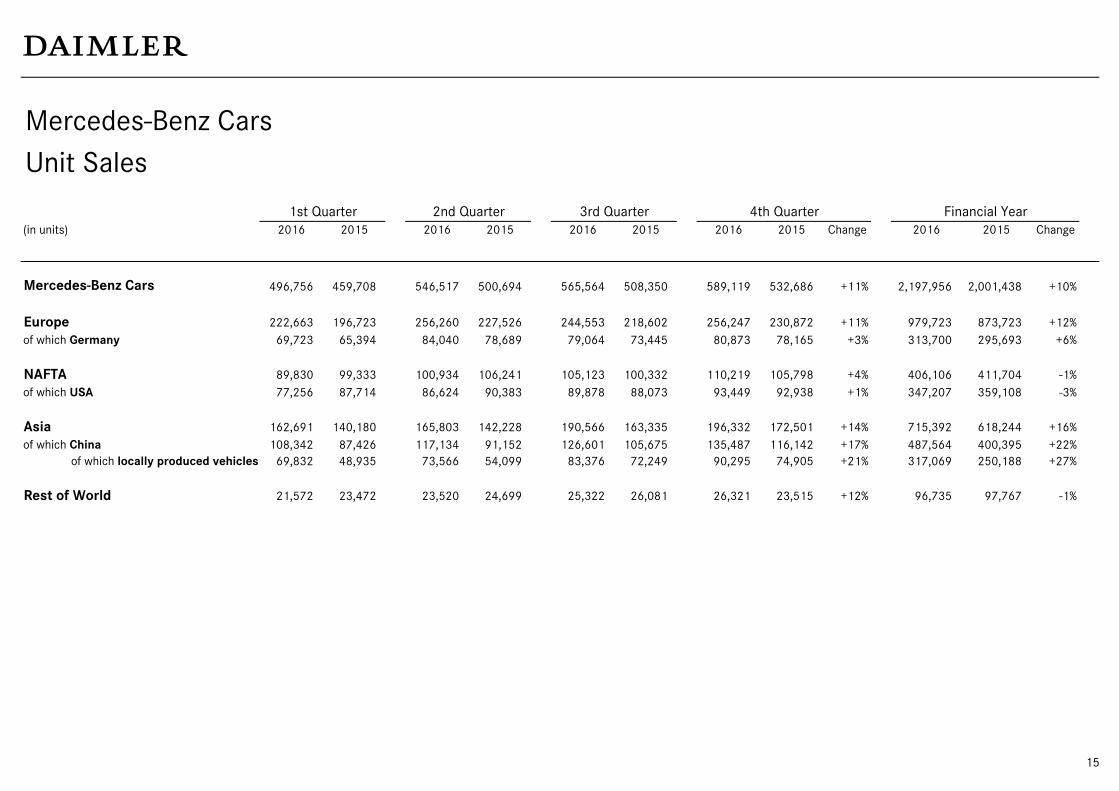
Mercedes-Benz Cars
Unit Sales
1st Quarter 2nd Quarter 3rd Quarter 4th Quarter Financial Year
(in units) 2016 2015 2016 2015 2016 2015 2016 2015 Change 2016 2015 Change
Mercedes-Benz Cars 496,756 459,708 546,517 500,694 565,564 508,350 589,119 532,686 +11% 2,197,956 2,001,438 +10%
Europe 222,663 196,723 256,260 227,526 244,553 218,602 256,247 230,872 +11% 979,723 873,723 +12%
of which Germany 69,723 65,394 84,040 78,689 79,064 73,445 80,873 78,165 +3% 313,700 295,693 +6%
NAFTA 89,830 99,333 100,934 106,241 105,123 100,332 110,219 105,798 +4% 406,106 411,704 -1%
of which USA 77,256 87,714 86,624 90,383 89,878 88,073 93,449 92,938 +1% 347,207 359,108 -3%
Asia 162,691 140,180 165,803 142,228 190,566 163,335 196,332 172,501 +14% 715,392 618,244 +16%
of which China 108,342 87,426 117,134 91,152 126,601 105,675 135,487 116,142 +17% 487,564 400,395 +22%
of which locally produced vehicles 69,832 48,935 73,566 54,099 83,376 72,249 90,295 74,905 +21% 317,069 250,188 +27%
Rest of World 21,572 23,472 23,520 24,699 25,322 26,081 26,321 23,515 +12% 96,735 97,767 -1%
15
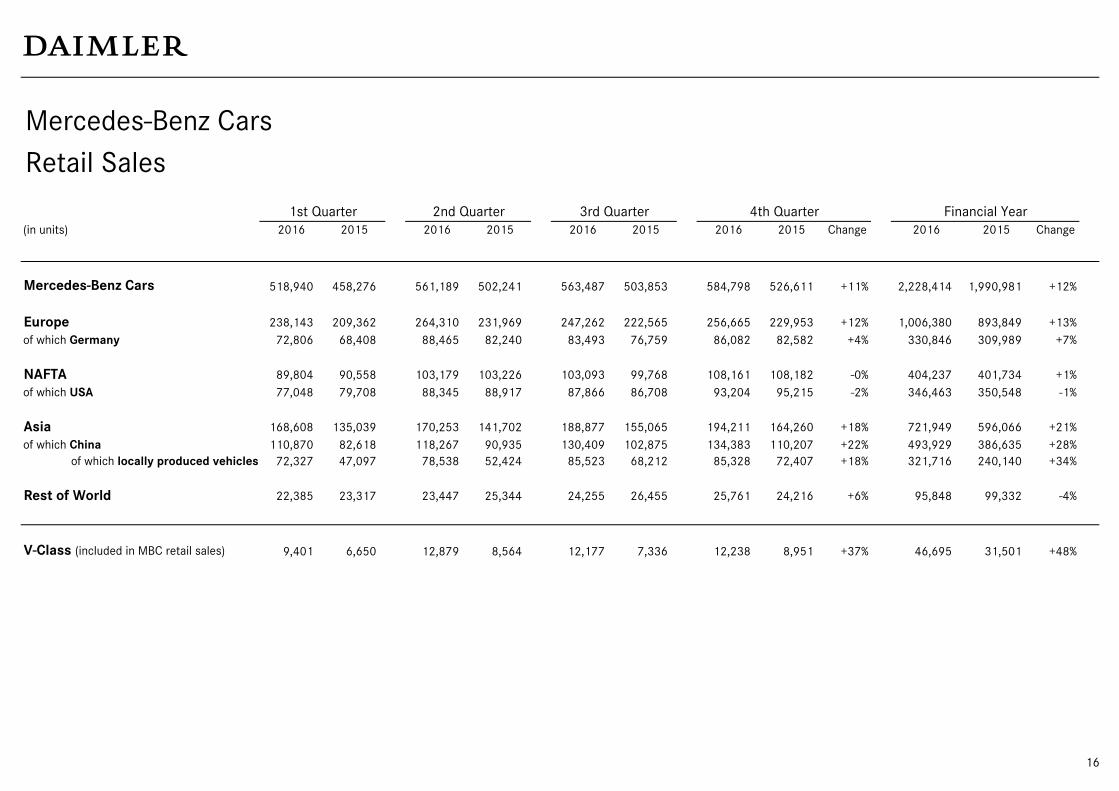
Mercedes-Benz Cars
Retail Sales
1st Quarter 2nd Quarter 3rd Quarter 4th Quarter Financial Year
(in units) 2016 2015 2016 2015 2016 2015 2016 2015 Change 2016 2015 Change
Mercedes-Benz Cars 518,940 458,276 561,189 502,241 563,487 503,853 584,798 526,611 +11% 2,228,414 1,990,981 +12%
Europe 238,143 209,362 264,310 231,969 247,262 222,565 256,665 229,953 +12% 1,006,380 893,849 +13%
of which Germany 72,806 68,408 88,465 82,240 83,493 76,759 86,082 82,582 +4% 330,846 309,989 +7%
NAFTA 89,804 90,558 103,179 103,226 103,093 99,768 108,161 108,182 -0% 404,237 401,734 +1%
of which USA 77,048 79,708 88,345 88,917 87,866 86,708 93,204 95,215 -2% 346,463 350,548 -1%
Asia 168,608 135,039 170,253 141,702 188,877 155,065 194,211 164,260 +18% 721,949 596,066 +21%
of which China 110,870 82,618 118,267 90,935 130,409 102,875 134,383 110,207 +22% 493,929 386,635 +28%
of which locally produced vehicles 72,327 47,097 78,538 52,424 85,523 68,212 85,328 72,407 +18% 321,716 240,140 +34%
Rest of World 22,385 23,317 23,447 25,344 24,255 26,455 25,761 24,216 +6% 95,848 99,332 -4%
V-Class (included in MBC retail sales) 9,401 6,650 12,879 8,564 12,177 7,336 12,238 8,951 +37% 46,695 31,501 +48%
16
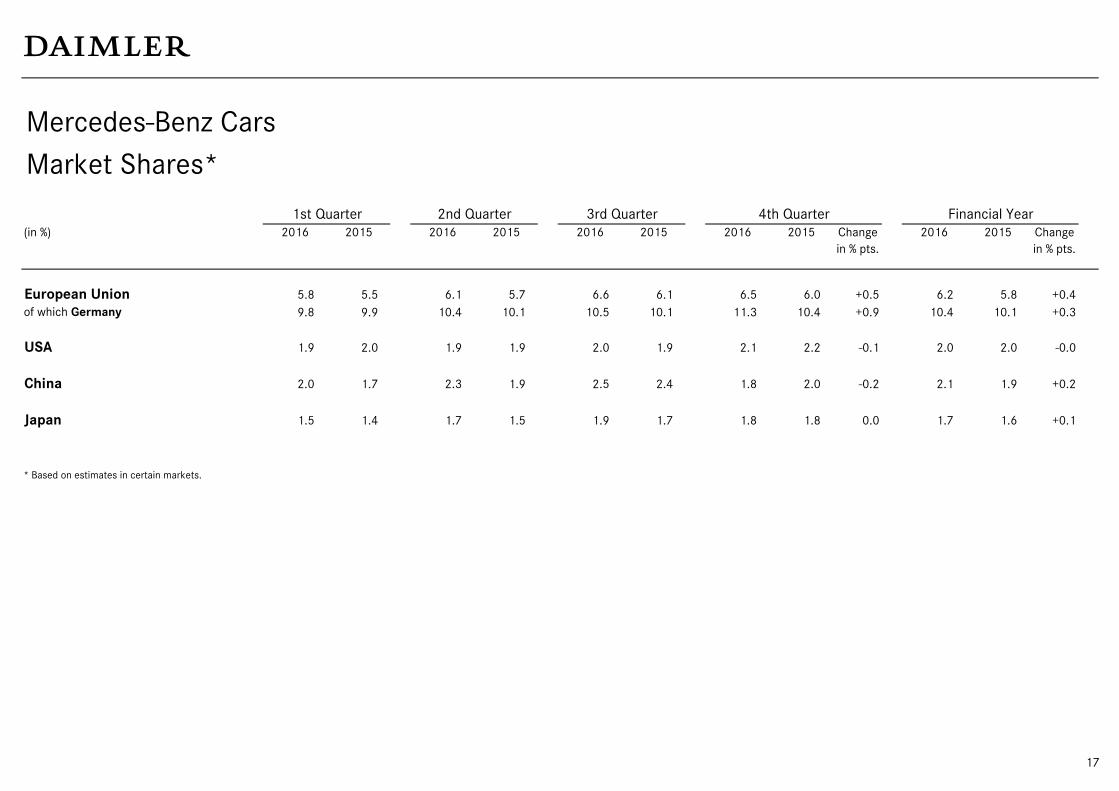
Mercedes-Benz Cars
Market Shares*
1st Quarter 2nd Quarter 3rd Quarter 4th Quarter Financial Year
(in %) 2016 2015 2016 2015 2016 2015 2016 2015 Change 2016 2015 Change
in % pts. in % pts.
European Union 5.8 5.5 6.1 5.7 6.6 6.1 6.5 6.0 +0.5 6.2 5.8 +0.4
of which Germany 9.8 9.9 10.4 10.1 10.5 10.1 11.3 10.4 +0.9 10.4 10.1 +0.3
USA 1.9 2.0 1.9 1.9 2.0 1.9 2.1 2.2 -0.1 2.0 2.0 -0.0
China 2.0 1.7 2.3 1.9 2.5 2.4 1.8 2.0 -0.2 2.1 1.9 +0.2
Japan 1.5 1.4 1.7 1.5 1.9 1.7 1.8 1.8 0.0 1.7 1.6 +0.1
* Based on estimates in certain markets.
17
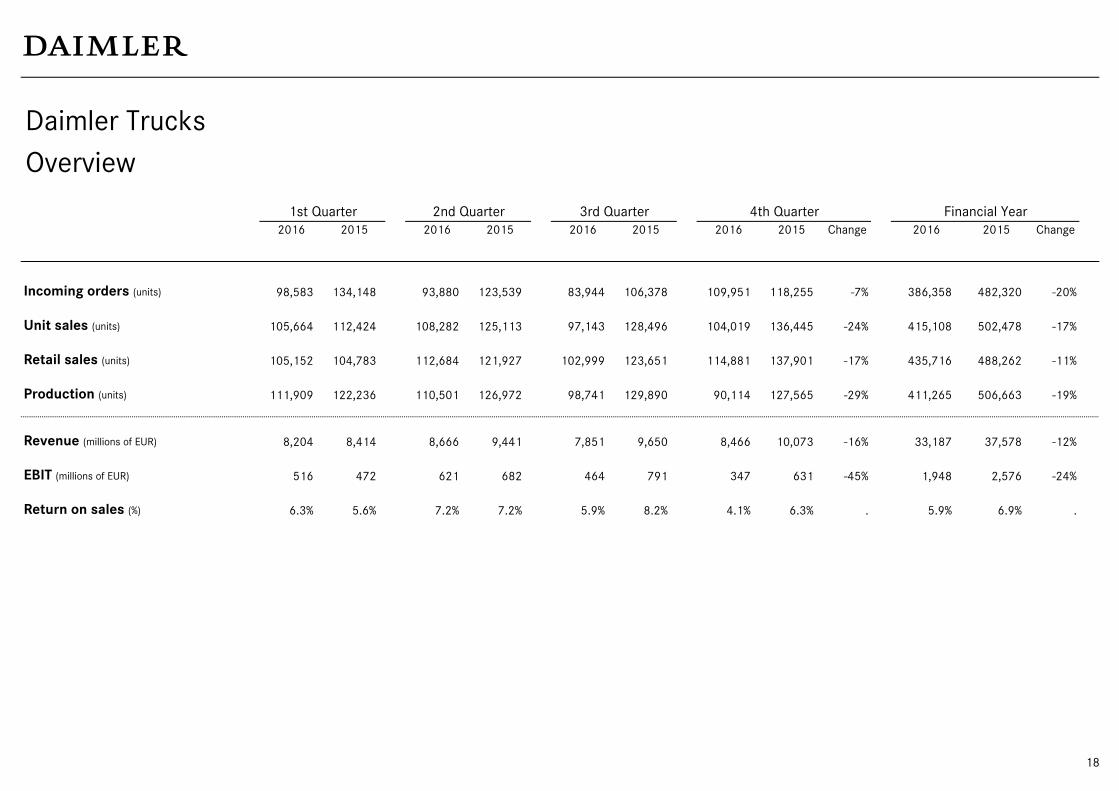
Daimler Trucks
Overview
1st Quarter 2nd Quarter 3rd Quarter 4th Quarter Financial Year
2016 2015 2016 2015 2016 2015 2016 2015 Change 2016 2015 Change
Incoming orders (units) 98,583 134,148 93,880 123,539 83,944 106,378 109,951 118,255 -7% 386,358 482,320 -20%
Unit sales (units) 105,664 112,424 108,282 125,113 97,143 128,496 104,019 136,445 -24% 415,108 502,478 -17%
Retail sales (units) 105,152 104,783 112,684 121,927 102,999 123,651 114,881 137,901 -17% 435,716 488,262 -11%
Production (units) 111,909 122,236 110,501 126,972 98,741 129,890 90,114 127,565 -29% 411,265 506,663 -19%
Revenue (millions of EUR) 8,204 8,414 8,666 9,441 7,851 9,650 8,466 10,073 -16% 33,187 37,578 -12%
EBIT (millions of EUR) 516 472 621 682 464 791 347 631 -45% 1,948 2,576 -24%
Return on sales (%) 6.3% 5.6% 7.2% 7.2% 5.9% 8.2% 4.1% 6.3% . 5.9% 6.9% .
18
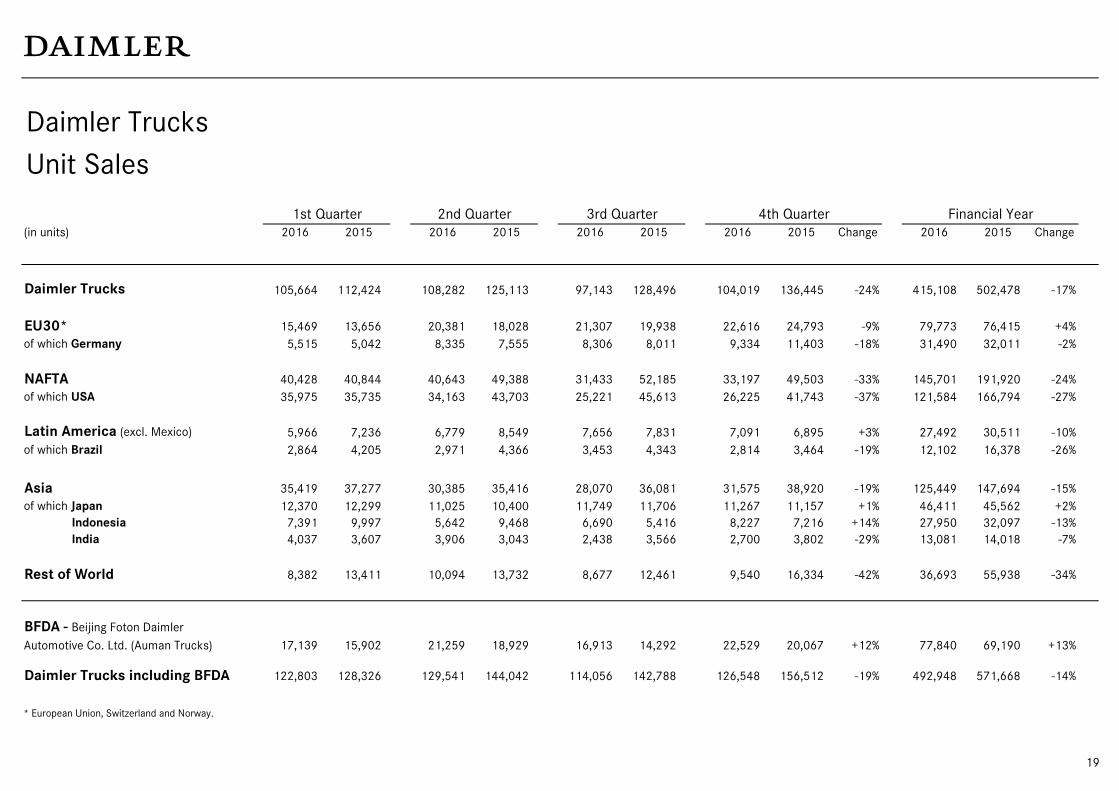
Daimler Trucks
Unit Sales
1st Quarter 2nd Quarter 3rd Quarter 4th Quarter Financial Year
(in units) 2016 2015 2016 2015 2016 2015 2016 2015 Change 2016 2015 Change
Daimler Trucks 105,664 112,424 108,282 125,113 97,143 128,496 104,019 136,445 -24% 415,108 502,478 -17%
EU30* 15,469 13,656 20,381 18,028 21,307 19,938 22,616 24,793 -9% 79,773 76,415 +4%
of which Germany 5,515 5,042 8,335 7,555 8,306 8,011 9,334 11,403 -18% 31,490 32,011 -2%
NAFTA 40,428 40,844 40,643 49,388 31,433 52,185 33,197 49,503 -33% 145,701 191,920 -24%
of which USA 35,975 35,735 34,163 43,703 25,221 45,613 26,225 41,743 -37% 121,584 166,794 -27%
Latin America (excl. Mexico) 5,966 7,236 6,779 8,549 7,656 7,831 7,091 6,895 +3% 27,492 30,511 -10%
of which Brazil 2,864 4,205 2,971 4,366 3,453 4,343 2,814 3,464 -19% 12,102 16,378 -26%
Asia 35,419 37,277 30,385 35,416 28,070 36,081 31,575 38,920 -19% 125,449 147,694 -15%
of which Japan 12,370 12,299 11,025 10,400 11,749 11,706 11,267 11,157 +1% 46,411 45,562 +2%
Indonesia 7,391 9,997 5,642 9,468 6,690 5,416 8,227 7,216 +14% 27,950 32,097 -13%
India 4,037 3,607 3,906 3,043 2,438 3,566 2,700 3,802 -29% 13,081 14,018 -7%
Rest of World 8,382 13,411 10,094 13,732 8,677 12,461 9,540 16,334 -42% 36,693 55,938 -34%
BFDA - Beijing Foton Daimler
Automotive Co. Ltd. (Auman Trucks) 17,139 15,902 21,259 18,929 16,913 14,292 22,529 20,067 +12% 77,840 69,190 +13%
Daimler Trucks including BFDA 122,803 128,326 129,541 144,042 114,056 142,788 126,548 156,512 -19% 492,948 571,668 -14%
* European Union, Switzerland and Norway.
19
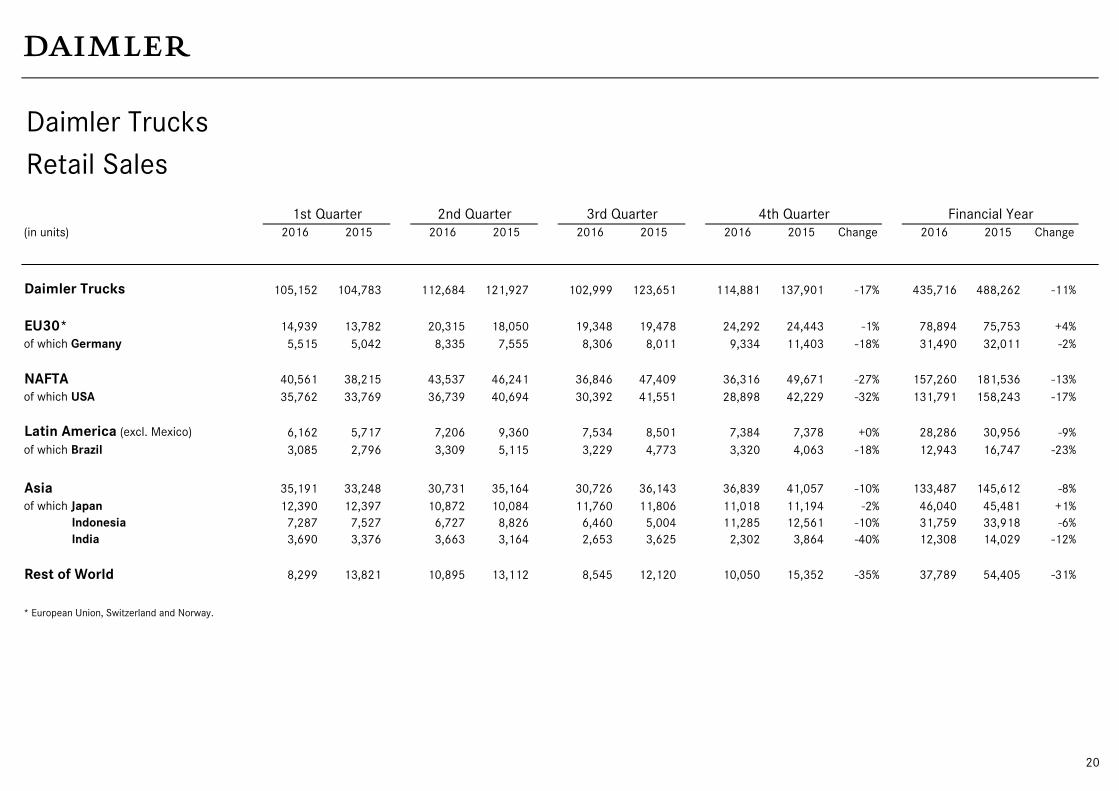
Daimler Trucks
Retail Sales
1st Quarter 2nd Quarter 3rd Quarter 4th Quarter Financial Year
(in units) 2016 2015 2016 2015 2016 2015 2016 2015 Change 2016 2015 Change
Daimler Trucks 105,152 104,783 112,684 121,927 102,999 123,651 114,881 137,901 -17% 435,716 488,262 -11%
EU30* 14,939 13,782 20,315 18,050 19,348 19,478 24,292 24,443 -1% 78,894 75,753 +4%
of which Germany 5,515 5,042 8,335 7,555 8,306 8,011 9,334 11,403 -18% 31,490 32,011 -2%
NAFTA 40,561 38,215 43,537 46,241 36,846 47,409 36,316 49,671 -27% 157,260 181,536 -13%
of which USA 35,762 33,769 36,739 40,694 30,392 41,551 28,898 42,229 -32% 131,791 158,243 -17%
Latin America (excl. Mexico) 6,162 5,717 7,206 9,360 7,534 8,501 7,384 7,378 +0% 28,286 30,956 -9%
of which Brazil 3,085 2,796 3,309 5,115 3,229 4,773 3,320 4,063 -18% 12,943 16,747 -23%
Asia 35,191 33,248 30,731 35,164 30,726 36,143 36,839 41,057 -10% 133,487 145,612 -8%
of which Japan 12,390 12,397 10,872 10,084 11,760 11,806 11,018 11,194 -2% 46,040 45,481 +1%
Indonesia 7,287 7,527 6,727 8,826 6,460 5,004 11,285 12,561 -10% 31,759 33,918 -6%
India 3,690 3,376 3,663 3,164 2,653 3,625 2,302 3,864 -40% 12,308 14,029 -12%
Rest of World 8,299 13,821 10,895 13,112 8,545 12,120 10,050 15,352 -35% 37,789 54,405 -31%
* European Union, Switzerland and Norway.
20
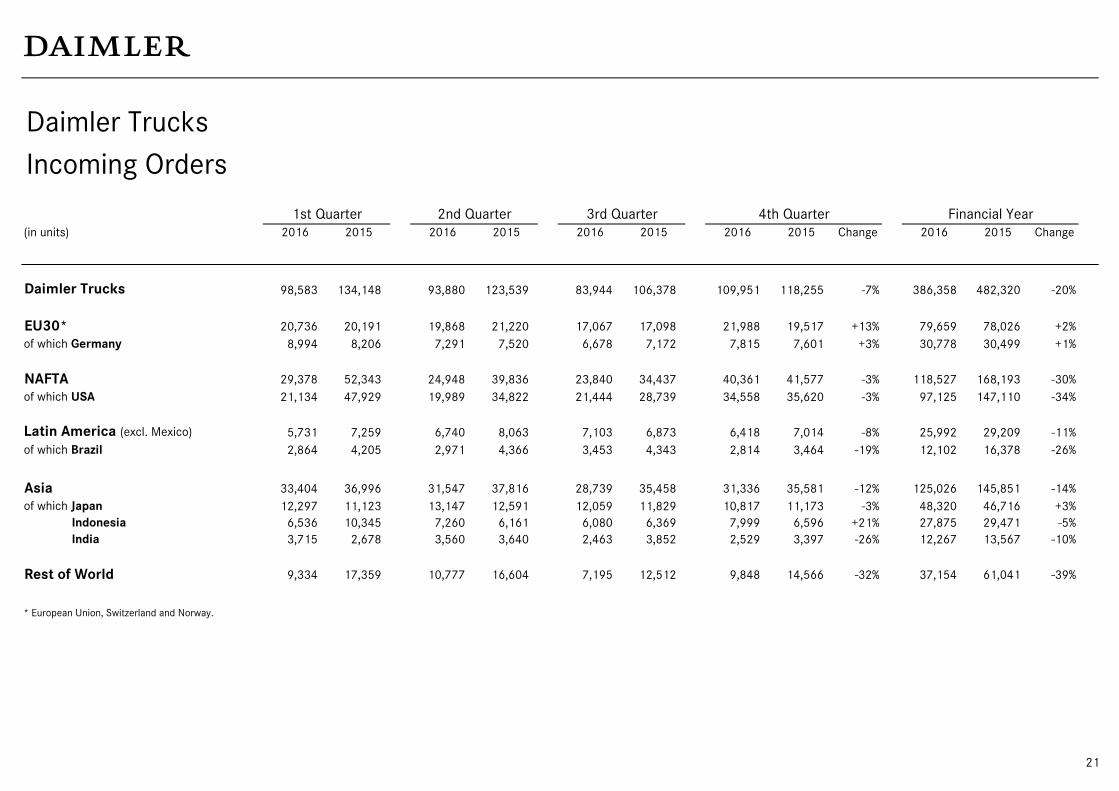
Daimler Trucks
Incoming Orders
1st Quarter 2nd Quarter 3rd Quarter 4th Quarter Financial Year
(in units) 2016 2015 2016 2015 2016 2015 2016 2015 Change 2016 2015 Change
Daimler Trucks 98,583 134,148 93,880 123,539 83,944 106,378 109,951 118,255 -7% 386,358 482,320 -20%
EU30* 20,736 20,191 19,868 21,220 17,067 17,098 21,988 19,517 +13% 79,659 78,026 +2%
of which Germany 8,994 8,206 7,291 7,520 6,678 7,172 7,815 7,601 +3% 30,778 30,499 +1%
NAFTA 29,378 52,343 24,948 39,836 23,840 34,437 40,361 41,577 -3% 118,527 168,193 -30%
of which USA 21,134 47,929 19,989 34,822 21,444 28,739 34,558 35,620 -3% 97,125 147,110 -34%
Latin America (excl. Mexico) 5,731 7,259 6,740 8,063 7,103 6,873 6,418 7,014 -8% 25,992 29,209 -11%
of which Brazil 2,864 4,205 2,971 4,366 3,453 4,343 2,814 3,464 -19% 12,102 16,378 -26%
Asia 33,404 36,996 31,547 37,816 28,739 35,458 31,336 35,581 -12% 125,026 145,851 -14%
of which Japan 12,297 11,123 13,147 12,591 12,059 11,829 10,817 11,173 -3% 48,320 46,716 +3%
Indonesia 6,536 10,345 7,260 6,161 6,080 6,369 7,999 6,596 +21% 27,875 29,471 -5%
India 3,715 2,678 3,560 3,640 2,463 3,852 2,529 3,397 -26% 12,267 13,567 -10%
Rest of World 9,334 17,359 10,777 16,604 7,195 12,512 9,848 14,566 -32% 37,154 61,041 -39%
* European Union, Switzerland and Norway.
21
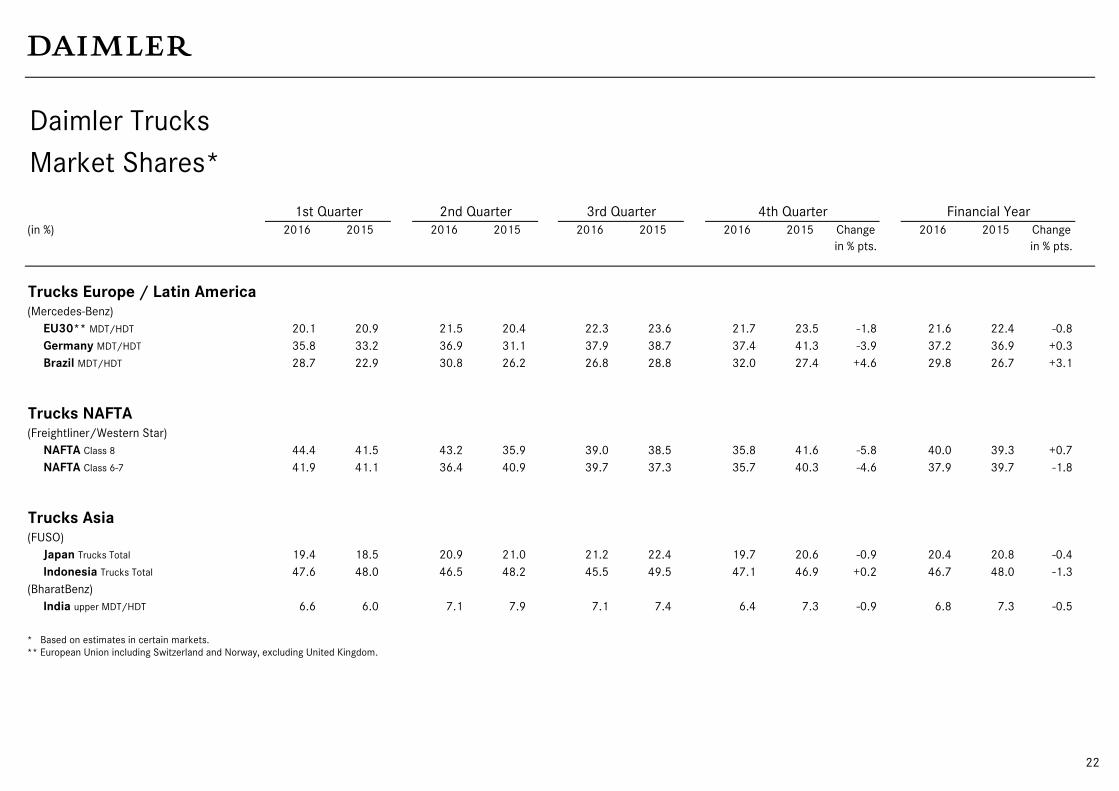
Daimler Trucks
Market Shares*
1st Quarter 2nd Quarter 3rd Quarter 4th Quarter Financial Year
(in %) 2016 2015 2016 2015 2016 2015 2016 2015 Change 2016 2015 Change
in % pts. in % pts.
Trucks Europe / Latin America(Mercedes-Benz)
EU30** MDT/HDT 20.1 20.9 21.5 20.4 22.3 23.6 21.7 23.5 -1.8 21.6 22.4 -0.8
Germany MDT/HDT 35.8 33.2 36.9 31.1 37.9 38.7 37.4 41.3 -3.9 37.2 36.9 +0.3
Brazil MDT/HDT 28.7 22.9 30.8 26.2 26.8 28.8 32.0 27.4 +4.6 29.8 26.7 +3.1
Trucks NAFTA(Freightliner/Western Star)
NAFTA Class 8 44.4 41.5 43.2 35.9 39.0 38.5 35.8 41.6 -5.8 40.0 39.3 +0.7
NAFTA Class 6-7 41.9 41.1 36.4 40.9 39.7 37.3 35.7 40.3 -4.6 37.9 39.7 -1.8
Trucks Asia(FUSO)
Japan Trucks Total 19.4 18.5 20.9 21.0 21.2 22.4 19.7 20.6 -0.9 20.4 20.8 -0.4
Indonesia Trucks Total 47.6 48.0 46.5 48.2 45.5 49.5 47.1 46.9 +0.2 46.7 48.0 -1.3
(BharatBenz)
India upper MDT/HDT 6.6 6.0 7.1 7.9 7.1 7.4 6.4 7.3 -0.9 6.8 7.3 -0.5
* Based on estimates in certain markets.
** European Union including Switzerland and Norway, excluding United Kingdom.
22
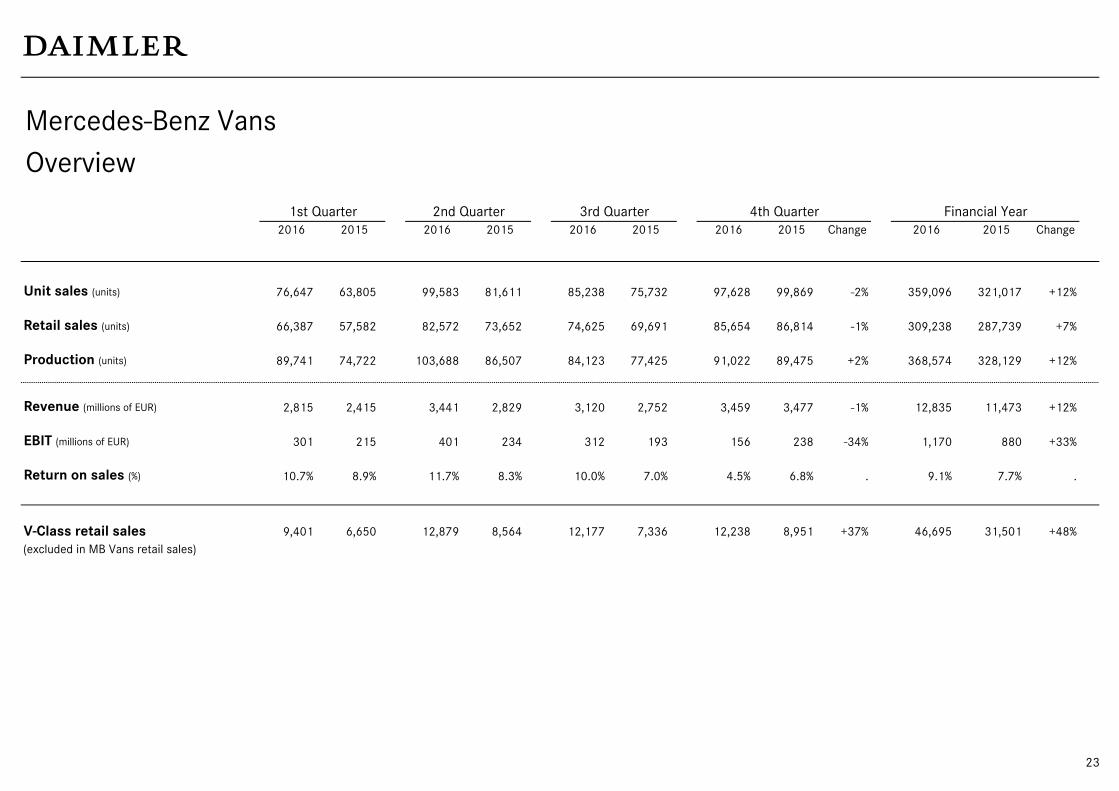
Mercedes-Benz Vans
Overview
1st Quarter 2nd Quarter 3rd Quarter 4th Quarter Financial Year
2016 2015 2016 2015 2016 2015 2016 2015 Change 2016 2015 Change
Unit sales (units) 76,647 63,805 99,583 81,611 85,238 75,732 97,628 99,869 -2% 359,096 321,017 +12%
Retail sales (units) 66,387 57,582 82,572 73,652 74,625 69,691 85,654 86,814 -1% 309,238 287,739 +7%
Production (units) 89,741 74,722 103,688 86,507 84,123 77,425 91,022 89,475 +2% 368,574 328,129 +12%
Revenue (millions of EUR) 2,815 2,415 3,441 2,829 3,120 2,752 3,459 3,477 -1% 12,835 11,473 +12%
EBIT (millions of EUR) 301 215 401 234 312 193 156 238 -34% 1,170 880 +33%
Return on sales (%) 10.7% 8.9% 11.7% 8.3% 10.0% 7.0% 4.5% 6.8% . 9.1% 7.7% .
V-Class retail sales 9,401 6,650 12,879 8,564 12,177 7,336 12,238 8,951 +37% 46,695 31,501 +48%
(excluded in MB Vans retail sales)
23
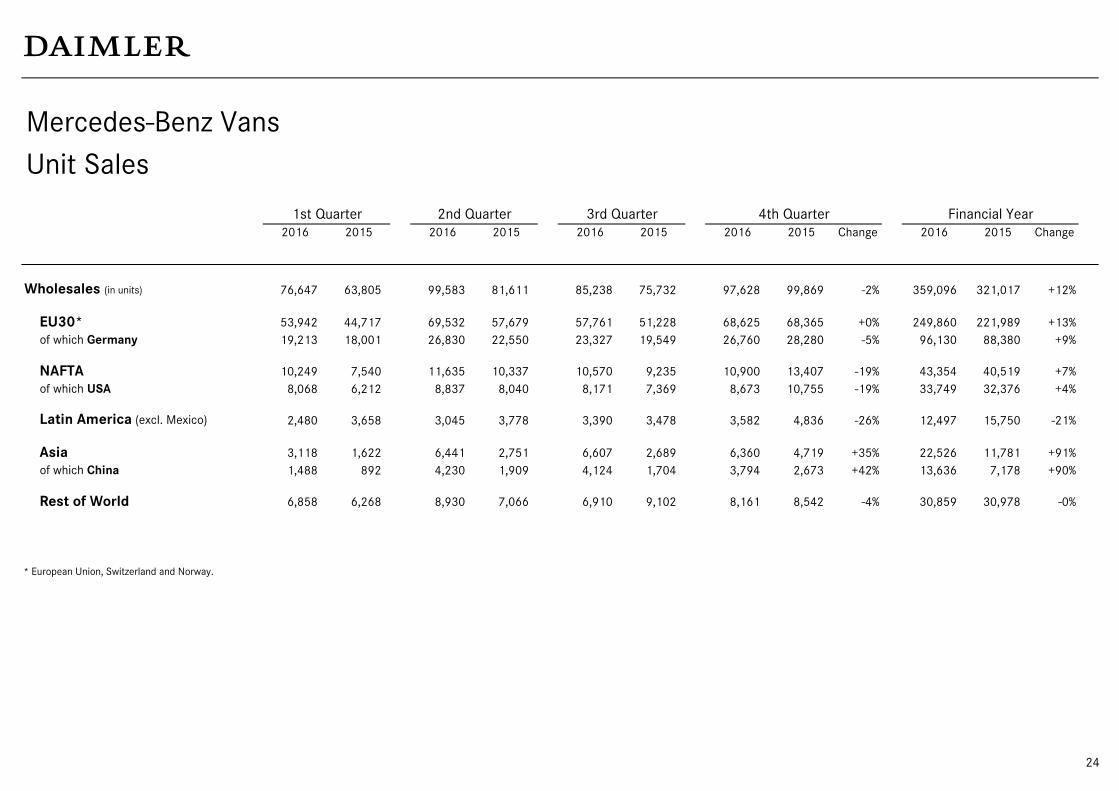
Mercedes-Benz Vans
Unit Sales
1st Quarter 2nd Quarter 3rd Quarter 4th Quarter Financial Year
2016 2015 2016 2015 2016 2015 2016 2015 Change 2016 2015 Change
Wholesales (in units) 76,647 63,805 99,583 81,611 85,238 75,732 97,628 99,869 -2% 359,096 321,017 +12%
EU30* 53,942 44,717 69,532 57,679 57,761 51,228 68,625 68,365 +0% 249,860 221,989 +13%
of which Germany 19,213 18,001 26,830 22,550 23,327 19,549 26,760 28,280 -5% 96,130 88,380 +9%
NAFTA 10,249 7,540 11,635 10,337 10,570 9,235 10,900 13,407 -19% 43,354 40,519 +7%
of which USA 8,068 6,212 8,837 8,040 8,171 7,369 8,673 10,755 -19% 33,749 32,376 +4%
Latin America (excl. Mexico) 2,480 3,658 3,045 3,778 3,390 3,478 3,582 4,836 -26% 12,497 15,750 -21%
Asia 3,118 1,622 6,441 2,751 6,607 2,689 6,360 4,719 +35% 22,526 11,781 +91%
of which China 1,488 892 4,230 1,909 4,124 1,704 3,794 2,673 +42% 13,636 7,178 +90%
Rest of World 6,858 6,268 8,930 7,066 6,910 9,102 8,161 8,542 -4% 30,859 30,978 -0%
* European Union, Switzerland and Norway.
24
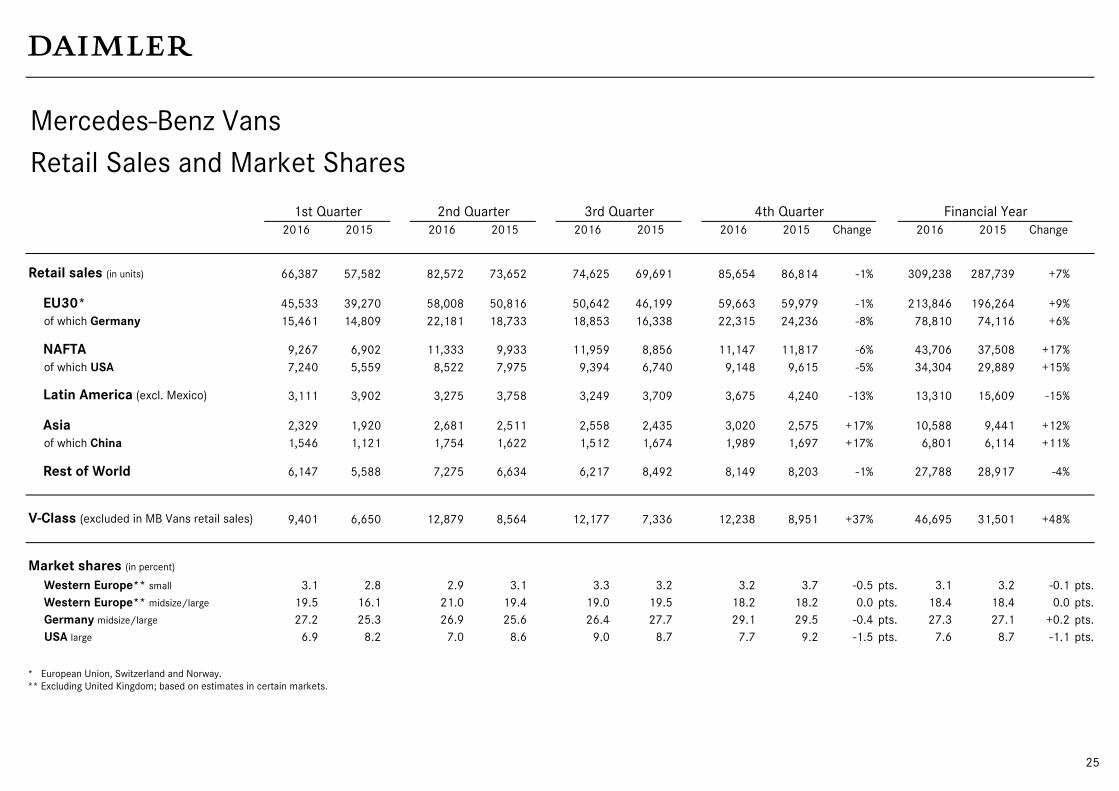
Mercedes-Benz Vans
Retail Sales and Market Shares
1st Quarter 2nd Quarter 3rd Quarter 4th Quarter Financial Year
2016 2015 2016 2015 2016 2015 2016 2015 Change 2016 2015 Change
Retail sales (in units) 66,387 57,582 82,572 73,652 74,625 69,691 85,654 86,814 -1% 309,238 287,739 +7%
EU30* 45,533 39,270 58,008 50,816 50,642 46,199 59,663 59,979 -1% 213,846 196,264 +9%
of which Germany 15,461 14,809 22,181 18,733 18,853 16,338 22,315 24,236 -8% 78,810 74,116 +6%
NAFTA 9,267 6,902 11,333 9,933 11,959 8,856 11,147 11,817 -6% 43,706 37,508 +17%
of which USA 7,240 5,559 8,522 7,975 9,394 6,740 9,148 9,615 -5% 34,304 29,889 +15%
Latin America (excl. Mexico) 3,111 3,902 3,275 3,758 3,249 3,709 3,675 4,240 -13% 13,310 15,609 -15%
Asia 2,329 1,920 2,681 2,511 2,558 2,435 3,020 2,575 +17% 10,588 9,441 +12%
of which China 1,546 1,121 1,754 1,622 1,512 1,674 1,989 1,697 +17% 6,801 6,114 +11%
Rest of World 6,147 5,588 7,275 6,634 6,217 8,492 8,149 8,203 -1% 27,788 28,917 -4%
V-Class (excluded in MB Vans retail sales) 9,401 6,650 12,879 8,564 12,177 7,336 12,238 8,951 +37% 46,695 31,501 +48%
Market shares (in percent)
Western Europe** small 3.1 2.8 2.9 3.1 3.3 3.2 3.2 3.7 -0.5 pts. 3.1 3.2 -0.1 pts.
Western Europe** midsize/large 19.5 16.1 21.0 19.4 19.0 19.5 18.2 18.2 0.0 pts. 18.4 18.4 0.0 pts.
Germany midsize/large 27.2 25.3 26.9 25.6 26.4 27.7 29.1 29.5 -0.4 pts. 27.3 27.1 +0.2 pts.
USA large 6.9 8.2 7.0 8.6 9.0 8.7 7.7 9.2 -1.5 pts. 7.6 8.7 -1.1 pts.
* European Union, Switzerland and Norway.
** Excluding United Kingdom; based on estimates in certain markets.
25
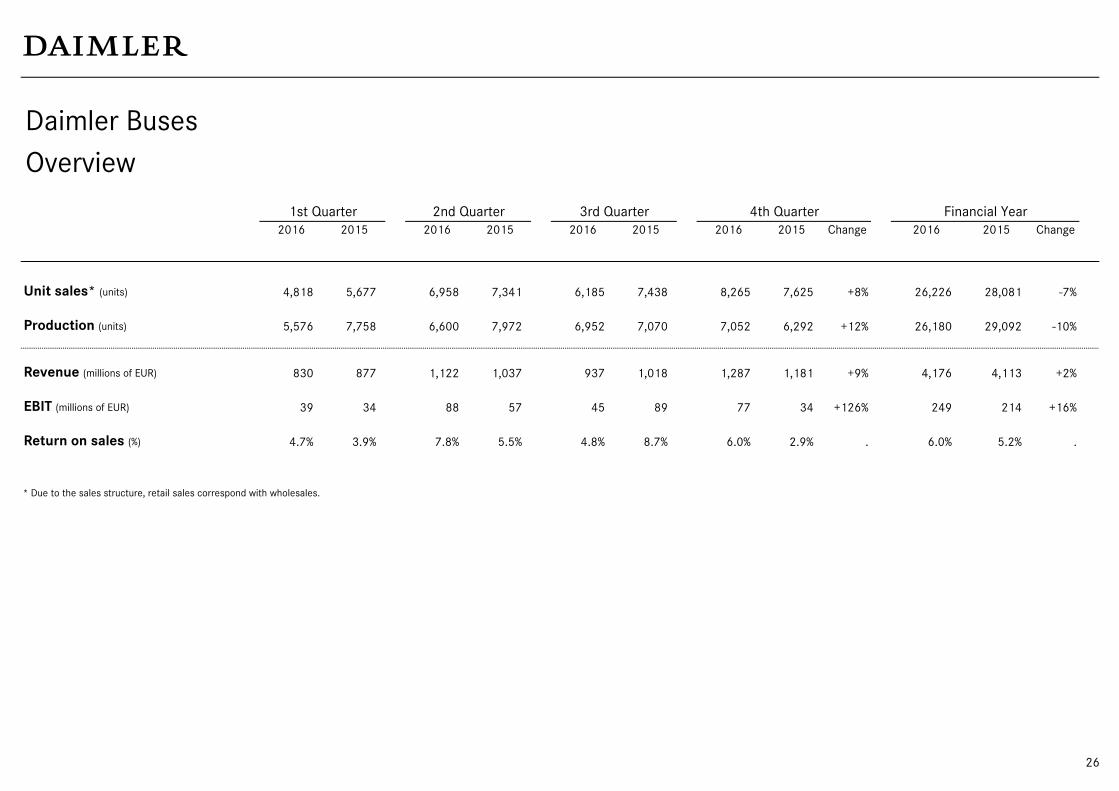
Daimler Buses
Overview
1st Quarter 2nd Quarter 3rd Quarter 4th Quarter Financial Year
2016 2015 2016 2015 2016 2015 2016 2015 Change 2016 2015 Change
Unit sales* (units) 4,818 5,677 6,958 7,341 6,185 7,438 8,265 7,625 +8% 26,226 28,081 -7%
Production (units) 5,576 7,758 6,600 7,972 6,952 7,070 7,052 6,292 +12% 26,180 29,092 -10%
Revenue (millions of EUR) 830 877 1,122 1,037 937 1,018 1,287 1,181 +9% 4,176 4,113 +2%
EBIT (millions of EUR) 39 34 88 57 45 89 77 34 +126% 249 214 +16%
Return on sales (%) 4.7% 3.9% 7.8% 5.5% 4.8% 8.7% 6.0% 2.9% . 6.0% 5.2% .
* Due to the sales structure, retail sales correspond with wholesales.
26
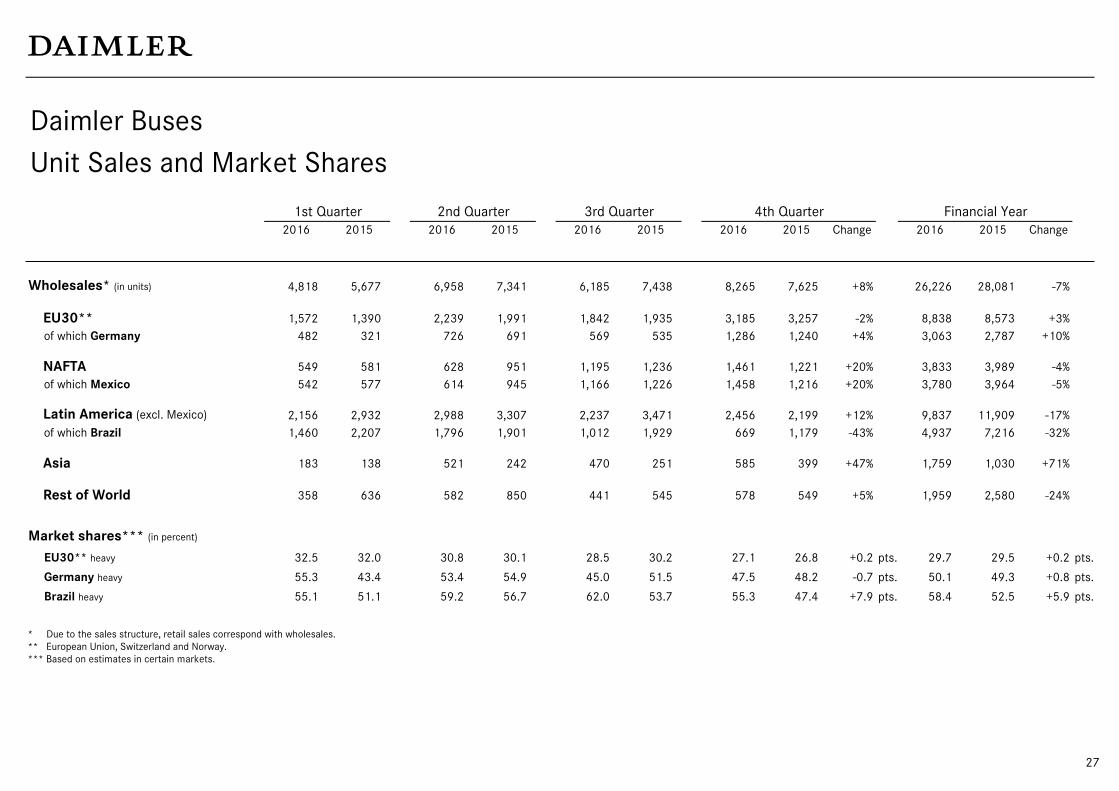
Daimler Buses
Unit Sales and Market Shares
1st Quarter 2nd Quarter 3rd Quarter 4th Quarter Financial Year
2016 2015 2016 2015 2016 2015 2016 2015 Change 2016 2015 Change
Wholesales* (in units) 4,818 5,677 6,958 7,341 6,185 7,438 8,265 7,625 +8% 26,226 28,081 -7%
EU30** 1,572 1,390 2,239 1,991 1,842 1,935 3,185 3,257 -2% 8,838 8,573 +3%
of which Germany 482 321 726 691 569 535 1,286 1,240 +4% 3,063 2,787 +10%
NAFTA 549 581 628 951 1,195 1,236 1,461 1,221 +20% 3,833 3,989 -4%
of which Mexico 542 577 614 945 1,166 1,226 1,458 1,216 +20% 3,780 3,964 -5%
Latin America (excl. Mexico) 2,156 2,932 2,988 3,307 2,237 3,471 2,456 2,199 +12% 9,837 11,909 -17%
of which Brazil 1,460 2,207 1,796 1,901 1,012 1,929 669 1,179 -43% 4,937 7,216 -32%
Asia 183 138 521 242 470 251 585 399 +47% 1,759 1,030 +71%
Rest of World 358 636 582 850 441 545 578 549 +5% 1,959 2,580 -24%
Market shares*** (in percent)
EU30** heavy 32.5 32.0 30.8 30.1 28.5 30.2 27.1 26.8 +0.2 pts. 29.7 29.5 +0.2 pts.
Germany heavy 55.3 43.4 53.4 54.9 45.0 51.5 47.5 48.2 -0.7 pts. 50.1 49.3 +0.8 pts.
Brazil heavy 55.1 51.1 59.2 56.7 62.0 53.7 55.3 47.4 +7.9 pts. 58.4 52.5 +5.9 pts.
* Due to the sales structure, retail sales correspond with wholesales.
** European Union, Switzerland and Norway.
*** Based on estimates in certain markets.
27
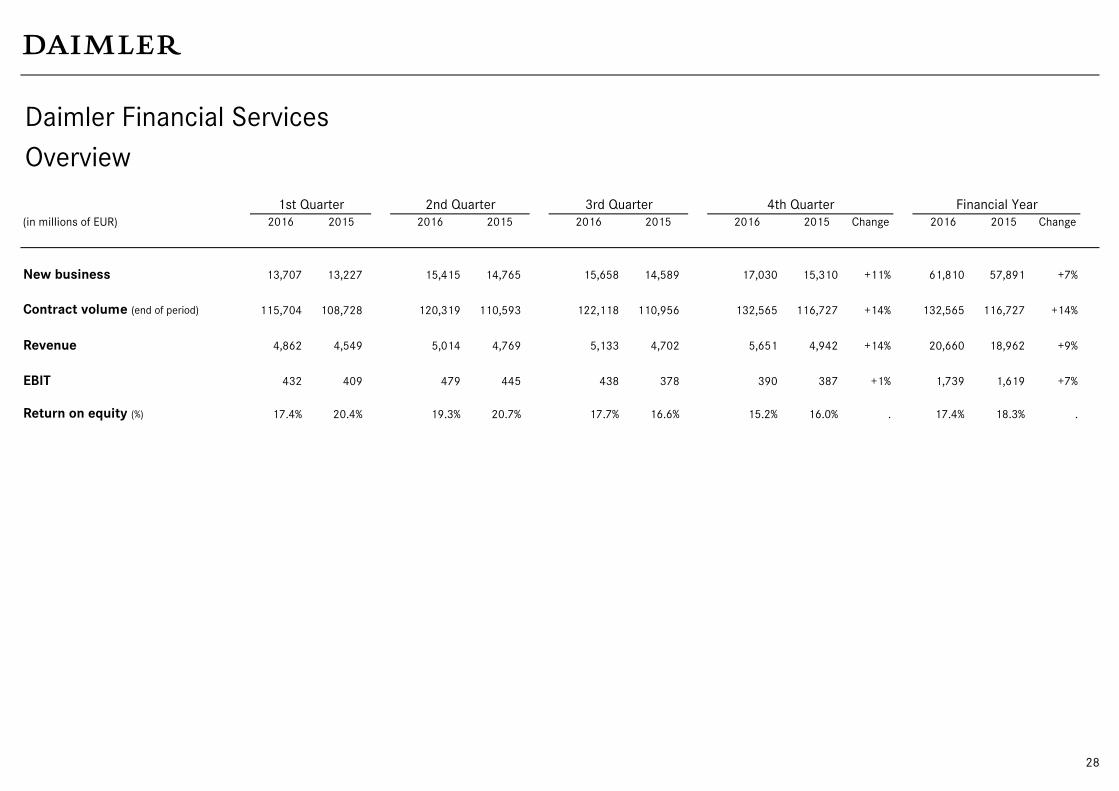
Daimler Financial Services
Overview
1st Quarter 2nd Quarter 3rd Quarter 4th Quarter Financial Year
(in millions of EUR) 2016 2015 2016 2015 2016 2015 2016 2015 Change 2016 2015 Change
New business 13,707 13,227 15,415 14,765 15,658 14,589 17,030 15,310 +11% 61,810 57,891 +7%
Contract volume (end of period) 115,704 108,728 120,319 110,593 122,118 110,956 132,565 116,727 +14% 132,565 116,727 +14%
Revenue 4,862 4,549 5,014 4,769 5,133 4,702 5,651 4,942 +14% 20,660 18,962 +9%
EBIT 432 409 479 445 438 378 390 387 +1% 1,739 1,619 +7%
Return on equity (%) 17.4% 20.4% 19.3% 20.7% 17.7% 16.6% 15.2% 16.0% . 17.4% 18.3% .
28