d-scholarship.pitt.edu global energy demand is projected to increase by 77% from 2006 to 2030 along...
156
CONTROL OF MINERAL SCALING IN POWER PLANT RECIRCULATING COOLING SYSTEMS USING TREATED MUNICIPAL WASTEWATER by Wenshi Liu Bachelor of Science in Environmental Engineering, Wuhan University, 2004 Master of Science in Environmental Engineering, Wuhan University, 2009 Submitted to the Graduate Faculty of Swanson School of Engineering in partial fulfillment of the requirements for the degree of Doctor of Philosophy University of Pittsburgh 2013
Transcript of d-scholarship.pitt.edu global energy demand is projected to increase by 77% from 2006 to 2030 along...

CONTROL OF MINERAL SCALING IN POWER PLANT RECIRCULATING
COOLING SYSTEMS USING TREATED MUNICIPAL WASTEWATER
by
Wenshi Liu
Bachelor of Science in Environmental Engineering, Wuhan University, 2004
Master of Science in Environmental Engineering, Wuhan University, 2009
Submitted to the Graduate Faculty of
Swanson School of Engineering in partial fulfillment
of the requirements for the degree of
Doctor of Philosophy
University of Pittsburgh
2013
UNIVERSITY OF PITTSBURGH
SWANSON SCHOOL OF ENGINEERING
This dissertation was presented
by
Wenshi Liu
It was defended on
May 2, 2013
and approved by
Radisav D. Vidic, Ph.D., Professor, Department of Civil and Environmental Engineering
David A. Dzombak, Ph.D., Professor, Department of Civil and Environmental Engineering at
Carnegie Mellon University
Leonard W. Casson, Ph.D., Associate Professor, Department of Civil and Environmental
Engineering
Kyle Bibby, Ph.D., Assistant Professor, Department of Civil and Environmental
Engineering
Vikas Khanna, Ph.D., Assistant Professor, Department of Civil and Environmental
Engineering
Dissertation Director: Radisav D. Vidic, Ph.D., Professor, Department of Civil and
Environmental Engineering
ii

Copyright © by Wenshi Liu
2013
iii
The global energy demand is projected to increase by 77% from 2006 to 2030 along with a
projected 38% increase in freshwater withdrawal for cooling in power industry. Finding
alternative sources of water for cooling has become essential for future energy generation in
thermoelectric power plants because of water scarcity in many parts of the US. Treated
municipal wastewater is considered as one of the most promising alternative water sources
because of its geographic distribution and abundant quantity. However, its impaired water
quality makes the cooling tower management more challenging. Therefore, effective approaches
are required to prevent scaling, corrosion, and biological growth to promote the reuse of treated
municipal wastewater as cooling water in power plants.
This study focuses on understanding mineral scale formation and developing effective
mitigation methods when using tertiary treated municipal wastewater as power plant cooling
makeup. Two types of tertiary-treated municipal wastewater that were evaluated included
secondary-treated water with pH adjustment (MWW_pH) and water from secondary-treatment
followed by nitrification and sand filtration (MWW_NF). Laboratory-scale studies and pilot-
scale cooling systems were used to evaluate mineral scaling formation and inhibition on non-
heated surfaces (e.g., pipelines, tower packing, etc.) under conditions relevant to full-scale
cooling systems. Results showed that pH adjustment to 7.8 plus the addition of 5 ppm
polymaleic acid (PMA) could reduce the scaling significantly with MWW_pH. MWW_NF
CONTROL OF MINERAL SCALING IN POWER PLANT RECIRCULATING
COOLING SYSTEM USING TREATED MUNICIPAL WASTEWATER
Wenshi Liu, Ph.D
University of Pittsburgh, 2013
iv

exhibited little scaling potential, which is related in part to the lower pH and alkalinity in this
water. Amorphous calcium phosphate (ACP) was the primary form of mineral scale on non-
heated surface with the above two-types of tertiary-treated municipal wastewater.
A bench-scale experimental system was designed to simulate the condenser surface to
study the impacts of mineral scaling on the heated surfaces and the effectiveness of proposed
scaling control strategies under these conditions. Heated surface favored the formation of
hydroxyapatite (HAP), the most thermodynamically stable calcium phosphate, was the main
reason for the crystalline fouling with MWW_pH at pH 7.8. 10 ppm PMA addition could
suppress the crystalline fouling of MWW_pH at 7.8 to a low level by inhibiting the
transformation of amorphous calcium phosphate to hydroxyapatite during the test period.
Significant crystalline fouling was identified with MWW_NF at pH 7.2 while pH adjustment to
7.8 resulted in negligible fouling.
The impact of flow velocity on particle deposition was analyzed in a quantitative model,
showing positive deposition potential for bulk precipitates at flow velocity of 0.5 and 0.4 m/s
while little particulate fouling was theoretically predicted at 0.6 m/s in the test situation. Bench-
scale studies were consistent the model prediction, confirming that the model could be used to
identify optimal hydrodynamic conditions to control depositions of bulk precipitates.
The mechanism of calcium phosphate scale control by common antiscalants included
PMA and 1-hydroxyethane 1,1-diphosphonic acid (HEDP) was elucidated to provide scientific
background for the effective scaling mitigation when treated municipal wastewater is used as
make-up in thermoelectric power plant cooling systems. Both PMA and HEDP inhibited the
transformation of ACP to HAP by preventing the aggregation of ACP particles. However, PMA
v

dispersed the ACP particles mainly through electrostatic repulsive force while hydration force
was hypothesized to be the reason for the function of HEDP in dispersion.
The key findings of this study indicate that it is possible to control mineral scaling
through direct chemical addition at proper operating conditions when treated municipal
wastewater is used as makeup water in the recirculating cooling system. This study not only
evaluated scaling control methods in cooling systems, but also revealed the fundamentals of
scaling formation and inhibition.
vi

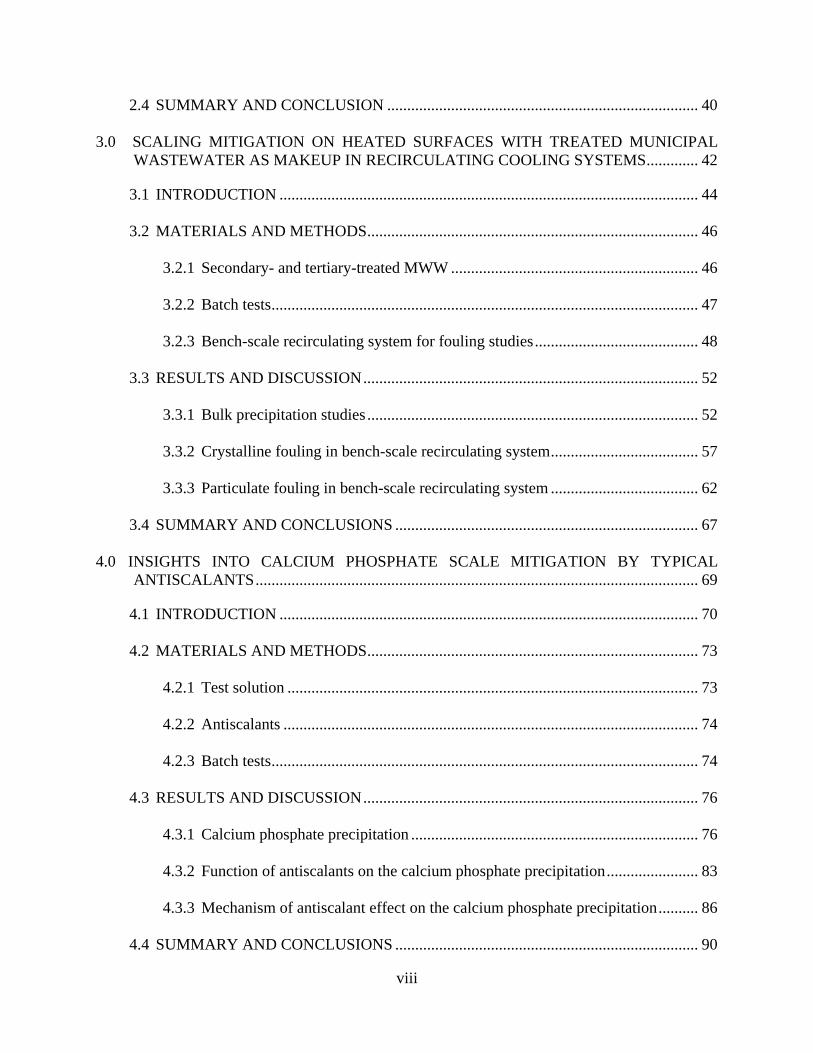
TABLE OF CONTENTS
TABLE OF CONTENTS ............................................................................................................. VII
LIST OF TABLES ........................................................................................................................ XI
LIST OF FIGURES ..................................................................................................................... XII
ACKNOWLEDGEMENTS ...................................................................................................... XVII
1.0 INTRODUCTION ................................................................................................................. 1
1.1 RESEARCH OBJECTIVES ............................................................................................ 3
1.2 SCOPE OF THE DISSERTATION ................................................................................ 4
2.0 SCALING MITIGATION ON NON-HEATED SURFACES WITH TREATED MUNICIPAL WASTEWATER AS MAKEUP IN RECIRCULATING COOLING SYSTEMS ............................................................................................................................. 7
2.1 INTRODUCTION ........................................................................................................... 9
2.2 MATERIALS AND METHODS ................................................................................... 11
2.2.1 Municipal wastewater ......................................................................................... 11
2.2.2 Laboratory experimental systems ....................................................................... 13
2.2.3 Pilot-scale cooling tower tests ............................................................................ 15
2.3 RESULTS AND DISCUSSION .................................................................................... 17
2.3.1 Precipitation reactions in solution: batch tests ................................................... 17
2.3.2 Bench-scale recirculating system tests ............................................................... 25
2.3.3 Pilot-scale studies with tertiary-treated MWW .................................................. 29
vii
2.4 SUMMARY AND CONCLUSION .............................................................................. 40
3.0 SCALING MITIGATION ON HEATED SURFACES WITH TREATED MUNICIPAL WASTEWATER AS MAKEUP IN RECIRCULATING COOLING SYSTEMS ............. 42
3.1 INTRODUCTION ......................................................................................................... 44
3.2 MATERIALS AND METHODS ................................................................................... 46
3.2.1 Secondary- and tertiary-treated MWW .............................................................. 46
3.2.2 Batch tests ........................................................................................................... 47
3.2.3 Bench-scale recirculating system for fouling studies ......................................... 48
3.3 RESULTS AND DISCUSSION .................................................................................... 52
3.3.1 Bulk precipitation studies ................................................................................... 52
3.3.2 Crystalline fouling in bench-scale recirculating system ..................................... 57
3.3.3 Particulate fouling in bench-scale recirculating system ..................................... 62
3.4 SUMMARY AND CONCLUSIONS ............................................................................ 67
4.0 INSIGHTS INTO CALCIUM PHOSPHATE SCALE MITIGATION BY TYPICAL ANTISCALANTS ............................................................................................................... 69
4.1 INTRODUCTION ......................................................................................................... 70
4.2 MATERIALS AND METHODS ................................................................................... 73
4.2.1 Test solution ....................................................................................................... 73
4.2.2 Antiscalants ........................................................................................................ 74
4.2.3 Batch tests ........................................................................................................... 74
4.3 RESULTS AND DISCUSSION .................................................................................... 76
4.3.1 Calcium phosphate precipitation ........................................................................ 76
4.3.2 Function of antiscalants on the calcium phosphate precipitation ....................... 83
4.3.3 Mechanism of antiscalant effect on the calcium phosphate precipitation .......... 86
4.4 SUMMARY AND CONCLUSIONS ............................................................................ 90
viii

5.0 SUMMARY, CONCLUSIONS AND FUTURE WORK ...................................................... 92
5.1 SUMMARY AND CONCLUSIONS ............................................................................ 92
5.1.1 Mineral scaling mitigation on non-heated surfaces with tertiary-treated municipal wastewater as cooling system makeup ............................................................... 93
5.1.2 Crystalline fouling mitigation on the heated surfaces with tertiary-treated municipal wastewater as cooling system makeup .............................................. 93
5.1.3 Impact of hydrodynamic conditions on the particulate fouling.......................... 94
5.1.4 Mechanism of common antiscalants on the calcium phosphate precipitation .... 94
5.1.5 Overall findings .................................................................................................. 95
5.2 KEY CONTRIBUTIONS .............................................................................................. 96
5.3 FUTURE DIRECTIONS ............................................................................................... 97
5.3.1 Development of a predictive model for heat exchanger fouling when treated municipal wastewater is used as cooling makeup .............................................. 97
5.3.2 Elucidation of mineral-antiscalants interactions for improved scaling and corrosion inhibition ............................................................................................. 99
5.3.3 Engineering of substrate surface materials for mineral scaling mitigation ..... 100
APPENDIX A TWO PATHWAYS FOR MINERAL SCALE FORMATION: SURFACE CRYSTALLIZATION AND PARTICLE DEPOSITION ................................................ 102
A.1 INTRODUCTION AND APPROACH ....................................................................... 102
A.2 RESULTS AND DISCUSSION .................................................................................. 103
A.2.1 Forces analysis on the individual particle deposited on the pipe surface ......... 103
A.2.2 Critical shear flow velocity to detach the individual scale particle deposited on the pipe surface ................................................................................................. 110
A.3 SUMMARY AND CONCLUSIONS .......................................................................... 114
APPENDIX B REPRODUCIBILITY OF THE FOULING RESISTANCE MEASUREMENT IN THE BENCH-SCALE RECIRCULATING SYSTEM FOR FOULING STUDIES ........ 115
B.1 MATERIALS AND METHODS ................................................................................. 115
ix

B.2 RESULTS AND DISCUSSION .................................................................................. 116
APPENDIX C SCALING MITIGATION FOR MWW_NFG AS MAKEUP FOR COOLING 117
C.1 INTRODUCTION ....................................................................................................... 117
C.2 MATERIALS AND METHODS ................................................................................. 118
C.3 RESULTS AND DISCUSSION .................................................................................. 119
C.4 SUMMARY AND CONCLUSIONS .......................................................................... 127
BIBLIOGRAPHY ....................................................................................................................... 128
x

LIST OF TABLES
Table 1.1 Main contents in each chapter of this study .................................................................... 6
Table 2.1 Key water quality parameters of Franklin Township Municipal Sanitary Authority (Murrysville, PA) secondary treated effluent (Sampled on September 3, 2008) ......... 12
Table 2.2 Chemical composition of synthetic MWW and MWW_NF at 4 cycles of concentration (CoC 4) for batch- and bench-scale experiments ......................................................... 13
Table 2.3 Chemical composition of synthetic MWW and MWW_NF at 4 cycles of concentration (CoC 4) for batch- and bench-scale experiments ......................................................... 17
Table 2.4 Langelier Saturation Index (LSI) of the recirculating water in Towers A, B and C in pilot-scale tests with MWW_ pH ................................................................................. 32
Table 2.5 Langelier Saturation Index of the recirculating water in Towers A, B and C in pilot-scale tests with MWW_NF on days 36, 40, 44, 49, and 54 ......................................... 37
Table 3.1 Chemical composition of synthetic MWW and MWW_NF at 4 cycles of concentration (CoC 4) used in the scaling study on heated surface ................................................... 46
Table 3.2 Experimental parameters and typical conditions in recirculating cooling systems at thermoelectric power plants ......................................................................................... 51
Table 4.1 Chemical compositions of the test solution used in the study for the antiscalants on calcium phosphate precipitation ................................................................................... 73
Table 4.2 Solubility of amorphous calcium phosphate at 25°C, 30°C, 40°C, and 45°C .............. 82
Table A.1 Useful parameters to calculate the forces acting on the individual scale particle deposited on the stainless steel pipe surface .............................................................. 112
Table C.1 Langelier Saturation Index for the recirculating water in Towers A, B, and C during the pilot-scale cooling tower test, summer 2011 ........................................................ 123
xi

LIST OF FIGURES
Figure 2.1 Schematic diagram of bench scale recirculating system ............................................. 15
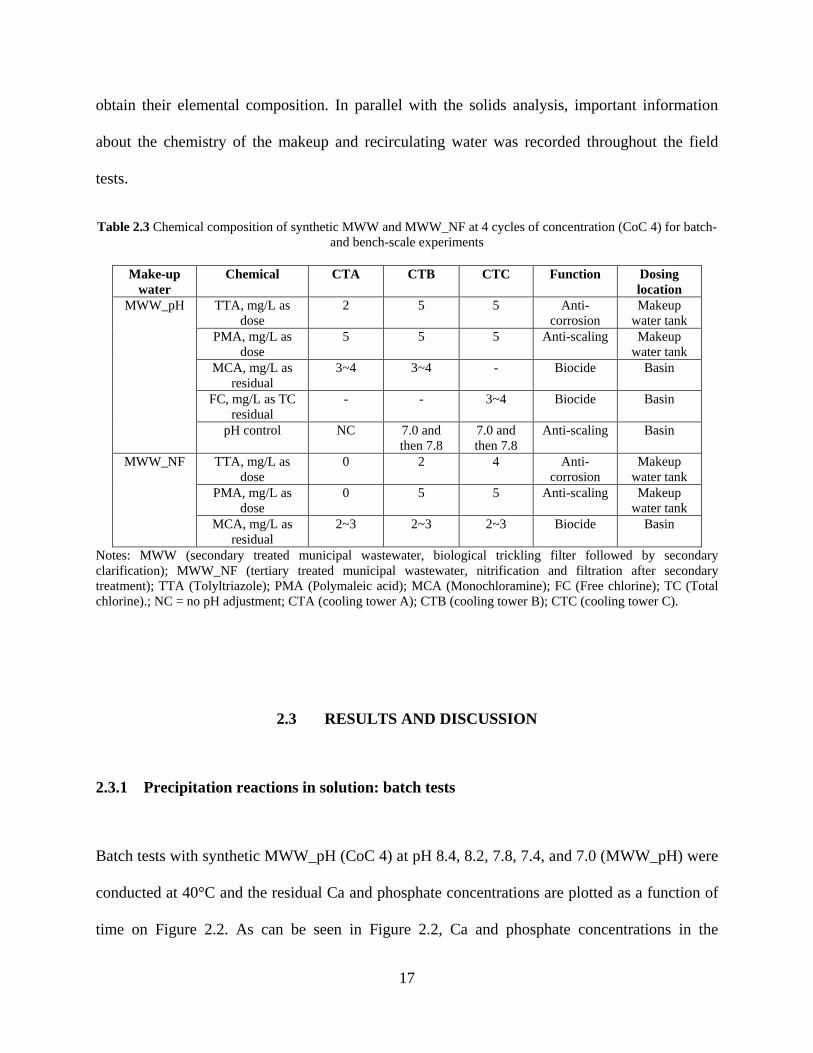
Figure 2.2 Residual Ca and phosphate concentrations in batch tests with synthetic secondary-treated MWW (CoC 4) as a function of time at typical cooling water temperature (40°C) when pH was maintained at 8.4, 8.2, 7.8, 7.4, and 7.0. The data represent mean values based on triplicate measurements with relative standard deviation (%RSD) of Ca and phosphate concentration measurements within ±5.2% and ±3.1%, respectively. ...................................................................................................................................... 18
Figure 2.3 XRD pattern of the precipitates from batch tests with synthetic secondary-treated MWW (CoC 4, 40°C) when pH was maintained at pH 8.4, 8.2, 7.8, and 7.4 ............. 19
Figure 2.4 SEM image and the elemental composition of the precipitates from batch tests with synthetic secondary-treated MWW (CoC 4, 40°C) when pH was maintained at pH 7.4. EDS scan was performed on the area outlined by the square box on the SEM image. 20
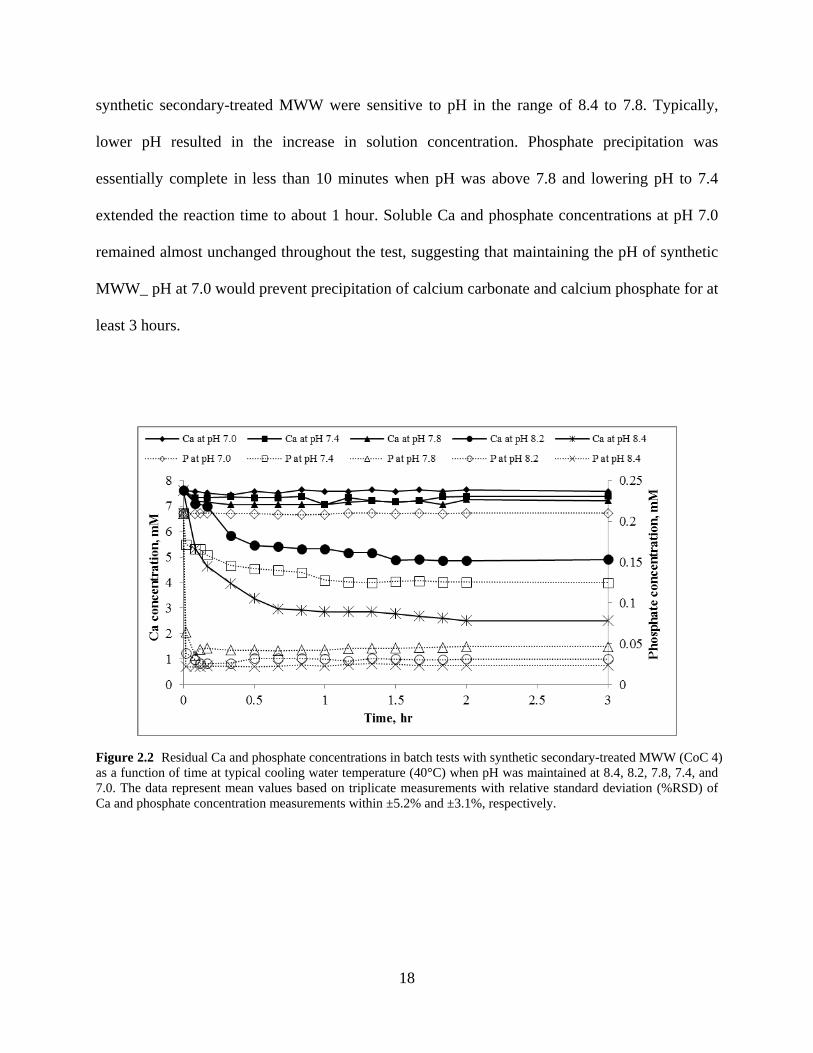
Figure 2.5 SEM images of precipitates from batch tests with synthetic secondary-treated MWW (CoC 4, 40°C) when pH was maintained at different value: (a) pH 8.2; (b) pH 7.8 ... 21
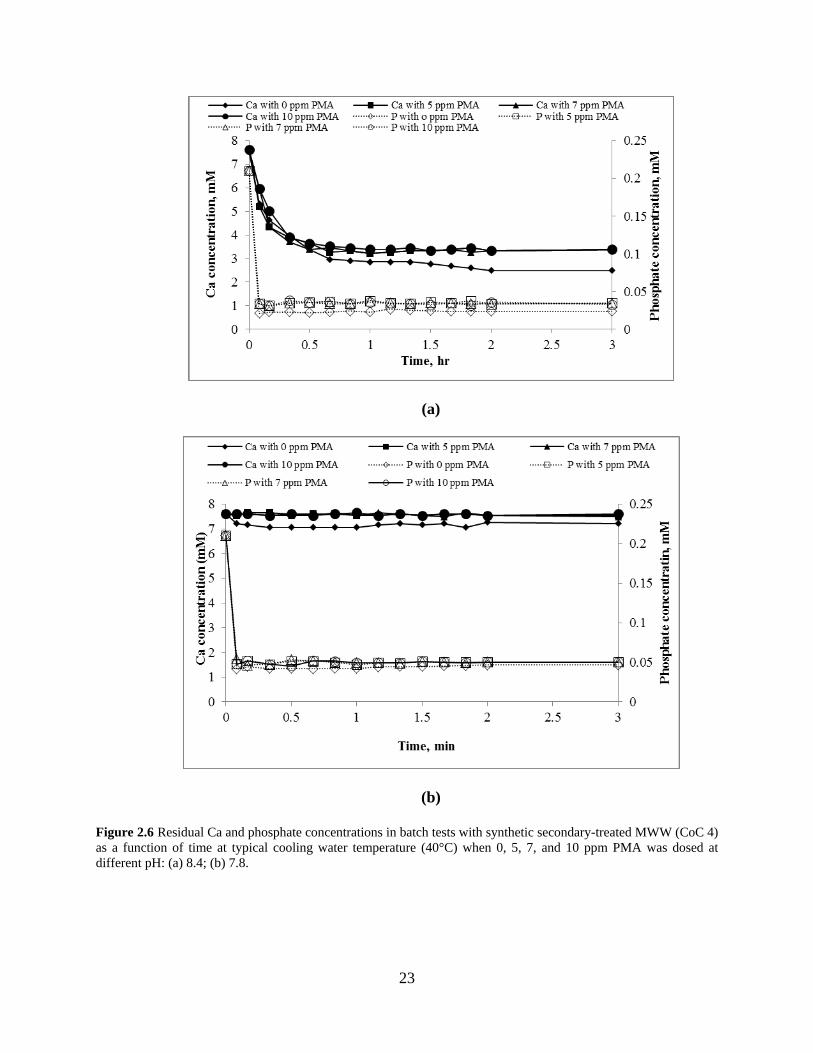
Figure 2.6 Residual Ca and phosphate concentrations in batch tests with synthetic secondary-treated MWW (CoC 4) as a function of time at typical cooling water temperature (40°C) when 0, 5, 7, and 10 ppm PMA was dosed at different pH: (a) 8.4; (b) 7.8. ... 23
Figure 2.7 SEM images of precipitates from batch tests with synthetic secondary-treated MWW (CoC 4, 40°C) when pH was maintained at 7.8 with the addition of 5 ppm PMA ...... 24
Figure 2.8 Residual Ca and phosphate concentrations in batch tests with synthetic MWW_NF (CoC 4) as a function of time at typical cooling water temperature (40°C). The data represent mean values based on triplicate measurements with relative standard deviation (%R RSD) of Ca and phosphate concentration measurements within ±4.3% and ±2.6%, respectively. .............................................................................................. 25
Figure 2.9 Scaling behavior of synthetic MWW under different scaling control strategies in bench-scale recirculating system tests: (a) MWW_pH ; (b) MWW_NF. The bulk water temperature and flow velocity was maintained at 40°C and 0.6 m/s respectively. Error bars indicate the data range of measurements from duplicate tests. The bulk water
xii

temperature and flow velocity were maintained at 40°C and 0.6 m/s respectively. Error bars indicate the data range of measurements from duplicate tests. ............................ 27
Figure 2.10 SEM images of the mineral deposits collected on the stainless disc specimens from bench-scale recirculating system tests under different scaling mitigation strategies: (a) pH control at 8.4; (b) pH control at 8.4 plus 5 ppm PMA; (c) pH control at 7.8; (d) pH control at 7.8 plus 5 ppm PMA .................................................................................... 28
Figure 2.11 “Green deposits” retained on 0.45 µm filter paper after filtering the recirculating water in Tower B on day 9 in pilot scale tests with MWW_pH at pH 7.0 .................. 30
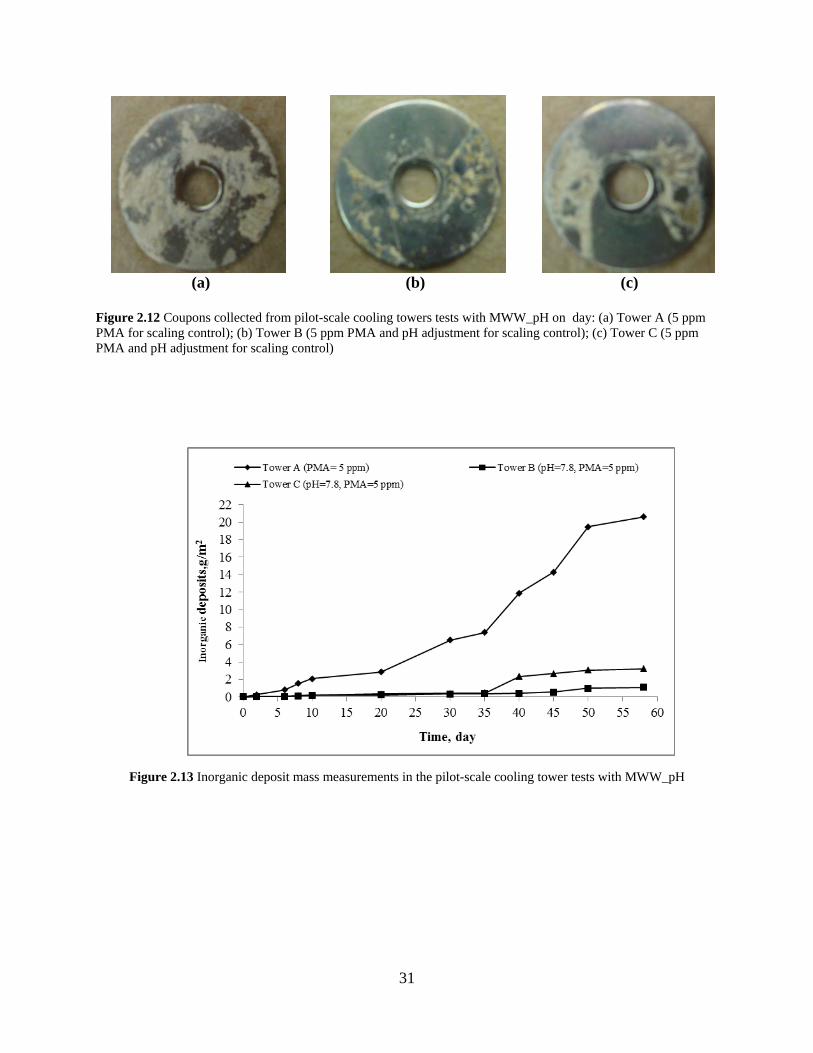
Figure 2.12 Coupons collected from pilot-scale cooling towers tests with MWW_pH on day: (a) Tower A (5 ppm PMA for scaling control); (b) Tower B (5 ppm PMA and pH adjustment for scaling control); (c) Tower C (5 ppm PMA and pH adjustment for scaling control) ............................................................................................................. 31
Figure 2.13 Inorganic deposit mass measurements in the pilot-scale cooling tower tests with MWW_pH .................................................................................................................... 31
Figure 2.14 Orthophosphate concentration in the make-up water and recirculating water in the pilot-scale cooling tower tests with MWW_pH ........................................................... 33
Figure 2.15 SEM images and the elemental composition of the solid deposits collected on stainless steel discs immersed in pilot-scale cooling towers operated at CoC 4-6: Day-50 sample from Tower B using MWW_ pH. EDS scan was performed on the area outlined by the square box on the SEM image. ........................................................... 34
Figure 2.16 Water flow rates measured in the pilot-scale cooling tower tests with MWW_ pH as recirculating water. Target flow rate is 3 GPM for the system. ................................... 35
Figure 2.17 Coupons collected on day 10 in the pilot-scale cooling tower tests with MWW_NF as make-up water: (a) Tower A (no PMA); (b) Tower B (5 ppm PMA); (c) Tower C (5 ppm PMA). ................................................................................................................... 36
Figure 2.18 Inorganic deposit mass measurements in the pilot-scale cooling tower tests with MWW_NF ................................................................................................................... 37
Figure 2.19 Orthophosphate concentration in the make-up water and recirculating water in the pilot-scale cooling tower tests with MWW_NF .......................................................... 38
Figure 2.20 SEM images and the elemental composition of the solid deposits collected on stainless steel discs immersed in pilot-scale cooling towers operated at CoC 4-6: Day-50 sample from Tower B using MWW_ NF. EDS scan was performed on the area outlined by the square box on the SEM image. ........................................................... 39
Figure 2.21 Water flow rates measured in the pilot-scale cooling tower tests with MWW_ NF as recirculating water. Target flow rate is 3 GPM for the system .................................... 40
xiii
Figure 3.1 Schematic diagram of the bench-scale recirculating system for fouling studies ......... 50
Figure 3.2 Residual phosphate concentrations in batch tests with synthetic MWW (CoC 4) at pH 7.8 and MWW_NF (CoC 4) at pH 7.2 and 7.8 as a function of time with temperature at typical cooling water temperature (40°C) and condenser surface temperature (49°C) ....................................................................................................... 53
Figure 3.3 XRD pattern of the precipitates from batch tests with synthetic MWW_pH (CoC 4, 49°C) when pH was maintained at pH 7.8: (a) raw sample; (b) raw sample after heating at 500°C for 1 hrs; (c)sample collected for system with 10 ppm PMA after heating at 500°C for 1hr ............................................................................................... 54
Figure 3.4 SEM image and elemental composition of the precipitate formed in batch test with synthetic MWW (CoC 4, 49°C) when pH was maintained at pH 7.8. EDS scan was performed on the area outlined by the square box on the SEM image. ....................... 54
Figure 3.5 XRD pattern of the precipitates collected at 60, 150, and 180 min from batch tests with synthetic MWW_NF (CoC 4, 49°C) when pH was maintained at pH 7.2 .......... 56
Figure 3.6 Residual phosphate concentrations in batch tests with MWW_pH (CoC 4) as a function of time at typical cooling water temperature (40°C) and condenser surface temperature (49°C) when 0, 5, and 10 ppm PMA were added at pH 7.8 .................... 57
Figure 3.7 Development of fouling resistance in MWW_pH (CoC 4, 49°C) at pH 7.8 in the presence of 0, 5, and 10 ppm PMA .............................................................................. 58
Figure 3.8 XRD pattern of the precipitates in the fouling tests with MWW_pH (CoC 4, 49°C) at pH 7.8: (a) mineral deposits on the heater with 0 ppm PMA addition; (b) bulk precipitates with 0 ppm PMA addition; (c) mineral deposits on the heater with 10 ppm PMA addition ............................................................................................................... 59
Figure 3.9 Fouling resistance for MWW_NF (CoC 4, 49°C) when bulk pH was controlled at 7.8 and 7.2 .......................................................................................................................... 60
Figure 3.10 Phosphate concentration in the fouling tests with MWW_NF (CoC 4, 49°C) when pH was controlled at 7.8 and 7.2 .................................................................................. 61
Figure 3.11 XRD pattern of bulk precipitates and mineral deposits on the heated surface in the fouling tests with MWW_NF (CoC 4, 49°C): (a) precipitates formed in the bulk solution after 1 hr at pH 7.8; (b) mineral deposits on the heater during the test at pH 7.2; (c) bulk precipitates formed in the bulk solution after 12 hr at pH 7.2 ................. 61
Figure 3.12 Particle size distribution of bulk precipitates formed in MWW_NF (CoC 4, 40°C) at pH 7.8 ........................................................................................................................... 64
Figure 3.13 Total vertical force on bulk precipitates at 0.6, 0.5, and 0.4 m/s flow velocities: (a) particle size between 1~10 µm; (b) particle size between 10~50 µm .......................... 65
xiv
Figure 3.14 Particulate fouling with suspended solids created during the fouling test with synthetic MWW_NF (CoC 4) at 42±3°C as a function of flow velocity. Error bars indicate the data range of measurements from duplicate tests. .................................... 66
Figure 4.1 Residual concentrations in batch tests with test solution at pH 7.2 as a function of time with temperature at 25°C, 30°C , 40°C , 45°C , and 50°C: (a) Phosphate; (b) Ca. The data represent mean values based on triplicate measurements with relative stand standard deviation (%RSD) of Ca and phosphate concentration measurements within ±5.3% and ±2.1%, respectively .................................................................................... 77
Figure 4.2 XRD pattern of the precipitates collected at 3, 8, and 30 min from batch tests at 40°C when pH was maintained at pH 7.2 ............................................................................. 78
Figure 4.3 XRD pattern of the precipitates from batch test at 25°C when pH was maintained at pH 7.2: (a) raw sample; (b) raw sample after heating at 500°C for 3 hr ...................... 79
Figure 4.4 Temperature dependence of amorphous calcium phosphate solubility product (the point at 50°C was obtained from the tests with antiscalants in Section 4.3.2) ............ 83
Figure 4.5 Residual phosphate concentrations in batch tests with antiscalants as a function of time at different conditions: (a) pH 7.2 and 40ºC; (b) pH 7.8 and 40 ºC; (c) pH 7.8 and 50ºC .............................................................................................................................. 85
Figure 4.6 XRD pattern of the precipitates from batch tests with antiscalants: (a) 2 ppm PMA at pH 7.2 and 40 ºC; (b) 5 ppm PMA at pH 7.8 and 40 ºC; (c) 5 ppm PMA at pH 7.8 and 50 ºC; (d) 2 ppm HEDP at pH 7.8 and 50 ºC ............................................................... 85
Figure 4.7 Dynamic changes of mean size of precipitates at pH 7.2 and 40°C with no antiscalant, 2 ppm PMA, 5 ppm PMA, and 2 ppm HEDP .............................................................. 88
Figure 4.8 Zeta potential of the amorphous calcium phosphate precipitates formed in the test solution at pH 7.2 and 40 ºC in the presence of 0, 2, and 5 ppm PMA and 2 ppm HEDP in the induction time before the transformation of amorphous calcium phosphate (ACP) to hydroxyapatite (HAP) ................................................................. 90
Figure A.1 Possible forces acting on the particles on the pipe surface ....................................... 103
Figure A.2 Particle adhesion/removal model (Ahmadi et al., 2005) .......................................... 108
Figure A.3 critical shear flow velocity to detach the individual scale particle with seizes between 1~50 µm ..................................................................................................................... 113
Figure A.4 Flow velocity at the center of the particle deposited on the pipe surface with sizes between 1~50 µm ....................................................................................................... 113
Figure B.1 Development of fouling resistance in MWW (CoC 4) without pH control in two independent test runs .................................................................................................. 116
xv

Figure C.1 Inorganic deposits measured in the pilot-scale cooling tower tests with MWW_NFG .................................................................................................................................... 120
Figure C.2 SEM image and elemental composition of the solid deposits collected on stainless steel discs immersed in pilot-scale cooling towers operated at CoC 4-6: Day-15 sample from Tower A using MWW_ NF. EDS scan was performed on the area outlined by the square box on the SEM image. ......................................................... 120
Figure C.3 SEM image and elemental composition of the solid deposits collected on stainless steel discs immersed in pilot-scale cooling towers operated at CoC 4-6: Day-15 sample from Tower B using MWW_ NFG. EDS scan was performed on the area outlined by the square box on the SEM image.. ........................................................ 121
Figure C.4 SEM image and elemental composition of the solid deposits collected on stainless steel discs immersed in pilot-scale cooling towers operated at CoC 4-6: Day-15 sample from Tower C using MWW_ NFG. EDS scan was performed on the area outlined by the square box on the SEM image. ......................................................... 121
Figure C.5 Phosphate concentrations in pilot-scale cooling tower tests using MWW_NF as make-up water, summer 2010 .................................................................................... 122
Figure C.6 Phosphate concentrations in pilot-scale cooling tower tests using MWW_NF and MWW_NFG as make-up water, summer 2011 ......................................................... 123
Figure C.7 Total alkalinity profile in pilot-scale cooling tower tests using MWW_NF and MWW_NFG as make-up water, summer 2011 ......................................................... 125
Figure C.8 Total alkalinity profile in pilot-scale cooling tower tests using MWW_NF as make-up water, summer 2010 ................................................................................................... 125
Figure C.9 pH in pilot-scale cooling tower tests using MWW_NF and MWW_NFG as make-up water during the pilot-scale cooling tower test, summer 2011 .................................. 126
xvi
ACKNOWLEDGEMENTS
I wish to express my cordial gratitude to my advisor and mentor, Professor Radisav D. Vidic, for
offering me the great opportunity to work on this project. My doctoral studies under his direction
have been an unforgettable experience full of challenge, inspiration, and reward. The knowledge
and methodology I have learned from Professor Vidic will be invaluable assets to support my
continued pursuits of a professional career in environmental engineering and science. My thanks
are extended for his great encouragement and advice as a great mentor in my personal life. He
was always standing by me, whether in progress or in trouble. It has been a lucky and honorable
experience working with him.
I would also like to thank Professor David A. Dzombak for our pertinent discussions
about my research. His valuable advice and suggestions helped me to get technical and practical
insights into the scope of my research. I also wish to express great thanks to my committee
members, Professors Leonard W. Casson, Ronald D. Neufeld, Kyle Bibby, and Vikas Khanna,
who shared their precious knowledge and opinions regarding the academic research and personal
professional development.
I especially appreciate the diligent assistance and sincere cooperation of members of this
research project and Dr. Vidic’s research group: Heng Li, Shih-Hsiang Chien, Ming-Kai Hsieh,
Mahbuboor Choudhury, Ranjani Theregowda, Can He, Tieyuan Zhang, and Dr. Jason D.
xvii

Monnel. I won’t forget the delightful time of working with these intelligent and hard-working
fellows.
I would also like to thank the United States Department of Energy, National Energy
Technology Laboratory for funding this innovative research project (Grant No. DE-FC26-
06NT42722 and No. DE-NT0006550).
I want to give special thanks to my friends Hui Jin, Lei Gao, Chen Zhou, Kaining Zhou,
Wenge Liu, Zhiliang Chen, Xuan Zhu, Shuai Zhu, Lin Wang, Jianqian Yu, Peng Liu, Bo Zheng,
Ye Zhou, Dezhi Wang, Xiaogang Wu, Shuai Zhu, Xunchi Pu, Xiao Qin, Huiqi Deng, Zhong Lin,
Bo Ding, and Jiyong Huang, who stand beside me silently and assist me through countless
discouragements.
Finally, I greatly appreciate my love Wansu Xu. Her love and understanding keep
inspiring me to move forward toward my goal. Without her selfless support through more than
2000 days, I could not have accomplished my study. I am also grateful to my family members,
particularly my mother Chuanxiang You and my father Peichuan Liu. I sincerely thank for every
single encouragement and support from my love and family. Without them, I could not have
reached this level of my life.
To Them I dedicate
My Love, Wansu Xu
My Parents, Peichuan Liu and Chuanxiang You
Chinese Dream in my perspective: prosperity, civilization, and dignity
xviii
1.0 INTRODUCTION
Water availability represents a growing concern for meeting human needs in the future. It is
estimated that more than 60% of the world’s population will lack access to an adequate supply
by 2025, largely in Asia, Africa, and Latin America (Feeley et al., 2008). The U.S. is also not
immune from water supply problems. As water use is increasing every year, at least 36 states are
anticipating local, regional, or statewide water shortages by 2013, even under non-drought
conditions (EPA, 2008). In response to the water scarcity issue, wastewater reuse is recognized
as an environmentally sound approach for sustainable water management.
Among the major freshwater users in the US, thermoelectric power generation has
recently become the top user (201 Bgal/day or 49% of total water withdrawals). Each kilowatt-
hour (kWh) of the thermoelectric generation requires the use of approximately 25 gallons of
water, which is primarily for cooling purposes (Feeley et al., 2008). As population growth and
economic development continue to increase the demand for electric power, it is necessary to
ensure a reliable and abundant water source for thermoelectric power generation. However,
freshwater shortages and the competing demand from other water uses will increase pressure on
power plants to reduce water consumption and adopt wastewater reuse. Several cases in arid
areas, such as Arizona and Texas, have shown that lack of available cooling water sources can
result in suspension in operation of existing power plants and delay construction of new power
plants (Feeley and Ramezan, 2003; Dishneau, 2007).
1
Power plant cooling demands large quantities of relatively low quality water when
compared to other uses of water (e.g., drinking and food production). Therefore, alternative
sources to replace freshwater for cooling system operation are likely to be in great demand in the
near future. Among all the alternatives, treated municipal wastewater (MWW) is a promising
candidate for power plant cooling due to its widespread availability and consistent quality (Li et
al., 2011a; EPRI, 2008). Use of treated MWW as make-up water for cooling in power plants has
been in full-scale operation for several decades (Osborn, 1970; Humphris, 1977; Rebhun and
Engel, 1988; Wijesinghe et al., 1996). However, these power plants typically use treated MWW
only as a fraction of the total makeup water needed or only after significant additional treatment
before addition to the recirculating cooling systems (Wijesinghe et al., 1996; Li et al., 2011a).
Few studies have focused on the feasibility of using treated MWW as the dominant makeup
water with or without additional prior treatment.
The main challenges when using MWW as cooling system makeup are scaling, corrosion,
and biofouling (biological growth) due to impaired water quality (Wijesinghe et al., 1996; Selby
et al., 1996; Puckorius, 2003; Vidic, 2009). The term “scaling” is generally used to describe the
collection and growth of unwanted inorganic salts which increases both pressure drop and
resistance to heat transfer in the cooling systems (Neufeld et al., 1985). The scaling problem
would be exacerbated under typical recirculating cooling tower operations (i.e., elevated
temperature and evaporative loss of water that leads to concentration of minerals). Because of
the negative environmental impacts, traditional once-through cooling water systems are
discouraged and recirculating cooling water systems are the only option for new or repermitted
thermoelectric power plants (Reynolds, 1980).
2
Mineral scaling could be prevented in a number of ways. For mineral deposits that are
pH-dependent, like calcium carbonate, acid addition can reduce the pH and alkalinity in the
recirculating systems and thus lower the formation potential of some mineral scales. However,
increased corrosion rates would occur at lower pH (Troup and Richardson, 1978). Physical water
treatment (PWT) methods, including magnetic fields, electric fields, alteration of surface charges
of water, and mechanical disturbance for scaling control have been reported in bench-and pilot-
scale studies (Cho et al., 2004). However, the effect of the PWT on the mineral scaling is still
questionable in real practice (Troup and Richardson, 1978). Up to now, addition of chemicals
that serve as antiscalants is still the most effective approach for mitigating mineral scaling (Al
Nasser et al., 2011).
Although there is abundant experience with scaling inhibition in freshwater, scaling
control for treated MWW used as makeup for cooling systems is rather challenging due to its
complicated water chemistry. Most antiscalants that have been proven effective in freshwater
may not be as effective in treated MWW (Li et al., 2011b). In order to advance the reuse of the
treated MWW as cooling water in power plants, it is necessary to develop and implement sound
scaling control technologies for different types of treated MWW.
1.1 RESEARCH OBJECTIVES
This study aims to investigate the use of treated municipal wastewater where freshwater is not
readily available for power plant cooling systems. To evaluate the feasibility of using this
impaired water source for cooling, specific goals of this study were to advance the fundamental
3

understanding of scaling behavior of treated municipal wastewater under conditions relevant to
cooling tower operation and to develop effective approaches for mineral scaling inhibition. In
order to fulfill these major goals, experimental investigations were conducted to achieve the
following specific objectives: 1) determine the main scaling mechanism and effective mitigation
methods for heated and non-heated surfaces in bench-scale studies; 2) understand the role of
hydrodynamic conditions on the scaling processes; 3) study the effectiveness and mechanism of
common antiscalants on mineral scale formation relevant to MWW reuse as makeup in
recirculating cooling systems; and 4). validate the findings from bench-scale studies in extended
pilot-scale cooling tower tests.
1.2 SCOPE OF THE DISSERTATION
This dissertation incorporates three journal manuscripts and is presented in five chapters. The
core of the dissertation consists of Chapters 2, 3, and 4, which include major findings of this
study.
The present chapter (Chapter 1) introduces the background and motivation of the study.
Two types of tertiary-treated municipal wastewaters, namely secondary-treated MWW
with pH adjustment (MWW_pH) and secondary-treated MWW subjected to nitrification and
sand filtration (MWW_NF) were evaluated as the sole source of make-up water for recirculating
cooling systems. Chapter 2 demonstrated the mineral scaling on non-heated surfaces (e.g.,
pipelines, tower packing, etc.) with MWW and MWW_NF in recirculating cooling systems.
4

Batch-, bench-, and pilot-scale studies were conducted to determine the effective scaling
mitigation methods and test their compatibility with corrosion and biofouling control methods in
the integrated chemical regimen. This chapter has been published in Water Research (Liu et al.,
2012).
Chapter 3 addresses the scaling on condenser tube surfaces (fouling) when MWW_pH or
MWW_NF is used as the sole make-up water for recirculating cooling systems. A bench-scale
recirculating system equipped with a cartridge heater was designed to simulate the heat
exchanger surface for fouling investigation. Effects of mineral scaling on the heat transfer
efficiency deterioration were studied in the customized test system. Bench-scale tests were also
conducted to determine chemical control methods and operational strategies to mitigate scale
buildup on heated surfaces. This chapter has been submitted for publication (Liu et al., 2013a).
Chapter 4 examines the function of common antiscalants on the calcium phosphate
precipitation. Calcium phosphate scales were encountered in numerous wastewater reuse and
water treatment processes but only limited guidance could be found in literature. In batch tests, a
combined analysis of bulk chemistry, precipitates mineralogy, and surface characteristics was
conducted to obtain insights into inhibition mechanisms of common antiscalants on calcium
phosphate scale formation. This chapter will be submitted for publication soon (Liu et al.,
2013b).
Chapter 5 summarizes the original contributions, major findings, and conclusions of this
work. Specific future work that can be carried out from this dissertation is also provided in this
chapter.
5
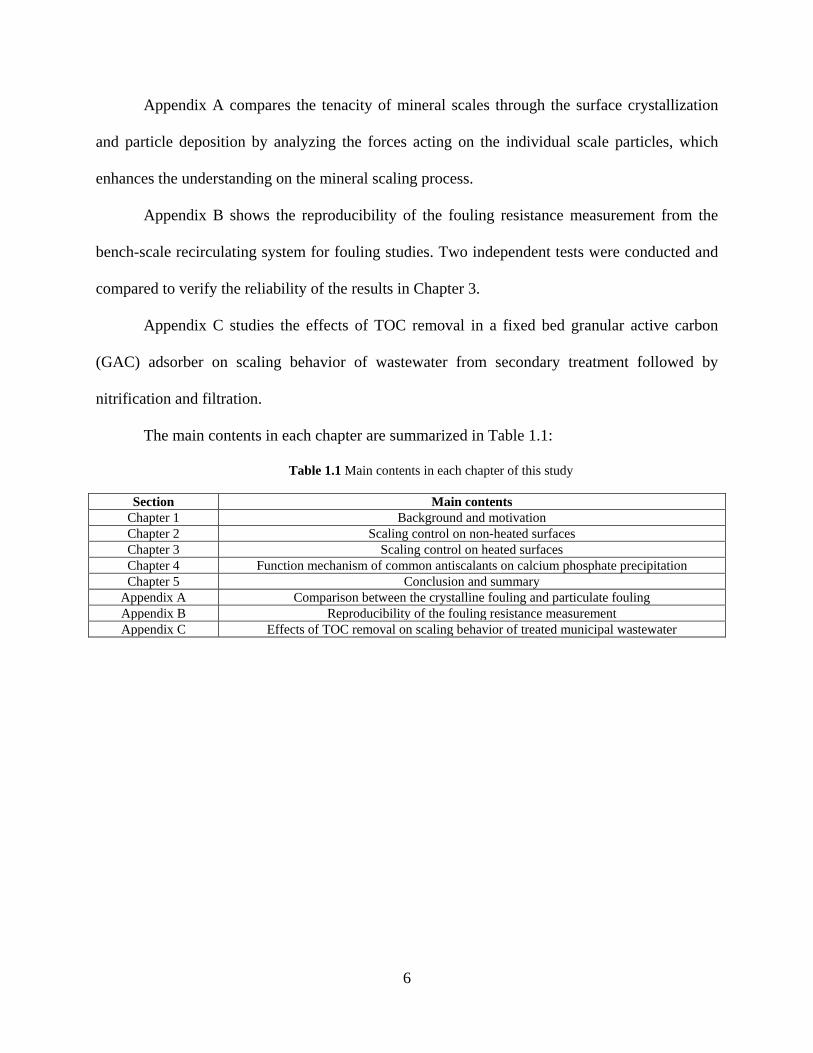
Appendix A compares the tenacity of mineral scales through the surface crystallization
and particle deposition by analyzing the forces acting on the individual scale particles, which
enhances the understanding on the mineral scaling process.
Appendix B shows the reproducibility of the fouling resistance measurement from the
bench-scale recirculating system for fouling studies. Two independent tests were conducted and
compared to verify the reliability of the results in Chapter 3.
Appendix C studies the effects of TOC removal in a fixed bed granular active carbon
(GAC) adsorber on scaling behavior of wastewater from secondary treatment followed by
nitrification and filtration.
The main contents in each chapter are summarized in Table 1.1:
Table 1.1 Main contents in each chapter of this study
Section Main contents Chapter 1 Background and motivation Chapter 2 Scaling control on non-heated surfaces Chapter 3 Scaling control on heated surfaces Chapter 4 Function mechanism of common antiscalants on calcium phosphate precipitation Chapter 5 Conclusion and summary
Appendix A Comparison between the crystalline fouling and particulate fouling Appendix B Reproducibility of the fouling resistance measurement Appendix C Effects of TOC removal on scaling behavior of treated municipal wastewater
6

2.0 SCALING MITIGATION ON NON-HEATED SURFACES WITH TREATED
MUNICIPAL WASTEWATER AS MAKEUP IN RECIRCULATING COOLING SYSTEMS
This work has been published as:
Liu, W., Chien, S.H., Dzombak, D., Vidic, R. (2012) Mineral scaling mitigation in cooling systems using tertiary-treated municipal wastewater. Water Research, 46(14), pp.4488-4498.
7
Treated municipal wastewater (MWW) is recognized as a significant potential source of cooling
water for power generation. One of the key challenges for the successful use of the effluent from
wastewater treatment facilities for cooling is the potential for significant mineral scaling when
the raw water is concentrated as much as 4-6 times in recirculating cooling systems. Previous
bench- and pilot-scale tests (Li et al., 2011b) have shown that commonly used phosphorus- and
polymer- based scaling inhibitors are ineffective when secondary-treated municipal wastewater
(MWW) is used as makeup. In this study, two types of tertiary-treated municipal wastewaters,
namely secondary-treated MWW with pH adjustment (MWW_pH) and secondary-treated MWW
subjected to nitrification and sand filtration (MWW_NF) were evaluated as the sole source of
make-up water for recirculating cooling systems. Both laboratory studies and pilot-scale tests
revealed that adjusting the pH to 7.8 could reduce the mineral scaling rate by more than 80%
without causing any significant corrosion problems. In contrast to MWW, where calcium
carbonate was the dominant scaling mineral, the main component of mineral scale in MWW_pH
was calcium phosphate. Both static and dynamic bench-scale tests indicated that scaling would
not be a significant concern when MWW_NF is used as the make-up water in recirculating
cooling systems operated at 4-6 cycles of concentration (CoC). Extended pilot-scale studies
confirmed that MWW_NF is suitable makeup water for power plant cooling systems and that no
anti-scaling chemicals would be required.
8

2.1 INTRODUCTION
Secondary treatment is the most common method for municipal wastewater treatment in the U.S.
Secondary-treated MWW is characterized by low to moderate content of total suspended solids
(TSS) and organic matter, but moderate to high content of dissolved solids, alkalinity, and
hardness. Under typical recirculating cooling conditions (i.e., elevated temperature and
evaporative loss of water), a significant concern when using secondary MWW is the potential for
severe mineral scaling. Among methods used to prevent scale formation and deposition,
antiscalants have been proven effective when traditional water source (i.e. fresh water) was
employed in cooling systems (Shakkthivel and Vasudevan, 2006; Moudgil et al., 2009).
However, their effectiveness can be seriously compromised when secondary-treated MWW is
used instead. Among common antiscalants, phosphate- or phosphonate- based agents could react
with calcium ions to form insoluble precipitates and exacerbate the scaling problem, especially in
concentrated MWW with high concentration of calcium and phosphate (Selby et al., 1996;
Zhang et al., 2010). In a previous study by Li et al. (2011b), carboxylic polymers, like
polymaleic acid (PMA), have been shown to significantly reduce the scaling in bench-scale tests
with synthetic secondary-treated MWW. However, these antiscalants were not as effective
during extended pilot-scale tests with real secondary-treated MWW. Therefore, development and
demonstration of effective scaling control approaches are needed for treated MWW to advance
the reuse of this water source for power plant cooling.
Previous studies have shown that the major mineral scales formed in recirculating cooling
systems using secondary-treated MWW as make-up water are calcium carbonate and to a lesser
extent calcium phosphate (Li et al., 2011b). Chemical species distribution for these precipitation
9

reactions is highly dependent on the solution pH. It is reasonable to assume that lowering the
solution pH should lower the formation of the inorganic precipitates by lowering alkalinity and
thus lowering the driving force for scale formation. However, concerns like enhanced corrosion
rates would arise at lower pH (Troup and Richardson, 1978; Hsieh et al., 2010). Although the
impact of pH reduction on scaling control is well known, proper acid dosing and the combined
effects of acid addition and other chemical treatment programs, such as antiscalants, corrosion
inhibitors and biocides, in cooling systems using tertiary-treated MWW have not been
investigated before.
It has been reported that the ammonia concentration in the secondary-treated MWW can
be as high as 10 to 30 mg-N/L (Selby et al., 1996). Biological nitrification processes for
ammonia removal have been adopted by many wastewater treatment plants faced with more
stringent discharge requirements (Office of Water Programs at California State University
Sacramento, 2009). From the prospective of mineral scaling control, tertiary treatment of the
MWW by nitrification would depress the pH and alkalinity and thus reduce the scaling
propensity in recirculating cooling systems (Metcalf & Eddy, 2004). There are currently no
studies that offer guidance on the scaling behavior of tertiary-treated MWW when used as make-
up water in recirculating cooling systems.
The focus of this study was on mineral deposition on pipes and tower packing at bulk
water conditions when tertiary-treated MWW is used as the sole make-up water. Types of
tertiary treatment considered were pH adjustment (MWW_ pH) and nitrification followed by
sand filtration (MWW_NF). Batch tests and bench-scale recirculating system studies were
conducted to determine the desired pH range and the synergism between pH adjustment and
10

antiscalant addition on scaling mitigation when using MWW_pH as make-up water in
recirculating cooling systems. In addition, the precipitation and deposition potential of
secondary-treated MWW subjected to nitrification and sand filtration (MWW_NF) was also
studied under well-controlled laboratory conditions. Pilot-scale cooling tower tests were then
conducted to evaluate the applicability of selected scaling mitigation strategies in the field and to
test their compatibility with corrosion and biofouling control methods in the integrated chemical
regimen for tertiary-treated MWW reuse in recirculating cooling systems.
2.2 MATERIALS AND METHODS
2.2.1 Municipal wastewater
Secondary-treated MWW (biological trickling filter followed by secondary clarification) from
Franklin Township Sanitary Authority, Murrysville, PA, was used in pilot-scale tests and as a
model for typical secondary-treated municipal effluent (Metcalf & Eddy, 2004). Key
characteristics of this water and the tertiary-treated MWW_NF water (secondary treatment
followed by nitrification and sand filtration) from the same wastewater treatment facility are
shown in Table 2.1.
Typical operation of a recirculating cooling system will concentrate the feed water as
much as 4-6 times due to evaporative losses in the system. A synthetic wastewater (Table 2.2)
was prepared to represent secondary-treated MWW at 4 cycles of concentration (CoC 4) in terms
11

of its mineral content for detailed investigation in laboratory tests (Li et al., 2011b). Chemical
composition of synthetic MWW_NF at CoC 4 for laboratory studies is also shown in Table 2.2.
Both synthetic waters were prepared based on the characteristics of the actual wastewaters
shown in Table 2.1.
Table 2.1 Key water quality parameters of Franklin Township Municipal Sanitary Authority (Murrysville, PA) secondary treated effluent (Sampled on September 3, 2008)
Analyte Unit Result Detection limit MWW MWW_NF
Ca mg/L 42 39.7 5 Cu mg/L 0.028 0.17 0.025 Fe mg/L 0.5 0.31 0.1 K mg/L 16.3 15.8 5
Mg mg/L 10.7 9.8 5 Na mg/L 94 78 5
SiO2 mg/L 8.54 7 1.07 NH3 mg N/L 21.0 1.42 0.5 NO3 mg N/L 3.6 18.1 0.1 Cl mg/L 106 96.3 10
SO4 mg/L 86 83.1 1 Total P mg P/L 4.5 12 0.5
pH 7.1 6.7 HCO3 Alkalinity mg CaCO3/L 177 25.4 5 Total Alkalinity mg CaCO3/L 177 25.4 5
BOD mg/L 32 5.8 TOC mg/L 27 8.7 1 TDS mg/L 661 474 10 TSS mg/L 24.5 20.8 5
Conductance mS/cm 1.03 0.87 0.01 Notes: MWW (secondary treated municipal wastewater, biological trickling filter followed by secondary clarification); MWW_NF (tertiary treated municipal wastewater, nitrification and sand filtration after secondary treatment).
12

Table 2.2 Chemical composition of synthetic MWW and MWW_NF at 4 cycles of concentration (CoC 4) for batch-
and bench-scale experiments
Cation Concentration (mM) Anion Concentration (mM) MWW MWW_NF MWW MWW_NF
Ca2+ 7.60 4.00 SO42- 2.84 3.50
Mg2+ 7.16 1.60 HCO3- 13.44 1.60
Na+ 26.88 9.80 Cl- 31.13 11.20 K+ 0.70 0.48 PO4
3- 0.21 0.48 NH4
+ (as N) 7.01 - NO3- (as N) 1.20 -
Notes: MWW (secondary treated municipal wastewater, biological trickling filter followed by secondary clarification); MWW_NF (tertiary treated municipal wastewater, nitrification and sand filtration after secondary treatment).
2.2.2 Laboratory experimental systems
Precipitation behavior of MWW_ pH at CoC 4 was first studied in a 1.4 L beaker covered with
plastic wrap to minimize water loss due to evaporation. The contents in the beaker were
completely mixed with a magnetic stirrer and the bulk temperature was controlled at 40°C
(typical bulk temperature of power plant recirculating cooling water) using the heating plate. The
experiments were always initiated by adding all the salts listed in Table 2.2 except for CaCl2. For
the tests intended to study the impact of pH on precipitation behavior of MWW_ pH at CoC 4,
the solution pH was then lowered to 6.8 with 0.5 M hydrochloric acid (previous tests have shown
that there will be no immediate bulk precipitation at pH 6.8) followed by the addition of CaCl2.
pH of the synthetic solution was then adjusted and maintained at a desired pH with 0.5 M
hydrochloric acid or 0.5 M sodium hydroxide. The effectiveness of polymaleic acid (PMA, Kroff
Chemical Company, Pittsburgh, PA) as a model antiscalant on the precipitation was tested by
adding it to the solution before the addition of any salts.
13

Precipitation behavior in the beaker was monitored by withdrawing 5 mL of the solution
at predetermined intervals. The water sample was filtered through a 0.45 µm membrane and
immediately acidified to pH< 2 with concentrated HNO3. Calcium and phosphate concentrations
were determined by atomic absorption spectroscopy and the molybdate/ascorbic acid method
(American Public Health Association et al., 2005), respectively. Mg concentration was not
monitored because previous study (Li et al., 2011b) has shown that Mg precipitation was
negligible. Precipitated solids were collected, washed with DI water, and air-dried for subsequent
petrographic and chemical characterization.
A bench-scale recirculating system (Figure 2.1) was used to investigate the deposition
behavior of MWW_ pH and MWW_NF under different scaling mitigation strategies. Synthetic
treated MWW and MWW_NF were used for reproducible solution chemistry. Mineral mass
deposited on stainless steel (SS) discs (5.61 cm2) was monitored to track the scaling process.
Temperature was controlled at approximately 40°C (105°F), and flow rate through the system
was maintained at 11.4 L/min (3 gpm) to achieve flow velocity of 0.66 m/s (2.18 ft/s) and
Reynolds number of 1.9×10⁴.
The crystalline characteristics of the solids were analyzed by x-ray diffraction (XRD, PW
1830, Philips Analytical Inc., Natick, MA) with Cu Kα radiation. Once the diffraction patterns
were obtained, both manual matching of the peak positions and a computer-aided search for the
compounds were performed. The morphology of the precipitates was inspected using Scanning
Electron Microscopy (SEM, Philips XL30, FEI Co., Hillsboro, OR) and the elemental
compositions of selected sample were determined by Energy Dispersive X-ray Spectroscopy
(EDS, EDAX Inc., Mahwah, NJ).
14

Figure 2.1 Schematic diagram of bench scale recirculating system
2.2.3 Pilot-scale cooling tower tests
Field tests with pilot-scale cooling towers were conducted at the Franklin Township Municipal
Sanitary Authority (FTMSA, Murrysville, PA) using three pilot-scale cooling towers. The design
and operation of the pilot-scale cooling towers is reported elsewhere (Chien et al., 2012a). The
field tests were conducted with treated MWW and MWW_NF to test the optimal scaling
mitigation strategies that were identified from bench-scale experiments and their compatibility
with corrosion and biofouling control methods in the integrated chemical regimen when using
tertiary-treated MWW as make-up water in recirculating cooling systems. All three towers were
operated at CoC 4-6, using a target flow velocity of 0.66 m/s (2.18 ft/s). The temperature of
water entering the tower was about 40°C (105°F) and leaving the tower was about 35°C (95°F).
The cooling towers were tested for two consecutive 60-day periods from May 2010 to
September 2010. In each test period, three towers were operated side by side and the chemical
addition for the control of biofouling and corrosion was implemented together with the scaling
control program. In previous tests, tolyltriazole (TTA) showed effective corrosion inhibition for
15

copper and copper alloys while phosphorous-based corrosion inhibitors were largely removed by
precipitation (Hsieh et al., 2010). PMA reduced scaling significantly in the absence of chlorine
(biocides) when synthetic secondary-treated MWW at CoC 4 was recirculated at bench-scale
systems but was only partially effective in the presence of chlorine (Li et al., 2011b). Pre-formed
monochloramine (MCA) was found to be less aggressive than free chlorine while still being an
effective biocide (Chien et al., 2012b). Thus, TTA was selected for corrosion control and MCA
was selected for biofouling control in these pilot-scale cooling tower tests. The chemical
inhibitor dosing used in tests with MWW_ pH and MWW_NF are shown in Table 2.3. Pilot-
scale tests with MWW_ pH were used to study the impact of TTA on corrosion inhibition and
effectiveness of different biocides (free chlorine or MCA) for biofouling control (Table 2.3).
Cooling tower A in the pilot-scale test with MWW_NF was used as a control with biocide
addition only, while cooling towers B and C were used to compare the effectiveness of TTA at
different concentrations for corrosion control (Table 2.3). The results of biofouling and corrosion
control studies are reported separately (Chien et al, 2012b; Choudhury et al., 2012). pH control
was maintained using an automated system consisting of pre-calibrated pH probe with pH
controller, and a solenoid valve.
Similar to the bench-scale recirculating system tests, stainless steel discs were used to
provide collecting surfaces for scaling/deposition and were withdrawn at predetermined time
intervals to monitor the scaling process. One important difference between the scaling studies
with synthetic treated MWW in the laboratory and real treated MWW in the field is the biomass
growth on SS discs used in the field tests. Therefore, the SS discs were first placed at 104°C for
3.5 hours to dry and then at 500°C for 3.5 hours to remove volatile organic component of the
deposit. The inorganic deposits on selected SS disc specimens were analyzed by SEM/EDS to
16
obtain their elemental composition. In parallel with the solids analysis, important information
about the chemistry of the makeup and recirculating water was recorded throughout the field
tests.
Table 2.3 Chemical composition of synthetic MWW and MWW_NF at 4 cycles of concentration (CoC 4) for batch- and bench-scale experiments
Make-up water
Chemical CTA CTB CTC Function Dosing location
MWW_pH TTA, mg/L as dose
2 5 5 Anti-corrosion
Makeup water tank
PMA, mg/L as dose
5 5 5 Anti-scaling Makeup water tank
MCA, mg/L as residual
3~4 3~4 - Biocide Basin
FC, mg/L as TC residual
- - 3~4 Biocide Basin
pH control NC 7.0 and then 7.8
7.0 and then 7.8
Anti-scaling Basin
MWW_NF TTA, mg/L as dose
0 2 4 Anti-corrosion
Makeup water tank
PMA, mg/L as dose
0 5 5 Anti-scaling Makeup water tank
MCA, mg/L as residual
2~3 2~3 2~3 Biocide Basin
Notes: MWW (secondary treated municipal wastewater, biological trickling filter followed by secondary clarification); MWW_NF (tertiary treated municipal wastewater, nitrification and filtration after secondary treatment); TTA (Tolyltriazole); PMA (Polymaleic acid); MCA (Monochloramine); FC (Free chlorine); TC (Total chlorine).; NC = no pH adjustment; CTA (cooling tower A); CTB (cooling tower B); CTC (cooling tower C).
2.3 RESULTS AND DISCUSSION
2.3.1 Precipitation reactions in solution: batch tests
Batch tests with synthetic MWW_pH (CoC 4) at pH 8.4, 8.2, 7.8, 7.4, and 7.0 (MWW_pH) were
conducted at 40°C and the residual Ca and phosphate concentrations are plotted as a function of
time on Figure 2.2. As can be seen in Figure 2.2, Ca and phosphate concentrations in the
17
synthetic secondary-treated MWW were sensitive to pH in the range of 8.4 to 7.8. Typically,
lower pH resulted in the increase in solution concentration. Phosphate precipitation was
essentially complete in less than 10 minutes when pH was above 7.8 and lowering pH to 7.4
extended the reaction time to about 1 hour. Soluble Ca and phosphate concentrations at pH 7.0
remained almost unchanged throughout the test, suggesting that maintaining the pH of synthetic
MWW_ pH at 7.0 would prevent precipitation of calcium carbonate and calcium phosphate for at
least 3 hours.
Figure 2.2 Residual Ca and phosphate concentrations in batch tests with synthetic secondary-treated MWW (CoC 4) as a function of time at typical cooling water temperature (40°C) when pH was maintained at 8.4, 8.2, 7.8, 7.4, and 7.0. The data represent mean values based on triplicate measurements with relative standard deviation (%RSD) of Ca and phosphate concentration measurements within ±5.2% and ±3.1%, respectively.
18

XRD analysis (Figure 2.3) showed that magnesian calcite was the main crystalline
components of the precipitates from the synthetic secondary-treated MWW at pH 8.4, 8.2, and
7.8. Magnesian calcite is generally formed by the coprecipitation of MgCO3 and CaCO3 and
contains small but variable amounts (less than 5%) of MgCO3 in solid solution (Thorstenson and
Plummer, 1977). Comparison of the XRD patterns at these pH conditions revealed that the peaks
of magnesian calcite decreased with pH reduction. Maintaining the pH at 7.4 could totally inhibit
the formation of magnesian calcite as evidence by the absence of its characteristic peaks in XRD
spectra. Morphology of amorphous calcium phosphate was observed in SEM images (Chesters,
2009) and EDS analysis verified that the precipitates were mainly composed of Ca and P with a
small amount of Mg and C incorporated (Figure 2.4).
Figure 2.3 XRD pattern of the precipitates from batch tests with synthetic secondary-treated MWW (CoC 4, 40°C) when pH was maintained at pH 8.4, 8.2, 7.8, and 7.4
19

Figure 2.4 SEM image and the elemental composition of the precipitates from batch tests with synthetic secondary-treated MWW (CoC 4, 40°C) when pH was maintained at pH 7.4. EDS scan was performed on the area outlined by the square box on the SEM image
Morphology of precipitates formed in the batch tests is shown in the SEM images on
Figure 2.5. Only “broccoli-like” minerals were identified in the precipitates formed from the
synthetic secondary-treated MWW (CoC 4) at pH 8.2. Normally, three polymorphs of CaCO3
could form in the absence of biological activity: calcite with rhombohedral shape (Wu et al.,
2010), aragonite with needle-like shape (Hardikarl and Matijevic, 2001), and spherical vaterite
(Hou and Feng, 2006). However, the morphology of the precipitates formed in these tests could
not be recognized as either of these polymorphs. The incorporation of Mg ions into the lattice of
calcite would poison the side faces of calcite and allow the crystals to grow in the c-axis
direction, producing elongated morphology rather than equant crystals with rhombohedral shape
(Folk, 1974; Davis et al., 2000). It is thus concluded that broccoli-like minerals in Figure 2.5(a)
were clusters of single elongated calcite crystals (Swietlik et al., 2011). When pH was lowered to
7.8, two predominant morphologies were observed in the SEM images (Figure 2.5 (b)):
amorphous minerals and “broccoli-like” minerals.
20
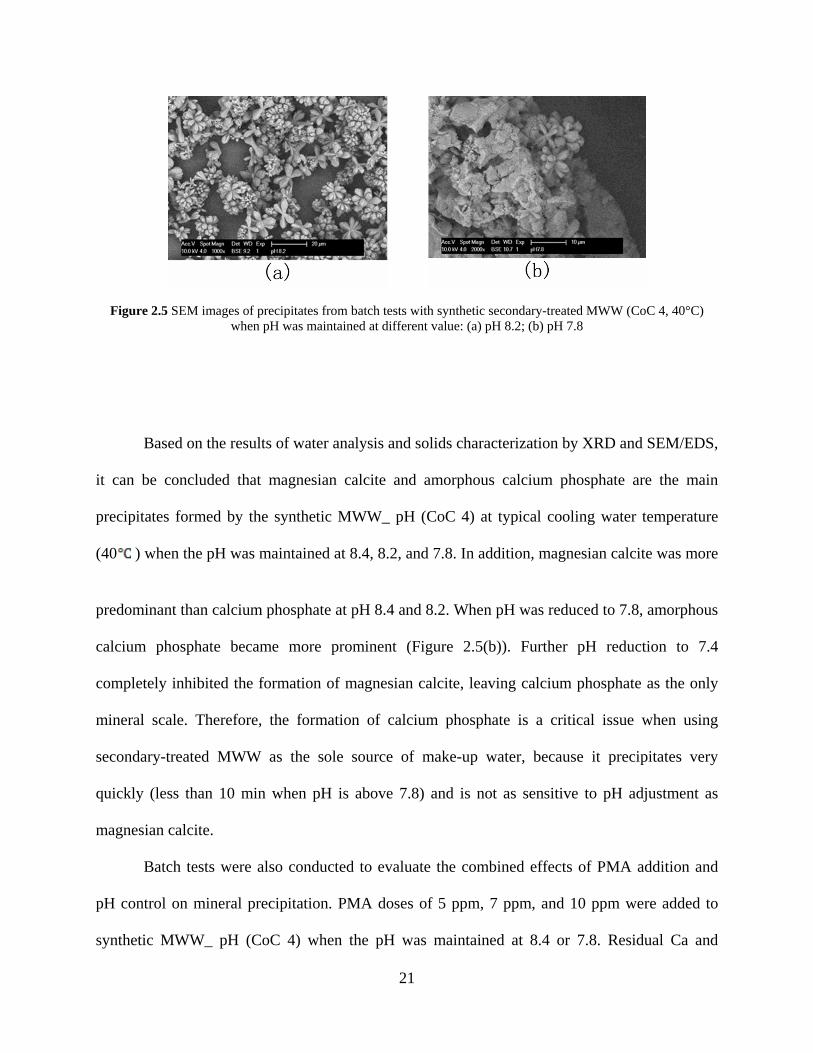
Figure 2.5 SEM images of precipitates from batch tests with synthetic secondary-treated MWW (CoC 4, 40°C) when pH was maintained at different value: (a) pH 8.2; (b) pH 7.8
Based on the results of water analysis and solids characterization by XRD and SEM/EDS,
it can be concluded that magnesian calcite and amorphous calcium phosphate are the main
precipitates formed by the synthetic MWW_ pH (CoC 4) at typical cooling water temperature
(40 ) when the pH was maintained at 8.4, 8.2, and 7.8. In addition, magnesian calcite was more
predominant than calcium phosphate at pH 8.4 and 8.2. When pH was reduced to 7.8, amorphous
calcium phosphate became more prominent (Figure 2.5(b)). Further pH reduction to 7.4
completely inhibited the formation of magnesian calcite, leaving calcium phosphate as the only
mineral scale. Therefore, the formation of calcium phosphate is a critical issue when using
secondary-treated MWW as the sole source of make-up water, because it precipitates very
quickly (less than 10 min when pH is above 7.8) and is not as sensitive to pH adjustment as
magnesian calcite.
Batch tests were also conducted to evaluate the combined effects of PMA addition and
pH control on mineral precipitation. PMA doses of 5 ppm, 7 ppm, and 10 ppm were added to
synthetic MWW_ pH (CoC 4) when the pH was maintained at 8.4 or 7.8. Residual Ca and
21

phosphate concentrations were monitored as a function of time as shown in Figure 2.6. At pH
8.4, both calcium and phosphate concentrations were slightly elevated by the addition of PMA,
revealing that PMA had minimal impact on precipitation propensity of minerals and associated
increase in the solubility of the scaling species. Fairly limited increase in solubility was also
observed at pH 7.8 (Figure 2.6 (b)). In addition, amorphous calcium phosphate dominated the
solids characterization spectra collected at pH 7.8 as evidence by the absence of distinct XRD
peaks (data not shown) and EDS analysis of precipitates on Figure 2.7. Adsorption of the PMA
molecules at the active sites on the surface of pre-critical nuclei would prevent the growth of the
crystals beyond the pre-critical size and formation of stable magnesian calcite (Meldrum and
Hyde, 2001). The residual phosphate concentration measurement showed that the precipitation of
calcium phosphate was still significant at pH 7.8 (Figure 2.6(b)). It should be noted that
increasing the PMA dosage at both pH conditions did not result in precipitation inhibition.
22
(a)
(b)
Figure 2.6 Residual Ca and phosphate concentrations in batch tests with synthetic secondary-treated MWW (CoC 4) as a function of time at typical cooling water temperature (40°C) when 0, 5, 7, and 10 ppm PMA was dosed at different pH: (a) 8.4; (b) 7.8.
23

Figure 2.7 SEM images of precipitates from batch tests with synthetic secondary-treated MWW (CoC 4, 40°C) when pH was maintained at 7.8 with the addition of 5 ppm PMA
No visual precipitate was observed during the first 2 hours of the batch test with synthetic
MWW_NF at CoC 4 without any pH adjustment. However, as the solution equilibrated with
atmosphere and pH increased from 6.8 to 7.6, it turned turbid after about 2 hours. Residual Ca
and phosphate concentrations also decreased with the development of turbidity (Figure 2.8) and
reached steady state after 14 hours. Solids characterization revealed that the precipitates were
mainly in the form of amorphous calcium phosphate. These results suggest that when MWW_NF
is used as make-up water in recirculating cooling systems operated at CoC 4, no magnesian
calcite would be expected and calcium phosphate would be the primary mineral scale.
24

Figure 2.8 Residual Ca and phosphate concentrations in batch tests with synthetic MWW_NF (CoC 4) as a function of time at typical cooling water temperature (40°C). The data represent mean values based on triplicate measurements with relative standard deviation (%R RSD) of Ca and phosphate concentration measurements within ±4.3% and ±2.6%, respectively.
2.3.2 Bench-scale recirculating system tests
A series of experiments in a bench-scale recirculating system was conducted to test the
effectiveness of scaling control strategies on mineral deposition from flowing synthetic MWW.
The scaling control strategies were designed based on the results from the batch tests. Scaling
behavior of the synthetic MWW_ pH under different scaling control strategies is shown in Figure
2.9(a).
Mass gain on the disc specimen exposed to recirculating synthetic MWW_ pH at pH 8.4
developed quickly and reached 1.6 mg in 24 hours. Although total mineral deposits accumulated
after 48 hours were nearly the same with or without the addition of PMA, the addition of PMA
significantly delayed the scaling process. The PMA can function as colloid dispersant through
25
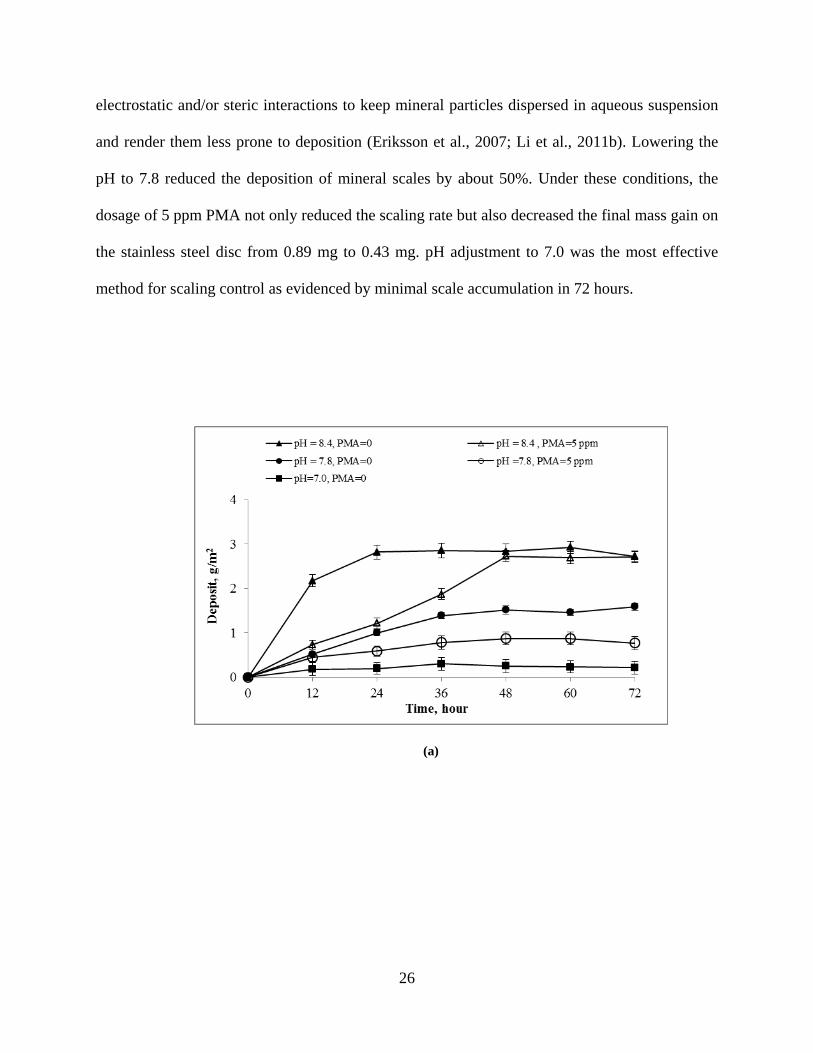
electrostatic and/or steric interactions to keep mineral particles dispersed in aqueous suspension
and render them less prone to deposition (Eriksson et al., 2007; Li et al., 2011b). Lowering the
pH to 7.8 reduced the deposition of mineral scales by about 50%. Under these conditions, the
dosage of 5 ppm PMA not only reduced the scaling rate but also decreased the final mass gain on
the stainless steel disc from 0.89 mg to 0.43 mg. pH adjustment to 7.0 was the most effective
method for scaling control as evidenced by minimal scale accumulation in 72 hours.
(a)
26

(b)
Figure 2.9 Scaling behavior of synthetic MWW under different scaling control strategies in bench-scale recirculating system tests: (a) MWW_pH ; (b) MWW_NF. The bulk water temperature and flow velocity was maintained at 40°C and 0.6 m/s respectively. Error bars indicate the data range of measurements from duplicate tests. The bulk water temperature and flow velocity were maintained at 40°C and 0.6 m/s respectively. Error bars indicate the data range of measurements from duplicate tests.
Figure 2.10 depicts morphologies of mineral deposits on stainless disc specimens
collected from bench-scale recirculating system tests. At pH 8.4 (Figure 2.10(a)), the
morphology of magnesian calcite dominated on the disc specimen (Swietlik et al., 2011).
However, the minerals did not grow in clusters as in batch tests but formed separately and thus
appeared as needle-like structures. Addition of 5 ppm PMA to the system operated at pH 8.4
(Figure 2.10(b)) made it difficult to identify well-developed magnesian calcite thereby, revealing
the role of PMA as crystal distorter in the deposition inhibition. Adjusting the pH to 7.8 (Figure
2.10(c)) decreased the percentage of magnesian calcite and amorphous deposits appeared on
SEM images. Only amorphous solids (Figure 2.10(d)) were identified on the collector surface
when pH was controlled around 7.8 and 5 ppm PMA was added to recirculating water.
27
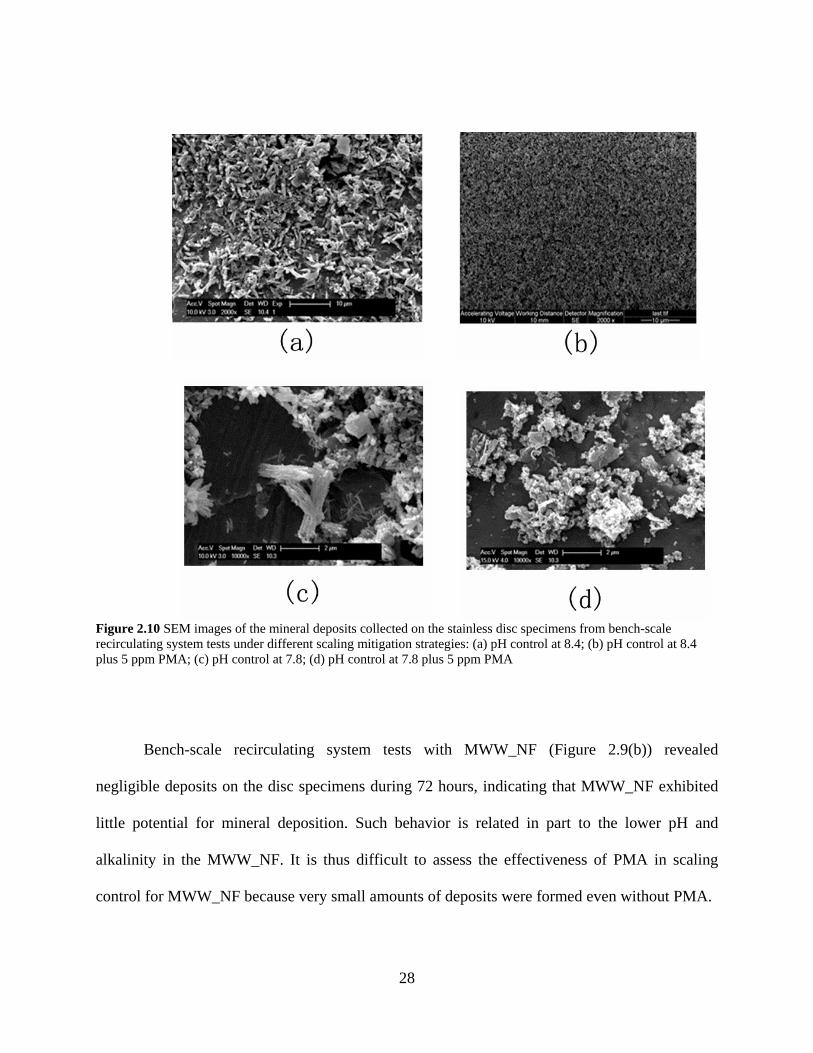
Figure 2.10 SEM images of the mineral deposits collected on the stainless disc specimens from bench-scale recirculating system tests under different scaling mitigation strategies: (a) pH control at 8.4; (b) pH control at 8.4 plus 5 ppm PMA; (c) pH control at 7.8; (d) pH control at 7.8 plus 5 ppm PMA
Bench-scale recirculating system tests with MWW_NF (Figure 2.9(b)) revealed
negligible deposits on the disc specimens during 72 hours, indicating that MWW_NF exhibited
little potential for mineral deposition. Such behavior is related in part to the lower pH and
alkalinity in the MWW_NF. It is thus difficult to assess the effectiveness of PMA in scaling
control for MWW_NF because very small amounts of deposits were formed even without PMA.
28
2.3.3 Pilot-scale studies with tertiary-treated MWW
2.3.3.1 MWW_pH
In the pilot-scale cooling tower tests with MWW_ pH as the make-up water source, recirculating
water in all three towers was dosed with about 5 ppm PMA as scaling inhibitor. In addition, pH
in Towers B and C was initially adjusted to pH 7.0 by adding 0.1 M H2SO4 because batch and
bench-scale recirculating system tests revealed that pH control at 7.0 could totally inhibit the
precipitation and deposition of mineral scales from the synthetic MWW at CoC 4. However,
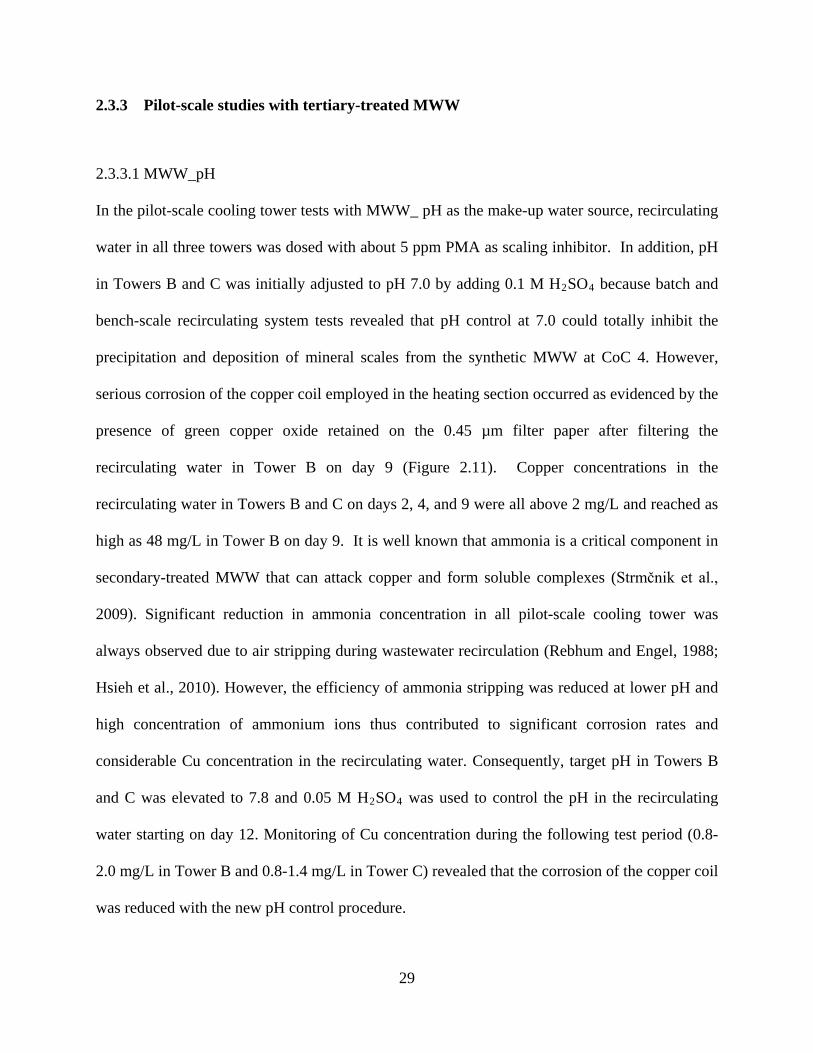
serious corrosion of the copper coil employed in the heating section occurred as evidenced by the
presence of green copper oxide retained on the 0.45 µm filter paper after filtering the
recirculating water in Tower B on day 9 (Figure 2.11). Copper concentrations in the
recirculating water in Towers B and C on days 2, 4, and 9 were all above 2 mg/L and reached as
high as 48 mg/L in Tower B on day 9. It is well known that ammonia is a critical component in
secondary-treated MWW that can attack copper and form soluble complexes (Strmčnik et al.,
2009). Significant reduction in ammonia concentration in all pilot-scale cooling tower was
always observed due to air stripping during wastewater recirculation (Rebhum and Engel, 1988;
Hsieh et al., 2010). However, the efficiency of ammonia stripping was reduced at lower pH and
high concentration of ammonium ions thus contributed to significant corrosion rates and
considerable Cu concentration in the recirculating water. Consequently, target pH in Towers B
and C was elevated to 7.8 and 0.05 M H2SO4 was used to control the pH in the recirculating
water starting on day 12. Monitoring of Cu concentration during the following test period (0.8-
2.0 mg/L in Tower B and 0.8-1.4 mg/L in Tower C) revealed that the corrosion of the copper coil
was reduced with the new pH control procedure.
29
Figure 2.11 “Green deposits” retained on 0.45 µm filter paper after filtering the recirculating water in Tower B on day 9 in pilot scale tests with MWW_pH at pH 7.0
Images of the test coupons collected from the three pilot-scale cooling towers with
MWW_pH as makeup on day 58 are shown in Figure 2.12. Figure 2.13 depicts the time course
of inorganic scale deposition in the three cooling systems during the tests with MWW_pH. The
total mass of the inorganic deposits on day 58 in Tower A was as high as 11.57 mg, while the
mass gains in Towers B and C were only 0.61 and 1.80 mg, respectively. It is clear that just
adding 5 ppm PMA failed to mitigate scaling in Tower A. Significant reduction in the inorganic
deposition was observed with pH adjustment in Towers B and C. Furthermore, use of
monochloramine as biocide in Tower B resulted in even lower scale accumulation as compared
to Tower C where free chlorine was used for biofouling control. This finding is in agreement
with the previous related study which revealed enhanced PMA oxidation with free chlorine when
compared to monochloramine (Li et al., 2011b).
30
(a) (b) (c)
Figure 2.12 Coupons collected from pilot-scale cooling towers tests with MWW_pH on day: (a) Tower A (5 ppm PMA for scaling control); (b) Tower B (5 ppm PMA and pH adjustment for scaling control); (c) Tower C (5 ppm PMA and pH adjustment for scaling control)
Figure 2.13 Inorganic deposit mass measurements in the pilot-scale cooling tower tests with MWW_pH
31

Water samples from the recirculating loop of each cooling tower operated at steady state
were analyzed for key constituents. Previous study with MWW revealed that calcium carbonate
was the dominant mineral scale on the sampling discs with a small amount of magnesium and
calcium phosphate (Li et al., 2011b). Langelier Saturation Index (LSI), which is widely used to
estimate the scaling potential of calcium carbonate in cooling towers, was calculated based on
the quality of the recirculating water (EPRI, 2003; Sheikholeslami, 2004) for all three towers
operated with MWW_pH. LSI calculations revealed that the recirculating water in Tower A had
significant calcium carbonate precipitation potential while there was no scaling propensity in
Tower B on most of the sampling days (Table 2.4). The scaling tendency in Tower C was a bit
more erratic and the LSI value was close to zero with positive values on several sampling days.
Table 2.4 Langelier Saturation Index (LSI) of the recirculating water in Towers A, B and C in pilot-scale tests with MWW_ pH
Day Langelier Saturation Index (LSI)a
Tower A (PMA=5 ppm)
Tower B (pH=7.8, PMA= 5 ppm)
Tower C (pH=7.8, PMA= 5 ppm)
2 0.80 -0.64 -2.55 9 1.17 -1.48 0.25
16 1.46 -0.04 -0.36 23 0.82 -0.64 0.29 30 1.61 -0.12 0.59 37 0.41 -0.36 0.05 44 0.95 -0.58 -0.70 58 1.05 0.22 0.41
a If LSI is negative, there is no potential to form scale and the water will dissolve CaCO3; if LSI is positive, scale can form and CaCO3 precipitation may occur; if LSI is close to zero, the water is neutral with respect to scale formation;
32

Comparison of orthophosphate concentrations in the make-up water and recirculating
water for all three towers operated with MWW_pH is shown in Figure 2.14. In Tower A, more
than 80% of orthophosphate precipitated from the solution. On the other hand, orthophosphate
concentration in Towers B and C was always 2.0-3.5 times that of the make-up water. Water
quality analysis suggests that calcium phosphate is the primary mineral scale when pH of the
recirculating water is adjusted at 7.8 and 5 ppm PMA is added. SEM/EDS results shown in
Figure 2.15 confirm this conclusion.
Figure 2.14 Orthophosphate concentration in the make-up water and recirculating water in the pilot-scale cooling tower tests with MWW_pH
33
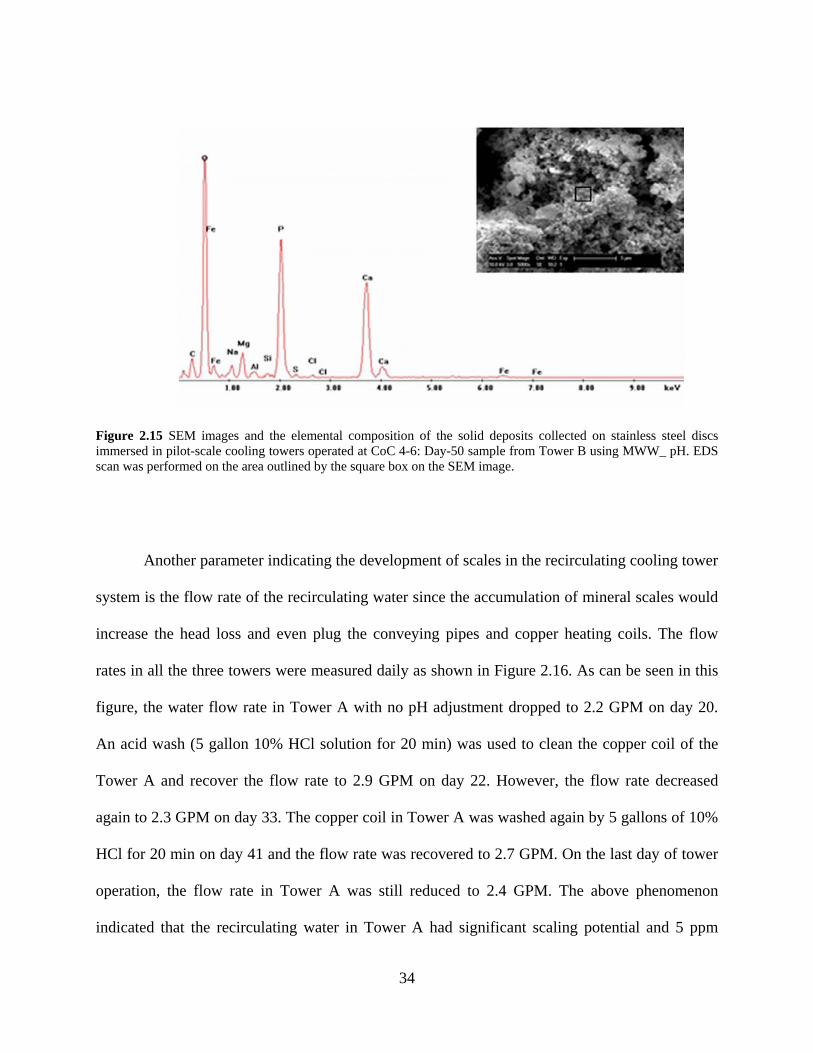
Figure 2.15 SEM images and the elemental composition of the solid deposits collected on stainless steel discs immersed in pilot-scale cooling towers operated at CoC 4-6: Day-50 sample from Tower B using MWW_ pH. EDS scan was performed on the area outlined by the square box on the SEM image.
Another parameter indicating the development of scales in the recirculating cooling tower
system is the flow rate of the recirculating water since the accumulation of mineral scales would
increase the head loss and even plug the conveying pipes and copper heating coils. The flow
rates in all the three towers were measured daily as shown in Figure 2.16. As can be seen in this
figure, the water flow rate in Tower A with no pH adjustment dropped to 2.2 GPM on day 20.
An acid wash (5 gallon 10% HCl solution for 20 min) was used to clean the copper coil of the
Tower A and recover the flow rate to 2.9 GPM on day 22. However, the flow rate decreased
again to 2.3 GPM on day 33. The copper coil in Tower A was washed again by 5 gallons of 10%
HCl for 20 min on day 41 and the flow rate was recovered to 2.7 GPM. On the last day of tower
operation, the flow rate in Tower A was still reduced to 2.4 GPM. The above phenomenon
indicated that the recirculating water in Tower A had significant scaling potential and 5 ppm
34
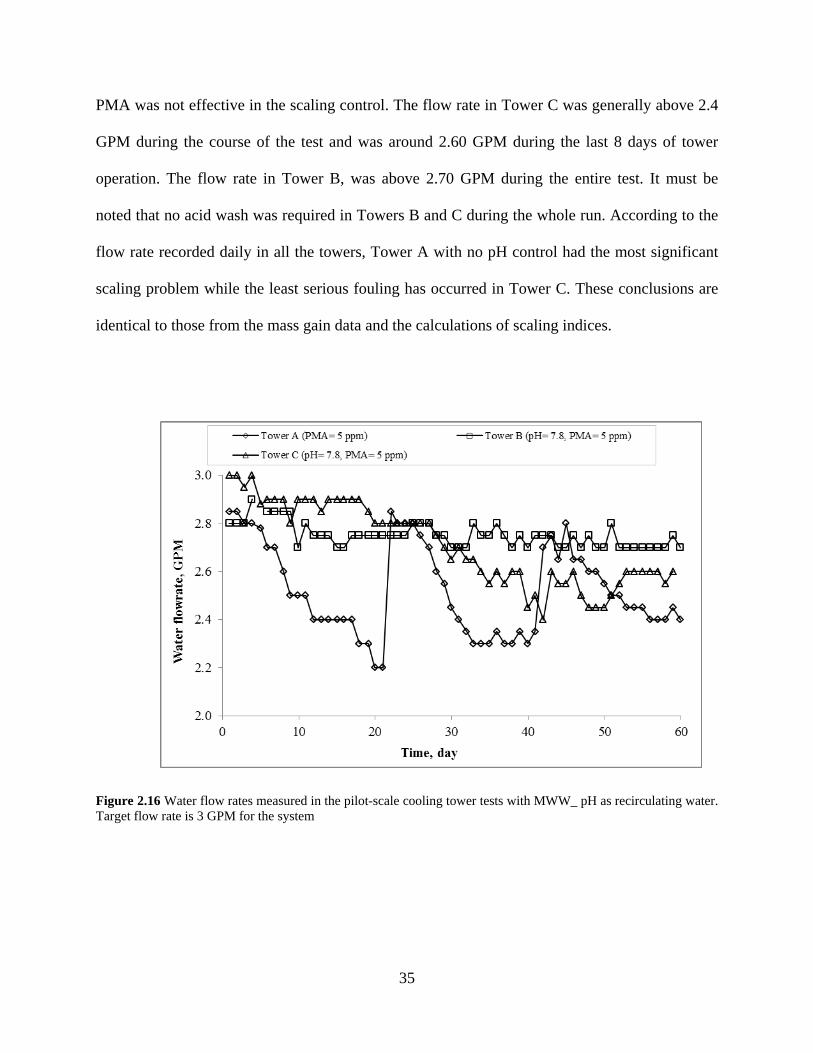
PMA was not effective in the scaling control. The flow rate in Tower C was generally above 2.4
GPM during the course of the test and was around 2.60 GPM during the last 8 days of tower
operation. The flow rate in Tower B, was above 2.70 GPM during the entire test. It must be
noted that no acid wash was required in Towers B and C during the whole run. According to the
flow rate recorded daily in all the towers, Tower A with no pH control had the most significant
scaling problem while the least serious fouling has occurred in Tower C. These conclusions are
identical to those from the mass gain data and the calculations of scaling indices.
Figure 2.16 Water flow rates measured in the pilot-scale cooling tower tests with MWW_ pH as recirculating water. Target flow rate is 3 GPM for the system
35

2.3.3.2 MWW_NF
Images of the test coupons collected from the three pilot-scale cooling towers with MWW_NF as
makeup on day 10 are shown in Figure 2.17. Figure 2.18 depicts accumulated mineral scale
solids deposited on stainless steel disc specimens in the three cooling towers during the tests with
MWW_ NF. The inorganic mass gain on the specimens in all the three towers was small (0.05-
0.67 mg) even after 50 days of immersion in the system. Tower A sample showed the least
amount of deposits when compared with the other two despite the fact that Towers B and C
received 5 ppm PMA to mitigate the scaling. Because of the small amount of inorganic deposits
(less than 0.7 mg) accumulated on the specimens, it is difficult to assess the effectiveness of the
PMA as antiscalant. LSI values for all three towers (Table 2.5) were negative, suggesting that
recirculating water was below saturation with respect to calcium carbonate.
(a) (b) (c)
Figure 2.17 Coupons collected on day 10 in the pilot-scale cooling tower tests with MWW_NF as make-up water: (a) Tower A (no PMA); (b) Tower B (5 ppm PMA); (c) Tower C (5 ppm PMA).
36

Figure 2.18 Inorganic deposit mass measurements in the pilot-scale cooling tower tests with MWW_NF
Table 2.5 Langelier Saturation Index of the recirculating water in Towers A, B and C in pilot-scale tests with MWW_NF on days 36, 40, 44, 49, and 54
Days
Langelier Saturation Index (LSI)a
Tower A (PMA= 0)
Tower B (PMA= 5 ppm)
Tower C (PMA= 5 ppm)
36 -1.75 -1.58 -1.56 40 -1.99 -1.80 -1.80 44 -2.78 -2.59 -2.85 49 -3.06 -2.61 -2.72 54 -2.72 -2.66 -2.71
a If LSI is negative, there is no potential to form scale and the water will dissolve CaCO3; if LSI is positive, scale can form and CaCO3 precipitation may occur; if LSI is close to zero, the water is neutral with respect to scale formation;
37

The pilot-scale cooling tower tests with MWW_NF were all operated at CoC 4-6 but the
orthophosphate concentration in the recirculating water was generally 2~5 times that of the
make-up water (Figure 2.19). These results indicate that precipitation of calcium phosphate
occurred during the test period and may be the major form of the limited mineral scales collected
on sampling coupons. It must be noted that the precipitation of calcium phosphate was still not as
severe as in the tests with secondary-treated MWW where 90% of the phosphate precipitated (Li
et al., 2011b). SEM/EDS analyses were performed on the deposits collected from Tower B after
50 days of operation with MWW_NF at CoC 4-6 (Figure 2.20). The EDS spectra showed that
calcium phosphate was the predominant mineral scale, which is consistent with bench-scale
results and water quality analysis. The carbon peak on Figure 2.20 could be due to substitution of
carbonate for the phosphate in the deposits (Ferguson and McCarty, 1971; Suchanek et al., 2004).
Similar results were obtained from the EDS analysis on the inorganic deposits collected from
Towers A and C on day 50.
Figure 2.19 Orthophosphate concentration in the make-up water and recirculating water in the pilot-scale cooling tower tests with MWW_NF
38

Figure 2.20 SEM images and the elemental composition of the solid deposits collected on stainless steel discs immersed in pilot-scale cooling towers operated at CoC 4-6: Day-50 sample from Tower B using MWW_ NF. EDS scan was performed on the area outlined by the square box on the SEM image.
As described in the preceding text, flow rate is another parameter indicating the scaling
problem. Different from the results with MWW_pH, the flow rates recorded in Figure 2.21 were
always above 2.70 GPM during the entire 60 days of operation, indicating that no significant
scaling or biofouling has occurred in the three towers. In the last 30 days, the flow rate in Tower
C was around 2.9-3.0 GPM while the flow rates in Tower A and B were generally in the range of
2.8-2.95 GPM. This trend was generally consistent with the mass gain data in which Tower C
has shown the least mineral deposition while the mass gain in Tower A and B were a slightly
higher.
39

Figure 2.21 Water flow rates measured in the pilot-scale cooling tower tests with MWW_ NF as recirculating water. Target flow rate is 3 GPM for the system
2.4 SUMMARY AND CONCLUSION
This study investigated mineral scaling on non-heated surfaces and its control when using
tertiary-treated municipal wastewater as an alternative cooling system make-up water to replace
freshwater. Two types of tertiary-treated municipal wastewater that were evaluated in this study
included secondary-treated water with pH adjustment (MWW_pH) and water from secondary-
treatment followed by nitrification and sand filtration (MWW_NF). Based on the results from
batch tests, magnesian calcite and amorphous calcium phosphate are the mineral scales formed
when pH of the synthetic secondary-treated MWW is controlled at 8.4 and 7.8. Bench-scale
recirculating tests showed that the addition of 5 ppm PMA delayed the scale deposition process
40

but had minimal impact on the final total mineral deposits at pH 8.4, while the combination of
pH control at 7.8 and the addition of 5 ppm PMA not only reduced the scaling rate but also
decreased the final mass gain on the sampling specimens. MWW_NF water was shown to have
little potential for mineral deposition on non-heated surfaces, which was due to its lower pH and
alkalinity when compared to secondary-treated MWW.
Results from the pilot-scale cooling tower tests were consistent with conclusion from
bench-scale studies, i.e., pH adjustment to 7.8 was needed besides the addition of 5 ppm PMA to
reduce the scaling rate significantly. With this scaling mitigation method, the formation of
calcium carbonate was inhibited and calcium phosphate was the primary form of mineral scale.
Negligible mineral deposits of calcium phosphate were observed in pilot-scale studies with
MWW_NF.
Overall, this study revealed that the use of tertiary-treated municipal wastewater
(nitrification and sand filtration) in a recirculating cooling system will not lead to significant
inorganic scale formation on non-heated surfaces. This study also demonstrated that it is possible
to manage scaling on non-heated surfaces associated with the use of municipal wastewater either
through pH control or tertiary treatment commonly used in municipal wastewater treatment
practice.
41
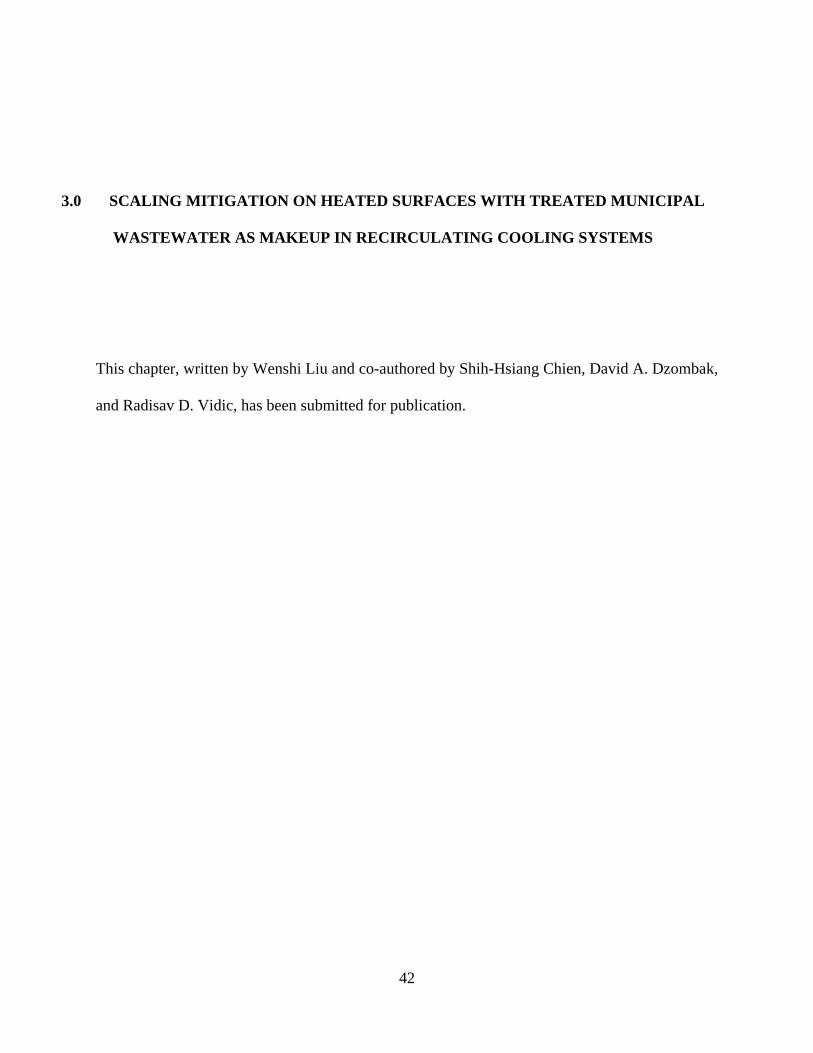
3.0 SCALING MITIGATION ON HEATED SURFACES WITH TREATED MUNICIPAL
WASTEWATER AS MAKEUP IN RECIRCULATING COOLING SYSTEMS
This chapter, written by Wenshi Liu and co-authored by Shih-Hsiang Chien, David A. Dzombak,
and Radisav D. Vidic, has been submitted for publication.
42

The solubility of potential scaling minerals will be different in different parts of the cooling
systems. Limited mineral scaling on non-heated surfaces does not guarantee insignificant scale
deposition on the hottest portion of recirculating cooling systems, i.e. the condenser tubes. In
order to advance the use of treated MWW as cooling water in recirculating cooling systems, it is
necessary to assess mineral deposition on condenser surfaces and develop suitable control
methods under relevant process conditions.
In this study, scaling of two types of tertiary-treated municipal wastewater on condenser
surfaces (crystalline fouling and particulate fouling) was evaluated on a customized bench-scale
recirculating system. The tertiary-treated municipal wastewater that were evaluated in this study
included secondary-treated water with pH adjustment (MWW_pH) and water from secondary-
treatment followed by nitrification and sand filtration (MWW_NF). The tests revealed that
MWW_pH has significant crystalline fouling potential on the condenser surfaces when the pH
was adjusted at 7.8 and that hydroxyapatite was the main component of the mineral scales
formed on condenser surfaces. Addition of antiscalants, e.g. polymaleic acid (PMA), was shown
to be effective in fouling mitigation by inhibiting transformation of amorphous calcium
phosphate to hydroxyapatite. In the case of MWW_NF, significant crystalline fouling was
observed at pH 7.2 while bulk precipitation reduced the driving force for crystalline fouling
when pH was adjusted to 7.8. Overall, this study demonstrated that it is possible to manage
crystalline fouling and particulate fouling on hot condenser tube surfaces associated with the use
of treated municipal wastewater through pH control, antiscalant addition and adequate flow
regime.
43

3.1 INTRODUCTION
Previous studies by Li et al. (2011b) and Liu et al. (2012) focused on scaling control on non-
heated surfaces (e.g., pipelines, tower packing, etc.) when treated MWW is reused in
recirculating cooling systems. This work demonstrated that it is possible to manage scaling
problems on non-heated surfaces in cooling systems using MWW_pH and addition of
antiscalants. Furthermore, negligible mineral scaling potential on non-heated surfaces was
identified for MWW_NF, mainly due to its lower pH and alkalinity.
However, the solubility of amorphous calcium phosphate, which is the main component
mineral scale formed when tertiary-treated MWW is used in cooling systems (Liu et al., 2012),
decreases with an increase in temperature (Spanos et al., 2007). It is then possible that scale
deposition will occur in the hottest portion of recirculating cooling systems, i.e., the condenser
tubes. In order to advance the use of MWW as cooling water in recirculating cooling systems, it
is important to assess mineral deposition on condenser surfaces and develop suitable control
methods under relevant process conditions.
The accumulation of mineral scales arises from two mechanisms: surface crystallization
(crystalline fouling) and particle deposition (particulate fouling). In crystalline fouling, dissolved
ions diffuse towards the hot surface where they exceed supersaturation and react to form a robust
scale layer (Rosmaninho et al., 2007). Attachment of suspended solids that have precipitated in
the bulk solution to the flow surface by cohesive forces constitutes particulate fouling (Bott,
1995). Build-up of mineral scale layer by either mechanism is determined by the interplay
between physical-chemical factors acting to form and bind mineral deposits and hydrodynamic
conditions that provide transport and shearing of those deposits.
44

Common scaling models including the Langelier Saturation Index (Langelier, W.F.,
1946), Ryznar Stability Index (Ryznar, 1944), and Puckorius Saturation Index (Puckorius and
Brook, 1991), only consider the role of thermodynamic saturation with respect to calcium
carbonate scale formation. MWW contains additional scale forming species, especially
phosphate (Humphris, 1977; Rebhun and Engel, 1988; Li et al, 2011b; Liu et al., 2012). Further,
the ionic diffusion models developed to describe scale formation, such as that by Hasson et al.
(1968), reveal the contribution of flow in transport of dissolved ions for scale formation but place
little emphasis on particle deposition in the flowing fluid. For the reuse of treated MWW in
recirculating cooling systems, it is possible that particle deposition will contribute to the fouling
process especially on horizontal condensers (Narayan et al., 2007) since bulk precipitation occurs
due to the high mineral saturation in concentrated cooling water (Liu et al., 2012). In this case,
the influence of flow velocity on particulate fouling over horizontal condensers needs to be
studied to identify appropriate operational conditions to minimize scaling when treated MWW is
used in recirculating cooling systems.
The focus of this study was on crystalline fouling and particulate fouling on a heated
condenser tube surface when tertiary-treated MWW (MWW_pH or MWW_NF) was used as the
recirculating cooling water. Batch tests were conducted to study bulk precipitation behavior of
tertiary-treated MWW as a function of temperature for selected scaling control strategies. Bench-
scale studies in a recirculating cooling system were then conducted to determine chemical
control methods and operational strategies to mitigate scale buildup on hot surfaces.
45
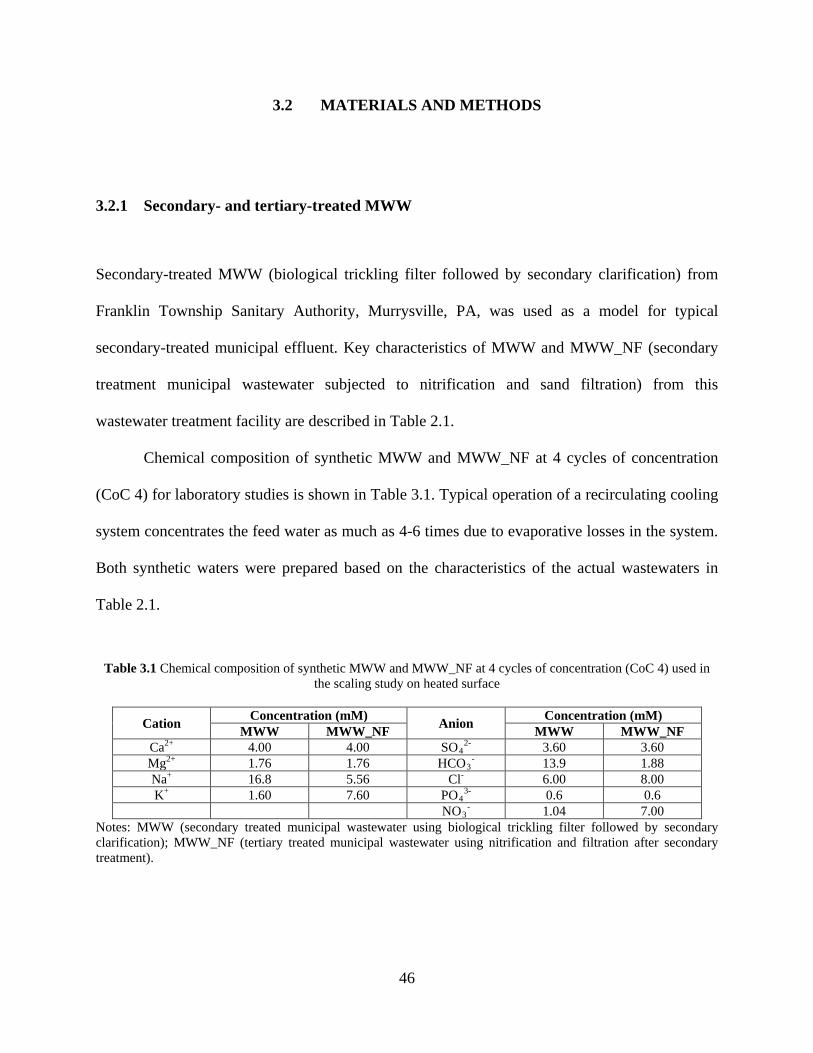
3.2 MATERIALS AND METHODS
3.2.1 Secondary- and tertiary-treated MWW
Secondary-treated MWW (biological trickling filter followed by secondary clarification) from
Franklin Township Sanitary Authority, Murrysville, PA, was used as a model for typical
secondary-treated municipal effluent. Key characteristics of MWW and MWW_NF (secondary
treatment municipal wastewater subjected to nitrification and sand filtration) from this
wastewater treatment facility are described in Table 2.1.
Chemical composition of synthetic MWW and MWW_NF at 4 cycles of concentration
(CoC 4) for laboratory studies is shown in Table 3.1. Typical operation of a recirculating cooling
system concentrates the feed water as much as 4-6 times due to evaporative losses in the system.
Both synthetic waters were prepared based on the characteristics of the actual wastewaters in
Table 2.1.
Table 3.1 Chemical composition of synthetic MWW and MWW_NF at 4 cycles of concentration (CoC 4) used in the scaling study on heated surface
Cation Concentration (mM) Anion Concentration (mM) MWW MWW_NF MWW MWW_NF
Ca2+ 4.00 4.00 SO42- 3.60 3.60
Mg2+ 1.76 1.76 HCO3- 13.9 1.88
Na+ 16.8 5.56 Cl- 6.00 8.00 K+ 1.60 7.60 PO4
3- 0.6 0.6 NO3
- 1.04 7.00 Notes: MWW (secondary treated municipal wastewater using biological trickling filter followed by secondary clarification); MWW_NF (tertiary treated municipal wastewater using nitrification and filtration after secondary treatment).
46

3.2.2 Batch tests
Precipitation behavior of MWW_pH and MWW_NF at CoC 4 was first studied in a 1.4 L beaker
covered with plastic wrap to minimize water loss due to evaporation. The content of the beaker
was completely mixed with a magnetic stirrer and the bulk temperature was controlled at 40°C
(typical bulk water temperature in a recirculating cooling system) or 49°C (typical heat
exchanger surface temperature) using a heating plate (Aull, 2011). The experiments were always
initiated by adding all the salts listed in Table 3.1 except for CaCl2. For the tests intended to
study the precipitation behavior of MWW_pH at CoC 4, the solution pH was first lowered to 6.8
with 0.5 M hydrochloric acid as previous tests have shown that there will be no immediate bulk
precipitation at pH 6.8. After the addition of CaCl2, pH of the synthetic solution was adjusted
and maintained at a desired pH with 0.5 M hydrochloric acid or 0.5 M sodium hydroxide. The
effectiveness of polymaleic acid (PMA, Kroff Chemical Company, Pittsburgh, PA) as a model
antiscalant was tested by adding it to the solution before adding any salts.
Precipitation behavior in the beaker was monitored by withdrawing 5 mL of the solution
at predetermined intervals. The water sample was filtered through a 0.45 µm nylon membrane
and immediately acidified to pH< 2 with concentrated HNO3. Phosphate concentration was
determined by the molybdenum blue method (American Public Health Association et al., 2005).
Precipitated solids were collected, washed with DI water, and air-dried for subsequent
petrographic and chemical characterization. The crystalline characteristics of the solids were
analyzed by X-ray diffraction (XRD, PW1830, Philips Analytical Inc., Natick, MA) with Cu Kα
radiation. Once the diffraction patterns were obtained, both manual matching of the peak
positions and a computer-aided search to identify the crystalline phase were performed. The
morphology of the precipitates was inspected using Scanning Electron Microscopy (SEM,
47
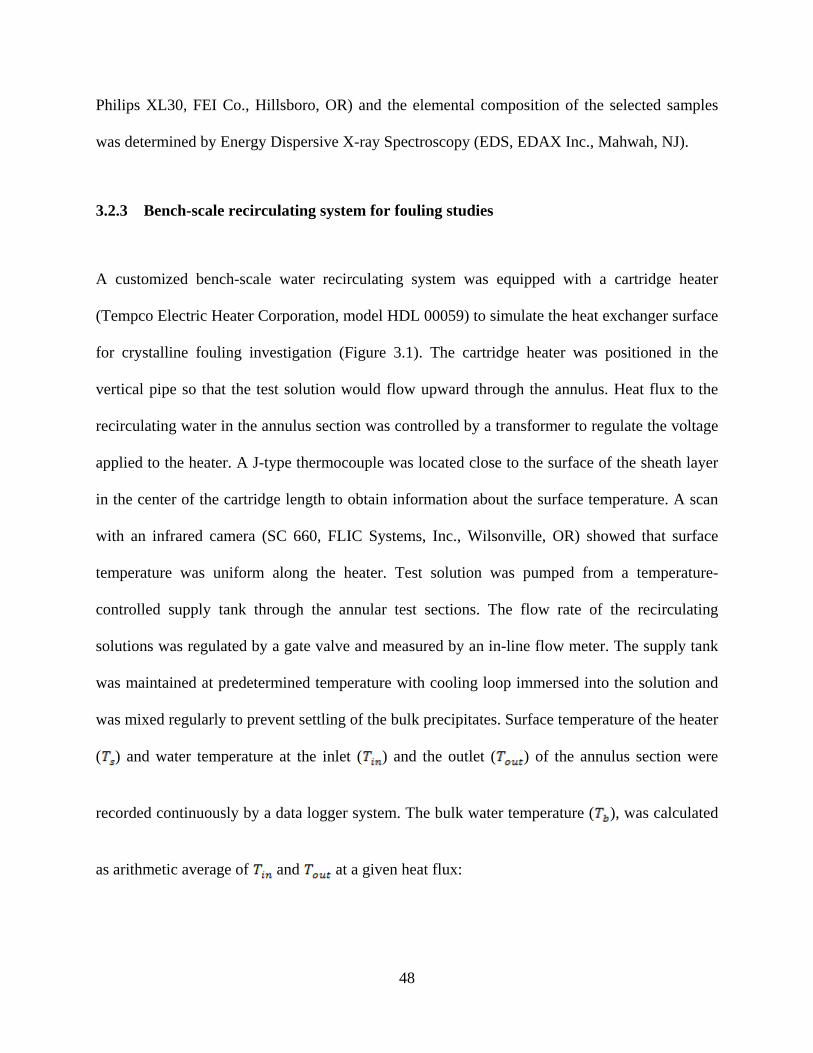
Philips XL30, FEI Co., Hillsboro, OR) and the elemental composition of the selected samples
was determined by Energy Dispersive X-ray Spectroscopy (EDS, EDAX Inc., Mahwah, NJ).
3.2.3 Bench-scale recirculating system for fouling studies
A customized bench-scale water recirculating system was equipped with a cartridge heater
(Tempco Electric Heater Corporation, model HDL 00059) to simulate the heat exchanger surface
for crystalline fouling investigation (Figure 3.1). The cartridge heater was positioned in the
vertical pipe so that the test solution would flow upward through the annulus. Heat flux to the
recirculating water in the annulus section was controlled by a transformer to regulate the voltage
applied to the heater. A J-type thermocouple was located close to the surface of the sheath layer
in the center of the cartridge length to obtain information about the surface temperature. A scan
with an infrared camera (SC 660, FLIC Systems, Inc., Wilsonville, OR) showed that surface
temperature was uniform along the heater. Test solution was pumped from a temperature-
controlled supply tank through the annular test sections. The flow rate of the recirculating
solutions was regulated by a gate valve and measured by an in-line flow meter. The supply tank
was maintained at predetermined temperature with cooling loop immersed into the solution and
was mixed regularly to prevent settling of the bulk precipitates. Surface temperature of the heater
( ) and water temperature at the inlet ( ) and the outlet ( ) of the annulus section were
recorded continuously by a data logger system. The bulk water temperature ( ), was calculated
as arithmetic average of and at a given heat flux:
48
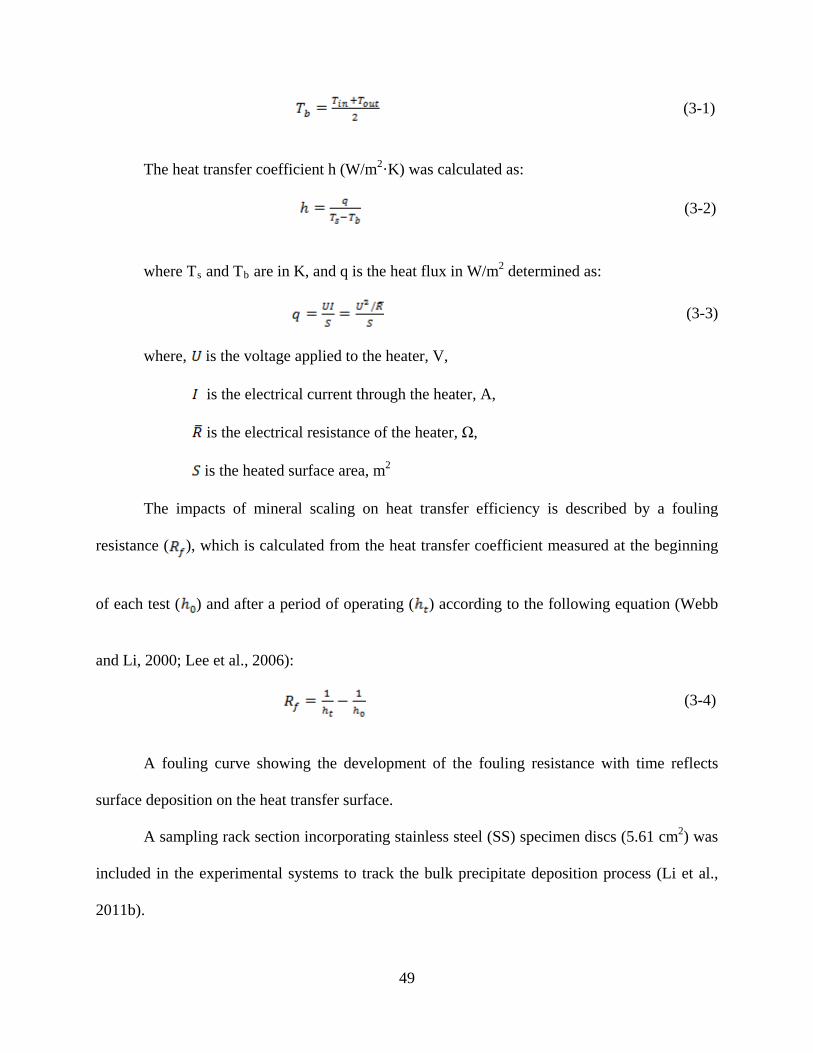
(3-1)
The heat transfer coefficient h (W/m2·K) was calculated as:
(3-2)
where Ts and Tb are in K, and q is the heat flux in W/m2 determined as: (3-3)
where, is the voltage applied to the heater, V,
is the electrical current through the heater, A,
is the electrical resistance of the heater, Ω,
is the heated surface area, m2
The impacts of mineral scaling on heat transfer efficiency is described by a fouling
resistance ( ), which is calculated from the heat transfer coefficient measured at the beginning
of each test ( ) and after a period of operating ( ) according to the following equation (Webb
and Li, 2000; Lee et al., 2006):
(3-4)
A fouling curve showing the development of the fouling resistance with time reflects
surface deposition on the heat transfer surface.
A sampling rack section incorporating stainless steel (SS) specimen discs (5.61 cm2) was
included in the experimental systems to track the bulk precipitate deposition process (Li et al.,
2011b).
49

Figure 3.1 Schematic diagram of the bench-scale recirculating system for fouling studies
In each test, 170 L of distilled water was recirculated in the system and heated by the
cartridge heater to typical cooling tower water temperature. When the temperature in the annular
section reached steady-state, chemicals listed in Table 3.1 were added to the distilled water to
simulate the composition of synthetic MWW and MWW_NF at CoC 4. The procedure for
preparing the test solution was the same as in the batch tests.
Key water quality parameters, including pH and phosphate concentration, were
monitored during each run to provide additional insight into the mechanism of the fouling
process. At the end of each test, bulk precipitates and deposits on the cartridge heater were
collected, washed with DI water, and air-dried for XRD and SEM/EDS analysis. The particle
50

size distribution of the precipitates formed in the bulk solution was analyzed using a particle size
analyzer based on laser diffraction (S3500, Microtrac Inc., Montgomeryville, PA).
Operating parameters utilized in this study are summarized in Table 3.2. Comparison
with typical values in full-scale recirculating cooling systems in power plants (Flynn, D., 2009;
GE Power & Water, 2012; Aull, 2011) indicates that these laboratory-scale tests were conducted
under relevant process conditions.
Table 3.2 Experimental parameters and typical conditions in recirculating cooling systems at thermoelectric power
plants
Experimental Parameters Typical field conditions Heat flux 45840 W/m2 15670 to 47020 W/m2
Flow velocity 1.4 m/s 0.6-2.4 m/s Surface temperature 52±3°C 49~60°C
Bulk water temperature 42±3°C 40~48°C
After the fouling resistance monitoring indicated equilibrium conditions with respect to
crystalline fouling in the test with MWW_NF at pH 7.8, stainless steel (SS) discs (5.61 cm2)
were inserted into the “sampling rack” (Figure 3.1). The discs were withdrawn at predetermined
time intervals to track the particulate fouling on these horizontal sampling surfaces that were
maintained at the same temperature as bulk water. To study the influence of hydrodynamic
conditions on particle deposition, the flow velocity was adjusted to 0.6, 0.5, and 0.4 m/s to
compare the mass gain on the SS discs under different shear force conditions.
51
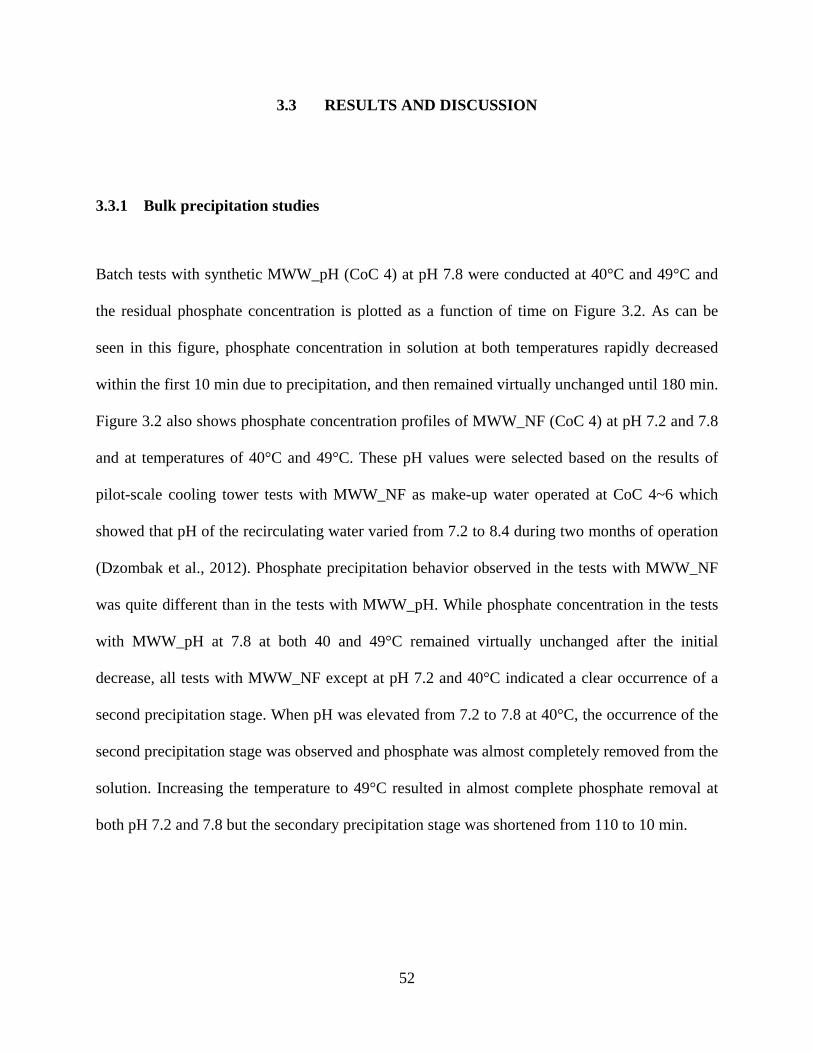
3.3 RESULTS AND DISCUSSION
3.3.1 Bulk precipitation studies
Batch tests with synthetic MWW_pH (CoC 4) at pH 7.8 were conducted at 40°C and 49°C and
the residual phosphate concentration is plotted as a function of time on Figure 3.2. As can be
seen in this figure, phosphate concentration in solution at both temperatures rapidly decreased
within the first 10 min due to precipitation, and then remained virtually unchanged until 180 min.
Figure 3.2 also shows phosphate concentration profiles of MWW_NF (CoC 4) at pH 7.2 and 7.8
and at temperatures of 40°C and 49°C. These pH values were selected based on the results of
pilot-scale cooling tower tests with MWW_NF as make-up water operated at CoC 4~6 which
showed that pH of the recirculating water varied from 7.2 to 8.4 during two months of operation
(Dzombak et al., 2012). Phosphate precipitation behavior observed in the tests with MWW_NF
was quite different than in the tests with MWW_pH. While phosphate concentration in the tests
with MWW_pH at 7.8 at both 40 and 49°C remained virtually unchanged after the initial
decrease, all tests with MWW_NF except at pH 7.2 and 40°C indicated a clear occurrence of a
second precipitation stage. When pH was elevated from 7.2 to 7.8 at 40°C, the occurrence of the
second precipitation stage was observed and phosphate was almost completely removed from the
solution. Increasing the temperature to 49°C resulted in almost complete phosphate removal at
both pH 7.2 and 7.8 but the secondary precipitation stage was shortened from 110 to 10 min.
52

Figure 3.2 Residual phosphate concentrations in batch tests with synthetic MWW (CoC 4) at pH 7.8 and MWW_NF (CoC 4) at pH 7.2 and 7.8 as a function of time with temperature at typical cooling water temperature (40°C) and condenser surface temperature (49°C)
A typical broad peak of amorphous calcium phosphate (ACP) between 2Ө=25° and 35°
was observed in the XRD spectrum (Figure 3.3a) of the precipitate collected from synthetic
MWW_pH at pH 7.8 and 49°C (Alvarez et al., 2004; Cao and Harris., 2008). Morphology of the
amorphous phase precipitated from MWW_pH 7.8 observed in SEM images is shown on Figure
3.4. EDS analysis indicated that the precipitates were mainly composed of Ca and P with a small
amount of Mg and C incorporated (Figure 3.4). Heating the precipitate at 500°C for 1 hr formed
the crystalline structure characteristic of hydroxyapatite as evidenced by XRD spectrum shown
Figure 3.3b.
53

Figure 3.3 XRD pattern of the precipitates from batch tests with synthetic MWW_pH (CoC 4, 49°C) when pH was maintained at pH 7.8: (a) raw sample; (b) raw sample after heating at 500°C for 1 hrs; (c)sample collected for system with 10 ppm PMA after heating at 500°C for 1hrs
Figure 3.4 SEM image and elemental composition of the precipitate formed in batch test with synthetic MWW (CoC 4, 49°C) when pH was maintained at pH 7.8. EDS scan was performed on the area outlined by the square box on the SEM image.
54

Similar XRD pattern was also observed for the precipitate formed in synthetic MWW_pH
at pH 7.8 and 40°C. Based on the results of water analysis and solids characterization by XRD
and SEM/EDS, it can be concluded that amorphous calcium phosphate is the main precipitate
formed in the synthetic MWW_ pH (CoC 4) at typical cooling water temperature (40°C) and
condenser surface temperature (49°C) when pH was maintained at 7.8.
Amorphous calcium phosphate (ACP), Ca3(PO4)2·nH2O, and hydroxyapatite (HAP),
Ca5(PO4)3(OH), are two common types of calcium phosphate minerals (Barat et al., 2011).
Although HAP is the most stable calcium phosphate mineral, formation of more soluble ACP is
favored kinetically because of energy saving in precipitation reactions (Eanes et al., 1965; Castro
et al., 2012). Heating the metastable ACP would enhance the conversion process to HAP and
result in improved resolution of the XRD peaks as shown in Figure 3.3 (Cao and Harries, 2008;
Liu et al., 2001).
The XRD pattern for the precipitates obtained from MWW_NF (CoC 4) maintained at
pH 7.2 and 49°C at selected time intervals are shown in Figure 3.5. The results of phosphate
monitoring in Figure 3.2 and solids characterization in Figure 3.5 clearly support the hypothesis
that the initial phosphate reduction corresponds to rapid precipitation of ACP followed by
transformation of ACP to HAP, which resulted in further phosphate consumption and growth of
the HAP peaks in the XRD spectra. The induction time and rate of ACP transformation into HAP
is influenced by numerous parameters, such as degree of supersaturation, ionic strength, pH,
temperature, and chemical additives (Kim et al., 2004). Shorter induction time and faster
crystallization rate was observed in MWW_NF when pH increased from 7.2 to 7.8 at 49°C
(Figure 3.2) or when temperature increased from 40°C to 49°C at pH 7.8 (Figure 3.2). These
results are in agreement with previous studies (Kibalczyc et al., 1988; Liu et al., 2001).
55

Figure 3.5 XRD pattern of the precipitates collected at 60, 150, and 180 min from batch tests with synthetic MWW_NF (CoC 4, 49°C) when pH was maintained at pH 7.2
In the case of MWW_pH, no distinct conversion of ACP to HAP was observed in this
study. Such behavior could be ascribed to relatively high carbonate alkalinity of this water
(Table 3.1) as previous studies indicated that bicarbonate concentration considerably delayed the
induction period (Ferguson et al., 1973).
Batch tests were also conducted to evaluate the effects of polymaleic acid (PMA) on
mineral precipitation in MWW_pH at 40°C and 49°C and pH 7.8. PMA doses of 5 ppm and 10
ppm were added to synthetic MWW_pH (CoC 4) before pH was adjusted to 7.8. Residual
phosphate concentration was monitored with time as shown in Figure 3.6. It appears that PMA
had no effect on amorphous calcium phosphate formation since the residual phosphate
concentration was almost identical with and without PMA addition. However, even after the
precipitate formed in MWW_pH (CoC 4) maintained at pH 7.8 and 49°C with the PMA dosage
of 10 ppm was heated at 500°C for 1 hr, only a broad peak of ACP was observed in the XRD
56
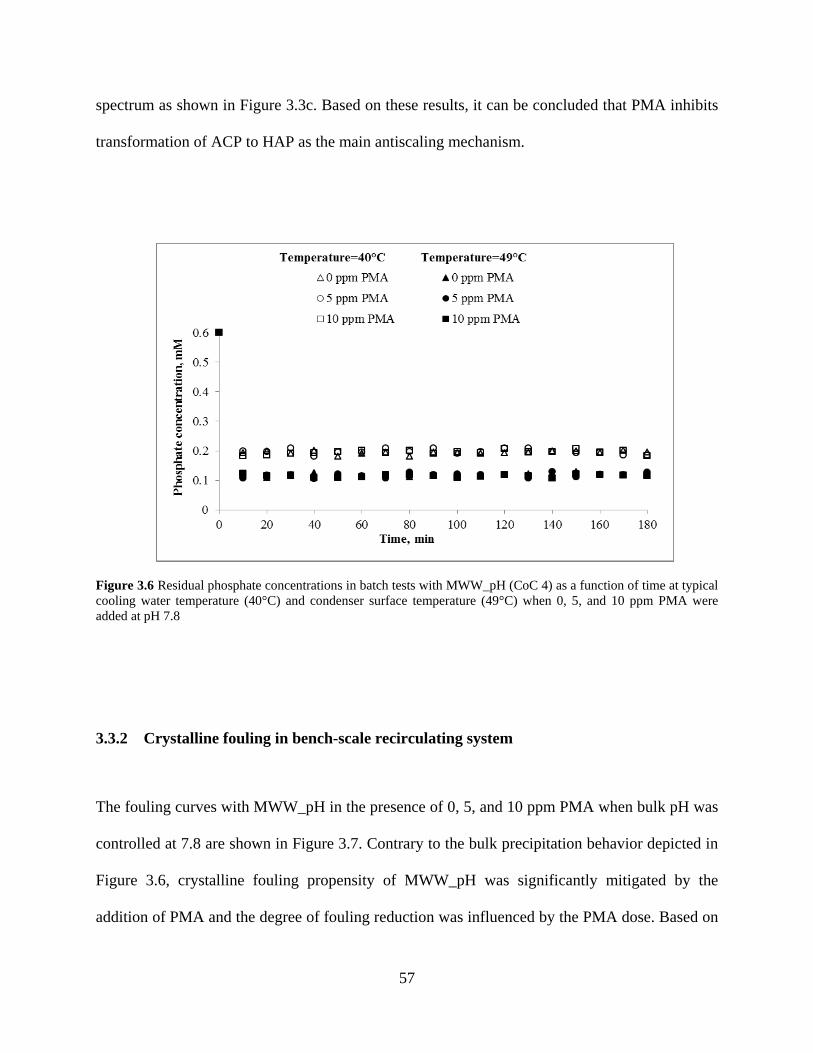
spectrum as shown in Figure 3.3c. Based on these results, it can be concluded that PMA inhibits
transformation of ACP to HAP as the main antiscaling mechanism.
Figure 3.6 Residual phosphate concentrations in batch tests with MWW_pH (CoC 4) as a function of time at typical cooling water temperature (40°C) and condenser surface temperature (49°C) when 0, 5, and 10 ppm PMA were added at pH 7.8
3.3.2 Crystalline fouling in bench-scale recirculating system
The fouling curves with MWW_pH in the presence of 0, 5, and 10 ppm PMA when bulk pH was
controlled at 7.8 are shown in Figure 3.7. Contrary to the bulk precipitation behavior depicted in
Figure 3.6, crystalline fouling propensity of MWW_pH was significantly mitigated by the
addition of PMA and the degree of fouling reduction was influenced by the PMA dose. Based on
57

the XRD patterns depicted in Figure 3.8, it can be concluded that HAP is more likely to form on
the heated surface (Figure 3.8a) while only ACP was identified in the precipitate formed in the
bulk solution (Figure 3.8b). Since HAP is less soluble than ACP, the driving force for HAP
formation was still present even after the bulk precipitation was accomplished, which is the main
reason for mineral scale formation on the vertical heated surface. PMA addition to the system
inhibited the conversion of ACP to HAP on the heated surface as documented by the absence of
HAP spectra in the XRD analysis of the deposits formed during the fouling test with MWW_pH
(CoC 4) and PMA dosage of 10 ppm shown in Figure 3.8c. The decrease in fouling of the heater
was the result of the increase in solubility of phosphate precipitate that predominated in the
system (i.e., ACP).
Figure 3.7 Development of fouling resistance in MWW_pH (CoC 4, 49°C) at pH 7.8 in the presence of 0, 5, and 10 ppm PMA
58
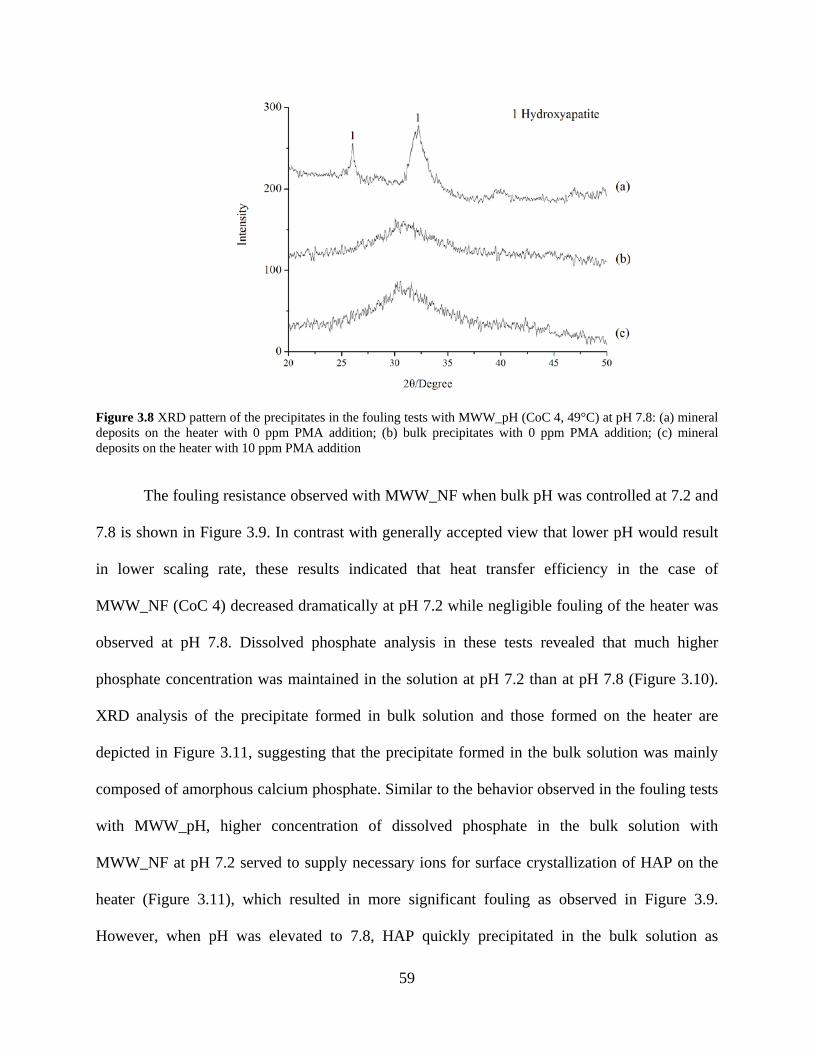
Figure 3.8 XRD pattern of the precipitates in the fouling tests with MWW_pH (CoC 4, 49°C) at pH 7.8: (a) mineral deposits on the heater with 0 ppm PMA addition; (b) bulk precipitates with 0 ppm PMA addition; (c) mineral deposits on the heater with 10 ppm PMA addition
The fouling resistance observed with MWW_NF when bulk pH was controlled at 7.2 and
7.8 is shown in Figure 3.9. In contrast with generally accepted view that lower pH would result
in lower scaling rate, these results indicated that heat transfer efficiency in the case of
MWW_NF (CoC 4) decreased dramatically at pH 7.2 while negligible fouling of the heater was
observed at pH 7.8. Dissolved phosphate analysis in these tests revealed that much higher
phosphate concentration was maintained in the solution at pH 7.2 than at pH 7.8 (Figure 3.10).
XRD analysis of the precipitate formed in bulk solution and those formed on the heater are
depicted in Figure 3.11, suggesting that the precipitate formed in the bulk solution was mainly
composed of amorphous calcium phosphate. Similar to the behavior observed in the fouling tests
with MWW_pH, higher concentration of dissolved phosphate in the bulk solution with
MWW_NF at pH 7.2 served to supply necessary ions for surface crystallization of HAP on the
heater (Figure 3.11), which resulted in more significant fouling as observed in Figure 3.9.
However, when pH was elevated to 7.8, HAP quickly precipitated in the bulk solution as
59

suggested by analysis of solids collected after just 1 hr of reaction time depicted in Figure 3.11.
This observation is consistent with the results from batch tests shown in Figure 3.2 and low
phosphate concentration in solution resulting from HAP formation at pH 7.8 caused negligible
fouling on the vertical heated surface.
Figure 3.9 Fouling resistance for MWW_NF (CoC 4, 49°C) when bulk pH was controlled at 7.8 and 7.2
60

Figure 3.10 Phosphate concentration in the fouling tests with MWW_NF (CoC 4, 49°C) when pH was controlled at 7.8 and 7.2
Figure 3.11 XRD pattern of bulk precipitates and mineral deposits on the heated surface in the fouling tests with MWW_NF (CoC 4, 49°C): (a) precipitates formed in the bulk solution after 1 hr at pH 7.8; (b) mineral deposits on the heater during the test at pH 7.2; (c) bulk precipitates formed in the bulk solution after 12 hr at pH 7.2
61
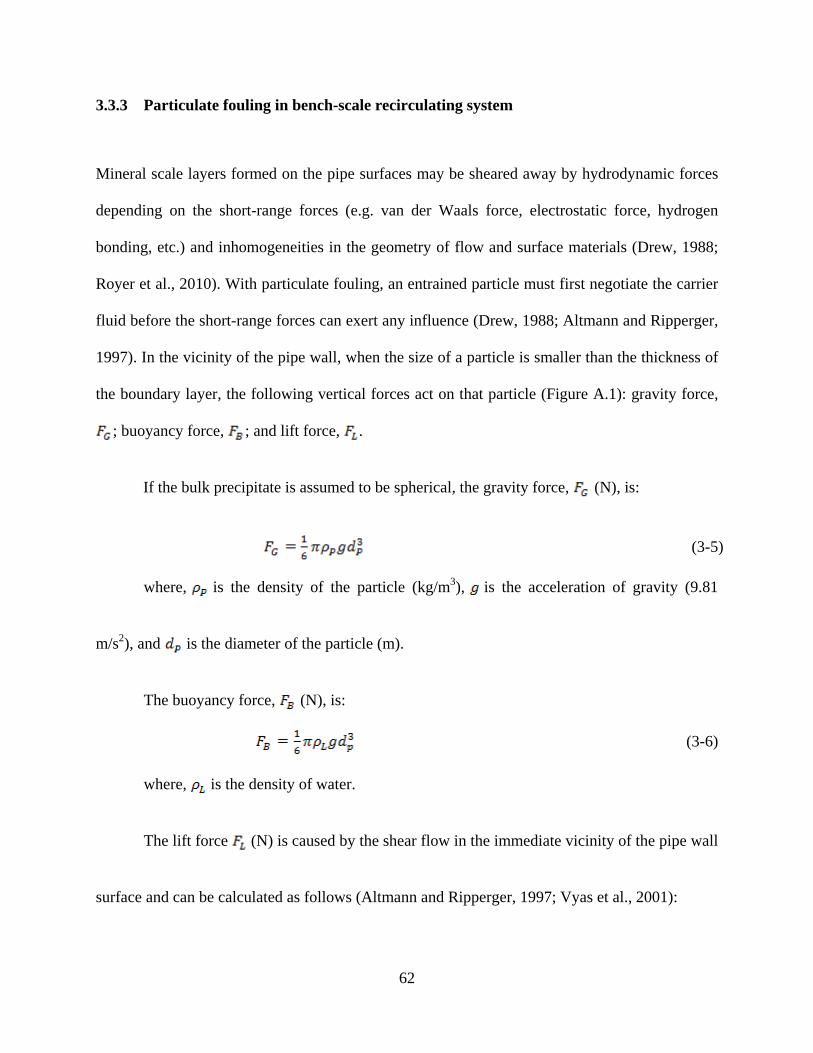
3.3.3 Particulate fouling in bench-scale recirculating system
Mineral scale layers formed on the pipe surfaces may be sheared away by hydrodynamic forces
depending on the short-range forces (e.g. van der Waals force, electrostatic force, hydrogen
bonding, etc.) and inhomogeneities in the geometry of flow and surface materials (Drew, 1988;
Royer et al., 2010). With particulate fouling, an entrained particle must first negotiate the carrier
fluid before the short-range forces can exert any influence (Drew, 1988; Altmann and Ripperger,
1997). In the vicinity of the pipe wall, when the size of a particle is smaller than the thickness of
the boundary layer, the following vertical forces act on that particle (Figure A.1): gravity force,
; buoyancy force, ; and lift force, .
If the bulk precipitate is assumed to be spherical, the gravity force, (N), is:
(3-5)
where, is the density of the particle (kg/m3), is the acceleration of gravity (9.81
m/s2), and is the diameter of the particle (m).
The buoyancy force, (N), is:
(3-6)
where, is the density of water.
The lift force (N) is caused by the shear flow in the immediate vicinity of the pipe wall
surface and can be calculated as follows (Altmann and Ripperger, 1997; Vyas et al., 2001):
62

(3-7)
where, is the shear stress at the tube wall (N/m2), and is the dynamic fluid viscosity
(N·s/m2). For tubes, the shear stress is expressed in terms of the Darcy friction factor and the
mean fluid velocity (Littlejohn et al., 2000):
(3-8)
Combining Equations (3-5)-(3-7), the total vertical force, (N), is:
(3-9)
Equation (3-9) indicates that the occurrence of particulate fouling is mainly determined
by the particle size distribution and hydrodynamic conditions. Positive indicates the
deposition potential of bulk precipitates while little particulate fouling is theoretically feasible in
the case of negative .
Particle size distribution of bulk precipitates formed in MWW_NF (CoC 4, 40°C) at pH
7.8 (Figure 3.12) indicates that these precipitates ranged in size between 5~50 µm. The analysis
of precipitates from other tertiary-treated MWW also showed that their size was below 50 µm
(data not shown) and smaller than the thickness of the laminar boundary layer (Appendix A).
The total vertical force acting on particles in the 1-10 µm and 10-50 µm size ranges in fluid flow
with velocities ranging from 1.4 to 0.4 m/s shown in Figure 3.13 was calculated using Equation
(3-9). This figure shows a positive deposition potential for bulk precipitates at flow velocities
63

below 0.5 m/s while little particulate fouling is theoretically predicted when the velocity is above
0.6 m/s.
Figure 3.12 Particle size distribution of bulk precipitates formed in MWW_NF (CoC 4, 40°C) at pH 7.8
64
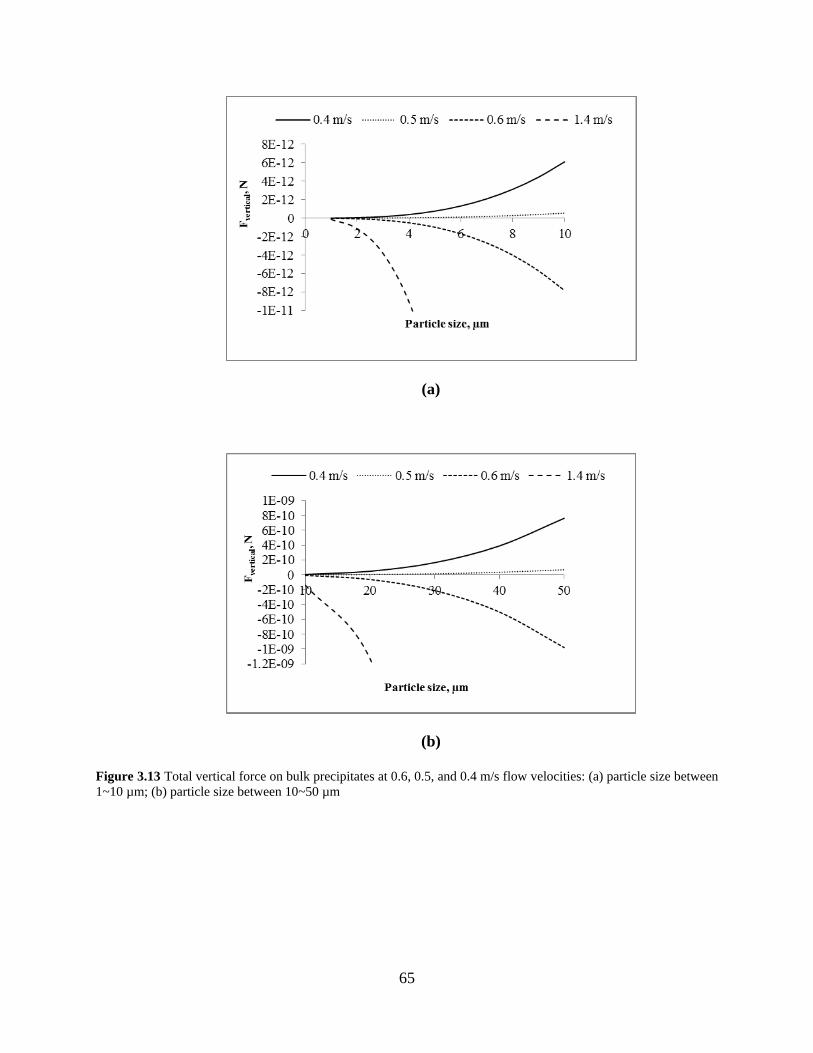
(a)
(b)
Figure 3.13 Total vertical force on bulk precipitates at 0.6, 0.5, and 0.4 m/s flow velocities: (a) particle size between 1~10 µm; (b) particle size between 10~50 µm
65
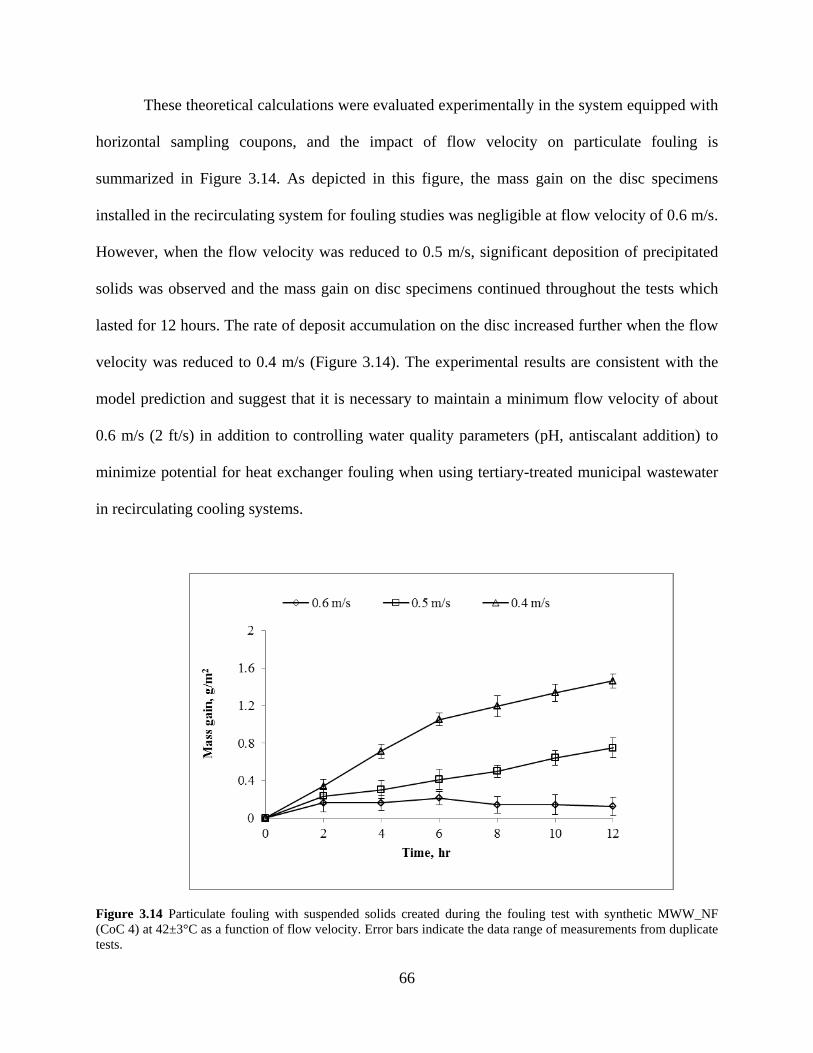
These theoretical calculations were evaluated experimentally in the system equipped with
horizontal sampling coupons, and the impact of flow velocity on particulate fouling is
summarized in Figure 3.14. As depicted in this figure, the mass gain on the disc specimens
installed in the recirculating system for fouling studies was negligible at flow velocity of 0.6 m/s.
However, when the flow velocity was reduced to 0.5 m/s, significant deposition of precipitated
solids was observed and the mass gain on disc specimens continued throughout the tests which
lasted for 12 hours. The rate of deposit accumulation on the disc increased further when the flow
velocity was reduced to 0.4 m/s (Figure 3.14). The experimental results are consistent with the
model prediction and suggest that it is necessary to maintain a minimum flow velocity of about
0.6 m/s (2 ft/s) in addition to controlling water quality parameters (pH, antiscalant addition) to
minimize potential for heat exchanger fouling when using tertiary-treated municipal wastewater
in recirculating cooling systems.
Figure 3.14 Particulate fouling with suspended solids created during the fouling test with synthetic MWW_NF (CoC 4) at 42±3°C as a function of flow velocity. Error bars indicate the data range of measurements from duplicate tests.
66

3.4 SUMMARY AND CONCLUSIONS
This study investigated mineral scaling behavior on heated surfaces and its control when using
tertiary-treated municipal wastewater as alternative cooling system make-up water to replace
freshwater. Two types of tertiary-treated municipal wastewater that were evaluated in this study
included secondary-treated municipal wastewater with pH adjustment (MWW_pH) and
secondary-treated municipal wastewater subjected to nitrification and sand filtration
(MWW_NF). Batch tests revealed that amorphous calcium phosphate (ACP) was the dominant
precipitate formed in MWW_pH at typical cooling water temperature (40°C) and condenser
surface temperature (49°C) when bulk pH was controlled at 7.8. Addition of PMA scale inhibitor
had negligible impact on ACP precipitation. Bench-scale recirculating tests showed that
MWW_pH exhibited significant potential for crystalline fouling on the heated surface because of
the formation of hydroxyapatite (HAP), which is less soluble than ACP. PMA addition was
shown to inhibit the fouling of the heated surface for MWW_pH because it inhibits the
transformation of ACP to HAP.
ACP was the dominant bulk precipitate formed in MWW_NF at typical cooling water
temperature (40°C) at pH 7.2. Elevating the temperature to condenser surface temperature (49°C)
or increasing the pH to 7.8 accelerated the transformation of ACP to HAP. Bench-scale
recirculating tests with MWW_NF revealed significant crystalline fouling of the heated surface
67
by MWW_NF at pH 7.2 while no fouling was observed at pH 7.8. Crystalline fouling at pH 7.2
was due to the fact that only ACP precipitated in the bulk solution leaving a significant potential
for the formation of less soluble HAP on the heated surface. When pH was elevated to 7.8, the
formation of HAP in the bulk solution consumed more scale-forming phosphate ions and
reduced the driving force for crystalline fouling on the heated surface.
Particulate fouling is governed by the precipitate size distribution and hydrodynamic
conditions. Both theoretical analysis and experimental studies showed that particle fouling can
be inhibited by increasing the flow velocity above 0.6 m/s (2 ft/s).
Overall, this study demonstrated that it is possible to manage crystalline fouling and
particulate fouling on hot condenser tube surfaces associated with the use of treated municipal
wastewater through pH control, antiscalant addition and adequate flow regime.
68
4.0 INSIGHTS INTO CALCIUM PHOSPHATE SCALE MITIGATION BY TYPICAL
ANTISCALANTS
This chapter, written by Wenshi Liu and coauthored by Can He, Radisav D. Vidic, and David A.
Dzombak, will be submitted for publication.
69
Calcium phosphate scaling is encountered in many situations in water treatment and wastewater
reuse applications. Amorphous calcium phosphate (ACP), Ca3(PO4)2·nH2O, and hydroxyapatite
(HAP), Ca5(PO4)3(OH), are two common types of calcium phosphate minerals formed by
calcium and phosphate (Barat et al., 2011). Literature on the effects of antiscalants on calcium
phosphate precipitation is limited. In this study, two types of antiscalants, polymaleic acid
(PMA) and 1-hydroxyethane 1,1-diphosphonic acid (HEDP), were evaluated with regard to their
ability to inhibit calcium phosphate precipitation. The tests revealed that both PMA and HEDP
exhibited negligible impact on ACP formation but could delay or inhibit the transformation of
ACP to HAP. The inhibition mechanism of PMA and HEDP was mainly ascribed to their ability
to prevent aggregation of ACP precipitates during the induction period. A further analysis
showed that PMA induced negative surface charges on ACP particles and caused strong
electrostatic repulsive forces to disperse ACP precipitates. However, HEDP had minimal effect
on electrostatic repulsion and its function might be due to the hydration force associated with
phosphonate groups in the structure.
4.1 INTRODUCTION
Secondary-treated municipal wastewater (MWW) has elevated levels of phosphate from mostly
anthropogenic sources, especially domestic and industrial sewage. This relatively high
concentration of phosphorus (10-48 mg/L) when compared to freshwater is critical as it leads to
calcium phosphate scaling in the system and promotes microbiological growth. Previous studies
70
with MWW as the sole source of make-up water for recirculating cooling systems have shown
that calcium phosphate was the main mineral scale formed when calcium carbonate was
effectively inhibited by pH adjustment (Wijesinghe et al., 1996; Liu et al., 2012). In other
wastewater reuse applications, calcium phosphate scaling also limited the widespread application
of reverse osmosis (RO) purification of MWW for irrigation purposes (Greenberg et al., 2005;
Bartels et al., 2005). Even with traditional water sources for cooling system use, a long-term
fouling study over a operation period for 2500 h identified calcium phosphate scales on the
condense tubes (Webb and Li, 2000; Li and Webb, 2000). As the most insoluble calcium scales,
calcium phosphate is a serious problem in many aspects of water treatment and wastewater reuse
applications. However, its precipitation from aqueous solution received only minor attention in
recent studies focused on mineral scaling mitigation (Andritsos et al., 2002).
Addition of chemicals that serve as antiscalants is still the most effective means for
mineral scaling mitigation. It is hypothesized that in supersaturated solutions of sparingly soluble
salts, a significant delay in crystal nucleation and subsequent growth would occur in the presence
of antiscalants added at a dosage of 1-10 ppm (Shih et al., 2004). Although antiscalants have
been used for more than 150 years, the fundamentals of inhibition mechanisms are still
inadequately understood (Hasson et al., 1997; Al Nasser et al., 2011). This is especially the case
for calcium phosphate scale, since the available information on the effects of the antiscalant
treatment with regard to this scale is sometimes conflicting (Greenberg et al., 2005). Five
commercial antiscalants were proven to be ineffective in mitigating the membrane permeability
decay caused by calcium phosphate scales (Greenberg et al., 2005). However, other studies
suggested that common antiscalants like polyacrylic acid (PAA), 1-hydroxyethane 1,1-
diphosphonic acid (HEDP), and 2-phosphonobutane-1,2,4-tricarboxylic acid (PBTC) could
71
inhibit calcium phosphate precipitation significantly and the inhibition efficiency improved with
the increase in dosage up to a certain level known as “threshold dosage” (Amjad, 1989; Fu et al.,
2011). Thus, additional efforts are needed to verify the function of antiscalants for calcium
phosphate and provide guidance on the expected performance of a specific additive in a situation
with high calcium phosphate scaling potential.
The focus of this study was to examine the effects of typical antiscalants on calcium
phosphate precipitation, which has been encountered in numerous water treatment processes
(Wijesinghe et al., 1996; Webb and Li, 2000; Li and Webb, 2000; Bartels et al., 2005; Greenberg
et al., 2005; Liu et al., 2012). A combined analysis of bulk water chemistry, precipitates
mineralogy, and surface characteristics was conducted to obtain insights into potential mitigation
mechanisms of typical antiscalants on calcium phosphate precipitation. This study would
contribute to improve the fundamental understanding on the inhibition mechanism of the
anticalants and provide scientific guidance for the synthesis, evaluation, and application of the
antiscalants in water treatment.
72

4.2 MATERIALS AND METHODS
4.2.1 Test solution
Tertiary-treated MWW (secondary treated municipal wastewater subjected to nitrification and
sand filtration, MWW_NF) from Franklin Township Sanitary Authority, Murrysville, PA, was
used as a model test solution in this study. Key characteristics of MWW_NF from this
wastewater treatment facility are described in Table 2.1. Typical operation of a recirculating
cooling system concentrates the feed water as much as 4-6 times due to evaporative losses in the
system. Test solution in this study as shown in Table 4.1 was prepared to contain the same
calcium concentration, phosphate concentration, and ionic strength as the synthetic MWW_NF at
4 cycles of concentration (CoC 4).
Table 4.1 Chemical compositions of the test solution used in the study for the antiscalants on calcium phosphate precipitation
Ions Ca2+ PO43- Na+ Cl-
Concentration (mM) 4.00 0.6 23.8 31.8
All chemicals in this study were analytical reagent grade, obtained from Fisher Scientific,
Inc. Calcium and phosphate stock solutions were prepared by dissolving calcium chloride
dehydrate and potassium phosphate monobasic in DI water (resistivity > 18 MΩ cm), filtered
through 0.22 µm filter paper.
73

4.2.2 Antiscalants
Presently, three types of scale inhibitors have been widely used in water treatment industry:
polyphosphates (e.g., sodium hexametaphosphate, SHMP), phosphonates (e.g., 1-hydroxyethane
1,1-diphosphonic acid, HEDP), and polyelectrolytes (e.g., polymaleic acid, PMA).
Polyphosphates, such as SHMP, can easily decompose to orthophosphate in aqueous phase,
which would further react with calcium ions to form insoluble calcium phosphate scale.
Phosphonates, as typified by the stable C-P bond, overcome the tendency of polyphosphates to
hydrolyze the O-P chain and increase the hydrolytic stability. Among the numerous
commercially available antiscalants, polyelectrolytes and phosphonates are the two types of
inhibitors extensively used in water treatment industry and essential building blocks in most
antiscalant formulations. In this study, PMA and HEDP were selected as models for
polyelectrolytes and phosphonates, respectively. PMA (50% active content) and HEDP (60%
active content) were provided by Kroff Chemical Company (Pittsburgh, PA). The scaling
inhibitor concentrations were all calculated on the dry basis.
4.2.3 Batch tests
Calcium phosphate precipitation experiments were conducted in a 1.4 L beaker covered with
plastic wrap to minimize water loss due to evaporation. The contents of the beaker were
completely mixed with a magnetic stirrer and the temperature was controlled at a target level
using a heating plate. The experiments were always initiated by adding all the salts listed in
Table 4.1 except for CaCl2. After the addition of CaCl2, pH of the test solution was adjusted and
74

maintained at a desired level with 0.5 M hydrochloric acid or 0.5 M sodium hydroxide. The
effectiveness of antiscalants was tested by adding it to the solution before adding any salts.
Precipitation behavior in the beaker was monitored by withdrawing an aliquot of the
solution at predetermined intervals. The water sample was filtered through a 0.45 µm nylon
membrane and immediately acidified to pH< 2 with concentrated HNO3. The orthophosphate
concentration was determined by the molybdenum blue method (American Public Health
Association et al., 2005) and calcium concentration was measured by Atomic Absorption
Spectroscopy (AAS, 1100B, PerkinElmer Inc., Waltham, MA).
Precipitated solids were collected, washed with DI water, and air-dried for subsequent
petrographic and chemical characterization. The crystalline characteristics of the solids were
analyzed by x-ray diffraction (XRD, PW1830, Philips Analytical Inc., Natick, MA) with Cu Kα
radiation. Once the diffraction patterns were obtained, both manual matching of the peak
positions and a computer-aided search to identify the crystalline phase were performed. The sizes
of the precipitates were determined using dynamic light scattering (DLS). DLS measurements
were made using an ALV/CGS-3 compact goniometer system equipped with a 22 mV HeNe
Laser (λ=632.8 nm) at a scattering angle of 90º. A Zeta PALS QELS instrument (Brookhaven
Instruments Corporation) was used to measure the Zeta potential of precipitated particles.
75
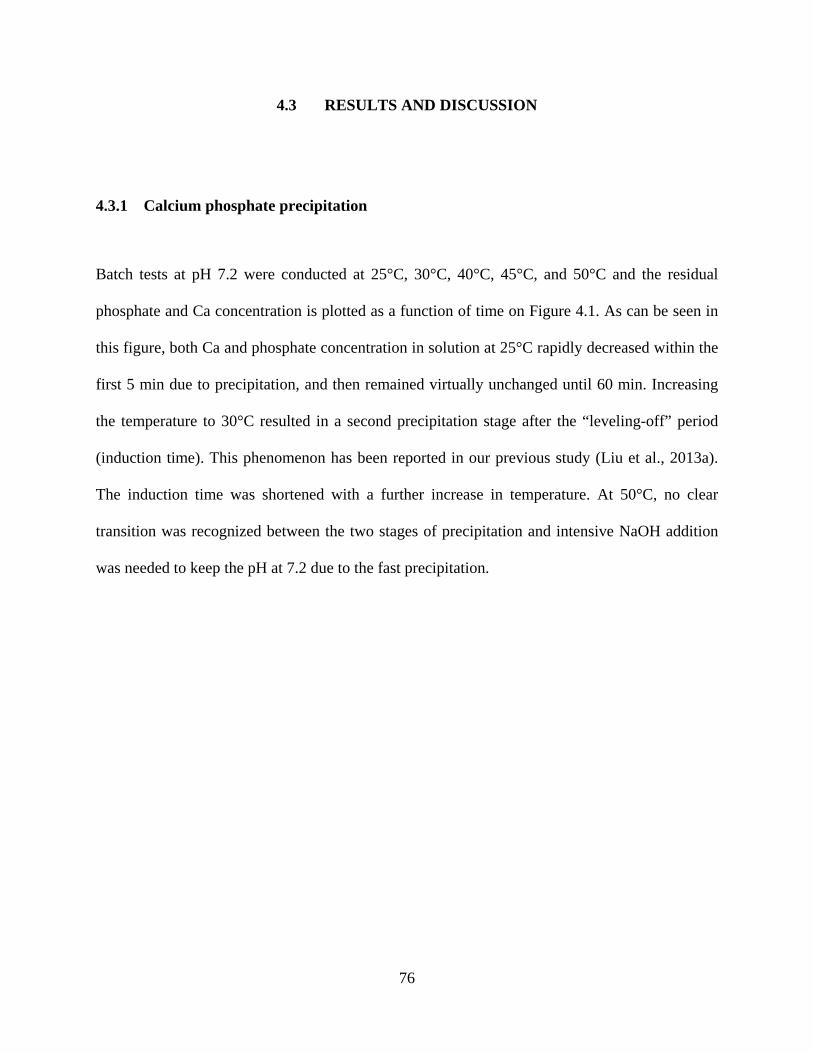
4.3 RESULTS AND DISCUSSION
4.3.1 Calcium phosphate precipitation
Batch tests at pH 7.2 were conducted at 25°C, 30°C, 40°C, 45°C, and 50°C and the residual
phosphate and Ca concentration is plotted as a function of time on Figure 4.1. As can be seen in
this figure, both Ca and phosphate concentration in solution at 25°C rapidly decreased within the
first 5 min due to precipitation, and then remained virtually unchanged until 60 min. Increasing
the temperature to 30°C resulted in a second precipitation stage after the “leveling-off” period
(induction time). This phenomenon has been reported in our previous study (Liu et al., 2013a).
The induction time was shortened with a further increase in temperature. At 50°C, no clear
transition was recognized between the two stages of precipitation and intensive NaOH addition
was needed to keep the pH at 7.2 due to the fast precipitation.
76

(a)
(b)
Figure 4.1 Residual concentrations in batch tests with test solution at pH 7.2 as a function of time with temperature at 25°C, 30°C , 40°C , 45°C , and 50°C: (a) Phosphate; (b) Ca. The data represent mean values based on triplicate measurements with relative stand standard deviation (%RSD) of Ca and phosphate concentration measurements within ±5.3% and ±2.1%, respectively
77

The XRD patterns for the precipitate obtained from test solution maintained at pH 7.2
and 40°C at selected time intervals are shown in Figure 4.2. The results of phosphate and
calcium monitoring in Figure 4.1 and solids characterization in Figure 4.2 clearly suggested the
initial phosphate and calcium reduction corresponds to rapid precipitation of amorphous calcium
phosphate (ACP) observed after 3 min of reaction. Conversion of ACP to the most
thermodynamically stable calcium phosphate mineral, hydroxyapatite (HAP), was initiated at 6
min and HAP continued to dominate solid phase throughout the experiment. By reducing the
temperature to 25°C, only a broad peak of ACP between 2Ө=25° and 35° was observed in the
XRD spectrum (Figure 4.3a) of the precipitate collected from batch tests at pH 7.2 and 25°C
(Alvarez et al., 2004). Heating the precipitate at 500°C for 3 hr improved the crystallization
characteristics, resulting in distinct peaks of HAP in XRD analysis as shown in Figure 4.3b.
Figure 4.2 XRD pattern of the precipitates collected at 3, 8, and 30 min from batch tests at 40°C when pH was maintained at pH 7.2
78

Figure 4.3 XRD pattern of the precipitates from batch test at 25°C when pH was maintained at pH 7.2: (a) raw sample; (b) raw sample after heating at 500°C for 3 hr
As a metastable amorphous precursor, ACP (Ca3(PO4)2·nH2O) has been shown to be
structurally and chemically distinct from HAP (Ca5(PO4)3(OH)). Unlike HAP which has been
studied extensively, the thermodynamic parameters of ACP precipitation are comparatively
limited. Some values of solubility products of ACP at 20°C were reported in several phosphorus
recovery studies (Seckler et al., 1996; Barat et al., 2011). Although, calcium phosphate
precipitation is more prevalent at higher temperature like those of heat exchanger surfaces, little
information is available on the ACP solubility product at other temperatures.
The solubility product, , for ACP is expressed as:
(4-1)
where bracketed quantities represent ion concentrations and, represents ion activities.
79

Phosphate ions would form pairs with Ca2+ and the ion pairs taken into consideration are
CaHPO4 (formation constant Kpair 1=1015.035 at 25ºC, Hpair 1=-3 kJ/mol), CaPO4- (formation
constant Kpair 2=106.46 at 25ºC, Hpair 2=12.97 kJ/mol), CaH2PO4+ (formation constant Kpair
3=1020.923 at 25ºC, Hpair 3=-6 kJ/mol, and CaOH+ (formation constant Kpair 4=10-12.697, Hpair
4=64.11 kJ/mol), while Ca(OH)2 (aq) could be neglected (Wang et al., 2009). The
thermodynamic parameters in the discussion that follows were taken from the database in
MINTEQA2 (Allison et al., 1991)
The term designates total inorganic phosphate that can be expressed as:
(4-2)
The term designates total calcium that can be expressed as:
(4-3)
Equilibrium constants for the phosphoric acid dissociation are given as:
(4-4)
(4-5)
(4-6)
80

where is the ith dissociation constant of phosphoric acid and is the hydrogen ion
activity ). The ionic activity coefficients, of the ionic species with charge valence
were calculated from Debye–Hückel equation:
(4-7)
where is the ionic strength of the test solution.
Equilibrium constants for the ion-pairs formation are given as,
(4-8)
(4-9)
(4-10)
(4-11)
where is the hydroxyl ion activity and were obtained from the ionic product of
water, :
(4-12)
81

By combing Equations (4-1)-(4-12), ACP solubility product can be calculated using
experimentally determined Ca and total inorganic phosphate concentrations. Values of solubility
products of ACP and the associated standard errors at 25°C, 30°C, 40°C, and 45°C obtained
from the data shown in Figure 4.1 are listed in Table 4.2. The plotting of against
(units in K-1) shown in Figure 4.4 shows good agreement with van't Hoff equation assuming
that the standard enthalpy of reaction ( ) is constant in the temperature range of 25ºC-50ºC.
According to the fitted relationship, the solubility product of ACP at 20ºC is calculated to be 10-
26.28, which is in agreement with previous studies (Seckler et al., 1996; Barat et al., 2011).
Table 4.2 Solubility of amorphous calcium phosphate at 25°C, 30°C, 40°C, and 45°C
Temperature (ºC) 25 30 40 45 Solubility product (×1027) 4.16±0.0396 3.61±0.0293 2.22±0.0168 1.878±0.005
82

Figure 4.4 Temperature dependence of amorphous calcium phosphate solubility product (the point at 50°C was obtained from the tests with antiscalants in Section 4.3.2)
4.3.2 Function of antiscalants on the calcium phosphate precipitation
Batch tests were conducted to evaluate the effects of PMA and HEDP on calcium phosphate
precipitation at 40°C and 50°C and pH 7.2 and pH 7.8. A series of PMA and HEDP dosages
were added to the test solution before adding any salts. Residual phosphate concentration was
monitored with time as shown in Figure 4.5. XRD pattern of the selected precipitates are shown
in Figure 4.6. Except for the precipitates included in Figure 4.6, no distinct HAP peaks but a
broad peak of ACP between 2Ө=25° and 35° was observed in the XRD spectrum of all other
precipitates (data not shown).
83

(a)
(b)
84
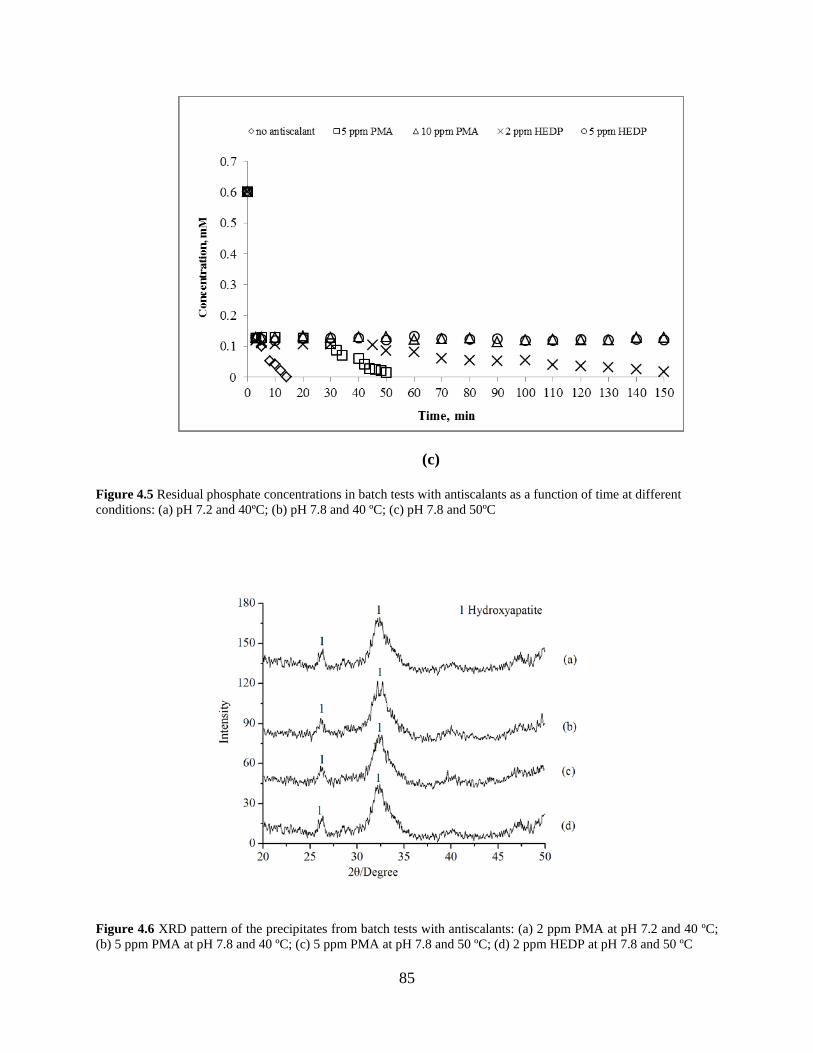
(c)
Figure 4.5 Residual phosphate concentrations in batch tests with antiscalants as a function of time at different conditions: (a) pH 7.2 and 40ºC; (b) pH 7.8 and 40 ºC; (c) pH 7.8 and 50ºC
Figure 4.6 XRD pattern of the precipitates from batch tests with antiscalants: (a) 2 ppm PMA at pH 7.2 and 40 ºC; (b) 5 ppm PMA at pH 7.8 and 40 ºC; (c) 5 ppm PMA at pH 7.8 and 50 ºC; (d) 2 ppm HEDP at pH 7.8 and 50 ºC
85

As shown in Figure 4.5(a), the addition of 2 ppm PMA delayed induction period from
about 5 min to 60 min at pH 7.2 and 40°C. By increasing the PMA dosage to 5 ppm, no
transformation of ACP to HAP was observed all through the tests for 120 min. Under identical
conditions, HEDP dose of 2 ppm could inhibit the transformation for 120 min and further
increase in dosage to 5 ppm did not show any improvement in the inhibitory effects. When pH
was elevated from 7.2 to 7.8 at 40°C, the addition of 5 ppm PMA failed to stop the
transformation of ACP to HAP, but the induction period was delayed and the conversion kinetics
was slower when compared to the control sample as shown in Figure 4.5(b). However, after the
addition of 10 ppm PMA or 2 ppm HEDP, the occurrence of the second precipitation stage was
not observed within 120 min. At pH 7.8 and 50°C, the dosage of HEDP had to be increased to 5
ppm to inhibit the transformation for 120 min. In all the tests, PMA and HEDP had negligible
effects on ACP precipitation but could slow or even inhibit the transformation of ACP to HAP.
Besides, higher dosages of antiscalants were needed to achieve the similar inhibition efficiency
at higher degree of supersaturation, e.g. when pH increased from 7.2 to 7.8 at 40°C or when
temperature increased from 40°C to 50°C at pH 7.8.
4.3.3 Mechanism of antiscalant effect on the calcium phosphate precipitation
The formation of ACP and the transformation of ACP to the most thermodynamically stable
calcium phosphate phase, hydroxyapatite (HAP), remain under extensive debate in spite of
intensive research efforts. In previous studies, the dissolution-reprecipitation (Nylen et al., 1972)
and solution-mediated solid-solid transformation (Boskey and Posner, 1973) mechanisms have
been proposed, since the ACP remains stable in the absence of water. However, an in situ
86
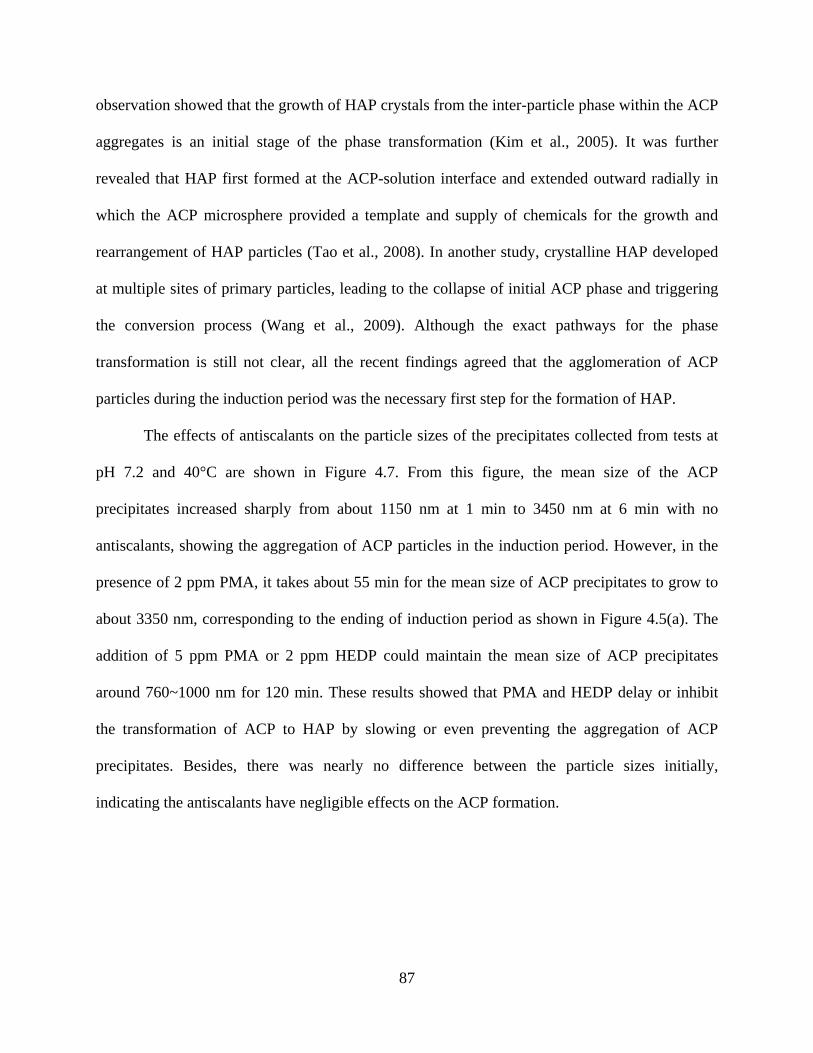
observation showed that the growth of HAP crystals from the inter-particle phase within the ACP
aggregates is an initial stage of the phase transformation (Kim et al., 2005). It was further
revealed that HAP first formed at the ACP-solution interface and extended outward radially in
which the ACP microsphere provided a template and supply of chemicals for the growth and
rearrangement of HAP particles (Tao et al., 2008). In another study, crystalline HAP developed
at multiple sites of primary particles, leading to the collapse of initial ACP phase and triggering
the conversion process (Wang et al., 2009). Although the exact pathways for the phase
transformation is still not clear, all the recent findings agreed that the agglomeration of ACP
particles during the induction period was the necessary first step for the formation of HAP.
The effects of antiscalants on the particle sizes of the precipitates collected from tests at
pH 7.2 and 40°C are shown in Figure 4.7. From this figure, the mean size of the ACP
precipitates increased sharply from about 1150 nm at 1 min to 3450 nm at 6 min with no
antiscalants, showing the aggregation of ACP particles in the induction period. However, in the
presence of 2 ppm PMA, it takes about 55 min for the mean size of ACP precipitates to grow to
about 3350 nm, corresponding to the ending of induction period as shown in Figure 4.5(a). The
addition of 5 ppm PMA or 2 ppm HEDP could maintain the mean size of ACP precipitates
around 760~1000 nm for 120 min. These results showed that PMA and HEDP delay or inhibit
the transformation of ACP to HAP by slowing or even preventing the aggregation of ACP
precipitates. Besides, there was nearly no difference between the particle sizes initially,
indicating the antiscalants have negligible effects on the ACP formation.
87

Figure 4.7 Dynamic changes of mean size of precipitates at pH 7.2 and 40°C with no antiscalant, 2 ppm PMA, 5 ppm PMA, and 2 ppm HEDP
Carboxylic acid polymers like polyacrylic acid (PAA) and PMA and phosphonates like
HEDP have been used as dispersants in colloids solutions for a long time (Lu and Kessler, 2006;
Tulloch, 2011). As precipitation inhibitors, PMA and HEDP functioned by blocking active
crystal growth sites through their complexation with lattice cations, such as calcium (Amjad,
1985; Hasson et al., 2011; Rosenberg et al., 2012). The effects of PMA on the aggregation
potential of ACP precipitates could be understood by the Zeta potential measurement in the
induction time. The Zeta potentials of the ACP precipitates at pH 7.2 and 40ºC were estimated to
be 6.32±2.28 mV in the absence of antiscalants; as shown in Figure 4.8, the ACP precipitates
were changed to be negatively charged with Zeta potentials at -12.1±1.43 mV at the dosage of 2
ppm PMA and further increase in dosage to 5 ppm PMA resulted in more negative surface
charge on the ACP particles (-21.3±1.40 mV). The shift in the Zeta potentials inferred stronger
88
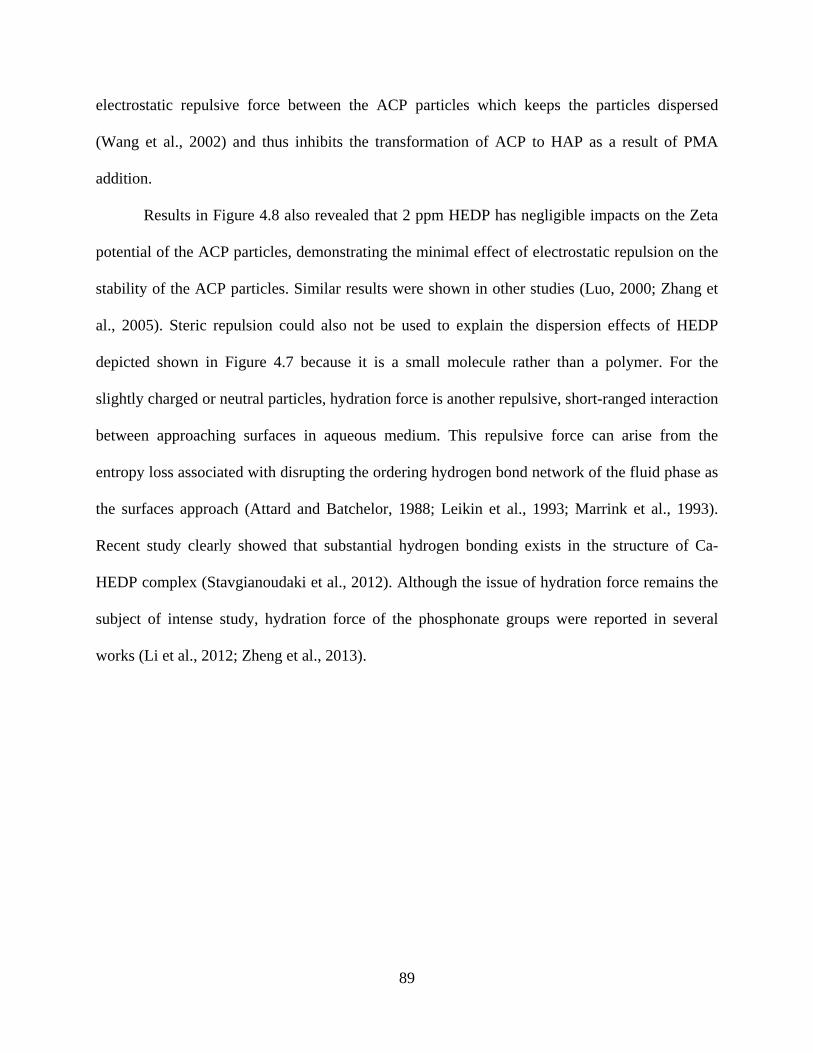
electrostatic repulsive force between the ACP particles which keeps the particles dispersed
(Wang et al., 2002) and thus inhibits the transformation of ACP to HAP as a result of PMA
addition.
Results in Figure 4.8 also revealed that 2 ppm HEDP has negligible impacts on the Zeta
potential of the ACP particles, demonstrating the minimal effect of electrostatic repulsion on the
stability of the ACP particles. Similar results were shown in other studies (Luo, 2000; Zhang et
al., 2005). Steric repulsion could also not be used to explain the dispersion effects of HEDP
depicted shown in Figure 4.7 because it is a small molecule rather than a polymer. For the
slightly charged or neutral particles, hydration force is another repulsive, short-ranged interaction
between approaching surfaces in aqueous medium. This repulsive force can arise from the
entropy loss associated with disrupting the ordering hydrogen bond network of the fluid phase as
the surfaces approach (Attard and Batchelor, 1988; Leikin et al., 1993; Marrink et al., 1993).
Recent study clearly showed that substantial hydrogen bonding exists in the structure of Ca-
HEDP complex (Stavgianoudaki et al., 2012). Although the issue of hydration force remains the
subject of intense study, hydration force of the phosphonate groups were reported in several
works (Li et al., 2012; Zheng et al., 2013).
89

Figure 4.8 Zeta potential of the amorphous calcium phosphate precipitates formed in the test solution at pH 7.2 and 40 ºC in the presence of 0, 2, and 5 ppm PMA and 2 ppm HEDP in the induction time before the transformation of amorphous calcium phosphate (ACP) to hydroxyapatite (HAP)
4.4 SUMMARY AND CONCLUSIONS
This study investigated the function of antiscalants on the calcium phosphate precipitation. Two
types of antiscalants were evaluated in this study, including polyelectrolytes (e.g., polymaleic
acid, PMA) and phosphonates (e.g., 1-hydroxyethane 1,1-diphosphonic acid, HEDP). Both PMA
and HEDP exhibited negligible effects on the amorphous calcium phosphate (ACP) precipitation
but could inhibit the transformation of ACP to hydroxyapatite (HAP). The inhibition effects
could be observed from the prolonged induction period and slower transformation kinetics after
the addition of either antiscalant.
90

Particle size analysis suggests that both PMA and HEDP inhibited the ACP
transformation by preventing the aggregation of ACP particles. Zeta potential analysis showed
that PMA dosage induced negative surface charges on the particles and thus stronger
electrostatic repulsive force to disperse the ACP precipitates. However, HEDP has minimal
effect on electrostatic repulsion between ACP particles. The pathway of the HEDP on the
stability of ACP precipitates might be due to the hydration force caused by the phosphonate
groups.
Overall, this study revealed the function and mechanisms of typical antiscalants in the
calcium phosphate precipitation.
91

5.0 SUMMARY, CONCLUSIONS AND FUTURE WORK
5.1 SUMMARY AND CONCLUSIONS
This study aimed to advance the understanding of scaling behavior of tertiary-treated municipal
wastewater under conditions relevant to cooling system operation and to develop effective
approaches for mineral scaling mitigation. Two types of tertiary-treated municipal wastewater
were evaluated, including secondary-treated water with pH adjustment (MWW_pH), and water
from secondary treatment followed by nitrification and sand filtration (MWW_NF). The specific
objectives of this study were to: 1) determine the main scaling mechanism and effective
mitigation methods for heated and non-heated surfaces in bench-scale studies; 2) understand the
role of hydrodynamic conditions on the scaling processes; 3) study the effectiveness and
mechanism of common antiscalants on mineral scale formation relevant to MWW reuse as
makeup in recirculating cooling systems; and 4) validate the findings from bench-scale studies in
extended pilot-scale cooling tower tests. The main findings were summarized in the following
sections with respect to the four objectives described above.
92
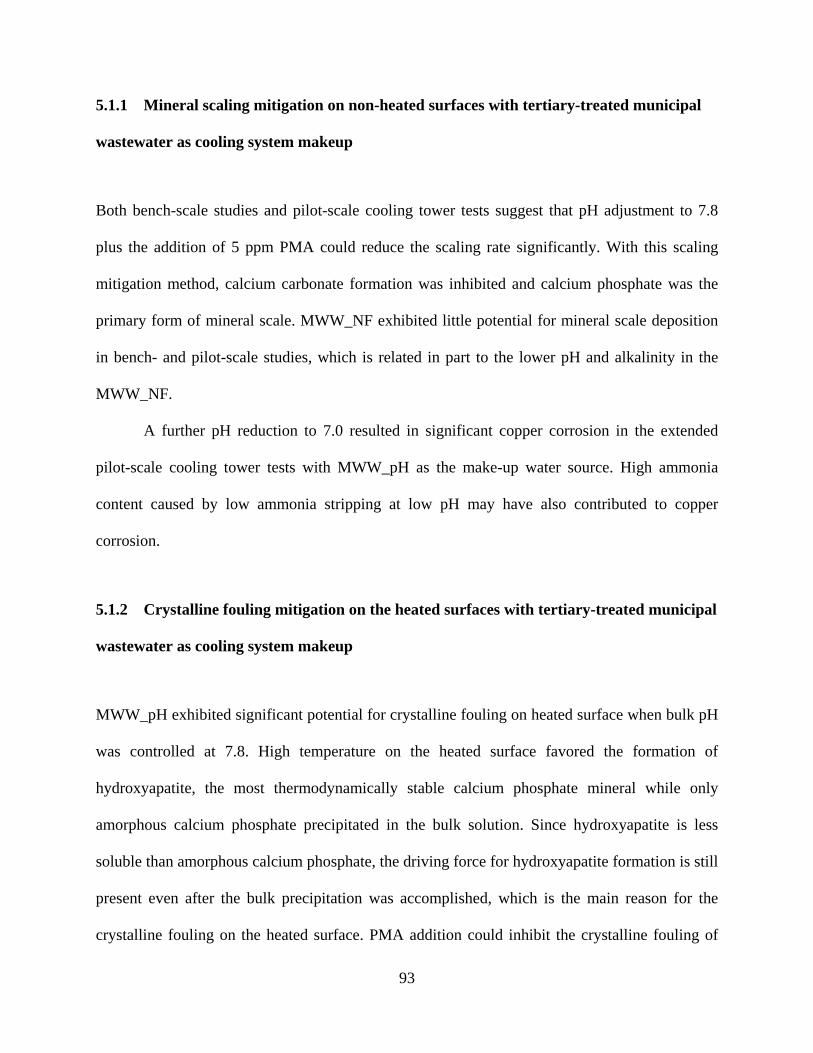
5.1.1 Mineral scaling mitigation on non-heated surfaces with tertiary-treated municipal
wastewater as cooling system makeup
Both bench-scale studies and pilot-scale cooling tower tests suggest that pH adjustment to 7.8
plus the addition of 5 ppm PMA could reduce the scaling rate significantly. With this scaling
mitigation method, calcium carbonate formation was inhibited and calcium phosphate was the
primary form of mineral scale. MWW_NF exhibited little potential for mineral scale deposition
in bench- and pilot-scale studies, which is related in part to the lower pH and alkalinity in the
MWW_NF.
A further pH reduction to 7.0 resulted in significant copper corrosion in the extended
pilot-scale cooling tower tests with MWW_pH as the make-up water source. High ammonia
content caused by low ammonia stripping at low pH may have also contributed to copper
corrosion.
5.1.2 Crystalline fouling mitigation on the heated surfaces with tertiary-treated municipal
wastewater as cooling system makeup
MWW_pH exhibited significant potential for crystalline fouling on heated surface when bulk pH
was controlled at 7.8. High temperature on the heated surface favored the formation of
hydroxyapatite, the most thermodynamically stable calcium phosphate mineral while only
amorphous calcium phosphate precipitated in the bulk solution. Since hydroxyapatite is less
soluble than amorphous calcium phosphate, the driving force for hydroxyapatite formation is still
present even after the bulk precipitation was accomplished, which is the main reason for the
crystalline fouling on the heated surface. PMA addition could inhibit the crystalline fouling of
93

MWW_pH effectively by delaying or blocking the transformation of amorphous calcium
phosphate to hydroxyapatite.
In contrast with generally accepted view that lower pH results in lower scaling rate,
significant crystalline fouling was identified with MWW_NF at pH 7.2 while pH adjustment to
7.8 lead to negligible fouling. High concentration of dissolved phosphate remained in the bulk
solution at pH 7.2 and served to supply necessary ions for surface crystallization of
hydroxyapatite on the heated surface. When pH was elevated to 7.8, low dissolved phosphate
remaining after hydroxyapatite formation in the bulk solution caused negligible crystallization on
the heated surface.
5.1.3 Impact of hydrodynamic conditions on the particulate fouling
A qualitative model was presented to identify optimal hydrodynamic conditions for particulate
fouling control. This model analyzed the forces acting on bulk precipitates and suggested that the
occurrence of particulate fouling is mainly determined by the precipitate size and hydrodynamic
conditions. Modeling showed a positive deposition potential for bulk precipitates at flow velocity
of 0.5 and 0.4 m/s while little particulate fouling was theoretically predicted at 0.6 m/s. The
experimental results from bench-scale studies were consistent with the model prediction.
5.1.4 Mechanism of common antiscalants on the calcium phosphate precipitation
Two types of common antiscalants were evaluated in this study, including polymaleic acid (PMA)
and 1-hydroxyethane 1,1-diphosphonic acid (HEDP). Both PMA and HEDP exhibited negligible
impacts on the amorphous calcium phosphate precipitation, but inhibited the transformation of
94
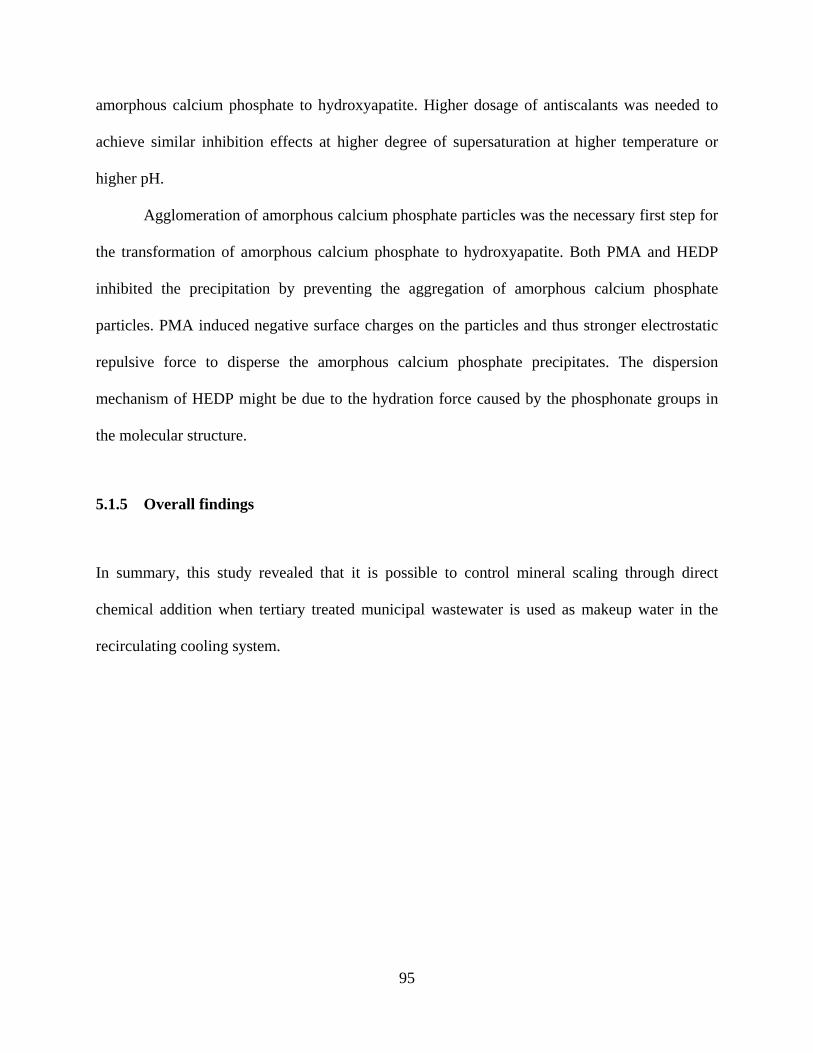
amorphous calcium phosphate to hydroxyapatite. Higher dosage of antiscalants was needed to
achieve similar inhibition effects at higher degree of supersaturation at higher temperature or
higher pH.
Agglomeration of amorphous calcium phosphate particles was the necessary first step for
the transformation of amorphous calcium phosphate to hydroxyapatite. Both PMA and HEDP
inhibited the precipitation by preventing the aggregation of amorphous calcium phosphate
particles. PMA induced negative surface charges on the particles and thus stronger electrostatic
repulsive force to disperse the amorphous calcium phosphate precipitates. The dispersion
mechanism of HEDP might be due to the hydration force caused by the phosphonate groups in
the molecular structure.
5.1.5 Overall findings
In summary, this study revealed that it is possible to control mineral scaling through direct
chemical addition when tertiary treated municipal wastewater is used as makeup water in the
recirculating cooling system.
95
5.2 KEY CONTRIBUTIONS
This study contributes to better understanding of the formation and inhibition of mineral scales,
with emphasis on engineering development for mineral deposition control needed for successful
wastewater reuse in industrial cooling.
The specific contributions of this dissertation are summarized below:
• Provided scientific evidence and understanding, through bench- and pilot-scale studies, of
the mineral scale formation and inhibition in treated municipal wastewater as alternative
makeup water for power plant cooling.
• Developed a bench-scale recirculating system for convenient and sensitive study of the
effects of mineral scaling on heat transfer efficiency loss.
• Proposed and validated a qualitative model to predict the deposition of bulk precipitates
under different hydrodynamic conditions.
• Investigated the function and mechanism of PMA and HEDP on calcium phosphate
precipitation.
• Obtained the solubility products of amorphous calcium phosphate in the range of
25°C~50°C.
96
5.3 FUTURE DIRECTIONS
This study points to a promising future for wastewater reuse in power plant cooling systems with
respect to mineral scaling control. To extrapolate the scope of this work in the areas of
evaluation and mitigation of mineral scaling, several directions for future work are suggested
below:
5.3.1 Development of a predictive model for heat exchanger fouling when treated
municipal wastewater is used as cooling makeup
The costs of heat exchanger fouling due to cleaning, additional hardware, and loss of production
was estimated to be in the range of 0.4-2.2 Million (USD 2009) (Walker et al., 2012). Because
fouling resistance varies with cooling water quality, operating conditions, and time, it is
necessary to understand the fouling trends of heat exchangers to determine reasonable cleaning
schedule. Besides, during the design stage, a common practice is to prescribe a fouling factor on
the heat transfer surfaces where fouling is anticipated to provide an allowance for fouling.
Several models have been reported on the fouling prediction in heat exchangers. The
ionic diffusion model developed by Hasson et al. (1968) divided the mineral scaling into several
processes: nucleation, diffusion, crystallization, and molecular ordering of the crystal lattice. By
equating the rates of the individual processes, an over-all equation of CaCO3 deposition rate can
be obtained from the model. In this model, the sale growth rate is related with the bulk
concentration of bicarbonate ion, calcium ion, and dissolved CO2. However, this model has not
considered the removal process caused by the flowing fluid and thus can only be applied in the
97
situation when the flow velocity is low (Branch and M ller-Steinhagen, 1991). Tests also
showed that the ionic diffusion model, which is for pH>10, would underpredict the deposition
rate for scaling solution with pH below 9 (Andritsos et al., 1996; Khan et al., 2001). Besides, the
model only related the scale growth rate with water quality but no information on the heat
transfer efficiency loss caused by mineral deposition can be obtained. There were also other
analytic (Wakinson and Martinez, 1975; Chan and Ghassesmi, 1991) and semi-analytic (Khan et
al., 2001) models based on their particular studies to estimate the fouling behavior in heat
exchangers. Overall, these models did not always give good agreements with experimental
results (Kim et al., 2002).
The sources contributing to fouling factor for heat exchanger design are still the values
suggested by Tubular Exchanger Manufacturers Association (TEMA) (Bansal et al., 2001).
These values are specified for only a handful of applications (water and hydrocarbon streams)
and have changed little since their first publication. Heat exchangers designers, therefore,
frequently have to use estimated fouling resistances similar to the TEMA values or rely on
experience with similar installations in the past.
It has to be noted that fouling prediction is still a major unresolved problem.
Understanding, and being able to predict, the characteristics of scale and fouling development
precisely is necessary for reliable design and uninterrupted operation of the heat exchangers.
This is especially the case for the cooling systems with treated MWW as makeup water because
of its low water quality.
Along this direction, it will be particularly meaningful to explore the following:
- Collect the thermodynamic and kinetic parameters under conditions relevant to MWW
reuse in cooling systems. Several studies (Chong and Sheikholeslami, 2001;
98
Sheiholeslami and Ng, 2001; Sheiholeslami, 2003) revealed that the effects of co-
existing chemical species on the precipitation behavior of a particular mineral have not
been studied extensively and the attempts to apply the specific data obtained from simple
aqueous systems to more complex ones containing multiple chemical constituents is
likely to have limited success.
- Obtain more fundamental understanding on the scaling formation. Appendix A provides
some insights into the mineral deposition mechanism. As for the future research,
computational fluid dynamics (CFD) modeling of flow water and heat transfer in
complex heat exchanger geometries, combined with corrections for the effect of
operating parameters (temperature, flow velocity, surface characteristics, etc.), may be
fruitful to understand mineral deposition processes and predict the fouling development.
5.3.2 Elucidation of mineral-antiscalants interactions for improved scaling and corrosion
inhibition
The assessment of the effectiveness for various antiscalants is largely based on empirical tests
and lacks theoretically sound systematic investigation due to the poor understanding of various
antiscaling mechanisms. This study revealed the mechanisms for two common types of
antiscalants in calcium phosphate precipitation. To further study these functions, future work
may focus on the following:
- Formulate a theoretical framework based on molecular dynamics to explain the
precipitation inhibition effects of PMA or other polymeric antiscalants.
99
- Investigate the interactions between cations (e.g. Ca2+, Ba2+, etc.) and phosphonate
groups in aqueous phase and on particle surfaces to improve the understanding of the
role of such interactions in precipitation inhibition and particle dispersion.
- Study the synergistic effects of some antiscalants in corrosion inhibition. Recent studies
showed that some antiscalants can also work as corrosion inhibitors in cooling water
management (Abdel-Gaber et al., 2011; Abd-EI-Khalek et al., 2013). A systematic
investigation on this point will not only reduce operational cost but also help to unveil
the mystery associated with the antiscalants.
Although the antiscalants have been used for a long time, the fundamentals of inhibition
mechanisms are still inadequately understood. Scale inhibition is still closer to being an art than a
science and there is still enough of the “art” remaining to make it a fascinating subject (Darton,
1997). Along this direction, scientific guidance could be provided for the synthesis, evaluation,
and application of the antiscalants in water treatment.
5.3.3 Engineering of substrate surface materials for mineral scaling mitigation
Mineral scale deposition is ultimately a surface phenomenon. Theoretical calculations in
Appendix A showed that the tenacity of the scale would vary with the surface properties. Novel
surfaces for scaling mitigation have been reported in several studies (Yang et al., 2000;
Rosmaninho et al., 2007). However, these studies still provides no conclusive recommendations
for industrial operations. Nevertheless, an improved understanding and development of non-
scaling surfaces, as initiated by nature with the leaves of flowers or the scales of fish, may
achieve more effective and robust scaling inhibition technologies. Knowledge development in
this direction will especially benefit the continuing effort in the novel design of anti-deposition
100

molecules that can be grafted on membrane surfaces, resulting in membrane systems that
effectively separate mineral salts from water without causing significant membrane fouling.
101

APPENDIX A
TWO PATHWAYS FOR MINERAL SCALE FORMATION: SURFACE
CRYSTALLIZATION AND PARTICLE DEPOSITION
A.1 INTRODUCTION AND APPROACH
Mineral scaling can be considered to result from two main processes. The first one is directly
related to the dissolved supersaturated components diffuse towards the flow surface and reacts to
form a scale layer (surface crystallization). The second one is mainly caused by the adhesion of
particles, previously formed in the solution, to the bare surface or to already formed deposit layer
(particle deposition). The predominance of each of these processes is dependent on the solution
and surface characteristics. In order to predict the scaling process and propose reasonable
inhibition strategies, it is necessary to study the mechanism of each process in details.
102
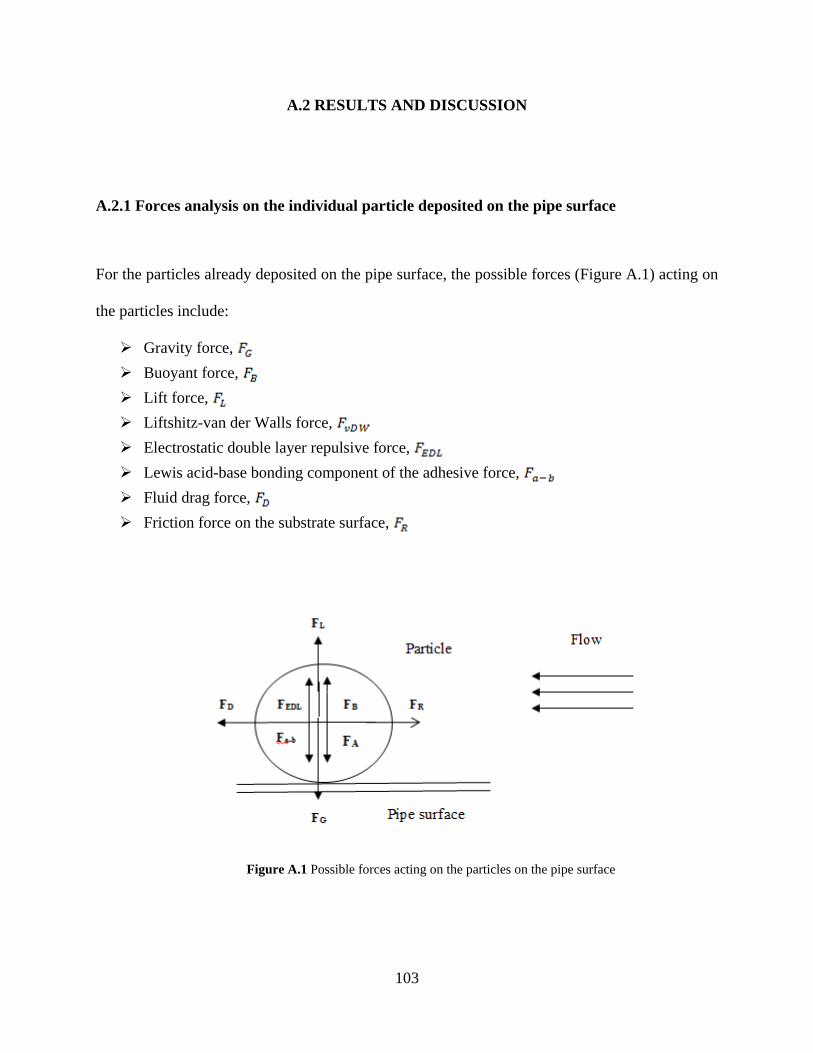
A.2 RESULTS AND DISCUSSION
A.2.1 Forces analysis on the individual particle deposited on the pipe surface
For the particles already deposited on the pipe surface, the possible forces (Figure A.1) acting on
the particles include:
Gravity force, Buoyant force, Lift force, Liftshitz-van der Walls force, Electrostatic double layer repulsive force, Lewis acid-base bonding component of the adhesive force, Fluid drag force, Friction force on the substrate surface,
Figure A.1 Possible forces acting on the particles on the pipe surface
103

For the drag force, , is:
(A-1)
Where, is the density of the particle, g is the gravitational constant, and is the
diameter of the particle
For the buoyant force, , is:
(A-2)
Where, is the density of the water.
For the drag force (Altmann and Ripperger, 1997), :
(A-3)
Where, is the shear stress.
The shear stress is given as,
(A-4)
Where, is the Darcy friction factor and is the mean flow velocity.
For the lift force, , is:
(A-5)
Where, is the dynamic viscosity of the water.
104

The Liftshitz-van der Waals interaction potential energy between the particles and
surface is (Berg, 2010):
(A-6)
Where, is the interactive potential, is the effective Hamaker constant, is the
radius of the spherical particle, and is the distance of closed approach between particle and
surface.
In the cases of ,
(A-7)
In details, the effective Hamaker constant, , is:
(A-8)
The effective Hamaker constant describes the attractive interactive potential
between the particles (1) and the substrate (2) when immersed in an aqueous medium (3)
(Royer et al., 2010).
For the electrostatic double layer repulsive force, the traditional way is to use Derjaguin
integration method with DLVO theory. The electrostatic double layer interaction energy
between a sphere (S) and a flat plate (P) could be described as follows (Hoek and Agarwal,
2006):
(A-9)
105
Where, is the dielectric constant, the value is 69.94 at 50°C; is the permittivity of
free space, 8.854×10⁻¹² C V-1 m-1; is the electron charge, 1.6021765 × 10⁻¹⁹ C; is the
surface potential of the charged flat plate; is the surface potential of the charged particle; is
the Debye parameter; is the closest approach and is typically taken to be approximately 0.4
nm (Rimai et al, 2000).
Then,
(A-10)
Debye parameter, , could be given as (Berg, 2010):
(A-11)
Where, is the electron charge, 1.6021765 × 10⁻¹⁹ C; is the Avogadro's constant =
6.0221415 × 10²³; is the ionic strength.
Another possible function between the particles and the surface is the Lewis acid-base
interaction. Different form apolar Lifshitz-van der Waals interation, Lewis acid-base (AB)
interactions (include the special case of hydrogen donor-hydrogen acceptor interaction)
consider the electron acceptor-electron donor interactions (Van Oss et al., 1988). The Lewis
acid-base bonding component of the work of adhesion, is given by:
(A-12)
106
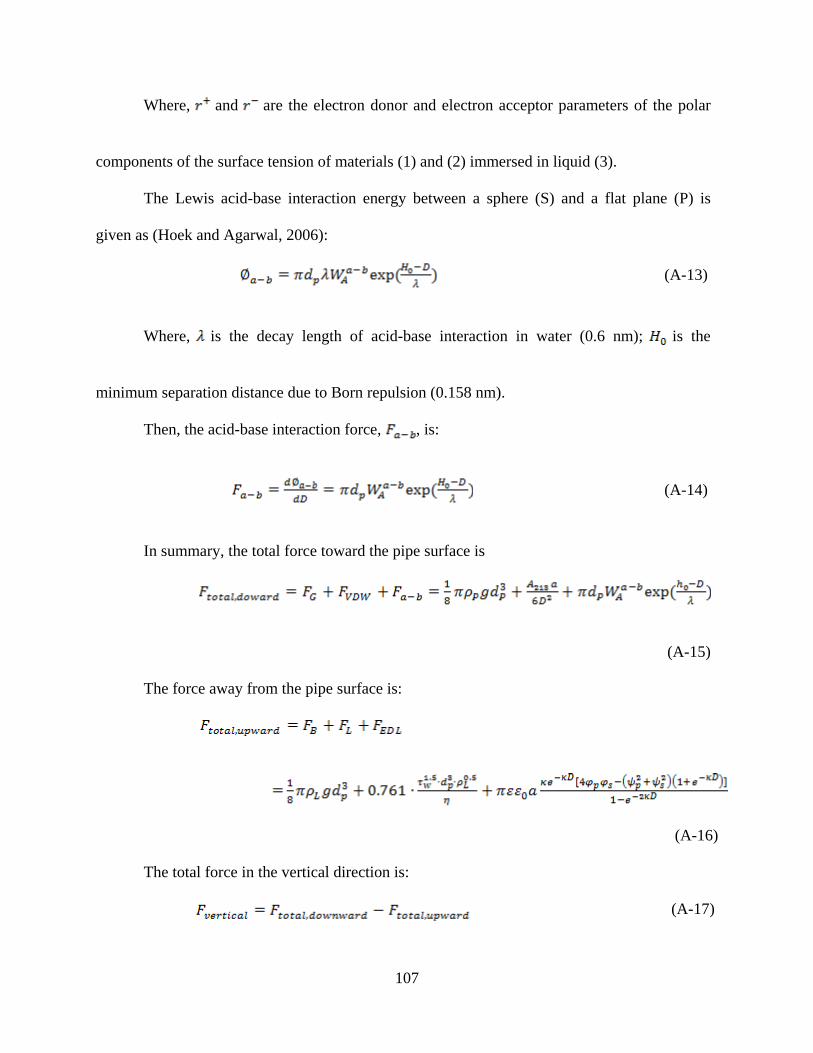
Where, and are the electron donor and electron acceptor parameters of the polar
components of the surface tension of materials (1) and (2) immersed in liquid (3).
The Lewis acid-base interaction energy between a sphere (S) and a flat plane (P) is
given as (Hoek and Agarwal, 2006):
(A-13)
Where, is the decay length of acid-base interaction in water (0.6 nm); is the
minimum separation distance due to Born repulsion (0.158 nm).
Then, the acid-base interaction force, , is:
(A-14)
In summary, the total force toward the pipe surface is
(A-15)
The force away from the pipe surface is:
(A-16)
The total force in the vertical direction is:
(A-17)
107
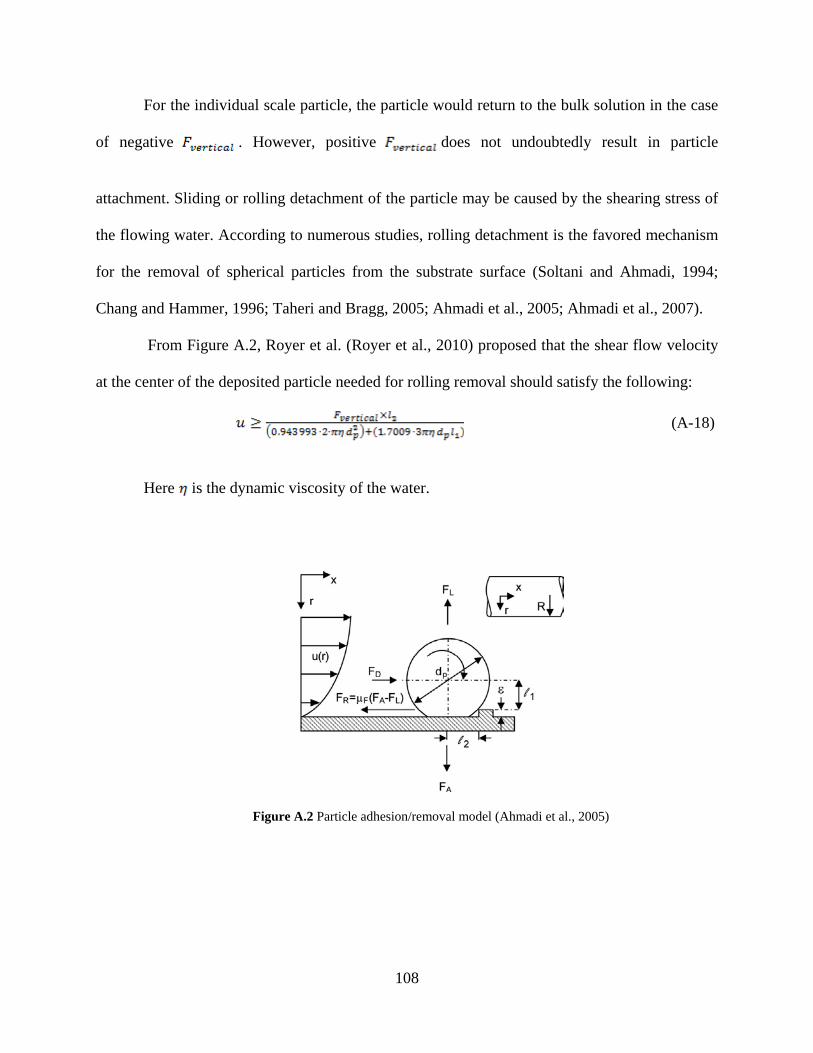
For the individual scale particle, the particle would return to the bulk solution in the case
of negative . However, positive does not undoubtedly result in particle
attachment. Sliding or rolling detachment of the particle may be caused by the shearing stress of
the flowing water. According to numerous studies, rolling detachment is the favored mechanism
for the removal of spherical particles from the substrate surface (Soltani and Ahmadi, 1994;
Chang and Hammer, 1996; Taheri and Bragg, 2005; Ahmadi et al., 2005; Ahmadi et al., 2007).
From Figure A.2, Royer et al. (Royer et al., 2010) proposed that the shear flow velocity
at the center of the deposited particle needed for rolling removal should satisfy the following:
(A-18)
Here is the dynamic viscosity of the water.
Figure A.2 Particle adhesion/removal model (Ahmadi et al., 2005)
108

Figure A.2 showed that the shear flow velocity depends on the pipe surface roughness
( ). The pipe surface roughness would be difficult to characterize and not uniform over the
whole collecting surfaces.
For and , when deformation is negligible,
(A-19)
Under the relationship described by Equation (A-19), the maximum value of the right
part of Equation (A-18) is:
(A-20)
Here we define the critical shear flow velocity to detach the individual scale particle on
the pipe surface as:
(A-21)
Therefore, in the case of positive :
If the flow velocity at the center of the particle , the scale particle will be removed
by the flowing water.
If the flow velocity at the center of the particle , whether the scale particle will
stay or be removed depends on the roughness of the pipe surface.
109

As discussed in the preceding text, negative indicates no retention of the scale
particle on the pipe surface.
A.2.2 Critical shear flow velocity to detach the individual scale particle deposited on the
pipe surface
For the turbulent pipe flow (which is always the case for cooling water at thermoelectric power
plants), a simplified theory was proposed by splitting the tube section into three distinct regions
(Von Kármán, 1939):
• The turbulent core • The laminar sub-layer • The buffer layer between the above two layers
It is in the laminar sub-layer that the velocity gradient and lift force is significant. The
thickness of the laminar sub-layer could be estimated by the following equation (Rama, 2007):
(A-22)
Where, is the kinematic viscosity of the water.
The scenario for the calculation was designed according to the test condition in the
fouling study as shown in Chapter 3: flow rate is set at 0.0003155 m3/s (5 GPM), the diameter of
the pipe is 0.0254 m (1 inch), and the bulk water temperature is maintained around 40°C., the
thickness of the laminar sub-layer, , is (Rama, 2007):
(A-23)
110
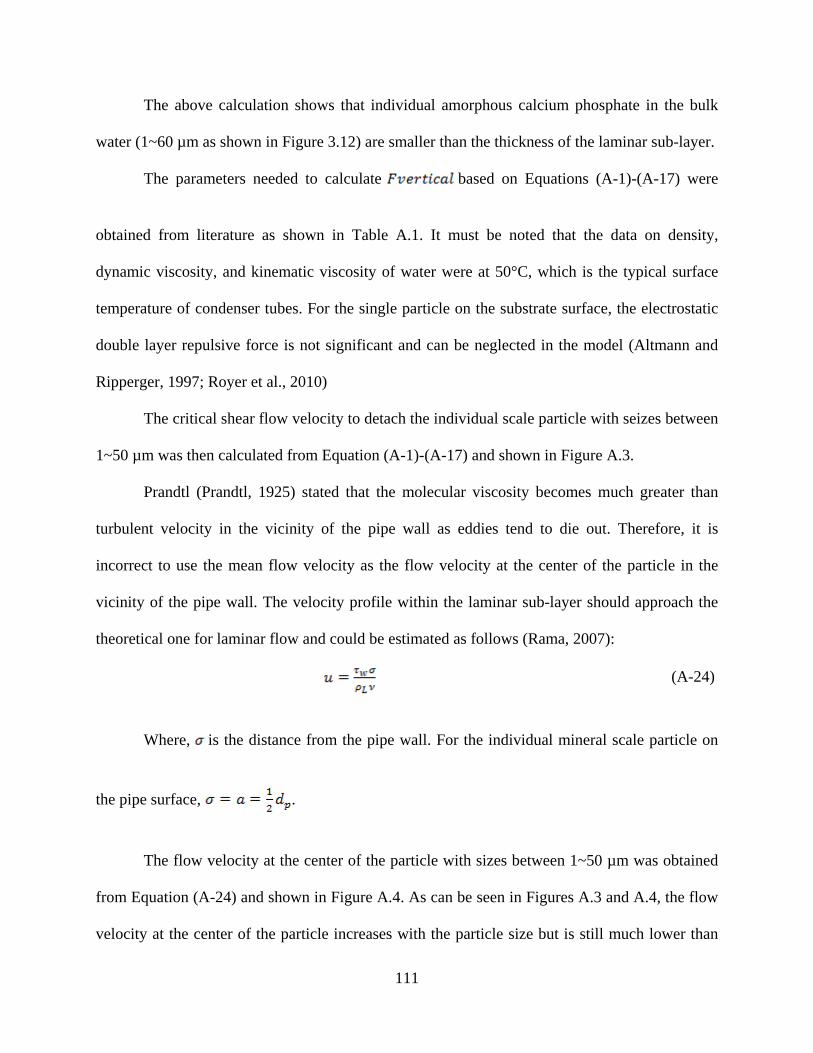
The above calculation shows that individual amorphous calcium phosphate in the bulk
water (1~60 µm as shown in Figure 3.12) are smaller than the thickness of the laminar sub-layer.
The parameters needed to calculate based on Equations (A-1)-(A-17) were
obtained from literature as shown in Table A.1. It must be noted that the data on density,
dynamic viscosity, and kinematic viscosity of water were at 50°C, which is the typical surface
temperature of condenser tubes. For the single particle on the substrate surface, the electrostatic
double layer repulsive force is not significant and can be neglected in the model (Altmann and
Ripperger, 1997; Royer et al., 2010)
The critical shear flow velocity to detach the individual scale particle with seizes between
1~50 µm was then calculated from Equation (A-1)-(A-17) and shown in Figure A.3.
Prandtl (Prandtl, 1925) stated that the molecular viscosity becomes much greater than
turbulent velocity in the vicinity of the pipe wall as eddies tend to die out. Therefore, it is
incorrect to use the mean flow velocity as the flow velocity at the center of the particle in the
vicinity of the pipe wall. The velocity profile within the laminar sub-layer should approach the
theoretical one for laminar flow and could be estimated as follows (Rama, 2007):
(A-24)
Where, is the distance from the pipe wall. For the individual mineral scale particle on
the pipe surface, .
The flow velocity at the center of the particle with sizes between 1~50 µm was obtained
from Equation (A-24) and shown in Figure A.4. As can be seen in Figures A.3 and A.4, the flow
velocity at the center of the particle increases with the particle size but is still much lower than
111

the critical flow velocity to detach the individual scale particle from the pipe wall. This is the
reason why the mineral scales formed through surface crystallization are usually hard and
tenacious. As discussed in Section 3.3.3, an entrained particle in the bulk phase must first
negotiate the carrier fluid before the short-range forces (Van der Waals force, Lewis acid-base
bond, etc.) can exert any influence and little bulk precipitate was observed when the flow
velocity exceeds 0.6 m/s for the particles with sizes between 1~50 µm.
Table A.1 Useful parameters to calculate the forces acting on the individual scale particle deposited on the stainless
steel pipe surface
Symbol Parameters Unit Value Source Density of HAP 3.156×10³ Muralithran and Ramesh, 2000
A11 Hamaker constant of calcium
phosphate 5.4×10⁻²⁰ Morgan et al., 2011
A22 Hamaker constant of stainless
steel 21.67×10⁻²⁰ Hansen and Giddings, 1989
A33 Hamaker constant of water 4.35×10⁻²⁰ Bargeman and van Voorst, 1972
Electron donor of the polar component of the surface
tension of HAP
0.9
Wu and Nancollas, 1998 Electron acceptor of the polar
component of the surface tension of HAP
16
Electron donor of the polar component of the surface tension of stainless steel
1.4
Rosmaninho et al., 2003 Electron acceptor of the polar
component of the surface tension of stainless steel
39.1
Electron donor of the polar component of the surface
tension of water
25.5
Van Oss, 1988 Electron acceptor of the polar
component of the surface tension of water
25.5
Density of water at 50°C 0.98804×10³
Davis and Cornwell, 2008 Dynamic viscosity of water at
50°C
0.547×10⁻³
Kinematic viscosity of water at 50°C
0.554×10⁻⁶
112

Figure A.3 critical shear flow velocity to detach the individual scale particle with seizes between 1~50 µm
Figure A.4 Flow velocity at the center of the particle deposited on the pipe surface with sizes between 1~50 µm
113

A.3 SUMMARY AND CONCLUSIONS
• Surface crystallization leads to hard and tenacious mineral scales. Once they are formed,
normal hydrodynamic conditions would hardly remove the initial layer on the pipe surfaces.
• Hydrodynamic conditions could be adjusted to prevent the deposition of bulk precipitates.
Mineral scales formed through particle deposition are different from those formed resulting from
surface crystallization because they must first negotiate the carrier fluid before the short-range
forces can exert any influence.
• Surface materials may influence the interaction between the scale particles and substrate
surfaces and thus the tenacity of the particle on the pipe walls.
• The relative extent of the surface crystallization and particle deposition in mineral scale
formation is dependent on the saturation states of the solute, hydrodynamic conditions, the type
of scales, and the surface characteristics (e.g. roughness, surface tension components, etc.).
Determining the relative extent is essential to proper modeling and to devise preventive
techniques to combat scaling.
114

APPENDIX B
REPRODUCIBILITY OF THE FOULING RESISTANCE MEASUREMENT IN THE
BENCH-SCALE RECIRCULATING SYSTEM FOR FOULING STUDIES
B.1 MATERIALS AND METHODS
The design and operation of the bench-scale recirculating system for fouling studies is described
in Section 2.3. Synthetic secondary-treated municipal wastewater (MWW) at CoC 4 with no pH
control was used in the recirculating system to test the reproducibility of the fouling resistance
measurement. The chemical composition of synthetic MWW at CoC 4 is shown in Table 3.1.
In each test, 170 L of distilled water was recirculated in the system and heated by the
cartridge heater to typical cooling tower water temperature. When the temperature profile has
stabilized in the annular section, chemical listed in Table 3.1 were added to the distilled water to
start the tests. A fouling curve from the temperature profile monitoring in the annular section was
then obtained to reflect the mineral deposition on the heat transfer surfaces. Two independent
tests were compared to test the reproducibility of the fouling resistance measurement from the
bench-scale recirculating system.
115

B.2 RESULTS AND DISCUSSION
The curves from two independent tests are shown in Figure B.1. The comparison between the
two curves shows that the relative standard deviation (%RSD) of the fouling test system is within
10% for 129 measurements among 145 measurements within 12 hours.
Figure B.1 Development of fouling resistance in MWW (CoC 4) without pH control in two independent test runs
116
APPENDIX C
SCALING MITIGATION FOR MWW_NFG AS MAKEUP FOR COOLING
C.1 INTRODUCTION
Organic matter in cooling system make-up water promotes biofouling and increases biocide
requirements to control biofouling. In addition, organic matter can adsorb on metal surfaces and
contribute directly to fouling. One of the unit processes that can be utilized for the removal of
residual dissolved organic matter is activated carbon adsorption. The main objective in this part
was to identify the effects of TOC removal in a fixed bed granular activate carbon (GAC)
adsorber on scaling behavior of water from secondary-treatment followed by nitrification and
filtration (MWW_NF).
117

C.2 MATERIALS AND METHODS
It was expected that only organic matter in the treated municipal wastewater is influenced
significantly by the GAC treatment. Thus, no batch and bench-scale recirculating system tests
which focused on synthetic treated municipal wastewater composed of mineral contents only
were conducted.
Three pilot-scale cooling towers (Tower A, B, and C) were operated side-by-side at the
Franklin Township Municipal Sanitary Authority (FTMSA, Murrysville, PA) in summer 2011.
MWW_NF after GAC treatment is designated as MWW_NFG and was fed into Tower C while
the other two towers were used as control towers for scaling study. Traditional stainless steel (SS)
coupon discs were immersed in the recirculating water and sampled at a predetermined schedule.
The air-dried SS coupons were dried at 104oC for 3.5 hours and subsequently combusted at
500oC for 3.5 hours in a muffle furnace. The deposits after the combustion were considered as
the inorganic mineral scales. The inorganic deposits on selected SS disc specimens were also
analyzed by SEM/EDS to obtain their elemental composition. In parallel with the solids analysis,
important information about the chemistry of the makeup and recirculating water was recorded
throughout the field tests.
During the field tests, the alkalinity of the MWW_NF was unusually high in the first 15
days resulting in significant mass gain in all three towers (this will be discussed in the following
text). In order to obtain representative information, a new test was initiated on day 16 and lasted
for 12 days when the alkalinity of makeup water was in the normal range. For the sake of
simplicity in discussion, the whole test period was divided into two phases: Phase 1 (day 1 to day
15) and Phase 2 (day 16 to day 28).
118

C.3 RESULTS AND DISCUSSION
Figure C.2 depicts the time course of inorganic mineral scale deposition on the stainless steel
coupon discs in the three cooling towers during the two phases of pilot-scale cooling tests.
As can be seen in Figure C.1, mineral deposition on the stainless steel coupon discs
immersed in Towers A, B, and C for the first 15 days (phase 1) was significant, especially in
Towers A and C. This result was completely inconsistent with the pilot-scale cooling tower tests
with MWW_NF in summer 2010 as shown in Section 4.2. In order to explain these unusual
results, SEM/EDS analysis was first conducted to study the elemental compositions of the
inorganic deposits collected from Towers A, B, and C, as shown in Figure C.2, C.3, and C.4
respectively. These analyses showed that the inorganic deposits were mainly composed of
calcium carbonate and calcium phosphate. In order to provide reasonable explanations for the
significant elevation of mass gain in the first phase, it was necessary to assess the reactions
leading to the formation of calcium phosphate and calcium carbonate individually.
119
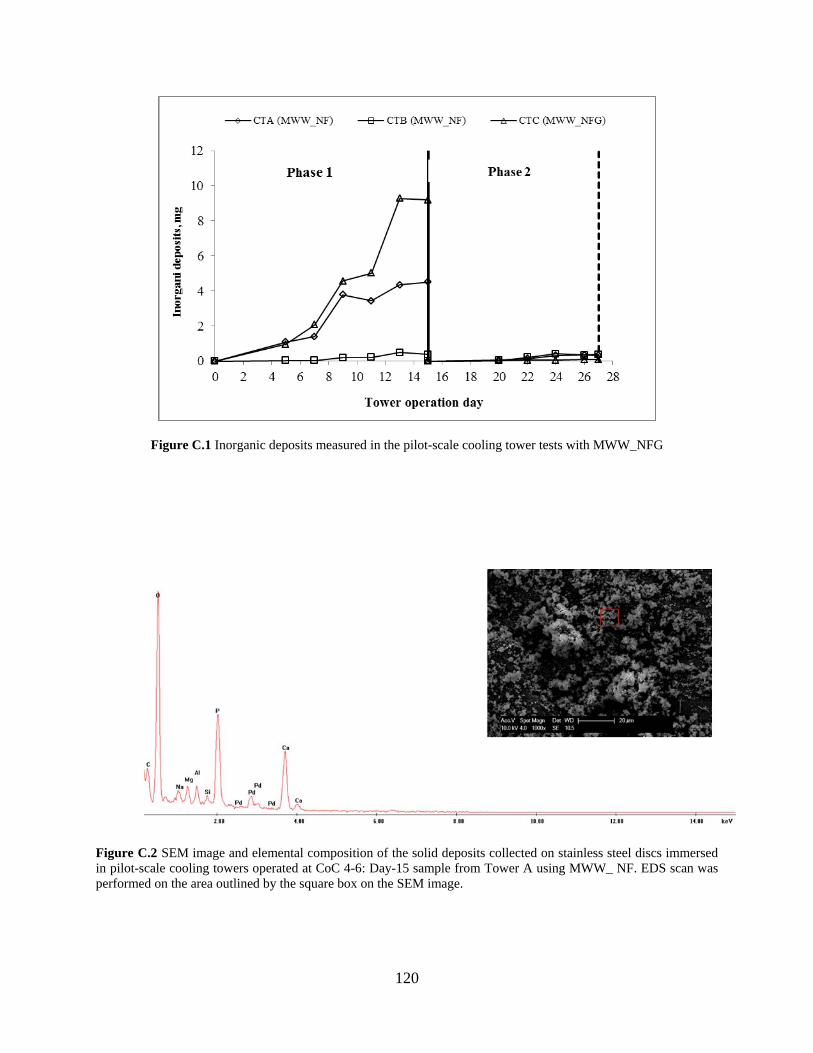
Figure C.1 Inorganic deposits measured in the pilot-scale cooling tower tests with MWW_NFG
Figure C.2 SEM image and elemental composition of the solid deposits collected on stainless steel discs immersed in pilot-scale cooling towers operated at CoC 4-6: Day-15 sample from Tower A using MWW_ NF. EDS scan was performed on the area outlined by the square box on the SEM image.
120

Figure C.3 SEM image and elemental composition of the solid deposits collected on stainless steel discs immersed in pilot-scale cooling towers operated at CoC 4-6: Day-15 sample from Tower B using MWW_ NFG. EDS scan was performed on the area outlined by the square box on the SEM image.
Figure C.4 SEM image and elemental composition of the solid deposits collected on stainless steel discs immersed in pilot-scale cooling towers operated at CoC 4-6: Day-15 sample from Tower C using MWW_ NFG. EDS scan was performed on the area outlined by the square box on the SEM image.
121
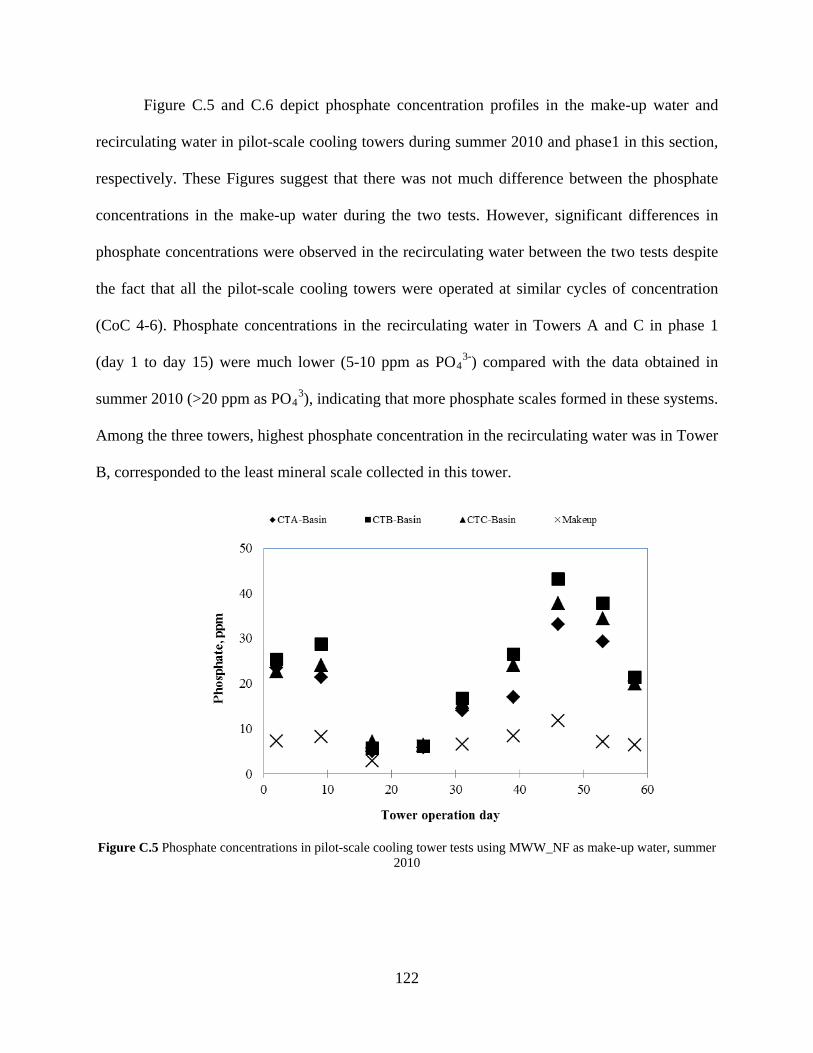
Figure C.5 and C.6 depict phosphate concentration profiles in the make-up water and
recirculating water in pilot-scale cooling towers during summer 2010 and phase1 in this section,
respectively. These Figures suggest that there was not much difference between the phosphate
concentrations in the make-up water during the two tests. However, significant differences in
phosphate concentrations were observed in the recirculating water between the two tests despite
the fact that all the pilot-scale cooling towers were operated at similar cycles of concentration
(CoC 4-6). Phosphate concentrations in the recirculating water in Towers A and C in phase 1
(day 1 to day 15) were much lower (5-10 ppm as PO43-) compared with the data obtained in
summer 2010 (>20 ppm as PO43), indicating that more phosphate scales formed in these systems.
Among the three towers, highest phosphate concentration in the recirculating water was in Tower
B, corresponded to the least mineral scale collected in this tower.
Figure C.5 Phosphate concentrations in pilot-scale cooling tower tests using MWW_NF as make-up water, summer
2010
122
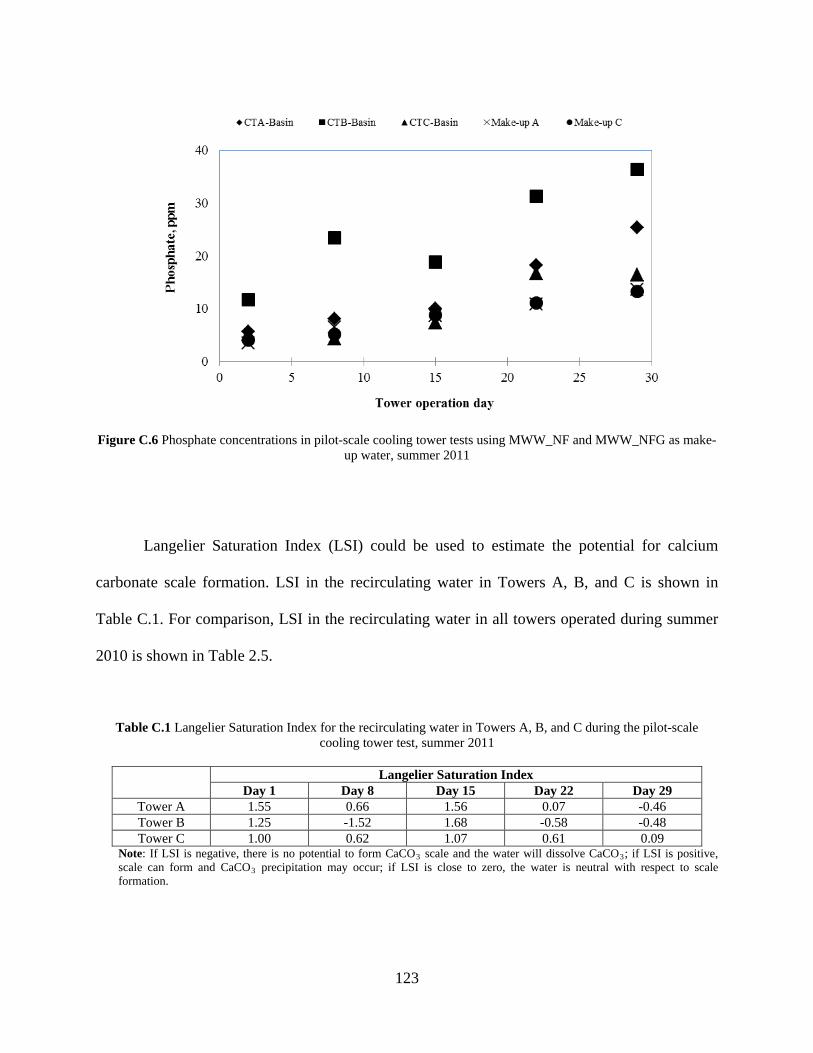
Figure C.6 Phosphate concentrations in pilot-scale cooling tower tests using MWW_NF and MWW_NFG as make-
up water, summer 2011
Langelier Saturation Index (LSI) could be used to estimate the potential for calcium
carbonate scale formation. LSI in the recirculating water in Towers A, B, and C is shown in
Table C.1. For comparison, LSI in the recirculating water in all towers operated during summer
2010 is shown in Table 2.5.
Table C.1 Langelier Saturation Index for the recirculating water in Towers A, B, and C during the pilot-scale cooling tower test, summer 2011
Langelier Saturation Index Day 1 Day 8 Day 15 Day 22 Day 29
Tower A 1.55 0.66 1.56 0.07 -0.46 Tower B 1.25 -1.52 1.68 -0.58 -0.48 Tower C 1.00 0.62 1.07 0.61 0.09
Note: If LSI is negative, there is no potential to form CaCO3 scale and the water will dissolve CaCO3; if LSI is positive, scale can form and CaCO3 precipitation may occur; if LSI is close to zero, the water is neutral with respect to scale formation.
123

Nearly all LSI values for the recirculating water in phase 1 of the pilot-scale test in this
section were positive, indicating that there was a significant potential for the precipitation of
calcium carbonate. On the contrary, Table 2.5 clearly shows that there was no driving force for
the formation of calcium carbonate scale during the experiments conducted in summer 2010.
Positive scaling propensity of calcium carbonate in all three towers operated in summer 2011
arises from high total alkalinity in the recirculating water. A comparison between the total
alkalinity of the recirculating water during phase 1 of the test in 2011 (Figure C.7) and in
summer 2010 (Figure C.8), clearly illustrates significant differences in total alkalinity between
these tests. For example, total alkalinity in the recirculating water in Towers A and C during the
first 15 days in summer 2011 was in the range from 92.8- 215.5 mg/L as CaCO3 and 77.4-199.3
mg/L as CaCO3, respectively. On the other hand, total alkalinity in the recirculating water during
summer 2010 was generally in the range of 50-70 mg/L as CaCO3. The high alkalinity in the
recirculating water was from the unusually high total alkalinity in the make-up water during the
first phase of this section (50.83-77.35 mg/L as CaCO3) while the values were generally in the
range of 14.4-35.2 mg/L as CaCO3 with the MWW_NF as make-up water in summer 2010.
124
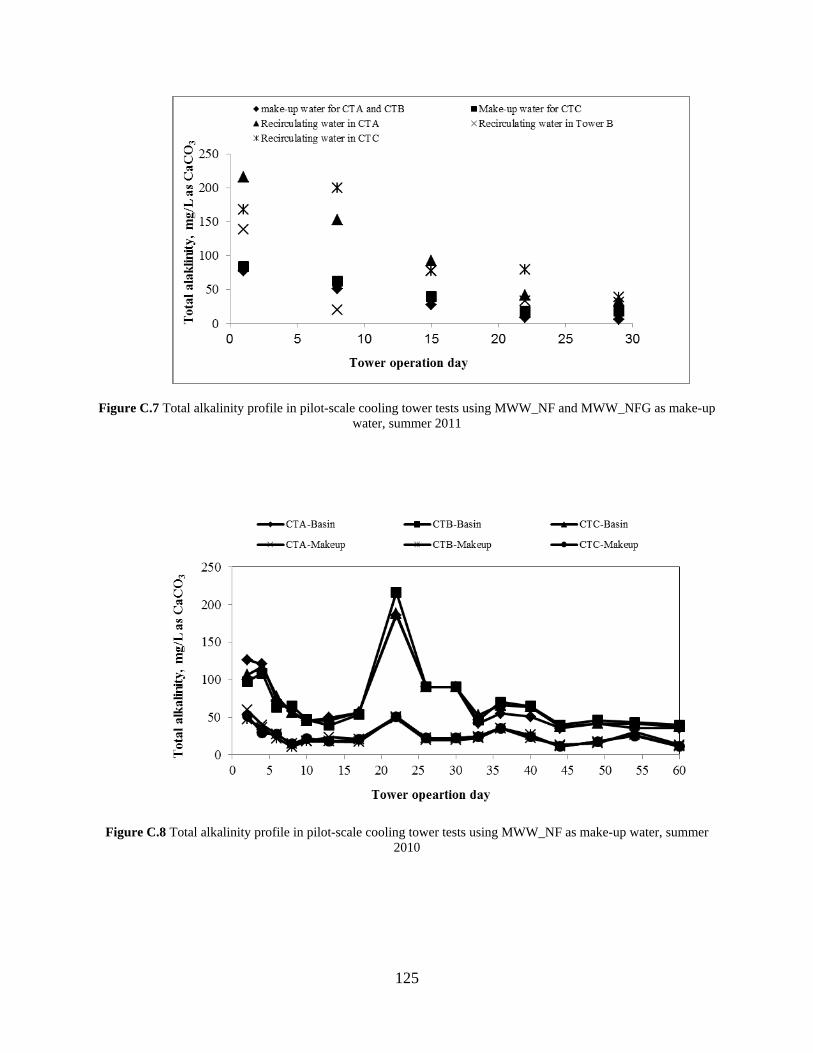
Figure C.7 Total alkalinity profile in pilot-scale cooling tower tests using MWW_NF and MWW_NFG as make-up water, summer 2011
Figure C.8 Total alkalinity profile in pilot-scale cooling tower tests using MWW_NF as make-up water, summer
2010
125

With regards to the effects of organic removal by activated carbon on the scaling
behavior, Tower C with MWW_NFG as make-up water showed the greatest inorganic scale
deposition during the first 15 days. Activated carbon adsorption led to an increase in pH of the
make-up water (Figure C.9), which enhanced the scaling potential in recirculating cooling tower
system. The elevation of pH was understandable since more than half of the organic material in
treated municipal wastewater falls in the strong acid or weak acid classification (Bunch et al.,
1961). On the other hand, the least inorganic deposition in Tower B was associated with the
lowest pH, which could be ascribed to the addition of chlorine dioxide dosed in this tower to
control the biofouling.
Figure C.9 pH in pilot-scale cooling tower tests using MWW_NF and MWW_NFG as make-up water during the pilot-scale cooling tower test, summer 2011
126
Another phase of tests was conducted on day 16 when the total alkalinity of make-up
water returned to the usual range (5.53-27.63 mg/L as CaCO3). In phase 2, negligible mass gain
was observed in all the three towers as shown in Figure C.1 which was consistent with the pilot-
scale cooling tower tests described in Section 2.3. Meanwhile, phosphate concentrations in the
recirculating water increased in phase 2 as shown in Figure C.6, indicating lower calcium
phosphate formation potential. Besides, much lower LSI meaning less CaCO3 scaling potential
was also observed in phase 2 as shown in Table C.1. The above changes were surely related to
the reduction in total alkalinity in the make-up water and thus the pH in the recirculating water
(Figure C.9).
C.4 SUMMARY AND CONCLUSIONS
From the representative information obtained from the second phase, it could be concluded that
MWW_NFG showed equally low scaling potential as MWW_NF. The removal of organic
matters does not cause significant changes on the scaling characteristics of MWW_NF.
127

BIBLIOGRAPHY
Abdel-Gaber, A.M., Abd-EI-Nabey, B.A., Khamis, E., Abd-EI-Khalek, D.E. (2011) A natural extract as scale and corrosion inhibitor for steel surface in brine solution. Desalination, 278(1-3), pp.337-342.
Abd-EI-Khalek, D.E., Abd-EI-Nabey, B.A. (2013) Evaluation of sodium hexametaphosphate as
scale and corrosion inhibitor in cooling water using electrochemical techniques. Desalination, 311, pp.227-233.
Ahmadi, G., Zhang, H., Han, R., Greenspan, B. (2005) Removal of particle pairs from a plane surface. The Journal of Adhesion, 81(2), pp.189-212.
Ahmadi, G., Guo, S., Zhang, X. (2007) Particle adhesion and detachment in turbulent flows including capillary forces. Particulate Science and Technology: An International Journal, 25(1), pp..59-76.
Al Nasser, W.N., Al-Salhi, F.H., Hounslow, M.J., and Salman, A.D. (2011) Inline monitoring the effect of chemical inhibitor on the calcium carbonate precipitation and agglomeration, Chemical Engineering Research and Design, 89(5), pp. 500-511.
Allison, J.D., Brown, D.S., Novo-Gradac, K.J. (1991) MINTEQA2/PRODEFA2, a geochemical assessment model for environmental systems: version 3.0. EPA/600/3-91/021. US EPA, Washington, D.C.
Altmann, J., Ripperger, S. (1997) Particle deposition and layer formation at the crossflow microfiltration. Journal of Membrane Science, 124(1), pp.119-128.
Alvarez, R., Evans, L.A., Miham, P.J., Wilson, M.A. (2004) Effects of humic materials on the precipitation of calcium phosphate. Geoderma, 118(3-4), pp. 245-260.
American Public Health Association, American Water Works Association, Water Environmental Federation (2005) Standard Methods for the Examination of Water and Wastewater, 21 st ed., Washington, DC.
Amjad, Z. (1985) Applications of antiscalants to control calcium sulfate scaling in reverse osmosis systems. Desalination, 54, pp.263-276.
128

Amjad, Z. (1989) Effect of precipitation inhibitors on calcium phosphate scale formation. Canadian Journal of Chemistry, 67(5), pp.850-856.
Andritsos N, Kontopoulou M., Karabelas, A.J. (1996) Calcium carbonate deposit formation under isothermal conditions. Canadian Journal of Chemical Engineering, 1996, 74, pp.911-919.
Andritsos, N., Yiantsios, S.G., Karabelas, A.J. (2002) Calcium phosphate scale formation from simulated milk ultrafiltrate solutions. Food and Bioproducts Processing, 80(4), pp.223-230.
Attard, P., Batchelor, M.T. (1988) A mechanism for the hydration force demonstrated in a model system. Chemical Physics Letters, 149(2), pp.206-211.
Aull, R. (2011) Typical condenser surface temperature and cooling water temperature in cooling systems at thermoelectric power plants. Brentwood Industries Inc., Reading, PA. personal communication.
Bansal, B., Müller-Steinhagen, H., Chen, X.D. (2001) Comparison of crystallization fouling in plate and double-pipe heat exchnagers. Heat Transfer Engineering, 22(5), pp.13-25.
Barat, R., Montoya, T., Seco, A., Ferrer, J. (2011) Modelling biological and chemically induced precipitation of calcium phosphate in enhanced biological phosphorus removal system. Water Research, 45(12), pp.3744-3752.
Bargeman, D., van Voorst Vader, F. (1972) Van der waals forces between immersed particles. Journal of Electroanalytical Chemistry, 37(1), pp.45-52.
Bartels, C.R., Wilf, M., Andes, K., Long, J. (2005) Design considerations for wastewater treatment by reverse osmosis. Water Science and Technology, 51(6-7), pp.473-482.
Berg, J.C. (2010) An introduction to interfaces and colloids: The bridge to nanosicence. World Scientific Publishing Co., London, pp.525-552.
Boskey, A.L., Posner, A.S. (1973) Conversion of amorphous calcium phosphate to microcrystalline hydroxyapatite. A pH-dependent, solution-mediated, solid-solid conversion. Journal of Physical Chemistry, 77(19), pp.2313-2317.
Bott, T.R. (1995) The fouling of heat exchangers, Elsevier Science, New York.
Branch, C. A., M ller-Steinhagen, H. M. (1991) Influence of Scaling on the Performance of Shell-and-Tube Heat Exchangers. Heat Transfer Engineering, 12(2), pp.37 – 45.
Bunch R.L., Barth E.F., and Ettinger M.B. (1961) Organic Materials in Secondary Effluents, Journal of Water Pollution Control Federation, 33(2), pp. 122-126.
Cao, X., Harris, W. (2008) Carbonate and magnesium interactive effect on calcium phosphate precipitation. Environmental Science & Technology, 42(2), pp. 436-442.
129
Castro, F., Ferreira, A., Rocha, F., Vicente, A., Teixeira, J.A. (2012) Characterization of intermediate stages in the precipitation of hydroxyapatite at 37ºC. Chemical Engineering Science, 77, pp.150-156.
Chan, S.H., Ghassesmi, K.F. (1991) Analytical modeling of calcium carbonate depositon for laminar falling films and turbulent flow in annuli: Part 2 multispecies model. Journal of Heat Transfer, 113(3), pp.741-746.
Chang, K., Hammer, D. (1996) Influence of direction and type of applied force on the detachment of macromolecularly-bound particles from surfaces. Langmuir, 12(9), pp.2271-2282.
Chesters, S.P. (2009) Innovations in the inhibition and cleaning of reverse osmosis membrane scaling and fouling. Desalination, 238(1-3), pp.22-29.
Chien, S.H., Hsieh, M.K., Li, H., Monnell, J., Dzombak, D., Vidic, R. (2012a) Pilot-scale cooling tower to evaluate corrosion, scaling, and biofouling control strategies for cooling system makeup water. AIP: Review of Scientific Instruments, 83(2), pp.024101 1-10.
Chien, S.H., Chowdhury, I., Hsieh, M.K.; Li, H., Monnell, J., Dzombak, D., Vidic, R. (2012b) Control of biological growth in recirculating cooling systems using treated secondary effluent as makeup water with monochloramine. Water Research, 46(19), pp.6508-6518.
Cho, Y.I., Lee, S, Kim, W, and Suh, S. (2004) “Physical water treatment for the mitigation of mineral fouling in cooling-tower water applications”, 2003 ECI Conference on Heat Exchanger Fouling and Cleaning: Fundamentals and Application, Santa Fe, NM.
Chong, T.H., Sheikholeslami, R. (2001) Thermodynamics and kinetics for mixed calcium carbonate and calcium sulfate precipitation. Chemical Engineering Science, 56(18), pp.5391-5400.
Choudhury, M.R., Hsieh, M.K., Vidic, R., Dzombak, D. (2012) Corrosion management in power plant cooling water systems using tertiary treated municipal wastewater as makeup water. Corrosion Science, 61, pp. 231-241.
Darton, E.G. (1997) Scale inhibition techniques used in membrane systems. Desalination, 113(2-3), pp.227-229.
Davis, K.J., Dove, P.M., Yoero, J.J. (2000) The Role of Mg2+ as an impurity in calcite growth. Science, 290(5494), pp.1134-1137.
Davis, M.L., Cornwell, D.A. (1998) Introduction to environmental engineering (Vol.4). Boston: McGraw-Hill, pp.997.
Dishneau, D. (2007) Frederick County denies cooling water to proposed power plant. The Baltimore Examiner, 17 September.
130

Drew, D. (1988) The lift force on a small sphere in the presence of a wall. Chemical Engineering Science, 43(4), pp.769-773.
Dzombak, D., Vidic, D., Landis, A.(2012) Use of Treated Municipal Wastewater as Power Plant Cooling System Makeup water: Tertiary Treatment versus Expanded Chemical Regimen for Recirculating Water Quality Managemen, Department of Energy, Grant DE-NT006550, National Energy Technology Laboratory, Pittsburgh, PA.
Eanes, E.D., Gillessen, I.H., Posner, A.S. (1965) Intermediate states in the precipitation of hydroxyapatite. Nature, 208, pp.365-367.
EPA (2008) Water Supply and Use in the United States, United States Environmental Protection Agency, EPA-832-F-06-006, June 2008.
EPRI (2003) Use of Degraded Water Sources as Cooling Water in Power Plants (1005359). California Energy Commision. Public Interest Energy Research Program Sacramento, CA.
EPRI (2008) Use of Alternate Water Sources for Power Plant Cooling. Palo Alto, CA.
Eriksson, R., Merta, J., Rosenholm, J.B. (2007) The calcite/water interface: I. Surface charge in indifferent electrolyte media and the influence of low-molecular-weight polyelectrolyte. Journal of Colloid and Interface Science, 313(1), pp.184-193.
Feeley, T.J. and Ramezan, M. (2003). Electric Utilities and Water: Emerging Issues and R&D Needs, in Proceedings of 9th Annual Industrial Wastes Technical and Regulatory Conference. Water Environment Federation, San Antonio, TX.
Feeley III,T.J., Skone, T.J., Stiegel, G.J., McNemar, A., Nemeth, M., Schimmoller, B., Murphy, J.T., Manfredo, L. (2008). Water: A critical resource in the thermoelectric power industry, Energy, 33(1), pp 1-11.
Ferguson, J.F., McCarty, P.L. (1971) Effects of carbonate and magnesium on calcium phosphate precipitation. Environmental Science and Technology, 5(6), pp.534-540.
Ferguson, J.F., Jenkins, D. J., Eastman, J. (1973) Calcium phosphate precipitation at slightly alkaline pH values. Journal of Water Pollution Control Federation, 45(4), 620-631.
Flynn, D. (2009) The Nalco Water Handbook (Third Edition). McGraw-Hill Companies, New York.
Folk, R.L. (1974) The natural history of crystalline calcium carbonate; effect of magnesium content and salinity. Journal of Sedimentary Research, 44(1), pp.40-53.
Fu, C., Zhou, Y., Liu, G., Huang, J., Sun, W., Wu, W. (2011) Inhibition of Ca3(PO4)2, CaCO3, and CaSO4 precipitation for industrial recycling water. Industrial & Engineering Chemistry Research, 50(18), pp.10393-10399.
131

GE Power & Water (2012) Handbook of Industrial Water Treatment. (Last access on September 20, 2012 at http://www.gewater.com/handbook/index.jsp)
Greenberg, G., Hasson, D., Semiat, R. (2005) Limits of RO recovery imposed by calcium phosphate precipitation. Desalination, 183(1-3), pp.273-288.
Hansen, M.E., Giddings, J. Calvin (1989) Retention perturbations due to particle-wall interactions in sedimentation field-flow fractionation. Analytical Chemistry, 61(8), pp.811-819.
Hardikarl, V.V., Matijevic, E. (2001) Influence of ionic and nonionic dextrans on the formation of calcium hydroxide and calcium carbonate particles. Colloids and Surfaces A: Physiochemical and Engineering Aspects, 186(1-2), pp.23-31.
Hasson D. Avriel, M., Resnick, W., Rozenman, T., Windreich, S. (1968) Mechanism of calcium carbonate scale deposition on heat transfer surfaces. Industrial and Engineering Chemistry Fundamentals, 7(1), pp.59-65.
Hasson, D., Bramson, D, Limoni-Relis, B., Semiat, R. (1997) Influence of the flow system on the inhibitory action of CaCO3 scale prevention additives, Desalination. 108(1-3), pp.67-69.
Hasson, D., Shemer, H., Sher, A. (2011) State of the art of friendly “green” scale control inhibitors: a review article. Industrial & Engineering Chemistry Research, 50(12), pp. 7601-7607
Hoek, E. M., Agarwal, G.K. (2006) Extended DLVO interactions between spherical particles and rough surfaces. Journal of Colloid and Interface Science, 298(1), pp. 50-58.
Hou, W., Feng, Q. (2006) Morphology and formation mechanism of vaterite particles grown in glycine-containing aqueous solutions. Materials Science and Engineering C, 26(4), pp.644-647.
Hsieh, M.K, Li, H., Chien, S.H., Jason, M., Chowdhury, I., Dzombak, D., Vidic, R. (2010) Corrosion control when using secondary treated municipal wastewater as alternative makeup water for cooling tower systems. Water Environment Research, 82(12), pp. 2346-2356.
Humphris, T.H. (1977) The use of sewage effluent as power station cooling water. Water Research, 11(2), pp.217-223.
Khan, M.S., Budair, M.O., Zubair, S.M. (2001) A parametric study of CaCO3 scaling in AISI 316 stainless steel tubes. Heat and Mass Transfer, 38(1-2), pp. 115-121.
Kibalczyc, W., Zielenkiewicz, A., Zielenkiewicz, W. (1988) Calorimetric investigations of calcium phosphate precipitation in relation to solution composition and temperature. Thermochimica Acta, 131, pp.47-55.
132

Kim, S., Ryu, H-S., Jung, H.S., Hong, K.S.(2004) Influence of Ca/P ratios of starting solutions on the crystallization of amorphous calcium phosphate to hydroxyapatite. Meatals and Materials International, 10(2), pp.171-175.
Kim, S., Ryu, H-S., Shin, H., Jung, H.S., Hong, K.S. (2005) In situ observation of hydroxyapatite nanocrystal formation from amorphous calcium phosphate in calcium-rich solutions. Materials Chemistry and Physicals, 91(2-3), pp.500-506.
Kim, W.T., Bai, Cheolho, Cho, Y.I. (2002) A study of CaCO3 fouling with a microscopic imaging technique. International Journal of Heat and Mass Transfer, 45(3), pp.597-607.
Langelier, W.F. (1946) Chemical equilibria in water treatment. Journal of American Water Works Association, 38(2), pp.169-178.
Lee, G.J., Tijing, L.D., Park, B.C., Baek, B.J., Cho, Y.I. (2006) Use of catalytic materials for the mitigation of mineral fouling. International Communications in Heat and Mass Transfer, 33(1), pp.14-23.
Leikin, S., Parsegian, V.A., Rau, D.C., Rand, R.P. (1993) Hydration forces. Annual Review of Physical Chemistry, 44, pp.369-395.
Li, H., Chien, S.H., Hsieh, M.K., Dzombak, D., Vidic, R. (2011a). Escalating water demand for energy production and the potential for use of treated municipal wastewater. Environmental Science and Technology, 45(10), pp 4195-4200.
Li, H., Hsieh, M., Chien, S., Monnell, J.D., Dzombak, D.A., and Vidic, R.D. (2011b) Control of mineral scale deposition in cooling systems using secondary-treated municipal wastewater, Water Research, 45(2), pp. 748-760.
Li, P., Liu. H., Ding, X., Wang, Y., Chen ,Y., Zhou, Y., Tang, Y., Wei, H., Cai, C., and Lu, T. (2012) Synthesis of water-soluble phosphonate functionalized single-walled carbon nanotubes and their application in biosensing. Journal of Materials Chemistry, 22, pp.15370-15378.
Li, W., Webb, R.L. (2000) Fouling in enhanced tubes using cooling tower water Part II: combined particulate and precipitation fouling. International Journal of Heat and Mass Transfer, 43(19), pp.3579-3588.
Littlejohn, F., Grant, C.S., Sáez, A.E. (2000) Mechanisms for the removal of calcium phosphate deposits in turbulent flow. Industrial & Engineering Chemistry Research, 39(4), pp.933-942.
Liu, C., Huang, Y., Shen, W., Cui, J. (2001) Kinetics of hydroxyapatite precipitation at pH 10 to 11.Biomaterials, 22, pp.301-306.
Liu, W., Chien, S.H., Dzombak, D., Vidic, R. (2012) Mineral scaling mitigation in cooling systems using tertiary-treated municipal wastewater. Water Research, 46(14), pp.4488-4498.
133
Liu, W., Chien, S.H., Dzombak, D., Vidic, R. (2013a) Scaling control for heat exchangers in recirculating cooling systems using tertiary-treated municipal wastewater, Industrial & Engineering Research (Submitted)
Liu, W., He, C., Dzombak, D., Vidic, R. (2013b) Insights into calcium phosphate scale mitigation by typical antiscalants (In preparation)
Lu, K., Kessler, C. (2006) Colloidal dispersion and rheology study of nanoparticles. Journal of Materials Science, 41(17), pp.5613-5618.
Luo, Q. (2000) Stabilization of alumina polishing slurries using phosphonate dispersants.
Industrial & Engineering Chemistry Research, 39(9), pp.3249-3254.
Marrink, S., Berkowitz, M., Berendsen, J.C. (1993) Molecular dynamics simulation of a membrane/water interface: the ordering of water and its relation to the hydration force. Langmuir, 9(11), pp.3122-3131.
Meldrum, F.C., Hyde, S.T. (2001) Morphological influence of magnesium and organic additives on the precipitation of calcite. Journal of Crystal Growth, 231(4), pp.544-558.
Metcalf & Eddy (2004) Wastewater Engineering: Treatment and Reuse. McGraw-Hill, Inc.
Morgan, T.T., Goff, T.M., Adair, J.H. (2011) The colloidal stability of fluorescent calcium phosphosilicate nanoparticles: the effects of evaporation and redispersion on particle size distribution. Nanoscale, 3(5), pp.2044-2053.
Moudgil, H.K., Yadav, S., Chaudhary, R.S., Kumar D. (2009) Synergistic effect of some antiscalants as corrosion inhibitor for industrial cooling water system. Journal of Applied Electrochemistry, 39(8), pp. 1339-1347.
Müller-Steinhagen, H., Malayeri, M.R., Watkinson, A.P. (2005) Fouling of heat exchangers – new approaches to solve an old problem. Heat Transfer Engineering, 26(1), pp. 1-4.
Muralithran, G., Ramesh, S. (2000) The effects of sintering temperature on the properties of hydroxyapatite. Ceramics International, 26(2), pp.221-230.
Narayan, G.P., Anoop, K.B., and Das, S.K. (2007) Mechanism of enhancement/deterioration of boiling heat transfer using stable nanoparticle suspensions over vertical tubes. Journal of Applied Physics, 102(7), pp.073217 1-7.
Neufeld, R.D., Debes, M.R., Moretti, C., Mayernik, J., Keleti, G., Sykora, J., and Bender, J.
(1985) Cooling tower evaporation of treated coal gasification wastewaters. Journal Water Pollution Control, 57(9), pp.955-964.
Nylen, M.U., Eanes, E.D., Termine, J.D. (1972) Molecular and ultrastructural studies of non-crystalline calcium phosphate. Calcified Tissue Research, 9(1), pp.95-108.
134

Office of Water Programs at California State University Sacramento (2009) Ammonia Removal Options for High Purity Oxygen Activated Sludge Systems: A Literature Review. (Last access on February 25, 2013 at http://www.owp.csus.edu/research/wastewater/papers/HPOAS-Lit-Review-Final.pdf )
Osborn, D.W. (1970) Factors affecting the use of purified sewage effluent for cooling purposes. Journal of Water Pollution Control, 69, pp. 546.
Prakash, K.H., Kumar, R., Ooi, C.P., Cheang, P., Khor, K.A. (2006) Apparent solubility of hydroxyapatite in aqueous medium and its influence on the morphology of nanocrystallites with precipitation temperature. Langmuir, 22(26), pp.11002-11008.
Prandtl, L. (1925) Bericht liber die Untersuchungen zur ausgebildeten Turbulenz. Z. Angew. Math. Mech., 5, pp.136-139.
Puckorius, P.R., Brooke, J.M. (1991) A new practical index for calcium carbonate scale prediction in cooling tower systems. Corrosion 47(4), pp.280-284.
Puckorius P. R., and Diehl K. (2003), “Water Reuse Experimencs with Cooling Tower Systems in San Antonio, Texas”, Cooling Tower Institute Annual Conference, 2003. Paper No. TP03-03.
Rama, D.D. (2007) Fluid mechanics and machinery. New Age International Publishers, New Delhi, pp.424-428.
Rebhum, M., Engel, G. (1988) Reuse of wastewater for industrial cooling systems. Journal of Water Pollution Control Federation, 60(2), pp.237-241.
Reynolds, J.Z. (1980) Power plant cooling systems: policy alternatives. Science, 207(4429), pp. 367-372.
Rimai, D.S., Quensnel, D.J., Busnaina, A.A. (2000) The adhesion of dry particles in the nanometer to micrometer-size range. Colloids and Surfaces A: Physicochemical and Engineering Aspects, 165(1-3), pp.3-10.
Rosenberg, Y.O., Reznik, I.J., Zomora-Nahum, S., Ganor, J. (2012) The effect of pH on the formation of a gypsum scale in the presence of a phosphonate antiscalant. Desalination, 284, pp.207-220.
Rosmaninho, R., Rizzo, G., Müller-Steinhagen, H., Melo, L.F. (2003) Study of the influence of bulk properties and surface tension on the deposition process of calcium phosphate on modified stainless steel, in Proceedings of ECI Conference on Heat Exchanger Fouling and Cleaning: Fundamentals and Applications”, Santa Fe, New Mexico.
Rosmaninho, R., Rocha, F., Rizzo, G., Müller-Steinhagen, H., Melo, L.F. (2007) Calcium phosphate fouling on TiN-coated stainless steel surfaces: Role of ions and particles. Chemical Engineering Science, 62(14), pp.3821-3831.
135

Royer, M., Davidson, J.H., Francis, L.F., Mantell, S.C. (2010) Shear induced removal of calcium carbonate scale from polypropylene and copper tubes. Journal of Solar Energy Engineering, 132(1), pp.011013.1-011013.9.
Ryznar, J.W. (1944) A new index for determining amount of calcium carbonate scale formed by a water. Journal of American Water Works Association, 36(4), pp.473-486.
Seckler M.M., Bruinsma S.L., van Rosmalen G.M. (1996) Phosphate removal in a fluidized bed I. Identification of physical processes. Water Research, 30(7), pp.1585-1588.
Selby, K.A., Puckorius, P.R., Helm, K.R. (1996) The use of reclaimed water in electric power stations and other industrial facilities. Water, Air, and Soil Pollution, 90(1-2), pp. 183-193.
Selby, K.A., Puckorius, P.R., Helm, K.R. (1996) The use of reclaimed water in electric power stations and other industrial facilities. Water, Air, and Soil Pollution, 90(1-2), pp. 183-193.
Shakkthivel, P., Vasudevan, T. (2006) Acrylic acid-diphenylamine sulphonic acid copolymer threshold inhibitor for sulphate and carbonate scales in cooling water systems. Desalination, 197(1-3), pp. 179-189.
Sheikholeslami, R., Ng, M. (2001) Calcium sulfate precipitation in the presence of nondominant calcium carbonate: thermodynamics and kinetics. Industrial & Engineering Chemistry Research, 40(16), pp. 3570-3578.
Sheikholeslami, R. (2003) Mixed salts – scaling limits and propensity. Desalination, 154(2), pp.117-127.
Sheikholeslami, R. (2004) Assessment of the scaling potential for sparingly soluble salts in RO and NF units. Desalination, 167, pp.247-256.
Shih, W-Y., Albrecht, K., Glater, J., Cohen, Y. (2004) A dual-probe approach for evaluation of gypsum crystallization in response to antiscalant treatment. Desalination, 169(3), pp.213-221.
Soltani, M. and Ahmadi, G. (1994) On particle adhesion and removal mechanisms in turbulent flows. Journal of Adhesion Science and Technology, 8(7), pp.763-785.
Spanos, N., Patis, A., Kanellopoulou, D., Andritsos, N., and Koutsoukos, P.G. (2007) Precipitation of calcium phosphate from simulated milk ultrafiltrate solutions. Crystal growth & Design, 7(1), pp.25-29.
Stavgianoudaki, N., Papathanasiou, K.E., Colodrero, R.M.P., Choquesillo-Lazarte, D., Garcia-Ruiz, J.M., Cabeza, A., Aranda, M.A.G., Demadis, K.D. (2012) Crystal engineering in confined spaces. A novel method to grow crystalline metal phosphonates in a alginate gel systems. CrystEngComm, 14, pp.5385-5389.
136

Strmčnik, D., Gaberšček, M., Pihlar, B., Kočar, D., Jamnik, J. (2009) Copper dissolution in ammonia solutions: identification of the mechanism at low overpotentials. Journal of Electrochemical Society, 156(7), pp.222-229.
Suchanek, W.L., Byrappa, K., Shuk, P., Riman, R.E., Janas, V.F., TenHuisen, K.S. (2004) Mechanochemical-hydrothermal synthesis of calcium phosphate powers with coupled magnesium and carbonate substitution. Journal of Solid State Chemistry, 177(3), pp.793-799.
Swietlik, J., Raczyk-Stanislawiak, U., Piszora, P., Nawrocki, J. (2011) Reasons for the lack of chemical stability of treated water rich in magnesium. Water Research, 45(19), pp. 6585-6592.
Taheri, M., Bragg, G.M. (1992) A study of particle resuspension in a turbulent flow using a preston tube. Aerosol Science and Technology, 16(1), pp.15-20.
Tao, J., Pan, H., Wang, J., Wu, J., Wang, B., Xu, X., Tang, R. (2008) Evolution of amorphous calcium phosphate to hydroxyapatite probed by gold nanoparticles. Journal of Physical Chemistry, 112(38), pp.14929-14933.
Thorstenson, D.C., Plummer, L.N. (1977) Equilibrium criteria for two component solids reacting with fixed composition in aqueous phase – example: the magnesian calcites. American Journal of Science, 277(10), pp.1203-1223.
Troup, D.H., Richardson, J.A. (1978) Scale nucleation on a heat transfer surface and its prevention. Chemical Engineering Communications, 2(4-5), pp. 167-180.
Tulloch, S. (2011) The use of dispersants in pressurized water reactor steam generators. Eng.D. Thesis, College of Engineering & Physical Sciences, University of Birmingham.
Van Oss, C.J., Chaudhury, M.K., Good, R.J (1988) Interfacial Lifshitz-van der Waals and polar interactions in macroscopic systems. Chemical Reviews, 88(6), pp.927-941.
Vidic, R.D.; Dzombak, D.A.; Hsieh, M.K.; Li, H.; Chien, S.H.; Feng, Y.; Chowdhury, I.; Monnell, J.D. (2009) Reuse of Treated Internal or External Wastewaters in the Cooling Systems of Coal-based Thermoelectric Power Plants, Department of Energy, Grant DE-FC26-06NT42722, National Energy Technology Laboratory, Pittsburgh, PA.
Von Kármán, T. (1939) The analogy between fluid friction and heat transfer. Transactions of the American Society of Mechanical Engineers, 61, pp.705-710.
Vyas,H.K., Bennett, R.J., Marshall, A.D. (2001) Cake resistance and force balance mechanism in the crossflow microfiltration of lactalbumin particles. Journal of Membrane Science, 192(1-2), pp.165-176.
Walker, M.E., Safari, I., Theregowda, R.B., Hsieh, M-K., Abbasian, J., Arastoopour, H., Dzombak, D.A., and Miller, D.C. (2012) Economic impact of condenser fouling in existing thermoelectric power plants. Energy, 44(1), pp.429-437.
137
Wakinson, A.P., Martinez, O. (1975) Scaling of heat exchangers tubes by calcium carbonate. Journal of Heat Transfer, 1975, 97(4), pp.504-508.
Wang, C-G., Liao, J-W., Gou, B-D., Huang, J., Tang, R-K., Tao, J-H., Zhang, T-L., Wang, K. (2009) Crystallization at multiple sites inside particles of amorphous calcium phosphate. Crystal Growth & Design, 9(6), pp.2620-2626.
Wang, X., Lee, B.I., Mann, L. (2002) Dispersion of barium titanate with polyaspartic acid in
aqueous media. Colloid and Surfaces A: Physicochemical and Engineering Aspects, 202(1), 71-80.
Webb, R.L., Li, W. (2000) Fouling in enhanced tubes using cooling tower water Part I: long-term fouling data. International Journal of Heat and Mass Transfer, 43(19), pp. 3567-3578.
Wijesinghe, B., Kaye, R.B., Fell, C.J. (1996) Reuse of treated sewage effluent for cooling water make up: A feasibility study and a pilot plant study. Water Science and Technology, 33(10-11), pp.363-369.
Wu, W., Nancollas, G.H. (1998) The dissolution and growth of sparingly soluble inorganic salts: A kinetics and surface energy approach. Pure and Applied Chemistry, 70, 1867-1872.
Wu, Z., Davidson, J.H., Francis, L.F. (2010) Effect of water chemistry on calcium carbonate deposition on metal and polymer surfaces. Journal of Colloid and Interface Science, 343(1), pp.176-187.
Yang, Q., Ding, J., Shen, Z. (2000) Investigation on fouling behaviors of low-energy surface and fouling fractal characteristics. Chemical Engineering Science, 55(4), pp.797-805.
Zhang, B., Zhang, L., Li, F., Hu, W., Hannam, P.M. (2010) Testing the formation of Ca–phosphonate precipitates and evaluating the anionicpolymers as Ca–phosphonate precipitates and CaCO3 scale inhibitor in simulated cooling water. Corrosion Science, 52(12), pp.3883-3890.
Zhang, G., Ge, J., Song, Z., Sun, M., Liu, J. (2005) The effect of HEDP on Zeta potential of calcium carbonate. Acta Petrolei Sinica (Petroleum Processing Section), 6, pp.62-68.
Zheng, M., Li, P., Fu, G., Chen, Y., Zhou, Y., Tang, Y., Lu, T.(2013) Efficient anchorage of highly dispersed and ultrafine palladium nanoparticles on the water-soluble phosphonate functionalized multiwall carbon nanotubes. Applied Catalysis B: Environmental, 129, pp.394-402.
138