![Gareth Haysom [Compatibility Mode]](https://static.fdocuments.in/doc/165x107/554ae9c1b4c905ba058b52fc/gareth-haysom-compatibility-mode.jpg)
Current State of Photovoltaics - ottawa.peo.on.ca...Current State of Photovoltaics: efficiency-cost...
30
Current State of Photovoltaics: efficiency-cost trends, performance, and deployment in Ontario Dr. Joan Haysom Sr. Research Associate SUNLAB Research Group University of Ottawa Energy Engineering Hampton Consultants
Transcript of Current State of Photovoltaics - ottawa.peo.on.ca...Current State of Photovoltaics: efficiency-cost...

Current State of Photovoltaics:
efficiency-cost trends, performance, and deployment in Ontario
Dr. Joan Haysom
Sr. Research AssociateSUNLAB Research Group
University of Ottawa
Energy EngineeringHampton Consultants

Mapping a Renewable Energy Future
Projects that are
profitable.
Projects that help
the grid / programs
that encourage
uptake
Slide 2 Joan Haysom Ottawa PEO Sustainability Workshop Feb. 3, 2016

Driving down the price of PV deployments

Lab records
Organics
Silicon
Concentrated
Multi-junction
Thin film CdTe
Perovskites
46%
31- 40%
20 - 25%
21%
11%
Time (years)
Eff
icie
ncy
(%
)
Non-conc. multi-junction
PV Material Efficiency IncreasesIn-field system
production today
30%
$$$
13%
9%
?
?
Slide 4 Joan Haysom Ottawa PEO Sustainability Workshop Feb. 3, 2016
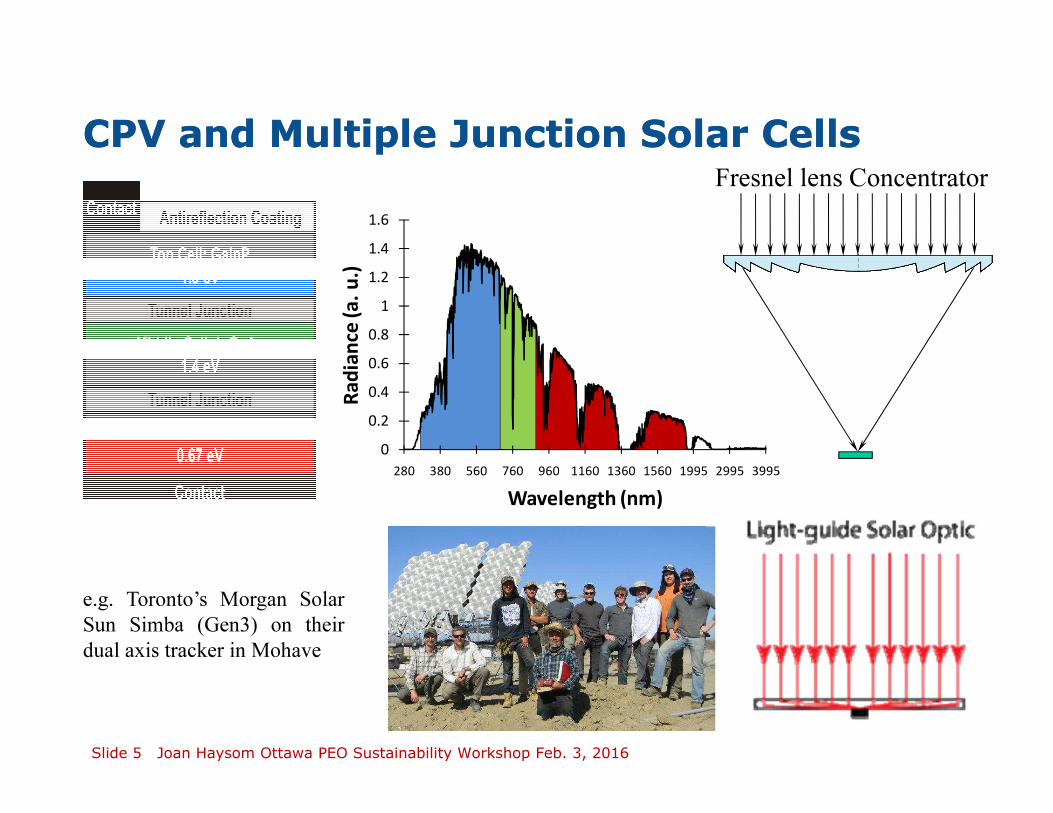
CPV and Multiple Junction Solar CellsCPV and Multiple Junction Solar Cells
0
0.2
0.4
0.6
0.8
1
1.2
1.4
1.6
280 380 560 760 960 1160 1360 1560 1995 2995 3995
Ra
dia
nce
(a
. u
.)
Wavelength (nm)
e.g. Toronto’s Morgan Solar
Sun Simba (Gen3) on their
dual axis tracker in Mohave
Slide 5 Joan Haysom Ottawa PEO Sustainability Workshop Feb. 3, 2016
Fresnel lens Concentrator
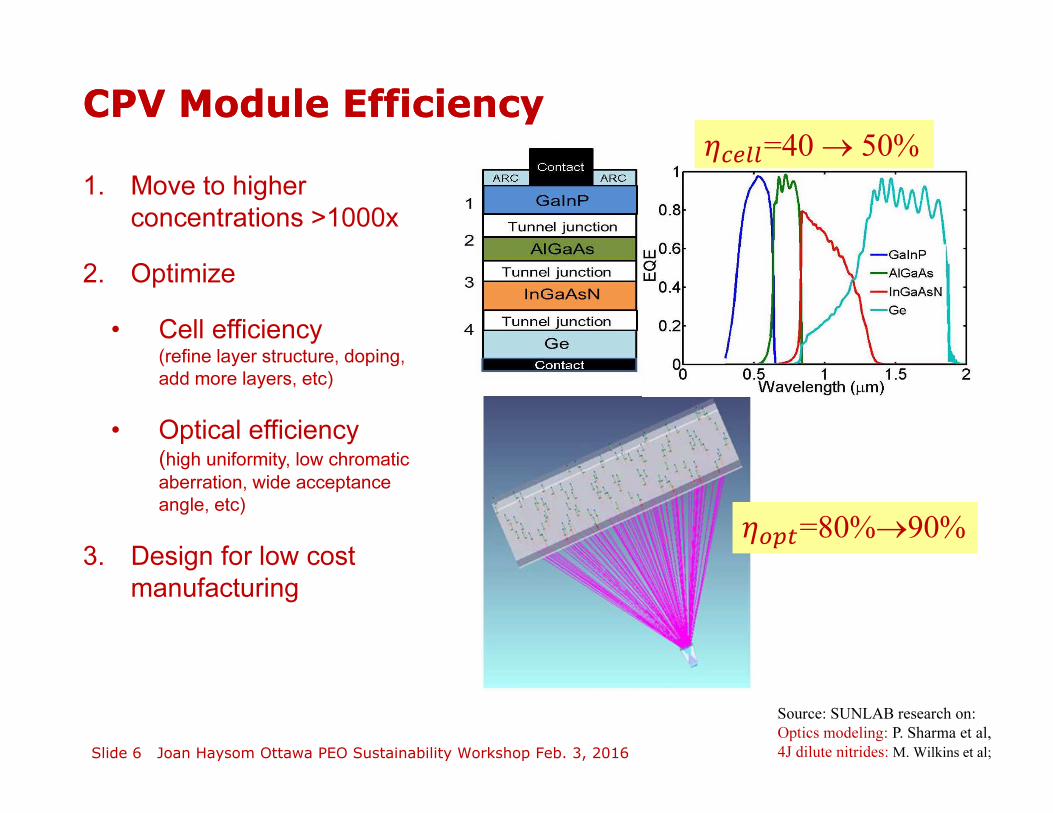
CPV Module EfficiencyCPV Module Efficiency
Source: SUNLAB research on:
Optics modeling: P. Sharma et al,
4J dilute nitrides: M. Wilkins et al;
1. Move to higher
concentrations >1000x
2. Optimize
• Cell efficiency(refine layer structure, doping,
add more layers, etc)
• Optical efficiency(high uniformity, low chromatic
aberration, wide acceptance
angle, etc)
3. Design for low cost
manufacturing
����=80%→90%
�����=40 → 50%
Slide 6 Joan Haysom Ottawa PEO Sustainability Workshop Feb. 3, 2016
Slide 7 Joan Haysom Ottawa PEO Sustainability Workshop Feb. 3, 2016
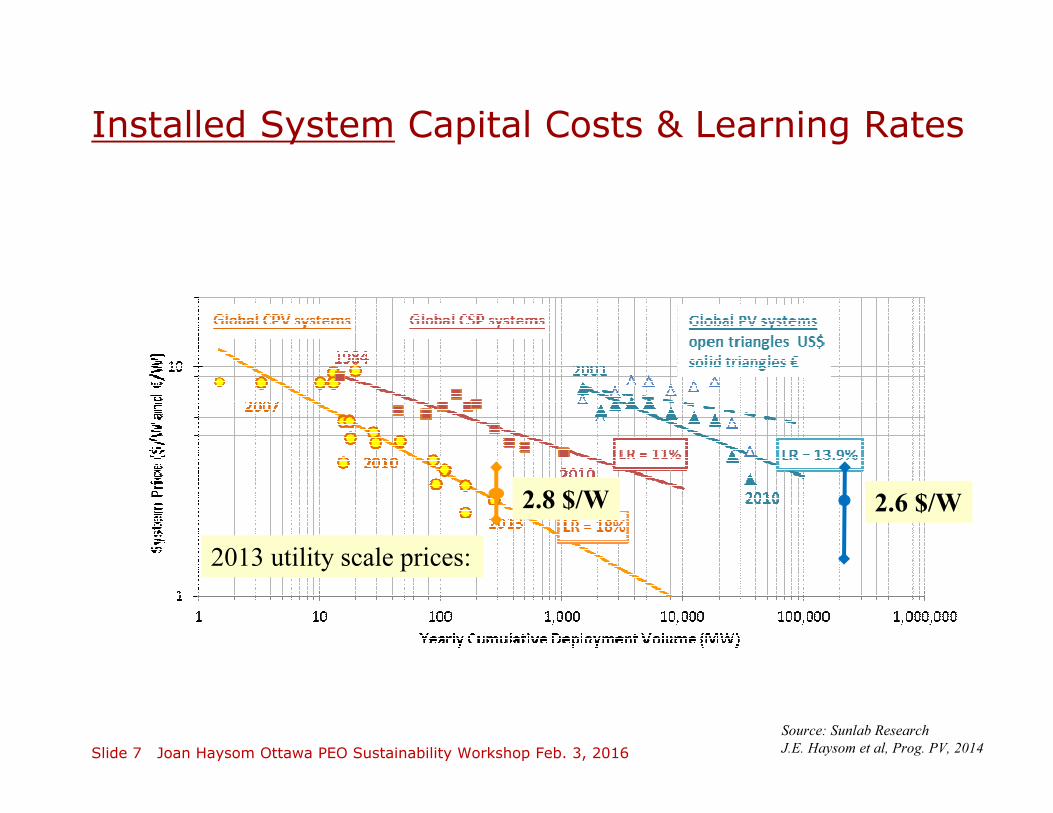
Installed System Capital Costs & Learning Rates
Source: Sunlab Research
J.E. Haysom et al, Prog. PV, 2014
2.8 $/W
2013 utility scale prices:
2.6 $/W

System Cost = Module + BOS
Source: GTM Research
Balance of System (BOS)
(racking, inverter, labour, fees, profit)
now more than 50% of cost
Slide 8 Joan Haysom Ottawa PEO Sustainability Workshop Feb. 3, 2016
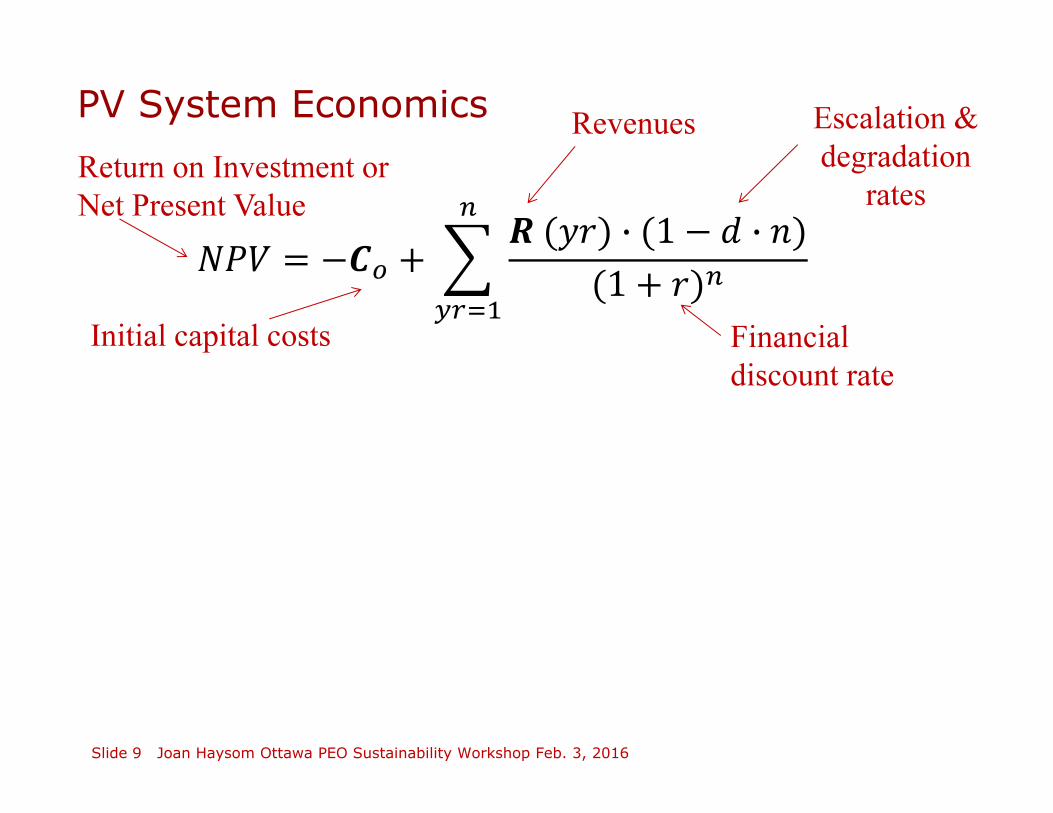
PV System Economics
Slide 9 Joan Haysom Ottawa PEO Sustainability Workshop Feb. 3, 2016
� �
�
����
Escalation &
degradation
rates
Financial
discount rate
Return on Investment or
Net Present Value
Initial capital costs
Revenues
Slide 10 Joan Haysom Ottawa PEO Sustainability Workshop Feb. 3, 2016
� �
�
����
��� �
��
����
Escalation &
degradation
rates
Financial
discount rate
Return on Investment or
Net Present Value
Initial capital costs
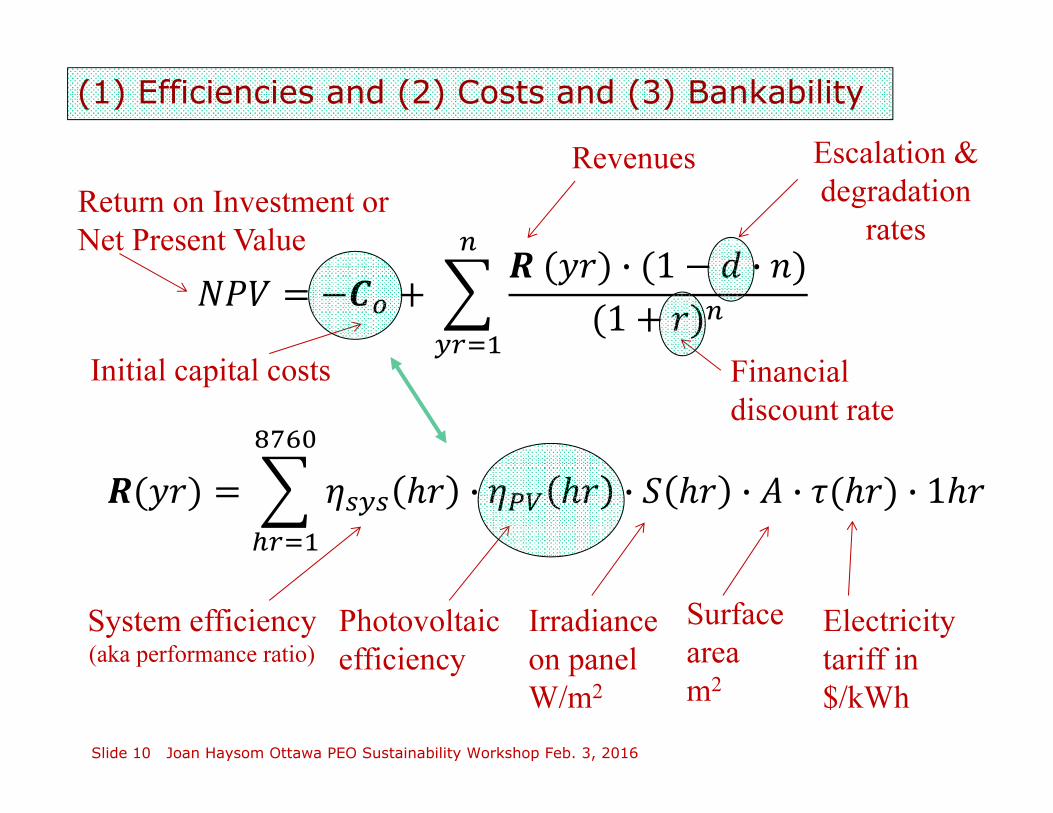
Irradiance
on panel
W/m2
Photovoltaic
efficiency
Surface
area
m2
System efficiency(aka performance ratio)
Electricity
tariff in
$/kWh
Revenues
(1) Efficiencies and (2) Costs and (3) Bankability

(4) Bifacial PV panels
Slide 11 Joan Haysom Ottawa PEO Sustainability Workshop Feb. 3, 2016
�(��) = � ���� �� · ��� �� · � �� · · (��) · 1������
��
Irradiance on
panel
W/m2
Surface
area
m2

Bifacial Energy Prediction
• Module Power Output depends on the properties of the environment:
• Reflectivity of the
ground & surrounding
objects
• non-uniformity of
cloudy sky
• Shadows from racking,
etc
Source: Sunlab research by
Robert. Li
Collaboration with CelesticaSlide 12 Joan Haysom Ottawa PEO Sustainability Workshop Feb. 3, 2016

5) Optimizing for a time-dependent tariff
Slide 13 Joan Haysom Ottawa PEO Sustainability Workshop Feb. 3, 2016
Ontario large user
~45% bill based on demand
in top five summer hours
(GA factor)
Sacramento, CA
Peak $0.22/kWh
Low 6.6¢/kWh
Las Vegas, NV
Summer super peak $0.30/kWh
Low 4¢/kWh
West
of
So
uth
West
of
So
uth
West
of
So
uth
Panel Tilt angle Panel Tilt angle Panel Tilt angle
Source: Sunlab & Telfer Research
J.E. Haysom et al, Prog. PV, 2015
�(��) = � ���� �� · ��� �� · � �� · · (��) · 1������
��
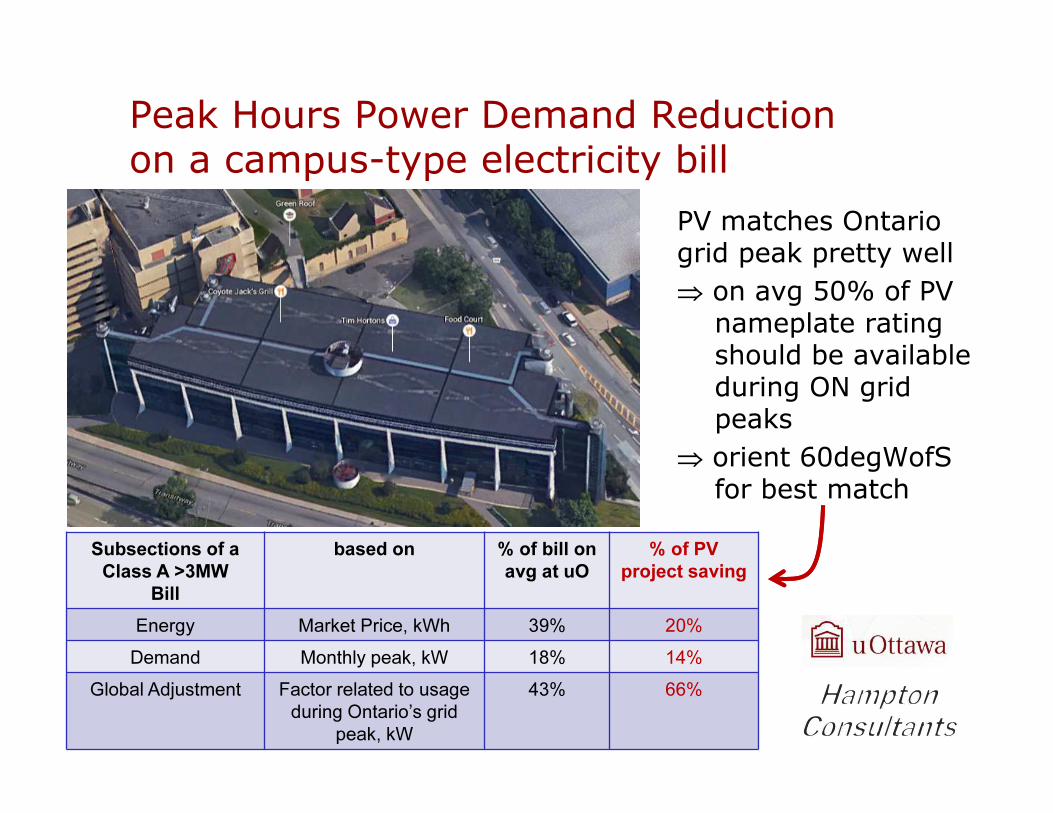
Peak Hours Power Demand Reduction on a campus-type electricity bill
PV matches Ontario grid peak pretty well
⇒ on avg 50% of PV nameplate rating should be available during ON grid peaks
⇒ orient 60degWofS for best match
Subsections of a
Class A >3MW
Bill
based on % of bill on
avg at uO
% of PV
project saving
Energy Market Price, kWh 39% 20%
Demand Monthly peak, kW 18% 14%
Global Adjustment Factor related to usage
during Ontario’s grid
peak, kW
43% 66%

Slide 15 Joan Haysom Ottawa PEO Sustainability Workshop Feb. 3, 2016
� �
�
����
��� �
��
����
degradation
rates
Financial
discount rate
Initial capital costs
Irradiance
on panel
W/m2
Photovoltaic
efficiency
Surface
area
m2
System
efficiency
Electricity
tariff in
$/kWh
Outdoor testing: (6) Performance and
Degradation and (7) Solar Resource Accuracy

SUNLAB Solar Test Site801 King Edward, parkade of Minto Sportsplex
Longterm
logging of a large
# of instruments
⇒ 2 min
timesteps
⇒ Direct, global
and diffuse
irradiance
⇒ Spectrum
⇒ Weather
⇒ PV & CPV
systems
Slide 16 Joan Haysom Ottawa PEO Sustainability Workshop Feb. 3, 2016
Multiyear Irradiance Dataset Paper
J.E. Haysom et al, submitted to PVSC 2016
The Solar Market
Where is solar on deployment volumes and costs versus other grid generation

Global PV Production Today:
Estimated PV Electricity Production Based on 2014 Installed Capacity
Source: 2014: A Snapshot of Global PV Markets
8%
5%
1%
0
slide courtesy of Yves Poissant, CanMETSlide 18 Joan Haysom Ottawa PEO Sustainability Workshop Feb. 3, 2016
1% of the world electricity generation is
now provided by PV

19
Canadian Solar Resource
• Most of Canada has more sun
than Germany (the #3)
• Ottawa has very good solar
potential within Canada
Germany
Slide 19 Joan Haysom Ottawa PEO Sustainability Workshop Feb. 3, 2016

Source: Natural Resources Canada
Utility Interconnected PV Systems 2014
Canadian Deployments
Slide 20 Joan Haysom Ottawa PEO Sustainability Workshop Feb. 3, 2016
Ontario highlights
• 99% is in Ontario, equalling
1.5% of provincial capacity
• 600MW PV modules produced
in Ontario in 2013,
manufacturing capacity of 1GW
• Industry exported $200M in
2013, or 20% of production
graphic courtesy of Yves Poissant, CanMET

Levelized Cost of Energy (LCOE)for Solar in Ottawa
For new build in ~ 2015$18/kW/yr maintenance, 7% discount rate, 0.5% deg per year, 25 year life, no debt costs
Installation
Cost ($/W)
LCOE
($/kWh)
$2.25 0.19
$2.48 0.21
$2.70 0.22
$2.93 0.24
Sensitivity to cost
Nominal 500kW
system assumed:
⇒19–24 ¢/kWh
���� =
∑ ����
∑�� � ������� Scaled actual energy output from Hydro Ottawa PV systems (microFITs scaled to 500kW)
Source: Sunlab research by
J.E. Haysom et al, Report #2
Collaboration with Hydro OttawaSlide 21 Joan Haysom Ottawa PEO Sustainability Workshop Feb. 3, 2016

Decreasing Feed In Tariffs (Ontario)
0
20
40
60
80
100
2009 2011 2013 2015 2017
FIT
Ta
riff (
¢ / k
Wh
)
Year
microFIT
Rooftop FIT<100kW
Rooftop FIT<500kW
Ground FIT<500kW2016:
20 to 29 ¢/kWh
Slide 22 Joan Haysom Ottawa PEO Sustainability Workshop Feb. 3, 2016Source: OPA & IESO Rate Schedules
via Hampton Consultants
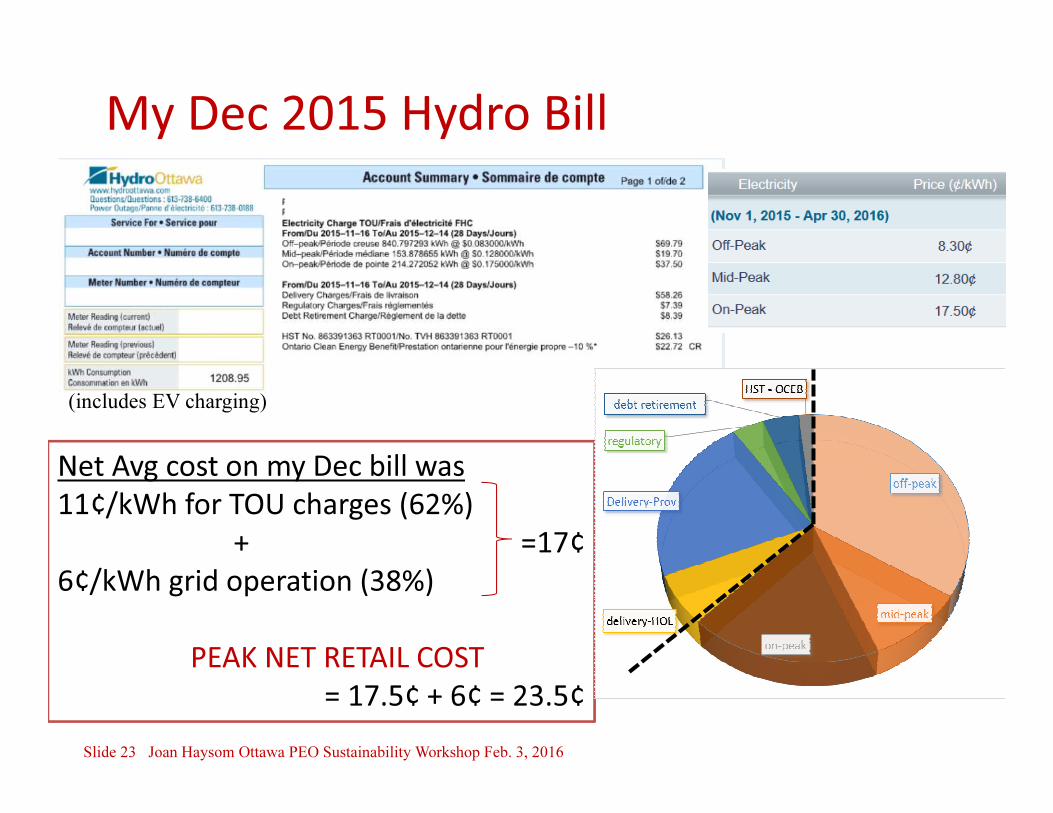
My Dec 2015 Hydro Bill
Slide 23 Joan Haysom Ottawa PEO Sustainability Workshop Feb. 3, 2016
Net Avg cost on my Dec bill was
11¢/kWh for TOU charges (62%)
+ =17¢
6¢/kWh grid operation (38%)
PEAK NET RETAIL COST
= 17.5¢ + 6¢ = 23.5¢
(includes EV charging)

Electricity pricing – the value of when and where
Slide 24 Joan Haysom Ottawa PEO Sustainability Workshop Feb. 3, 2016
• Peak is the most expensive energy
• Top peak hour + margin set required
grid capacity
5-8 ¢/kWh
10-16 ¢/kWh
• Losses = 7% avg, 11% peak
• Cost of infrastructure, O&M

Costs vs Value of Distributed Generation
Source: Perez et al, Energy Policy 39 (2011)Slide 25 Joan Haysom Ottawa PEO Sustainability Workshop Feb. 3, 2016

Ontario Long Term Energy Plan 2013
0
5
10
15
20
25
30
35
2010 2015 2020 2025 2030 2035
Fo
recast
Pro
du
cti
on
(T
Wh
)
Non-Hydro Renewables
Natural Gas and Imports
Source: Ontario LTEP 2013 module 4
via Hampton ConsultantsSlide 26 Joan Haysom Ottawa PEO Sustainability Workshop Feb. 3, 2016

Regulatory
Adaptations
Deployable
solutions
Winning
business
models
A high renewable energy grid
Scalable
Low risk
Low carbon
Distributed
Lowest cost
long term
PV
materialsPV
products
Power
electronics,
software
and
controls
Social
support
+ all the other
technologiesLots of Conservation
Hydro, Wind, Bio, Geo,
Thermal, Co-gen
batteries
optimization
Systems
thinking
Political
Leadership
Slide 27 Joan Haysom Ottawa PEO Sustainability Workshop Feb. 3, 2016

Thank you very much!

Backup

DC AC
AC
AC
Connecting to the Grid
45389
45389
45389
DC AC
AC
AC