Current and Future Cost of Solar Photovoltaics · PDF fileCurrent and Future Cost of Solar...
56
Current and Future Cost of Solar Photovoltaics Key Insights FEBRUARY 2015
Transcript of Current and Future Cost of Solar Photovoltaics · PDF fileCurrent and Future Cost of Solar...
Current and Future Cost of Solar Photovoltaics
Key Insights
FEBRUARY 2015

Agora Energiewende - who we are
2
• Independent and non-partisan Think Tank, 18 Experts
• Mission: How do we make the Energiewende in
Germany a success story?
• Financed with 15 million Euro by the Mercator
Foundation and the European Climate Foundation
(Project duration: 2012-2017)
• Analyzing, assessing, understanding, discussing,
putting forward proposals
www.agora-energiewende.com

Starting point:
uncertainty about the future role of solar PV
among experts and policy makers
3
Own illustration
„The future will
be based on solar
power“
Cost for solar
power will rise
again soon
„Solar is a game-
changer for
energy industry“
Cost for solar
power will
decrease
„The solar bubble
is about to burst“
„Solar will remain
a rich-people-
technology“
Future: very different perspectives on solar power
?
Today: solar photovoltaics becomes mainstream
http://washpost.bloomberg.com/Story?docId=1376-NJJ39B6JIJVD01-3IVODTLTL6845GSMJHEF9LCLR3
http://recurrentenergy.com/press-release/nrg-solar-achieves-commercial-operation-of-two-solar-pv-projects-in-california-developed-by-recurrent-energy/

Objective:
provide a range of future cost scenarios to
support discussion on role of solar PV
4
Cost of solar
PV today
Ambitious
assumptions
Cost of solar
PV in 2050
Min
Max
Conservative
assumptions
Own illustration
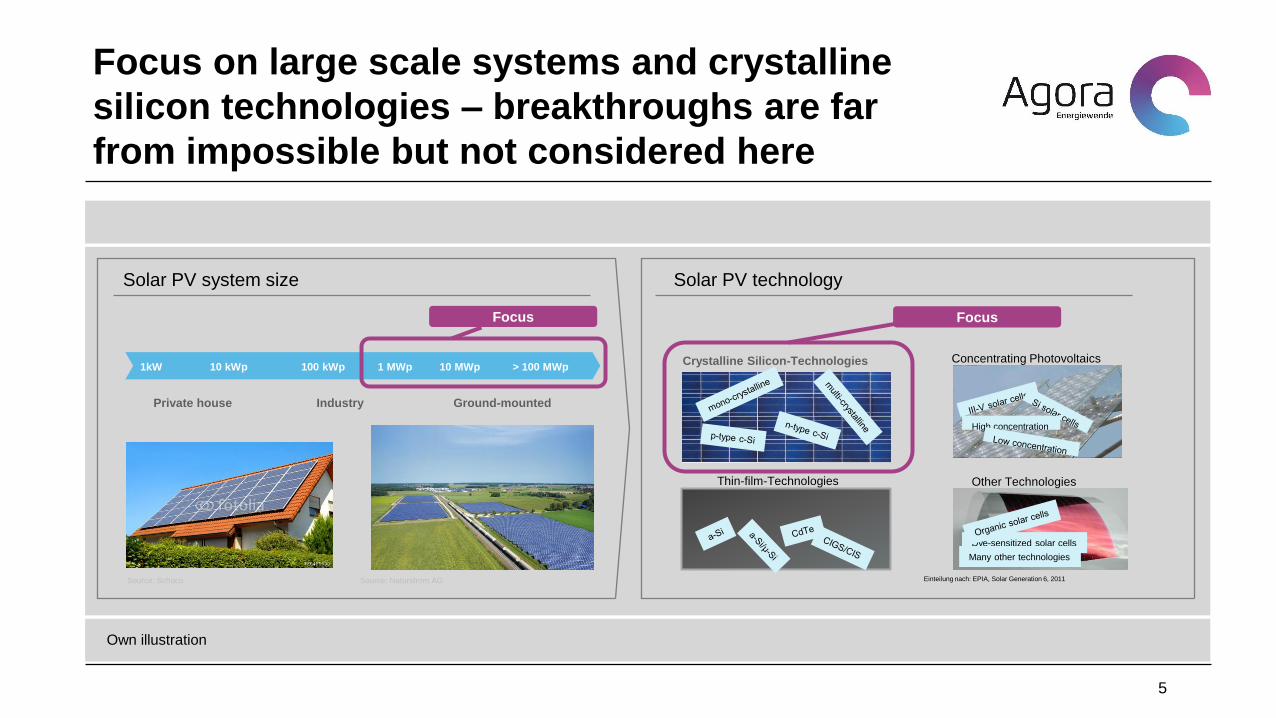
Focus on large scale systems and crystalline
silicon technologies – breakthroughs are far
from impossible but not considered here
5
Own illustration
Solar PV technology Solar PV system size
1kW 10 kWp 100 kWp 1 MWp 10 MWp > 100 MWp
Private house Industry Ground-mounted
Focus
Source: Schüco Source: Naturstrom AG Einteilung nach: EPIA, Solar Generation 6, 2011
Thin-film-Technologies Other Technologies
Concentrating Photovoltaics
High concentration
Dye-sensitized solar cells
Many other technologies
Crystalline Silicon-Technologies
Focus

Future solar module prices in different scenarios
are based on the historical “learning rate”
6
Own illustration
Scenario 4,
year 2050:
140 - 210 EUR/kWp
Scenario 1,
year 2050:
270-360 EUR/kWp
0
250
500
750
1000
1250
1500
1750
2000
Expert discussion: Scenarios of market development Resulting cost of solar modules based on „learning rate“
Example of methodology used
Backup
Scenario 1,
most pesimistic:
175 GW in 2050
Scenario 4,
PV-Breakthrough:
1780 GW in 2050
2050 2014
World market solar PV modules, in GW
2014:
~40 GW
http://www.sunpower.de/haus/solarmodule/x-series/

Feed-in tariff for new large-scale solar photovoltaic in Germany
Key Insight 1:
Solar photovoltaics is already today a low-cost
renewable energy technology
7
*Nominal values, Feed-in tariff applicable at first of January each year, value 2015 excl. adjustment of 0,4 ct/kWh for direct marketing.
Source: German renewable energy law, Agora Energiewende
43
8,7 0
10
20
30
40
2005 2006 2007 2008 2009 2010 2011 2012 2013 2014 2015
~80%
ct/kWh*
For Comparison:
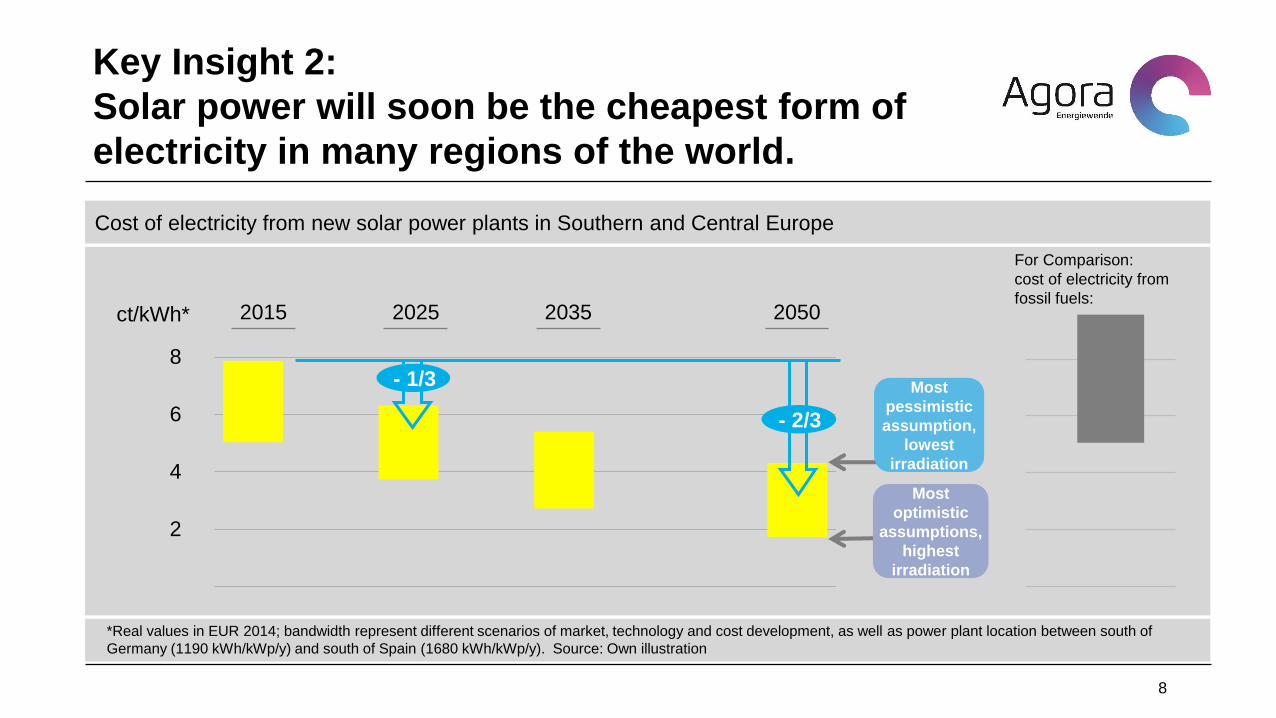
Cost of electricity from new solar power plants in Southern and Central Europe
Key Insight 2:
Solar power will soon be the cheapest form of
electricity in many regions of the world.
8
*Real values in EUR 2014; bandwidth represent different scenarios of market, technology and cost development, as well as power plant location between south of
Germany (1190 kWh/kWp/y) and south of Spain (1680 kWh/kWp/y). Source: Own illustration
For Comparison:
cost of electricity from
fossil fuels: ct/kWh* 2015 2050
8
6
4
2
2025 2035
- 1/3
- 2/3
Most
optimistic
assumptions,
highest
irradiation
Most
pessimistic
assumption,
lowest
irradiation

Cost of electricity of solar PV at different costs of capital, example southern Germany and southern Spain in 2025
Key Insight 3:
Financial and regulatory environments will be
key to reducing cost in the future.
9
* Real values in EUR 2014 ** Weighted average cost of capital (WACC)
Source: own illustration
ct/kW
h*
Higher cost of capital,
higher cost
6
4
Germany (south) Spain (south)
5% 5% 7,5% 10% Cost of capital:**
More sun,
lower cost 2
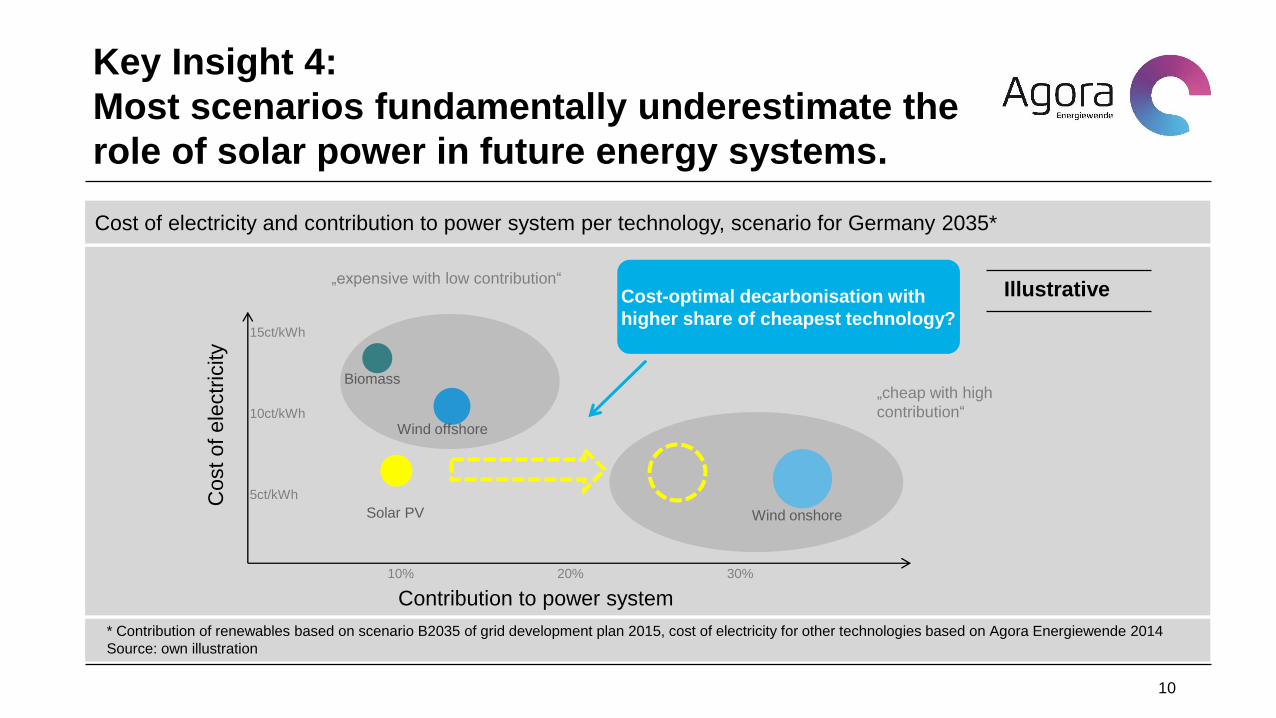
Cost of electricity and contribution to power system per technology, scenario for Germany 2035*
Key Insight 4:
Most scenarios fundamentally underestimate the
role of solar power in future energy systems.
10
* Contribution of renewables based on scenario B2035 of grid development plan 2015, cost of electricity for other technologies based on Agora Energiewende 2014
Source: own illustration
Co
st o
f ele
ctr
icity
Contribution to power system
Cost-optimal decarbonisation with
higher share of cheapest technology?
Solar PV
Biomass
Wind offshore
Wind onshore
10% 30% 20%
5ct/kWh
15ct/kWh
10ct/kWh
„expensive with low contribution“
„cheap with high
contribution“
Illustrative
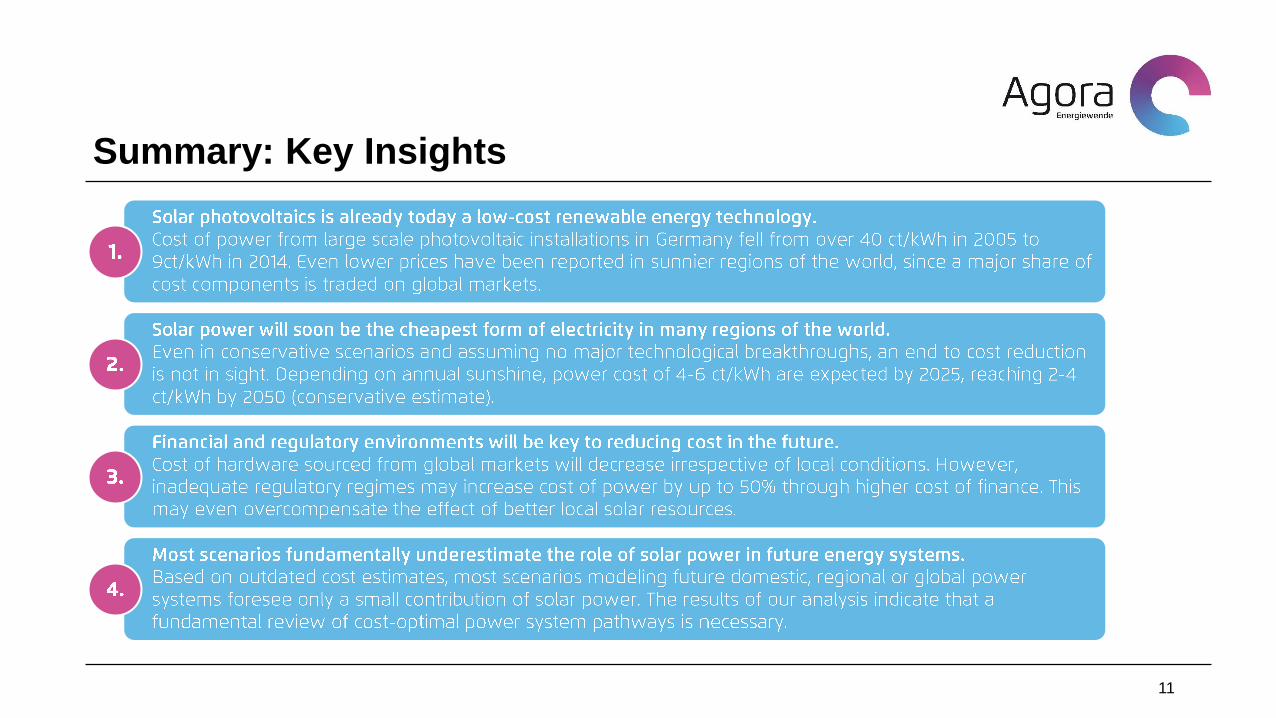
Summary: Key Insights
11
Deep-dive regions and countries
12
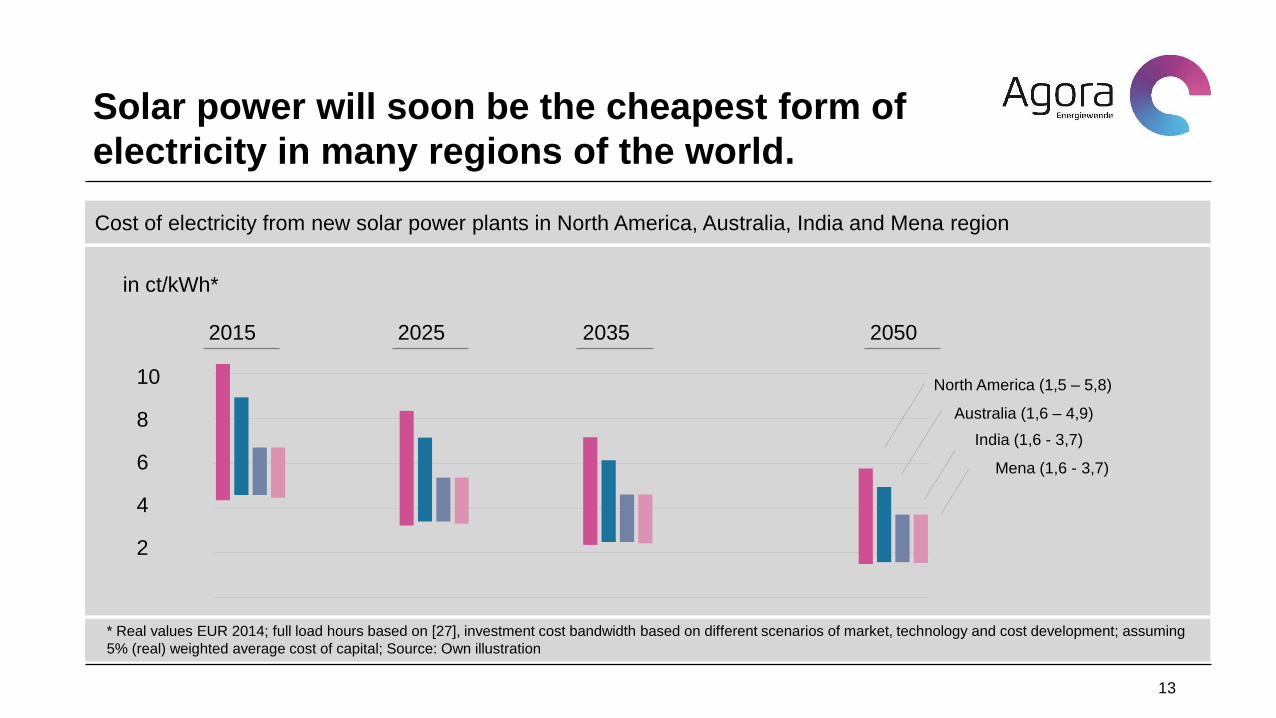
Cost of electricity from new solar power plants in North America, Australia, India and Mena region
Solar power will soon be the cheapest form of
electricity in many regions of the world.
13
* Real values EUR 2014; full load hours based on [27], investment cost bandwidth based on different scenarios of market, technology and cost development; assuming
5% (real) weighted average cost of capital; Source: Own illustration
in ct/kWh*
10
6
4
2
8
North America (1,5 – 5,8)
Australia (1,6 – 4,9)
India (1,6 - 3,7)
Mena (1,6 - 3,7)
2015 2050 2025 2035

UK: Current and future cost of solar energy
14
Exchange rates based on time of analysis (may 2014); ranges include differences in solar irradiation within the country as well as scenarios of technology and global market development;
a global market for modules, inverters and other cost components is assumed, short-term effects of higher cost in new markets (e.g. first GW in a specific country) are not considered
Currency:
EUR
0
2
4
6
8
10
12
14
16
18
Levelized Cost of electricity from large scale solar PV: United Kingdom
2015 2025 2035 2050
ctEUR2014/kWh
Full load hours: 800 - 1150 kWh/kWp p.a., Cost of capital (WACC): between 5% and 10%
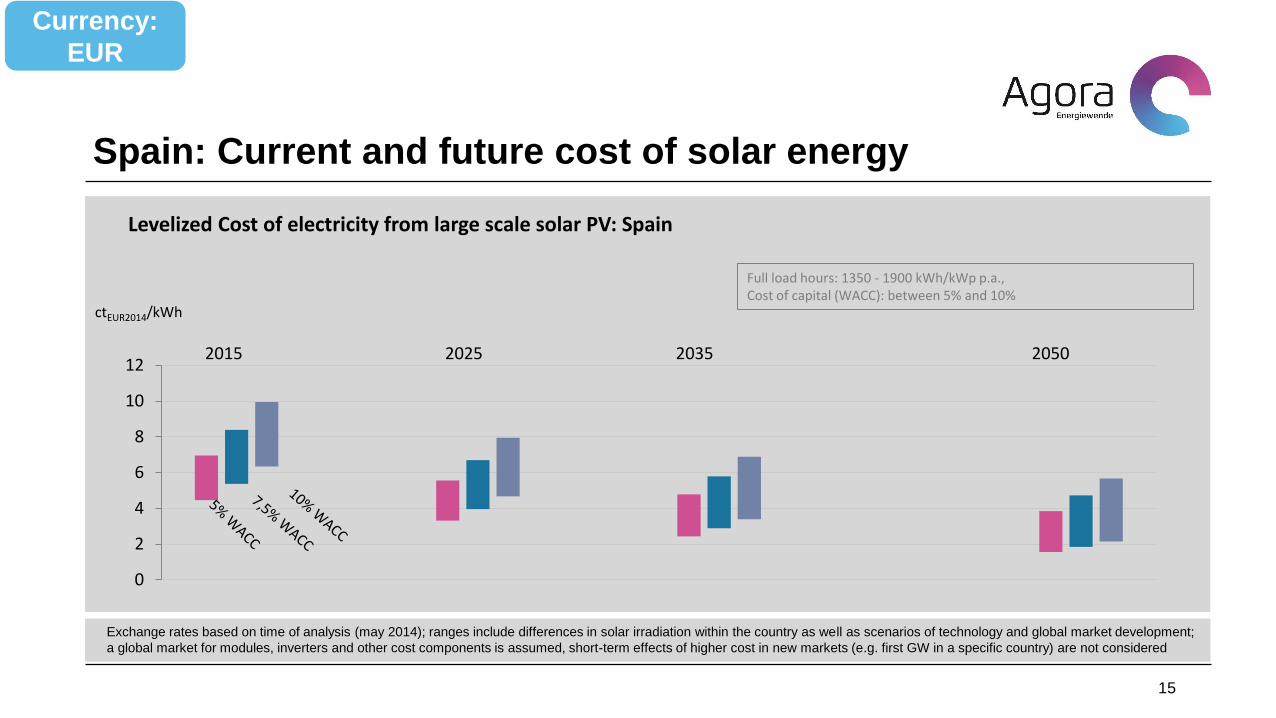
Spain: Current and future cost of solar energy
15
Exchange rates based on time of analysis (may 2014); ranges include differences in solar irradiation within the country as well as scenarios of technology and global market development;
a global market for modules, inverters and other cost components is assumed, short-term effects of higher cost in new markets (e.g. first GW in a specific country) are not considered
Currency:
EUR
0
2
4
6
8
10
12
Levelized Cost of electricity from large scale solar PV: Spain
2015 2025 2035 2050
ctEUR2014/kWh
Full load hours: 1350 - 1900 kWh/kWp p.a., Cost of capital (WACC): between 5% and 10%

France: Current and future cost of solar energy
16
Exchange rates based on time of analysis (may 2014); ranges include differences in solar irradiation within the country as well as scenarios of technology and global market development;
a global market for modules, inverters and other cost components is assumed, short-term effects of higher cost in new markets (e.g. first GW in a specific country) are not considered
Currency:
EUR
0
2
4
6
8
10
12
14
16
Levelized Cost of electricity from large scale solar PV: France
2015 2025 2035 2050
ctEUR2014/kWh
Full load hours: 1000 - 1550 kWh/kWp p.a., Cost of capital (WACC): between 5% and 10%

Poland: Current and future cost of solar energy
17
Exchange rates based on time of analysis (may 2014); ranges include differences in solar irradiation within the country as well as scenarios of technology and global market development;
a global market for modules, inverters and other cost components is assumed, short-term effects of higher cost in new markets (e.g. first GW in a specific country) are not considered
Currency:
EUR
0
2
4
6
8
10
12
14
16
Levelized Cost of electricity from large scale solar PV: Poland
2015 2025 2035 2050
ctEUR2014/kWh
Full load hours: 950 - 1050 kWh/kWp p.a., Cost of capital (WACC): between 5% and 10%

18
Full report available at: http://www.agora-energiewende.org/
Comments and feedback welcome!
Media contact:
Backup – Excel tool and further country-results
19
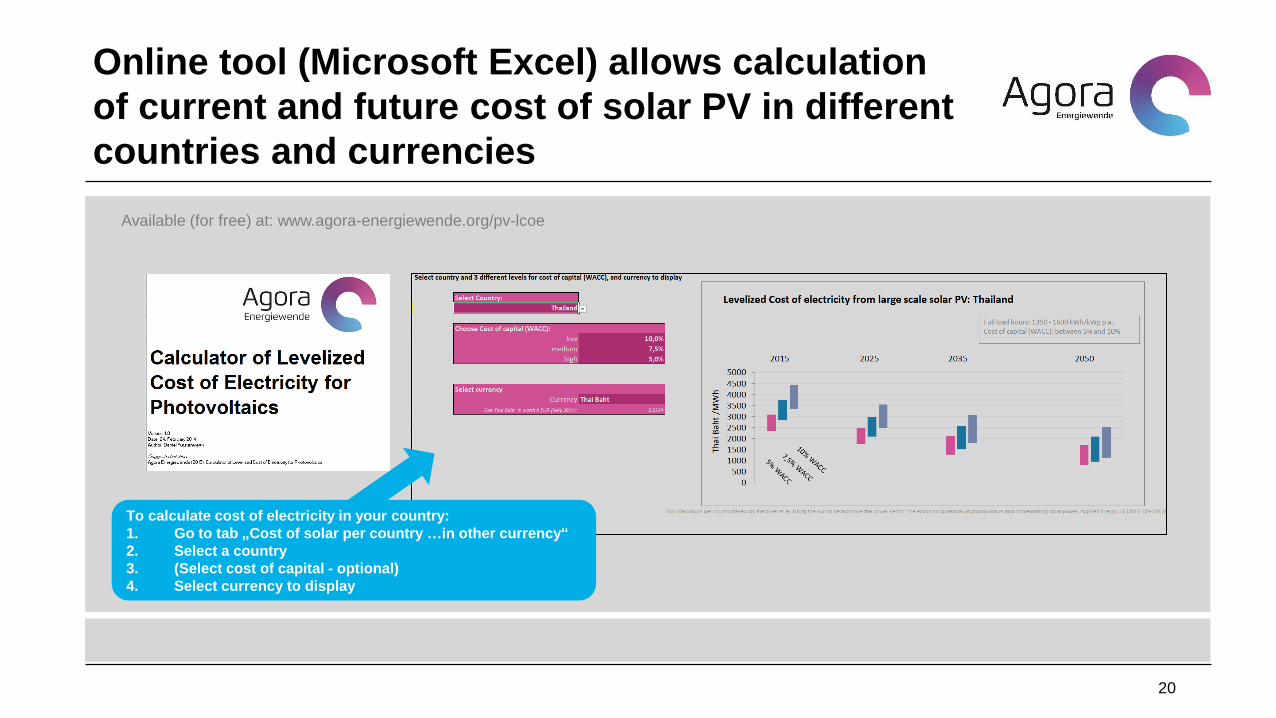
Online tool (Microsoft Excel) allows calculation
of current and future cost of solar PV in different
countries and currencies
20
Available (for free) at: www.agora-energiewende.org/pv-lcoe
To calculate cost of electricity in your country:
1. Go to tab „Cost of solar per country …in other currency“
2. Select a country
3. (Select cost of capital - optional)
4. Select currency to display

Greece: Current and future cost of solar energy
21
Exchange rates based on time of analysis (may 2014); ranges include differences in solar irradiation within the country as well as scenarios of technology and global market development;
a global market for modules, inverters and other cost components is assumed, short-term effects of higher cost in new markets (e.g. first GW in a specific country) are not considered
Currency:
EUR
0
2
4
6
8
10
12
Levelized Cost of electricity from large scale solar PV: Greece
2015 2025 2035 2050
ctEUR2014/kWh
Full load hours: 1300 - 1800 kWh/kWp p.a., Cost of capital (WACC): between 5% and 10%

Germany: Current and future cost of solar
energy
22
Exchange rates based on time of analysis (may 2014); ranges include differences in solar irradiation within the country as well as scenarios of technology and global market development;
a global market for modules, inverters and other cost components is assumed, short-term effects of higher cost in new markets (e.g. first GW in a specific country) are not considered
Currency:
EUR
0
2
4
6
8
10
12
14
16
Levelized Cost of electricity from large scale solar PV: Germany
2015 2025 2035 2050
ctEUR2014/kWh
Full load hours: 900 - 1200 kWh/kWp p.a., Cost of capital (WACC): between 5% and 10%

Italy: Current and future cost of solar energy
23
Exchange rates based on time of analysis (may 2014); ranges include differences in solar irradiation within the country as well as scenarios of technology and global market development;
a global market for modules, inverters and other cost components is assumed, short-term effects of higher cost in new markets (e.g. first GW in a specific country) are not considered
Currency:
EUR
0
2
4
6
8
10
12
Levelized Cost of electricity from large scale solar PV: Italy
2015 2025 2035 2050
ctEUR2014/kWh
Full load hours: 1200 - 1650 kWh/kWp p.a., Cost of capital (WACC): between 5% and 10%
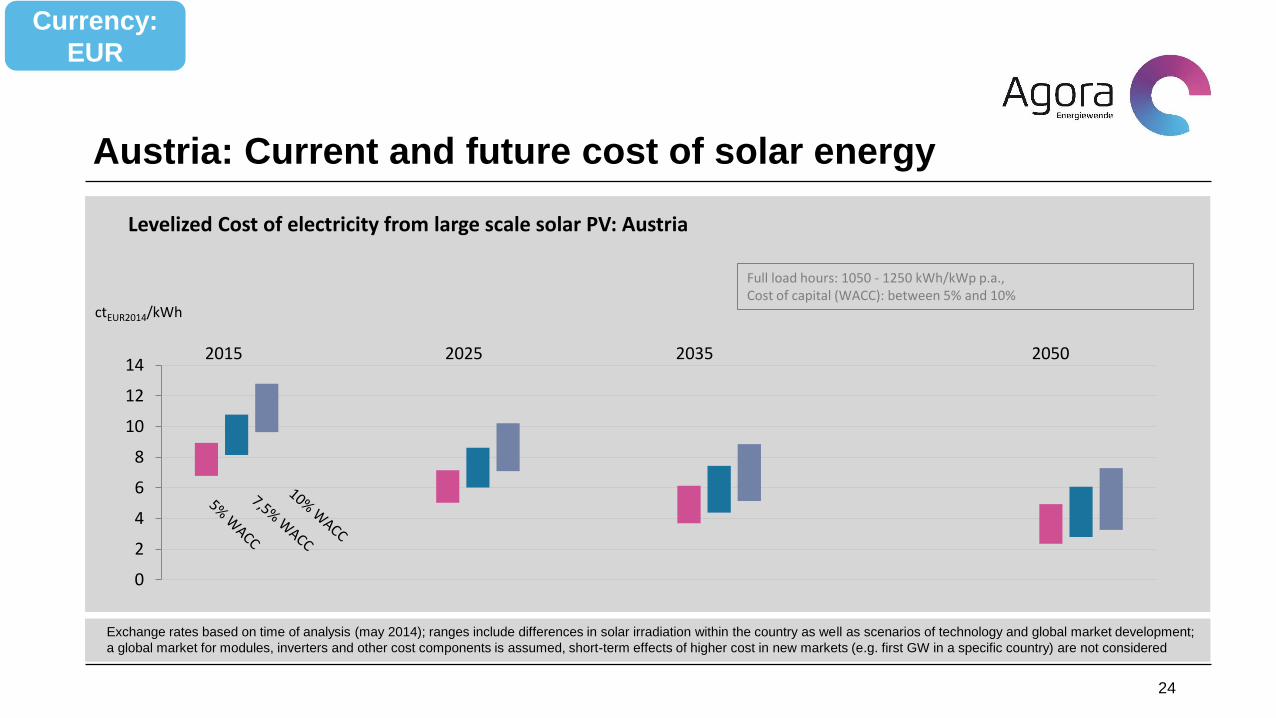
Austria: Current and future cost of solar energy
24
Exchange rates based on time of analysis (may 2014); ranges include differences in solar irradiation within the country as well as scenarios of technology and global market development;
a global market for modules, inverters and other cost components is assumed, short-term effects of higher cost in new markets (e.g. first GW in a specific country) are not considered
Currency:
EUR
0
2
4
6
8
10
12
14
Levelized Cost of electricity from large scale solar PV: Austria
2015 2025 2035 2050
ctEUR2014/kWh
Full load hours: 1050 - 1250 kWh/kWp p.a., Cost of capital (WACC): between 5% and 10%

Denmark: Current and future cost of solar
energy
25
Exchange rates based on time of analysis (may 2014); ranges include differences in solar irradiation within the country as well as scenarios of technology and global market development;
a global market for modules, inverters and other cost components is assumed, short-term effects of higher cost in new markets (e.g. first GW in a specific country) are not considered
Currency:
EUR
0
2
4
6
8
10
12
14
Levelized Cost of electricity from large scale solar PV: Denmark
2015 2025 2035 2050
ctEUR2014/kWh
Full load hours: 1050 - 1100 kWh/kWp p.a., Cost of capital (WACC): between 5% and 10%
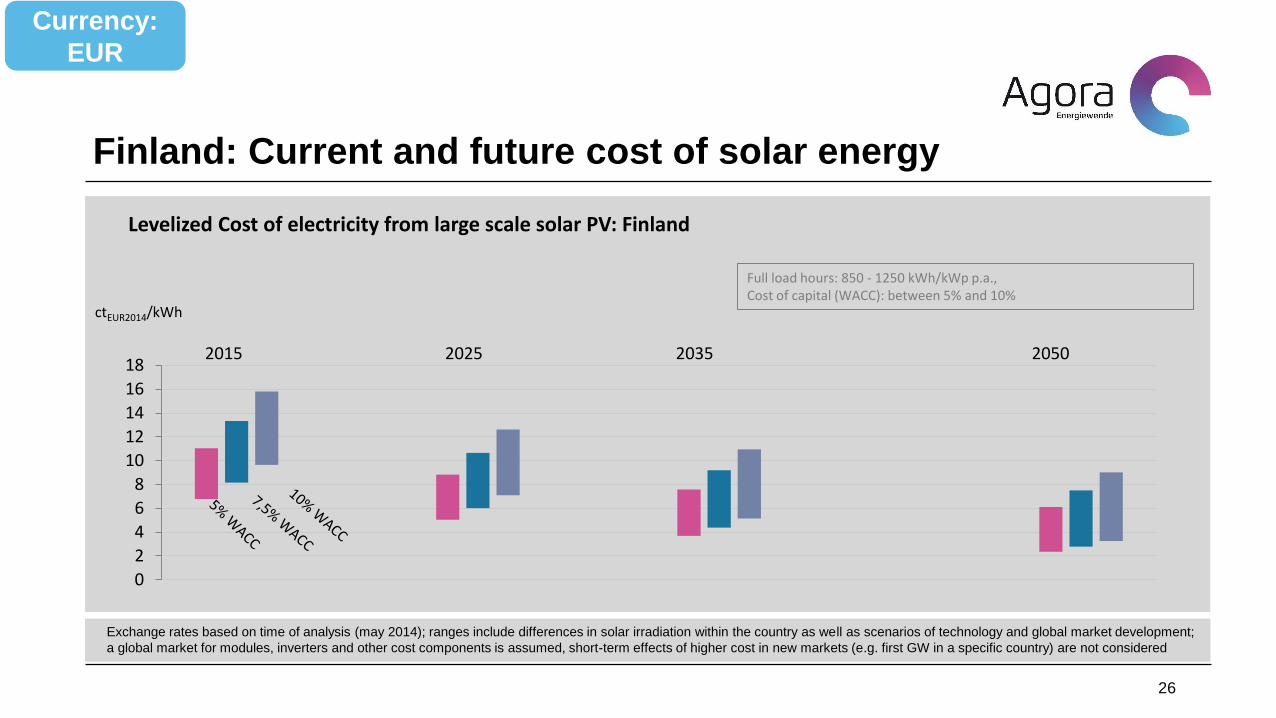
Finland: Current and future cost of solar energy
26
Exchange rates based on time of analysis (may 2014); ranges include differences in solar irradiation within the country as well as scenarios of technology and global market development;
a global market for modules, inverters and other cost components is assumed, short-term effects of higher cost in new markets (e.g. first GW in a specific country) are not considered
Currency:
EUR
0
2
4
6
8
10
12
14
16
18
Levelized Cost of electricity from large scale solar PV: Finland
2015 2025 2035 2050
ctEUR2014/kWh
Full load hours: 850 - 1250 kWh/kWp p.a., Cost of capital (WACC): between 5% and 10%

Latvia: Current and future cost of solar energy
27
Exchange rates based on time of analysis (may 2014); ranges include differences in solar irradiation within the country as well as scenarios of technology and global market development;
a global market for modules, inverters and other cost components is assumed, short-term effects of higher cost in new markets (e.g. first GW in a specific country) are not considered
Currency:
EUR
0
2
4
6
8
10
12
14
Levelized Cost of electricity from large scale solar PV: Latvia
2015 2025 2035 2050
ctEUR2014/kWh
Full load hours: 1100 - 1250 kWh/kWp p.a., Cost of capital (WACC): between 5% and 10%

Romania: Current and future cost of solar
energy
28
Exchange rates based on time of analysis (may 2014); ranges include differences in solar irradiation within the country as well as scenarios of technology and global market development;
a global market for modules, inverters and other cost components is assumed, short-term effects of higher cost in new markets (e.g. first GW in a specific country) are not considered
Currency:
EUR
0
2
4
6
8
10
12
14
Levelized Cost of electricity from large scale solar PV: Romania
2015 2025 2035 2050
ctEUR2014/kWh
Full load hours: 1100 - 1250 kWh/kWp p.a., Cost of capital (WACC): between 5% and 10%

Hungary: Current and future cost of solar energy
29
Exchange rates based on time of analysis (may 2014); ranges include differences in solar irradiation within the country as well as scenarios of technology and global market development;
a global market for modules, inverters and other cost components is assumed, short-term effects of higher cost in new markets (e.g. first GW in a specific country) are not considered
Currency:
EUR
0
2
4
6
8
10
12
14
Levelized Cost of electricity from large scale solar PV: Hungary
2015 2025 2035 2050
ctEUR2014/kWh
Full load hours: 1100 - 1200 kWh/kWp p.a., Cost of capital (WACC): between 5% and 10%

Czech Republic: Current and future cost of solar
energy
30
Exchange rates based on time of analysis (may 2014); ranges include differences in solar irradiation within the country as well as scenarios of technology and global market development;
a global market for modules, inverters and other cost components is assumed, short-term effects of higher cost in new markets (e.g. first GW in a specific country) are not considered
Currency:
EUR
0
2
4
6
8
10
12
14
16
Levelized Cost of electricity from large scale solar PV: Czech Republic
2015 2025 2035 2050
ctEUR2014/kWh
Full load hours: 950 - 1050 kWh/kWp p.a., Cost of capital (WACC): between 5% and 10%

Estonia: Current and future cost of solar energy
31
Exchange rates based on time of analysis (may 2014); ranges include differences in solar irradiation within the country as well as scenarios of technology and global market development;
a global market for modules, inverters and other cost components is assumed, short-term effects of higher cost in new markets (e.g. first GW in a specific country) are not considered
Currency:
EUR
0
2
4
6
8
10
12
14
Levelized Cost of electricity from large scale solar PV: Estonia
2015 2025 2035 2050
ctEUR2014/kWh
Full load hours: 1150 - 1250 kWh/kWp p.a., Cost of capital (WACC): between 5% and 10%

Lithuania: Current and future cost of solar
energy
32
Exchange rates based on time of analysis (may 2014); ranges include differences in solar irradiation within the country as well as scenarios of technology and global market development;
a global market for modules, inverters and other cost components is assumed, short-term effects of higher cost in new markets (e.g. first GW in a specific country) are not considered
Currency:
EUR
0
2
4
6
8
10
12
14
Levelized Cost of electricity from large scale solar PV: Lithuania
2015 2025 2035 2050
ctEUR2014/kWh
Full load hours: 1050 - 1200 kWh/kWp p.a., Cost of capital (WACC): between 5% and 10%

Bulgaria: Current and future cost of solar energy
33
Exchange rates based on time of analysis (may 2014); ranges include differences in solar irradiation within the country as well as scenarios of technology and global market development;
a global market for modules, inverters and other cost components is assumed, short-term effects of higher cost in new markets (e.g. first GW in a specific country) are not considered
Currency:
EUR
0
2
4
6
8
10
12
14
Levelized Cost of electricity from large scale solar PV: Bulgaria
2015 2025 2035 2050
ctEUR2014/kWh
Full load hours: 1150 - 1300 kWh/kWp p.a., Cost of capital (WACC): between 5% and 10%

Slovakia: Current and future cost of solar energy
34
Exchange rates based on time of analysis (may 2014); ranges include differences in solar irradiation within the country as well as scenarios of technology and global market development;
a global market for modules, inverters and other cost components is assumed, short-term effects of higher cost in new markets (e.g. first GW in a specific country) are not considered
Currency:
EUR
0
2
4
6
8
10
12
14
16
Levelized Cost of electricity from large scale solar PV: Slovakia
2015 2025 2035 2050
ctEUR2014/kWh
Full load hours: 950 - 1100 kWh/kWp p.a., Cost of capital (WACC): between 5% and 10%

Slovenia: Current and future cost of solar energy
35
Exchange rates based on time of analysis (may 2014); ranges include differences in solar irradiation within the country as well as scenarios of technology and global market development;
a global market for modules, inverters and other cost components is assumed, short-term effects of higher cost in new markets (e.g. first GW in a specific country) are not considered
Currency:
EUR
0
2
4
6
8
10
12
14
Levelized Cost of electricity from large scale solar PV: Slovenia
2015 2025 2035 2050
ctEUR2014/kWh
Full load hours: 1150 - 1300 kWh/kWp p.a., Cost of capital (WACC): between 5% and 10%
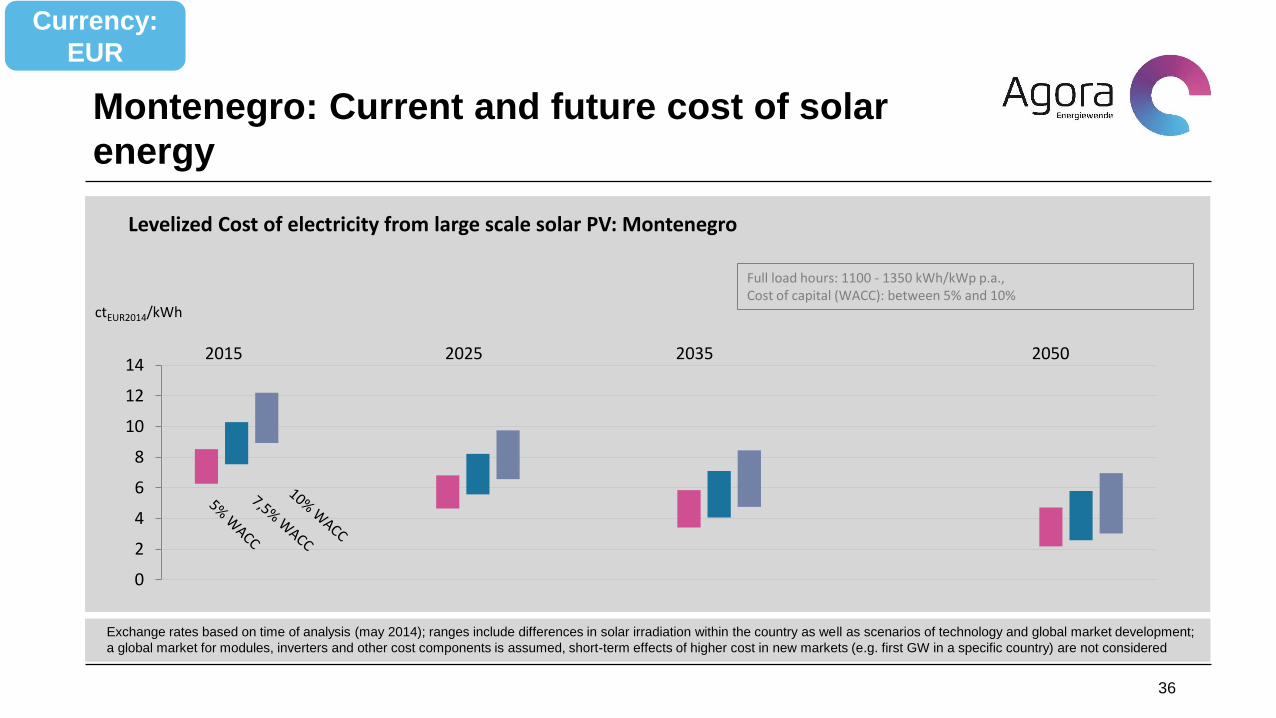
Montenegro: Current and future cost of solar
energy
36
Exchange rates based on time of analysis (may 2014); ranges include differences in solar irradiation within the country as well as scenarios of technology and global market development;
a global market for modules, inverters and other cost components is assumed, short-term effects of higher cost in new markets (e.g. first GW in a specific country) are not considered
Currency:
EUR
0
2
4
6
8
10
12
14
Levelized Cost of electricity from large scale solar PV: Montenegro
2015 2025 2035 2050
ctEUR2014/kWh
Full load hours: 1100 - 1350 kWh/kWp p.a., Cost of capital (WACC): between 5% and 10%

Macedonia: Current and future cost of solar
energy
37
Exchange rates based on time of analysis (may 2014); ranges include differences in solar irradiation within the country as well as scenarios of technology and global market development;
a global market for modules, inverters and other cost components is assumed, short-term effects of higher cost in new markets (e.g. first GW in a specific country) are not considered
Currency:
EUR
0
2
4
6
8
10
12
14
Levelized Cost of electricity from large scale solar PV: Macedonia (FYROM)
2015 2025 2035 2050
ctEUR2014/kWh
Full load hours: 1150 - 1350 kWh/kWp p.a., Cost of capital (WACC): between 5% and 10%

Serbia: Current and future cost of solar energy
38
Exchange rates based on time of analysis (may 2014); ranges include differences in solar irradiation within the country as well as scenarios of technology and global market development;
a global market for modules, inverters and other cost components is assumed, short-term effects of higher cost in new markets (e.g. first GW in a specific country) are not considered
Currency:
EUR
0
2
4
6
8
10
12
14
Levelized Cost of electricity from large scale solar PV: Serbia
2015 2025 2035 2050
ctEUR2014/kWh
Full load hours: 1100 - 1200 kWh/kWp p.a., Cost of capital (WACC): between 5% and 10%

Backup – Non-EU countries
39

Australia: Current and future cost of solar
energy
40
Exchange rates based on time of analysis (may 2014); ranges include differences in solar irradiation within the country as well as scenarios of technology and global market development;
a global market for modules, inverters and other cost components is assumed, short-term effects of higher cost in new markets (e.g. first GW in a specific country) are not considered
Currency:
EUR
0
2
4
6
8
10
12
14
Levelized Cost of electricity from large scale solar PV: Australia
2015 2025 2035 2050
ctEUR2014/kWh
Full load hours: 1050 - 1850 kWh/kWp p.a., Cost of capital (WACC): between 5% and 10%

China: Current and future cost of solar energy
41
Exchange rates based on time of analysis (may 2014); ranges include differences in solar irradiation within the country as well as scenarios of technology and global market development;
a global market for modules, inverters and other cost components is assumed, short-term effects of higher cost in new markets (e.g. first GW in a specific country) are not considered
Currency:
EUR
0
2
4
6
8
10
12
14
Levelized Cost of electricity from large scale solar PV: China
2015 2025 2035 2050
ctEUR2014/kWh
Full load hours: 1150 - 1750 kWh/kWp p.a., Cost of capital (WACC): between 5% and 10%

India: Current and future cost of solar energy
42
Exchange rates based on time of analysis (may 2014); ranges include differences in solar irradiation within the country as well as scenarios of technology and global market development;
a global market for modules, inverters and other cost components is assumed, short-term effects of higher cost in new markets (e.g. first GW in a specific country) are not considered
Currency:
EUR
0
2
4
6
8
10
12
Levelized Cost of electricity from large scale solar PV: India
2015 2025 2035 2050
ctEUR2014/kWh
Full load hours: 1400 - 1850 kWh/kWp p.a., Cost of capital (WACC): between 5% and 10%

Turkey: Current and future cost of solar energy
43
Exchange rates based on time of analysis (may 2014); ranges include differences in solar irradiation within the country as well as scenarios of technology and global market development;
a global market for modules, inverters and other cost components is assumed, short-term effects of higher cost in new markets (e.g. first GW in a specific country) are not considered
Currency:
EUR
0
2
4
6
8
10
12
Levelized Cost of electricity from large scale solar PV: Turkey
2015 2025 2035 2050
ctEUR2014/kWh
Full load hours: 1350 - 1750 kWh/kWp p.a., Cost of capital (WACC): between 5% and 10%

South Korea: Current and future cost of solar
energy
44
Exchange rates based on time of analysis (may 2014); ranges include differences in solar irradiation within the country as well as scenarios of technology and global market development;
a global market for modules, inverters and other cost components is assumed, short-term effects of higher cost in new markets (e.g. first GW in a specific country) are not considered
Currency:
EUR
0
2
4
6
8
10
12
Levelized Cost of electricity from large scale solar PV: Korea, South
2015 2025 2035 2050
ctEUR2014/kWh
Full load hours: 1300 - 1350 kWh/kWp p.a., Cost of capital (WACC): between 5% and 10%

USA: Current and future cost of solar energy
45
Ranges include differences in solar irradiation within the country as well as scenarios of technology and global market development; a global market for modules,
inverters and other cost components is assumed, short-term effects of higher cost in new markets (e.g. first GW in a specific country) are not considered
Currency:
EUR
0
2
4
6
8
10
12
Levelized Cost of electricity from large scale solar PV: United States
2015 2025 2035 2050
ctEUR2014/kWh
Full load hours: 1350 - 1950 kWh/kWp p.a., Cost of capital (WACC): between 5% and 10%
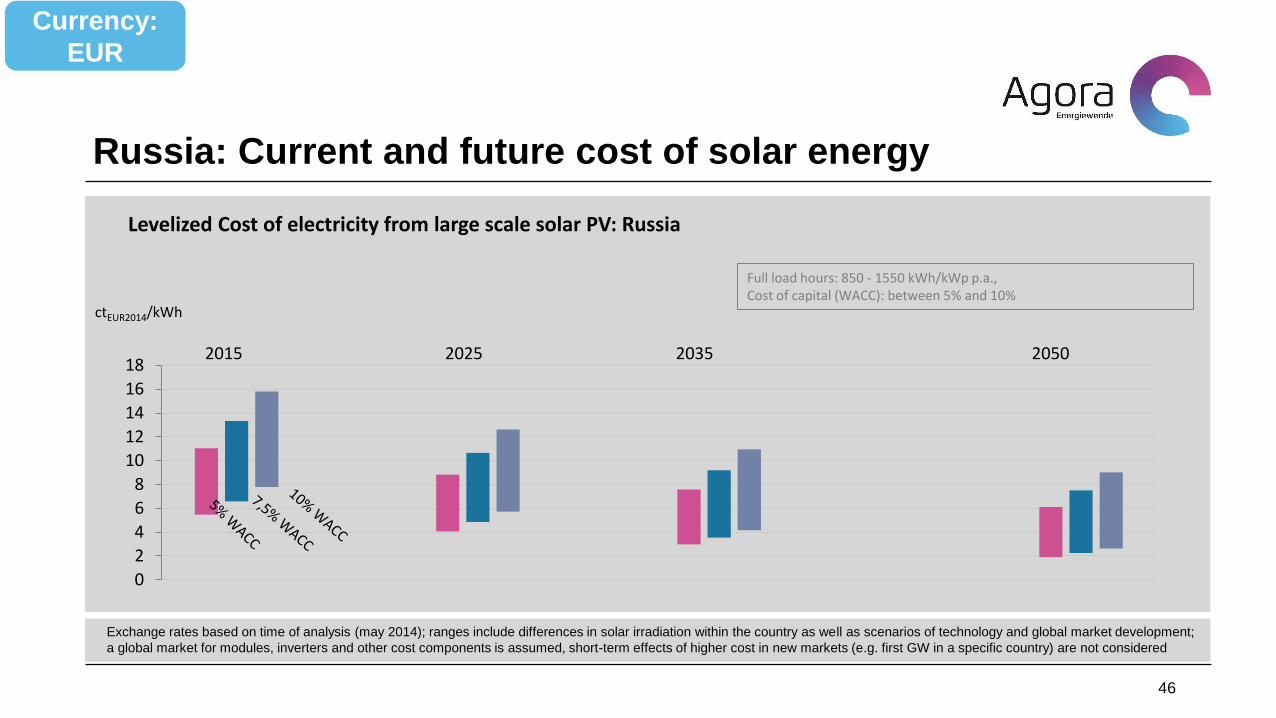
Russia: Current and future cost of solar energy
46
Exchange rates based on time of analysis (may 2014); ranges include differences in solar irradiation within the country as well as scenarios of technology and global market development;
a global market for modules, inverters and other cost components is assumed, short-term effects of higher cost in new markets (e.g. first GW in a specific country) are not considered
Currency:
EUR
0
2
4
6
8
10
12
14
16
18
Levelized Cost of electricity from large scale solar PV: Russia
2015 2025 2035 2050
ctEUR2014/kWh
Full load hours: 850 - 1550 kWh/kWp p.a., Cost of capital (WACC): between 5% and 10%
Backup – further details on analysis
47

Different approaches were applied to estimate
future cost of components and were discussed
in detail in expert workshops
48
Overview of Methodology Applied to Estimate Total System Cost in 2050
Backup
Component Cost in 2014 Cost in 2050 Logic of calculation
Balance of
System
Module
Inverter
Learning curve
Learning curve
Component based
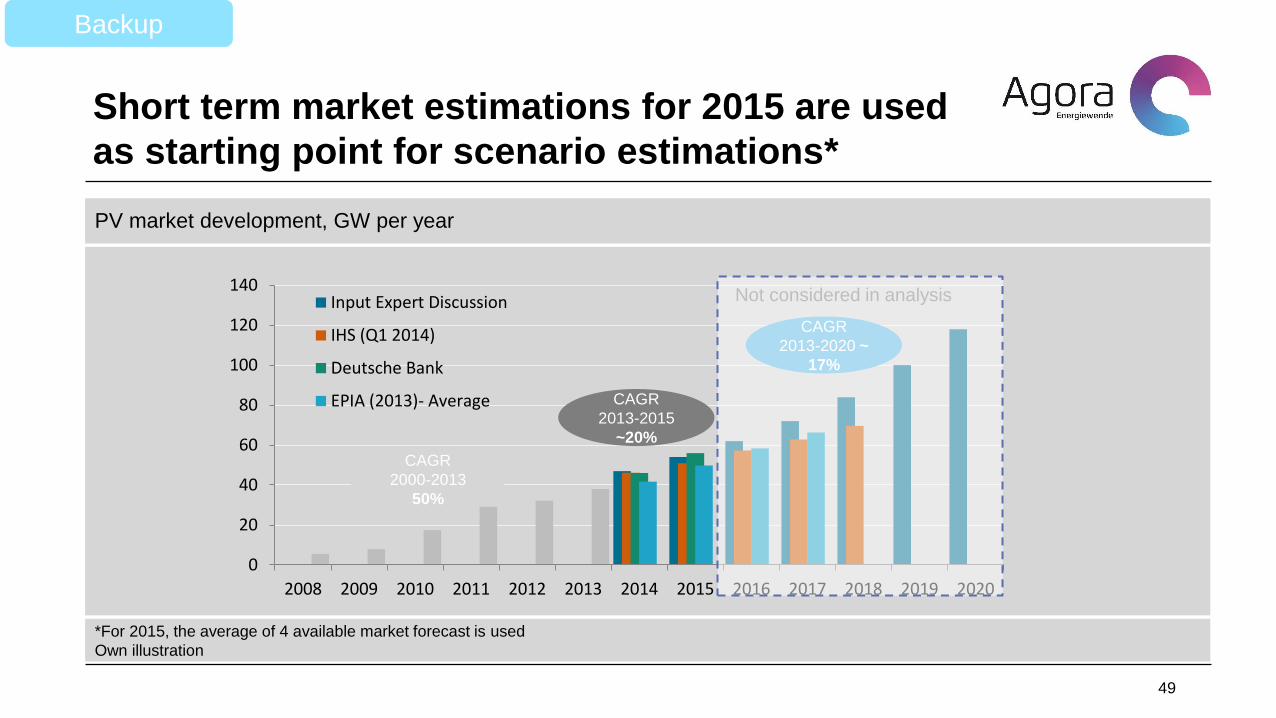
Short term market estimations for 2015 are used
as starting point for scenario estimations*
49
*For 2015, the average of 4 available market forecast is used
Own illustration
PV market development, GW per year
Backup
0
20
40
60
80
100
120
140
2008 2009 2010 2011 2012 2013 2014 2015 2016 2017 2018 2019 2020
Input Expert Discussion
IHS (Q1 2014)
Deutsche Bank
EPIA (2013)- Average
CAGR
2000-2013
50%
CAGR
2013-2020 ~
17%
Not considered in analysis
CAGR
2013-2015
~20%

Number of Duplications in Cumulated Production
Does not Differ Strongly Across All Scenarios
50
Own illustration
Cumulated PV production in scenarios, in TW; duplications
Backup
8
6,2
7
5,5
Number of
Duplications
2013-2050

Crosscheck with global electricity demand:
PV break-through scenario only feasible with
Electricifcation
51
Own illustration
Global Electricity Demand and PV Generation, in 1000*TWh
Backup
Demand based on…
Prof. Breyer IEA
40% 91%
18% 42%
10% 22%
5% 12%
Crosscheck of scenarios:
PV share of electricity
demand in 2050

Increasing module efficiency will lead to cost
reductions in all other parts of the power plant
52
Own illustration
Total land area needed for PV power plant with 1 MWp
Backup
Today:
(Module Efficiency ~15%)
2050:
(Module Efficiency ~30%)
~2
soccer
fields
~1
soccer
field
Effect of higher module efficiency:
• Less modules to install
• Less weight to transport
• Less structures to build
• Less surface to use
~2x Efficiency
~50% Surface
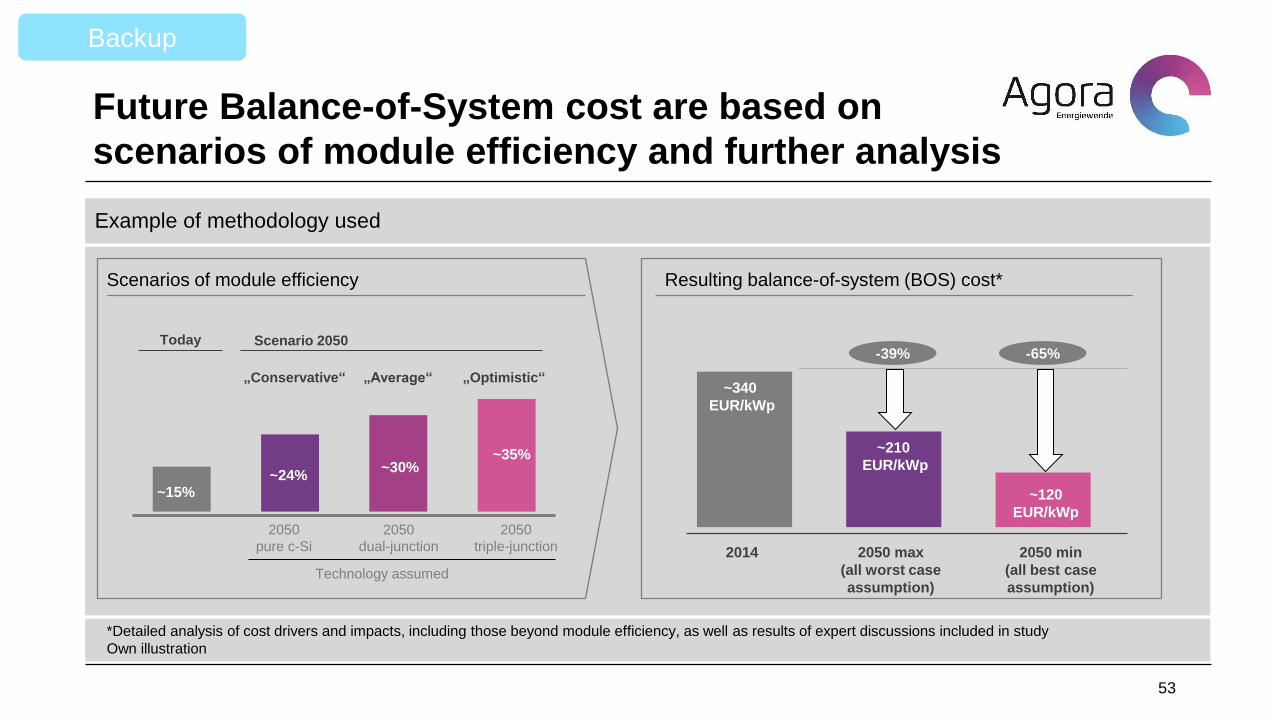
Future Balance-of-System cost are based on
scenarios of module efficiency and further analysis
53
*Detailed analysis of cost drivers and impacts, including those beyond module efficiency, as well as results of expert discussions included in study
Own illustration
Example of methodology used
Backup
Scenarios of module efficiency Resulting balance-of-system (BOS) cost*
„Conservative“ „Average“ „Optimistic“
Today Scenario 2050
~15% ~24%
~30% ~35%
2050
pure c-Si
2050
dual-junction
2050
triple-junction
Technology assumed
2014 2050 max
(all worst case
assumption)
-39% -65%
~340
EUR/kWp
~210
EUR/kWp
~120
EUR/kWp
2050 min
(all best case
assumption)
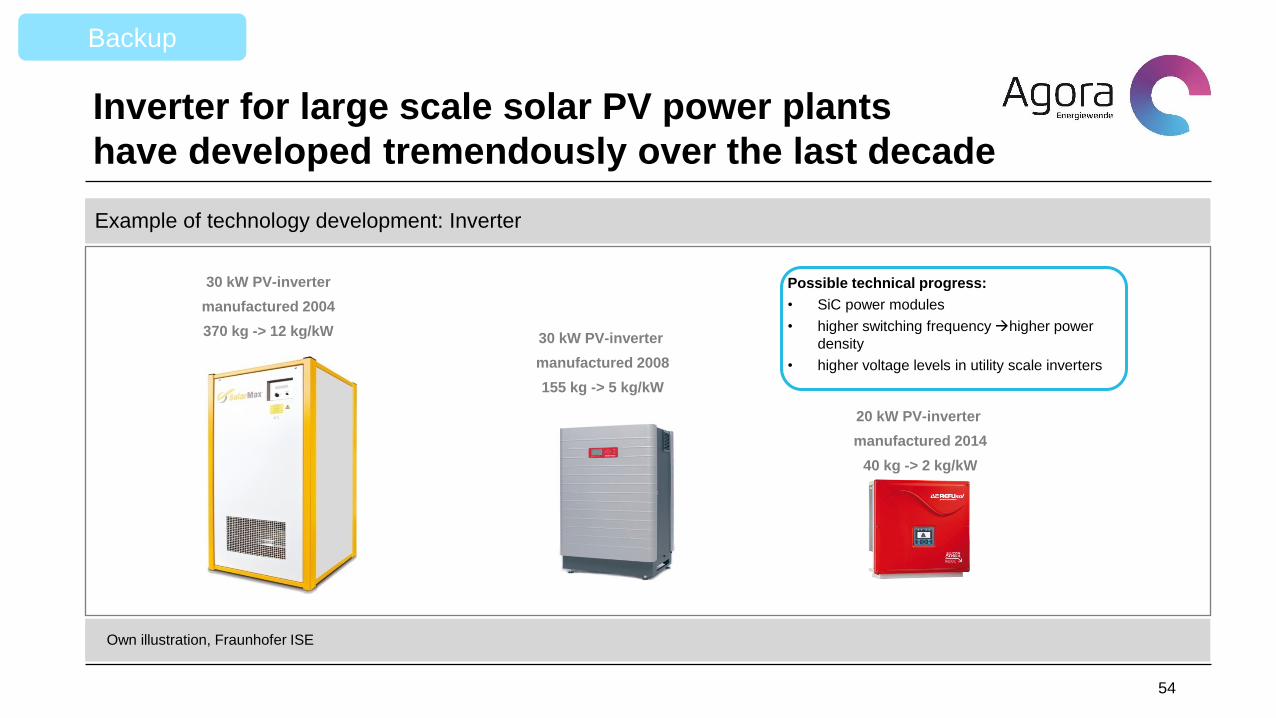
Inverter for large scale solar PV power plants
have developed tremendously over the last decade
54
Own illustration, Fraunhofer ISE
Example of technology development: Inverter
Backup
30 kW PV-inverter
manufactured 2004
370 kg -> 12 kg/kW 30 kW PV-inverter
manufactured 2008
155 kg -> 5 kg/kW
20 kW PV-inverter
manufactured 2014
40 kg -> 2 kg/kW
Possible technical progress:
• SiC power modules
• higher switching frequency higher power
density
• higher voltage levels in utility scale inverters

Future Cost of Inverters are estimated based
on the „Price Experience Curve“
55
Own illustration, Fraunhofer ISE
Inverter Price, Cumulated Produced Capacity
Backup
Scenario 1:
40 EUR/kWp
Scenario 4:
20 EUR/kWp
Scenario 3:
30 EUR/kWp
Source of historic data: SMA

Resulting total cost of ground mounted PV systems
in 2050 ranges between 280 and 610 EUR/kWp – assuming
no technology breakthroughs (conservative estimate)
56
Own illustration
Cost of PV System, in EUR/kWp
Backup
550
357
135
110
43
20
335
206
117
BOS
Module
Inverter
2014
~1000 €/kWp
~610 €/kWp
~280 €/kWp
2050
Max Min