CSN TECHNICAL BULLETIN No. 4 TECHNICAL SUPPORT FOR …
49
CSN TECHNICAL BULLETIN No. 4 TECHNICAL SUPPORT FOR THE BAY-WIDE RUNOFF REDUCTION METHOD VERSION 2.0
Transcript of CSN TECHNICAL BULLETIN No. 4 TECHNICAL SUPPORT FOR …

CSN TECHNICAL BULLETIN No. 4 TECHNICAL SUPPORT FOR THE BAY-WIDE
RUNOFF REDUCTION METHOD VERSION 2.0

Table of Contents
Page Section 1 Introduction and Objectives 3 Section 2 Basic Concepts 3 Treatment Volume 3 Runoff Reduction Volume 5 Runoff Reduction Practices 6 Nutrient EMC Removal 6 Level 1 and 2 STP Design 7 Summary Table 7 The Four Step Compliance Process 8 Section 2 Level 1 and 2 STP Design Guidance 9 Section 3 Minimum Design Criteria for ESD Practices 11 Section 4: The VA DCR Compliance Spreadsheet 11 Section 5: Review and Verification of Plans 12 Appendix A: Documentation of Runoff Reduction Rates 13 Appendix B: Documentation of Nutrient EMC Reduction Rates 24 Appendix C: Level 1/Level 2 STP Design Guidelines 37 Appendix D: Minimum ESD Design Criteria 40 Appendix E: Sample Compliance Spreadsheet 49

CSN Technical Bulletin No. 4 Technical Support for the Runoff Reduction Method
Section 1: Introduction and Objectives The objective of this memo is to provide the scientific basis for creating a workable engineering framework to rapidly design effective combinations of runoff reduction and stormwater treatment practices to promote ESD within states and localities within the Chesapeake Bay watershed. This memo draws extensively from recent work performed by CSN and the Center for Watershed Protection to develop a state-wide compliance system for the Virginia DCR (Hirschman et al, 2008). Indeed, the Appendices are taken directly from that document, and the hard work of Dave Hirschman, Kelly Collins and other CWP staff are gratefully acknowledged. The runoff reduction framework described herein can be adapted to other Bay states, such as Delaware, the District of Columbia, Maryland, Pennsylvania and West Virginia as they develop new stormwater regulations, policies and design manuals. The basic method is flexible enough that each state can modify it to suit their unique conditions and water resources protection objectives. Section 2: Basic Concepts This section outlines the basic concepts that provide the technical foundation for the runoff reduction method. This section defines the treatment volume, runoff reduction volume, runoff reduction practices, nutrient EMC removal, Level 1 and 2 STP design, and the four step compliance process.
2a The Treatment Volume The treatment volume is a slight variation of the 90% capture rule that was originally established in the MDE (2000) stormwater manual. The 90th percentile rainfall event is defined as one-inch of rainfall in most parts of the Bay watershed (although it can range from 0.9 to 1.2 inches. The treatment volume is defined by multiplying the 90th percentile rainfall depth by three site cover runoff coefficients present at the site (forest, turf, and impervious cover), as shown in the equation below. Tv = P * (RvI * %I + RvT * %T + RvF * %F) * SA ____________________________________ 12 Where Tv = Runoff reduction volume in acre feet P = Target Rainfall Depth RvI = runoff coefficient for impervious cover RvT = runoff coefficient for turf cover or disturbed soils RvF = runoff coefficient for forest cover % I = percent of site in impervious cover %T = percent of site in turf cover %F = percent of site in forest cover SA = total site area, in acres
3

CSN Technical Bulletin No. 4 Technical Support for the Runoff Reduction Method
The site cover runoff coefficients to be used are provided in Table 1 Table 1. Site Cover Runoff Coefficients Soil Condition Runoff Coefficient Forest Cover 0.02 to 0.05* Disturbed Soils 0.15 to 0.25* Impervious Cover 0.95 *Range dependent on original Hydrologic Soil Group (HSG) Forest A: 0.02 B: 0.03 C: 0.04 D: 0.05 Disturbed Soils A: 0.15 B: 0.20 C: 0.22 D: 0.25 Restored Soils A: 0.05 B: 0.06 C: 0.10 D: 0.12 The three runoff coefficients provided in Table 1 were derived from research by Pitt et al (2005), Gregory et al (2004), Lichter and Lindsey (1994), Schueler (2001a), Schueler, (2001b), Legg et al (1996), Pitt et al (1999), Schueler (1987) and Cappiella et al (2006). Numerous researchers have documented the impact of construction earthworks on the compaction of soils, as measured by an increase in bulk density, a decline in soil permeability, and an increase in the runoff coefficient. These areas of compacted pervious cover (lawn or turf) have a much greater hydrologic response to rainfall than forest or pasture. The effect of earthworks and soil compaction nearly doubles the runoff coefficient from un-forested areas (as shown in Table 1). The proposed treatment volume has several distinct advantages when it comes to evaluating and sizing runoff reduction and stormwater practices, including:
• Storage is a direct function of impervious cover and disturbed soils, which provides designers incentives to minimize the area of both at a site.
• The treatment volume can be set for water quality and/or channel protection
volume rainfall depth, depending on the characteristics of the receiving stream and the intensity of development in its subwatershed. This avoids the segregation of WQ and CPv requirements that is inherent in many state stormwater manuals, and should reduce compliance costs, at low intensity sites.
• Provides adequate storage to treat pollutants for all storm events, which is
important since the first flush effect has been found to be modest for many pollutants (Pitt et al 2005).
• Allows for all structural and non-structural practices to be assessed on a common
basis according to a roof to stream sequence.
• Explicitly acknowledges the difference between forest and turf cover and disturbed and undisturbed soils, which creates incentives to conserve forests and reduce mass grading and provides a defensible basis for computing runoff reduction volumes for these actions.
4

CSN Technical Bulletin No. 4 Technical Support for the Runoff Reduction Method
2b The Runoff Reduction Volume The runoff reduction volume is the primary stormwater treatment strategy to maintain the same predevelopment runoff volume delivered to the stream after site development. In its simplest terms, this means achieving the same predevelopment runoff coefficient for each storm up to a defined rainfall event. Runoff reduction (RRv) is defined as the total runoff volume reduced through canopy interception, soil infiltration, evaporation, rainfall harvesting, engineered infiltration, extended filtration or evapo-transpiration. Extended filtration includes bioretention or dry swales with under drains that delay the delivery of stormwater from small sites to the stream system by six hours or more. The RRv is considered to be fully inclusive of the Tv at a development site, and designers are strongly encouraged by combining runoff reduction and stormwater treatment practices in a series to maximize the degree of runoff and pollutant reduction achieved at a site. The runoff reduction strategy has many benefits when it comes to managing stormwater at a site. For example, runoff reduction:
• Eliminates the use of credits as originally set forth in the Maryland stormwater manual (MDE, 2000), and instead, makes use of runoff reduction practices an integral element of on-site compliance.
• Provides an objective measure to measure the aggregate performance of
environmental site design, runoff reduction practices and stormwater treatment practices (STPs) together using a common currency (i.e., the treatment volume).
• Mimics predevelopment hydrology with respect to runoff volume, duration and
velocity which is important to reduce the increased frequency and duration of runoff events that stream channels experience after development. If the Channel Protection rainfall depth is used to define the treatment volume, it provides an attractive alternative to the 24 hour extended detention Channel Protection volume first advanced in the 2000 MDE manual. Even if ED is still needed to comply, the runoff reduction volume used for water quality can be directly subtracted from CPv.
• Helps maintain groundwater recharge that supports stream baseflow when it is not
raining, without specifying a mandatory infiltration or recharge requirement that can be problematic in certain terrain or soil conditions in the Bay watershed
• Enhances the degree and reliability of pollutant mass removal for runoff reduction
and stormwater treatment practices since pollutant loads are the product of both stormwater flow volume and the treated pollutant concentration leaving a practice.
5
CSN Technical Bulletin No. 4 Technical Support for the Runoff Reduction Method
2c. The List of Runoff Reduction Practices
The following practices are considered to have runoff reduction potential:
1. Sheetflow to Conserved Open Space (formerly a stormwater credit) 2. Rooftop Disconnection (formerly a credit) 3. Permeable Paving 4. Green Roofs 5. Grass Channel (formerly a credit) 6. Bioretention/Dry Swale 7. Wet Swale 8. Infiltration 9. Extended Detention (low) 10. Soil Amendments 11. Rain Tanks/Cisterns
The specific amount of runoff reduction achieved by these practices is outlined in Table 3 and Appendix A.
2d STP Nutrient EMC Reductions
The Core ESD Principles recommend that Bay state stormwater manuals should contain specific and numeric performance criteria to assure the aggregate nutrient load delivered to the Chesapeake Bay and Coastal Bays from urban development is actually reduced over time (CSN, 2008). The recommended nutrient based limit for post-development phosphorus is about 0.25 lb/acre/yr. The load limit creates an accountability mechanism to ensure development projects really meet watershed objectives to protect the Chesapeake Bay. The basic concept is that new development on non-urban land must not exceed the average load for non-urban land using effective stormwater practices in the watershed. The proposed nutrient requirement is similar to proposed nutrient stormwater regulations under consideration in the Commonwealth of Virginia. The Virginia load limits were computed using the Chesapeake Bay Model Tributary Strategy Confirmation Runs. The load limits were established as the total of forest, crops, pasture and mixed open space, adjusted for delivery to the Bay (3,418,105 lbs for TP), divided by their total land area in the state (12,209,171 acres). This yields an average load of 0.28 lbs/ac/yr for TP and 2.68 lbs/ac/yr for TN. A simple spreadsheet calculation is used to define on-site compliance with the nutrient load, using both runoff reduction and phosphorus removal rates for each practice. Considerable analysis was performed to define the appropriate measure of nutrient removal by runoff reduction and stormwater treatment practices. Recent work has shown that it is extremely important to segregate out the reduction in event mean concentration (EMCs) as it travels through the practice. To this end, the most recent version of the NPRD was reanalyzed to define the median and 75% quartile reduction in EMC for both phosphorus and nitrogen for a range of practices (see Appendix B). Given the similarity
6

CSN Technical Bulletin No. 4 Technical Support for the Runoff Reduction Method
in EMC reductions for both phosphorus and nitrogen within the same practice, a decision was made to rely on a single nutrient (phosphorus).
2e Level 1 and Level 2 STP Design
Most state stormwater manuals in the Bay contain one basic set of design criteria for the major groups of STPs, with some design features that required, with others that are merely encouraged. The runoff reduction method departs from this by establishing a baseline design level (Level 1) and a more sophisticated design (Level 2) that can achieve a greater degree of runoff and pollutant reduction. This is important since research has shown that the performance of ESD and STP practices can vary greatly depending on both sizing and design features. Section 3 describes the technical approach that was undertaken to tease out which design and sizing factors could be assigned to baseline Level 1 design and more innovative designs that would have greater runoff and nutrient reduction (Level 2).
2f Summary Table for Current Practices
Table 2 summarizes the comparative runoff reduction, EMC reduction and total mass reductions associated with different ESD practices, based on research documented in Appendix A and B. When a range is shown, the first number is for Level I STP design and the second is for Level 2 STP design. In general, the practices fall into three groups (1) practices that are effective in both runoff and pollutant reduction (2) practices that are effective in runoff reduction but not pollutant reduction, and (3) practices that are ineffective in runoff reduction but are effective in pollutant reduction.
Table 2: Comparative Runoff Reduction, TP and TM EMC Removal Rates Practice Level 1 RR
(%) Level 2 RR
(%) TP EMC PR
(%) TN EMC PR
(%) Infiltration 50 90 25 15 Bioretention 40 80 25 to 50 40 to 60 Pervious Paver 45 75 25 25 Green Roof 45 60 0 0 Dry Swale 40 60 20 to 40 25 to 35 Rain Tanks/Cisterns 40 40 0 0 Rooftop Disconnection 25 50 30 15 Grass Channel 15 30 15 20 Dry ED Pond 0 15 15 10 Wet Pond 0 0 50 to 75 30 to 40 Constructed Wetland 0 0 50 to 75 25 to 55 Sand Filter 0 0 60 to 65 30 to 45 See Appendices A, B and C for the derivation of these numbers
7

CSN Technical Bulletin No. 4 Technical Support for the Runoff Reduction Method
2f. The Four Step Compliance Process
The runoff reduction method relies on a four step compliance procedure, as shown in Figure 1, and described below.
Step 1: Apply ESD Practices to Minimize IC, Grading and Loss of Forest Cover. This step focuses on how to implement environmental site design practices prior to site layout using the ESD plan and map. The goal is to minimize impervious cover and mass grading, and maximize retention of forest cover, natural areas and undisturbed soils. Step 2: Compute Post Development Land Cover. In the second step, a spreadsheet is used to compute the three site runoff coefficients, and calculate a site-specific target treatment volume and phosphorus load reduction limit. Step 3: Apply Runoff Reduction Practices. In this step, the designer experiments with combinations of the nine runoff reduction practices on the site. In each case, they estimate the spatial area to be treated by each runoff reduction practice, and chip away at the required treatment volume within each drainage area on the site. Step 4: Compute Phosphorus Reduction by RRPs and Conventional STPs. In this step, the spreadsheet checks to see whether the phosphorus load reduction has been achieved at the site. Removal by previously entered runoff reduction practices is automatically calculated, and the designer can then add conventional STPs such as filtering practices or linear wetlands to meet their remaining requirement, if needed. In reality, the process is iterative for more difficult sites. When compliance cannot be achieved on the first try, designers can return to prior steps, to see what alternative combination of ESD practices, runoff reduction practices, or conventional STPs are needed for compliance. In the event that compliance is impossible on the site, the spreadsheet computes the unmet phosphorus load for the site, which would be subject to an impervious cover mitigation fee.
8

CSN Technical Bulletin No. 4 Technical Support for the Runoff Reduction Method
Figure 1. Sequence for Assessing Runoff Reduction Opportunities at a Site
Step 1Conserve
Natural Areas and Soils
Step 2Apply ESD Reduction Practices
Step 3Apply Engineered
Runoff ReductionPractices
Reduce Tv
req’ts?
ReduceTv
req’ts?
Step 4Apply Standard
Treatment Practices
Step 5Mitigation Fee for balance of unmet P
Load
• Soil Amendments• Forest Conservation• Site Design to Minimize Impervious Area•Reduce Soil Disturbance
• Roof Disconnects•Sheetflow to Cons• Reforestation•Soil Amendments• Permeable pavers
• Bioretention• Dry Swales • Green Roofs• Infiltration •Traditional STPs
•Adjust Site loads for Phosphorus treatment
Meet Tvreq’ts?
Meet PR req’ts?
A step by step approach to comply at a development site
Tv: Treatment Volume for SiteESD: Environmental Site Design STP: Stormwater Treatment Practices
Section 3. Basis for Level 1/Level 2 STP Design Guidelines
This section documents the scientific rationale and assumptions used to assign sizing and design features to Level 1 and Level 2 STPs that are presented in Appendix C. Standard Design Features. The first step identified the “standard” design features that should be included in all designs (i.e., not directly related to differential nutrient removal rates). These include any features needed to maintain proper function of the STP, as well as its safety, appearance, safe conveyance, longevity, feasibility constraints, standard setbacks or maintenance needs. These standard features will be outlined in the detailed design specifications to be developed by CSN and others later in the year. Design Point Tables. Appendix B of the Stormwater Retrofit Manual (Schueler et al, 2007) contains a series of tables that describe design factors that increase/decrease overall pollutant removal rates, and these were initially used to assign design features into Level 1 and 2. It should be acknowledged that design point method was primarily developed to evaluate removal rates for under-designed retrofits that may lack the full range of design features present in a new development setting. For example, the method evaluates removal for quartiles above and below the median removal. For a new development setting, the base removal rate is the median (i.e., Level 1), whereas Level 2 is the 75th percentile value. In addition, the original design point method was designed to estimate
9

CSN Technical Bulletin No. 4 Technical Support for the Runoff Reduction Method
removal for eight different pollutants; changes were made in this memo to reflect the more specific goal of nutrient removal. Review of 2007 NPRD Rates, CWP (2007) recently released an update to the Winer (2000) national pollutant removal database. 27 new performance monitoring studies were added, mostly for under-represented practices such as bioretention, infiltration and water quality swales. Even so, nearly 80% of the performance entries in the NPRD were built and monitored from 1980 to 2000, so many of the older designs may not reflect modern design features (particularly for ponds and wetlands). Review of Individual Studies. To gain additional insight into the value of different sizes and design features, 50 stormwater technical notes were reviewed that provided a more in-depth analysis of more than 70 studies included in the NPRD (Schueler and Holland, 2000). In addition, selected references were reviewed from the 2000 to 2006 stormwater literature, with an emphasis on design enhancements for infiltration, bioretention, and water quality swales. Greater emphasis was placed on studies in close geographic proximity to the Bay states. Based on the foregoing analysis, five primary design factors were used to define Level 1 and Level 2 STPs: increased treatment volume, increased runoff reduction volumes, enhanced design geometry, vegetative condition, and use of multiple treatment methods. More on the basis for each split are provided below.
1. Increased Treatment Volume. Increasing the treatment volume can enhance nutrient removal rates, up to a point. The existing treatment option captures about 90% of the annual runoff volume, so further increases can only bring out modest increases, unless the larger volume increases the residence time or rate of nutrient uptake (which has been documented for ponds and wetlands). Therefore, three incremental levels of greater treatment volume were considered for each STP: 110%, 125 and 150% of the base Tv. 2. Increased Runoff Reduction Volume. The second strategy to enhance nutrient removal rates is to increase the proportion of the treatment volume that is achieved by runoff reduction. In this instance, design features that could significantly enhance runoff reduction volumes were generally assigned to Level 2. 3. Enhanced Design Geometry. A third strategy to split STPs according to nutrient removal is to isolate geometry factors that are known to influence either hydraulic performance or create better treatment conditions. Examples include flow path, depth of filter media, multiple cells, the SA/CDA ratio, max CDA and minimum ED time. 4. Vegetative Condition. A fourth splitting strategy involves the ultimate type and cover of vegetation within the STP insofar as it influences nutrient uptake, increases the ET pump, or stabilizes trapped sediments or a filter bed. Landscape
10

CSN Technical Bulletin No. 4 Technical Support for the Runoff Reduction Method
designs that maximize tree canopy or otherwise increase the ultimate vegetative cover for a practice were often used to support Level 2 designs. 5. Multiple Treatment Methods. The last major strategy is to combine several treatment options within a single practice to increase the reliability of treatment.
Section 4. Deriving Minimum Design Criteria for Select ESD Practices Under the runoff reduction method, several ESD practices that were originally offered as credits in some state manuals (e.g., MDE, 2000) are now full fledged runoff reduction practices. From a design standpoint, however, it is still important to establish qualifying criteria for the following practices:
• Site Reforestation • Soil Restoration • Sheetflow to Conserved Open Space • Rooftop Disconnection • Grass Channels
The updated design criteria for these ESD practices are provided in Appendix D. In most cases, the new design criteria were based on the original qualifying credit criteria contained in the 2000 MDE Manual, but they have been updated to reflect local experience and further credit details in other manuals produced since 2000 (e.g., Minnesota, Credit River, DCR). The soil restoration and site reforestation criteria were drafted using recent research.
Section 5: The VA DCR Compliance Spreadsheet A hard copy of the current version of the VA DCR compliance spreadsheet is provided in Appendix E. The spreadsheet is being tweaked based on input from design engineers and testing on difficult sites, and will be finalized in the summer of 2008. Several minor adaptations would need to be made if it were to be adopted for ESD compliance in other Bay states. Most engineers like the simplicity of the spreadsheet and particularly like the ability to quickly experiment with combinations of runoff reduction practices to find the most cost-effective solution. Plan reviewers like the fact that most of the calculation cells are hidden (and can’t be changed by the user), so the focus is on coming up with the best combination of practices. The spreadsheet method has been tested on about a half dozen highly constrained sites (existing site plans for small infill, flat coastal plain, highways, and steep slope sites). In most, but not all cases, designers found acceptable solutions using the spreadsheet for water quality (one-inch). The ability to meet the channel protection criteria was not tested, since this sizing issue has yet to be resolved in Virginia.
11

CSN Technical Bulletin No. 4 Technical Support for the Runoff Reduction Method
Section 6 Review and Verification in Site Plan Review and Construction Runoff reduction needs to be explicitly addressed during three stages of local development review- feasibility during concept design, confirmation in final design, and verification during final construction inspection at the site. 1. Early Concept Design. Practices are initially considered during site layout by carefully considering existing drainage features, forest conservation, stream buffers, wetland, floodplain, recharge, habitat, steep slopes, zero-order stream protection, and other natural area protections that apply to the site. The early map/plan should include initial estimates of site forest, turf and impervious cover, and the initial spreadsheet calculation indicating how they have met the treatment volume and pollutant removal requirements. The local review authority then checks both the practice delineations and the computations as part of the stormwater concept plan review. 2. Final Design. The practices are reviewed a second time during final design to confirm whether they meet the both the spreadsheet and practice feasibility requirements (e.g., slopes, contributing drainage area, flow paths, etc). The designer should be able to justify the precise boundaries of each practice area drawn on the plan, and indicate in the submittal whether any additional grading, soil amendments or plantings are needed to qualify. Reviewers would check practice area delineations, make sure flow paths are realistic, and make sure any required easements or management plans needed for the practice are secured. It should be emphasized that full engineering review would still be required for any individual structural practice used at the site to ensure they meet the Level 1 or 2 design criteria. 3. Construction Inspection. Field inspection is essential to verify that runoff reduction practices are properly installed at the site. This is normally done as a site walk through at the time of final construction inspection. To ensure compliance, communities may want to set the value of the performance bond based on the pre-practice, unadjusted treatment volume for the site to ensure runoff reduction practices are correctly installed.
12

CSN Technical Bulletin No. 4 Technical Support for the Runoff Reduction Method
APPENDIX A: DERIVATION OF RUNOFF REDUCTION RATES FOR SELECT STPs
Runoff reduction (RR) is defined as the average annual reduction in stormwater runoff volume. For stormwater treatment practices, runoff can be reduced via canopy interception, soil infiltration, evaporation, transpiration, rainfall harvesting, engineered infiltration, or extended filtration. Extended filtration includes bioretention or dry swales with underdrains that delay the delivery of stormwater from small sites to the stream system by six hours or more. Prior to 2003, very few research studies reported flow reductions in the literature, reporting instead on the change in inflow and outflow event mean concentrations (EMC). Recently, more studies have been reporting flow reductions, particularly for LID and STP projects, although data is still limited. Summaries of the runoff reduction performance for individual STPs are discussed in this section. From a design standpoint, the runoff reduction rates are appropriate for use in the VA spreadsheet up to the water quality storm event. Runoff reduction rates were generally an annual average based on the study site water balance. These rates do not apply to reduction achieved for the channel protection volume storm or larger events. The runoff reduction numbers are dependent on meeting the Level 1 or 2 design criteria and minimum eligibility criteria as set forth in Appendix C and D. Given the limited number of runoff reduction performance studies available, the recommended rates were selected using conservative assumptions, and some of the numbers are considered provisional until more data becomes available. Green Roofs Considerable research has been conducted in recent years to define the runoff reduction capability of extensive green roofs (Table A-1). Reported rates for runoff reduction have been shown to be a function of function of media depth, roof slope, annual rainfall and cold season effects. Based on the prevailing climate for the region, a conservative runoff reduction rate for green roofs of 45 to 60% is recommended for initial design.
Table A-1. Volumetric Runoff Reduction by Green Roof LID Practice Location Runoff Reduction Reference Green Roof US 40 to 45% Jarrett et al (2007) Green Roof Germany 54% Mentens et al (2005) Green Roof MI 30 to 85% Getter et al (2007 Green Roof OR 69% Hutchinson (2003) Green Roof NC 55 to 63% Moran and Hunt (2005) Green Roof PA 45% Denardo et al (2005) Green Roof MI 50 to 60% VanWoert et al (2005) Green Roof ONT 54 to 76% Banting et al (2005) Green Roof GA 43 to 60 Carter and Jackson (2007)
RR Estimate 45 to 60%
13
CSN Technical Bulletin No. 4 Technical Support for the Runoff Reduction Method
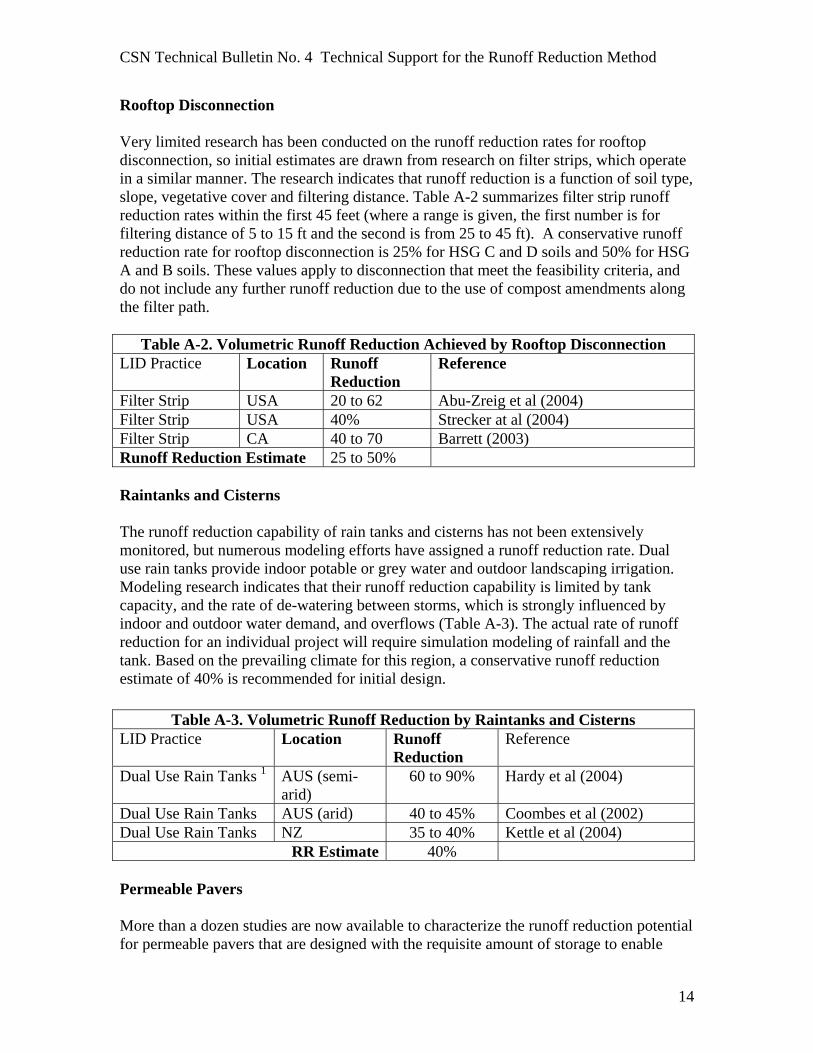
Rooftop Disconnection Very limited research has been conducted on the runoff reduction rates for rooftop disconnection, so initial estimates are drawn from research on filter strips, which operate in a similar manner. The research indicates that runoff reduction is a function of soil type, slope, vegetative cover and filtering distance. Table A-2 summarizes filter strip runoff reduction rates within the first 45 feet (where a range is given, the first number is for filtering distance of 5 to 15 ft and the second is from 25 to 45 ft). A conservative runoff reduction rate for rooftop disconnection is 25% for HSG C and D soils and 50% for HSG A and B soils. These values apply to disconnection that meet the feasibility criteria, and do not include any further runoff reduction due to the use of compost amendments along the filter path.
Table A-2. Volumetric Runoff Reduction Achieved by Rooftop Disconnection LID Practice Location Runoff
Reduction Reference
Filter Strip USA 20 to 62 Abu-Zreig et al (2004) Filter Strip USA 40% Strecker at al (2004) Filter Strip CA 40 to 70 Barrett (2003) Runoff Reduction Estimate 25 to 50% Raintanks and Cisterns The runoff reduction capability of rain tanks and cisterns has not been extensively monitored, but numerous modeling efforts have assigned a runoff reduction rate. Dual use rain tanks provide indoor potable or grey water and outdoor landscaping irrigation. Modeling research indicates that their runoff reduction capability is limited by tank capacity, and the rate of de-watering between storms, which is strongly influenced by indoor and outdoor water demand, and overflows (Table A-3). The actual rate of runoff reduction for an individual project will require simulation modeling of rainfall and the tank. Based on the prevailing climate for this region, a conservative runoff reduction estimate of 40% is recommended for initial design.
Table A-3. Volumetric Runoff Reduction by Raintanks and Cisterns LID Practice Location Runoff
Reduction Reference
Dual Use Rain Tanks 1 AUS (semi-arid)
60 to 90% Hardy et al (2004)
Dual Use Rain Tanks AUS (arid) 40 to 45% Coombes et al (2002) Dual Use Rain Tanks NZ 35 to 40% Kettle et al (2004)
RR Estimate 40%
Permeable Pavers More than a dozen studies are now available to characterize the runoff reduction potential for permeable pavers that are designed with the requisite amount of storage to enable
14

CSN Technical Bulletin No. 4 Technical Support for the Runoff Reduction Method
infiltration beneath the paver. The research studies have been classified into two categories: permeable paver applications that have underdrains and those that do not (Table A-4). Assuming the permeable paver is designed with adequate pretreatment and soil infiltration testing, a conservative runoff reduction rate of 75% is assigned to designs that rely upon full infiltration. Permeable paver applications on HSG C and D soils that typically require underdrains should use the lower runoff reduction rate of 45%.
Table A-4. Volumetric Runoff Reduction by Permeable Pavement LID Practice Location Runoff Reduction Reference Pervious Pavement * ONT 99 Van Seters et al (2006) Pervious Pavement * PA 94 Traver et al (2006) Pervious Pavement * FRA 98 Legret and Colandini (1999) Pervious Pavement * NC 100 Bean et al (2007) Pervious Pavement * NC 95 to 98% Collins et al (2007) Pervious Pavement * WA 97 to 100 Brattebo and Booth (2003) Pervious Pavement * CT 72 Gilbert and Clausen (2006) Pervious Pavement * UK 78 Jefferies (2004) Pervious Pavement # NC 38 to 66 Collins et al (2007) Pervious Pavement # PA 25-45 Pratt et al (1989) Pervious Pavement # NC 66 Bean et al (2007) Pervious Pavement # UK 53 Jefferies (2004) Pervious Pavement # MD 45 to 60 Schueler et al (1987) Pervious Pavement # Lab 30 to 55 Andersen et al (1989)
Runoff Reduction Estimate 45# to 75* * no underdrain collection # underdrain collection
Grass Channels Runoff reduction by grass channels is generally low, but is strongly influenced by soil type, slope, vegetative cover, and the length of channel (Table A-5). Recent research indicates that a conservative runoff reduction rate of 10 to 20% can be used depending on whether soils fall in HSG A/B or C/D. The runoff reduction rates can be doubled if the swale is modified to incorporate compost soil amendments.
Table A-5. Volumetric Runoff Reduction Achieved by Grass Channels LID Practice Location % Runoff
Reduction Reference
Grass Channel VA 0 Schueler (1983) Grass Channel USA 40 Strecker at al (2004) Grass Channel NH 0 UNHSC (2007) Grass Channel OR 27 to 41 Liptan and Murase (2000)
Runoff Reduction Estimate 10 to 20
15

CSN Technical Bulletin No. 4 Technical Support for the Runoff Reduction Method
Bioretention More than 10 studies are now available to characterize the runoff reduction rates for bioretention areas. The research can be classified into bioretention applications that possess underdrains and those that do not (and therefore rely on full infiltration into underlying soils) (Table A-6). A conservative runoff reduction rate of 80% is assigned to designs that rely upon full infiltration. Bioretention areas located on HSG C and D soils that typically require underdrains should use the lower runoff reduction rate of 40%.
Table A-6. Volumetric Runoff Reduction Achieved by Bioretention LID Practice Location % Runoff
Reduction Reference
Bioretention * CT 99% Dietz and Clausen (2006) Bioretention * PA 86% Ermilio (2005) Bioretention * FL 98% Rushton (2002) Bioretention * AUS 73% Lloyd et al (2002) Bioretention # ONT 40% Van Seters et al (2006) Bioretention # Model 30% Perez-Perdini et al (2005) Bioretention # NC 40 to 60% Smith and Hunt (2007) Bioretention # NC 20 to 29% Sharkey (2006) Bioretention # NC 52 to 56% Hunt et al. (2006) Bioretention # NC 20 to 50% Passeport et al. (2008) Bioretention # MD 52 to 65% Davis (2008)
Runoff Reduction Estimate 40# to 80* # underdrain design *infiltration design Dry Swales Only a handful of data are available to define the runoff reduction rate for dry swales, but research indicates that they perform as well as, or better than, bioretention with underdrains (Table A-7). Since an underdrain is an integral design feature for dry swales, a conservative runoff reduction of 40% is assigned to dry swales, a value equivalent to that asssigned to bioretention with underdrains. If a dry swale lacks an underdrain due to highly permeable soils, or is designed with an underground stone storage layer, the runoff reduction rate can be increased to 60%.
Table A-7. Volumetric Runoff Reduction Achieved by Dry Swales LID Practice Location % Runoff
Reduction Reference
Dry Swale WA 98% Horner et al (2003) Dry Swale MD 46 to 54% Stagge (2006) Dry Swale TX 90% Barrett et al (1998) Bioretention with underdrains
20 to 60% This memo
Runoff Reduction Estimate 40 to 60%
16

CSN Technical Bulletin No. 4 Technical Support for the Runoff Reduction Method
Wet Swales Limited runoff reduction data is available on wet swales. Wet swales function similarly to wet ponds and wetlands, retaining a permanent pool of water due to intersection with ground water or poorly drained soils. No runoff reduction rate is recommended for wet swales. Infiltration The runoff reduction capability of infiltration practices is presumed to be high, given that infiltration is the design intent of the practice. Some surface overflows do occur when the infiltration storage capacity is exceeded. Assuming the practice is designed with adequate pretreatment and soil infiltration testing, a conservative runoff reduction rate of 90% is assigned to infiltration practices. If an underdrain must be utilized, the recommended runoff reduction rate drops to 50% (Table A-8).
Table A-8. Volumetric Runoff Reduction Achieved by Infiltration LID Practice Location Runoff Reduction Reference Infiltration NH 90% UNHSC (2005) Infiltration VA 60% Schueler (1983) Infiltration PA 90% Traver et al (2006) Infiltration NC 96-100% Bright et al (2007) Runoff Reduction Estimate 50 to 90% Extended Detention In lined extended detention (ED) basins, evaporation reduces a small portion of the runoff volume, and in unlined basins, runoff is further reduced via seepage. Strecker et al. (2004) analyzed the runoff reduction rates for 11 dry extended detention basins in the EPA/ASCE National Stormwater STP Database and found a mean runoff volume reduction of 30%; however, more recent evaluations suggest lower runoff reduction rates (Strecker, personal communication, 2008). Additionally, two ED basins in NC had negligible runoff reduction rates (Hathway et al, 2007e), and a basin in FL sited in very well drained soils had a 70% runoff reduction rate (Harper et al, 1999), which was attributed to groundwater seepage. Based on the prevailing climate for the region, a conservative runoff reduction estimate of 0% for lined basins, and 15% for unlined basins is recommended for initial design. Soil Amendments Several studies have examined the effect of soil compost amendments to reduce the volume of runoff produced by lawn runoff from compacted soils (Table A-9). An additional runoff reduction rate of 50% is given when compost amended soils receive runoff from an appropriately designed rooftop disconnection or grass channel. A 75% runoff reduction rate can be used for the runoff from lawn areas that are compost amended, but do not receive any off-site runoff from impervious surfaces.
17

CSN Technical Bulletin No. 4 Technical Support for the Runoff Reduction Method
Table A-9. Volumetric Reduction in Lawn Runoff Due to Compost Amendments
LID Practice Location Runoff Reduction
Reference
Compost Amendment WI 74 to 91% Balusek (2003) Compost Amendment AL 84 to 91% Pitt et al (1999 and 2005) Compost Amendment WA 29 to 50% Kolsti et al (1995) Compost Amendment WA 53 to 74% Hielima (1999)
Runoff Reduction Estimate 50 to 75%
Filtering Practices, Wetlands, and Wet Ponds Very little individual performance data is available on the runoff reduction capabilities of sand filters, wet pond, and wetland practices. In pond and wetland applications, evapo-transpiration may occur; however, research suggests that the amount of runoff reduced is very low to negligible (Strecker et al, 2004 ; Hathaway et al, 2007a-d). Therefore, a conservative runoff reduction rate of 0% is recommended for filters, wet ponds, and wetlands. Stormwater Planters, Tree Pits, and Tree Clusters Only one study has measured the hydrologic capacity of stormwater planters or tree pits to reduce runoff, and it found they had relatively low capability (UNHSC, 2007). The actual runoff reduction capability for these practices is related to their contributing drainage area, runoff storage capacity and rate of overflow or underdrain. Consequently, these practices are assigned a modest runoff reduction capability of 15%. No specific research has been conducted on the runoff reduction rates for tree clusters as set forth in Cappiella et al (2005), although the value of trees in reducing runoff has been established by Portland BES (2003) and PA DEP (2006). These manuals assign a runoff reduction rate of 6 cubic feet per qualifying deciduous tree and 10 cubic feet per evergreen tree. If planting bed is compost amended, or tree cluster is designed to accept off-site runoff, a higher rate of runoff reduction may be used. References Cited Abu-Zreig, M. Rudra, M. Lalonde. H. Whitely and N. Kaushik. 2004. Experimental investigation of runoff reduction and sediment removal by vegetated filter strips. Hydrologic Processess. 18: 2029-2037 Andersen C., I. Foster, and C. Pratt. 1989. Role of permeable pavements in regulating Hydrologic Processes. 13(4): 597-606 Balusek, D.E. 2003. Quantifying decreases in stormwater runoff from deep-tilling, chisel-planting and compost amendments. Dane County Land Conservation Department. Madison, Wisconsin.
18

CSN Technical Bulletin No. 4 Technical Support for the Runoff Reduction Method
Banting, D., Doshi, H., Li, J., and Missious, P. 2005. Report on the Environmental Benefits and Costs of Green Roof Technology for the City of Toronto. Prepared for City of Toronto and Ontario Centres of Excellence – Earth and Environmental Technologies. October, 2005. Barrett, M., P. Walsh, J. Malina and R. Charbeneau. 1998. Performance of vegetative controls for treating highway runoff. Journal of Environmental Engineering. 124(11): 1121-1128, Barrett, M. 2003. Roadside vegetated treatment sites study: final report. Caltrans Division of Environmental Analyses. CTSW.RT-03-028. Bean, R., W. Hunt, and D. Bidelspach. 2007. Field study of four permeable pavement sites in eastern North Carolina for runoff reduction and water quality impacts. Journal of Irrigation and Drainage Engineering. Brattebo, B. and D. Booth. 2003. Long term stormwater quantity and quality performance of permeable pavement systems. Water Research 37(18): 4369-4376 Bright, T.M. 2007. M.S. Thesis. North Carolina State University, Department of Biological and Agricultural Engineering. Raleigh, N.C. CALTRANS, 2004. California Department of Transportation, Division of Environmental Analysis. STP retrofit pilot program. Final Report CTSW-RT-01-050. January, 2004. Cappiella, K., T. Schueler, and T. Wright. 2005. Urban Watershed Forestry Manual. Part 2: Conserving and Planting Trees at Development Sites. USDA Forest Service, Newtown Square, PA. Carter, T. and C. Jackson. 2007. Vegetated roofs for stormwater management at multiple spatial scales. Landscape and Urban Planning. Collins, K., W. Hunt and J. Hathaway. 2008. Hydrologic comparison of four types of permeable pavement and standard asphalt in eastern North Carolina. Journal of Hydrologic Engineering. Coombes, P. and G. Kuczera. 2003. Analysis of the performance of rainwater tanks in Australian capital cities. 28th International Hydrology and Water Resources Symposium 10 – 14 November 2003 Wollongong NSW Davis, A. 2008. Field performance of bioretention: hydrology impacts. Journal of Hydrological Engineering. Feb 2008. 90-96.
19

CSN Technical Bulletin No. 4 Technical Support for the Runoff Reduction Method
Denardo, J., A. Jarrett, H. Manbeck, D. Beattie and R. Berghage. 2005. Stormwater mitigaton and surface temperature reduction by green roofs. Trans ASCE. 48(4): 1491-1496, Dietz, M. and J. Clausen. 2006. Saturation to improve pollutant retention in a rain garden. Environmental Science and Technology. 40(4): 1335-1340. Ermilio, J. 2005. Characterization study of a bio-infiltration stormwater STP. M.S. Thesis. Villanova Univiersity. Department of Civil and Environmental Engineering. Philadelphia, PA Getter, K., B. Rowe and J. Anderson. 2007. Quantifying the effect of slope on extensive green roof stormwater retention. Ecological Engineering 31: 225-231. Gilbert, J. and J. Clausen. 2006. Stormwater runoff quality and quantity from asphalt, paver and crushed stone driveways in Connecticut. Water Research 40: 826-832. Hardy, M, P. Coombes and G. Kuczera. 2004. An investigation of estate level impacts of spatially distributed rainwater tanks. Proceedings of the 2004 International Conference on Water Sensitive Urban Design – Cities as Catchments. 21–25 November 2004, Adelaide. Harper, H., J. Herr, D. Baker, and E. Livingston. 1999. Performance Evaluation of Dry Detention Stormwater Management Systems. Sixth Biennial Stormwater Research & Watershed Management Conference September, 1999. Hathaway, J.M., W.F. Hunt, A. Johnson, and J.T. Smith. 2007a. Bruns Ave. Elementary School Wetland, Final Report – Stormwater Treatment Capabilities. Report from North Carolina State University Department of Biological and Agricultural Engineering to City of Charlotte Stormwater Services. Hathaway, J.M., W.F. Hunt, A. Johnson, and J.T. Smith. 2007b. Edwards Branch Wetland, Final Report – Stormwater Treatment Capabilities. Report from North Carolina State University Department of Biological and Agricultural Engineering to City of Charlotte Stormwater Services. Hathaway, J.M., W.F. Hunt, A. Johnson, and J.T. Smith. 2007c. Pierson Pond, Final Report – Stormwater Treatment Capabilities. Report from North Carolina State University Department of Biological and Agricultural Engineering to City of Charlotte Stormwater Services. Hathaway, J.M., W.F. Hunt, A. Johnson, and J.T. Smith. 2007d. Shade Valley Pond, Final Report – Stormwater Treatment Capabilities. Report from North Carolina State University Department of Biological and Agricultural Engineering to City of Charlotte Stormwater Services.
20

CSN Technical Bulletin No. 4 Technical Support for the Runoff Reduction Method
Hathaway, J.M., W.F. Hunt, and A. Johnson. 2007e. Morehead Dry Detention Final Report – Stormwater Treatment Capabilities. Report from North Carolina State University Department of Biological and Agricultural Engineering to City of Charlotte Stormwater Services. Hielema, E. 1999. Hydrologic simulation of the Klahanie catchment with and without a landscape consisting of soil amended with compost. MS Thesis. College of Engineering. University of Washington. Seattle, WA Horner, R., H. Lim and S. Burges. 2003. Hydrologic monitoring of the Seattle ultra-urban stormwater management project. University of Washington. Department of Civil and Environmental Engineering. Water Resources Series. Technical Report 170. Hunt, W. A. Jarret, J. Smith and L. Sharkey. 2006. Evaluating bioretention hydrology and nutrient removal at three field sites in North Carolina. Journal of Irrigation and Drainage Engineering. 6: 600-612. Hutchinson, D. P. Abrams, R. Retzlaff and Y. Liptan. 2003. Stormwater monitoing of two ecorooofs in Portland, Oregon (USA). Proceedings: Greening Rooftops for Sustainable Communities. Chicago, Illinois May29-30, 2003 Jarrett, A, B. Hunt and R. Berghage. 2007. Evaluating a spreadsheet model to predict green roof stormwater retention. Proceedings 207 LID Conference. Wilmington, NC Jefferies, C. 2004. Sustainable drainage systems in Scotland: the monitoring programme. Scottish Universities SUDS Monitoring Project. Dundee, Scotland Kettle, D., T. Diyagama, N.Shaw, J. Heijs and G. Wilson. 2004. Modeling of low impact initiatives. New Zealand Water and Wastes Association. Stormwater 2004 Conference. 6-7 May 2004. Rotorua, NZ. Kolsti, K.,S. Burges and B. Jensen. 1995. Hydrologic response of residential-scale lawns with till containing various amounts of compost amendments. Water Resources Technical Report No. 147. University of Washington. Dept of Civil Engineering, Seattle, WA. Liptan, Thomas and Robert K. Murase, “Watergardens as Stormwater Infrastructure in Portland, Oregon.” Working Paper, Harvard Design School, Boston, MA, 2000. Legret, M and V. Colandani. 1999. Effects of a porous pavement structure with a reservoir structure on runoff water: water quality and fate of metals. Water Science and Technology. 39(2): 111-117 Lloyd, S., T. Wong and C. Chesterfield. 2002. Water sensitive urban design: a stormwater management perspective. Cooperative Research Centre for Catchment. Monash University, Victoria 3800 Australia. Industry Report 02/10
21

CSN Technical Bulletin No. 4 Technical Support for the Runoff Reduction Method
Mentens, J. D. Raes and M. Herving. 2005. Green roof as a tool for solving rainwater runoff problems in the urbanized 21st century. Landscape and Urban Planning (3): 217-226, Moran, A. and B. Hunt. 2005. Green roof hydrologic and water quality performance in North Carolina. 2005 ASAE Annual International Meeting. Tampa, FL. 17 July, 2005 Passeport, E., Hunt, W.F., Line, D.E., and Smith, R.A. 2008. Effectiveness of two grassed bioretention cells at reducing stormwater pollution. Under review. Perez-Pedini, C., J. Limbruneer, and R, Vogel. Optimal location of infiltration-based Best management practices for stormwater management. ASCE Journal of Water Resources Planning and Management, 131(6): 441-448 Pitt, R. J. Lantrip and R. Harrison. 1999. Infiltration through disturbed urban soils and compost-amended soil effects on runoff quality and quantity. Research Report EPA/600/R-00/016. Office of Research and Development. U.S. EPA. Washington, D.C. Pitt, R. S. Chen, S. Clark and J. Lantrip. 2005. Soil structure effects associated with urbanization and the benefits of soil amendments. World Water and Environmental Resources Congress. Conference Proceedings. American Society of Civil Engineers. Anchorage, AK. Portland BES. 2003. Stormwater Management Manual. City of Portland. Portland, Oregon. PA DEP. 2006. Pennsylvania Stormwater Manaual. Department of Environmental Protection. Harrisburg, PA Pratt, C., J. Mantle and P. Schofield. 1989. Urban stormwater reduction and quality improvement through the use of permeable pavements. Water Science and Technology 21(8): 769-778. Rushton, B. 2002. Treatment of stormwater runoff from an agricultural basin by a wet-detention pond in Ruskin, Florida. Final Report to the Southwest Florida Water Management District. November, 2002. Schueler, T. 1983. Washington Area Nationwide Urban Runoff Project. Final Report. Metropolitan Washington Council of Governments. Washington, DC. Schueler, T. 1987. Controlling urban runoff: a practical manual for planning and designing urban STPs. Metropolitan Washington Council of Governments. Washington, DC.
22

CSN Technical Bulletin No. 4 Technical Support for the Runoff Reduction Method
Sharkey, Lucas J. 2006. The Performance of Bioretention Areas in North Carolina: A Study of Water Quality, Water Quantity, and Soil Media. M.S thesis. North Carolina State University. Department of Biological and Agricultural Engineering Smith, R and W. Hunt. 2007. Pollutant removals in bioretention cells with grass cover. Proceedings 2nd National Low Impact Development Conference. Wilmington, NC. March 13-15, 2007. Stagge, J. 2006. Field evaluation of hydrologic and water quality benefits of grass swales for managing highway runoff. M.S. Thesis, University of Maryland, Department of Civil and Environmental Engineering. College Park, MD. Strecker, E., Quigley, M., Urbonas, B., and Jones, J. 2004. Stormwater management: State-of-the-art in comprehensive approaches to stormwater. The Water Report. Issue #6. Envirotech Publishers Inc., Eugene, OR. Traver, R. 1008. Villanova Urban Stormwater Partnership. Philadelphia, PA University of New Hampshire Stormwater Center (UNHSC). 2005. 2005 stormwater data report. Durham, NH Van Seters, T., D. Smith and G. MacMillan. 2006. Performance evaluation of permeable pavement and a bioretentions swale. Proceedings 8th International Conference on Concrete Block Paving. November 6-8, 2006. San Fransisco, CA VanWoert, N, D. Rowe, J. Anderson, C. Rugh, R. Fernandez and L. Xiao. 2005. Green roof stormwater retention: effects of roof surface, slope and media depth. Journal of Environmental Quality. 34(3): 1036-1044.
23

CSN Technical Bulletin No. 4 Technical Support for the Runoff Reduction Method
APPENDIX B:
DERIVATION OF EMC POLLUTANT REMOVAL RATES FOR SELECT STPs
Pollutant removal efficiency refers to the pollutant reduction from the inflow to the outflow of a system. Pollutant removal efficiency can be calculated using variety of computations, but the two most common methods are event mean concentration (EMC) efficiency and mass or load efficiency. EMC efficiency is derived by averaging the influent and effluent concentrations for storm events, and then calculating the median change. Mass efficiency is calculated by determining the pollutant load reduction from the influent to effluent, and is influenced by the volume of water reduced by the practice (e.g., runoff reduction). Depending on the method used, reported removal efficiencies of stormwater best management practices (STPs) can vary widely and are often inconsistent. Further, removal efficiencies do not adequately address runoff volume reductions in STPs (Strecker et al, 2004; Jones et al, 2008). However, for the purposes of this method, reporting EMC based pollutant removal efficiencies can isolate key STP pollutant removal mechanisms and offers a supplemental approach to increase STP performance apart beyond runoff reduction. The following sections discuss the derivation of EMC based pollutant removal efficiencies of STPs. The NPRPD (CWP, 2000) details the pollutant removal efficiencies of several STPs that were derived using several different methods. Studies reporting EMC pollutant removal in the NPRPD were isolated and included in the analysis. Further, EMC pollutant removal numbers were compiled from recent studies. When possible, a median and 75th percentile value for nutrient PR was determined. It should be noted that the data used to estimate pollutant removal was derived from practices in good conditions; most studies focused on STPs that were constructed within three years of monitoring. Further, the actual EMC pollutant removal performance can be strongly influenced by the influent quality. Since pollutant removal rates are usually dependent on site characteristics and STP geometry, the EMC based pollutant removal numbers are dependent on meeting the level 1 or 2 design criteria (Appendix C) or the eligibility criteria for ESD (Appendix D). Due to the limited number of performance studies, conservative EMC pollutant removal rates were selected. In several cases, provisional numbers are set forth until more data becomes available. Green Roofs In recent years, several studies have been conducted on the nutrient removal capabilities of green roofs. Results confirm that green roofs initially leach nutrients from the compost contained the growth media used to support initial plant growth (Table B-1). Several studies have suggested that the leaching may subside over time; however, the extent to which nutrient leaching decreases has not been quantified. Media with high
24

CSN Technical Bulletin No. 4 Technical Support for the Runoff Reduction Method
compost content will leach more nutrients than media with lower compost content. Therefore, to minimize the export of nutrients, media should be selected with the lowest compost content to support the growth of the desired roof vegetation. No pollutant removal credit for nitrogen or phosphorus is recommended.
Table B-1. Pollutant Removal Achieved by Green Roofs LID Practice: Green Roof1
Location TP Removal
TN Removal
Study
Green Roof NC negative Negative Moran et al, 2005 Green Roof OR negative Negative Hutchinson, 2003 Green Roof CAN negative Negative Banting et al, 2005
EMC PR estimate 0% 0% 1Pollutant removal values are EMC based for all studies + Study included in NPRPD (CWP, 2007)
Disconnection (Vegetated Filter Strips) Limited research has been conducted on the pollutant removal rates for rooftop disconnection, so initial estimates are drawn from research on filter strips, which operate in a similar manner. The research indicates that nutrient reduction is a function of filtering distance and vegetative cover (Abu-Zreig et al, 2003; Barrett et al, 1998; CALTRANS, 2004; Goel et al, 2004). Since very little information regarding the EMC based nutrient removal rates of vegetated filter strips has been published, no pollutant removal rate for TP and TN is recommended at this initial stage. . Raintanks and Cisterns Limited research has been conducted to evaluate the pollutant removal capabilities of rain tanks and cisterns, however, it is generally understood that no primary pollutant removal benefits exist (MPAC, ND). Based on this assumption, no pollutant removal credit for nitrogen or phosphorus is recommended for raintanks and cisterns. Permeable Pavement While several studies have documented high heavy metal and TSS removal efficiencies of permeable pavements, few studies have evaluated permeable pavement nutrient removal capabilities. Limited results indicate that permeable pavement TP and TN removal rates vary widely (Table B-2). TP can potentially be reduced by adsorption to the aggregate and soils in the pavement subbase layers, but may also leach from underlying soils or surface fill material in pavement void spaces. Provisional EMC pollutant removal rates of 25% for both total phosphorus and total nitrogen are recommended for initial design.
25

CSN Technical Bulletin No. 4 Technical Support for the Runoff Reduction Method
Table B-2. Pollutant Removal Achieved by Permeable Pavements LID Practice: Permeable Pavement1
Location Pollutant Removal (TP)
Pollutant Removal (TN)
Study
Permeable Pavement# Lab 60% Day et al, 1981 Permeable Pavement# CAN 0% James and Shahin, 1998 Permeable Pavement# GA 10% negative Dreelin et al, 2006 Permeable Pavement# NC 65% 36% Bean et al, 2007+ Permeable Pavement# NC negative negative Bean, 2005+ Permeable Pavement# NH 38% UNH, 2007 Permeable Pavement# NC 0% 25%* Collins et al., 2008 Permeable Pavement# CT 34% 88% Gilbert and Clausen, 2006
EMC PR estimate 25% 25% 1Pollutant removal values are EMC based for all studies + Study included in NPRPD (CWP, 2007) * for one pavement type only # underdrain design
Grass Channels (Drainage Swales) Several studies have documented the nutrient removal rates of drainage swales (Table B-3). Nutrient removal is generally low, but is influenced by vegetative cover and flow velocity. The removal of mowed grass clippings may also increase nutrient removal. Fertilization of channel vegetation should be avoided. Conservative pollutant removal rates of 15% for TP and 20% for TN are recommended for initial design.
Table B-3. Pollutant Removal Achieved by Grass Channels LID Practice: Drainage Swale1
Location Pollutant Removal (TP)
Pollutant Removal (TN)
Study
Grass Channel MD 0% 37% OWML, 1983+ Grass Channel MD 0% negative OWML, 1983 + Grass Channel TX 34 to 44% 38% Walsh et al, 1995 +
Grass Channel TX negative negative Welborn and Veehuis, 1987 +
Grass Channel FL 13% 21% Harper, 1988+ Grass Channel FL 25% 11% Yousef et al, 1986+ Grass Channel WA 29-45 Seattle Metro, 1992 + Grass Channel CA negative 30% CALTRANS, 2004
Grass Channel USA 29 Schueler and Holland, 2000 (article 116)
EMC PR estimate 15% 20% 1Pollutant removal values are EMC based for all studies except NPRPD + Study included in NPRPD (CWP, 2007)
26

CSN Technical Bulletin No. 4 Technical Support for the Runoff Reduction Method
Bioretention Several recent studies have indicated that bioretention practices are effective at removing nutrients, as well as metals, pathogens, oil and grease. Much of this research has reported mass based pollutant removal rates, but ten studies reporting EMC based removal rates are now available (Table B-4). The extent of TP removal is related to bioretention cell depth, mulching, plant cover, and the organic matter content of the soil media. The primary phosphorus removal mechanism is soil adsorption. It is imperative that the P-index of the media be tested to ensure a low number (less than 30), as earlier studies have found that soil media with a high P-index will leach phosphorus. Nitrogen is removed through mineralization and denitrification near the surface of bioretention cells and also by denitrification in anaerobic zones that often develop deeper in the cells. Design of an internal water storage zone (sump) using an upturned underdrain may increase TN removal. A summary of bioretention mass removal included in the NPRPD lists lower median and 75th percentile pollutant removal rates for TP; however, many of these earlier studies tested practices with high P-index media. Conservative EMC pollutant removal rates of 25 to 50% for TP removal and 40 to 60% for TN removal are recommended for initial design. TP removal is credited only if the media is tested to ensure that the media P-index is less than 30.
Table B-4. Pollutant Removal Achieved by Bioretention LID Practice: Bioretention1
Location Pollutant Removal (TP)
Pollutant Removal (TN)
Study
NPRPD (N=10) 5a-30 b 46 a -55 b CWP, 2007 Bioretention# MD 81% Davis et al., 2001 Bioretention# MD 65% 49% Davis et al., 2006 Bioretention# MD 87% 59% Davis et al., 2006 Bioretention# Lab 81% 60% Davis et al., 2006 Bioretention# PA 1% 48% Ermilio, 2005+ Bioretention# NC 8% 61% Smith and Hunt, 2006+ Bioretention# NC 32% 38% Hunt et al. 2008 Bioretention# NC 60% 54% Passeport et al. 2008 Bioretention# NC 66% 62% Sharkey, 2006 Bioretention# VA 13% Yu and Stopinski, 2001+
EMC PR estimate 25 to 50% 40 to 60% 1Pollutant removal values are EMC based for all studies except NPRPD
a Median pollutant removal rate b 75th Percentile pollutant removal rate + Study included in NPRPD (CWP, 2007) # underdrain design
27
CSN Technical Bulletin No. 4 Technical Support for the Runoff Reduction Method
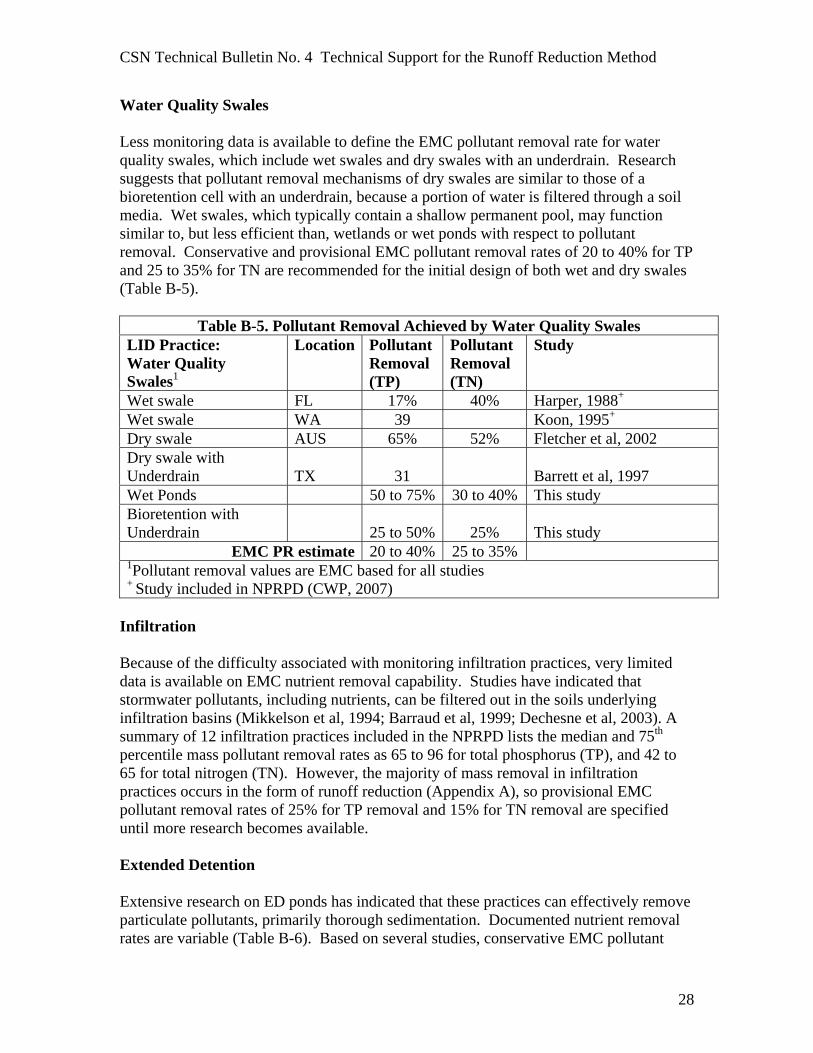
Water Quality Swales Less monitoring data is available to define the EMC pollutant removal rate for water quality swales, which include wet swales and dry swales with an underdrain. Research suggests that pollutant removal mechanisms of dry swales are similar to those of a bioretention cell with an underdrain, because a portion of water is filtered through a soil media. Wet swales, which typically contain a shallow permanent pool, may function similar to, but less efficient than, wetlands or wet ponds with respect to pollutant removal. Conservative and provisional EMC pollutant removal rates of 20 to 40% for TP and 25 to 35% for TN are recommended for the initial design of both wet and dry swales (Table B-5).
Table B-5. Pollutant Removal Achieved by Water Quality Swales LID Practice: Water Quality Swales1
Location Pollutant Removal (TP)
Pollutant Removal (TN)
Study
Wet swale FL 17% 40% Harper, 1988+ Wet swale WA 39 Koon, 1995+ Dry swale AUS 65% 52% Fletcher et al, 2002 Dry swale with Underdrain TX 31 Barrett et al, 1997 Wet Ponds 50 to 75% 30 to 40% This study Bioretention with Underdrain 25 to 50% 25% This study
EMC PR estimate 20 to 40% 25 to 35% 1Pollutant removal values are EMC based for all studies + Study included in NPRPD (CWP, 2007)
Infiltration Because of the difficulty associated with monitoring infiltration practices, very limited data is available on EMC nutrient removal capability. Studies have indicated that stormwater pollutants, including nutrients, can be filtered out in the soils underlying infiltration basins (Mikkelson et al, 1994; Barraud et al, 1999; Dechesne et al, 2003). A summary of 12 infiltration practices included in the NPRPD lists the median and 75th percentile mass pollutant removal rates as 65 to 96 for total phosphorus (TP), and 42 to 65 for total nitrogen (TN). However, the majority of mass removal in infiltration practices occurs in the form of runoff reduction (Appendix A), so provisional EMC pollutant removal rates of 25% for TP removal and 15% for TN removal are specified until more research becomes available. Extended Detention Extensive research on ED ponds has indicated that these practices can effectively remove particulate pollutants, primarily thorough sedimentation. Documented nutrient removal rates are variable (Table B-6). Based on several studies, conservative EMC pollutant
28
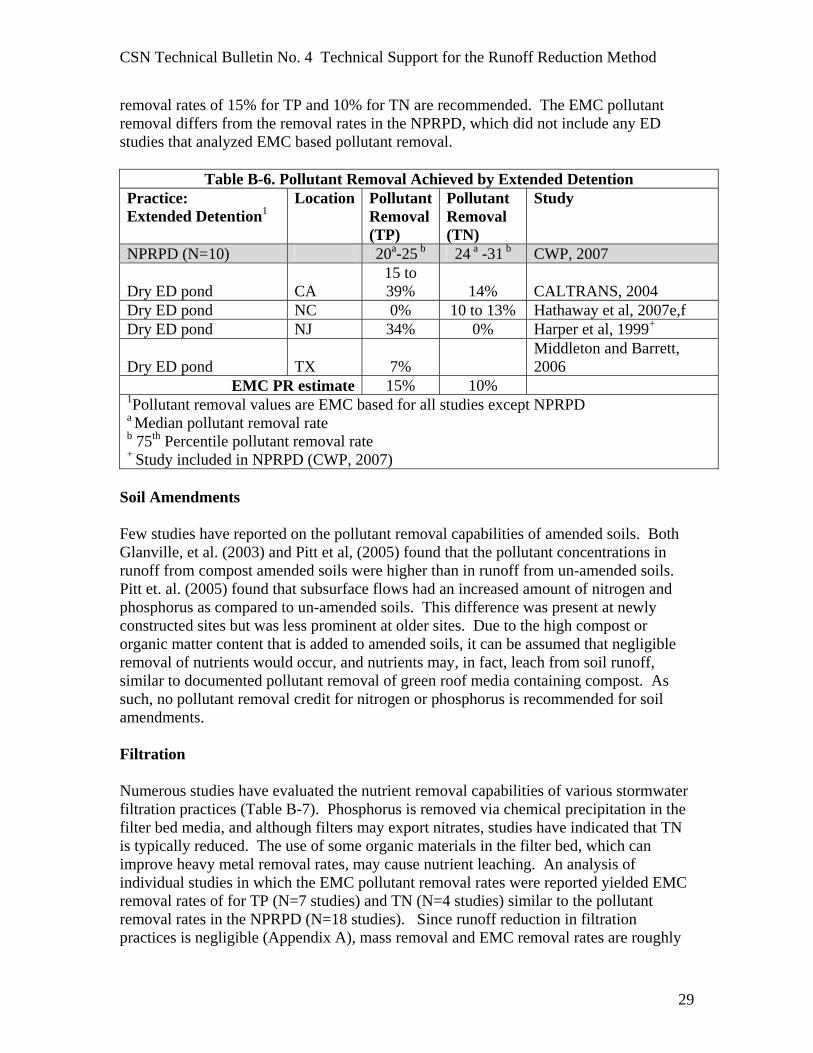
CSN Technical Bulletin No. 4 Technical Support for the Runoff Reduction Method
removal rates of 15% for TP and 10% for TN are recommended. The EMC pollutant removal differs from the removal rates in the NPRPD, which did not include any ED studies that analyzed EMC based pollutant removal.
Table B-6. Pollutant Removal Achieved by Extended Detention Practice: Extended Detention1
Location Pollutant Removal (TP)
Pollutant Removal (TN)
Study
NPRPD (N=10) 20a-25 b 24 a -31 b CWP, 2007
Dry ED pond CA 15 to 39% 14% CALTRANS, 2004
Dry ED pond NC 0% 10 to 13% Hathaway et al, 2007e,f Dry ED pond NJ 34% 0% Harper et al, 1999+
Dry ED pond TX 7% Middleton and Barrett, 2006
EMC PR estimate 15% 10% 1Pollutant removal values are EMC based for all studies except NPRPD
a Median pollutant removal rate b 75th Percentile pollutant removal rate + Study included in NPRPD (CWP, 2007)
Soil Amendments Few studies have reported on the pollutant removal capabilities of amended soils. Both Glanville, et al. (2003) and Pitt et al, (2005) found that the pollutant concentrations in runoff from compost amended soils were higher than in runoff from un-amended soils. Pitt et. al. (2005) found that subsurface flows had an increased amount of nitrogen and phosphorus as compared to un-amended soils. This difference was present at newly constructed sites but was less prominent at older sites. Due to the high compost or organic matter content that is added to amended soils, it can be assumed that negligible removal of nutrients would occur, and nutrients may, in fact, leach from soil runoff, similar to documented pollutant removal of green roof media containing compost. As such, no pollutant removal credit for nitrogen or phosphorus is recommended for soil amendments. Filtration Numerous studies have evaluated the nutrient removal capabilities of various stormwater filtration practices (Table B-7). Phosphorus is removed via chemical precipitation in the filter bed media, and although filters may export nitrates, studies have indicated that TN is typically reduced. The use of some organic materials in the filter bed, which can improve heavy metal removal rates, may cause nutrient leaching. An analysis of individual studies in which the EMC pollutant removal rates were reported yielded EMC removal rates of for TP (N=7 studies) and TN (N=4 studies) similar to the pollutant removal rates in the NPRPD (N=18 studies). Since runoff reduction in filtration practices is negligible (Appendix A), mass removal and EMC removal rates are roughly
29

CSN Technical Bulletin No. 4 Technical Support for the Runoff Reduction Method
equivalent. Since so few studies report EMC removal rates, filtration practices were assigned based on their NPRPD removal rates of 60 to 65% for TP, and 30 to 45% for TN.
Table B-7. Pollutant Removal Achieved by Filtration Practice: Sand Filters1
Location TP Removal
TN Removal
Study
NPRPD (N=18) 59a-66 b 32 a -47 b CWP, 2007 Sand Filter TX 39 % 22% Barrett, 2003 Sand Filter VA 66% 47% Bell et al, 1995+ Peat Sand Filter TX 48% 30 to 51% LCRA, 1997 + Sand Filter WA 20 to 41% Horner, 1995+ Sand Filter TX 45% 15% Barton Springs, 1996+ Organic filter WI 88% Corsi and Greb, 1997+ Compost filter TX 41% Stewart, 1992+
EMC PR estimate 60 to 65% 30 to 45% 1Pollutant removal values are EMC based for all studies except NPRPD
a Median pollutant removal rate b 75th Percentile pollutant removal rate
+ Study included in NPRPD (CWP, 2007) Wetlands Studies indicate that wetlands can effectively remove TP and TN, primarily through sedimentation and plant nutrient uptake (Table B-8). Nutrient removal is related to the vegetative covering, wetland geometry, and the drawdown time of the temporary storage volume. An analysis of individual studies in which the EMC pollutant removal rates were reported yielded EMC removal rates of for TP (N=8 studies) and TN (N=4 studies) similar to the pollutant removal rates in the NPRPD (N=40 studies). Since runoff reduction in wetland practices is negligible (Appendix A), mass removal and EMC removal rates are roughly equivalent. Wetlands were therefore assigned EMC pollutant removal rates based on the values in the NPRPD: 50 to 75% for TP, and 25 to 55% for TN. Wet Ponds Numerous studies have evaluated the nutrient removal capabilities of wet ponds (Table B-9). Several factors appear to affect removal rates, such as the treatment volume captured, presence of emergent vegetation, and length of the flow path in the pond. The establishment of a diverse, dense plant community around the perimeter of the pond may increase nutrient removal, and may also discourage water fowl activity, potentially reducing organic nutrient and pathogen inputs. An analysis of individual studies in which the EMC pollutant removal rates were reported yielded EMC removal rates of for TP (N=16 studies) and TN (N=12 studies) similar to the pollutant removal rates in the NPRPD (N=46 studies). Since runoff reduction in wet pond practices is negligible (Appendix A), mass removal and EMC removal rates were considered to be equivalent. Wet ponds were therefore assigned pollutant removal rates based on the values in the NPRPD: 50 to 75% for TP, and 30 to 40% for TN.
30

CSN Technical Bulletin No. 4 Technical Support for the Runoff Reduction Method
Table B-8. Pollutant Removal Achieved by Wetlands Practice: Wetlands1
Location TP Removal
TN Removal
Study
NPRPD (N=40) 48a-76 b 24 a -55 b CWP, 2007 Wetland FL 28% 10% Martin, 1988+ Wetland FL 48% 13% Blackburn et al, 1986 + Wetland WA 33% Koon, 1995 + Wetland FL 57% Rushton and Dye, 1993+ Wetland VA 69% Yu et al, 1998 + Wetland VA 15% Yu et al, 1998 + Submerged gravel wetland CA 46% Negative Reuter et al, 1992+ Wetland NC 45% 35 to 45% Hathaway et al, 2007a,b
EMC PR estimate 50 to 75% 25 to 55% 1Pollutant removal values are EMC based for all studies except NPRPD
a Median pollutant removal rate b 75th Percentile pollutant removal rate + Study included in NPRPD (CWP, 2007)
Table B-9. Pollutant Removal Achieved by Wet Ponds Practice: Wet Ponds1
Location TP Removal
TN Removal
Study
NPRPD (N=46) 52a-76 b 31 a -41 b CWP, 2007 Wet Pond TX 87% 50% City of Austin, TX 1996+ Wet Pond WA 19% Comings et al, N.D + Wet Pond FL 55% 12% Cullum, 1984 + Wet Pond FL 30% 16% Gain, 1996 + Wet Pond FL 40% Kantrowitz & Woodham, 995+ Wet Pond FL 22% 15% Martin, 1988 + Wet Pond CAN 72% SWAMP, 2000 + Wet Pond CA 29% 0% Taylor et al, 2001 Wet Pond NC 57% 40% Mallin et al, 2002 Wet Pond CA 5% 51% CALTRANS, 2004 Wet Pond NC 15 to 41% 19 to 23% Hathaway et al, 2007c,d Wet ED pond CAN 37% 28% Fellows et al, 1999+ Wet ED pond CO 52% 55% LCRA, 1997 + Wet ED pond FL 75% 28% Rushton et al, 1995+ Wet ED pond FL 50% 25% Rushton et al, 2002+ Wet ED pond CAN 56 to 65% SWAMP, 2000
EMC PR estimate 50 to 75% 30 to 40% 1Pollutant removal values are EMC based for all studies except NPRPD
a Median pollutant removal rate b 75th Percentile pollutant removal rate + Study included in NPRPD (CWP, 2007)
31

CSN Technical Bulletin No. 4 Technical Support for the Runoff Reduction Method
References: Abu-Zreig, M., Rudra, R.P., Whiteley, H.R., Lalonde, M.N., Kaushik, N.K. 2003. Phosphorus removal in vegetated filter strips. Journal of Environmental Quality. 32: 613-619. Banting, D., Doshi, H., Li, J., and Missious, P. 2005. Report on the Environmental Benefits and Costs of Green Roof Technology for the City of Toronto. Prepared for City of Toronto and Ontario Centres of Excellence – Earth and Environmental Technologies. October, 2005. Barraud, S., Gautier, A., Bardin, J.P., and Riou, V. 1999. The impact of intentional stormwater infiltration on soil and groundwater. Water Science and Technology. 39(2): 185-192 Barrett, M.E., Smith, P., Malina, J.F. 1997. Performance of permanent runoff controls. ASCE Proceedings of the 24th Annual Water Resources Planning and Management Conference. Barrett, M.E., Walsh, P.M., Malina, J.F., Charbeneau, R.J. 1998. Performance of vegetative controls for treating highway runoff. Journal of Environmental Engineering. 124 (11): 1121-1128. Barrett, M. E. 2003. Performance, Cost and Maintenance Requirements of Austin sand filters. Journal of Water Resources Planning and Management. 129(3): 234-242. Bean, E. Z. 2005. A field study to evaluate permeable pavement surface infiltrations rates, runoff quantity, runoff quality, and exfiltrate quality. MS thesis. North Carolina State University, Department of Biological and Agricultural Engineering. Raleigh, N.C. Bean, E.Z., Hunt, W.F., and Bidelspach, D.A. 2007b. Evaluation of four permeable pavement sites in eastern North Carolina for runoff reduction and water quality impacts. Journal of Irrigation and Drainage Engineering, 133 (6):583-592. CALTRANS, 2004. California Department of Transportation, Division of Environmental Analysis. STP retrofit pilot program. Final Report CTSW-RT-01-050. January, 2004. Collins, K.A., Hunt, W.F., and Hathaway, J.M. 2008b. Nutrient and TSS removal comparison of four types of permeable pavement and standard asphalt in eastern North Carolina. (under review). CWP, 2007. National Pollutant Removal Performance Database, Version 3. Center for Watershed Protection. Ellicott City, MD
32

CSN Technical Bulletin No. 4 Technical Support for the Runoff Reduction Method
Day, G.E., Smith, D.R., and Bowers J. 1981. Runoff and pollution abatement characteristics of concrete grid pavements. Bulletin 135, Virginia Polytechnic Institute and State University. Davis, A.P., M. Shokouhian, H. Sharma and C. Minami. 2001. Laboratory Study of Biological Retention for Urban Stormwater Management. Water Environment Research. 73(5): 5-14. Davis, A.P., M. Shokouhian, H. Sharma and C. Minami. 2006. Water Quality Improvement through Bioretention Media: Nitrogen and Phosphorus Removal. Water Environment Research. 78(3): 284-293. Dechesne, M., Barraud, S., and Bardin, J.P. 2004. Spatial Distribution of pollution in an urban stormwater basin. Journal of Contaminant Hydrology. 72: 189-205 Dreelin E.A., Fowler, L. Carroll, R.C. 2006. A test of porous pavement effectiveness on clay soils during natural storm events. Water Research. 40: 799-805. Ermilio, J.R. 2005. Characterization Study of a Bio-Infiltration Stormwater STP. M.S. Thesis. Villanova University. Department of Civil and Environmental Engineering. Philadelphia, PA. Fletcher, T.D., Peljo, L., Fielding, J., Wong, T.H.F., and Weber, T. 2002. The performance of vegetated swales for urban stormwater pollution control. ACSE 9th International Conference on Urban Drainage. Portland, Oregon, Sept 8-13, 2002. Gilbert, J.K. and Clausen, J.C. 2006. Stormwater runoff quality and quantity from asphalt, paver, and crushed stone driveways in Connecticut. Water Research. 40: 826-832 Glanville, T., Persyn R., Richard, T. 2003. “Final Report: Impacts of Compost Blankets on Erosion Control, Revegetation, and Water Quality at Highway Construction Sites in Iowa.” Iowa State University. Goel, P.K., Rudra, R.P., Gharabaghi, B., Das, S., Gupta, N. 2004. Pollutants removal by vegetative filter strips planted with different grasses. ASAE International Meeting, Ottawa, Canada, 1-4 August 2004: 2521-2535 Harper, H., J. Herr, D. Baker, and E. Livingston. 1999. Performance Evaluation of Dry Detention Stormwater Management Systems. Sixth Biennial Stormwater Research & Watershed Management Conference September, 1999. Hathaway, J.M., W.F. Hunt, A. Johnson, and J.T. Smith. 2007a. Bruns Ave. Elementary School Wetland, Final Report – Stormwater Treatment Capabilities. Report from North Carolina State University Department of Biological and Agricultural Engineering to City of Charlotte Stormwater Services.
33

CSN Technical Bulletin No. 4 Technical Support for the Runoff Reduction Method
Hathaway, J.M., W.F. Hunt, A. Johnson, and J.T. Smith. 2007b. Edwards Branch Wetland, Final Report – Stormwater Treatment Capabilities. Report from North Carolina State University Department of Biological and Agricultural Engineering to City of Charlotte Stormwater Services. Hathaway, J.M., W.F. Hunt, A. Johnson, and J.T. Smith. 2007c. Pierson Pond, Final Report – Stormwater Treatment Capabilities. Report from North Carolina State University Department of Biological and Agricultural Engineering to City of Charlotte Stormwater Services. Hathaway, J.M., W.F. Hunt, A. Johnson, and J.T. Smith. 2007d. Shade Valley Pond, Final Report – Stormwater Treatment Capabilities. Report from North Carolina State University Department of Biological and Agricultural Engineering to City of Charlotte Stormwater Services. Hathaway, J.M., W.F. Hunt, and A. Johnson. 2007e. Morehead Dry Detention Final Report – Stormwater Treatment Capabilities. Report from North Carolina State University Department of Biological and Agricultural Engineering to City of Charlotte Stormwater Services. Hathaway, J.M., W.F. Hunt, and A. Johnson. 2007f. University Executive Park Dry Detention Basin, Final Report – Stormwater Treatment Capabilities. Report from North Carolina State University Department of Biological and Agricultural Engineering to City of Charlotte Stormwater Services. Hunt, W.F., A.R. Jarrett, J.T. Smith, L.J. Sharkey. 2006. Evaluating Bioretention Hydrology and Nutrient Removal at Three Field Sites in North Carolina. ASCE Journal of Irrigation and Drainage Engineering - Vol 132 (6): 600-608. Hunt, W.F., J.T. Smith, S.J. Jadlocki, J.M. Hathaway, P.R. Eubanks. 2008. Pollutant Removal and Peak Flow Mitigation by a Bioretention Cell in Urban Charlotte, NC. ASCE Journal of Environmental Engineering (in press) Hutchinson, D., P. Abrams, R. Retzlaff, and T. Liptan. 2003. Stormwater Monitoring Two Ecoroofs in Portland, Oregon, USA. In Proc. Greening Rooftops for Sustainable Communities: Chicago 2003: May 29-30, 2003; Chicago, Illinois. James, W. and Shahin, R. 1998 Ch 17: Pollutants Leached from Pavements by Acid Rain. In Advances in Modeling the Management of Stormwater Impacts, Vol. 6. 321-349. W. James, ed. Guelph, Canada: CHI. Jones, J., Clary, J., Strecker, E., Quigley, M. 2008. 15 Reasons you should think twice before using percent removal to assess STP performance. Stormwater Magazine. Jan/Feb 2008.
34

CSN Technical Bulletin No. 4 Technical Support for the Runoff Reduction Method
Metropolitan Area Planning Council (MACP). No Date. Low Impact Development Fact Sheet: Cisterns and Rain Barrels. Massachusetts Low Impact Development Tool Kit. Mallin, M.A., Ensign, S.H., Wheeler, T.L., and Mayes, D.B. 2002. Pollutant removal efficacy of three wet detention ponds. Journal of Environmental Quality. 31: 654-660. Middleton, J.R. and Barrett, M.E. 2006. Improved extended detention basin performance through better residence time control. Proceedings of the ASCE World Environmental and Water Resources Congress. May 21-25, 2006, Omaha, NE. Mikkelsen, P. S., Weyer, G., Berry, C., Walden, Y., Colandini, V., Poulsen, S., Grotehusmann, D., and Rohlfing, R. 1994. Pollution from urban stormwater infiltration. Water Science and Technology. 29(1): 293-302. Moran, A. and Hunt, B. 2005. Green roof hydrologic and water quality performance in North Carolina. 2005 ASAE Annual International Meeting, Tampa, Fl. 17 July 2005 Passeport, E., Hunt, W.F., Line, D.E., and Smith, R.A. 2008. Effectiveness of two grassed bioretention cells at reducing stormwater pollution. (under review) Pitt, R., Chen, S., Clark, S., Lantrip, J. 2005. Soil Structure Effect Associated with Urbanization and the Benefits of Soil Amendments. Rushton, B. 2002. Treatment of stormwater runoff from an agricultural basin by a wet-detention pond in Ruskin, Florida. Final Report to the Southwest Florida Water Management District. November, 2002. Sharkey, Lucas J. 2006. The Performance of Bioretention Areas in North Carolina: A Study of Water Quality, Water Quantity, and Soil Media. M.S thesis. North Carolina State University. Department of Biological and Agricultural Engineering. Raleigh, NC. Smith, R.A. and W.F. Hunt. 2006. Pollutant Removal in Bioretention Cells with Grass Cover. North Carolina State University. Raleigh, NC. Strecker, E., Quigley, M., Urbonas, B., and Jones, J. 2004. Stormwater management: State-of-the-art in comprehensive approaches to stormwater. The Water Report. Issue #6. Envirotech Publishers Inc., Eugene, OR. Taylor, S., Barrett, M., Borroum, J.S., Currier, B. 2001. Storm water treatment with a wet pond: a case study. Proceedings Proceedings of the 2001 Wetlands Engineering and River Restoration Conference, 2001, 323-332. UNH. 2007. University of New Hampshire Stormwater Center. 2007 Annual Report. Durham, NH.
35

CSN Technical Bulletin No. 4 Technical Support for the Runoff Reduction Method
Winer, R. 2000. National Pollutant Removal Performance Database for Stormwater Treatment Practices. 2nd Ed. Center for Watershed Protection. Ellicot City, MD. Yu, S.L. and M.D. Stopinski. 2001. Testing of Ultra-Urban Stormwater Best Management Practices. VTRC 01-R7. Virginia Transportation Research Council. Charlottesville, VA.
36

CSN Technical Bulletin No. 4 Technical Support for the Runoff Reduction Method
APPENDIX C:
LEVEL 1 AND 2 STP DESIGN FACTORS The following tables assign design factors to Level 1 or 2 that will achieve the indicated average runoff reduction and phosphorus removal rates.
C-1 Green Roof C-2 Permeable Pavers C-3 Bioretention C-4 Dry Swale C-5 Wet Swale C-6 Infiltration C-7 Extended Detention Pond C-8 Filtering Practice C-9 Constructed Wetland C-10 Wet Pond
The base pollutant removal and runoff reduction are the median values for Level 1, whereas Level 2 is the 75th percentile values. These tables do not include the standard setbacks, restrictions, feasibility constraints and minimum design features that apply to each practice at all site applications.
Table C-1. Green Roof Design Guidance Level 1 Design (RR:45; TP:0; TN:0) Level 2 Design (RR: 60; TP:0; TN:0) Depth of media four to six inches1 Media depth greater than six inches Soil media not tested for P-index Soil media with P index less than 10 Green roof receives roof runoff Green roof does not receive roof runoff or
is designed with additional media depth All Designs: shall be in conformance to ASTM (2005) International Green Roof Standards. Appropriate media and plant selection for harsh rooftop conditions and shallow media depths. Filter media mix should have the minimum organic matter/nutrient content to maintain fertility for plant growth but not contribute to nutrient leaching. 1If media depth is less than 4 inches, the runoff reduction credit is adjusted that each inch of media provides a 10% reduction in runoff volume.
Table C-2. Permeable Paver Design Guidance Level 1 Design (RR:45; TP:25; TN:25) Level 2 Design (RR: 75 TP:25; TN:25) TV= (1.0)(Rv)(A) TV = (1.1)(Rv) (A) Soil infiltration less than one-inch/hr Soil infiltration rate exceeds one-inch/hr Underdrain needed Underdrain not required CDA exceeds the pervious paver area CDA = The pervious paver area Slopes from 2 to 5% Slopes less than 2%
37

Table C-3. Bioretention Design Guidelines Level 1 Design (RR:40; TP:25; TN:40) Level 2 Design (RR:80; TP:50; TN:60) TV= (1.0)(Rv)(A) TV= (1.25) (Rv)(A) SA of filter exceeds 3% of CDA SA of filter bed exceeds 5% of CDA Filter media at least 24” deep Filter media at least 36” deep One form of accepted pretreatment Two or more forms of accepted pretreatment At least 75% plant cover w/ mulch At least 90% plant cover, including trees. One cell design Two cell design Underdrain needed Infiltration design or underground stone sump All Designs: acceptable media mix tested for phosphorus index, does not treat stormwater hotspot or baseflow.
Table C-4. Dry Swale Design Guidance Level 1 Design (RR:40; TP:20; TN:25) Level 2 Design (RR:60; TP:40; TN: 35) TV= (1.0)(Rv)(A) TV= (1.1)(Rv)(A) Swale slopes from <0.5% or >2.0% Swale slopes from 0.5% to 2.0% Soil infiltration rates less than 0.5 in Soil infiltration rates exceed one inch Swale served by underdrain Lacks underdrain or uses underground stone sump On-line design Off-line or multiple treatment cells Media depth less than 18 inches Media depth more than 24 inches Turf cover Turf cover, with trees and shrubs All Designs: acceptable media mix tested for phosphorus index
Table C-5. Wet Swale Design Guidance Level 1 Design (RR:0; TP:20; TN:25) Level 2 Design (RR:0; TP:40; TN:35) TV= (1.0)(Rv)(A) TV= (1.25)(Rv)(A) Swale slopes more than 1% Swale slopes less than 1% On-line design Off-line swale cells No planting Wetland planting within swale cells Turf cover in buffer Planting trees/shrubs within swale cells Note: Generally recommended only for flat coastal plain conditions with high water table. Linear wetland always preferred to wet swale
Table C-6. Infiltration Design Guidelines Level 1 Design (RR:50; TP:25; TN:15) Level 2 Design (RR:90; TP:25; TN:15) TV= (1.0)(Rv)(A) TV= (1.1)(Rv)(A) Maximum CDA of one acre Max CDA of 0.5 acre, nearly 100% IC At least one form of pretreatment At least two forms of pretreatment Soil infiltration rate of 0.5 to 1.0 in/hr Soil infiltration rates of 1.0 to 4.0 in/hr Underdrain needed due to soils No underdrain utilized All Designs: no hotspot runoff
38

Table C-7. Extended Detention (ED) Pond Guidance
Level 1 Design (RR:0; TP:15; TN:10) Level 2 Design (RR:15; TP:15; TN:10) TV= (1.0)(Rv)(A) TV = (1.25)(Rv) (A) At least 15% of TV in permanent pool More than 40% of TV in deep pool or wetlands Flow path at least 1:1 Flow path at least 1:5 to 1 Average ED time of 24 hours or less Average ED time of 36 hours vertical ED fluctuation exceeds 4 feet Maximum vertical ED limit of 4 feet Turf Cover on floor Trees and wetlands in the planting plan Forebay and micropool Additional cells or treatment methods (e.g.,
sand filter or biotretention on pond floor) CDA less than ten acres CDA greater than ten acres
Table C-8. Filtering STP Design Guidance Level 1 Design (RR:0; TP:60; TN:30) Level 2 Design (RR:0 1; TP:65; TN:45) TV= (1.0)(Rv)(A) TV= (1.25)(Rv)(A) One cell design Two cell design Sand media Sand media w/ organic layer CDA contains pervious area CDA is nearly 100% impervious Not a confirmed stormwater hotspot Site is a confirmed stormwater hotspot 1 can be increased to up to 50% if or second cell is used for infiltration
Table C-9. Constructed Wetland Design Guidance Level 1 Design (RR:0; TP:50; TN:25) Level 2 Design (RR:0; TP:75; TN:55) TV= (1.0)(Rv)(A) TV = (1.5)(Rv)(A) Single cell (with forebay) Multiple cells or pond/wetland design ED wetland No ED in wetland Uniform wetland depth Diverse microtopography Mean wetland depth more than one foot Mean wetland depth less than one foot Wetland SA/CDA ratio less than 3% Wetland SA/CDA ratio more than 3% Flow path 1:1 or less Flow path 1.5:1 or more Emergent wetland design Wooded wetland design
Table C-10 Wet Pond Design Guidance Level 1 Design (RR:0; TP:50; TN:30) Level 2 Design (RR:0; TP:75; TN:40) TV= (1.0)(Rv)(A) TV = (1.5)(Rv) (A) Single Pond Cell (w/ forebay) Wet ED or Multiple Cell Design Pool Depth Range of 3 to 12 feet Pool Depth Range of 4 to 8 feet Flow path 1:1 or less Flow path 1.5:1 or more Pond intersects with groundwater Adequate water balance CDA less than 15 acres CDA greater than 15 acres
39

APPENDIX D: MINIMUM CRITERIA FOR SELECT ESD PRACTICES
From a design standpoint, it is still important to establish qualifying criteria for the following ESD practices:
• Site Reforestation • Soil Restoration • Sheetflow to Conserved Open Space • Rooftop Disconnection • Grass Channels
The updated design criteria for these ESD practices are provided in the tables below. In most cases, the design criteria were based on the original qualifying credit criteria contained in the 2000 MDE Manual, but they have been updated to reflect local experience, further credit details in other manuals produced since 2000 (e.g., Minnesota, Credit River, DCR). The soil restoration and site reforestation criteria were drafted using recent research.
40

Table D-1. Site Reforestation Description: Site reforestation involves planting trees on existing turf or barren ground at a development site with the explicit goal of establishing a mature forest canopy that will intercept rainfall, increase evapo-transpiration and enhance soil infiltration rates. Reforestation areas at larger development sites and for individual trees for smaller development sites are eligible under certain qualifying conditions. Computation: A runoff coefficient of twice the forest runoff coefficient may be used for the entire combined areas of reforestation in the contributing drainage area, since it may take several decades for the replanted area to mature and provide full hydrologic benefits. If reforestation is combined with soil amendments, then the forest cover coefficient area can be used instead. The runoff reduction calculation for individual qualifying trees or tree clusters is 6 cubic feet per deciduous tree and 10 cubic feet per evergreen tree 1 Eligibility for Reforestation Practice (sites greater than one acre in size)
• The minimum contiguous area of reforestation must be greater than 5000 square feet
• A long term vegetation management plan must be prepared and filed with the local review authority to maintain the reforestation area in a natural forest condition
• The reforestation area must be protected by a perpetual stormwater easement or deed restriction that indicates that no future development or disturbance can occur within the area
• Reforestation methods must achieve 75% forest canopy within ten years • The planting plan must be approved by the appropriate local forestry or
conservation authority, including any special site preparation needs • The construction contract should contain a care and replacement warranty
extending at least three growing seasons to ensure adequate growth and survival of the plant community
• The reforestation area shall be shown on all construction drawings and ESC plans during construction
Eligibility for Individual Tree Practice (Sites less than one acre in size). • Qualifying trees on small sites include native tree at less two inches in caliper
planted in expanded tree pits with adequate soil volume to ensure future growth and survival
41

1 The individual tree runoff credits were developed from data contained in Portland BES(2004), PA DEP (2006) and Cappiella et al (2005a and 2005b)
Table D-2. Soil Restoration Criteria Application: Compost amended soils can be used to reduce the generation of runoff from compacted urban lawns and to enhance the runoff reduction performance of downspout disconnections and grass channels (Note: See Draft Soil Restoration Specification). Computation: A runoff reduction rate of 50% is given when compost amended soils receive runoff from an appropriately designed rooftop disconnection or grass channel. A 75% runoff reduction rate can be used for the runoff from lawn areas that are compost amended, but do not receive any off-site runoff from impervious surfaces. Suitability for Soil Restoration: Compost amended soils are suitable for any pervious area where soils have been or will be compacted by the grading and construction process. They are particularly well suited when existing soils have low infiltration rates (HSG C and D) and when the pervious area will be used to filter runoff (downspout disconnections and grass channels). The area or strip of amended soils should be hydraulically connected to the stormwater conveyance system. Compost amendments are not recommended where:
• Existing soils have high infiltration rates (i.e., A HSG) • The water table or bedrock is located within 1.5 feet of the soil surface. • Slopes exceed ten percent • Existing soils are saturated or seasonally wet • They would harm roots of existing trees (stay outside the tree drip line) • The downhill slope runs toward an existing or proposed building foundation
Sizing: Several simple sizing criteria are used when soil compost amendments are used to enhance the performance of a downspout disconnection
o Flow from the downspout should be spread over a 10 foot wide strip extending down-gradient from the building to the street or conveyance system.
• Existing soils in the strip will be scarified or tilled to a depth of 12 to 18 inches and amended with well-aged compost to achieve a organic matter content in the range of 8 to 13%.
• The depth of compost amendment is based on the relationship of the contributing rooftop area to the area of the soil amendment strip, using the guidance presented in the Bay-wide soil restoration design specification
Similar sizing criteria are used when soil compost amendments are used to enhance the performance of a grass channel
Flow in the grass channel should be spread over a 10 foot wide strip extending the length of the bottom of the channel
• Existing soils in the strip will be scarified or tilled to a depth of 12 inches and soils mixed with 6 to 8 inches of well-aged compost to achieve an organic matter content in the range of 8 to 13%.
• The amended area will need to be rapidly stabilized with perennial, salt tolerant grass species. For grass channels on steep slopes, it may be necessary to install a

Technical Support Memo for Runoff Reduction Method…CSN. March 15, 2008
Table D-2. Soil Restoration Criteria protective biodegradable geotextile fabric
• Designers will need to ensure that the final elevation of the grass channel meets original hydraulic capacity
Design Specifications: Leaf compost should be made exclusively of fallen deciduous leaves with less than 5% dry weight of woody or green yard debris materials. The compost shall contain less than 0.5% foreign material such as glass or plastic contaminants and be certified as pesticide free. The use of leaf mulch, composted mixed yard debris, biosolids, mushroom compost or composted animal manures is prohibited. The compost shall be matured and been composted for a period of at least one year and exhibit no further composition. Visual appearance of leaf matter in the compost is not acceptable. The compost should have a dry bulk density ranging from 40 to 50 lbs/ft3, a pH between 6 to 8 and a CEC in excess 50 meq/100 grams dry weight. Construction Sequence: The construction sequence for compost amendments differs depending whether the practice will be applied to a large area or a narrow filter strip such as in a rooftop disconnection or grass channel. For larger areas, a typical construction sequence is as follows.
1. Prior to building, the proposed area should be deep tilled to a depth of 2 to 3 feet using a tractor with two deep shanks (curved metal bars) to create rips perpendicular to the direction of flow.
2. A second deep tilling is needed after final building lots have been graded to a depth 12 to 18 inches
3. An acceptable compost mix is then incorporated into the soil using a rototiller or similar equipment at the volumetric rate of one part compost to two parts soils
4. The site should be leveled and seed or sod used to establish a vigorous grass cover. Lime or irrigation may initially be needed during start
5. Compost amendment areas exceeding 2500 square feet should employ simple erosion control measures, such as silt fence, to reduce the potential for erosion
6. If the soil restoration area will receive any upslope runoff, then erosion control measures are needed to keep sediments from upslope runoff from compromising the amended area, particularly during construction
7. Construction inspection involves digging a test pit to verify the depth of mulch, amended soil and scarification. A rod penetrometer should be used to establish the depth of uncompacted soil at one location per 10,000 square feet
The first step is usually omitted when compost is used for narrower filter strips.
43

Technical Support Memo for Runoff Reduction Method…CSN. March 15, 2008
Table D-3. Sheetflow To Conserved Open Space Description: Sending sheetflow from developed areas of the site to protected conservation areas Computation: The runoff coefficient for conservation area will be forest or restoration area, depending on predevelopment land cover. Qualifying contributing areas include any turf and impervious cover that is hydrologically connected to the protected conservation area and is effectively treated by it. A 75% runoff reduction practice is given for qualifying HSG A and B soils, and a 50% runoff reduction is given for qualifying HSG C and D soils. Basic Eligibility for the Conservation Area
• The minimum combined area of all natural areas conserved within the appropriate drainage area must exceed 0.5 acres
• No major disturbance may occur within the open space during or after construction (i.e., no clearing or grading allowed except temporary disturbances associated with incidental utility construction, restoration operations or management of nuisance vegetation). The conservation area shall not be stripped of topsoil. Some light grading may be needed at the boundary using tracked vehicles to prevent compaction
• The limits of disturbance should be clearly shown on all construction drawings and protected by acceptable signage and silt fencing
• A long term vegetation management plan must be prepared to maintain the conservation area in a natural vegetative condition. Managed turf is not considered an acceptable form of vegetative management, and only the passive recreation areas of dedicated parkland are eligible for the practice (e.g., ball fields and golf courses are not eligible)
• The conservation area must be protected by a perpetual easement or deed restriction that assigns the responsible party to ensure no future development, disturbance or clearing can occur within the area.
• The practice does not apply to jurisdictional wetlands that are sensitive to increased inputs of stormwater runoff
Basic Eligibility for the Runoff Generating Area
• The maximum contributing sheet flow path from adjacent pervious areas should not exceed 150 feet
• The maximum contributing sheet flow path from adjacent impervious areas should not exceed 75 feet
• If the contributing flow path has a slope greater than 3% , graded terraces should be placed every 20 feet along the flow path
• Runoff should enter the boundary of the open space as sheetflow for the one-inch storm. A depression, berm or level spreader may be used to spread out concentrated flows generated during larger storm events.
44

Technical Support Memo for Runoff Reduction Method…CSN. March 15, 2008
Table D-4. Rooftop Disconnection Description: This runoff reduction practice is offered when rooftop runoff is disconnected, and then filtered, treated, or reused before it moves from roof to the storm drain system. Computation: Two kinds of practices are allowed. One is for simple rooftop disconnection, whereas the second involves disconnection combined with supplementary runoff treatment involving: (a) Compost amended soils in the filter path (b) Installation of rain gardens or dry wells (c) Storage and reuse in a rain tank, cistern or foundation planter. Simple disconnection is assigned a runoff reduction rate of 50% on A/B soils (25% on C/D soils). Disconnection to amended soils is assigned a 50% reduction. Disconnection to rain gardens or dry wells is assigned a 75% reduction on A/B soils (50% for C/D soils). The runoff reduction for rain tanks and cisterns is 40%, but varies depending on design and the degree of water reuse. See Figure D-1 to determine the most appropriate rooftop disconnection option.
In addition to a RAIN TANK, consider using a rain garden or simple disconnection for the
overflow from the tank.
Use multiple RAIN TANKS or
a CISTERN
In addition to a RAIN TANK, consider using a rain garden or simple disconnection for the
overflow from the tank.
Use multiple RAIN TANKS or
a CISTERN
Use multiple RAIN TANKS or
a CISTERN
Figure D-1. Rooftop disconnection options.
Eligibility for Simple Downspout Disconnection (25 to 50% RR)
45
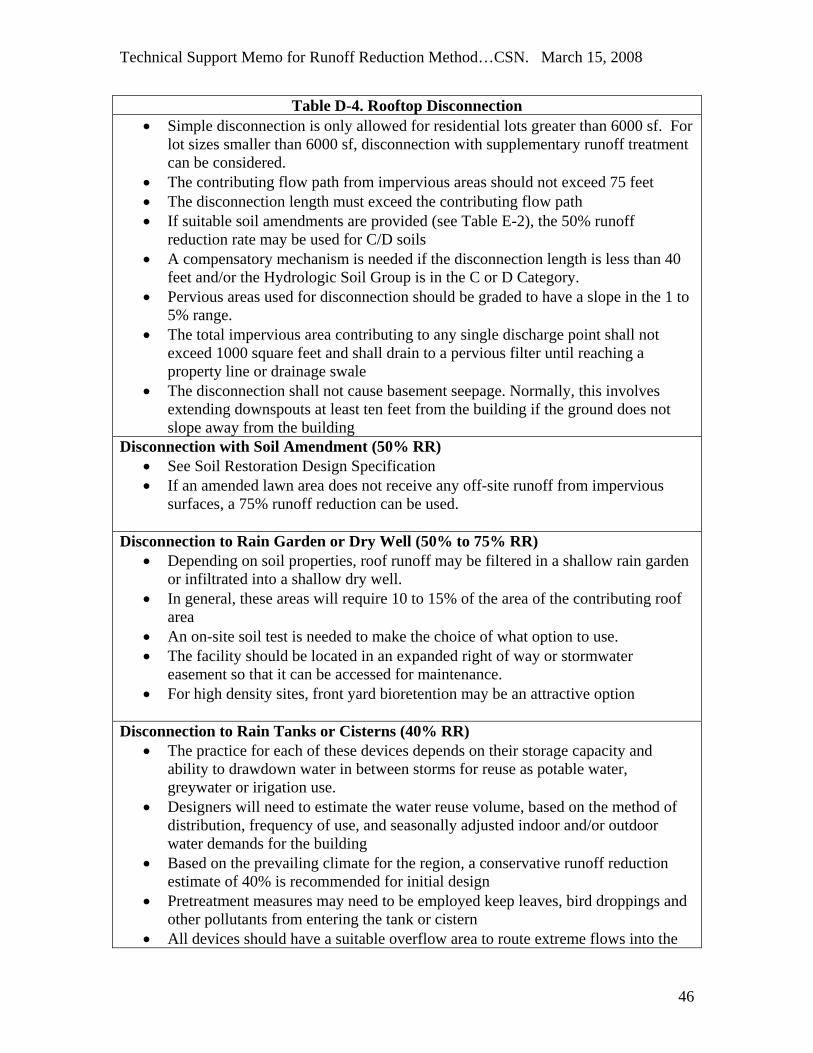
Technical Support Memo for Runoff Reduction Method…CSN. March 15, 2008
Table D-4. Rooftop Disconnection • Simple disconnection is only allowed for residential lots greater than 6000 sf. For
lot sizes smaller than 6000 sf, disconnection with supplementary runoff treatment can be considered.
• The contributing flow path from impervious areas should not exceed 75 feet • The disconnection length must exceed the contributing flow path • If suitable soil amendments are provided (see Table E-2), the 50% runoff
reduction rate may be used for C/D soils • A compensatory mechanism is needed if the disconnection length is less than 40
feet and/or the Hydrologic Soil Group is in the C or D Category. • Pervious areas used for disconnection should be graded to have a slope in the 1 to
5% range. • The total impervious area contributing to any single discharge point shall not
exceed 1000 square feet and shall drain to a pervious filter until reaching a property line or drainage swale
• The disconnection shall not cause basement seepage. Normally, this involves extending downspouts at least ten feet from the building if the ground does not slope away from the building
Disconnection with Soil Amendment (50% RR)
• See Soil Restoration Design Specification • If an amended lawn area does not receive any off-site runoff from impervious
surfaces, a 75% runoff reduction can be used. Disconnection to Rain Garden or Dry Well (50% to 75% RR)
• Depending on soil properties, roof runoff may be filtered in a shallow rain garden or infiltrated into a shallow dry well.
• In general, these areas will require 10 to 15% of the area of the contributing roof area
• An on-site soil test is needed to make the choice of what option to use. • The facility should be located in an expanded right of way or stormwater
easement so that it can be accessed for maintenance. • For high density sites, front yard bioretention may be an attractive option
Disconnection to Rain Tanks or Cisterns (40% RR)
• The practice for each of these devices depends on their storage capacity and ability to drawdown water in between storms for reuse as potable water, greywater or irigation use.
• Designers will need to estimate the water reuse volume, based on the method of distribution, frequency of use, and seasonally adjusted indoor and/or outdoor water demands for the building
• Based on the prevailing climate for the region, a conservative runoff reduction estimate of 40% is recommended for initial design
• Pretreatment measures may need to be employed keep leaves, bird droppings and other pollutants from entering the tank or cistern
• All devices should have a suitable overflow area to route extreme flows into the
46

Technical Support Memo for Runoff Reduction Method…CSN. March 15, 2008
Table D-4. Rooftop Disconnection next treatment practice or stormwater conveyance system
Table D-5. Grass Channels Description: The non-roadway portion of the area draining to the grass channel (rooftop, driveway and sidewalk impervious cover and turf cover) Computation: A 20% reduction in runoff volume is offered for combined turf and impervious cover draining to qualifying swales on A/B soils (10% on C/D soils) Eligibility: A qualifying grass channel meets the following criteria:
• Primarily serves low to moderate residential development, with a maximum density of no more than 4 dwelling units per acre
• The bottom width of the channel should be between 4 to 8 feet wide. If suitable soil amendments are provided (see Table E-2), the 20% runoff reduction rate may be used for C/D soils
• Swale side-slopes should be no steeper than 3H:1V • The longitudinal slope of the channel should be no greater than 2%. (Checkdams
may be used to break up slopes on steeper swales) • 5 acres maximum contributing drainage area to any individual grass channel • The dimensions of the channel should ensure that runoff velocity is non-erosive
during the two-year design storm event and safely convey the locals design storm (e.g., ten year design event)
• Designers should demonstrate that the channel will have a maximum flow velocity of less than one foot per second during a one-inch storm event
Note: Where feasible, the dry swale is always the preferable option due to its greater runoff reduction and pollutant reduction capability.
References: Balusek. 2003. Quantifying decreases in stormwater runoff from deep-tilling, chisel-planting and compost amendments. Dane County Land Conservation Department. Madison, Wisconsin. Cappiella, K., T. Wright and T. Schueler. 2005. Urban Watershed Forestry Manual. Part 1. Methods for increasing forest cover in a watershed. USDA Forest Service. Newton Square, PA. Cappiella, K., T. Schueler, and T. Wright. 2005. Urban Watershed Forestry Manual. Part 2: Conserving and Planting Trees at Development Sites. USDA Forest Service, Newtown Square, PA. Portland BES. 2003. Stormwater Management Manual. City of Portland. Portland, Oregon.
47

Technical Support Memo for Runoff Reduction Method…CSN. March 15, 2008
PA DEP. 2006. Pennsylvania Stormwater Manaual. Department of Environmental Protection. Harrisburg, PA Roa-Espinosa. 2006. An introduction to soil compaction and the subsoiling practice. technical note. Dane County Land Conservation Department. Madison,Wisconsin. Smith, R and W. Hunt. 2007. Pollutant removals in bioretention cells with grass cover. Proceedings 2nd National Low Impact Development Conference. Wilmington, NC. March 13-15, 2007.
48

Technical Support Memo for Runoff Reduction Method…CSN. March 15, 2008
APPENDIX E
SAMPLE VA DCR SPREADSHEET
49