Cross Sectional Examination of a Fouled Tube Removed from ...
35
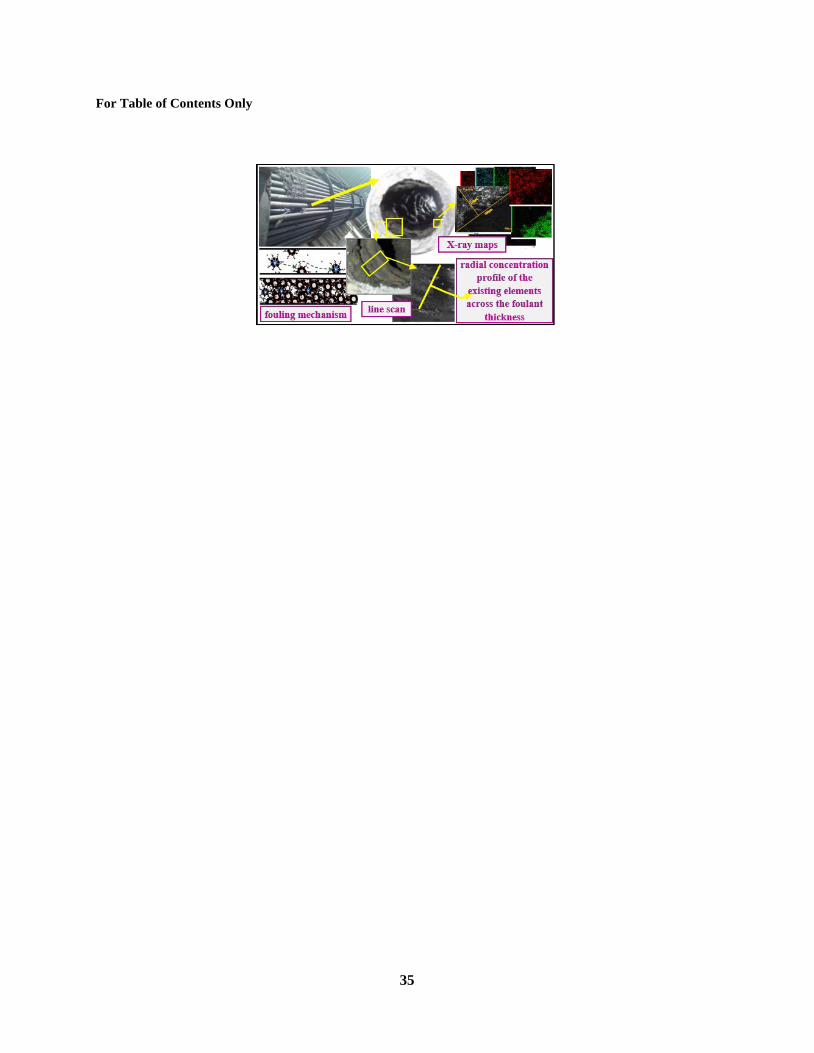
1 Cross Sectional Examination of a Fouled Tube Removed from a Crude Oil Preheat Exchanger Elaheh Behranvand a , Mohammad Reza Mozdianfard a, *, Emilio Diaz-Bejarano b,c , Francesco Coletti c,d , Pawel Orzlowski b and Sandro Macchietto b,c a Chem. Eng. Dep., University of Kashan, Kashan, 87317-53153, IRAN b Dept. of Chem. Eng., Imperial College London, London SW7 2AZ, UK c Hexxcell Ltd., Innovation Hub, White City Campus, 80 Wood Lane, London W12 0BZ, UK d College of Engineering, Design and Physical Sciences, Brunel University London, Uxbridge, UB8 3PH, UK *[email protected] Abstract A first attempt is presented to characterize intact foulant of a refinery preheater. A tube was removed from an exchanger located post-desalter and preflash-drum at a 4-year shutdown, and dissected into undisturbed cut-out rings. Following visual inspection, elemental analysis (x-ray maps and line scans) was carried out and radial concentration profiles of the existing elements were established. A stratified coloured foulant layer inside the tube appeared in sine waves fluctuating at both axial and angular directions, likely evidencing for the first time a shadow effect and erosion process. Results agreed with our studies on a comparable exchanger of the same refinery. They confirm the proposed deposition mechanism and simulation results, indicating: formation of a stratified foulant consisting inorganics ranging 50wt%; presence of an acute inorganic deposition period along the chronic organic-inorganic fouling; and identification of foulant phases arrangement, amongst possible conductivity mixing models, as co- continuous and effective medium theory structures. Keywords: crude oil fouling, preheat train, characterization, stratified deposit, modelling
Transcript of Cross Sectional Examination of a Fouled Tube Removed from ...
1
Cross Sectional Examination of a Fouled Tube
Removed from a Crude Oil Preheat Exchanger
Elaheh Behranvanda, Mohammad Reza Mozdianfarda,*, Emilio Diaz-Bejarano b,c, Francesco Colettic,d, Pawel
Orzlowskib and Sandro Macchiettob,c
a Chem. Eng. Dep., University of Kashan, Kashan, 87317-53153, IRAN
b Dept. of Chem. Eng., Imperial College London, London SW7 2AZ, UK
c Hexxcell Ltd., Innovation Hub, White City Campus, 80 Wood Lane, London W12 0BZ, UK
d College of Engineering, Design and Physical Sciences, Brunel University London, Uxbridge, UB8 3PH, UK
Abstract
A first attempt is presented to characterize intact foulant of a refinery preheater. A tube was removed
from an exchanger located post-desalter and preflash-drum at a 4-year shutdown, and dissected into
undisturbed cut-out rings. Following visual inspection, elemental analysis (x-ray maps and line scans) was
carried out and radial concentration profiles of the existing elements were established. A stratified coloured
foulant layer inside the tube appeared in sine waves fluctuating at both axial and angular directions, likely
evidencing for the first time a shadow effect and erosion process. Results agreed with our studies on a
comparable exchanger of the same refinery. They confirm the proposed deposition mechanism and
simulation results, indicating: formation of a stratified foulant consisting inorganics ranging 50wt%;
presence of an acute inorganic deposition period along the chronic organic-inorganic fouling; and
identification of foulant phases arrangement, amongst possible conductivity mixing models, as co-
continuous and effective medium theory structures.
Keywords: crude oil fouling, preheat train, characterization, stratified deposit, modelling
2
1. Introduction
Fouling in crude oil preheat exchangers presents refineries with major operational, environmental and
safety challenges, concerning issues such as reduced heat transfer, rising pressure drop, excess CO2 emissions,
waste disposal, hazards related to approaching furnace limits, crane operation, personnel health and safety.
These could result in substantial economic penalties amounting to about $12.5MM per annum for a 100,000
bbl/day refinery1. Such fouling concerns are as old as heat exchangers themselves and have been scrutinized
from molecular to large industrial scales2 using either empirical studies on deposit generating rigs (hot wires3,
microbomb reactors4,5, batch stirred cells6,7 and flow loops8,9) or field studies on refinery preheat exchangers10–
14. The studies employ two main investigation means: analysis of process data and foulant samples
characterisations. The former aims to predict heat exchanger performance upon unintentional or planned
changes in the presence of fouling, by determining how fouling rate depends on measurable operating
conditions and fluid composition within an operating period, utilising various models and monitoring systems.
Characterization of collected foulant samples on the other hand, has helped in determining the underlying
fouling mechanisms15–17, recognized by Wiehe18 as the most informative source in setting up the required
fouling mitigation strategy. He argued that fouling cause/s should first be determined and traced back to the
source, whereupon, ways to interrupt/reduce foulant precursors are devised and selected depending on the
refinery conditions. Accordingly, applying any fouling reduction method without knowing the cause/s, may
pass the problem on to the next unit18.
However, the characteristics of foulant samples from experimental rigs do not quite represent those of
refinery heat exchangers12,19, mainly due to inaccurate simulation of flow condition, temperature, feed quality,
geometry and surface condition of a refinery heat exchanger into a lab scale rig. Sampling deposits from a
refinery exchanger becomes often possible only by dismantling it during major shutdowns, at intervals of 4-
5 years. Even so, maintenance practices and priorities (given the high risks associated with intense and diverse
repairs being simultaneously carried out by many technicians/contractors in limited operating space and time),
3
limit a safe, rapid and precise collection method. In order to identify fouling mechanism, samples should
provide information where the cause of fouling can be traced back to the source. This is not easily achievable
where refineries use a variety of crude feeds, even when feed blends are carefully recorded, together with
operations history and upsets (which is not common). Furthermore, samples should be carefully collected
from specified locations with accuracy, integrity and in a manner where representations of all surfaces fouled
by the same mechanism/s are distinguished. Intense planning and collaboration by all parties concerned is
required for such an applied scientific investigation to become reliable.
For instance, samples from the outer surfaces of exchanger tubes need to be collected from the maximum
possible number of tubes located in various position of the bundle, while care should be taken not to include
foulant deposited just besides the baffles or tube sheets, so as to minimise contamination due to maintenance
practices. As for inside the tube, samples may be collected by scratching the accessible entrance/exit surface
of the 4 to 6 m long tubes. Such samples by necessity become homogenised. Analysis of scraped
homogenized deposit already helps studying the overall fouling mechanism, but disregards deposition history
as its lay-down pattern has been disrupted. Deposition history could be defined as all information concerning
foulant species including: elements and their corresponding compounds, concentrations, deposition velocities,
structural arrangement and their variation during operating period. Understanding of fouling behaviour
evolution throughout layer build-up requires tubes to be dissected and their intact foulant examined in order
to provide such valuable information as radial concentration profiles, whereupon the deposition history is
reflected. The analysis of different tube sections would give additional information on deposition (e.g. axial
near the entrance or exit, or in different passes).
In recent years, several studies20–24 have led to the development of a comprehensive modelling framework
capable of relating the formation of different deposit layers to the corresponding exchanger operating
conditions (e.g. shear stress, temperature) and processing history (oil type, desalting performance, etc.). In
4
other words, it links deposit characteristics to specific events in time. Such studies may be termed
‘depositochronology’, analogous to ‘dendrochronology’, the scientific method of relating tree rings (also
called growth rings) characteristics to the exact year they were formed, in order to analyse atmospheric
conditions during different growth periods in history. A tree’s growth rate changes in a predictable pattern
throughout the year in response to seasonal climate changes, resulting in visible growth rings. Similarly,
formation of deposit with complex layer structures follows changes in fouling behaviour caused by different
operation. This is reflected macroscopically in measurable changes in the exchangers’ thermal and hydraulic
performance, mainly due to differences in thermal conductivity of fouling species deposited. Inorganic species
are expected to have higher conductivities than those of the organic ones typically found in pre-heat trains.
Hence, by monitoring an exchanger thermal and hydraulic data, information may be extracted on deposit
thickness and local thermal conductivity over time. Then, radial inorganic content profiles may be obtained
using the relations presented in25 for various thermal-conductivity mixing structures. However, obtaining the
right profile requires correct assumptions of the deposit structure. This can be based on either using an
appropriate fouling mechanism or, a posteriori, deposit characterization of scraped-homogenised or intact
samples. Once validated, if only inlet conditions and deposit characteristics of an exchanger were available,
the above models may be used to calculate the thermo-hydraulic performance along the operating period.
Hence, the availability and analysis of intact foulant samples would play a key role in the implementation,
validation and development of such advanced monitoring systems.
However, intact foulant characteristics have only been investigated in two works using experimental
rigs26,27 and, to the best of our knowledge, none has been publicly reported on refinery preheat exchangers
(apart from an initial analysis of the samples in this work presented in ref 24). In both of these works, while
studying combined sulphide and coke fouling, elements distribution across deposit thickness were established
by SEM-EDX analysis of the intact foulant samples. In the former, the sample was deposited on the outer
5
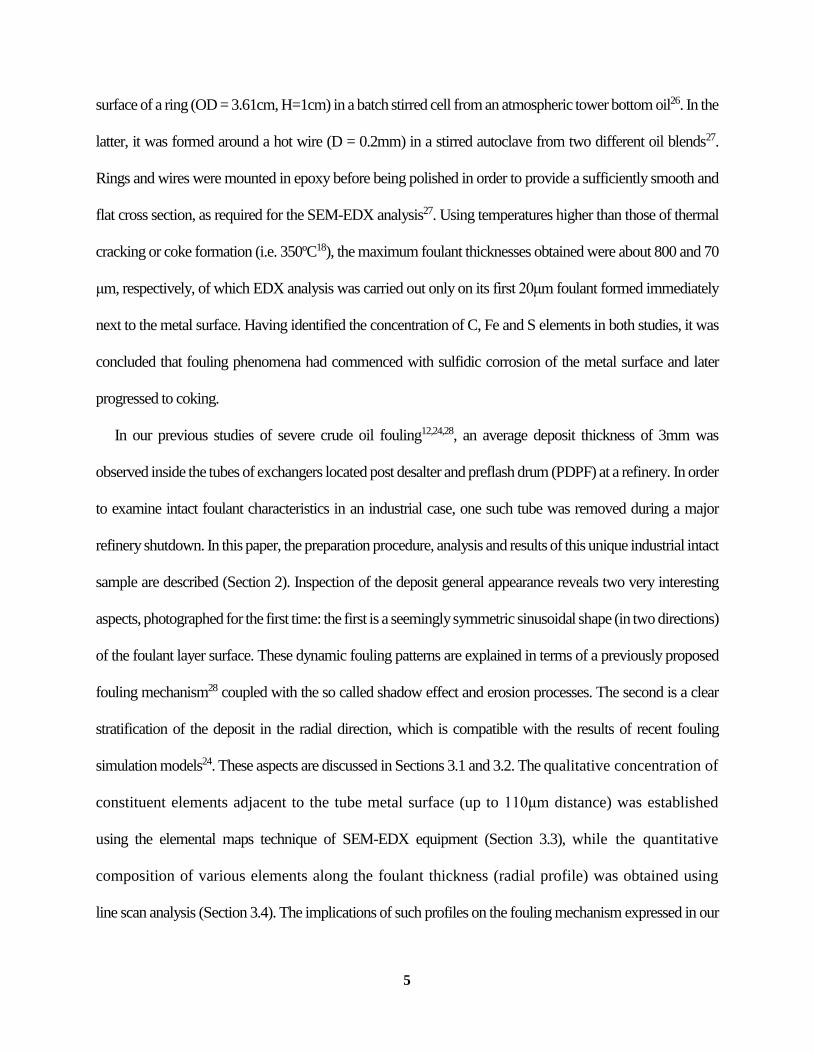
surface of a ring (OD = 3.61cm, H=1cm) in a batch stirred cell from an atmospheric tower bottom oil26. In the
latter, it was formed around a hot wire (D = 0.2mm) in a stirred autoclave from two different oil blends27.
Rings and wires were mounted in epoxy before being polished in order to provide a sufficiently smooth and
flat cross section, as required for the SEM-EDX analysis27. Using temperatures higher than those of thermal
cracking or coke formation (i.e. 350ºC18), the maximum foulant thicknesses obtained were about 800 and 70
μm, respectively, of which EDX analysis was carried out only on its first 20μm foulant formed immediately
next to the metal surface. Having identified the concentration of C, Fe and S elements in both studies, it was
concluded that fouling phenomena had commenced with sulfidic corrosion of the metal surface and later
progressed to coking.
In our previous studies of severe crude oil fouling12,24,28, an average deposit thickness of 3mm was
observed inside the tubes of exchangers located post desalter and preflash drum (PDPF) at a refinery. In order
to examine intact foulant characteristics in an industrial case, one such tube was removed during a major
refinery shutdown. In this paper, the preparation procedure, analysis and results of this unique industrial intact
sample are described (Section 2). Inspection of the deposit general appearance reveals two very interesting
aspects, photographed for the first time: the first is a seemingly symmetric sinusoidal shape (in two directions)
of the foulant layer surface. These dynamic fouling patterns are explained in terms of a previously proposed
fouling mechanism28 coupled with the so called shadow effect and erosion processes. The second is a clear
stratification of the deposit in the radial direction, which is compatible with the results of recent fouling
simulation models24. These aspects are discussed in Sections 3.1 and 3.2. The qualitative concentration of
constituent elements adjacent to the tube metal surface (up to 110μm distance) was established
using the elemental maps technique of SEM-EDX equipment (Section 3.3), while the quantitative
composition of various elements along the foulant thickness (radial profile) was obtained using
line scan analysis (Section 3.4). The implications of such profiles on the fouling mechanism expressed in our
6
previous studies are discussed, together with considerations on the choice and effect of structural models for
mixed-phase deposits. The experimental results are also compared with the depositochronology indications
obtained by the thermo-hydraulic analysis carried out previously, using the comprehensive modelling
framework in refs 23 and 24. Finally, Section 4 briefly discusses some new opportunities enabled by the
combined use of the experimental results presented with the advanced model-based analysis of operating data,
and is followed by key Conclusions.
2. Experimental
2.1. Sample
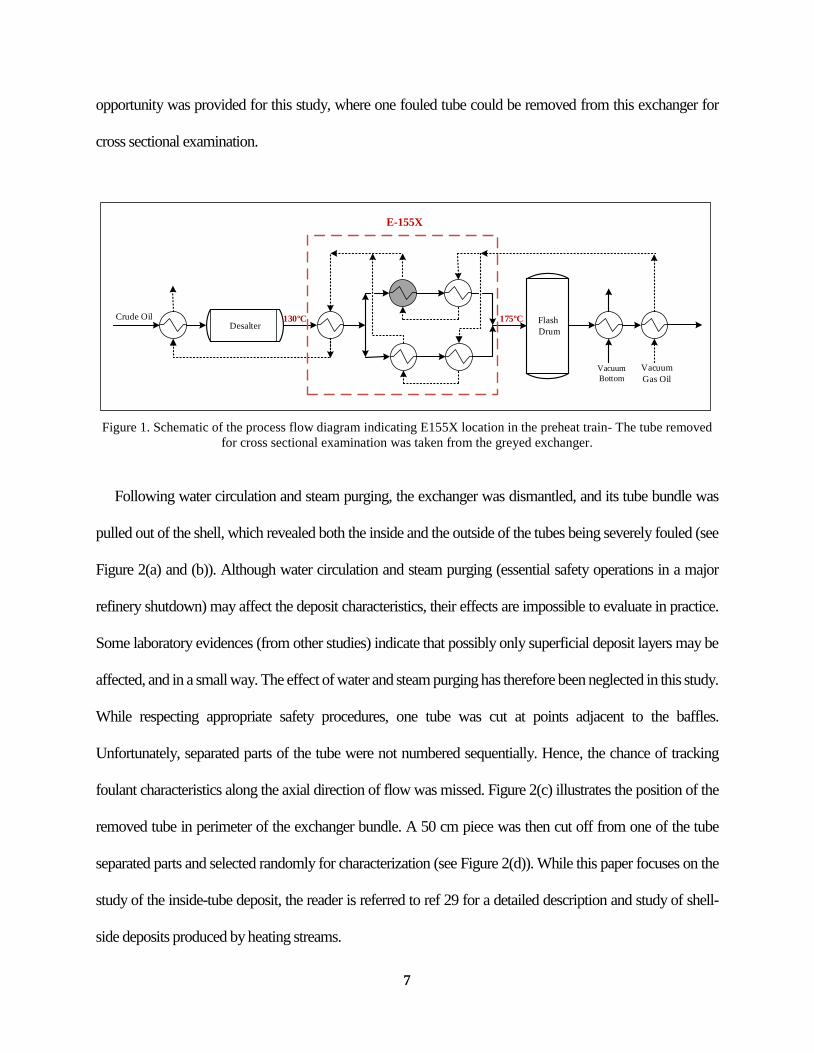
One tube was removed during a major shutdown from a set of exchangers (E155X, see Figure 1) located
in the post desalter and preflash drum (PDPF) of a preheat train in a refinery’s crude distillation unit. The train
had processed only one type of crude oil (with SG = 0.86) continuously for an operating period of about 4
years. Although some crude oil variability is inevitable, this eliminates one of the major sources of variation
in the analysis of industrial fouling, i.e. blend changes. Desalted crude oil entered the tube-side of these
exchangers and was heated by Vacuum Gas Oil (VGO) as shell-side fluid, and subsequently lost its lighter
fractions in a flash drum. Severe crude oil fouling had been experienced in these exchangers, leading to
approximately 20ºC decrease in temperature difference and 4 bar increase in pressure drop on the tube side,
compared to their initial operating conditions. Plant data indicated that a maximum temperature range of 130-
175ºC had been experienced by the crude oil with its velocity in clean conditions being about 1.6m/s. The
exchangers’ datasheets specified 529 tubes with 4267mm length being made of carbon steel with outer
diameter and wall thickness of 2.54 and 0.28 cm, respectively. In one of these exchangers (greyed in Figure
1), the tube bundle had been in operation for about 30 years, and had to be re-tubed in the shutdown based on
corrosion reports indicating the least allowable limits being reached for the wall thickness. Hence, an
7
opportunity was provided for this study, where one fouled tube could be removed from this exchanger for
cross sectional examination.
Crude Oil
E-155X
Flash
Drum
Vacuum
Gas Oil
Desalter
Vacuum
Bottom
130ºC 175ºC
Figure 1. Schematic of the process flow diagram indicating E155X location in the preheat train- The tube removed
for cross sectional examination was taken from the greyed exchanger.
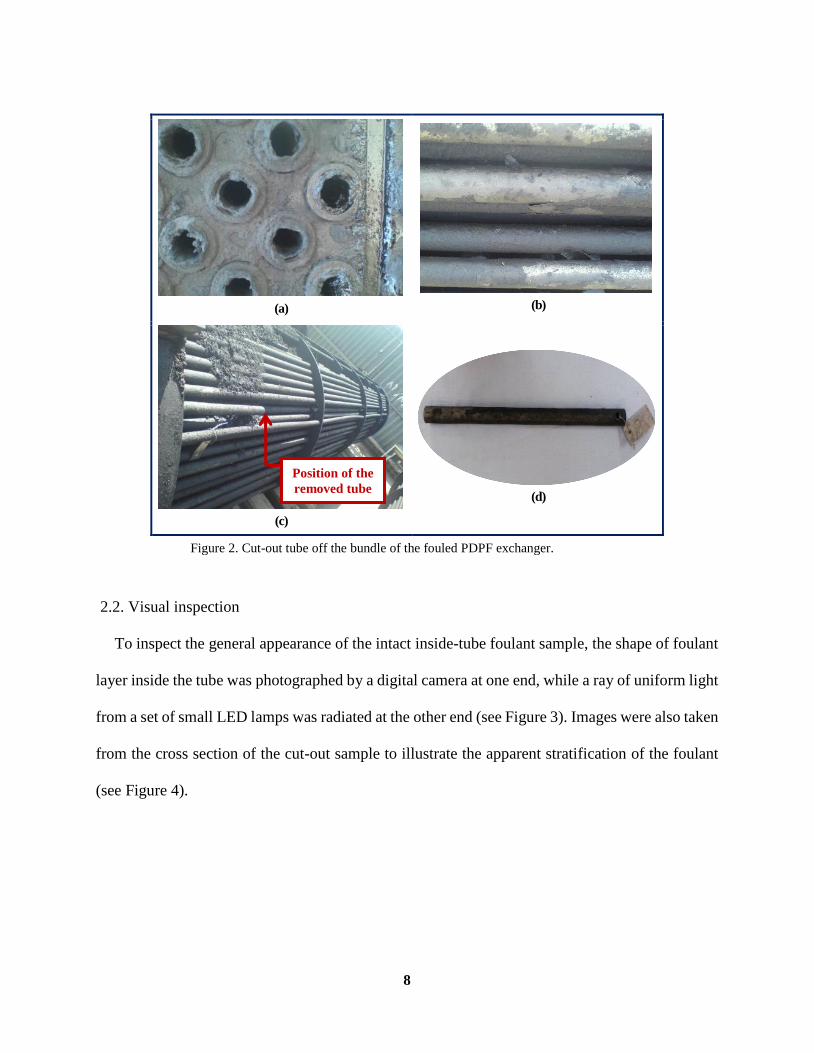
Following water circulation and steam purging, the exchanger was dismantled, and its tube bundle was
pulled out of the shell, which revealed both the inside and the outside of the tubes being severely fouled (see
Figure 2(a) and (b)). Although water circulation and steam purging (essential safety operations in a major
refinery shutdown) may affect the deposit characteristics, their effects are impossible to evaluate in practice.
Some laboratory evidences (from other studies) indicate that possibly only superficial deposit layers may be
affected, and in a small way. The effect of water and steam purging has therefore been neglected in this study.
While respecting appropriate safety procedures, one tube was cut at points adjacent to the baffles.
Unfortunately, separated parts of the tube were not numbered sequentially. Hence, the chance of tracking
foulant characteristics along the axial direction of flow was missed. Figure 2(c) illustrates the position of the
removed tube in perimeter of the exchanger bundle. A 50 cm piece was then cut off from one of the tube
separated parts and selected randomly for characterization (see Figure 2(d)). While this paper focuses on the
study of the inside-tube deposit, the reader is referred to ref 29 for a detailed description and study of shell-
side deposits produced by heating streams.
8
(a)
(b)
(c)
(d)
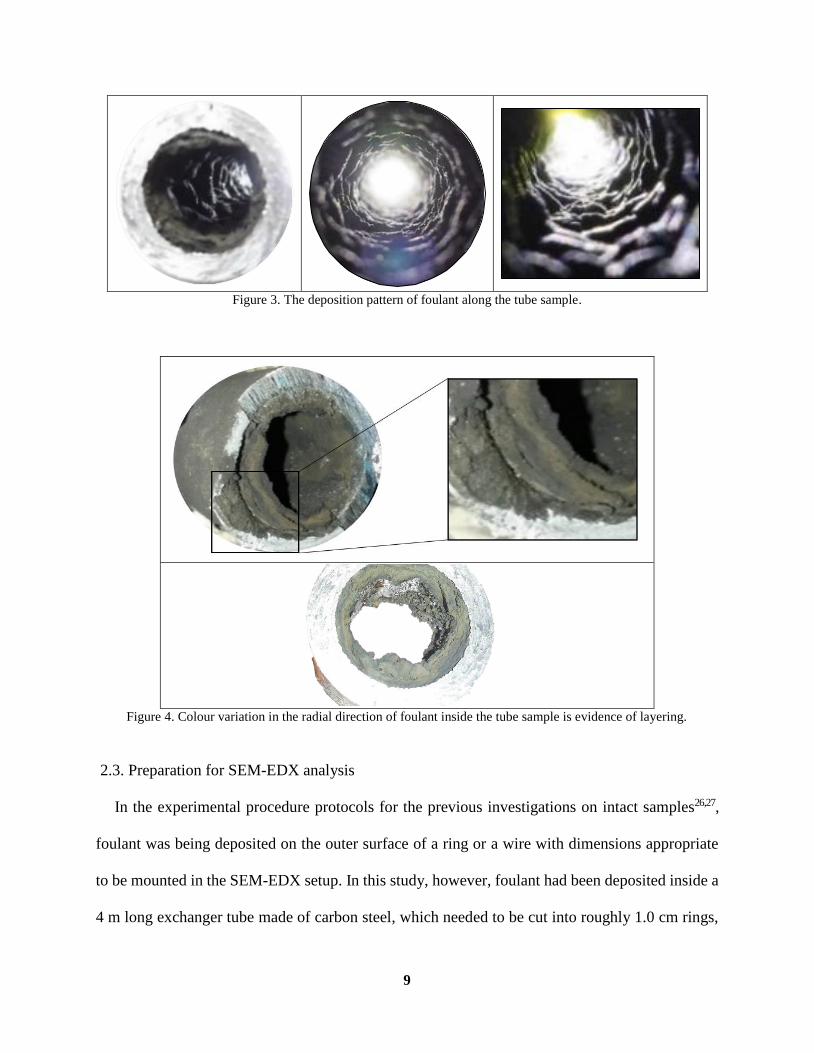
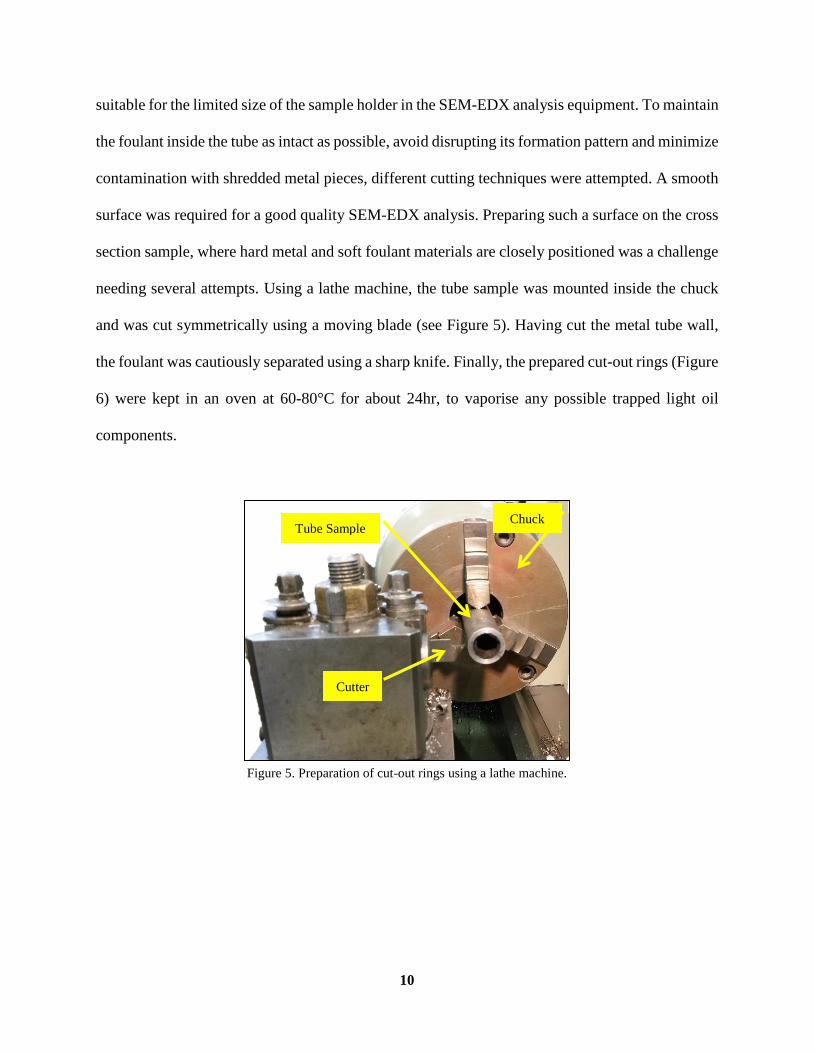
2.2. Visual inspection
To inspect the general appearance of the intact inside-tube foulant sample, the shape of foulant
layer inside the tube was photographed by a digital camera at one end, while a ray of uniform light
from a set of small LED lamps was radiated at the other end (see Figure 3). Images were also taken
from the cross section of the cut-out sample to illustrate the apparent stratification of the foulant
(see Figure 4).
Figure 2. Cut-out tube off the bundle of the fouled PDPF exchanger.
Position of the
removed tube
9
Figure 3. The deposition pattern of foulant along the tube sample.
Figure 4. Colour variation in the radial direction of foulant inside the tube sample is evidence of layering.
2.3. Preparation for SEM-EDX analysis
In the experimental procedure protocols for the previous investigations on intact samples26,27,
foulant was being deposited on the outer surface of a ring or a wire with dimensions appropriate
to be mounted in the SEM-EDX setup. In this study, however, foulant had been deposited inside a
4 m long exchanger tube made of carbon steel, which needed to be cut into roughly 1.0 cm rings,
10
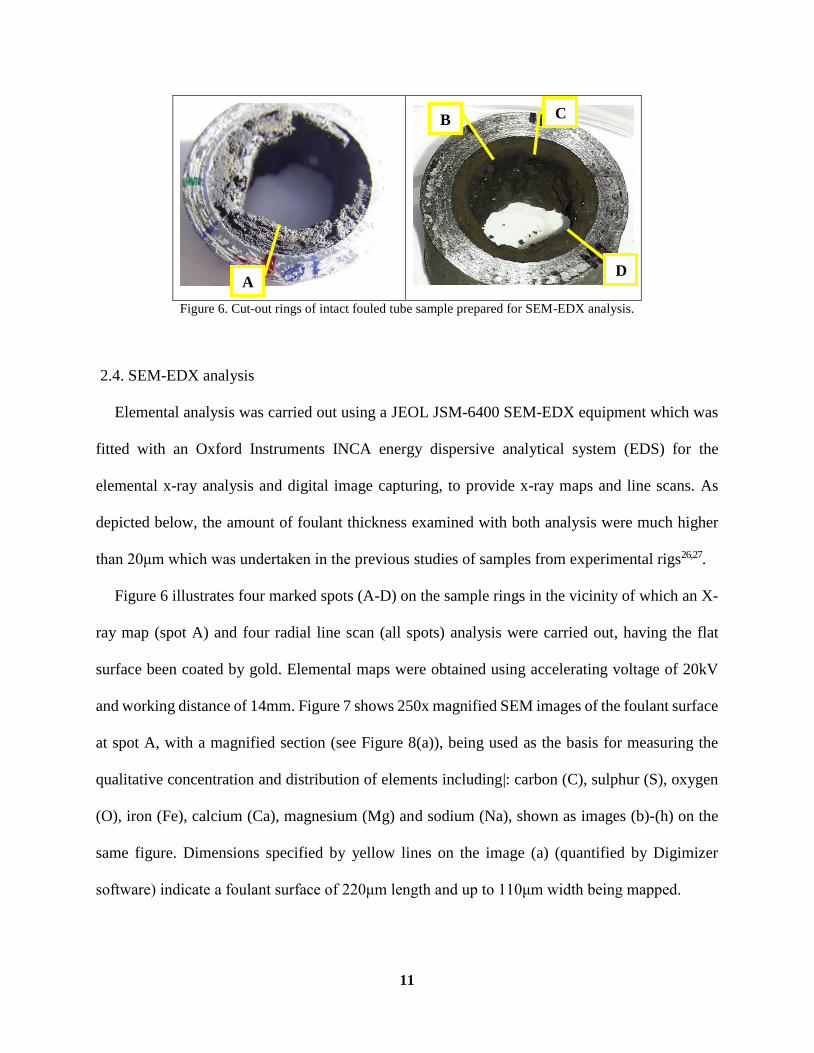
suitable for the limited size of the sample holder in the SEM-EDX analysis equipment. To maintain
the foulant inside the tube as intact as possible, avoid disrupting its formation pattern and minimize
contamination with shredded metal pieces, different cutting techniques were attempted. A smooth
surface was required for a good quality SEM-EDX analysis. Preparing such a surface on the cross
section sample, where hard metal and soft foulant materials are closely positioned was a challenge
needing several attempts. Using a lathe machine, the tube sample was mounted inside the chuck
and was cut symmetrically using a moving blade (see Figure 5). Having cut the metal tube wall,
the foulant was cautiously separated using a sharp knife. Finally, the prepared cut-out rings (Figure
6) were kept in an oven at 60-80°C for about 24hr, to vaporise any possible trapped light oil
components.
Figure 5. Preparation of cut-out rings using a lathe machine.
Tube Sample
Cutter
Chuck
11
Figure 6. Cut-out rings of intact fouled tube sample prepared for SEM-EDX analysis.
2.4. SEM-EDX analysis
Elemental analysis was carried out using a JEOL JSM-6400 SEM-EDX equipment which was
fitted with an Oxford Instruments INCA energy dispersive analytical system (EDS) for the
elemental x-ray analysis and digital image capturing, to provide x-ray maps and line scans. As
depicted below, the amount of foulant thickness examined with both analysis were much higher
than 20μm which was undertaken in the previous studies of samples from experimental rigs26,27.
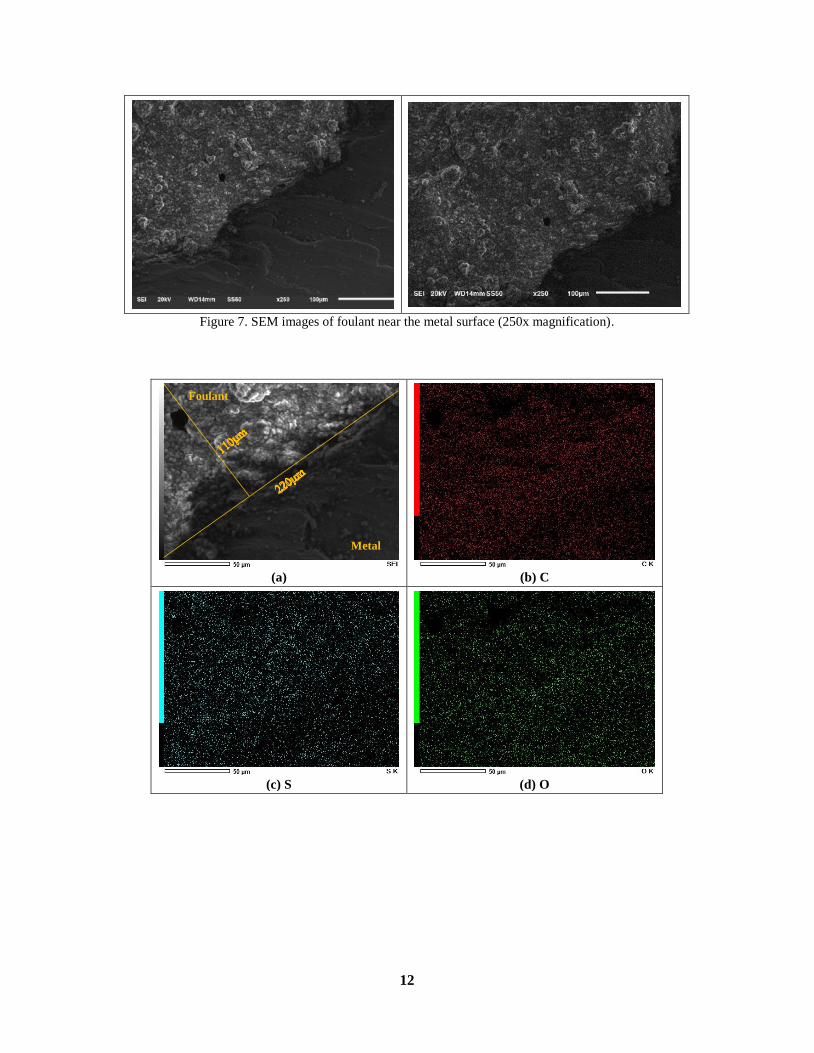
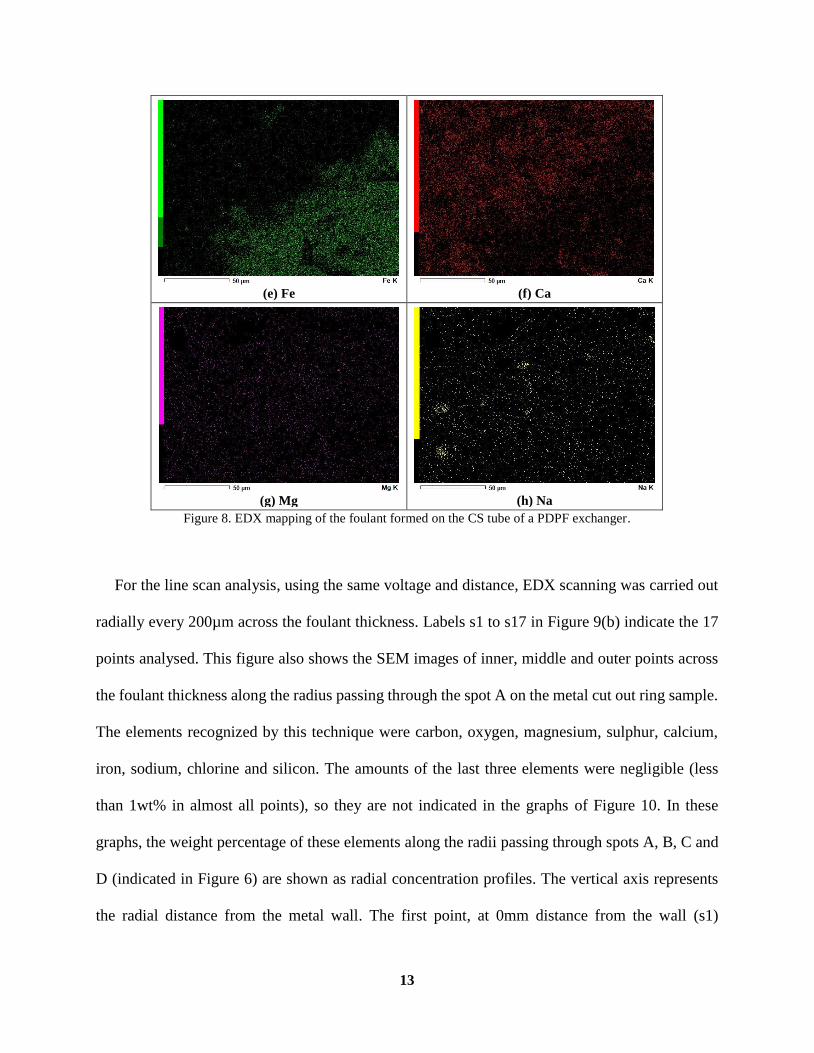
Figure 6 illustrates four marked spots (A-D) on the sample rings in the vicinity of which an X-
ray map (spot A) and four radial line scan (all spots) analysis were carried out, having the flat
surface been coated by gold. Elemental maps were obtained using accelerating voltage of 20kV
and working distance of 14mm. Figure 7 shows 250x magnified SEM images of the foulant surface
at spot A, with a magnified section (see Figure 8(a)), being used as the basis for measuring the
qualitative concentration and distribution of elements including|: carbon (C), sulphur (S), oxygen
(O), iron (Fe), calcium (Ca), magnesium (Mg) and sodium (Na), shown as images (b)-(h) on the
same figure. Dimensions specified by yellow lines on the image (a) (quantified by Digimizer
software) indicate a foulant surface of 220μm length and up to 110μm width being mapped.
A
B C
D
12
Figure 7. SEM images of foulant near the metal surface (250x magnification).
(b) C
(a)
(d) O
(c) S
Metal
Foulant
13
(f) Ca
(e) Fe
(h) Na
(g) Mg
Figure 8. EDX mapping of the foulant formed on the CS tube of a PDPF exchanger.
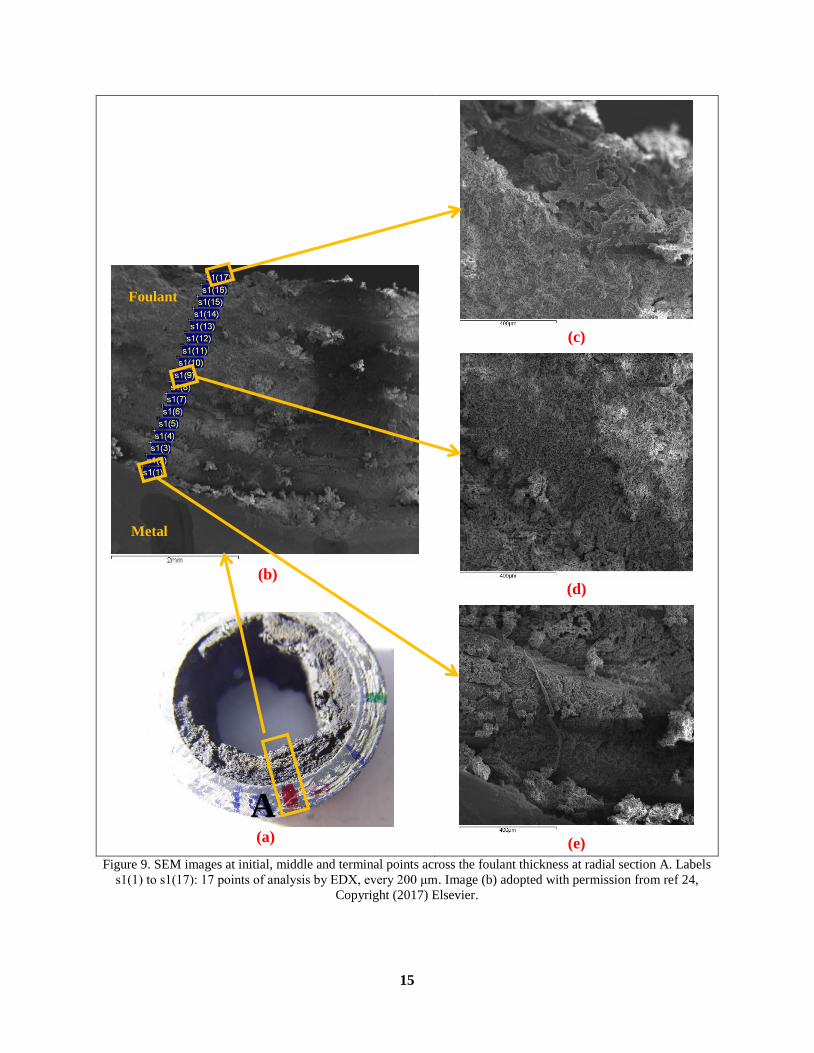
For the line scan analysis, using the same voltage and distance, EDX scanning was carried out
radially every 200µm across the foulant thickness. Labels s1 to s17 in Figure 9(b) indicate the 17
points analysed. This figure also shows the SEM images of inner, middle and outer points across
the foulant thickness along the radius passing through the spot A on the metal cut out ring sample.
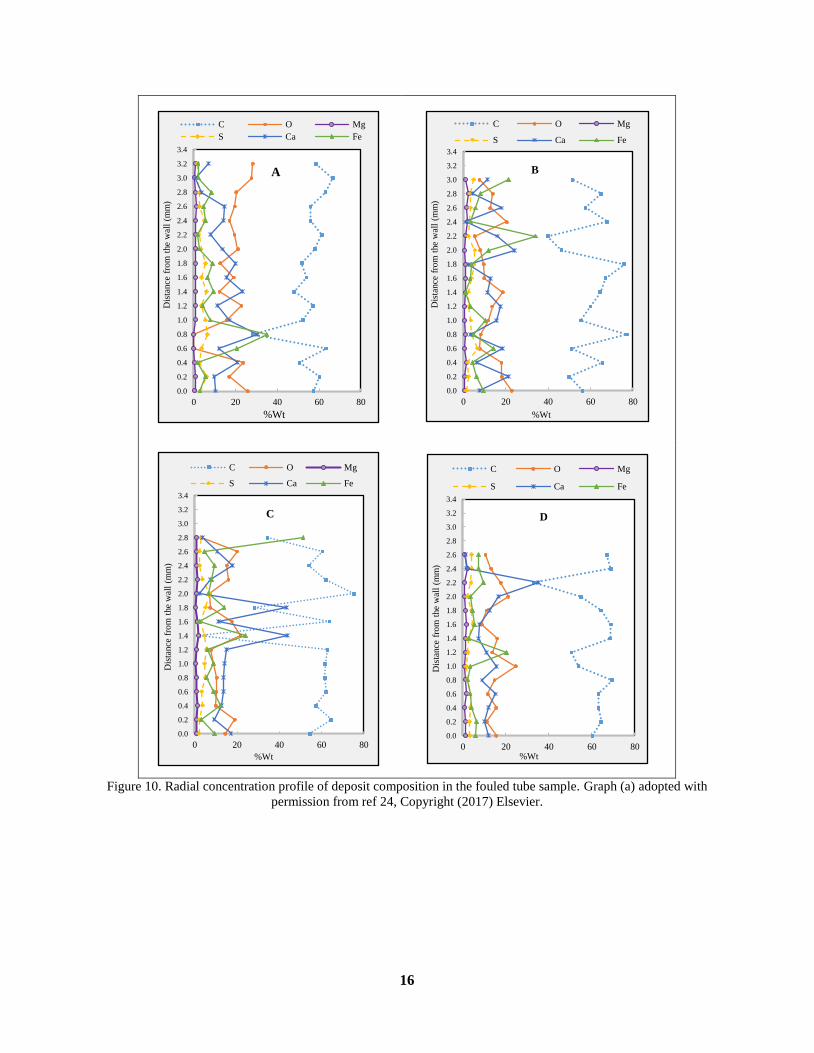
The elements recognized by this technique were carbon, oxygen, magnesium, sulphur, calcium,
iron, sodium, chlorine and silicon. The amounts of the last three elements were negligible (less
than 1wt% in almost all points), so they are not indicated in the graphs of Figure 10. In these
graphs, the weight percentage of these elements along the radii passing through spots A, B, C and
D (indicated in Figure 6) are shown as radial concentration profiles. The vertical axis represents
the radial distance from the metal wall. The first point, at 0mm distance from the wall (s1)

14
corresponds to the nearest specified point to the metal surface and the last one indicates the
elemental concentration at the surface of foulant layer (e.g. s17 for spot A, at 3.2mm from the
wall). It is worth noting that the foulant thickness at spots A, B, C and D was different, as shown
by the position of the last points in the graphs.
15
(b)
(c)
(d)
(a)
(e)
Figure 9. SEM images at initial, middle and terminal points across the foulant thickness at radial section A. Labels
s1(1) to s1(17): 17 points of analysis by EDX, every 200 μm. Image (b) adopted with permission from ref 24,
Copyright (2017) Elsevier.
A
Metal
Foulant
16
Figure 10. Radial concentration profile of deposit composition in the fouled tube sample. Graph (a) adopted with
permission from ref 24, Copyright (2017) Elsevier.
0.0
0.2
0.4
0.6
0.8
1.0
1.2
1.4
1.6
1.8
2.0
2.2
2.4
2.6
2.8
3.0
3.2
3.4
0 20 40 60 80
Dis
tance
fro
m t
he
wal
l(m
m)
%Wt
B
C O Mg
S Ca Fe
0.0
0.2
0.4
0.6
0.8
1.0
1.2
1.4
1.6
1.8
2.0
2.2
2.4
2.6
2.8
3.0
3.2
3.4
0 20 40 60 80
Dis
tance
fro
m t
he
wal
l(m
m)
%Wt
A
C O Mg
S Ca Fe
0.0
0.2
0.4
0.6
0.8
1.0
1.2
1.4
1.6
1.8
2.0
2.2
2.4
2.6
2.8
3.0
3.2
3.4
0 20 40 60 80
Dis
tance
fro
m t
he
wal
l(m
m)
%Wt
D
C O Mg
S Ca Fe
0.0
0.2
0.4
0.6
0.8
1.0
1.2
1.4
1.6
1.8
2.0
2.2
2.4
2.6
2.8
3.0
3.2
3.4
0 20 40 60 80
Dis
tance
fro
m t
he
wal
l(m
m)
%Wt
C
C O Mg
S Ca Fe
17
3. Discussions
3.1. Background
Investigations on another similar PDPF exchangers located in a parallel train (E155AB) in the
same refinery with the same feed and position in the train have already been reported12. This
exchangers also experienced the most severe fouling in their train, with the inner tube deposits
containing more than 50% inorganics, including calcium carbonate and iron sulphide. A 6-step
mechanism based on Lambourn and Durrieu's30 was proposed as the prevailing fouling
mechanism, where interactions of asphaltenes with water, salts and iron sulfides (a collaboration
of physical and chemical processes) lead to deposition of severe, tenacious and stable foulant on
the tube surfaces. The main step concerns the formation of insoluble associations of CaCO3
compounds surrounded by amphiphilic asphaltene molecules on which iron sulphide particulates
are adsorbed28. Desalting performance, water injection, brine chloride hydrolysis, caustic injection,
asphaltenes solubility dependence on temperature variation, and molecular structure of asphaltenes
as a surfactant agent were all identified as effective factors contributing to such severe fouling.
Given the similarity of trains/exchangers and operation, with the same crude oil, here it is
hypothesized that the same fouling mechanism applies.
In complementary works24,31, the comprehensive modelling framework mentioned above was
employed to quantify the fouling behaviour of these E155AB exchangers using measurements
collected during the 4-year operating period (which partially overlapped with that related to
E155X, the source of the tube sample). From this model-based analysis of operational thermal
(temperatures) and hydraulic (pressure drop) data, the authors managed to reconstruct a 4-year time profile of
deposit thickness and apparent conductivity, reflecting the thermal properties of the whole deposit at each
time. Using a deposit model with the ability to track deposition history21, it was possible to re-construct the
18
local radial conductivity profile at the end of the operating period and, finally, transform it into an approximate
deposit radial composition profile. The latter step required assuming a binary organic-inorganic system and
using a thermal-conductivity mixing model, several of which were presented by Wang et al.32 Accordingly,
the basic structural models for two phase materials are Series, Parallel, two forms of Maxwell–Eucken (ME1
& ME2), Effective Medium Theory (EMT), and Co-Continuous (CC).
The model-based analysis results revealed a non-uniform deposit, grown in layers of different
composition, evidencing layering or stratification. Layers with higher inorganics content were
formed when acute fouling periods were detected along an underlying overall falling trend of the
apparent deposition rate, representing chronic organic/inorganic deposition. The average
composition resulting from the plant data analysis was compared to the experimental compositional analysis
of scraped, homogenised deposits collected from E155AB at the end of the run. Excellent agreement was
obtained for a co-continuous (CC) conductivity mixing model, with an average inorganic content of 52wt%
versus 59wt% from the experimental characterization. A similar but not quite as good a match was obtained
using the EMT conductivity mixing model24. This comparison provided a preliminary verification of the
model-based thermo-hydraulic analysis approach.
The availability of new detailed radial composition data from the samples examined in this work gives the
opportunity to check and verify both the quality of the model-based analysis of operating data, and of the
proposed 6-step fouling mechanism28, where the deposit structure was believed to follow the ME
model (consisting of inorganic particles dispersed in a continuous organic phase).
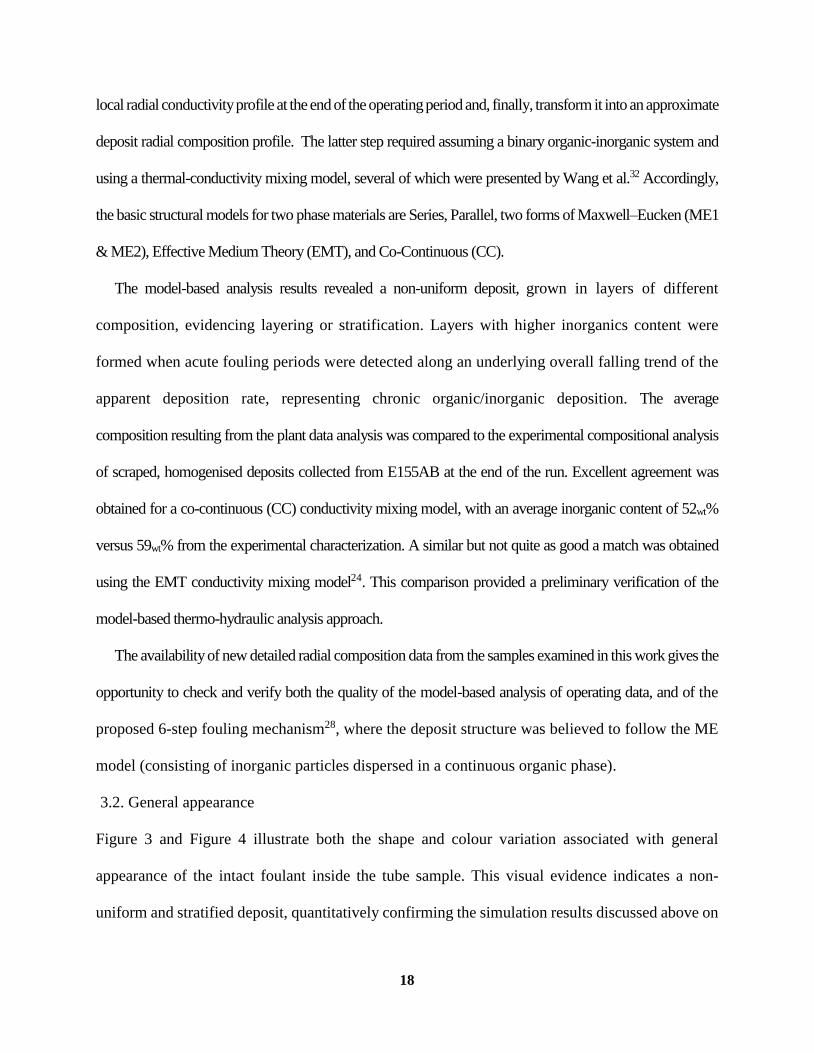
3.2. General appearance
Figure 3 and Figure 4 illustrate both the shape and colour variation associated with general
appearance of the intact foulant inside the tube sample. This visual evidence indicates a non-
uniform and stratified deposit, quantitatively confirming the simulation results discussed above on
19
the similar E155AB exchangers. As can be seen, the foulant deposit surface seems to have a
repeating pattern in sine waves shape which fluctuates at both axial and angular directions. The
average thickness is about 3mm, roughly equivalent to that of the tube wall. The foulant external
appearance results from all dynamic mechanisms involved in ‘deposition’ and ‘deposition-
offsetting’ patterns over the operation period. The term deposition-offsetting refers here to a
variety of mechanisms offsetting deposition such as removal, erosion, suppression. Controlled
laboratory experiments using techniques such as radioactive deposit tracer would be required to
understand the reasons behind this shape of the foulant layer. However, some interesting clues are
found in the literature33–36 describing a ‘shadow effect’ that may justify the deposition pattern.
When a mobile colloidal particle encounters a similar particle deposited on a tube wall, the
hydrodynamic transport of particles and interparticle interactions prevents immediate settlement
behind the deposited particles and moves it forward to some distance away from the wall. This is
referred to as the shadow effect and the distance where this happens, termed ‘shadow zone’, is
found experimentally to be influenced by such factors as particle size and velocity, surface
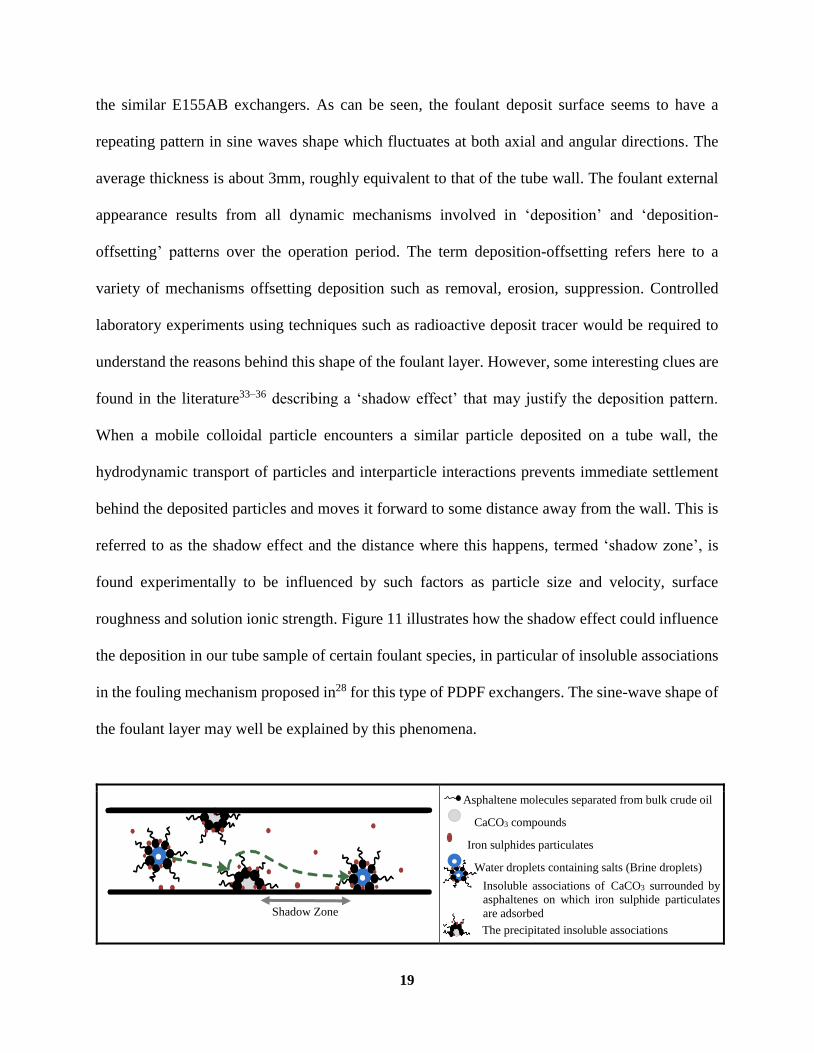
roughness and solution ionic strength. Figure 11 illustrates how the shadow effect could influence
the deposition in our tube sample of certain foulant species, in particular of insoluble associations
in the fouling mechanism proposed in28 for this type of PDPF exchangers. The sine-wave shape of
the foulant layer may well be explained by this phenomena.
Asphaltene molecules separated from bulk crude oil
CaCO3 compounds
Iron sulphides particulates
Water droplets containing salts (Brine droplets)
Insoluble associations of CaCO3 surrounded by
asphaltenes on which iron sulphide particulates
are adsorbed
The precipitated insoluble associations Shadow Zone
20
Figure 11. Influence of shadow effect on deposition of foulant species in tubes of PDPF exchangers.
The deposit pattern in this sample seems to be analogous to that resulting from sedimentation
on river soils. Sediments undergo erosion by shear stress (re-suspension) and re-deposition
somewhere downstream37. As sediments consolidate, erosion by shear becomes more difficult38.
This explanation of the non-uniform surfaces as a result of flow erosion would support a removal
mechanism as the main mechanism offsetting deposition, rather than a suppression mechanism
(when foulant is prevented from settling). A detailed discussion on the arguments about
suppression, removal and consolidation is provided by Diaz-Bejarano et al.,39 together with several
theoretical examples of the expected effects of each mechanism on the thermo-hydraulic
performance of an exchanger tube. The shape of the deposit in the sample is therefore coherent
with both fouling mechanism28 and advanced deposit simulation models, under plausible
assumptions.
Figure 4 shows the cross section of the cut-out tube sample, where colour variation of the
deposit is clearly displayed. Interestingly, the deposit looks black adjacent to the metal surface,
turning brighter or khaki in the middle and again black next to the fluid passage. Similar to growth
rings in a tree, such distinct colours at different radial locations could correspond to different
prevailing factors influencing the fouling mechanism throughout the operating period. It was
postulated that such stratification of layers reflect different composition (type/concentration of
foulant), deposit structure (spatial arrangement of deposited species) or the deposit having
undergone a different degree of physio-chemical transformation (ageing). Such hypothesis is
checked and verified by the quantitative element analysis in the next sections.
In respect of crude oil fouling simulation studies, it is noted that fouling inside a tube has
commonly been modelled as the deposition of a uniform layer, having constant thickness in all
21
axial and angular directions. Such models, commonly used in design, monitoring and cleaning
scheduling of heat exchangers, among other applications, do not seem compatible with the
evidence from this industrial sample. Regarding the axial direction, the dynamic and distributed
model of a shell and tube exchanger by Coletti and Macchietto20 includes the axial dependence on
local operating conditions in the fouling rate, resulting in a variation of the deposit thickness in
axial direction and along each pass. They also considered a radial variation of thermal-conductivity
of the deposit due to ageing, implementing the kinetics proposed by Coletti et al.40 Diaz-Bejarano
et al.21 subsequently proposed modelling the deposit as a multi-component system, considering
spatial distribution in the radial and axial directions, consistently with ref 20. Therefore, it became
possible to simulate mixed deposition of organic and multiple inorganic species and how changes
in fouling behaviour could reflect in the thermo-hydraulic performance of fouled tubes23. In other
words, it became possible to simulate deposits comprising of complex layers of different
composition (stratification) following distinct operation history. Although axial distribution of the
deposit was not checked in this work (all the tube ring samples were cut from a close axial location)
these more advanced simulation models are able to capture the radial stratification/heterogeneity
characteristics observed in the deposit sample.
3.3. Elemental maps
Figure 7 illustrates microscopic images of the foulant surface on the ring cut-out tube sample,
near the tube inner surface. Tenaciously intertwined foulant components seem to have aggregated
together and adhered to the rough, corroded metal surfaces and pierced firmly into the metal
cavities, justifying their adhesive nature experienced in cleaning the PDPF exchangers.
As can be seen from the elemental maps in Figure 8, in the foulant deposited adjacent to the
metal surface (to a depth of roughly 150μm), concentrations of carbon, oxygen, sulphur and
22
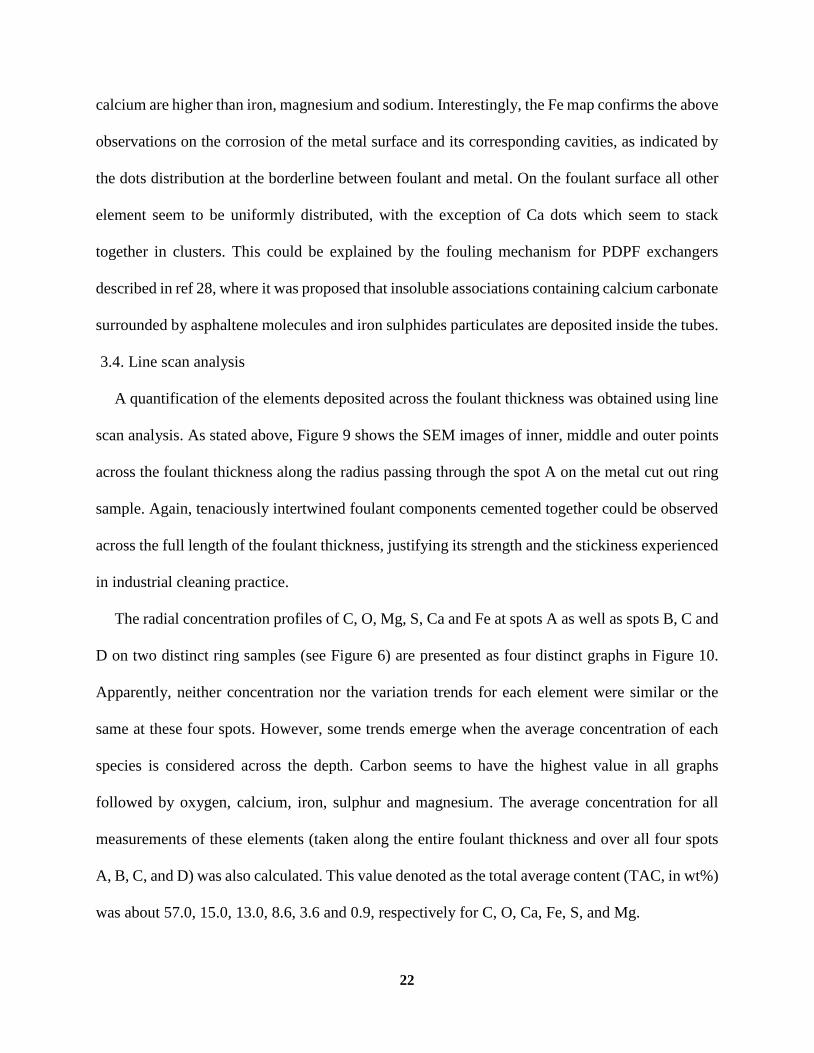
calcium are higher than iron, magnesium and sodium. Interestingly, the Fe map confirms the above
observations on the corrosion of the metal surface and its corresponding cavities, as indicated by
the dots distribution at the borderline between foulant and metal. On the foulant surface all other
element seem to be uniformly distributed, with the exception of Ca dots which seem to stack
together in clusters. This could be explained by the fouling mechanism for PDPF exchangers
described in ref 28, where it was proposed that insoluble associations containing calcium carbonate
surrounded by asphaltene molecules and iron sulphides particulates are deposited inside the tubes.
3.4. Line scan analysis
A quantification of the elements deposited across the foulant thickness was obtained using line
scan analysis. As stated above, Figure 9 shows the SEM images of inner, middle and outer points
across the foulant thickness along the radius passing through the spot A on the metal cut out ring
sample. Again, tenaciously intertwined foulant components cemented together could be observed
across the full length of the foulant thickness, justifying its strength and the stickiness experienced
in industrial cleaning practice.
The radial concentration profiles of C, O, Mg, S, Ca and Fe at spots A as well as spots B, C and
D on two distinct ring samples (see Figure 6) are presented as four distinct graphs in Figure 10.
Apparently, neither concentration nor the variation trends for each element were similar or the
same at these four spots. However, some trends emerge when the average concentration of each
species is considered across the depth. Carbon seems to have the highest value in all graphs
followed by oxygen, calcium, iron, sulphur and magnesium. The average concentration for all
measurements of these elements (taken along the entire foulant thickness and over all four spots
A, B, C, and D) was also calculated. This value denoted as the total average content (TAC, in wt%)
was about 57.0, 15.0, 13.0, 8.6, 3.6 and 0.9, respectively for C, O, Ca, Fe, S, and Mg.
23
Results obtained previously for the similar E155AB exchangers, where CaCO3 and FeS were
assumed as the only inorganic compounds, indicated the average inorganic content was 59 wt%.
This was obtained by the loss on ignition test carried out on scraped-homogenised sample collected
at the end of the operating period). Here, the average inorganic content of the foulant inside E155X
tube was calculated based on C and O content (related to the Ca used in CaCO3) and added to Fe,
S and Mg, making it to be 43wt%. This is not far off the 59% mentioned above. Both these studies
have shown that, irrespective of the testing method employed, the total inorganic content at PDPF
exchangers along both trains considered was about 50wt%, which plays an important role in the
formation of such a severe and stable foulant.
Another noticeable point in Figure 10 graphs regards the maximum distance of the deposit from
the wall, which ranges from 2.6-3.2 mm. This confirms the non-uniform foulant formation in the
angular direction of the tube sample (as observed in Figure 3).
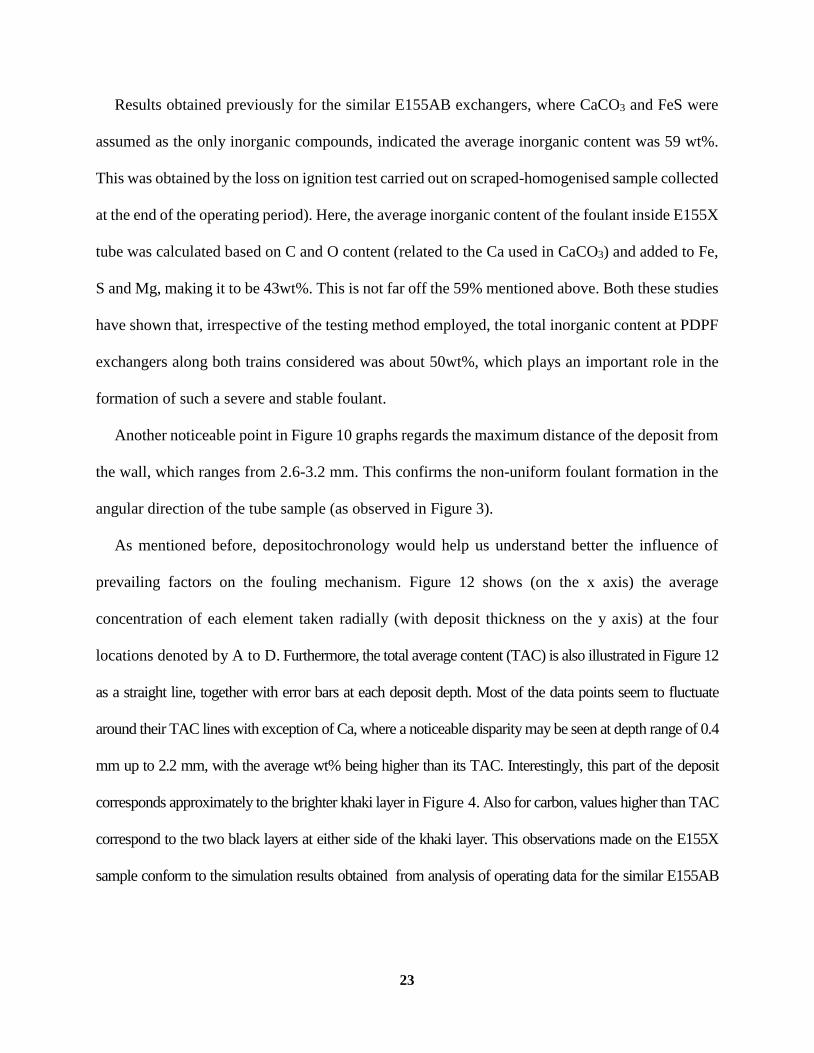
As mentioned before, depositochronology would help us understand better the influence of
prevailing factors on the fouling mechanism. Figure 12 shows (on the x axis) the average
concentration of each element taken radially (with deposit thickness on the y axis) at the four
locations denoted by A to D. Furthermore, the total average content (TAC) is also illustrated in Figure 12
as a straight line, together with error bars at each deposit depth. Most of the data points seem to fluctuate
around their TAC lines with exception of Ca, where a noticeable disparity may be seen at depth range of 0.4
mm up to 2.2 mm, with the average wt% being higher than its TAC. Interestingly, this part of the deposit
corresponds approximately to the brighter khaki layer in Figure 4. Also for carbon, values higher than TAC
correspond to the two black layers at either side of the khaki layer. This observations made on the E155X
sample conform to the simulation results obtained from analysis of operating data for the similar E155AB
24
exchangers24, where a layer with higher inorganics content was identified as having been formed
along the chronic organic/inorganic deposit.
Figure 12. Radial concentration profile for individual elements on the fouled tube sample.
The deposit structure (the arrangement in which organic and inorganic phases are being deposited) is also
important, as it affects both its thermal conductivity and ease of removal. Based on the proposed mechanism
presented for the PDPF exchanger’s tubes28, the structure of foulant was thought to be best described by the
ME model, while results of our simulation studies on E155AB24 showed that CC and EMT structures were
better matches. The ME model represents only one continuous phase and one or more dispersed phases, while
0.0
0.2
0.4
0.6
0.8
1.0
1.2
1.4
1.6
1.8
2.0
2.2
2.4
2.6
2.8
3.0
3.2
3.4
0 10 20 30 40 50 60 70 80 90 100
Dis
tance
fro
m t
he
wal
l(m
m)
%Wt
C TAC
0.0
0.2
0.4
0.6
0.8
1.0
1.2
1.4
1.6
1.8
2.0
2.2
2.4
2.6
2.8
3.0
3.2
3.4
0 10 20 30 40 50
Dis
tan
ce f
rom
th
e w
all
(mm
)
%Wt
O TAC
0.0
0.2
0.4
0.6
0.8
1.0
1.2
1.4
1.6
1.8
2.0
2.2
2.4
2.6
2.8
3.0
3.2
3.4
0 10 20 30 40 50
Dis
tan
ce f
rom
th
e w
all
(mm
)
%Wt
Ca TAC
0.0
0.2
0.4
0.6
0.8
1.0
1.2
1.4
1.6
1.8
2.0
2.2
2.4
2.6
2.8
3.0
3.2
3.4
0 10 20 30 40 50
Dis
tan
ce f
rom
th
e w
all
(mm
)
%Wt
Fe TAC
0.0
0.2
0.4
0.6
0.8
1.0
1.2
1.4
1.6
1.8
2.0
2.2
2.4
2.6
2.8
3.0
3.2
3.4
0 1 2 3 4 5 6 7 8 9 10
Dis
tan
ce f
rom
th
e w
all
(mm
)
%Wt
S TAC
0.0
0.2
0.4
0.6
0.8
1.0
1.2
1.4
1.6
1.8
2.0
2.2
2.4
2.6
2.8
3.0
3.2
3.4
0 1 2 3 4 5 6 7 8 9 10
Dis
tan
ce f
rom
th
e w
all
(mm
)
%Wt
Mg TAC
25
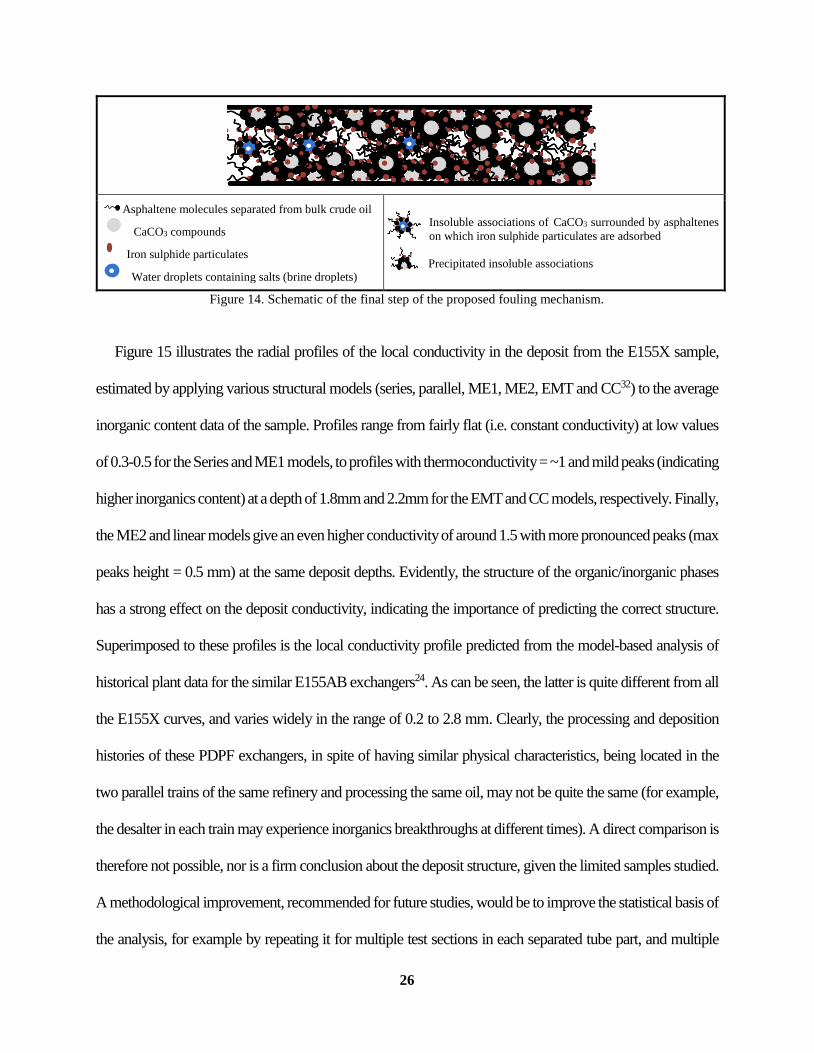
CC and EMT stand for structures with all phases being mutually continuous or dispersed, respectively. The
main depositing precursors in the previously proposed mechanism28 are insoluble associations of CaCO3
compounds surrounded by asphaltene molecules in the form of an inorganic phase being dispersed in a
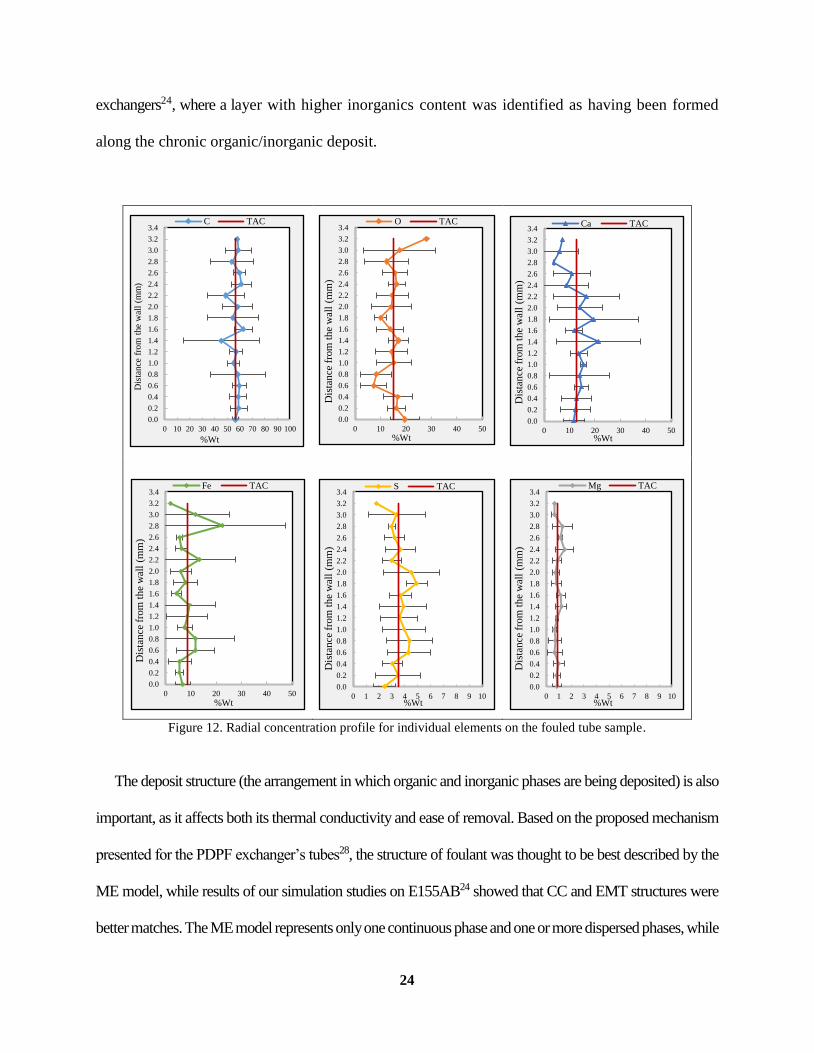
continuous organic phase. Iron sulfide particulates, which is another inorganic compound adsorbed on the
associations, were not considered, while Figure 13 indicates that their concentration (Fe + S) is comparable
to that of CaCO3 along the foulant thickness. Hence, with this modification, the final step of the proposed
mechanism could well be a mutually continuous or dispersed arrangement between organic and inorganic
phases, corresponding to structures described by the CC or EMT models as obtained by the simulation
results24. Figure 14 illustrates schematically this modified fouling mechanism.
Figure 13. Comparison of the radial concentration profile for FeS and Ca.
0.0
0.2
0.4
0.6
0.8
1.0
1.2
1.4
1.6
1.8
2.0
2.2
2.4
2.6
2.8
3.0
3.2
3.4
0 10 20 30 40 50 60 70 80 90 100
Dis
tan
ce f
rom
th
e w
all
(mm
)
%Wt
Ca FeS
26
Asphaltene molecules separated from bulk crude oil
CaCO3 compounds
Iron sulphide particulates
Water droplets containing salts (brine droplets)
Insoluble associations of CaCO3 surrounded by asphaltenes
on which iron sulphide particulates are adsorbed
Precipitated insoluble associations
Figure 14. Schematic of the final step of the proposed fouling mechanism.
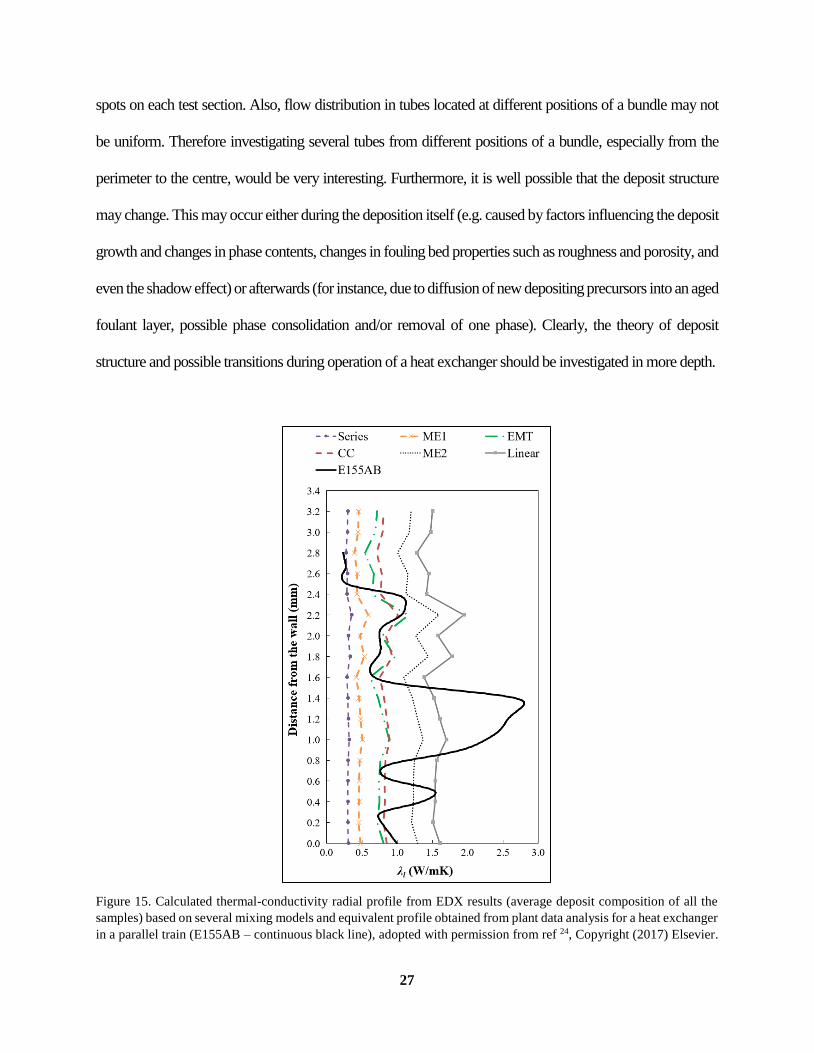
Figure 15 illustrates the radial profiles of the local conductivity in the deposit from the E155X sample,
estimated by applying various structural models (series, parallel, ME1, ME2, EMT and CC32) to the average
inorganic content data of the sample. Profiles range from fairly flat (i.e. constant conductivity) at low values
of 0.3-0.5 for the Series and ME1 models, to profiles with thermoconductivity = ~1 and mild peaks (indicating
higher inorganics content) at a depth of 1.8mm and 2.2mm for the EMT and CC models, respectively. Finally,
the ME2 and linear models give an even higher conductivity of around 1.5 with more pronounced peaks (max
peaks height = 0.5 mm) at the same deposit depths. Evidently, the structure of the organic/inorganic phases
has a strong effect on the deposit conductivity, indicating the importance of predicting the correct structure.
Superimposed to these profiles is the local conductivity profile predicted from the model-based analysis of
historical plant data for the similar E155AB exchangers24. As can be seen, the latter is quite different from all
the E155X curves, and varies widely in the range of 0.2 to 2.8 mm. Clearly, the processing and deposition
histories of these PDPF exchangers, in spite of having similar physical characteristics, being located in the
two parallel trains of the same refinery and processing the same oil, may not be quite the same (for example,
the desalter in each train may experience inorganics breakthroughs at different times). A direct comparison is
therefore not possible, nor is a firm conclusion about the deposit structure, given the limited samples studied.
A methodological improvement, recommended for future studies, would be to improve the statistical basis of
the analysis, for example by repeating it for multiple test sections in each separated tube part, and multiple
27
spots on each test section. Also, flow distribution in tubes located at different positions of a bundle may not
be uniform. Therefore investigating several tubes from different positions of a bundle, especially from the
perimeter to the centre, would be very interesting. Furthermore, it is well possible that the deposit structure
may change. This may occur either during the deposition itself (e.g. caused by factors influencing the deposit
growth and changes in phase contents, changes in fouling bed properties such as roughness and porosity, and
even the shadow effect) or afterwards (for instance, due to diffusion of new depositing precursors into an aged
foulant layer, possible phase consolidation and/or removal of one phase). Clearly, the theory of deposit
structure and possible transitions during operation of a heat exchanger should be investigated in more depth.
Figure 15. Calculated thermal-conductivity radial profile from EDX results (average deposit composition of all the
samples) based on several mixing models and equivalent profile obtained from plant data analysis for a heat exchanger
in a parallel train (E155AB – continuous black line), adopted with permission from ref 24, Copyright (2017) Elsevier.

28
Apart from influencing thermal conductivity, the structural arrangement of organic and inorganic phases
seems also to affect deposit stability, with important implications in particular for cleaning. For instance, in
the structures described by the EMT and CC models, inorganic and organic phases are arranged in such a way
that neither crude oil nor the injected water could gain access to them for dissolution. This seems consistent
with the practice at the refinery, where the foulant was found to be so stable at the end of the operating period
that despite pre-dismantling wash and steam purging being carried out just before shutdown, little or no effects
on the deposits was observed, as evidenced in Figure 1(a). On the other hand, in other deposit structures
(described by series, parallel, ME1 or ME2 models) contact between crude oil or water and the foulant phases
is possible, and an effective cleaning could take place. For these, predicting the transition time of deposit
structure could be employed as a rough guideline for estimating the appropriate on-line cleaning time.
4. Perspectives on the development and validation of model-based fouling detection systems
The above experimental method and results represent a useful addition to the general understanding of
crude oil fouling phenomena (such as the prevailing mechanisms, causes and potential solutions/mitigation
options). However, it also has clear limitations in respect of providing timely practical support to the refinery
during operation. Since this approach requires deposit collection, attainable only post shutdown-scenario (and
assuming it is possible to dismantle selected tubes), subsequent analysis, comparison to plant data, any insights
and suggested remedies would be available long after the fouling events had taken place in the plant.
Alternatively, a simulation based analysis of fouling from operating plant data has the potential to provide
faster detection and diagnosis of fouling behavior, and there are many systems that claim to do so. The
experimental results of the industrial data in this work show clearly that fouling simulation systems should be
29
able to deal with, and possibly accurately predict, non-uniform deposits comprising of both organic and
inorganic species, with complex stratification patterns and organic/inorganic structures.
A check of the findings of such an analysis based on the model-based thermo-hydraulic framework of ref
24 was carried out against the new experimental data, providing a useful validation. In particular, it was
shown that it is feasible to estimate the time frame when inorganic deposition prevails over the organic one.
This provides an opportunity for checking any correspondence with potential causes, such as desalting
performance, water/caustic injection, and the brine chloride hydrolysis affected by the temperature range
experienced in the exchangers. This would significantly increase our understanding of the most predominant
causes for intensified inorganic deposition directly from refinery data, in a way that would be difficult (or
impossible) to produce in a rig setting. The development of such an advanced heat exchanger monitoring
system, further verified by experimental data such as those presented here, would mark a substantial step-
change in industrial practice, enabling better diagnosis of fouling causes, improved troubleshooting, and better
decision making on the choice of mitigation options and cleaning agents.
Furthermore, the results presented highlight the need for deposition rate models which include
the contribution of inorganic fouling and other aspects, such as deposit removal (useful if the
shadow effect is ever to be captured). Such models go beyond that of Ebert and Panchal41, one of
the most commonly used model in current fouling simulations, or its derivatives. A development
in this direction has been proposed in recent work31.
Further development is clearly required to describe the complex wavy shapes and angular
irregularities observed in the deposit, for which further understanding of fluid-particle and particle-
particle interactions and rigorous simulation of flow patterns are required42–44. As mentioned
before, deposit tracer techniques might well be useful in this regard.
30
5. Conclusions
During a major 4-year shutdown at a refinery, a tube was removed from a severely fouled preheat
exchanger located post desalter and preflash drum (PDPF), and tube sections carefully cut out so as to retain
the deposit integrity in-situ. The foulant inside the tube was examined as the first characterization of intact
foulant from an industrial case. This revealed that the shape of the deposit layer was not uniform. Its surface
appeared as a sine waves fluctuating at both axial and angular directions, which, as far as we are aware, is a
novel result. Radial sections evidenced distinct stratified layers of black-khaki-black colours across the 3 mm
deposit thickness. SEM images confirmed that foulant components seemed to be tenaciously intertwined and
adhered to the tube corroded surface. Radial concentration profiles of carbon, oxygen, calcium, iron, sulphur
and magnesium were obtained at 4 specified spots on the cut-out rings. Their total average content was about
57.0, 15.0, 13.0, 8.6, 3.6 and 0.9 wt%, respectively, based on which the inorganic portion of foulant content
was estimated to be 43 wt%.
The external appearance was ascribed to the fouling dynamics resulting from deposition and deposition-
offsetting patterns, for which a shadow effect and erosion process described in the literature for other
applications provide a plausible explanation. However, further studies are recommended in the form of
controlled laboratory experiments using techniques such as radioactive deposit tracer. Other findings were
consistent with our previous studies on a similar exchanger located in a parallel train at the same refinery and
processing the same oil. This confirmed the fouling mechanism proposed earlier and enabled the refinement
of one of its steps. The experimental results were broadly in agreement with the results of a separate thermo-
hydraulic analysis of operating data carried out using a comprehensive modelling framework developed at
Imperial College London. This enabled a study we termed depositochronology, to relate the formation of
deposit layers to corresponding operating conditions and processing history. The experimental data and model
based analysis were useful to confirm the stratification of foulant content and presence of high inorganic
31
content, and to evidence an acute inorganic deposition period superimposed to chronic mixed organic-
inorganic fouling. The data suggested, albeit not conclusively, a mutually continuous or dispersed
arrangement between the organic and inorganic phases in the deposit. A hypothesis was propounded
suggesting that foulant structure or arrangement of its phases may vary over time along the operating period.
Investigating the surface roughness of foulant layer and measuring in-situ its thermal conductivity is
recommended in future studies to further clarify some of these aspects. Moreover, as this study seems to be
the first of its type, apart from limitations imposed by the industrial practical considerations, much of our
efforts and resources were spent on establishing the appropriate procedure. However, a number of issues
remained uninspected which need to be investigated in future studies. For instance, separated tube parts should
be marked sequentially, and for developing a statistical basis for the study, the analysis should be repeated for
multiple test sections in each tube, and multiple spots on each test section. In addition, as flow distribution in
tubes located at different positions of a bundle may not be uniform, one could examine experimentally several
tubes at different positions of a bundle, especially comparing the tubes on perimeter to those in the centre.
The model-based analysis presented ignores such radial bundle differences, and more detailed 3D models
would also be required. Nonetheless the agreement between experimental and simulation results is already
impressive.
Notes
The authors declare no competing financial interest.
Acknowledgement
EB and MRM gratefully acknowledge collaboration of the EORC refinery.
32
List of abbreviations
CC Co-Continuous
D Diameter
EDS Energy Dispersive analytical System
EDX Energy Dispersive X-ray spectroscopy
EMT Effective Medium Theory
H Height
LED Light Emitting Diode
ME Maxwell-Eucken
OD Outer Diameter
PDPF Post Desalter and Pre Flash drum
SEM Scanning Electron Microscopy
SG Specific Gravity
TAC Total Average Content
VGO Vacuum Gas Oil
References
(1) Coletti, F.; Joshi, H. M.; Macchietto, S.; Hewitt, G. F. Introduction. In Crude Oil Fouling; Coletti, F.,
Hewitt, G. F., Eds.; Elsevier Inc., 2015; pp 1–22.
(2) Macchietto, S.; Hewitt, G. F.; Coletti, F.; Crittenden, B. D.; Dugwell, D. R.; Galindo, A.; Jackson, G.;
Kandiyoti, R.; Kazarian, S. G.; Luckham, P. F.; et al. Fouling in Crude Oil Preheat Trains: A Systematic
Solution to an Old Problem. Heat Transf. Eng. 2011, 32 (3–4), 197–215.
(3) Stephenson, T.; Kubis, A.; Derakhshesh, M.; Hazelton, M.; Holt, C.; Eaton, P.; Newman, B.; Ho, A.; Gray,
M.; Mitlin, D. Corrosion-Fouling of 316 Stainless Steel and Pure Iron by Hot Oil. Energy & Fuels 2011, 25,
4540–4551.
(4) Venditti, S. Characterization of Petroleum Fouling with Respect to Operational Parameters, Ph.D.
Dissertation, Imperial College London, UK., 2010.
(5) Rostani, K. Effect of Crude Oil Vanadium Porphyrin Content and Blending on Heat Exchanger Fouling,
Ph.D. Dissertation, Imperial College London, UK, 2014.
(6) Eaton, P. Fouling Test Apparatus. US patent 4383438, 1983.
(7) Young, A.; Venditti, S.; Berrueco, C.; Yang, M.; Waters, A.; Davies, H.; Hill, S.; Millan, M.; Crittenden, B.
D. Characterization of Crude Oils and Their Fouling Deposits Using a Batch Stirred Cell System. Heat
Transf. Eng. 2011, 32 (3–4), 216–227.
(8) Dugwell, D. R.; Hale, C. P.; Hewitt, G. F.; Macchietto, S.; Pental, J. Test Rig and Method for Simulating
and Analyzing Petrochemical Fouling, US 2014/0090450 Al, 2014.
(9) Bennett, C. A.; Kistler, R. S.; Nangia, K.; Al-Ghawas, W.; Al-Hajji, N.; Al-Jemaz, A. Observation of an
Isokinetic Temperature and Compensation Effect for High Temperature Crude Oil Fouling. In 7th
International Conference on Heat Exchanger Fouling and Cleaning; Tomar, Portugal, 2007.
(10) Crittenden, B. D.; Kolaczkowski, S. T.; Downey, I. L. Fouling of Crude Oil Preheat Exchangers. Trans
IChemE, Part A, Chem. Eng. Res. Des. 1992, 70, 547–557.
(11) Joshi, H. M. Crude Oil Fouling Field Data and A Model for Pilot-Plant Scale Data. In International
Conference on Heat Exchanger Fouling and Cleaning; Malayeri, M. R., Müller-Steinhagen, H., Watkinson,
A. P., Eds.; Budapest, Hungary, 2013; pp 22–26.
33
(12) Mozdianfard, M. R.; Behranvand, E. A Field Study of Fouling in CDU Preheaters at Esfahan Refinery.
Appl. Therm. Eng. 2013, 50, 908–917.
(13) Tay, F. H.; Kazarian, S. G. Study of Petroleum Heat-Exchanger Deposits with ATR-FTIR Spectroscopic
Imaging. Energy and Fuels 2009, 118 (4), 4059–4067.
(14) Joshi, H. M. Analysis of Field Fouling Deposits from Crude Heat Exchangers. In Crude Oil Fouling;
Coletti, F., Hewitt, G. F., Eds.; Elsevier Inc., 2015; pp 86–113.
(15) Brons, G.; Brown, L. D.; Joshi, H. M.; Kennedy, R. J.; Bruno, T.; Rudy, T. M. Method for Refinery Foulant
Deposit Characterization. US 2006/0014296Al, 2006.
(16) Bennett, C. A.; Appleyard, S.; Gough, M.; Hohmann, R. P.; Joshi, H. M.; King, D. C.; Lam, T. Y.; Rudy, T.
M.; Scott, E. Industry-Recommended Procedures for Experimental Crude Oil Preheat Fouling Research.
Heat Transf. Eng. 2006, 27 (9), 28–35.
(17) Venditti, S.; Berrueco, C.; Alvarez, P.; Morgan, T. J.; Millan, M.; Herod, A. A.; Kandiyoti, R. Developing
Characterisation Methods for Foulants Deposited in Refinery Heat Exchangers. In International Conference
on Heat Exchanger Fouling and Cleaning VIII; Müller-Steinhagen, H., Malayeri, M. R., Watkinson, A. P.,
Eds.; Schladming, Austria, 2009; pp 44–51.
(18) Wiehe, I. A. Process Chemistry of Petroleum Macromolecules, 1 st.; CRC Press, Taylor & Francis Group:
USA, 2008.
(19) Bott, T. R. Fouling of Heat Exchangers; Elsevier, 1995.
(20) Coletti, F.; Macchietto, S. A Dynamic , Distributed Model of Shell-and-Tube Heat Exchangers Undergoing
Crude Oil Fouling. Ind. Eng. Chem. Res. 2011, 50, 4515–4533.
(21) Diaz-bejarano, E.; Coletti, F.; Macchietto, S. A New Dynamic Model of Crude Oil Fouling Deposits and Its
Application to the Simulation of Fouling-Cleaning Cycles. AIChE J. 2016, 62 (1), 90–107.
(22) Diaz-bejarano, E.; Coletti, F.; Macchietto, S. Thermo-Hydraulic Analysis of Refinery Heat Exchangers
Undergoing Fouling. Process Syst. Eng. AIChE J. 2017, 63 (3), 984–1001.
(23) Diaz-bejarano, E.; Coletti, F.; Macchietto, S. Impact of Complex Layering Structures of Organic and
Inorganic Foulants on the Thermo-Hydraulic Performance of a Single Heat Exchanger Tube – A Simulation
Study. Ind. Eng. Chem. Res. 2016, 55 (40), 10718–10734.
(24) Diaz-bejarano, E.; Behranvand, E.; Coletti, F.; Mozdianfard, M. R.; Macchietto, S. Organic and Inorganic
Fouling in Heat Exchangers – Industrial Case Study: Analysis of Fouling State. Appl. Energy 2017, 206,
1250–1266.
(25) Diaz-bejarano, E.; Coletti, F.; Macchietto, S. Complex Crude Oil Fouling Layers : Use of Model Predictions
to Detect Inorganics Breakthrough. Appl. Therm. Eng. 2018, 141, 666–674.
(26) Wang, W.; Watkinson, A. P. Deposition from a Sour Heavy Oil under Incipient Coking Conditions: Effects
of Surface Material and Temperature. In International Conference on Heat Exchanger Fouling and
Cleaning; Malayeri, M. R., Müller-Steinhagen, H., Watkinson, A. P., Eds.; Budapest, Hungary, 2013; pp 9–
17.
(27) Hazelton, M.; Stephenson, T.; Lepore, J.; Subramani, V.; Mitlin, D. Sulfide Promoted Chronic Fouling in a
Refinery: A Broad Phenomenon Spanning a Range of Heat Transfer Surfaces and Oil Types. Fuel 2015,
160, 479–489.
(28) Mozdianfard, M. R.; Behranvand, E. Fouling at Post Desalter and Pre Flash Drum Heat Exchangers of CDU
Preheat Train. Appl. Therm. Eng. 2015, 89, 783–794.
(29) Behranvand, E.; Mozdianfard, M. R.; Diaz-bejarano, E.; Coletti, F.; Orzlowski, P.; Macchietto, S. A
Comprehensive Investigation of Refinery Preheaters Foulant Samples Originated by Heavy Crude Oil
Fractions as Heating Fluids. Fuel 2018, 224 (July 2017), 529–536.
(30) Lambourn, G. A.; Durrieu, M. Fouling in Crude Oil Preheat Trains. In Heat Exchangers Theory and
Practice; Taborek, Hewitt, Afghan, Eds.; Hemisphere Publishing Company: New York, 1983.
(31) Diaz-bejarano, E.; Behranvand, E.; Coletti, F.; Mozdianfard, M. R.; Macchietto, S. Organic and Inorganic
Fouling in Heat Exchangers – Industrial Case Study: Analysis of Fouling Rate. Ind. Eng. Chem. Res. 2019,
34
58, 228–246.
(32) Wang, J.; Carson, J. K.; North, M. F.; Cleland, D. J. A New Structural Model of Effective Thermal
Conductivity for Heterogeneous Materials with Co-Continuous Phases. Int. J. Heat Mass Transf. 2008, 51,
2389–2397.
(33) Malysa, K.; Dabros, T.; Van De Ven, T. G. M. The Sedimentation of One Sphere Past a Second Attached to
a Wall. J. Fluid Mech. 1986, 162, 157–170.
(34) Ko, C. H.; Elimelech, M. The “shadow Effect” in Colloid Transport and Deposition Dynamics in Granular
Porous Media: Measurements and Mechanisms. Environ. Sci. Technol. 2000, 34 (17), 3681–3689.
(35) Henry, C.; Minier, J. P.; Lefèvre, G. Towards a Description of Particulate Fouling: From Single Particle
Deposition to Clogging. Adv. Colloid Interface Sci. 2012, 185–186, 34–76.
(36) Sasidharan, S.; Torkzaban, S.; Bradford, S. A.; Dillon, P. J.; Cook, P. G. Coupled Effects of Hydrodynamic
and Solution Chemistry on Long-Term Nanoparticle Transport and Deposition in Saturated Porous Media.
Colloids Surfaces A Physicochem. Eng. Asp. 2014.
(37) Knapen, A.; Poesen, J.; Govers, G.; Gyssels, G.; Nachtergaele, J. Resistance of Soils to Concentrated Flow
Erosion: A Review. Earth-Science Rev. 2007, 80 (1–2), 75–109.
(38) Nearing, M. A.; West, L. T.; Brown, L. C. A Consolidation Model for Estimating Changes in Rill
Erodibility. Am. Soc. Agric. Eng. 1988, 31 (3), 696–700.
(39) Diaz-bejarano, E.; Coletti, F.; Macchietto, S. Crude Oil Fouling Deposition , Suppression , Removal , and
Consolidation — and How to Tell the Difference. Heat Transf. Eng. 2017, 38 (7--8), 681–693.
(40) Coletti, F.; Ishiyama, E. M.; Paterson, W. R.; Wilson, D. I.; Macchietto, S. Impact of Deposit Aging and
Surface Roughness on Thermal Fouling: Distributed Model. AIChE J. 2010, 56 (12), 3257–3273.
(41) Ebert, W.; Panchal, C. B. Analysis of Exxon Crude-Oil-Slip Stream Coking Data. In Fouling Mitigation of
Industrial Heat–Exchange Equipment; Panchal, C. B., Ed.; Begell House, New York: San Luis Obispo, CA.
USA., 1995; pp 451–460.
(42) Henry, C.; Minier, J.-P. Progress in Particle Resuspension from Rough Surfaces by Turbulent Flows. Prog.
Energy Combust. Sci. 2014, 45, 1–53.
(43) Sileri, D.; Sahu, K.; Ding, H.; Matar, O. K. Mathematical Modelling of Asphatenes Deposition and Removal
in Crude Distillation Units. In Int. conf. on heat exchanger fouling and cleaning VIII; Müller-Steinhagen, H.,
Malayeri, M. R., Watkinson, A. P., Eds.; Schladming, Austria, 2009; Vol. 2009, pp 245–251.
(44) Yang, J.; Matar, O. K.; Hewitt, G. F.; Zheng, W.; Manchanda, P. Modelling of Fundamental Transfer
Processes in Crude-Oil Fouling. In 15th International Heat Transfer Conference, IHTC-15; Kyoto, Japan,
2014.
35
For Table of Contents Only