Laboratory Characterization of Fouled Railroad Ballast...
9
93 role of rail lines in coal transport has always been predominant. In 2005, two derailments occurred in the joint coal line of Burlington Northern Santa Fe (BNSF) and Union Pacific in Powder River Basin (PRB) in Wyoming, the largest source of incremental low- sulfur coal supplies in the United States. The derailments threatened to interrupt the supply of coal to power plants. Both derailments were suspected to be attributed to coal dust fouling, in which coal dust spilled over the ballasts and accumulated moisture, resulting in the loss of strength of the track. The ballast was heavily fouled by coal dust where both of the derailments occurred. This paper presents findings from a comprehensive laboratory testing program initiated at the University of Illinois to study the effects of different fouling agents—coal dust, plastic clayey soil, and mineral filler—on railroad ballast strength. Using large direct shear (shear box) tests, strength and deformation characteristics of granite type ballast material were investigated for clean ballast and ballast fouled by different agents at various stages under both dry and wet conditions. The shear strength properties, such as cohesion intercept and friction angle, are linked to field ballast fouling levels to better assess the impact of fouling on track instability and ultimately loss of track support, leading to derailments. BALLAST FOULING AND ITS MECHANISM Fouling materials in ballast have been traditionally considered not favorable for railroad ballast performance. Early research studies reported that around 70% of the fouling materials were from ballast breakdown (1–3). Railroad company internal studies also noted that almost all fouling fines in the railroad track were commonly from aggregate breakdown (4). According to Selig and Waters (5), ballast breakdown on average accounts for up to 76% of the ballast fouling, followed by 13% infiltration from subballast, 7% infiltration from ballast surface, 3% subgrade intrusion, and 1% due to tie wear. Selig and Waters (5) proposed two indices to describe ballast fouling: (a) fouling index is the sum of the percent by weight of ballast sample passing the 4.75 mm (No. 4) sieve plus the percent passing the 0.075 mm (No. 200 sieve) and (b) percentage of fouling is the ratio of the dry weight of material passing the 9.5 mm ( 3 / 8 in.) sieve to the dry weight of total sample. They also proposed that the particles retained on the 0.075 mm (No. 200 sieve) are treated as “coarse fouling materials” and particles passing the 0.075 mm (No. 200 sieve) are “fine fouling materials” (5). Raymond (6 ) suggested that if fouled ballast had to be used, the liquid limit (LL) of the fines should be less than 25 to maintain the function of drainage. Raymond (7 ) also found that the aggregate breakdown was significantly influenced by the type and especially hardness of the mineral aggregate. Harder aggregates had fewer breakdowns than softer aggregates did. Later, Raymond (8) noted Laboratory Characterization of Fouled Railroad Ballast Behavior Hai Huang, Erol Tutumluer, and William Dombrow c a a ba a b a a a a a a a a c c c b a ba a a a c a a c aca ca a b a c a ba a a a a a aa c a ( a b ) c b c a a ba a a a a ca a cca a a a c a ba a a a a c a b ba a b a c ( ) c a c a aa c c c c a c a a ca c a c a ba a a a c a a ac ba ba a a ca a a a c a ca a b a a ac ac b c a ab a ca b ba a a a ca ca ca c ab c ca ba a ca a c a ba a a c a ca Railroad ballast is uniformly graded coarse aggregate placed between and immediately underneath the crossties. The purpose of ballast is to provide drainage and structural support for the loading applied by trains. As ballast ages, it is progressively fouled with materials finer than aggregate particles, filling the void spaces. Methods specifically used to assess track ballast condition deal only with checking visually for evidence of fouling, pumping, and water accumulation (ponding) at ditches and shoulders. Additionally, ballast sampling and testing for fouling through laboratory sieve analyses generally provide some insight into the compositions of the larger aggregate particles and the amount of fines. Nonetheless, for a better evaluation of the service- ability and proper functioning of the existing ballast layer, ballast strength needs to be characterized for different percentages of fine materials, such as plastic soil fines, mineral filler, and more recently coal dust coming from coal trains, which can fill the voids and cause ballast fouling. Since rail transport, particularly a unit train, provides the most efficient means of transporting bulk commodities such as coal, the Department of Civil and Environmental Engineering, University of Illinois at Urbana– Champaign, 205 North Mathews Avenue, Urbana, IL 61801. Corresponding author: E. Tutumluer, [email protected]. Transportation Research Record: Journal of the Transportation Research Board, No. 2117, Transportation Research Board of the National Academies, Washington, D.C., 2009, pp. 93–101. DOI: 10.3141/2117-12
Transcript of Laboratory Characterization of Fouled Railroad Ballast...
93
role of rail lines in coal transport has always been predominant. In2005, two derailments occurred in the joint coal line of BurlingtonNorthern Santa Fe (BNSF) and Union Pacific in Powder RiverBasin (PRB) in Wyoming, the largest source of incremental low-sulfur coal supplies in the United States. The derailments threatenedto interrupt the supply of coal to power plants. Both derailmentswere suspected to be attributed to coal dust fouling, in which coaldust spilled over the ballasts and accumulated moisture, resulting inthe loss of strength of the track. The ballast was heavily fouled bycoal dust where both of the derailments occurred.
This paper presents findings from a comprehensive laboratorytesting program initiated at the University of Illinois to study theeffects of different fouling agents—coal dust, plastic clayey soil, andmineral filler—on railroad ballast strength. Using large direct shear(shear box) tests, strength and deformation characteristics of granitetype ballast material were investigated for clean ballast and ballastfouled by different agents at various stages under both dry and wetconditions. The shear strength properties, such as cohesion interceptand friction angle, are linked to field ballast fouling levels to betterassess the impact of fouling on track instability and ultimately lossof track support, leading to derailments.
BALLAST FOULING AND ITS MECHANISM
Fouling materials in ballast have been traditionally considered notfavorable for railroad ballast performance. Early research studiesreported that around 70% of the fouling materials were from ballastbreakdown (1–3). Railroad company internal studies also noted thatalmost all fouling fines in the railroad track were commonly fromaggregate breakdown (4). According to Selig and Waters (5), ballastbreakdown on average accounts for up to 76% of the ballast fouling,followed by 13% infiltration from subballast, 7% infiltration fromballast surface, 3% subgrade intrusion, and 1% due to tie wear.
Selig and Waters (5) proposed two indices to describe ballastfouling: (a) fouling index is the sum of the percent by weight ofballast sample passing the 4.75 mm (No. 4) sieve plus the percentpassing the 0.075 mm (No. 200 sieve) and (b) percentage of foulingis the ratio of the dry weight of material passing the 9.5 mm (3⁄8 in.)sieve to the dry weight of total sample. They also proposed thatthe particles retained on the 0.075 mm (No. 200 sieve) are treatedas “coarse fouling materials” and particles passing the 0.075 mm(No. 200 sieve) are “fine fouling materials” (5).
Raymond (6) suggested that if fouled ballast had to be used, the liquid limit (LL) of the fines should be less than 25 to maintainthe function of drainage. Raymond (7 ) also found that the aggregatebreakdown was significantly influenced by the type and especiallyhardness of the mineral aggregate. Harder aggregates had fewerbreakdowns than softer aggregates did. Later, Raymond (8) noted
Laboratory Characterization of FouledRailroad Ballast Behavior
Hai Huang, Erol Tutumluer, and William Dombrow
Fouling refers to the condition of railroad ballast when voids in thisunbound aggregate layer are filled with relatively finer materials orfouling agents, which commonly come from breakdown of the ballastaggregate, outside contamination such as coal dust from coal trains, orsubgrade soil intrusion. Effects of different fouling agents on ballastaggregate shear strength were studied at the University of Illinois.Through the use of a large direct shear (shear box) device, the strengthproperties of both clean and fouled ballast samples were determinedwhen three types of fine materials—coal dust, plastic clayey soil, andmineral filler—were added to clean ballast samples at various percentagesby weight of ballast under both dry and wet [mostly optimum moisturecontent (OMC)] conditions. Realistic sample preparation procedureswere conducted to closely simulate field-fouling scenarios. Test resultsshowed that when the coal dust fouling percentage increased, the ballastshear strength steadily decreased. Wet fouling was found to exacerbatethis trend. Results of ballast samples fouled with clay and mineral filler alsoshowed decreasing trends in strength properties; however, coal dust wasby far the worst fouling agent for its impact on track substructure androadbed. Approximately 15% coal dust fouling by weight of ballast wasstatistically significant to cause considerable strength reductions. In thecase of ballast fully fouled with wet coal dust at 35% OMC, the frictionangles obtained were as low as the friction angle of coal dust itself.
Railroad ballast is uniformly graded coarse aggregate placed betweenand immediately underneath the crossties. The purpose of ballast is toprovide drainage and structural support for the loading applied bytrains. As ballast ages, it is progressively fouled with materials finerthan aggregate particles, filling the void spaces. Methods specificallyused to assess track ballast condition deal only with checking visuallyfor evidence of fouling, pumping, and water accumulation (ponding)at ditches and shoulders. Additionally, ballast sampling and testingfor fouling through laboratory sieve analyses generally provide someinsight into the compositions of the larger aggregate particles and theamount of fines. Nonetheless, for a better evaluation of the service-ability and proper functioning of the existing ballast layer, ballaststrength needs to be characterized for different percentages of finematerials, such as plastic soil fines, mineral filler, and more recentlycoal dust coming from coal trains, which can fill the voids and causeballast fouling.
Since rail transport, particularly a unit train, provides the mostefficient means of transporting bulk commodities such as coal, the
Department of Civil and Environmental Engineering, University of Illinois at Urbana–Champaign, 205 North Mathews Avenue, Urbana, IL 61801. Corresponding author:E. Tutumluer, [email protected].
Transportation Research Record: Journal of the Transportation Research Board,No. 2117, Transportation Research Board of the National Academies, Washington,D.C., 2009, pp. 93–101.DOI: 10.3141/2117-12
that the wear of tie was more significant at the worst fouled tracklocations, possibly due to the abrasive effects of the slurry formedby fouling fines and water.
Chiang (9) conducted a series of ballast box repeated loading testson fouled ballast. Test results indicated that ballast settlement typicallyincreased as the amount of fouling material in ballast increased.Similarly, Han and Selig (10) conducted ballast box tests to evaluatethe impact of fouling on ballast settlement. They concluded that thedegree of ballast fouling indeed had a major impact on the ballastsettlement. With an increase in the percentage fouling, both the initialand final ballast settlements increased significantly. Investigations onthe strength of fouled ballast and studies on the fouling mechanism,however, have been somewhat limited.
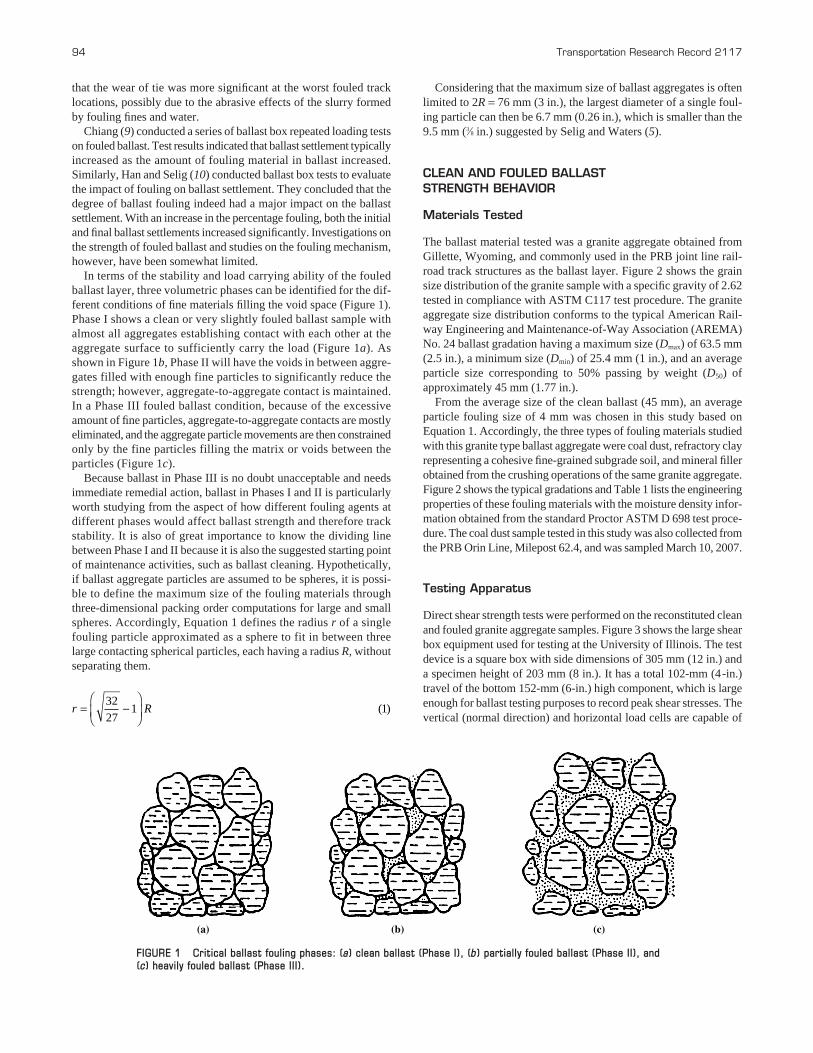
In terms of the stability and load carrying ability of the fouledballast layer, three volumetric phases can be identified for the dif-ferent conditions of fine materials filling the void space (Figure 1).Phase I shows a clean or very slightly fouled ballast sample withalmost all aggregates establishing contact with each other at theaggregate surface to sufficiently carry the load (Figure 1a). Asshown in Figure 1b, Phase II will have the voids in between aggre-gates filled with enough fine particles to significantly reduce thestrength; however, aggregate-to-aggregate contact is maintained.In a Phase III fouled ballast condition, because of the excessiveamount of fine particles, aggregate-to-aggregate contacts are mostlyeliminated, and the aggregate particle movements are then constrainedonly by the fine particles filling the matrix or voids between theparticles (Figure 1c).
Because ballast in Phase III is no doubt unacceptable and needsimmediate remedial action, ballast in Phases I and II is particularlyworth studying from the aspect of how different fouling agents atdifferent phases would affect ballast strength and therefore trackstability. It is also of great importance to know the dividing linebetween Phase I and II because it is also the suggested starting pointof maintenance activities, such as ballast cleaning. Hypothetically,if ballast aggregate particles are assumed to be spheres, it is possi-ble to define the maximum size of the fouling materials throughthree-dimensional packing order computations for large and smallspheres. Accordingly, Equation 1 defines the radius r of a singlefouling particle approximated as a sphere to fit in between threelarge contacting spherical particles, each having a radius R, withoutseparating them.
r R= −⎛
⎝⎜⎞
⎠⎟32
271 1( )
94 Transportation Research Record 2117
Considering that the maximum size of ballast aggregates is oftenlimited to 2R = 76 mm (3 in.), the largest diameter of a single foul-ing particle can then be 6.7 mm (0.26 in.), which is smaller than the9.5 mm (3⁄8 in.) suggested by Selig and Waters (5).
CLEAN AND FOULED BALLAST STRENGTH BEHAVIOR
Materials Tested
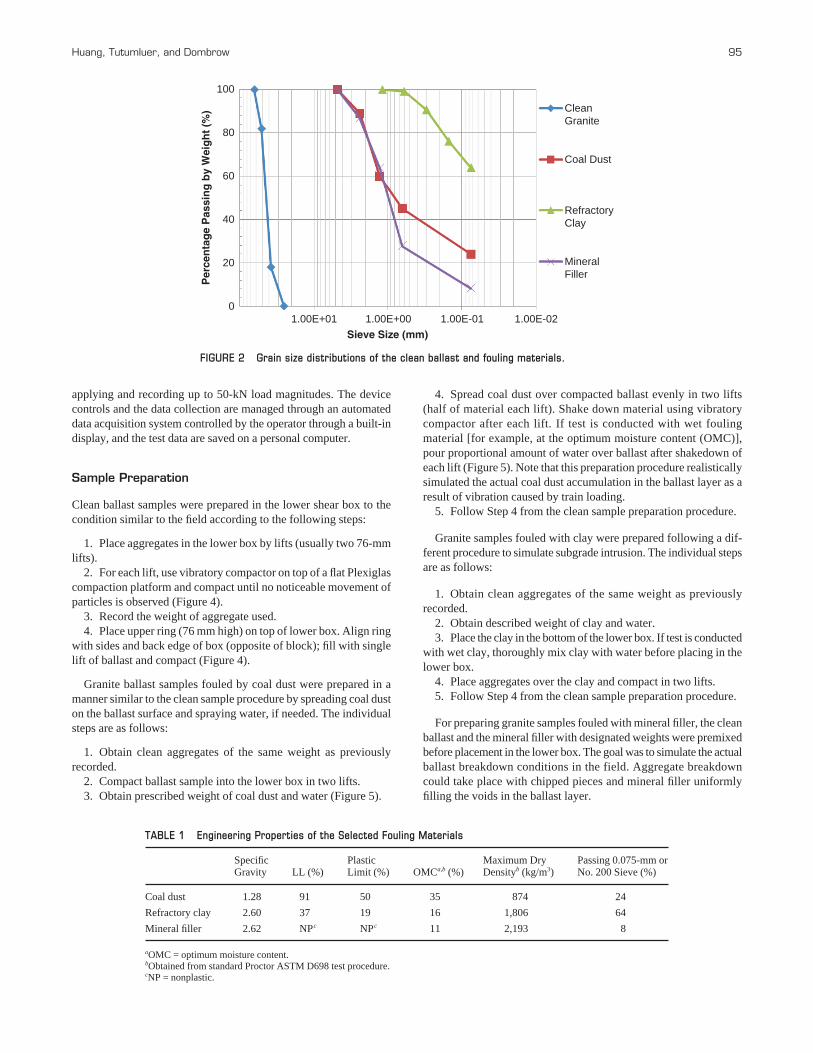
The ballast material tested was a granite aggregate obtained fromGillette, Wyoming, and commonly used in the PRB joint line rail-road track structures as the ballast layer. Figure 2 shows the grainsize distribution of the granite sample with a specific gravity of 2.62tested in compliance with ASTM C117 test procedure. The graniteaggregate size distribution conforms to the typical American Rail-way Engineering and Maintenance-of-Way Association (AREMA)No. 24 ballast gradation having a maximum size (Dmax) of 63.5 mm(2.5 in.), a minimum size (Dmin) of 25.4 mm (1 in.), and an averageparticle size corresponding to 50% passing by weight (D50) ofapproximately 45 mm (1.77 in.).
From the average size of the clean ballast (45 mm), an averageparticle fouling size of 4 mm was chosen in this study based onEquation 1. Accordingly, the three types of fouling materials studiedwith this granite type ballast aggregate were coal dust, refractory clayrepresenting a cohesive fine-grained subgrade soil, and mineral fillerobtained from the crushing operations of the same granite aggregate.Figure 2 shows the typical gradations and Table 1 lists the engineeringproperties of these fouling materials with the moisture density infor-mation obtained from the standard Proctor ASTM D 698 test proce-dure. The coal dust sample tested in this study was also collected fromthe PRB Orin Line, Milepost 62.4, and was sampled March 10, 2007.
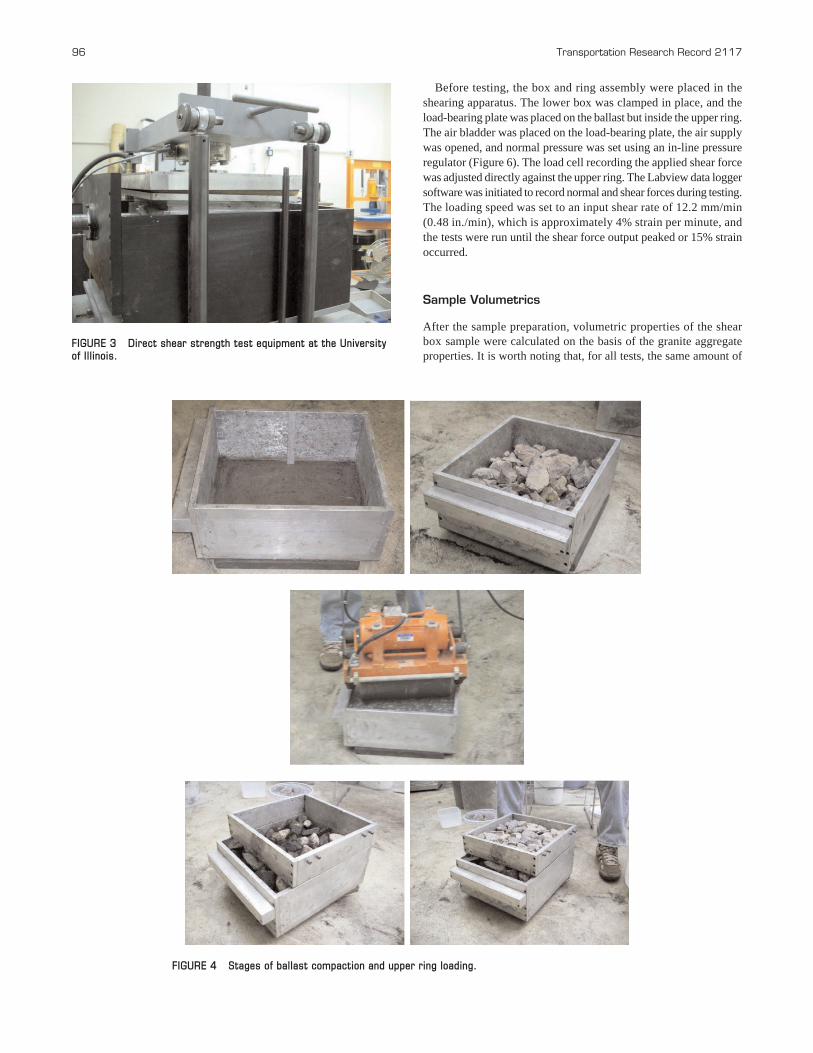
Testing Apparatus
Direct shear strength tests were performed on the reconstituted cleanand fouled granite aggregate samples. Figure 3 shows the large shearbox equipment used for testing at the University of Illinois. The testdevice is a square box with side dimensions of 305 mm (12 in.) anda specimen height of 203 mm (8 in.). It has a total 102-mm (4-in.)travel of the bottom 152-mm (6-in.) high component, which is largeenough for ballast testing purposes to record peak shear stresses. Thevertical (normal direction) and horizontal load cells are capable of
(a) (b) (c)
FIGURE 1 Critical ballast fouling phases: (a) clean ballast (Phase I), (b) partially fouled ballast (Phase II), and (c) heavily fouled ballast (Phase III).
applying and recording up to 50-kN load magnitudes. The devicecontrols and the data collection are managed through an automateddata acquisition system controlled by the operator through a built-indisplay, and the test data are saved on a personal computer.
Sample Preparation
Clean ballast samples were prepared in the lower shear box to thecondition similar to the field according to the following steps:
1. Place aggregates in the lower box by lifts (usually two 76-mmlifts).
2. For each lift, use vibratory compactor on top of a flat Plexiglascompaction platform and compact until no noticeable movement ofparticles is observed (Figure 4).
3. Record the weight of aggregate used.4. Place upper ring (76 mm high) on top of lower box. Align ring
with sides and back edge of box (opposite of block); fill with singlelift of ballast and compact (Figure 4).
Granite ballast samples fouled by coal dust were prepared in amanner similar to the clean sample procedure by spreading coal duston the ballast surface and spraying water, if needed. The individualsteps are as follows:
1. Obtain clean aggregates of the same weight as previouslyrecorded.
2. Compact ballast sample into the lower box in two lifts.3. Obtain prescribed weight of coal dust and water (Figure 5).
Huang, Tutumluer, and Dombrow 95
4. Spread coal dust over compacted ballast evenly in two lifts(half of material each lift). Shake down material using vibratorycompactor after each lift. If test is conducted with wet foulingmaterial [for example, at the optimum moisture content (OMC)],pour proportional amount of water over ballast after shakedown ofeach lift (Figure 5). Note that this preparation procedure realisticallysimulated the actual coal dust accumulation in the ballast layer as aresult of vibration caused by train loading.
5. Follow Step 4 from the clean sample preparation procedure.
Granite samples fouled with clay were prepared following a dif-ferent procedure to simulate subgrade intrusion. The individual stepsare as follows:
1. Obtain clean aggregates of the same weight as previouslyrecorded.
2. Obtain described weight of clay and water.3. Place the clay in the bottom of the lower box. If test is conducted
with wet clay, thoroughly mix clay with water before placing in thelower box.
4. Place aggregates over the clay and compact in two lifts.5. Follow Step 4 from the clean sample preparation procedure.
For preparing granite samples fouled with mineral filler, the cleanballast and the mineral filler with designated weights were premixedbefore placement in the lower box. The goal was to simulate the actualballast breakdown conditions in the field. Aggregate breakdowncould take place with chipped pieces and mineral filler uniformlyfilling the voids in the ballast layer.
Sieve Size (mm)1.00E+01
100
0
20
40
60
80
1.00E+00 1.00E-01 1.00E-02
CleanGranite
Coal Dust
RefractoryClay
MineralFiller
Per
cen
tag
e P
assi
ng
by
Wei
gh
t (%
)
FIGURE 2 Grain size distributions of the clean ballast and fouling materials.
TABLE 1 Engineering Properties of the Selected Fouling Materials
Specific Plastic Maximum Dry Passing 0.075-mm orGravity LL (%) Limit (%) OMCa,b (%) Densityb (kg/m3) No. 200 Sieve (%)
Coal dust 1.28 91 50 35 874 24
Refractory clay 2.60 37 19 16 1,806 64
Mineral filler 2.62 NPc NPc 11 2,193 8
aOMC = optimum moisture content.bObtained from standard Proctor ASTM D698 test procedure.cNP = nonplastic.
96 Transportation Research Record 2117
Before testing, the box and ring assembly were placed in theshearing apparatus. The lower box was clamped in place, and theload-bearing plate was placed on the ballast but inside the upper ring.The air bladder was placed on the load-bearing plate, the air supplywas opened, and normal pressure was set using an in-line pressureregulator (Figure 6). The load cell recording the applied shear forcewas adjusted directly against the upper ring. The Labview data loggersoftware was initiated to record normal and shear forces during testing.The loading speed was set to an input shear rate of 12.2 mm/min(0.48 in./min), which is approximately 4% strain per minute, andthe tests were run until the shear force output peaked or 15% strainoccurred.
Sample Volumetrics
After the sample preparation, volumetric properties of the shearbox sample were calculated on the basis of the granite aggregateproperties. It is worth noting that, for all tests, the same amount of
FIGURE 3 Direct shear strength test equipment at the Universityof Illinois.
FIGURE 4 Stages of ballast compaction and upper ring loading.

material was used to prepare approximately the same number ofaggregate contacts and a similar aggregate skeleton. That is, the voidsavailable for fouling material to fill in were kept the same in all cases.This void space was found for the clean granite sample to be 43%of the total volume, which corresponds to a void ratio of 0.75 or 75%of the aggregate volume. ASTM C29 test procedure was used forfinding porosity or air voids with the known values of the specificgravity and box volume and the weight of ballast compacted.
For the aggregate fouled with coal dust, 25% coal dust by weightof aggregate was found to completely fill in the voids of the cleangranite, thus referred to here as “fully coal dust fouled” conditionafter sample preparation. Similarly, 32% clay by weight of aggregate
Huang, Tutumluer, and Dombrow 97
and 40% mineral filler by weight of aggregate were observed tocompletely fill in the same void space of the clean granite for the fullyfouled conditions for clay and mineral filler, respectively.
Direct Shear Test Results
The ballast samples were sheared horizontally in the shear box undertarget normal pressures of 172, 241, and 310 kPa (25, 35, and 45 psi),typical ballast layer confining pressures, so that the relationshipsbetween normal stress and shear stress could be established. Themaximum shear stress at failure under each applied normal pressure
FIGURE 5 Coal dust being mixed as the fouling material.
FIGURE 6 Setup of the direct shear box apparatus.
was recorded from each test. This maximum shear stress typicallyoccurred when approximately 10% shear strain was reached duringtesting. The shear strength expression τmax = C + σn � tanΦ (where Cis the cohesion intercept, σn is the applied normal stress, and Φ is theinternal friction angle) was then developed for each ballast sampletested at a corresponding fouling fines content and moisture state.
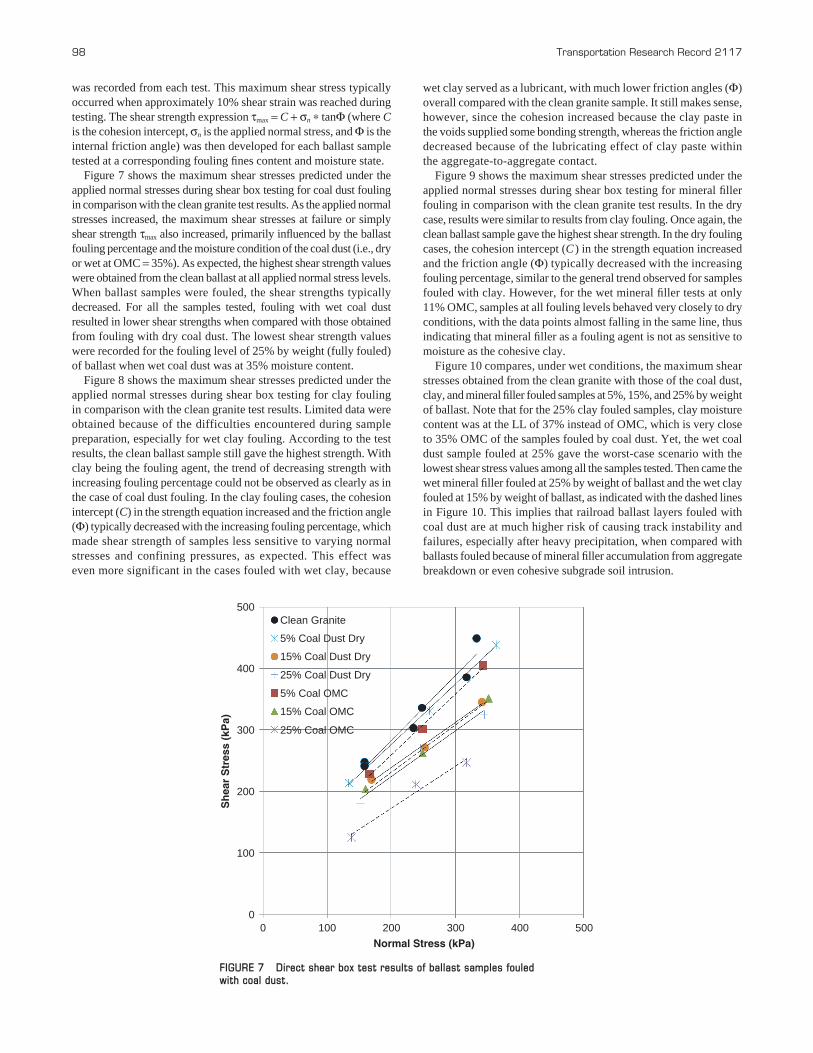
Figure 7 shows the maximum shear stresses predicted under theapplied normal stresses during shear box testing for coal dust foulingin comparison with the clean granite test results. As the applied normalstresses increased, the maximum shear stresses at failure or simplyshear strength τmax also increased, primarily influenced by the ballastfouling percentage and the moisture condition of the coal dust (i.e., dryor wet at OMC = 35%). As expected, the highest shear strength valueswere obtained from the clean ballast at all applied normal stress levels.When ballast samples were fouled, the shear strengths typicallydecreased. For all the samples tested, fouling with wet coal dustresulted in lower shear strengths when compared with those obtainedfrom fouling with dry coal dust. The lowest shear strength valueswere recorded for the fouling level of 25% by weight (fully fouled)of ballast when wet coal dust was at 35% moisture content.
Figure 8 shows the maximum shear stresses predicted under theapplied normal stresses during shear box testing for clay foulingin comparison with the clean granite test results. Limited data wereobtained because of the difficulties encountered during samplepreparation, especially for wet clay fouling. According to the testresults, the clean ballast sample still gave the highest strength. Withclay being the fouling agent, the trend of decreasing strength withincreasing fouling percentage could not be observed as clearly as inthe case of coal dust fouling. In the clay fouling cases, the cohesionintercept (C) in the strength equation increased and the friction angle(Φ) typically decreased with the increasing fouling percentage, whichmade shear strength of samples less sensitive to varying normalstresses and confining pressures, as expected. This effect waseven more significant in the cases fouled with wet clay, because
98 Transportation Research Record 2117
wet clay served as a lubricant, with much lower friction angles (Φ)overall compared with the clean granite sample. It still makes sense,however, since the cohesion increased because the clay paste inthe voids supplied some bonding strength, whereas the friction angledecreased because of the lubricating effect of clay paste withinthe aggregate-to-aggregate contact.
Figure 9 shows the maximum shear stresses predicted under theapplied normal stresses during shear box testing for mineral fillerfouling in comparison with the clean granite test results. In the drycase, results were similar to results from clay fouling. Once again, theclean ballast sample gave the highest shear strength. In the dry foulingcases, the cohesion intercept (C ) in the strength equation increasedand the friction angle (Φ) typically decreased with the increasingfouling percentage, similar to the general trend observed for samplesfouled with clay. However, for the wet mineral filler tests at only11% OMC, samples at all fouling levels behaved very closely to dryconditions, with the data points almost falling in the same line, thusindicating that mineral filler as a fouling agent is not as sensitive tomoisture as the cohesive clay.
Figure 10 compares, under wet conditions, the maximum shearstresses obtained from the clean granite with those of the coal dust,clay, and mineral filler fouled samples at 5%, 15%, and 25% by weightof ballast. Note that for the 25% clay fouled samples, clay moisturecontent was at the LL of 37% instead of OMC, which is very closeto 35% OMC of the samples fouled by coal dust. Yet, the wet coaldust sample fouled at 25% gave the worst-case scenario with thelowest shear stress values among all the samples tested. Then came thewet mineral filler fouled at 25% by weight of ballast and the wet clayfouled at 15% by weight of ballast, as indicated with the dashed linesin Figure 10. This implies that railroad ballast layers fouled withcoal dust are at much higher risk of causing track instability andfailures, especially after heavy precipitation, when compared withballasts fouled because of mineral filler accumulation from aggregatebreakdown or even cohesive subgrade soil intrusion.
Normal Stress (kPa)100
500
400
300
200
100
03000 200 400 500
Clean Granite
5% Coal Dust Dry
5% Coal OMC
15% Coal OMC
25% Coal OMC
15% Coal Dust Dry
25% Coal Dust Dry
Sh
ear
Str
ess
(kP
a)
FIGURE 7 Direct shear box test results of ballast samples fouled with coal dust.

Because the coal dust fouling was found to be the most detrimentalcase, a statistical analysis was performed for the significance of thedifferent coal dust levels affecting the critical stages of ballast fouling.As described early in this paper, it is important to determine at whatfouling level a significant drop in strength would be realized. Thatis, there is a need to determine the reasonable dividing line betweenPhase I and II. For this purpose, an F-test statistical approach wasused to evaluate the differences between the strength lines graphed
Huang, Tutumluer, and Dombrow 99
in Figure 7. With a value of significance (p-value) of 0.0014 (muchless than 0.05), 15% coal dust fouling was found to significantlydecrease the strength of ballast. Because all other strength lines inFigure 7 are below the 15% dry coal dust fouling line, 15% coal dustby weight is considered to be the critical stage of coal dust foulingin terms of ballast shear strength.
Table 2 lists cohesion intercepts (C) and friction angles (Φ) obtainedfrom the ballast testing program. High correlation coefficients, R2
Normal Stress (kPa)100
500
400
300
200
100
03000 200 400 500
Clean Granite5% Mineral Filler Dry
40% Mineral Filler Dry5% Mineral Filler OMC15% Mineral Filler OMC25% Mineral Filler OMC
15% Mineral Filler Dry25% Mineral Filler Dry
Sh
ear
Str
ess
(kP
a)
FIGURE 9 Direct shear box test results of ballast samples fouled withmineral filler.
Normal Stress (kPa)100
500
400
300
200
100
03000 200 400 500
Clean Granite5% Clay Dry
32% Clay Dry5% Clay OMC15% Clay OMC
15% Clay Dry
25% Clay Dry
Sh
ear
Str
ess
(kP
a)
FIGURE 8 Direct shear box test results of ballast samples fouled with clay.

values, were typically obtained for the established shear strengthequations except for two mineral filler samples. The clean granitetypically had the highest friction angle (Φ) of 46.6°, except for thefriction angle of 47.7° obtained for the low 5% dry mineral fillersample. For the case of 25% wet coal dust fouling, the friction anglecomputed is as low as 34.5°. This value is very close to the frictionangle of 33.5°, obtained from a parallel research study (11), for the
100 Transportation Research Record 2117
pure coal dust direct shear samples tested at OMC. Similarly, a lowcohesion intercept of 35 kPa (5.1 psi) is close to the very low uncon-fined compressive strength of 24 kPa (3.5 psi) also obtained for thecoal dust shear strength properties (11). This implies that the shear-ing action for the 25% coal dust fouled sample was mainly resistedin the direct shear apparatus by the wet coal dust governing thebehavior. Again, one should note that 35% OMC condition does not
Normal Stress (kPa)100
500
400
300
200
100
03000 200 400 500
Clean Granite5% Clay OMC
5% Coal OMC15% Coal OMC25% Coal OMC5% Mineral Filler OMC15% Mineral Filler OMC25% Mineral Filler OMC
15% Clay OMC25% Clay Liquid Limit
Sh
ear
Str
ess
(kP
a)
FIGURE 10 Comparisons of three fouling scenarios under wet conditions.
TABLE 2 Shear Box Direct Shear Strength Test Results
Percentage by Moistureτmax = C + σn * tan Φ Shear Strength τmax (kPa)
Weight of Clean Condition Cohesion C Friction Correlation 200-kPa Normal 300-kPa NormalFouling Agent Ballast (see Table 1) (kPa) Angle (Φ) Coefficient, R2 Stress Stress
Clean 0 Dry 72 46.6 .96 283 389
Coal dust 5 Dry 80 44.4 .99 276 37415 Dry 93 36.2 .99 239 31225 Dry 75 36.6 .98 224 2985 OMC 61 44.7 .99 259 359
15 OMC 77 37.7 .99 231 30925 OMC 35 34.5 .97 173 242
Clay 5 Dry 44 40.5 .99 215 30015 Dry 131 31.2 .99 252 31325 Dry 59 39.5 .99 224 30732 Dry 114 33.7 .97 247 3145 OMC 61 44.1 .95 255 352
15 OMC 85 38.0 .99 241 31925 LL 144 36.1 .98 290 363
Mineral filler 5 Dry 0 47.7 .99 195 30515 Dry 41 41.6 .93 219 30825 Dry 94 34.6 .85 232 30140 Dry 116 35.7 .71 260 3325 OMC 40 42.6 .98 224 316
15 OMC 26 43.4 .97 215 30925 OMC 66 38.0 .98 222 300
represent a fully saturated coal dust state. After soaking or 100% sat-uration, soil suction would be destroyed, thus resulting in even lowerstrengths and unstable ballast conditions.
Table 2 also lists for direct comparison purposes the shear strengthvalues computed under normal stress levels of 200 and 300 kPa(29.0 and 43.5 psi), typical field railroad ballast stress conditions.Most of the trends already mentioned and their effects can be clearlyseen by comparing the computed shear strength values. In the caseof ballast fouled by mineral filler, strength values from both dry andwet tests were very close, which may suggest that the 11% optimummoisture had a minor effect on mineral filler fouling. However, theclay fouled ballast samples at OMC give higher strength values thanthe dry clay fouled samples, which implies that clayey soils at OMChave higher shear strength properties. Since most geomaterialscompacted at OMC usually give the best mechanical properties,future research will need to also investigate fouled ballast behaviorwhen moisture content increases beyond optimum conditions.
SUMMARY AND CONCLUSIONS
A large direct shear (shear box) device was used to conduct laboratorytests at the University of Illinois on granite ballast samples obtainedfrom the PRB joint line in Wyoming. The tests measured strength anddeformation characteristics of both clean (new) and fouled ballastaggregates with three different fouling agents—coal dust also obtainedfrom the PRB joint line, plastic clay, and nonplastic mineral fillerobtained by crushing the same granite aggregate—at various stagesof fouling. The grain size distribution of the aggregate conformed tothe typical AREMA No. 24 ballast gradation with a maximum size(Dmax) of 63.5 mm (2.5 in.) and a minimum size (Dmin) of 25.4 mm(1 in.). Each fouling material was mixed with clean aggregates forachieving fouling levels of 5%, 15%, 25%, and sometimes up to 40%by weight of ballast under dry and wet, mostly OMC, conditions.The coal dust material was spread on the clean aggregate specimen andvibrated on top to achieve its percolation into the voids in an effortto realistically simulate coal dust falling off trains into the ballastlayer in the field. The plastic refractory clay and the mineral filler weremixed with granite aggregates by means of different sample prepa-ration techniques, again to simulate realistic field-fouling scenariosof subgrade intrusion and aggregate breakdown, respectively.
From the direct shear tests, the highest shear strength values wereobtained from the clean ballast samples at all applied normal stresslevels, which were representative of typical stress states experiencedin the ballast layer under train loading. When ballast samples werefouled, the shear strengths always decreased. This result was mostlyapparent with lower friction angles and cohesion intercepts. Wetfouling generally resulted in lower ballast shear strengths whencompared with those obtained from fouling with dry coal dust.Primarily because of increasing cohesive nature (i.e., cohesionintercepts) with increasing fouling percentages, plastic refractoryclay fouled samples exhibited slight increases in shear strength underboth dry and wet conditions. However, samples fouled with mineralfiller at 5%, 15%, and 25% were somewhat insensitive to the low11% moisture content increase from the dry condition and resultedin similar shear strength values.
Coal dust was by far the worst fouling agent for its impact on tracksubstructure and roadbed, and it caused the most drastic decreasesin shear strength, especially at high fouling levels. Through statistical
Huang, Tutumluer, and Dombrow 101
evaluation, 15% dry coal dust fouling by weight of ballast was shownto be sufficiently significant to cause critical fouling and decreaseconsiderably the ballast strength. For the case of 25% wet coal dustfouling by weight of ballast, the lowest shear strength properties,internal friction angle and cohesion, obtained were equivalent tothose properties of the coal dust itself at 35% OMC. Note that evenmore drastic strength reductions can occur when dry coal dust, whichhas never been saturated or soaked in the field and therefore has a highsuction potential, is subjected to inundation and 100% saturation.
It is still difficult to make unique conclusions on ballast foulingbecause of the differences between laboratory and field conditionsand difficulties in sample preparation process. This study is a firststep of trying to better understand fouling and its effect on ballaststrength and stability. Further studies and different methods ofinvestigation are needed to fully understand ballast fouling.
ACKNOWLEDGMENTS
The authors would like to thank BNSF Railway for providing thefinancial support needed to carry out this research. The authors wouldalso like to thank Hank Lees of BNSF for sharing his valuableknowledge and experience on the research topic and for providinghelp and support with obtaining materials. The assistance of KivancAvrenli on the coal dust tests is greatly appreciated.
REFERENCES
1. Selig, E. T., B. I. Collingwood, and S. W. Field. Causes of Fouling inTrack. AREA Bulletin 717, 1988.
2. Collingwood, B. I. An Investigation of the Cause of Railroad BallastFouling. Master of Science Degree Project Report No. AAR88-350P.University of Massachusetts, 1988.
3. Selig, E. T., V. DelloRusso, and K. J. Laine. Sources and Causes ofBallast Fouling. Report No. R-805. Association of American Railroads,Technical Center, Chicago, Ill., 1992.
4. Ballast Performance in Concrete Tie Track: Prairie Region, Edmonton,Geotechnical Service. Internal Report. Canadian National Railway, 1987.
5. Selig, E. T., and J. M. Waters. Track Geotechnology and SubstructureManagement. Thomas Telford Publications, London, 1994.
6. Raymond, G. P. Design for Railroad Ballast and Subgrade Support.Journal of the Geotechnical Engineering Division, Vol. 104, No. 1,1978, pp. 45–60.
7. Raymond, G. P. Railroad Ballast Load Ranking Classification. Jour-nal of the Geotechnical Engineering Division, Vol. 105, No. 10, 1979, pp. 1133–1153.
8. Raymond, G. P. Track and Support Rehabilitation for a Mine Com-pany Railroad. Canadian Geotechnical Journal, Vol. 37, No. 2, 2000,pp. 318–332.
9. Chiang, C. C. Effects of Water and Fines on Ballast Performance inBox Tests. Master of Science Degree Project Report No. AAR89-366P.University of Massachusetts, 1989.
10. Han, X., and E. T. Selig. Effects of Fouling on Ballast Settlement. Proc.,6th International Heavy Haul Railway Conference, Cape Town, SouthAfrica, 1997.
11. Tutumluer, E., W. Dombrow, and H. Huang. Laboratory Characteriza-tion of Coal Dust Fouled Ballast. AREMA 2008 Annual Conference andExhibition, Salt Lake City, UT, 2008.
The contents of this paper reflect the views of the authors, who are responsible forthe facts and the accuracy of the data. This paper does not constitute a standard,specification, or regulation.
The Railway Maintenance Committee sponsored publication of this paper.