Criterios diagnosticos en glaucoma
20
ISSUE HIGHLIGHT Optic disk evaluation and utility of high-tech devices in the assessment of glaucoma Sherry J. Bass, O.D. and Jerome Sherman, O.D. SUNY State College of Optometry and The Eye Institute and Laser Center. New York, New York Background: Every clinician has at one time or another exam- ined a patient who was misdiagnosed as having glaucoma or whose diagnosis of glaucoma was missed. Although glau- coma can exist with normal intraocular pressures, clinicians often rely on the presence of visual-field defects and the degree of optic disk cupping to direct care. However, assess- ment of cupping is but one small part of optic disk evalua- tion in glaucoma, and other features of the optic nerve head and retinal nerve fiber layer must be closely inspected to help diagnose borderline cases. In addition, glaucoma can exist without visual-field loss. High-tech devices offer an added dimension in the objective assessment of structure when subjective tests of function and/or ophthalmoscopic obser- vations are equivocal. Methods: This article details the various parameters of optic disk and retinal nerve fiber layer evaluation and their significance in the assessment of glaucoma. In addition, the role of four high-tech devices is evaluated for their utility in the assess- ment and progression of glaucomatous damage. Conclusions: When one attempts to classify a patient as hav- ing glaucoma, the degree of cupping and the presence or absence of visual f~eld loss can be misleading. Prior to defin- itive diagnosis, a thorough evaluation of the optic disk and retinal nerve fiber layer, and appropriate use of high-tech devices, should help reduce the under-diagnosis and over- diagnosis of this disease. T he determination of whether or not a patient has glau- coma and when to institute treatment is a diagnostic challenge for many clinicians. A patient with the "Big ThreeM-i.e., elevated intraocular pressures (IOPs), glauco- matous optic disk cupping, and glaucomatous visual-field loss-should be treated. The challenge presents when deter- mining if a patient who has only one or two of these signs should be treated, and persists when a patient is being treated for many years who does not, in fact, have glaucoma at all. Cupping of the optic nerve head and high intraocu- lar pressure have always been classic hallmarks of glaucoma and are frequently used to make the diagnosis of this dis- ease. The presence of an elevated intraocular pressure, how- ever, is no longer considered an absolute harbinger of glaucoma. Glaucoma exists in patients with normal intraocular pressures, and glaucoma never develops in the majority of ocular hypertensives. l However, suspicious cup size, shape, and depth continue to concern the eye care prac- titioner. Visual-field loss is another feature that can be misleading. Erroneous interpretation of visual-field loss can result in the Key Words: Assessment, evaluation, glaucoma, high.tech misdiagnosis of glaucoma, while the absence of field loss devices, optic disk, testing can falsely convince a practitioner that the patient does not have glaucoma. Clinicians have witnessed the birth of high-tech diagnostic procedures that were developed to quantify structural aspects of the optic nerve, retina, and retinal nerve fiber layer (RNFL). Since most of these devices have normative Bass SJ and Sherman J, optic disk evaluation and of databases, they can help classify the patient on the basis of high-tech devices in the assessment of glaucoma. Optometry ~fati~tical analysis of ~ 0 m p a r i ~ 0 n ~ to their normative data- 2004:75:277-96. base. Some of these techniques have the potential to aid cli- VOLUME 75lNUMBER 5lMAY 2004 OPTOMETRY
-
Upload
melissa-garcia-felix -
Category
Health & Medicine
-
view
167 -
download
2
Transcript of Criterios diagnosticos en glaucoma

I S S U E H I G H L I G H T
Optic disk evaluation and utility of high-tech devices in the assessment of glaucoma
Sherry J. Bass, O.D. and Jerome Sherman, O.D.
SUNY State College of Optometry and The Eye Institute and Laser Center. New York, New York
Background: Every clinician has at one time or another exam- ined a patient who was misdiagnosed as having glaucoma or whose diagnosis of glaucoma was missed. Although glau- coma can exist with normal intraocular pressures, clinicians often rely on the presence of visual-field defects and the degree of optic disk cupping to direct care. However, assess- ment of cupping is but one small part of optic disk evalua- tion in glaucoma, and other features of the optic nerve head and retinal nerve fiber layer must be closely inspected to help diagnose borderline cases. In addition, glaucoma can exist without visual-field loss. High-tech devices offer an added dimension in the objective assessment of structure when subjective tests of function and/or ophthalmoscopic obser- vations are equivocal.
Methods: This article details the various parameters of optic disk and retinal nerve fiber layer evaluation and their significance in the assessment of glaucoma. In addition, the role of four high-tech devices is evaluated for their utility in the assess- ment and progression of glaucomatous damage.
Conclusions: When one attempts to classify a patient as hav- ing glaucoma, the degree of cupping and the presence or absence of visual f~eld loss can be misleading. Prior to defin- itive diagnosis, a thorough evaluation of the optic disk and retinal nerve fiber layer, and appropriate use of high-tech devices, should help reduce the under-diagnosis and over- diagnosis of this disease.
T he determination of whether or not a patient has glau- coma and when to institute treatment is a diagnostic challenge for many clinicians. A patient with the "Big
ThreeM-i.e., elevated intraocular pressures (IOPs), glauco- matous optic disk cupping, and glaucomatous visual-field loss-should be treated. The challenge presents when deter- mining if a patient who has only one or two of these signs should be treated, and persists when a patient is being treated for many years who does not, in fact, have glaucoma at all. Cupping of the optic nerve head and high intraocu- lar pressure have always been classic hallmarks of glaucoma and are frequently used to make the diagnosis of this dis- ease. The presence of an elevated intraocular pressure, how- ever, is no longer considered an absolute harbinger of glaucoma. Glaucoma exists in patients with normal intraocular pressures, and glaucoma never develops in the majority of ocular hypertensives. l However, suspicious cup size, shape, and depth continue to concern the eye care prac- titioner.
Visual-field loss is another feature that can be misleading. Erroneous interpretation of visual-field loss can result in the
Key Words: Assessment, evaluation, glaucoma, high.tech misdiagnosis of glaucoma, while the absence of field loss devices, optic disk, testing can falsely convince a practitioner that the patient does not
have glaucoma.
Clinicians have witnessed the birth of high-tech diagnostic procedures that were developed to quantify structural aspects of the optic nerve, retina, and retinal nerve fiber layer (RNFL). Since most of these devices have normative
Bass SJ and Sherman J, optic disk evaluation and of databases, they can help classify the patient on the basis of high-tech devices in the assessment of glaucoma. Optometry ~fati~tical analysis of ~ 0 m p a r i ~ 0 n ~ to their normative data- 2004:75:277-96. base. Some of these techniques have the potential to aid cli-
VOLUME 75lNUMBER 5 lMAY 2004 OPTOMETRY
I S S U E H I G H L I G H T
[iulre 1 A, A larye optic disk IS usually associated w i th a large cup; 13, a small optlc dlsk a usually associated w i th a small cup, or no cup at a l l
nicians in the assessment of an abnormality at an initial visit, while others are best suited for the determination of change over time. In addition, these tests-which are objective-have added a whole new dimension to glaucoma detection by removing the variability factors associated with subjective visual-field testing. And since structural damage may precede functional loss in glaucoma, instruments that can objectively and quantita- tively assess structural damage now play an inte- gral role in the early assessment of glaucoma.
Evaluation of the optic nerve head Glaucoma affects the structure of the optic nerve head in some way and at some point in the course of the disease. There are several intrapapillary and peripapillary features of the optic nerve head exam- ination, in addition to cupping, whose association with optic nerve damage has been suggested, war- ranting close ophthalmoscopic inspection for signs of the glaucomatous disease p r o ~ e s s . ~
Optic disk size Determination of optic disk size is important because a large normal disk is nearly always asso- ciated with a large cup (see Figure 1, A). The only apparent exception to this rule is the rare con- genital disk anomaly, Morning Glory syndrome, in which a large disk is encountered with no cup because of the presence of fibroglial tissue in the center of the disk. In contrast, a small normal disk nearly always has a small cup (see Figure 1, B). Although a 0.5 CID ratio in a patient with a large disk is probably normal, a 0.5 CID ratio in a
patient with a small disk is most likely glauco- matous. One could argue, therefore, that a CID ratio is meaningless unless the approximate size of the disk is also considered. The size of the optic disk varies between and within individuals. A summary of 23 published studies2 established the range of values for optic disk area between 1.70 mm2 to 3.34 mm2. A disk can be grossly esti- mated as large or small using the 5-degree spot size of a direct ophthalmoscope. The illumination from this spot size should just about cover a disk of normal size. In patients with large disks, the light would cover only part of the disk, whereas in small disks the light covers the disk plus reti- nal areas outside the disk.
There are certain ethnic, gender, and ametropic associations with disk size. Disk size is generally smallest in whites, larger in Mexicans, and largest in people of African d e s ~ e n t ; ~ it also tends to be larger in males than in fern ale^.^ Although there is no ametropic association with disk size between -5.00 and + 5.00 D, large disks are asso- ciated with high myopia and small disks are asso- ciated with high hyperopia.
Large disks have a greater neuro-retinal rim area,3 more optic nerve fibers, and less nerve fiber crowding than small disks.4 Small disks are asso- ciated with non-arteritic anterior ischemic optic neuropathy (AION),5 disk d r ~ s e n , ~ and non-dis- tinct disk borders (pseudopapilledema) .7 But does disk size determine susceptibility to glaucoma? Since blacks have large optic disks and a greater likelihood for development of glaucoma when
278
OPTOMETRY VOLUME 75lNUMBER 5lMAY 2004

I S S U E H I G H L l G H l
Fiuun 2 The normal neuroretinal rim. thickest inferiorly, then superiorly, then nasally, and th~nnest temporally.
compared to whitest8 one might assume that a larger disk size is associated with greater glau- coma susceptibility. Non-highly-myopic patients with normal tension glaucoma (NTG) have been reported to have larger optic disk size than patients with primary open-angle glaucoma (POAG).9 However, in POAG and secondary open- angle glaucoma (S0AG)-e.g., pigmentary glau- coma-the disk size is n ~ r m a l . ' ~ , ~ '
What about small disks? Small disks are associ- ated with factors that affect perfusion of the optic disk (as evidenced by the greater association with non-arteritic AION5) and axoplasmic flow in the axons of the ganglion cells (as evidenced by the association with disk drusen6). In addition, the nerve fibers are more crowded in small disks, leaving them more susceptible to mechanical damage in glaucoma.12 Furthermore, small disks may have a smaller reserve because of a smaller number of nerve fibers than larger disks3 Although these factors would support a greater susceptibility of glaucoma in small optic disks, some studies have demonstrated that glaucoma- tous optic disk atrophy is independent of disk ~ i z e . ' ~ , ' ~ Dish size is therefore not definitive in deter- mination of susceptibility to development of glau- coma. Disk size is important, however, when judging the degree of cupping and making the determination as to whether a particular cup size is likely physiological, as opposed to pathological, for a certain disk size.
Optic disk shape The normal shape of the optic disk is oval, having a vertical diameter that is about 10% greater than the horizontal diam- eter. Significant corneal astig- matism and amblyopia associated with increased corneal astigma- tism correlate significantly with an abnormal optic disk shape.15 Before suspecting glaucoma in a patient with a vertically elon- gated disk, a significant amount of against-the-rule astigmatism should be ruled out. Studies have suggested that susceptibility to glaucoma is not dependent on optic disk shape.16 The shape of the optic disk in highly myopic eyes ( > 12D), however, is more oval, elongated, and oblique than in other eyes. This suggests that
the myopic stretching in these eyes pulls more on the optic disk in some directions than in others, and that the vertical elongation may be the rea- son high myopia is a risk factor for the develop- ment of glaucoma.
Neuro-retinal rim size and shape The size of the neuro-retinal rim is indicative of the anatomic reserve capacity of the optic disk and correlates well to the size of the disk: the larger the disk, the greater the rim area and optic nerve fiber count.3 Anatomically, axons from gan- glion cells close to the optic disk are positioned more centrally within the optic disk, whereas axons from peripheral retina lie at the optic nerve head margins. The shape of the neuro-retinal rim usually follows the "ISNT" rule: It is broadest inferiorly, followed by the superior, nasal, and temporal regions, where it is the narrowed7 (see Figure 2). In glaucoma, these regions are affected differently at various stages of the disease. Early glaucoma usually affects the inferotemporal and superotemporal rim disk regions. As glau- coma advances to the moderate stage, the great- est amount of rim loss occurs in the temporal horizontal region. In advanced glaucoma, only the nasal sector of the disk rim remains.18 Ophthal- moscopic observation of rim loss most often occurs in glaucomatous optic neuropathy, while it may not necessarily occur in other forms of optic neuropathy. Therefore, careful examination
2 79
V O L U M E 7 5 l N U M B E R 5 l M A Y 2 0 0 4 O P T O M E T R Y

ISSUE HIGHLIGHT
of the size and shape of the neuro-retinal rim tis- sue over time may be a prime way to differenti- ate glaucomatous optic nerve disease from other etiologies. Some of the high-tech instruments that quantify changes in rim area over time are useful in this regard.
Neuro-retinal rim pallor Pallor of the neuro-retinal rim is more often a sign of non-glaucomatous optic neuropathy than glaucomatous optic neuropathy.lg The overall disk pallor seen in advanced glaucoma is due to a more excavated cup rather than pallor of the neuro-retinal rim. It is more common to see a healthy pink rim-albeit very thin-in mod- erately advanced glaucoma, than a pale one. Overall, a nerve head with a pale rim needs to be investigated for other etiologies, such as ischemic optic neuropathy, intracranial masses, and hereditary and congenital optic nerve dis- eases. In addition, the pseudophakic eye can exhibit "pseudo-pallor" of the neuro-retinal rim. One major exception to this rule is the eye with angle closure glaucoma; following a large and rapid rise in IOP, the disk often appears pale, without dramatic cupping.20 Cupping of the optic nerve head, along with neuro-retinal rim pallor, may also be non-glaucomatous and has been reported in posterior ischemic optic neuropathy21 and giant cell a r t e r i t i ~ . ~ ~
Cupldisk ratio in relation to disk size Of all disk parameters, cupldisk ratio appears to be used most frequently in assessment of glau- comatous risk. This one feature may label a patient a glaucoma suspect, despite normal intraocular pressures and the fact that all other aspects of the disk are normal.
Cup-to-disk ratios vary widely, even in the nor- mal population, and can range from 0.0 to 0.9.17 Therefore, it is possible for a large CID ratio in a large optic disk to be physiological. It is important to assess both the horizontal and vertical cupldisk ratios, since the normal optic disk may have a slightly greater hori- zontal cup than vertical cup. In glaucoma, the vertical cup increases faster than the hori- zontal cup due to loss of the neuro-retinal rim superiorly and inferiorly. Therefore, a cup that is vertically elongated is more likely indicative of glaucoma.
The over-diagnosis and under-diagnosis of glaucoma can be minimized if the practitioner understands the relationship of CID ratio to disk size. Large disks are generally associated with large ClDs and small disks are generally asso- ciated with small ClDs. While a large CID ratio in a large disk is expected, it is unusual to see any significant degree of cupping in a small optic disk. An average or large CID ratio in a small disk is particularly suspicious in the pres- ence of vertical elongation of the cup. In fact, most small optic disks have either no cup or a cup size that is 10% to 20% the size of the disk. Early glaucoma in a small disk may be missed, because a small degree of increase in cupping in a cup that is small to begin with can easily go unnoticed-especially when intraocular pressures are normal.
In these cases, it is crucial that other available means of optic nerve head assessment be used. For example, small glaucomatous disks with small cups have been shown to demonstrate abnor- malities in the peripapillary region,23 primarily as a thinning or decrease in visibility of the retinal nerve fiber layer. This can be appreciated as an increase in the clarity of the retinal vessels near the disk. Other telltale signs include diffuse andlor focal attenuations in the retinal a r t e r i ~ l e s ~ ~ t ~ ~ and peripapillary chorioretinal a t r ~ p h y . ~ ~ , ~ ~
The large cup (or "macrocup") may be seen in patients with large optic nerve heads, or macrodisks. The patient with a primary or con- genital large disk or macrodisk will probably have a macrocup, which is physiological and not glau- c~matous .~ After the first year of life, these disks are constant and the cupping does not ~ h a n g e . ~ The secondary or acquired macrocup does undergo change, as seen in glaucoma (due to decreasing neuro-retinal rim tissue) and in high myopia (in which myopic stretching enlarges the disk and thereby the cup).
The inconclusiveness of CID ratio, as a diag- nostic clue, has multiple implications in this regard: a large disk with a large cup and a nor- mal neuro-retinal rim should not summarily be labeled as glaucomatous. Conversely, patients in whom early glaucomatous changes develop in the presence o f a macrocup may be deceptively perceived as having advanced glaucomatous cup excavation. However, visual fields in these cases
280
OPTOMETRY VOLUME 75lNUMBER 5IMAY 2004
ISSUE HIGHLIGHT
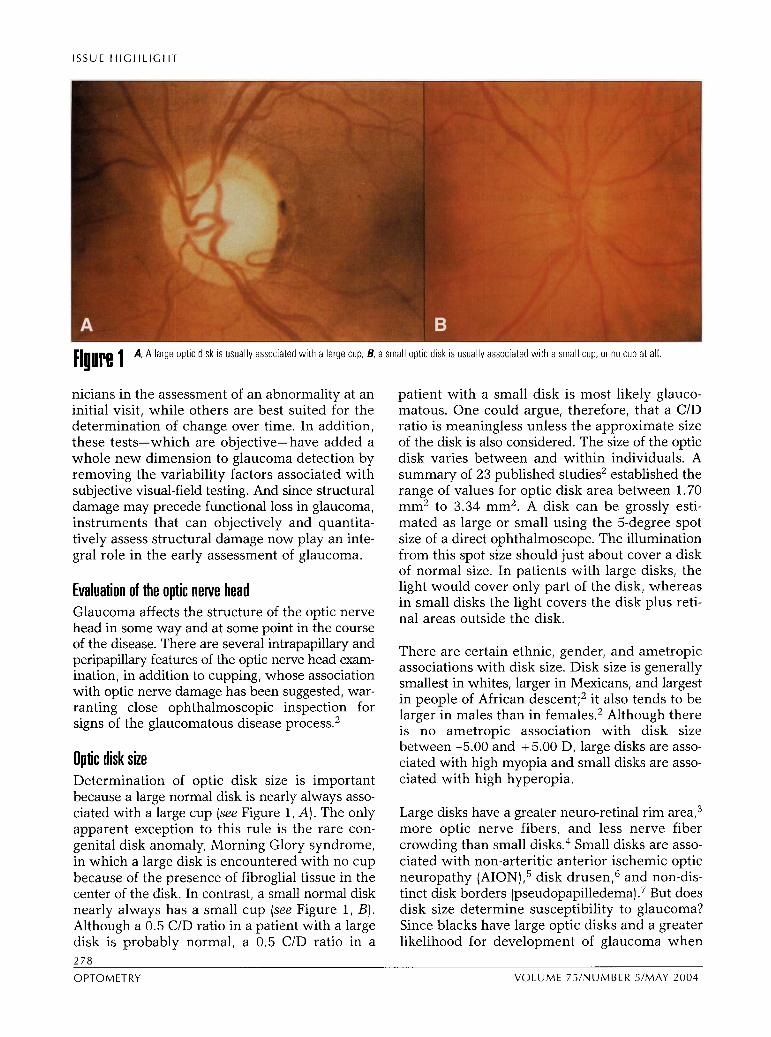
[iNUre 3 Optic disk (Drance) hemorrhages in glaucoma are ephemeral and may
would probably exhibit early defects and not advanced defects.
Optic cup shape and depth When evaluating cup shape and/or cup depth ophthalmoscopically, one must remember that the border between the optic cup and optic disk is based on contour, not color, and is best assessed stereoscopically. This is especially useful in eyes with shallow cups, as seen in myopic disks. While the optic disk has a shape that is oriented vertically, the optic cup shape is horizontally oval, with a horizontal diameter about 7% to 10% longer than the vertical.18 This discrepancy explains the shape of the neuro-retinal rim, which is thickest inferiorly and superiorly and thinnest nasally and temporally. A change in the optic cup shape from horizontal to vertical is the result of loss to the superior and inferior neuro- retinal disk rim seen in early glaucoma. Some of the high-tech devices place a high emphasis on CUP shape (contour) in the differentiation of nor- mal vs. abnormal cupping.
In addition to evaluation of cup shape in detec- tion of glaucoma, practitioners also evaluate cup depth, which depends on the cup area. Generally, the larger the optic cup, the greater its depth.28 Therefore, congenitally large disks (primary
macrodisks) are not only associ- ated with large cups, but also with deep cups. The exception to this is the large disk found in the high myopic eye with glaucoma; many of these cups remain very shallow, like their non-glauco- matous counterpart^.^ Cup depth also has some association with the type of glaucoma; eyes with traumatic glaucoma with angle recession and juvenile onset POAG reportedly have the deep- est ~ ~ p s . ~ ~ , ~ ~
Optic disk hemorrhages Optic disk hemorrhages are detected in less than 8% of patients with glaucoma31 (see Fig- ure 3) and have a greater associ- ation with NTG than other types
be missed (redarrow). of g l a ~ c o m a . ~ ~ , ~ ~ Optic disk hem- orrhages may also be caused by other etiologies, such as vascular
occlusive disease, Valsalva maneuvers, and optic disk drusen. In our clinical experience, optic disk hemorrhages in glaucoma-previously termed "Drance hemorrhagesn-are ephemeral, and hence only a fraction of their true number are ever observed.
Since optic disk hemorrhages occur in a small percentage of patients with glaucoma and can be associated with other etiologies, the presence of a disk hemorrhage alone is not a sufficient indicator of glaucoma, and has a low sensitiv- ity for the diagnosis of this disease. The pres- ence of an optic disk hemorrhage, along with other glaucomatous risk factors, however, should be viewed as an additional risk factor. Optic disk hemorrhage can also be perceived as a sign of progression in established cases of glaucoma.
Peripapillary chorioretinal atrophy Since the early 19001s, many investigators have reported observable peripapillary atrophy in glau- coma and have correlated the degree of atrophy with the degree of glaucomatous disk damage34 and field loss.35 The role of this feature as an indi- cator of glaucomatous damage to the optic nerve head, however, remains controversial. The atro- phy is basically divided into a central beta zone
VOLUME 75INUMBER 5/MAY 2004 OPTOMETRY

I S S U E H I G H L I G H T
and peripheral alpha zone36 (see Figure 4). Irregularities in pig- mentation and chorioretinal thinning characterize the outer alpha zone while visible sclera, retinal pigment epithelium (RPE) atrophy, and visibility of the choroidal vessels characterize the inner beta zone. While the alpha zone is present in almost all normal eyes, peripapillary atrophy of the beta zone is more likely to be indicative of glau- coma, occurring in less than 20% of normal patients.36 Peripapil- lary atrophy occurs more fre- quently in myopic disks and tilted disks, but this atrophy is generally localized temporal, superotemporal, and inferotem- poral to the optic nerve head, and rarely in the nasal peripap- m
Peripapillary atrophy in a glaucomatous disk in a patient wi th disk collaterals from an old illary region. These zones are Fiuure 4 veln occlusion.
reportedly larger36 in glaucoma- tous disks and can encircle the entire disk (the so-called "halo gl~ucomatosus") in Glaucoma causes nerve fiber layer damage via end-stage disease. Because these zones can exist localized defects, diffuse loss, or a combination in normal eyes, this feature, too, has a low dif- of the two. The localized defects occur in about ferential specificity. However, an enlargement in 20% of glaucoma patients38 and manifest as these two zones over time does sometimes dif- wedge-shaped dark areas that are widest further ferentiate glaucomatous from non-glaucomatous from the disk, coming to an apex at the edge of disease. the disk (see Figure 5). Notches in the neuro-reti-
nal rim tissue, optic disk hemorrhage (the cor-
Retinal nerve fiber layer evaluation responding RNFL defect appears 6 to 8 weeks after the onset of the hemorrhage), and/or peri-
The RNFL contains bundles of all the retinal gan- papillary atrophy may appear in the same sector dion axons gathered Mueller as the RNFL defect. Such defects have been processes. It is usually visible ophthalmoscopi- shown to be o p ~ t ~ a ~ m o s c o p ~ c a ~ ~ y visible after cally, but its presence can be better detected with 50% of the RNFL is lost.39 ~h~ other type of loss, the use of red-free filters and red-free photo- diffuse loss, results in a greater visibility and clar- graphs. In addition, some modern high-tech ity of the large retinal vessels and is more diffi- instruments have been designed cult to detect than focal loss. Since studies have assess this aspect of the retina, via confocal scan- demonstrated that the degree of RNFL loss tor-
laser tOmOg- relates well with the degree of optic disk damage raphy, and scanning laser polarimetry. The due to glaucoma,40~41 the RNFL must be carefully RNFL is thickest and most visible inferotempo- evaluated to avoid the over-diagnosis of glaucoma ral the disk, the in eyes with a large cup/large disk and the under- ral, nasal superior, and nasal inferior sector.37 diagnosis of glaucoma in eyes with a small Defects in the RNFL can occur in glaucoma, but cup/small disk. can also be associated with other diseases that cause optic neuropathy (e.g., disk drusen, toxo- plasmosis retinochoroiditis, optic pits, optic neu- Optic disk drusen ritis, compressive optic neuropathy, demyelinating Virtually ignored by both clinicians and researchers, disease, etc.). the relationship between disk drusen and glaucoma
O P T O M E T R Y V O L U M E 7 5 l N U M B E R 5 l M A Y 2004

ISSUE HIGHLIGHT
m [iuure 8 A wedgeshaped r e t i n h v e flber layer (RGL) defect i n g h u c o m is an example of locallzed RNFL loss.
nerve fiber layer loss. The arcuate scotoma and nasal step often found in eyes with disk drusen are essen- tially identical to the field deficits found in glaucoma.4z Although disk drusen do not necessarily prevent the development of cupping, they make the interpretation more dif- ficult." Patients with disk drusen often experience nerve fiber layer loss, greatly reducing the redun- dancy of the RNFL. Patients with disk drusen in whom glaucoma develops are, therefore, at greater risk of frank field defects earlier in the course of their disease process.
Optic nerve drusen or disk drusen are comprised of hyaline bodies with a mucolsrotein matrix nf
.-
I in approximately 2% of all eyes and generally progress throughout life. In our clinical experience, buried disk drusen in young children are often considered the most common cause of blurred disk borders
I (pseudopapilledema). Since disk drusen have an autosomal domi- A-
Fiuure 6 Top: Dlsk wi th optic nerve head drusen and no observable cup; Lower left B-scan ultra- sonography reveals an elevat~on above the disk (arrowl, and Lower right the elevation
nant inheritance pattern and sur-
perslsts at a lower sensitivity setting-a pattern typical of calcified optlc nerve drusen. face as age increases45 (see Figure 6) ,
V O L U M E 7 5 l N U M B E R 5 l M A Y 2004 OPTOMETRY

ISSUE H I G H L I G H T
examination of the child's parents often reveals frank disk drusen. Large surface disk drusen, which appear calcified ophthalmoscopically, are remarkably easy to document with B-mode ophthalmic ultrasonog- raphy. This procedure may c o n f i i the diagnosis because ultrasound reflections from calcified drusen (like bone) persist at low sensitivity levels (see Figure 6). Although disk drusen often appear to be calcified, not all disk drusen are calcified; thus, not all can be confirmed with ultrasonography. Disk drusen that are not calcified may also be more difficult to observe directly. Subtle or even occult (hidden) disk drusen are generally not diagnosed, but their presence often prevents observable cupping from being observed. This is to be expected when one considers that disk drusen sitting in an optic cup are like ice cubes fdl- ing up a glass. It is virtually impossible to determine the depth of a glass when something solid is filling it up. Likewise, instruments that measure disk topog- raphy-and the naked eye observing stereo disk pho- tographs-will also be unable to detennine the depth of the optic cup when solid masses such as drusen "fill it up."
The presence of disk drusen is the single most common cause of glaucoma without cupping.46 Disk drusen alone (or disk drusen along with glaucoma) often results in nerve fiber layer loss, as demonstrated by visual fields and/or objective instruments that measure RNFL thickness with a paradoxically normal-or even super-normal- disk topography (as demonstrated by objective instruments that measure optic disk topography). The combination of an abnormal nerve fiber layer (via visual fields and/or objective measurement of RNFL thickness) and a small cup (via stereo disk photographs and/or normal optic disk topography) strongly suggests the presence of disk drusen, which can be obvious, subtle, or occult.
Summary of optic newe head evaluation The degree of optic disk cupping is not necessarily indicative of the presence of glaucoma. When any patient with equivocal cupping in the presence or absence of demonstrated field loss is assessed, the most significant optic disk features to closely evaluate include, but are not limited to:
a. shape of the neuro-retinal rim b. relationship of cupldisk ratio to optic disk
size c. optic cup shape and depth d. decreased visibility of the RNFL and local-
ized RNFL defects e. presence of disk drusen
284
Standard of care vs. state-of-the-art in glaucoma diagnosis The decision faced by many clinicians regarding whether to commence treatment can be difficult, since the size of the cup is not always diagnos- tic. Likewise, the presence or absence of elevated intraocular pressures is not always diagnostic. Optic nerve head and peripapillary features require careful evaluation, although at times oph- thalmoscopic clues are lacking. Certainly, the deci- sion becomes easier as the patient is followed over time, when the clinician has had an opportunity to make observations of changes in the cupping and decreases in the rim tissue. Diagnosis is also less equivocal when field defects begin to appear and when IOPs demonstrate an increas- ing trend. However, when observing a patient for the first few visits, treatment decisions may not be obvious. While many clinicians realize this, cases of under- and over-diagnosis of this dis- order are encountered frequently. While some clinicians prefer to err on the side of over- treating-assuming they are less likely to expe- rience litigious consequences in the future-there are financial considerations, as well as quality of life issues, for some patients-especially those who experience side effects from medications they may not need. Furthermore, while results of the Ocular Hypertensive Treatment Study (OHTS) have helped clinicians reconsider treat- ing certain ocular hypertensive patients, nor- motensive glaucoma patients continue to be under-diagnosed until a significant increase in cupping flags the clinician's attention.
Standard of care testing in glaucoma Standard of care testing-namely, static automated perimetry-continues to be the mainstay of deter- mining functional loss in glaucomatous disease. Its value in following disease progression is unquestionable. However, as an aid in the detection of early glaucoma, perimetry falls short in some instances. This is especially true of the patient whose field loss is inconsistent from visit to visit, whose field loss falls outside of the cen- tral 30 degrees, whose field loss is not considered "glaucomatous," and/or who fails to demonstrate field loss despite the presence of other risk fac- tors (elevated IOP, strong family history, suspi- cious cupping, and RNFL loss).
Manufacturers of automated perimeters have attempted to improve the ability of the practi- tioner to detect glaucoma earlier. The develop-
-
OPTOMETRY VOLUME 75lNUMBER 5lMAY 2004
ISSUE HIGHLIGHT
ment of short wavelength automated perimetry (SWAP) and frequency doubling technology (FDT) have opened new avenues for early diag- nosis. SWAP is based on the hypothesis that there is less redundancy in the color vision pathway than the luminance pathway. Therefore, a blue stimulus against a yellow background is testing a narrower population of cells and should theo- retically be affected first in early disease. The high sensitivity of SWAP in early detection of glaucoma has been reconfirmed in a study of 500 eyes of 250 ocular hypertensive patients.47 FDT taps into the motion detectors in the visual pathway, which are believed to be affected in early glaucoma. The potential for FDT to be used as a screening method in glaucoma detection has been docu- mented.48
Perimetry remains the single, most important functional test to identify not only glaucoma, but also retinal, optic nerve, and visual pathway dis- orders. Unlike perimetry, tests that determine structural integrity of the disk and RNFL are not likely to alert the practitioner to suspect intracra- nial tumors and other brain disorders that affect the temporal, parietal, and occipital lobes.
Although perimetry has widespread applications, at least four factors limit its clinical utility:
1. Redundancy of retinal ganglion cells which result in normal visual fields in many cases until half of the ganglion cells and their axons are lost.
2. Speed; visual-field testing can never furnish more than one bit of information per second because visual-field testing is limited by the patient's speed in pressing the button.
3. Subjectivity of perimetry. 4. Incomplete testing of the visual field, in
that not all retinal points are tested.
State-of-the-art the role of high-tech devices Over the past several years, there has been an explosion of new technologies that are particularly well-suited for the diagnosis and management of glaucoma. Collectively, these devices were designed to provide objective evidence of abnor- malities in disk topography and/or nerve fiber layer thinning, and retinal thickness. Designed for in-office use by the clinician, they vary in their user-accessibility, ease of interpretation, and affordability. A primary, common goal of these technologies is the early detection of structural abnormalities that precede functional loss
(i.e. ,normal visual fields). All the high-tech devices have added a new and exciting dimension to glaucoma detection. They are objective as opposed to subjective, they are fast (65,000 bits of information are acquired in less than one sec- ond with several of the high-tech devices), and hundreds of thousands of data points are col- lected, in contrast to the limited number of points in visual-field testing. However, the practitioner must recognize the limitations of some of these instruments, as well as the importance of obtain- ing good quality images, and use all clinical data available when interpreting the findings.
What do these devices offer and how accurate are they? What information do they add to diagno- sis and management of glaucoma and other optic neuropathies? Does this information justify the cost? What are the shortcomings?
HRT 11 Some practitioners claim that a good set of stereo disk photographs is all that an astute clinician needs to detect a glaucomatous disk. However, evaluation and interpretation of disk photographs is subject to inter-clinician ~ a r i a b i l i t y . ~ ~ ~ ~ ~ It is par- ticularly difficult to quantify topographical attributes of the optic nerve head from stereo pho- tographs. A clinician's only quantitative meas- urement when evaluating an optic nerve head is an estimate of the C/D ratio to the nearest 5%, with N f 5% inter-observational accuracy. An accurate quantification of topographical features offers the ophthalmic clinician a means of detect- ing slow and subtle change.
The HRT I1 (Heidelberg Retinal Tomograph-Hei- delberg Engineering, Inc., Carlsbad, California) is a commercially available confocal scanning laser ophthalmoscope that uses a 670-nm red-diode laser source to provide real-time three-dimen- sional images and measurements of optic disk topography and RNFL. This is accomplished with- out pupil dilation or ocular contact. Three series of scans are captured in quick succession and then averaged. Image quality is assessed by the standard deviation or variability between the three scans. Stereometric parameters of disk topography are measured in detail. The "top five" parameters (as reported by Heidelberg Engi- neering) are: rim area, rim volume, cup shape measure, height variation contour, and RNFL thickness. Mean RNFL "thickness" is measured at the disk border using an artificial reference
VOLUME 75lNUMBER 5lMAY 2004 OPTOMETRY

ISSUE H I G H L I G H T
Figure 7 HRT II quantifies various parameters of disk topography (on the bottom left) and compares these values against the normative database in the analysis (on the right). Areas in red represent the cup; green represents the neuroretinal rim. The superior temporal neuroretinal rim is flagged as borderline (yellow exclamation point) and the superior, nasal, and inferior temporal neuroretinal rim are flagged as outside normal limits (red ic).
. , \ . &finer-dl . I lHElOELBErG zEg!L ~~ P a h t
':8ax:nuk DOB: Pet-ID: - - ,[kLw-
scmx
0s ~ c ~ ~ o . ~ d p I Dep(h:3.25mm opmlocjs
*M Ztnrnl ~Bnm) 0.4 0.8 1.2 1.0 Z.4 1, 51 40 440.0 0.4 0.8 1.2 1.0 QO 04 Q. (1 1 1 26 24 21 5 2 4 0
M 0.0 , 3 0 . 4
w - 0.8
11 -12 . 11 -1.0 .
Em - 2.0i, -2.4- '
2.8.
I P . !
-3.8 . ,
,'*O . a.a - . . .
~ C I n ~ , 6) o r n ~ n ; r .. - 4 4 4 4 . , .
. . - 0 0 I- . - . - - - - g?-"--wr -. . - - 0 4 3
n
3 0.8 - - 0 8
I - : .:\, I
$2 - . * . - 1 2 1
0.0 0.4 0.0 12 1.8 2.0 2.4 2.8 3.2 U 4.0 0 90 1 s 180 . 22S Pm 315 300
- x M no*, #'
* --- mw 2200 e -7=r I I mDm C y k r 1.- mm' m' 1.001 m'
~ym aza- km a m - - 1-1
- 'c*r#rurm a m ~r L J L
plane located 50 microns beneath the retinal sur- is used to differentiate optic nerve head cup from face of the papillomacular bundle (at the temporal neuro-retinal rim. Of the top five parameters, cup aspect of the disk border). The reference plane shape measure has been shown to have the best
I .
L j >
6 -.
. ' - .>
r Y - < + ,
286
OPTOMETRY VOLUME 75lNUMBER 51MAY 2004
m-ru o r - --- -4-
n r y r r n a r r l ~ 1 -
-Ow-- ILkr*.IyIcL
-Yolr
a7ro a m - amnm am am2rrr awsnn 401laW adlnr s r .
L Y - U U I - . ~
---lk.
, >
, I r 1, r, r . - 3 -
, 3.. ,A < , I
.m.J.rJMl-:
* ~ n a r m J Y m Y s O - 0 ~ ~ - 1 ~ 1 0 5 W 7 ~ 1 ~
C * r . d n M a m V b p h l l r U * m p m & m

ISSUE HIGHLIGHT
diagnostic p r e ~ i s i o n . ~ ~ Six equal sectors of the neuro-retinal rim are evaluated and compared (corrected for age) against the instrument's nor- mative database, which consists of approximately 200 whites. Sectors are assigned a green check mark if the RNFL and rim are within the pre- dicted range; a yellow exclamation mark if they are borderline; and a red "x" if they are outside normal limits. This six-sector evaluation uses Mooresfields Regression Analysis, a linear regres- sion analysis that has been demonstrated to have a sensitivity of 93.5% and specificity of 88.4%.52 All the parameters are globally analyzed and the patient's overall topographic results are catego- rized as "normal," "borderline," or "outside nor- mal limits" (see Figure 7).
This technology has some analytical shortcom- ings: without providing for racial variation in the normative database, Hispanics and blacks- whose disks and C/Ds tend to be larger than those of whites-tend to be flagged as "outside normal limits," even if they are physiologically sound. Furthermore, small to minimal cupping is con- sistently classified as "normal," requiring that the clinician carefully consider other findings (e.g., myopia, blurred disk borders, etc.), so as not to miss the glaucomatous disk with small cups.
This technology may prove to be most useful in helping the clinician determine the progression of cupping and other topographical changes over time, rather than flagging an abnormal disk at an initial visit. A progression change probability analysis and trend analysis are used to monitor any change over time (see Figure 8).
GDxVCC The GDxVCC (Laser Diagnostics Technology, Inc., San Diego, California) is a scanning laser polarimeter that indirectly measures the thickness of the RNFL using a near-infrared laser. GDx makes use of the principle of birefringence of the RNFL as an indirect indicator of its thickness. Because the RNFL is a lamellar structure, con- sisting of parallel layers, it will regularly and pre- dictably slow (retard) the speed at which polarized light passes through it. The thicker the RNFL, the greater is the retardation or birefrin- gence. RNFL thickness is analyzed over a "meas- urement circle," with an inner radius 1.2 mm from the center of the disk, extending outward 20 degrees. Since the disk is never assessed, this
instrument is completely independent of any disk parameters.
The device performs a scan in 0.7 seconds and the analysis takes about 1 minute per eye. Nei- ther pupil dilation nor corneal contact is required. Image quality is assessed on a scale from 1 to 10, with 10 being the best. The printout contains parameter summary measures, which include the TSNIT (Temporal, Superior, Nasal, Inferior, Temporal) average of RNFL thickness and inter- eye symmetry. These and other parameters are statistically compared to normative data, corrected for age and race. The technology's normative database consists of 600 patients (70% whites and Hispanics, 12% Asians, and 18% blacks).
Abnormal data are depicted in red on the print- out, along with the probability values depicting the degree of statistical significance. In addition, all the data are globally summated in the form of a Nerve Fiber Indicator (NF1)-formerly called "The Number" in an earlier version of this instru- ment. The NFI, which will be anywhere from 1 to 100, is a mathematical construct based on an algorithm that was trained to differentiate normal subjects from patients with glaucoma, using a combination of summary data and raw data points. Generally, a number less than 30 is con- sidered to be normal, numbers between 31 and 50 are considered highly suspicious of RNFL loss, and numbers above 50 are indicative of signifi- cant RNFL loss. The numbers assigned to all of these parameters are also valuable for the deter- mination of change over time. All measurements are independent of disk topography. An additional feature of the most recent version of the GDxVCC includes a deviation plot, which depicts the statistical significance of abnormal points in the RNFL measured 0.6 degrees apart superior and inferior to the optic nerve (see Fig- ure 9). The instrument also incorporates a pro- gram to analyze progression over time. Areas in the thickness map that are depicted in blue over time are indicative of statistically significant RNFL loss (see Figure 10).
A shortcoming of the first iteration of this tech- nology was that other lamellar structures in the eye (e.g., the cornea) affected these measure- ments-some to a greater degree than others. Since the cornea is a primary contributor of birefringence in the eye, a corneal compensator had to be incorporated to cancel out the
VOLUME 75/NUMBER 5/MAY 2004 OPTOMETRY

ISSUE HIGHLIGHT
?
-k.cIw w 4 4 m 4 4 8 - a / - - - . - . ' . . .OYlnr l . I * Y b d - . . . . 9- A= a a u d w-
r .IL.lrr am1 4 M d 1'. I. -a- m . 1. arswhrw ao, aim
-arraUm U O U W - - ---a L , . I
I . klY'-."' am *OM
* O y ) a8M am?- : . --- am
ar-- arnarrr --̂ am4 Q I I - I I + - am# d m 4 R
. .
. O . r ' h 1.m am#& I .
. . 111~nr- r a m - , .. . - - r*, m:manamw
--nomwi-C) P)---'-'---'-.--m --'-c-'L
-
Allre 8 Progression analysis on the HUT11 The area an red denotes stat~stcally s ~ g n f ~ c a n t loss an the anferaor neuroret~nal rlm over tame (redarrowj
corneal birefringence from the total measure- cel birerefringence from all corneas). A vari- ments. The original compensator was "fixed," able compensator (GDxVCC) has replaced the (i.e., it did not change position and did not can- fixed compensator. It initially measures each 288
OPTOMETRY VOLUME 75lNUMBER 5lMAY 2004

I S S U E H I G H L I G H T
. . . . . . . . . . . '. . '. . '. '. .. Fiber Analysis : ": :. '. -,:
wmfucu-- . .
Figure 8 The GDxVCC display The thickness maps (red arrow) reveal retinal nerve fiber layer (RNFL) thinning in both eyes-greater left eye. The deviat~on plot (yellowarrow) denotes statistically significant RNFL attenuation in both eyes-greater left eye. The TSNlT (Temporal. Superior, Nasal. Inferior, Temporal) curve (blue arrow) is reduced in both eyes-greater in left eye. The Nerve Fiber Indicator is 48 right eye and 77 left eve, both abnormal.
individual patient's cornea and adjusts the istic (ROC) curve of 0.95 for the NFI, with a compensator accordingly to cancel out the sensitivity of 90% and a specificity of 91%.53 corneal birerefringence from that eye. Data In our clinical experience, reproducibility of accumulated so far on 390 normals and 253 measurements in both normal and glaucoma patients with glaucoma have demonstrated an patients appears to be within 2 to 4 microns for area under the Receiver Operator Character- all parameters.
289
V O L U M E 7 5 l N U M B E R 5 / M A Y 2004 O P T O M E T R Y

I S S U E H I G H L I G H T
Fijure 10 Progression analysis on the GDxVCC Areas of progressive retinal nerve fiber layer loss over a 3Xyear period in this patient are depicted in blue (yellow arrow).
Stratus O C l l M (OCT 3) posed axial A scans that approximate a cross-sec- Optical Coherence Tomography /Stratus OCT, iion of the retina and opiic nerve head. Images Carl Zeiss Meditec Inc., Dublin, California) uses are obtained through an undilated pupil with no a superluminescent diode laser light that is scat- corneal contact. The quality of resolution tered, reflected, and absorbed by retinal tissue. allows the differentiation of 7 to 8 retinal layers The resultant image is up of many juxta- in this latest clinically available version of the 290
O P T O M E T R Y V O L U M E 7 5 l N U M B E R 5 l M A Y 2004

I S S U E H I G H L I G H T
. . . . . . .
Fiuure 11 A, Stratus OCT ONH Topography: On the left, the display demonstrates a cross-section through the disk (6 to 12 o'clock) and parameters of disk topography in this patient. On the upper right, the cup is depicted in green and the disk is depicted in red Below these displays are quantified disk parameters. B, Stratus OCT RNFL Thickness Analysis: On the left side, average RNFL thickness around the optic nerve head, in a circular area 3.4 mm in diameter, is displayed in a TSNlT curve (Temporal, Superior, Nasal, Inferior, Temporal) for each eye. On the right side, average thickness is displayed in 12 o'clock-hour sectors and in four quadrants for both eyes. The black curve represents the patient's RNFL thickness, which is below the normative database in this case. Areas depicted in green are within 95% of the normative database for that age group, areas in yellow in between 1 % and 5% of the normative database, and any areas in red lie below 1% of the normative database.
2 9 1
V O L U M E 7 5 l N U M B E R 5 l M A Y 2 0 0 4 O P T O M E T R Y

I S S U E H I G H L I G H T
Olaucoma - Analysis
nation Date: 211031
Filure 12 A. The Retinal Thickness Analyzer (RTA) optic nerve head topography display. The cup is depicted in red and the neuroretinal rim in green (upper halfl. Various optic nerve head parameters are noted in the lower half of the display. B (on facing page), The RTA measures retinal thickness at the macula. Retinal thinning due to ganglion cell loss may be a sign of early glaucoma. Areas in blueon the deviation map represent statistically significant areas of retinal thinning (blue arrow).
OCT, including the RNFL. The OCT was origi- nally developed to detect structural abnormal- ities in the macula, not readily apparent on ophthalmoscopy, such as various stages of macular holes, cysts, cystoid macular edema, central serous choroidopathy, etc. An additional feature of the Stratus OCT is the ability to obtain quantitative measurements of optic disk topog-
raphy and RNFL thickness. A series of 4-mm long radial line scans at 12 clock hours across the disk allows topographic measurement of disk parameters (see Figure 11, A ) . The instrument objectively finds the margin of the disk, using a signal from the end of the retinal pigment epithelium. Disk parameters that are measured include cup volume, disk, cup and rim area, and
O P T O M E T R Y V O L U M E 7 5 l N U M B E R 5 l M A Y 2004

ISSUE HIGHLIGHT
cupldisk ratios. To determine RNFL thickness, a circular scan of 3.4-mm diameter is centered on the optic nerve head and a peripapillary cross-sectional image is obtained and displayed as a TSNIT curve (see Figure 11, B).
'Itvo recent developments in this technology include the establishment of a normative data-
base to establish reference values in a normal population and software that allows the assess- ment of image quality. The normative database was obtained by evaluating the RNFL thickness measurements in an ethnically wide variety of 410 subjects (60% white, 27% Hispanic, 8% black, 3% Asian, 2% other), from which 328 qualified scans were obtained.54 Evaluating the
2 9 3
VOLUME 75lNUMBER 5IMAY 2004 OPTOMETRY

ISSUE H I G H L I G H T
signallnoise ratio after obtaining an image assesses the image quality. Clinical experience has demonstrated good reproducibility when the RNFL is normal or mildly reduced. However, the technology currently appears to have difficulty when the RNFL is very thin, and an error mes- sage is generated that the data is sub-optimal for analysis.
The Retinal Thickness Analyzer The Retinal Thickness Analyzer (RTA-Talia Technology, Newe-Ilan, Israel) is a digitized laser slit-lamp that makes use of a helium-neon laser (543-nm wavelength) as a light source. The instru- ment measures retinal thickness using a beam splitter that splits the incoming light into two sep- arate beams. One beam is reflected off the reti- nal pigment epithelium (RPE) and the other reflects off the internal limiting membrane (ILM). The difference between these two reflec- tions is a measurement of the retinal thickness at that point. The RTA was originally developed for the objective detection of retinal thickening, as seen in clinically significant macular edema (CSME) in diabetic r e t in~pa thy .~~ Currently, the RTA has added software to create a topographi- cal map of the optic nerve head. It maps out a two-dimensional rimlcup area map with hori- zontal and vertical cross-sectional graphs, a disk area image, RNFL cross-section (TSNIT Curve), and a three-dimensional topography map of the optic nerve (see Figure 12). The RNFL thickness is determined by measuring retinal thickness in the macula, since the paracentral RNFL is believed to be affected early in glaucoma. In a study of 10 normal patients comparing the RTA measurements with HRT I1 measurements, the mean cup depth, mean RNFL thickness, and cross-sectional area were significantly smaller on the RTA than the HRT 11, but the reproducibility was not significantly different between instru- m e n t ~ . ~ ~
When using this technology, the pupil must be a minimum of 6 mm, usually requiring dilation. In addition, images may be difficult to obtain in eyes with media opacities or in pseudophakia. The RTA measures retinal thickness but does not selectively evaluate the RNFL. Since it meas- ures total retinal thickness, a diabetic patient having macular CSME (resulting in retinal thick- ening) and glaucoma (resulting in retinal thin- ning) could conceivably end up with a normal retinal thickness in the macula. Based on the
fact that 40% of the RNFL ganglion cell bodies are in the central 20 degrees, the RTA is designed to detect early glaucoma by evaluat- ing retinal thickness around the macula. Although there is a substantial population of ganglion cell bodies in the macula, the RNFL in this region is actually very thin, perhaps only 10% of its thickness around the optic nerve head. Any detected loss in retinal thickness in the macula is due, therefore, to loss of ganglion cell bodies, not RNFL loss.
Although the RTA, like the HRT 11, can generate a TSNIT curve around the disk, both are really topographical curves and not true thickness curves. In contrast, the GDxVCC and Stratus OCTTM generate TSNIT curves around the optic disk that are based on RNFL thickness. Moreover, both latter technologies theoretically measure all the RNFL and not just the RNFL in the macula.
Summary The clinician is not challenged by the clear-cut cases of glaucoma and non-glaucoma. But a dis- ease whose presentation has such a broad over- lap with the normal population necessarily creates a confounding "gray" area into which glau- coma suspects are lumped, until further evidence either affirms or negates their status. The diag- nosis of glaucoma is complicated in these equiv- ocal cases. The careful assessment of various optic nerve head features-apart from cupping-is help- ful in the correct classification of such patients. In cases in which optic nerve head assessment is not decisive, the high-tech instruments available today provide a valuable adjunct with the objec- tive assessment of optic nerve head and RNFL structure.
Disclaimer Neither Dr. Sherry J. Bass nor Dr. Jerome Sherman has any financial or propri- etary interest in any of the companies mentioned in this article.
References 1 Kass MA, Heuer DK, Higginbotham EJ, et al. The Ocu-
lar Hypertension Treatment Study: a randomized trial determines that topical ocular hypotensive medication delays or prevents the onset of primary open-angle glau- coma. Arch Ophthalmol2002;120:701-13.
2. Jonas JB, Wido MB, Panda-Jonas S. Ophthalmoscopic evaluation of the optic nerve head. Sun, Ophthalmol 1999; 43:293-320.
3. Caprioli J, Miller JM. Optic disk rim area is related to disk size in normal subjects. Arch Ophthalmol 1987;105:1683-5.
OPTOMETRY VOLUME 75lNUMBER 5lMAY 2004

ISSUE HIGHLIGHT
4. Jonas JB, Schmidt AM, Muller-Bergh JA, et al. Human optic nerve fiber count and optic disc size. Invest Oph- thalmol Vis Sci 1992;33:2012-8.
5. Beck RW, Savino PJ, Repka MX, et al. Optic disk struc- ture in anterior ischemic optic neuropathy. Ophthalmol- ogy 1984;91:1334-7.
6. Jonas JB, Gusek GC, Guggenmoos-Holtzman I, et al. optic nerve head drusen associated with abnormally small optic disks. Int Ophthalmol 1987; 11:79-82.
7. Jonas JB, Gusek GC, Guggenmoos-Holtzman I, et al. Pseudopapilledema associated with abnormally small optic disks. Acta Ophthalmol 1988;66:190-3.
8. Martin MJ, Sommer A, Gold EB, et al. Race and primary open-angle glaucoma. Am J Ophthalmol 1985;99:383-7.
9. Jonas JB. Size of glaucomatous optic discs. Ger J Oph- thalmol 1992;1:41-4.
10. Jonas JB, Gusek GC, Naumann GOH. Optic disk mor- phometry in chronic primary open-angle glaucoma: I. Morphometric intrapapillary characteristics. Graefes Arch Clin Exp Ophthalmol 1988;226:522-30.
11. Jonas JB, Dichtl A, Budde WM, et al. Optic disc mor- phology in pigmentary glaucoma. Br J Ophthalmol 1998; 82:875-9.
12. Jonas JB, Mardin CY, Schlotzer-Schrehardt U, et al. Mor- phometry of the human lamina crobrosa surface. Invest Ophthalmol Vis Sci 1991;32:401-5.
13. Jonas JB, Fernandez, MC, Naumann GOH. Correlation of optic disc size to glaucoma susceptibility. Ophthalmology 1991;98:675-80.
14. Jonas JB, Sturmer J, Papastathpoulos KI, et al. Optic disc size and optic nerve damage in normal-pressure glau- coma. Br J Ophthalmol 1995;79: 1102-5.
15. Jonas JB, Kling F, Grundler AE. Optic disc shape, corneal &tig&atism and amblyopia. ~phthalmology- 1997; 104: 1934-7.
16. Jonas JB, Papastathopoulos KI. Optic disc shape in glau- coma. Graefes Arch Clin Exp Ophthalmol1996;234(Suppl 1): S167-173.
17. Jonas JB, Gusek GC, Naurnann GOH. Optic disc, cup and neuroretinal rim size, configuration, and correlations in normal eyes. Invest Ophthalmol Vis Sci 1988;29: 1151-8. Correction: Invest Ophthalmol Vis Sci 1991;32:1893.
18. Jonas JB, Fernandez M, Sturmer J. Pattern of glaucoma- tous neuroretinal rim loss. Ophthalmology 1993;100:63-7.
19. Trobe JD, Glaser JS, Cassady J, et al. Nonglaucomatous excavation of the optic disc. Arch Ophthalmol 1980;98: 1046-50.
20. Douglas GR, Drance SM, Schulzer M. The visual field and nerve head in angle closure glaucoma. Arch Oph- thalmol 1975;93:409-11.
21. Sonty S, Schwartz B. Development of cupping and pal- lor in posterior ischemic optic neuropathy. Int Ophthal- mol 1983;6:213-20.
22. Danesh-Meyer HV, Savino PJ, et al. The prevalence of cup- ping in end-stage arteritic and non-arteritic anterior ischemic optic neuropathy. Ophthalmology 2001;108:593-8.
23. Jonas JB, Fernandez MC, Naumann GOH. Glaucomatous optic nerve atrophy in small discs with low cup-to-disc ratios. Ophthalmology 1990;97: 121 1-5.
24. Frisen L, Claesson M. Narrowing of the retinal arterioles in descending optic atrophy: a quantitative clinical study. Ophthalmology 1984;91:1342-6.
25. Papastathopoulos KI, Jonas JB. Focal narrowing of reti- nal arterioles in optic nerve atrophy. Ophthalmology 1995;102:1706-11.
26. Anderson DR. Correlation of the peripapillary damage with the disc anatomy and field abnormalities in glau- coma. Doc Ophthalmol Proc Ser 1983;35: 1-10.
27. Fernandez MC, Jonas JB, Naumann GOH: Parapapillare chorioretinale Atrophie in Augen mit flacher glauko- matoser Papillenexkavation. Fortschr Ophthalmol 1990; 87:457-60.
28. Jonas JB, Zach F-M, Gusek GC, et al. Pseudoglaucoma- tous physiologic large cups. Am J Ophthalmol 1989; 107: 137-44.
29. Caprioli J. Correlation between disc appearance and type of glaucoma. In: Varma R, Spaeth GL, eds. The optic oewe in glaucoma. Philadelphia: Lippincott, 1993:91-8.
30. Jonas JB, Grundler AE: Optic disc morphology in juve- nile primary open-angle glaucoma. Graefes Arch Clin Exp Ophthalmol 1996;234:750-4 .
31. Healy PR, Mitchell P, Smith W, et al. Optic disc hemor- rhages in a population with and without glaucoma. Oph- thalmology 1998;105:216-23.
32. Drance SM. Disc hemorrhages in the glaucomas. Suw Ophthalmol 1989;33:331-7.
33. Gloster J. Incidence of optic disc hemorrhages in chronic simple glaucoma and ocular hypertension. Br J Oph- thalmol 1981;65:452-6.
34. Jonas JB, Naumann GOH. Peripapillary chorio-retinal atrophy in normal and glaucoma eyes: 11. Correlations. Invest Ophthalmol Vis Sci 1989;30:919-26.
35. Heijl A, Samander C. Peripapillary atrophy and glauco- matous visual defects. Doc Ophthalmol Proc Ser 1985;42: 403-7.
36. Jonas JB, Nguyne XN, Gusek GC, et al. The peripapil- lary chorio-retinal atrophy in normal and glaucoma eyes: I. Morphometric Data. Invest Ophthalmol Vis Sci 1989;30: 1599-603.
37. Jonas JB, Nguyen NX, Naumann GOH, The retinal nerve fiber layer in normal eyes. Ophthalmology 1989;96:627-32.
38. Jonas JB, Schiio D, Localized wedge-shaped defects of the retinal nerve fiber layer in glaucoma. Br J Ophthalmol 1994;78:285-90.
39. Quigley HA, Addicks EM. Quantitative studies of retinal nerve fiber layer defects. Arch Ophthalmol 1982;100:807-14.
40. Airaksinen PJ, Drance SM, Neuroretinal rim area and RNFL in glaucoma. Arch Ophthalmol 1985; 103:203-4.
41. Airaksinen PJ, Drance SM, Douglas GR, et al. Diffuse and localized nerve fiber layer loss in glaucoma. Am J Oph- thalmol 1984;98:566-71.
42. Auw-Haedrich C, Staubach F, Witschel H. Optic disk drusen. Suw Ophthalmol2002;37:515-32.
43. Samples JR, van Buskirk M, Shults WT, et al. Optic nerve head drusen and glaucoma. Arch Ophthalmol 1985;103: 1678-80.
44. Boyce SW, Platia EV, Green WR. Drusen of the optic nerve head. Ann Ophthalmol 1978; 10:695-704.
45. Savino PJ. Neuro-ophthalmology. In: Tasman W, Jaeger EA, eds. The Wills Eye Hospital Atlas of Clinical Oph- thalmology. Philadelphia: Lippincott-Raven, 1996:290-1.
46. Roth JM, Bass SJ, Nath S, et al. Optic nerve head drusen mask glaucomatous cupping. ARVO 2003, Abstract 642.
47. Dernirel S, Johnson CA. Incidence and prevalence of short wavelength automated perimetry deficits in ocular hyper- tensives. Am J OphthaImol2001; 131:709-15.
48. Quigley HA. Identification of glaucoma-related visual field abnormality with the screening protocol of fre- quency doubling technology. Am J Ophthalmol 1998; 125:819-29.
VOLUME 75lNUMBER 5IMAY 2004 OPTOMETRY

ISSUE HIGHLIGHT
49. Sung VC, Bhan A, Vernon SA. Agreement in assessing optic discs with a digital stereoscopic optic disc camera (Discam) and Heidelberg retina tomography. Br J Oph- thalmol2002;86: 196-202.
50. Spalding JM, Litwak AB, Shufelt CL. Optic nerve evalu- ation among optometrists. Optom Vis Sci 2000;77:446-52.
51. Uchida H, Brigatti L, Caprioli J. Detection of structural damage from glaucoma with confocal laser image analy- sis. Invest Ophthalmol Vis Sci 1996;37:2393-401.
52. Wollstein G, Garway-Heath DF, Hitchings RA. Identi- fication of early glaucoma cases with the scanning laser ophthalmoscope. Ophthalmology 1998; 105: 1557-63.
53. Sinai MJ, Zhou Q. Diagnostic utility of the GDxVCC. Comparison between normals and glaucoma patients using ROC analysis. Invest Ophthalmol Vis Sci 2003;Suppl: 3402)
54. Patella V. STRATUSOCT Establishment of normative ref- erence values for retinal nerve fiber layer thickness meas- urements. In press.
55. Zeimer R, Shahidi M, Mori M, Zou S, Asrani S. A new method for rapid mapping of the retinal thickness at the posterior pole. Invest Ophthalmol Vis Sci 1996;37:1994- 2001.
56. Itai N, Tanito M, Chihara E. Comparison of optic disc topography measured by retinal thickness analyzer with measurement by Heidelberg Retina Tornograph 11. Jpn J Ophthalmol 2003;47:214-20.
Corresponding author:
Sherry J. Bass, O.D. SUNY State College of Optometry
33 West 42nd Street New York, New York 10036
296
OPTOMETRY VOLUME 75lNUMBER 5lMAY 2004


![Diagnosticos de Fin de Siglo [Molloy]](https://static.fdocuments.in/doc/165x107/553433694a7959dc528b4af8/diagnosticos-de-fin-de-siglo-molloy.jpg)