Crime in the San Diego Region Mid-Year 2018 Statistics€¦ · CJ Bulletin - Crime in the San Diego...
17
CJbulletin 401 B STREET, SUITE 800 | SAN DIEGO, CA 92101-4231 | T (619) 699-1900 | F (619) 699-6905 | SANDAG.ORG/CJ Crime in the San Diego Region Mid-Year 2018 Statistics SEPTEMBER 2018
Transcript of Crime in the San Diego Region Mid-Year 2018 Statistics€¦ · CJ Bulletin - Crime in the San Diego...
CJbulletin
401 B STREET, SUI TE 800 | SAN DIEGO, CA 92101-4231 | T (619 ) 699-1900 | F (619) 699-6905 | SANDAG. ORG/CJ
Crime in the San Diego Region Mid-Year 2018 Statistics
SEPTEMBER 2018
C J B u l l e t i n - C r i m e i n t h e S a n D i e g o R e g i o n M i d - Y e a r 2 0 1 8 S t a t i s t i c s 2
BOARD OF DIRECTORS
The 18 cities and county government are SANDAG serving as the forum for regional decision-making.
SANDAG builds consensus; plans, engineers, and builds public transit; makes strategic plans; obtains and allocates resources; and provides information on a broad range of topics pertinent to the region’s quality of life.
CHAIR Hon. Terry Sinnott
VICE CHAIR Hon. Steve Vaus
CHIEF DEPUTY EXECUTIVE DIRECTOR Kim Kawada
CITY OF CARLSBAD Hon. Matt Hall, Mayor (A) Hon. Keith Blackburn, Mayor Pro Tem (A) Hon. Mark Packard, Councilmember
CITY OF CHULA VISTA Hon. Mary Salas, Mayor (A) Hon. Steve Padilla, Councilmember (A) Hon. John McCann, Councilmember
CITY OF CORONADO Hon. Richard Bailey, Mayor (A) Hon. Bill Sandke, Councilmember (A) Hon. Carrie Downey, Councilmember
CITY OF DEL MAR Hon. Terry Sinnott, Councilmember (A) Hon. Ellie Haviland, Councilmember (A) Hon. Dave Druker, Deputy Mayor
CITY OF EL CAJON Hon. Bill Wells, Mayor (A) Hon. Steve Goble, Councilmember
CITY OF ENCINITAS Hon. Catherine Blakespear, Mayor (A) Hon. Tony Kranz, Councilmember (A) Hon. Tasha Boerner Horvath, Councilmember
CITY OF ESCONDIDO Hon. Sam Abed, Mayor (A) Hon. John Masson, Councilmember (A) Hon. Ed Gallo, Councilmember
CITY OF IMPERIAL BEACH Hon. Serge Dedina, Mayor (A) Hon. Mark West, Mayor Pro Tem (A) Hon. Robert Patton, Councilmember
CITY OF LA MESA Hon. Kristine Alessio, Councilmember (A) Hon. Bill Baber, Councilmember (A) Hon. Colin Parent, Councilmember
CITY OF LEMON GROVE Hon. Racquel Vasquez, Mayor (A) Hon. Jerry Jones, Mayor Pro Tem (A) Hon. Jennifer Mendoza, Councilmember
CITY OF NATIONAL CITY Hon. Ron Morrison, Mayor (A) Hon. Alejandra Sotelo-Solis, Councilmember (A) Hon. Mona Rios, Councilmember
CITY OF OCEANSIDE Hon. Chuck Lowery, Deputy Mayor (A) Hon. Jerry Kern, Councilmember (A) Hon. Jack Feller, Councilmember
CITY OF POWAY Hon. Steve Vaus, Mayor (A) Vacant (A) Hon. John Mullin, Councilmember
CITY OF SAN DIEGO Hon. Kevin Faulconer, Mayor (A) Hon. Lorie Zapf, Councilmember (A) Hon. Chris Cate, Councilmember Hon. Myrtle Cole, Council President (A) Hon. Barbara Bry, Councilmember (A) Hon. Georgette Gomez, Councilmember
CITY OF SAN MARCOS Hon. Jim Desmond, Mayor (A) Hon. Chris Orlando, Councilmember (A) Hon. Kristal Jabara, Councilmember
CITY OF SANTEE Hon. John Minto, Mayor (A) Hon. Ronn Hall, Councilmember (A) Hon. Rob McNelis, Vice Mayor
CITY OF SOLANA BEACH Hon. David A. Zito, Mayor (A) Hon. Jewel Edson, Deputy Mayor (A) Hon. Lesa Heebner, Councilmember
CITY OF VISTA Hon. Judy Ritter, Mayor (A) Hon. John Aguilera, Councilmember (A) Hon. Amanda Rigby, Councilmember
COUNTY OF SAN DIEGO Hon. Bill Horn, Supervisor (A) Hon. Dianne Jacob, Supervisor (A) Hon. Kristin Gaspar, Chair Hon. Ron Roberts, Supervisor (A) Hon. Greg Cox, Supervisor (A) Hon. Kristin Gaspar, Chair
ADVISORY MEMBERS IMPERIAL COUNTY Hon. John Renison, Supervisor, District 1 (A) Mark Baza, Imperial County Transportation Commission
CALIFORNIA DEPARTMENT OF TRANSPORTATION Laurie Berman, Director (A) Tim Gubbins, Acting District 11 Director (A) Ann Fox, Deputy Director
METROPOLITAN TRANSIT SYSTEM Hon. Mona Rios (A) Hon. Bill Sandke
NORTH COUNTY TRANSIT DISTRICT Hon. Rebecca Jones, Chair (A) Hon. Ed Gallo (A) Hon. Jewel Edson
U.S. DEPARTMENT OF DEFENSE Joe Stuyvesant, Navy Region Southwest Executive Director (A) Steve Chung, Navy Region Southwest
SAN DIEGO UNIFIED PORT DISTRICT Hon. Garry Bonelli, Vice Chair (A) Hon. Michael Zucchet, Commissioner
SAN DIEGO COUNTY WATER AUTHORITY Mark Muir, Chair (A) Jim Madaffer, Vice Chair (A) Christy Guerin, Director
SOUTHERN CALIFORNIA TRIBAL CHAIRMEN’S ASSOCIATION Hon. Cody Martinez, Chairman, Sycuan Band of the Kumeyaay Nation Hon. Robert Smith, Chairman, Pala Band of Mission Indians
MEXICO Hon. Marcela Celorio, Cónsul General of Mexico (A) Gaspar Orozco Deputy Cónsul General of Mexico (A) Hon. Ruth Alicia López, Vice Cónsul
July 9, 2018
C J B u l l e t i n - C r i m e i n t h e S a n D i e g o R e g i o n M i d - Y e a r 2 0 1 8 S t a t i s t i c s 3
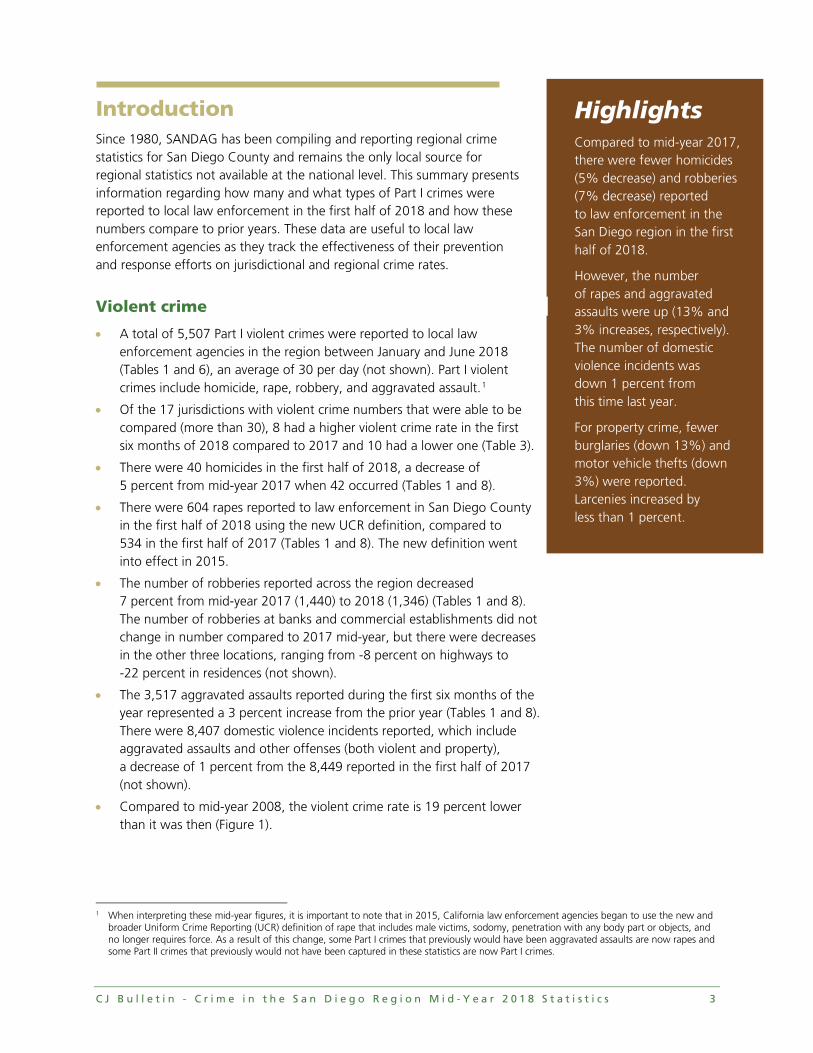
Introduction Since 1980, SANDAG has been compiling and reporting regional crime statistics for San Diego County and remains the only local source for regional statistics not available at the national level. This summary presents information regarding how many and what types of Part I crimes were reported to local law enforcement in the first half of 2018 and how these numbers compare to prior years. These data are useful to local law enforcement agencies as they track the effectiveness of their prevention and response efforts on jurisdictional and regional crime rates.
Violent crime
• A total of 5,507 Part I violent crimes were reported to local law enforcement agencies in the region between January and June 2018 (Tables 1 and 6), an average of 30 per day (not shown). Part I violent crimes include homicide, rape, robbery, and aggravated assault.1
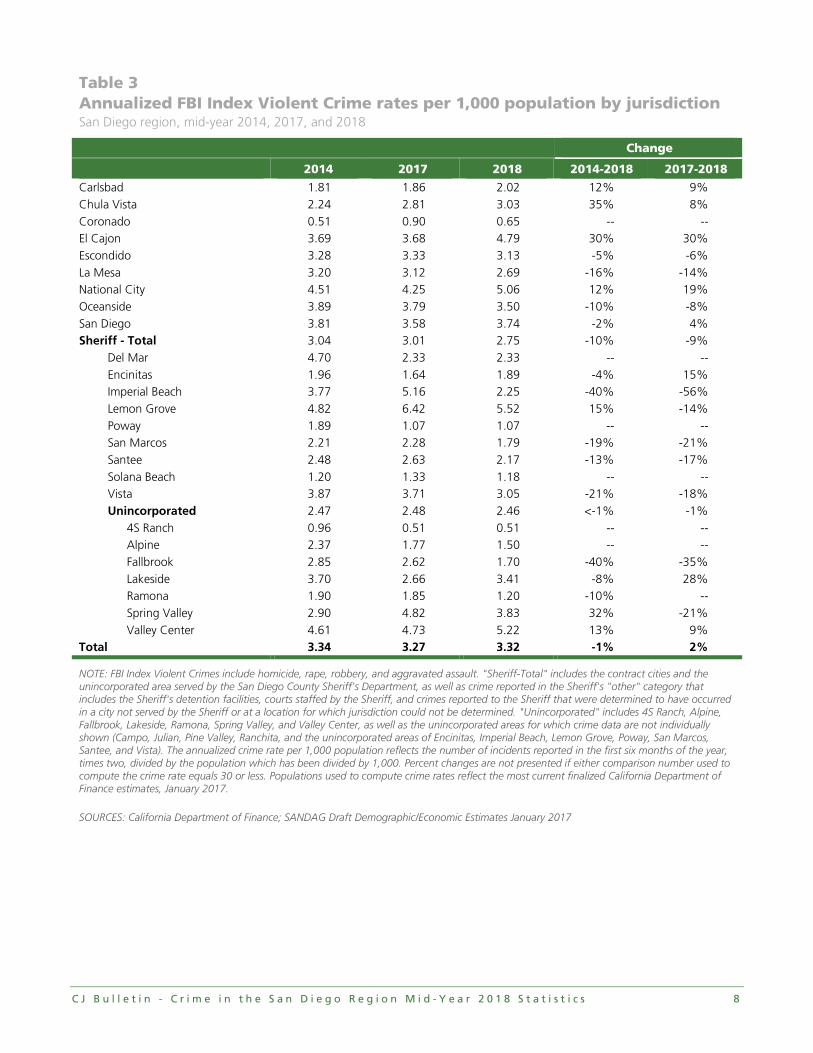
• Of the 17 jurisdictions with violent crime numbers that were able to be compared (more than 30), 8 had a higher violent crime rate in the first six months of 2018 compared to 2017 and 10 had a lower one (Table 3).
• There were 40 homicides in the first half of 2018, a decrease of 5 percent from mid-year 2017 when 42 occurred (Tables 1 and 8).
• There were 604 rapes reported to law enforcement in San Diego County in the first half of 2018 using the new UCR definition, compared to 534 in the first half of 2017 (Tables 1 and 8). The new definition went into effect in 2015.
• The number of robberies reported across the region decreased 7 percent from mid-year 2017 (1,440) to 2018 (1,346) (Tables 1 and 8). The number of robberies at banks and commercial establishments did not change in number compared to 2017 mid-year, but there were decreases in the other three locations, ranging from -8 percent on highways to -22 percent in residences (not shown).
• The 3,517 aggravated assaults reported during the first six months of the year represented a 3 percent increase from the prior year (Tables 1 and 8). There were 8,407 domestic violence incidents reported, which include aggravated assaults and other offenses (both violent and property), a decrease of 1 percent from the 8,449 reported in the first half of 2017 (not shown).
• Compared to mid-year 2008, the violent crime rate is 19 percent lower than it was then (Figure 1).
1 When interpreting these mid-year figures, it is important to note that in 2015, California law enforcement agencies began to use the new and
broader Uniform Crime Reporting (UCR) definition of rape that includes male victims, sodomy, penetration with any body part or objects, and no longer requires force. As a result of this change, some Part I crimes that previously would have been aggravated assaults are now rapes and some Part II crimes that previously would not have been captured in these statistics are now Part I crimes.
Highlights Compared to mid-year 2017, there were fewer homicides (5% decrease) and robberies (7% decrease) reported to law enforcement in the San Diego region in the first half of 2018.
However, the number of rapes and aggravated assaults were up (13% and 3% increases, respectively). The number of domestic violence incidents was down 1 percent from this time last year.
For property crime, fewer burglaries (down 13%) and motor vehicle thefts (down 3%) were reported. Larcenies increased by less than 1 percent.

C J B u l l e t i n - C r i m e i n t h e S a n D i e g o R e g i o n M i d - Y e a r 2 0 1 8 S t a t i s t i c s 4
Property crime
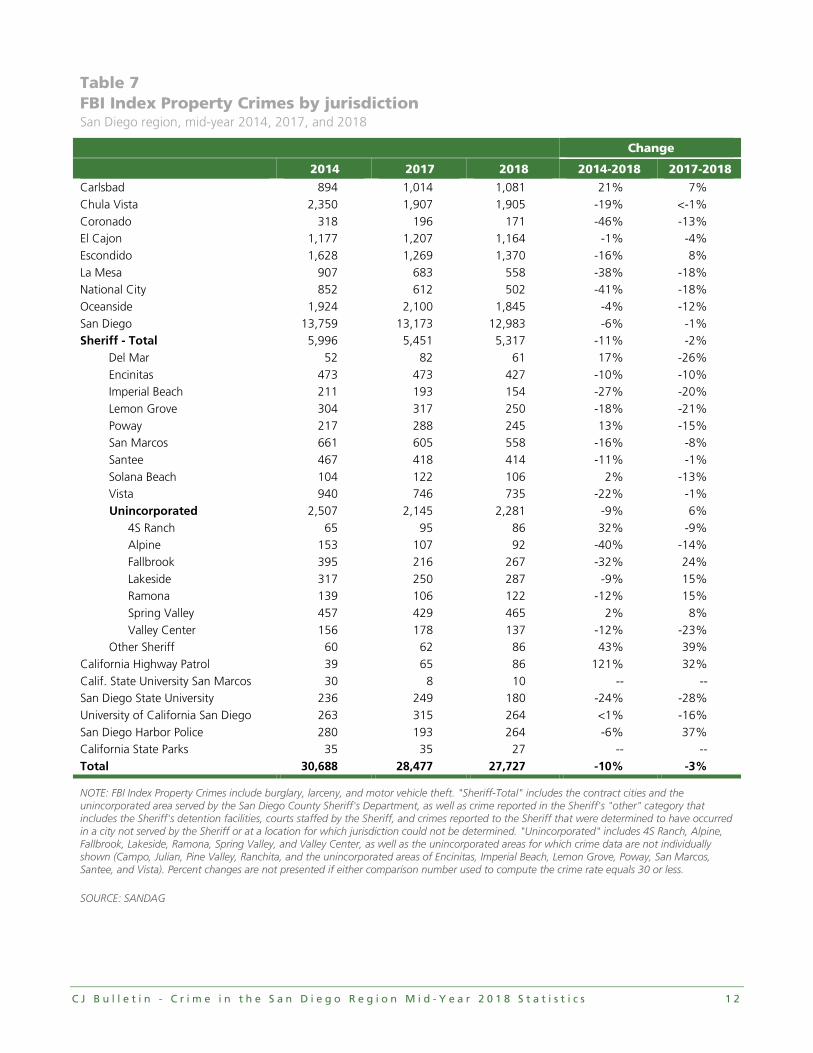
• A total of 27,727 property crimes were reported to local law enforcement agencies in the first half of 2018 (Tables 1 and 7). This equates to an average of 153 per day. Sixty-eight percent (68%) of these property crimes were larcenies, 17 percent motor vehicle thefts, and 15 percent burglaries (not shown).
• Of the 25 jurisdictions with property crime numbers that were able to be compared (more than 30), 19 had a lower property crime rate in the first six months of 2018 compared to 2017, and 6 had a higher one (Table 4).
• The 4,131 burglaries reported in the San Diego region in the first half of 2018 represented a decrease of 13 percent from the first half of 2017 (when there were 4,760). Residential burglaries decreased 14 percent and non-residential burglaries decreased 12 percent. Fifty-five percent (55%) of burglaries in the first half of 2018 were residential (Tables 1 and 8).
• The number of larcenies reported in the region at mid-year 2018 (18,915) represented a less than 1 percent increase from mid-year 2017 (18,903). Petty theft (estimated value of items stolen $400 and under) decreased by 8 percent and grand theft increased by 13 percent (Tables 1 and 8).
• Across the seven types of larcenies, there were increases in thefts from motor vehicles (4%), from buildings (4%), of bicycles (5%), and pickpockets/purse snatching (9%) (not shown).
• Motor vehicle theft decreased 3 percent over the past year, from 4,814 vehicles stolen at mid-year 2017 to 4,681 at mid-year 2018 (Tables 1 and 8).
• There were 189 arsons reported by law enforcement in the first half of 2018, up from 176 the first half of 2017, an increase of 7 percent (Tables 10 and 11).
• The mid-year 2018 property crime rate was 40 percent lower than it was in 2008 (Figure 2).
Background The ability for SANDAG to analyze data and produce reports on crime trends for the region relies upon a cooperative agreement with each local law enforcement agency. SANDAG obtains crime data from every agency on a monthly basis, allowing the presentation of regional crime data in a timely manner.
Crimes are categorized according to the FBI’s standardized UCR guidelines for law enforcement agencies across the country. Reported crimes are tallied in ARJIS according to the date of data entry, which may or may not reflect the day of occurrence. It should be noted that while local law enforcement agencies strive to tabulate their statistics in a timely fashion, data entry delays sometimes occur, which may affect statistics.
The mid-year crime rates per 1,000 residents are estimated by multiplying the number of crimes reported between January and June by two and dividing that number by the population which has been divided by 1,000.
The statistics presented in this CJ Bulletin include crime rates and numbers for San Diego County and individual jurisdictions for the first half of 2018. Comparisons are made to prior years. The number and type of crimes that are reported can be influenced by several factors, including the degree of opportunity to commit crimes in a given jurisdiction, which can be related to the amount of commercial land use and ease of access to the area.
Crime statistics for January through December 2018 are expected to be available in April 2019. If you have any questions about these numbers, please contact the Criminal Justice Research Division at (619) 699-1900. For more information about the SANDAG Criminal Justice Clearinghouse, please visit sandag.org/cj.

C J B u l l e t i n - C r i m e i n t h e S a n D i e g o R e g i o n M i d - Y e a r 2 0 1 8 S t a t i s t i c s 5
Figure 1 Annualized FBI Violent Crime rate mid-year 2008-2018
NOTE: The violent crime rate includes reported homicides, rapes, robberies, and aggravated assaults.
SOURCES: California Department of Finance; SANDAG Draft Demographic/Economic Estimates, January 2017
Figure 2 Annualized FBI Property Crime rate mid-year 2008-2018
NOTE: The property crime rate includes reported burglaries, larceny thefts, and motor vehicle thefts.
SOURCES: California Department of Finance; SANDAG Draft Demographic/Economic Estimates, January 2017
4.09
3.34 3.27 3.32
2008 2009 2010 2011 2012 2013 2014 2015 2016 2017 2018
Rat
e p
er 1
,000
po
pu
lati
on
27.96
18.99
17.17 16.72
2008 2009 2010 2011 2012 2013 2014 2015 2016 2017 2018
Rat
e p
er 1
,000
po
pu
lati
on
C J B u l l e t i n - C r i m e i n t h e S a n D i e g o R e g i o n M i d - Y e a r 2 0 1 8 S t a t i s t i c s 6
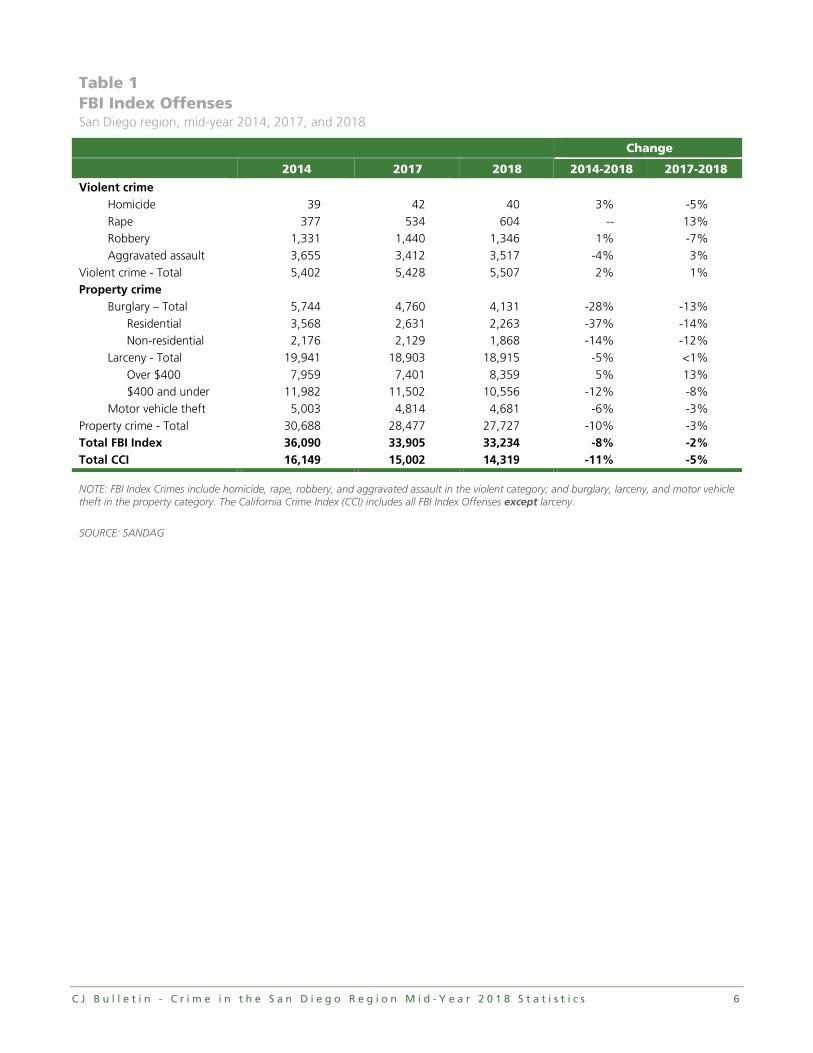
Table 1 FBI Index Offenses San Diego region, mid-year 2014, 2017, and 2018
Change 2014 2017 2018 2014-2018 2017-2018
Violent crime Homicide 39 42 40 3% -5% Rape 377 534 604 -- 13% Robbery 1,331 1,440 1,346 1% -7% Aggravated assault 3,655 3,412 3,517 -4% 3%
Violent crime - Total 5,402 5,428 5,507 2% 1% Property crime
Burglary – Total 5,744 4,760 4,131 -28% -13% Residential 3,568 2,631 2,263 -37% -14% Non-residential 2,176 2,129 1,868 -14% -12%
Larceny - Total 19,941 18,903 18,915 -5% <1% Over $400 7,959 7,401 8,359 5% 13% $400 and under 11,982 11,502 10,556 -12% -8%
Motor vehicle theft 5,003 4,814 4,681 -6% -3% Property crime - Total 30,688 28,477 27,727 -10% -3% Total FBI Index 36,090 33,905 33,234 -8% -2% Total CCI 16,149 15,002 14,319 -11% -5%
NOTE: FBI Index Crimes include homicide, rape, robbery, and aggravated assault in the violent category; and burglary, larceny, and motor vehicle theft in the property category. The California Crime Index (CCI) includes all FBI Index Offenses except larceny.
SOURCE: SANDAG
C J B u l l e t i n - C r i m e i n t h e S a n D i e g o R e g i o n M i d - Y e a r 2 0 1 8 S t a t i s t i c s 7
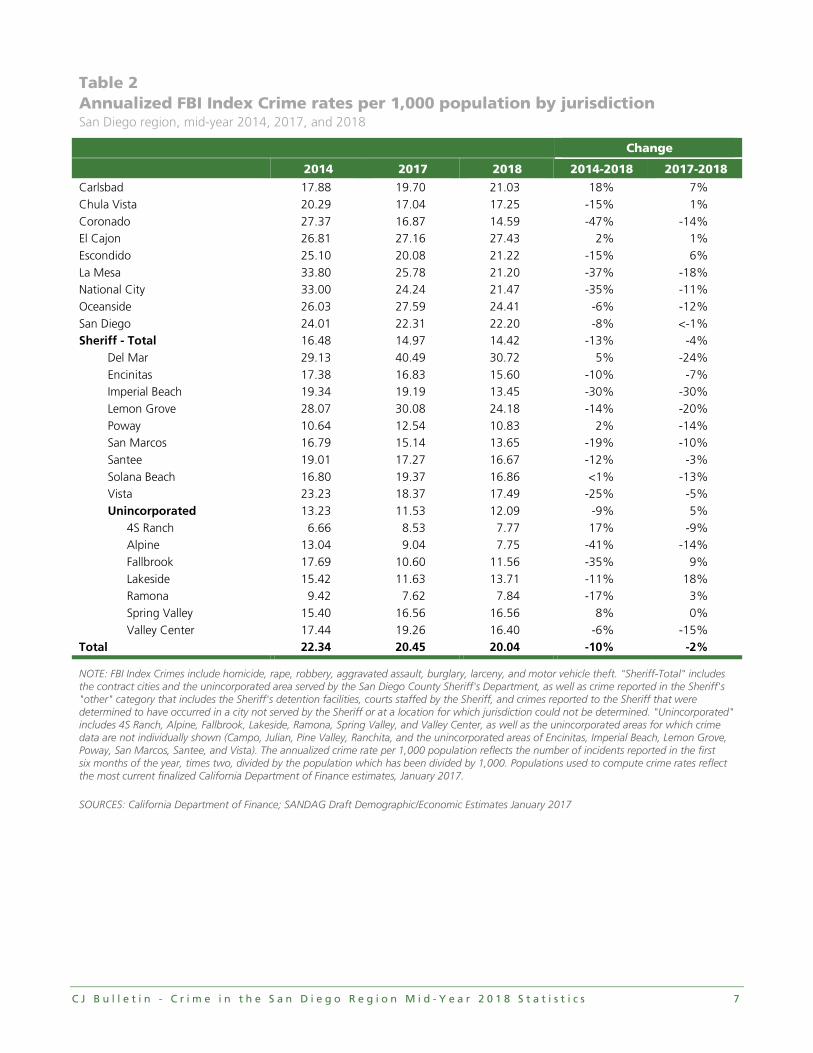
Table 2 Annualized FBI Index Crime rates per 1,000 population by jurisdiction San Diego region, mid-year 2014, 2017, and 2018
Change
2014 2017 2018 2014-2018 2017-2018
Carlsbad 17.88 19.70 21.03 18% 7% Chula Vista 20.29 17.04 17.25 -15% 1% Coronado 27.37 16.87 14.59 -47% -14% El Cajon 26.81 27.16 27.43 2% 1% Escondido 25.10 20.08 21.22 -15% 6% La Mesa 33.80 25.78 21.20 -37% -18% National City 33.00 24.24 21.47 -35% -11% Oceanside 26.03 27.59 24.41 -6% -12% San Diego 24.01 22.31 22.20 -8% <-1% Sheriff - Total 16.48 14.97 14.42 -13% -4%
Del Mar 29.13 40.49 30.72 5% -24% Encinitas 17.38 16.83 15.60 -10% -7% Imperial Beach 19.34 19.19 13.45 -30% -30% Lemon Grove 28.07 30.08 24.18 -14% -20% Poway 10.64 12.54 10.83 2% -14% San Marcos 16.79 15.14 13.65 -19% -10% Santee 19.01 17.27 16.67 -12% -3% Solana Beach 16.80 19.37 16.86 <1% -13% Vista 23.23 18.37 17.49 -25% -5% Unincorporated 13.23 11.53 12.09 -9% 5%
4S Ranch 6.66 8.53 7.77 17% -9% Alpine 13.04 9.04 7.75 -41% -14% Fallbrook 17.69 10.60 11.56 -35% 9% Lakeside 15.42 11.63 13.71 -11% 18% Ramona 9.42 7.62 7.84 -17% 3% Spring Valley 15.40 16.56 16.56 8% 0% Valley Center 17.44 19.26 16.40 -6% -15%
Total 22.34 20.45 20.04 -10% -2%
NOTE: FBI Index Crimes include homicide, rape, robbery, aggravated assault, burglary, larceny, and motor vehicle theft. "Sheriff-Total" includes the contract cities and the unincorporated area served by the San Diego County Sheriff's Department, as well as crime reported in the Sheriff's "other" category that includes the Sheriff's detention facilities, courts staffed by the Sheriff, and crimes reported to the Sheriff that were determined to have occurred in a city not served by the Sheriff or at a location for which jurisdiction could not be determined. "Unincorporated" includes 4S Ranch, Alpine, Fallbrook, Lakeside, Ramona, Spring Valley, and Valley Center, as well as the unincorporated areas for which crime data are not individually shown (Campo, Julian, Pine Valley, Ranchita, and the unincorporated areas of Encinitas, Imperial Beach, Lemon Grove, Poway, San Marcos, Santee, and Vista). The annualized crime rate per 1,000 population reflects the number of incidents reported in the first six months of the year, times two, divided by the population which has been divided by 1,000. Populations used to compute crime rates reflect the most current finalized California Department of Finance estimates, January 2017.
SOURCES: California Department of Finance; SANDAG Draft Demographic/Economic Estimates January 2017
C J B u l l e t i n - C r i m e i n t h e S a n D i e g o R e g i o n M i d - Y e a r 2 0 1 8 S t a t i s t i c s 8
Table 3 Annualized FBI Index Violent Crime rates per 1,000 population by jurisdiction San Diego region, mid-year 2014, 2017, and 2018
Change
2014 2017 2018 2014-2018 2017-2018
Carlsbad 1.81 1.86 2.02 12% 9% Chula Vista 2.24 2.81 3.03 35% 8% Coronado 0.51 0.90 0.65 -- -- El Cajon 3.69 3.68 4.79 30% 30% Escondido 3.28 3.33 3.13 -5% -6% La Mesa 3.20 3.12 2.69 -16% -14% National City 4.51 4.25 5.06 12% 19% Oceanside 3.89 3.79 3.50 -10% -8% San Diego 3.81 3.58 3.74 -2% 4% Sheriff - Total 3.04 3.01 2.75 -10% -9%
Del Mar 4.70 2.33 2.33 -- -- Encinitas 1.96 1.64 1.89 -4% 15% Imperial Beach 3.77 5.16 2.25 -40% -56% Lemon Grove 4.82 6.42 5.52 15% -14% Poway 1.89 1.07 1.07 -- -- San Marcos 2.21 2.28 1.79 -19% -21% Santee 2.48 2.63 2.17 -13% -17% Solana Beach 1.20 1.33 1.18 -- -- Vista 3.87 3.71 3.05 -21% -18% Unincorporated 2.47 2.48 2.46 <-1% -1%
4S Ranch 0.96 0.51 0.51 -- -- Alpine 2.37 1.77 1.50 -- -- Fallbrook 2.85 2.62 1.70 -40% -35% Lakeside 3.70 2.66 3.41 -8% 28% Ramona 1.90 1.85 1.20 -10% -- Spring Valley 2.90 4.82 3.83 32% -21% Valley Center 4.61 4.73 5.22 13% 9%
Total 3.34 3.27 3.32 -1% 2%
NOTE: FBI Index Violent Crimes include homicide, rape, robbery, and aggravated assault. "Sheriff-Total" includes the contract cities and the unincorporated area served by the San Diego County Sheriff's Department, as well as crime reported in the Sheriff's "other" category that includes the Sheriff's detention facilities, courts staffed by the Sheriff, and crimes reported to the Sheriff that were determined to have occurred in a city not served by the Sheriff or at a location for which jurisdiction could not be determined. "Unincorporated" includes 4S Ranch, Alpine, Fallbrook, Lakeside, Ramona, Spring Valley, and Valley Center, as well as the unincorporated areas for which crime data are not individually shown (Campo, Julian, Pine Valley, Ranchita, and the unincorporated areas of Encinitas, Imperial Beach, Lemon Grove, Poway, San Marcos, Santee, and Vista). The annualized crime rate per 1,000 population reflects the number of incidents reported in the first six months of the year, times two, divided by the population which has been divided by 1,000. Percent changes are not presented if either comparison number used to compute the crime rate equals 30 or less. Populations used to compute crime rates reflect the most current finalized California Department of Finance estimates, January 2017.
SOURCES: California Department of Finance; SANDAG Draft Demographic/Economic Estimates January 2017

C J B u l l e t i n - C r i m e i n t h e S a n D i e g o R e g i o n M i d - Y e a r 2 0 1 8 S t a t i s t i c s 9
Table 4 Annualized FBI Index Property Crime rates per 1,000 population by jurisdiction San Diego region, mid-year 2014, 2017, and 2018
Change
2014 2017 2018 2014-2018 2017-2018
Carlsbad 16.06 17.83 19.01 18% 7% Chula Vista 18.05 14.24 14.22 -21% <-1% Coronado 26.86 15.97 13.93 -48% -13% El Cajon 23.12 23.48 22.65 -2% -4% Escondido 21.81 16.75 18.09 -17% 8% La Mesa 30.60 22.66 18.51 -40% -18% National City 28.49 20.00 16.40 -42% -18% Oceanside 22.14 23.80 20.91 -6% -12% San Diego 20.21 18.73 18.46 -9% -1% Sheriff - Total 13.44 11.96 11.67 -13% -2%
Del Mar 24.43 38.17 28.39 16% -26% Encinitas 15.42 15.19 13.71 -11% -10% Imperial Beach 15.58 14.03 11.20 -28% -20% Lemon Grove 23.25 23.66 18.66 -20% -21% Poway 8.74 11.46 9.75 12% -15% San Marcos 14.58 12.87 11.87 -19% -8% Santee 16.53 14.64 14.50 -12% -1% Solana Beach 15.60 18.04 15.67 <1% -13% Vista 19.35 14.66 14.44 -25% -2% Unincorporated 10.76 9.05 9.63 -11% 6%
4S Ranch 5.70 8.03 7.27 28% -9% Alpine 10.67 7.27 6.25 -41% -14% Fallbrook 14.84 7.98 9.86 -34% 24% Lakeside 11.72 8.97 10.30 -12% 15% Ramona 7.53 5.77 6.64 -12% 15% Spring Valley 12.50 11.74 12.73 2% 8% Valley Center 12.83 14.53 11.18 -13% -23%
Total 18.99 17.17 16.72 -12% -3%
NOTE: FBI Index Property Crimes include burglary, larceny, and motor vehicle theft. "Sheriff-Total" includes the contract cities and the unincorporated area served by the San Diego County Sheriff's Department, as well as crime reported in the Sheriff's "other" category that includes the Sheriff's detention facilities, courts staffed by the Sheriff, and crimes reported to the Sheriff that were determined to have occurred in a city not served by the Sheriff or at a location for which jurisdiction could not be determined. "Unincorporated" includes 4S Ranch, Alpine, Fallbrook, Lakeside, Ramona, Spring Valley, and Valley Center, as well as the unincorporated areas for which crime data are not individually shown (Campo, Julian, Pine Valley, Ranchita, and the unincorporated areas of Encinitas, Imperial Beach, Lemon Grove, Poway, San Marcos, Santee, and Vista). The annualized crime rate per 1,000 population reflects the number of incidents reported in the first six months of the year, times two, divided by the population which has been divided by 1,000. Populations used to compute crime rates reflect the most current finalized California Department of Finance estimates, January 2017.
SOURCES: California Department of Finance; SANDAG Draft Demographic/Economic Estimates January 2017

C J B u l l e t i n - C r i m e i n t h e S a n D i e g o R e g i o n M i d - Y e a r 2 0 1 8 S t a t i s t i c s 1 0
Table 5 FBI Index Crimes by jurisdiction San Diego region, mid-year 2014, 2017, and 2018
Change
2014 2017 2018 2014-2018 2017-2018
Carlsbad 995 1,120 1,196 20% 7% Chula Vista 2,642 2,283 2,311 -13% 1% Coronado 324 207 179 -45% -14% El Cajon 1,365 1,396 1,410 3% 1% Escondido 1,873 1,521 1,607 -14% 6% La Mesa 1,002 777 639 -36% -18% National City 987 742 657 -33% -11% Oceanside 2,262 2,434 2,154 -5% -12% San Diego 16,350 15,688 15,613 -5% <-1% Sheriff - Total 7,351 6,824 6,570 -11% -4%
Del Mar 62 87 66 6% -24% Encinitas 533 524 486 -9% -7% Imperial Beach 262 264 185 -29% -30% Lemon Grove 367 403 324 -12% -20% Poway 264 315 272 3% -14% San Marcos 761 712 642 -16% -10% Santee 537 493 476 -11% -3% Solana Beach 112 131 114 2% -13% Vista 1,128 935 890 -21% -5% Unincorporated 3,083 2,732 2,863 -7% 5%
4S Ranch 76 101 92 21% -9% Alpine 187 133 114 -39% -14% Fallbrook 471 287 313 -34% 9% Lakeside 417 324 382 -8% 18% Ramona 174 140 144 -17% 3% Spring Valley 563 605 605 7% 0% Valley Center 212 236 201 -5% -15%
Other Sheriff 242 228 252 4% 11% California Highway Patrol 45 72 102 127% 42% Calif. State University San Marcos 31 11 11 -- -- San Diego State University 254 258 187 -26% -28% University of California San Diego 265 320 270 2% -16% San Diego Harbor Police 309 215 300 -3% 40% California State Parks 35 37 28 -- -- Total 36,090 33,905 33,234 -8% -2%
NOTE: FBI Index Crimes include homicide, rape, robbery, aggravated assault, burglary, larceny, and motor vehicle theft. "Sheriff-Total" includes the contract cities and the unincorporated area served by the San Diego County Sheriff's Department, as well as crime reported in the Sheriff's "other" category that includes the Sheriff's detention facilities, courts staffed by the Sheriff, and crimes reported to the Sheriff that were determined to have occurred in a city not served by the Sheriff or at a location for which jurisdiction could not be determined. "Unincorporated" includes 4S Ranch, Alpine, Fallbrook, Lakeside, Ramona, Spring Valley, and Valley Center, as well as the unincorporated areas for which crime data are not individually shown (Campo, Julian, Pine Valley, Ranchita, and the unincorporated areas of Encinitas, Imperial Beach, Lemon Grove, Poway, San Marcos, Santee, and Vista). Percent changes are not presented if either comparison number used to compute the crime rate equals 30 or less.
SOURCE: SANDAG

C J B u l l e t i n - C r i m e i n t h e S a n D i e g o R e g i o n M i d - Y e a r 2 0 1 8 S t a t i s t i c s 1 1
Table 6 FBI Index Violent Crimes by jurisdiction San Diego region, mid-year 2014, 2017, and 2018
Change
2014 2017 2018 2014-2018 2017-2018
Carlsbad 101 106 115 14% 8% Chula Vista 292 376 406 39% 8% Coronado 6 11 8 -- -- El Cajon 188 189 246 31% 30% Escondido 245 252 237 -3% -6% La Mesa 95 94 81 -15% -14% National City 135 130 155 15% 19% Oceanside 338 334 309 -9% -7% San Diego 2,591 2,515 2,630 2% 5% Sheriff - Total 1,355 1,373 1,253 -8% -9%
Del Mar 10 5 5 -- -- Encinitas 60 51 59 -2% 16% Imperial Beach 51 71 31 -39% -56% Lemon Grove 63 86 74 17% -14% Poway 47 27 27 -- -- San Marcos 100 107 84 -16% -22% Santee 70 75 62 -11% -17% Solana Beach 8 9 8 -- -- Vista 188 189 155 -18% -18% Unincorporated 576 587 582 1% -1%
4S Ranch 11 6 6 -- -- Alpine 34 26 22 -- -- Fallbrook 76 71 46 -39% -35% Lakeside 100 74 95 -5% 28% Ramona 35 34 22 -- -- Spring Valley 106 176 140 32% -20% Valley Center 56 58 64 14% 10%
Other Sheriff 182 166 166 -9% 0% California Highway Patrol 6 7 16 -- -- Calif. State University San Marcos 1 3 1 -- -- San Diego State University 18 9 7 -- -- University of California San Diego 2 5 6 -- -- San Diego Harbor Police 29 22 36 -- -- California State Parks 0 2 1 -- -- Total 5,402 5,428 5,507 2% 1%
NOTE: FBI Index Violent Crimes include homicide, rape, robbery, and aggravated assault. "Sheriff-Total" includes the contract cities and the unincorporated area served by the San Diego County Sheriff's Department, as well as crime reported in the Sheriff's "other" category that includes the Sheriff's detention facilities, courts staffed by the Sheriff, and crimes reported to the Sheriff that were determined to have occurred in a city not served by the Sheriff or at a location for which jurisdiction could not be determined. "Unincorporated" includes 4S Ranch, Alpine, Fallbrook, Lakeside, Ramona, Spring Valley, and Valley Center, as well as the unincorporated areas for which crime data are not individually shown (Campo, Julian, Pine Valley, Ranchita, and the unincorporated areas of Encinitas, Imperial Beach, Lemon Grove, Poway, San Marcos, Santee, and Vista). Percent changes are not presented if either comparison number used to compute the crime rate equals 30 or less.
SOURCE: SANDAG
C J B u l l e t i n - C r i m e i n t h e S a n D i e g o R e g i o n M i d - Y e a r 2 0 1 8 S t a t i s t i c s 1 2
Table 7 FBI Index Property Crimes by jurisdiction San Diego region, mid-year 2014, 2017, and 2018
Change
2014 2017 2018 2014-2018 2017-2018
Carlsbad 894 1,014 1,081 21% 7% Chula Vista 2,350 1,907 1,905 -19% <-1% Coronado 318 196 171 -46% -13% El Cajon 1,177 1,207 1,164 -1% -4% Escondido 1,628 1,269 1,370 -16% 8% La Mesa 907 683 558 -38% -18% National City 852 612 502 -41% -18% Oceanside 1,924 2,100 1,845 -4% -12% San Diego 13,759 13,173 12,983 -6% -1% Sheriff - Total 5,996 5,451 5,317 -11% -2%
Del Mar 52 82 61 17% -26% Encinitas 473 473 427 -10% -10% Imperial Beach 211 193 154 -27% -20% Lemon Grove 304 317 250 -18% -21% Poway 217 288 245 13% -15% San Marcos 661 605 558 -16% -8% Santee 467 418 414 -11% -1% Solana Beach 104 122 106 2% -13% Vista 940 746 735 -22% -1% Unincorporated 2,507 2,145 2,281 -9% 6%
4S Ranch 65 95 86 32% -9% Alpine 153 107 92 -40% -14% Fallbrook 395 216 267 -32% 24% Lakeside 317 250 287 -9% 15% Ramona 139 106 122 -12% 15% Spring Valley 457 429 465 2% 8% Valley Center 156 178 137 -12% -23%
Other Sheriff 60 62 86 43% 39% California Highway Patrol 39 65 86 121% 32% Calif. State University San Marcos 30 8 10 -- -- San Diego State University 236 249 180 -24% -28% University of California San Diego 263 315 264 <1% -16% San Diego Harbor Police 280 193 264 -6% 37% California State Parks 35 35 27 -- -- Total 30,688 28,477 27,727 -10% -3%
NOTE: FBI Index Property Crimes include burglary, larceny, and motor vehicle theft. "Sheriff-Total" includes the contract cities and the unincorporated area served by the San Diego County Sheriff's Department, as well as crime reported in the Sheriff's "other" category that includes the Sheriff's detention facilities, courts staffed by the Sheriff, and crimes reported to the Sheriff that were determined to have occurred in a city not served by the Sheriff or at a location for which jurisdiction could not be determined. "Unincorporated" includes 4S Ranch, Alpine, Fallbrook, Lakeside, Ramona, Spring Valley, and Valley Center, as well as the unincorporated areas for which crime data are not individually shown (Campo, Julian, Pine Valley, Ranchita, and the unincorporated areas of Encinitas, Imperial Beach, Lemon Grove, Poway, San Marcos, Santee, and Vista). Percent changes are not presented if either comparison number used to compute the crime rate equals 30 or less.
SOURCE: SANDAG

C J B u l l e t i n - C r i m e i n t h e S a n D i e g o R e g i o n M i d - Y e a r 2 0 1 8 S t a t i s t i c s 1 3
Table 8 Number of crimes by offense San Diego region, mid-year 2008-2018
Homicide Rape Robbery Aggravated
assault
Total violent crime
Residential burglary
Non- residential burglary
Total burglary
Larceny over $400
Larceny $400 & under
Total larceny
Motor vehicle theft
Total property
crime
FBI crime index
Calif. crime index
As of Dec. 2017
population
2008 49 405 1,969 3,778 6,201 4,693 3,678 8,371 9,341 14,504 23,845 10,186 42,402 48,603 24,758 3,032,689
2009 39 369 1,931 3,917 6,256 4,460 2,703 7,163 7,578 13,354 20,932 7,109 35,204 41,460 20,528 3,064,436
2010 31 336 1,679 3,759 5,805 4,598 2,361 6,959 8,023 13,315 21,338 6,474 34,771 40,576 19,238 3,095,313
2011 51 298 1,445 3,527 5,321 3,751 2,323 6,074 7,853 11,822 19,675 5,232 30,981 36,302 16,627 3,120,688
2012 64 377 1,529 3,843 5,813 4,613 2,233 6,846 8,489 12,569 21,058 5,716 33,620 39,433 18,375 3,153,951
2013 41 314 1,473 3,602 5,430 4,291 2,626 6,917 9,468 12,969 22,437 5,656 35,010 40,440 18,003 3,195,215
2014 39 377 1,331 3,655 5,402 3,568 2,176 5,744 7,959 11,982 19,941 5,003 30,688 36,090 16,149 3,231,651
2015 43 511 1,337 3,439 5,330 3,175 1,837 5,012 8,288 12,369 20,657 4,778 30,447 35,777 15,120 3,266,192
2016 49 550 1,389 3,373 5,361 3,371 1,883 5,254 8,748 12,041 20,789 5,504 31,547 36,908 16,119 3,286,717
2017 42 534 1,440 3,412 5,428 2,631 2,129 4,760 7,401 11,502 18,903 4,814 28,477 33,905 15,002 3,316,192
2018 40 604 1,346 3,517 5,507 2,263 1,868 4,131 8,359 10,556 18,915 4,681 27,727 33,234 14,319 3,316,192
NOTE: FBI Index Crimes include homicide, rape, robbery, and aggravated assault in the violent category and burglary, larceny, and motor vehicle theft in the property category. The CCI includes all FBI Index Offenses except larceny.
SOURCES: California Department of Finance, SANDAG

C J B u l l e t i n - C r i m e i n t h e S a n D i e g o R e g i o n M i d - Y e a r 2 0 1 8 S t a t i s t i c s 1 4
Table 9 Number of crimes by offense by jurisdiction San Diego region, mid-year 2014
Homicide Rape Robbery Aggravated
assault Residential
burglary
Non- residential burglary
Total burglary
Larceny over $400
Larceny $400 and
under
Total larceny
Motor vehicle theft
Arson FBI
crime index
Calif. crime index
Carlsbad 1 8 22 70 116 72 188 280 375 655 51 2 995 340 Chula Vista 3 20 107 162 206 107 313 582 1,023 1,605 432 21 2,642 1,037 Coronado 0 1 0 5 23 6 29 149 114 263 26 1 324 61 El Cajon 2 11 83 92 104 99 203 244 562 806 168 4 1,365 559 Escondido 0 11 69 165 160 100 260 384 679 1,063 305 10 1,873 810 La Mesa 0 7 31 57 101 53 154 219 438 657 96 3 1,002 345 National City 2 11 53 69 46 78 124 157 330 487 241 6 987 500 Oceanside 2 28 84 224 215 90 305 480 937 1,417 202 19 2,262 845 San Diego 19 183 635 1,754 1,720 927 2,647 3,757 4,758 8,515 2,597 110 16,350 7,835 Sheriff - Total 10 87 236 1,022 859 590 1,449 1,378 2,339 3,717 830 37 7,351 3,634
Del Mar 0 1 0 9 10 5 15 25 11 36 1 0 62 26 Encinitas 0 8 12 40 50 49 99 132 199 331 43 0 533 202 Imperial Beach 0 3 9 39 35 8 43 41 82 123 45 2 262 139 Lemon Grove 0 2 18 43 55 29 84 33 136 169 51 1 367 198 Poway 0 2 8 37 20 31 51 47 104 151 15 1 264 113 San Marcos 1 3 21 75 60 64 124 126 313 439 98 6 761 322 Santee 0 6 9 55 21 31 52 101 266 367 48 3 537 170 Solana Beach 0 1 4 3 13 17 30 37 31 68 6 0 112 44 Vista 1 20 55 112 93 68 161 229 408 637 142 5 1,128 491 Unincorporated 8 39 96 433 501 280 781 588 762 1,350 376 19 3,083 1,733
4S Ranch 0 1 3 7 15 9 24 20 16 36 5 0 76 40 Alpine 3 1 5 25 22 10 32 44 53 97 24 0 187 90 Fallbrook 2 7 12 55 73 76 149 94 108 202 44 0 471 269 Lakeside 0 11 10 79 44 32 76 67 137 204 37 0 417 213 Ramona 0 1 1 33 26 14 40 43 49 92 7 0 174 82 Spring Valley 0 7 30 69 86 41 127 99 121 220 110 0 563 343 Valley Center 0 5 7 44 32 19 51 45 37 82 23 0 212 130
Other Sheriff 0 2 4 176 1 8 9 19 27 46 5 0 242 196 California Highway Patrol 0 0 0 6 0 0 0 6 4 10 29 0 45 35 Calif. State University San Marcos 0 0 0 1 0 1 1 12 17 29 0 0 31 2 San Diego State University 0 5 6 7 12 11 23 63 139 202 11 0 254 52 University of California San Diego 0 1 1 0 4 10 14 84 156 240 9 1 265 25 San Diego Harbor Police 0 4 4 21 1 26 27 154 93 247 6 1 309 62 California State Parks 0 0 0 0 1 6 7 10 18 28 0 1 35 7 Total 39 377 1,331 3,655 3,568 2,176 5,744 7,959 11,982 19,941 5,003 216 36,090 16,149
NOTE: FBI Index Crimes include homicide, rape, robbery, and aggravated assault in the violent category and burglary, larceny, and motor vehicle theft in the property category. The CCI includes all FBI Index Offenses except larceny. "Sheriff-Total" includes the contract cities and the unincorporated area served by the Sheriff, as well as crimes reported in the Sheriff's "other" category that includes the Sheriff's detention facilities, courts staffed by the Sheriff, and crimes reported to the Sheriff that occurred in a city not served by the Sheriff or a location for which jurisdiction could not be determined. "Unincorporated" includes 4S Ranch, Alpine, Fallbrook, Lakeside, Ramona, Spring Valley, and Valley Center, as well as the unincorporated areas not shown (Campo, Julian, Pine Valley, Ranchita, and the unincorporated areas of Encinitas, Imperial Beach, Lemon Grove, Poway, San Marcos, Santee, and Vista).
SOURCE: SANDAG

C J B u l l e t i n - C r i m e i n t h e S a n D i e g o R e g i o n M i d - Y e a r 2 0 1 8 S t a t i s t i c s 1 5
Table 10 Number of crimes by offense by jurisdiction San Diego region, mid-year 2017
Homicide Rape Robbery Aggravated
assault Residential
burglary
Non- residential burglary
Total burglary
Larceny over $400
Larceny $400 and
under
Total larceny
Motor vehicle theft
Arson FBI
crime index
Calif. crime index
Carlsbad 0 16 17 73 96 108 204 313 432 745 65 7 1,120 375 Chula Vista 0 30 138 208 201 112 313 521 723 1,244 350 13 2,283 1,039 Coronado 0 0 2 9 12 5 17 89 76 165 14 1 207 42 El Cajon 0 24 62 103 126 105 231 278 479 757 219 6 1,396 639 Escondido 3 21 68 160 98 117 215 271 606 877 177 9 1,521 644 La Mesa 1 4 26 63 56 54 110 182 277 459 114 3 777 318 National City 2 15 52 61 39 35 74 144 200 344 194 6 742 398 Oceanside 4 36 82 212 165 152 317 524 1,044 1,568 215 16 2,434 866 San Diego 17 265 694 1,539 1,196 836 2,032 3,359 5,193 8,552 2,589 81 15,688 7,136 Sheriff - Total 15 116 289 953 626 557 1,183 1,414 2,031 3,445 823 26 6,824 3,379
Del Mar 0 0 0 5 13 8 21 35 21 56 5 0 87 31 Encinitas 0 7 15 29 55 58 113 148 178 326 34 1 524 198 Imperial Beach 0 4 15 52 28 10 38 44 70 114 41 0 264 150 Lemon Grove 1 1 31 53 30 21 51 60 145 205 61 0 403 198 Poway 0 1 6 20 27 49 76 82 105 187 25 1 315 128 San Marcos 0 14 28 65 41 72 113 151 266 417 75 0 712 295 Santee 0 6 23 46 32 37 69 87 212 299 50 0 493 194 Solana Beach 0 2 3 4 10 24 34 46 35 81 7 0 131 50 Vista 4 22 54 109 80 79 159 169 291 460 127 7 935 475 Unincorporated 10 48 108 421 310 192 502 579 681 1,260 383 17 2,732 1,472
4S Ranch 0 2 0 4 7 14 21 38 29 67 7 0 101 34 Alpine 1 1 3 21 8 11 19 22 41 63 25 0 133 70 Fallbrook 0 6 13 52 43 28 71 53 58 111 34 0 287 176 Lakeside 0 3 7 64 18 26 44 73 74 147 59 0 324 177 Ramona 0 3 5 26 16 14 30 26 37 63 13 0 140 77 Spring Valley 2 11 49 114 57 30 87 90 157 247 95 0 605 358 Valley Center 4 8 5 41 19 23 42 66 46 112 24 0 236 124
Other Sheriff 0 11 6 149 0 7 7 13 27 40 15 0 228 188 California Highway Patrol 0 1 0 6 1 6 7 6 18 24 34 0 72 48 Calif. State University San Marcos 0 3 0 0 0 0 0 2 6 8 0 1 11 3 San Diego State University 0 0 8 1 13 13 26 59 160 219 4 1 258 39 University of California San Diego 0 1 0 4 1 11 12 115 180 295 8 5 320 25 San Diego Harbor Police 0 2 2 18 1 15 16 114 62 176 1 0 215 39 California State Parks 0 0 0 2 0 3 3 10 15 25 7 1 37 12 Total 42 534 1,440 3,412 2,631 2,129 4,760 7,401 11,502 18,903 4,814 176 33,905 15,002
NOTE: FBI Index Crimes include homicide, rape, robbery, and aggravated assault in the violent category and burglary, larceny, and motor vehicle theft in the property category. The CCI includes all FBI Index Offenses except larceny. "Sheriff-Total" includes the contract cities and the unincorporated area served by the Sheriff, as well as crimes reported in the Sheriff's "other" category that includes the Sheriff's detention facilities, courts staffed by the Sheriff, and crimes reported to the Sheriff that occurred in a city not served by the Sheriff or a location for which jurisdiction could not be determined. "Unincorporated" includes 4S Ranch, Alpine, Fallbrook, Lakeside, Ramona, Spring Valley, and Valley Center, as well as the unincorporated areas not shown (Campo, Julian, Pine Valley, Ranchita, and the unincorporated areas of Encinitas, Imperial Beach, Lemon Grove, Poway, San Marcos, Santee, and Vista).
SOURCE: SANDAG
C J B u l l e t i n - C r i m e i n t h e S a n D i e g o R e g i o n M i d - Y e a r 2 0 1 8 S t a t i s t i c s 1 6
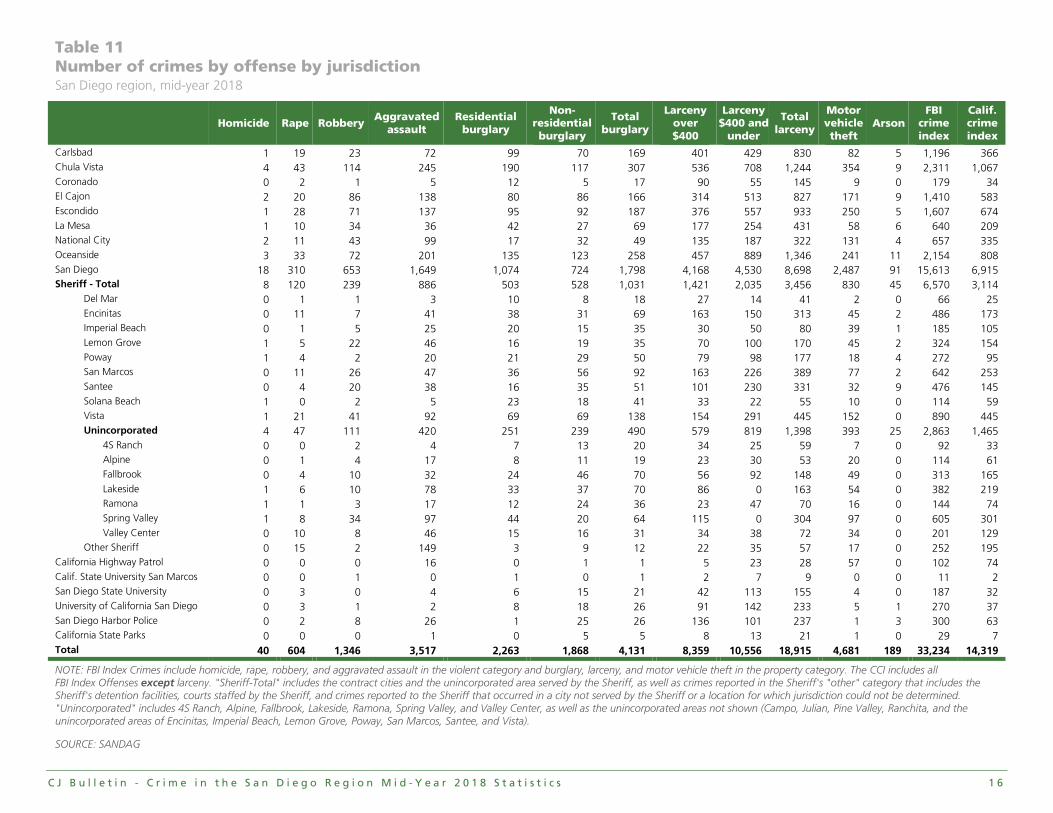
Table 11 Number of crimes by offense by jurisdiction San Diego region, mid-year 2018
Homicide Rape Robbery Aggravated
assault Residential
burglary
Non- residential burglary
Total burglary
Larceny over $400
Larceny $400 and
under
Total larceny
Motor vehicle theft
Arson FBI
crime index
Calif. crime index
Carlsbad 1 19 23 72 99 70 169 401 429 830 82 5 1,196 366 Chula Vista 4 43 114 245 190 117 307 536 708 1,244 354 9 2,311 1,067 Coronado 0 2 1 5 12 5 17 90 55 145 9 0 179 34 El Cajon 2 20 86 138 80 86 166 314 513 827 171 9 1,410 583 Escondido 1 28 71 137 95 92 187 376 557 933 250 5 1,607 674 La Mesa 1 10 34 36 42 27 69 177 254 431 58 6 640 209 National City 2 11 43 99 17 32 49 135 187 322 131 4 657 335 Oceanside 3 33 72 201 135 123 258 457 889 1,346 241 11 2,154 808 San Diego 18 310 653 1,649 1,074 724 1,798 4,168 4,530 8,698 2,487 91 15,613 6,915 Sheriff - Total 8 120 239 886 503 528 1,031 1,421 2,035 3,456 830 45 6,570 3,114
Del Mar 0 1 1 3 10 8 18 27 14 41 2 0 66 25 Encinitas 0 11 7 41 38 31 69 163 150 313 45 2 486 173 Imperial Beach 0 1 5 25 20 15 35 30 50 80 39 1 185 105 Lemon Grove 1 5 22 46 16 19 35 70 100 170 45 2 324 154 Poway 1 4 2 20 21 29 50 79 98 177 18 4 272 95 San Marcos 0 11 26 47 36 56 92 163 226 389 77 2 642 253 Santee 0 4 20 38 16 35 51 101 230 331 32 9 476 145 Solana Beach 1 0 2 5 23 18 41 33 22 55 10 0 114 59 Vista 1 21 41 92 69 69 138 154 291 445 152 0 890 445 Unincorporated 4 47 111 420 251 239 490 579 819 1,398 393 25 2,863 1,465
4S Ranch 0 0 2 4 7 13 20 34 25 59 7 0 92 33 Alpine 0 1 4 17 8 11 19 23 30 53 20 0 114 61 Fallbrook 0 4 10 32 24 46 70 56 92 148 49 0 313 165 Lakeside 1 6 10 78 33 37 70 86 0 163 54 0 382 219 Ramona 1 1 3 17 12 24 36 23 47 70 16 0 144 74 Spring Valley 1 8 34 97 44 20 64 115 0 304 97 0 605 301 Valley Center 0 10 8 46 15 16 31 34 38 72 34 0 201 129
Other Sheriff 0 15 2 149 3 9 12 22 35 57 17 0 252 195 California Highway Patrol 0 0 0 16 0 1 1 5 23 28 57 0 102 74 Calif. State University San Marcos 0 0 1 0 1 0 1 2 7 9 0 0 11 2 San Diego State University 0 3 0 4 6 15 21 42 113 155 4 0 187 32 University of California San Diego 0 3 1 2 8 18 26 91 142 233 5 1 270 37 San Diego Harbor Police 0 2 8 26 1 25 26 136 101 237 1 3 300 63 California State Parks 0 0 0 1 0 5 5 8 13 21 1 0 29 7 Total 40 604 1,346 3,517 2,263 1,868 4,131 8,359 10,556 18,915 4,681 189 33,234 14,319
NOTE: FBI Index Crimes include homicide, rape, robbery, and aggravated assault in the violent category and burglary, larceny, and motor vehicle theft in the property category. The CCI includes all FBI Index Offenses except larceny. "Sheriff-Total" includes the contract cities and the unincorporated area served by the Sheriff, as well as crimes reported in the Sheriff's "other" category that includes the Sheriff's detention facilities, courts staffed by the Sheriff, and crimes reported to the Sheriff that occurred in a city not served by the Sheriff or a location for which jurisdiction could not be determined. "Unincorporated" includes 4S Ranch, Alpine, Fallbrook, Lakeside, Ramona, Spring Valley, and Valley Center, as well as the unincorporated areas not shown (Campo, Julian, Pine Valley, Ranchita, and the unincorporated areas of Encinitas, Imperial Beach, Lemon Grove, Poway, San Marcos, Santee, and Vista).
SOURCE: SANDAG

C J B u l l e t i n - C r i m e i n t h e S a n D i e g o R e g i o n M i d - Y e a r 2 0 1 8 S t a t i s t i c s 1 7
Table 12 Population by jurisdiction San Diego region, mid-year 2014, 2017, and 2018
Change
2014 2017-2018 2014-2018
Carlsbad 111,323 113,725 2%
Chula Vista 260,416 267,917 3%
Coronado 23,677 24,543 4%
El Cajon 101,829 102,803 1%
Escondido 149,266 151,492 1%
La Mesa 59,285 60,286 2% National City 59,817 61,210 2%
Oceanside 173,811 176,461 2% San Diego 1,361,886 1,406,318 3%
Sheriff - Total 892,025 911,394 2%
Del Mar 4,257 4,297 1% Encinitas 61,340 62,288 2%
Imperial Beach 27,088 27,510 2% Lemon Grove 26,153 26,795 2%
Poway 49,638 50,253 1% San Marcos 90,662 94,042 4%
Santee 56,506 57,100 1%
Solana Beach 13,335 13,527 1% Vista 97,133 101,797 5%
Unincorporated 465,913 473,785 2% 4S Ranch 22,811 23,670 4%
Alpine 28,673 29,431 3%
Fallbrook 53,247 54,137 2% Lakeside 54,085 55,729 3%
Ramona 36,931 36,734 -1% Spring Valley 73,130 73,076 <-1%
Valley Center 24,314 24,505 1% Camp Pendleton 38,316 40,043 5%
Total 3,231,651 3,316,192 3%
NOTE: "Sheriff-Total" includes contract cities and the unincorporated area served by the San Diego County Sheriff's Department. Pendleton population is excluded from Sheriff's unincorporated area and included in the region total. "Unincorporated" includes 4S Ranch, Alpine, Fallbrook, Lakeside, Ramona, Spring Valley, and Valley Center, as well as the unincorporated areas not shown (Campo, Julian, Pine Valley, Ranchita, and the unincorporated areas of Encinitas, Imperial Beach, Lemon Grove, Poway, San Marcos, Santee, and Vista). Populations used to compute crime rates at the city-level reflect the most current finalized California Department of Finance estimates, January 2017. Below the city-level, SANDAG’s Draft vintage 2017 Demographic/Economic Estimates are used and may be revised when they are finalized later this year.
SOURCES: California Department of Finance; SANDAG Draft Demographic/Economic Estimates January 2017