Thirty-Six Years of Crime in the San Diego Region: 1980 ...
38
bulletin C J Thirty-Six Years of Crime in the San Diego Region: 1980 Through 2015 Criminal Justice Research Division, SANDAG 401 B Street Suite 800 San Diego, CA 92101 (619) 699-1900 A SANDAG CJ BULLETIN April 2016 Cynthia Burke, Ph.D. Division Director
Transcript of Thirty-Six Years of Crime in the San Diego Region: 1980 ...
bulletin
CJ
Thirty-Six Years of Crime in the San Diego Region:1980 Through 2015
Criminal Justice Research Division, SANDAG
401 B StreetSuite 800San Diego, CA 92101(619) 699-1900
A SANDAG CJ BULLETIN
April 2016
Cynthia Burke, Ph.D. Division Director
As of February 26, 2016
BOARD OF DIRECTORS
The 18 cities and county government are SANDAG serving as the forum for regional decision-making. SANDAG builds consensus; plans, engineers, and builds public transit; makes strategic plans; obtains and allocates
resources; and provides information on a broad range of topics pertinent to the region’s quality of life.
CHAIR Hon. Ron Roberts
FIRST VICE CHAIR Hon. Terry Sinnott
EXECUTIVE DIRECTOR Gary L. Gallegos
CITY OF CARLSBAD Hon. Matt Hall, Mayor (A) Hon. Lorraine Wood, Mayor Pro Tem (A) Hon. Keith Blackburn, Councilmember
CITY OF CHULA VISTA Hon. Mary Salas, Mayor (A) Hon. Pamela Bensoussan, Councilmember (A) Hon. John McCann, Councilmember
CITY OF CORONADO Hon. Carrie Downey, Councilmember (A) Hon. Michael Woiwode, Councilmember (A) Hon. Bill Sandke, Councilmember
CITY OF DEL MAR Hon. Terry Sinnott, Deputy Mayor (A) Hon. Dwight Worden, Councilmember (A) Hon. Al Corti, Councilmember
CITY OF EL CAJON Hon. Bill Wells, Mayor (A) Hon. Tony Ambrose, Mayor Pro Tem
CITY OF ENCINITAS Hon. Lisa Shaffer, Deputy Mayor (A) Hon. Tony Kranz, Councilmember (A) Hon. Kristin Gaspar, Mayor
CITY OF ESCONDIDO Hon. Sam Abed, Mayor (A) Hon. John Masson, Councilmember (A) Hon. Ed Gallo, Councilmember
CITY OF IMPERIAL BEACH Hon. Serge Dedina, Mayor (A) Hon. Ed Spriggs, Mayor Pro Tempore (A) Hon. Robert Patton, Councilmember
CITY OF LA MESA Hon. Kristine Alessio, Councilmember (A) Hon. Ruth Sterling, Councilmember (A) Hon. Bill Baber, Vice Mayor
CITY OF LEMON GROVE Hon. Mary Teresa Sessom, Mayor (A) Hon. Jerry Jones, Councilmember (A) Hon. Jennifer Mendoza, Councilmember
CITY OF NATIONAL CITY Hon. Ron Morrison, Mayor (A) Hon. Alejandra Sotelo-Solis, Councilmember (A) Hon. Mona Rios, Councilmember
CITY OF OCEANSIDE Hon. Jim Wood, Mayor (A) Hon. Esther Sanchez, Councilmember (A) Hon. Chuck Lowery, Deputy Mayor
CITY OF POWAY Hon. Steve Vaus, Mayor (A) Hon. Jim Cunningham, Deputy Mayor (A) Hon. John Mullin, Councilmember
CITY OF SAN DIEGO Hon. Kevin Faulconer, Mayor (A) Hon. Lorie Zapf, Councilmember (A) Hon. Chris Cate, Councilmember Hon. Todd Gloria, Councilmember (A) Hon. Sherri Lightner, Council President (A) Hon. Myrtle Cole, Councilmember
CITY OF SAN MARCOS Hon. Jim Desmond, Mayor (A) Hon. Chris Orlando, Councilmember (A) Hon. Rebecca Jones, Vice Mayor
CITY OF SANTEE Hon. Jack Dale, Councilmember (A) Hon. John Minto, Vice Mayor (A) Hon. Rob McNelis, Councilmember
CITY OF SOLANA BEACH Hon. Lesa Heebner, Councilmember (A) Hon. Mike Nichols, Councilmember (A) Hon. David A. Zito, Mayor
CITY OF VISTA Hon. Judy Ritter, Mayor (A) Hon. John Aguilera, Councilmember (A) Hon. Amanda Rigby, Deputy Mayor
COUNTY OF SAN DIEGO Hon. Dianne Jacob, Vice Chair (A) Hon. Bill Horn, Supervisor Hon. Ron Roberts, Chair (A) Hon. Greg Cox, Supervisor (A) Hon. Dave Roberts, Supervisor
ADVISORY MEMBERS
IMPERIAL COUNTY Hon. John Renison, Supervisor, District 1 (A) Maritza Hurtado, City of Calexico
CALIFORNIA DEPARTMENT OF TRANSPORTATION Malcolm Dougherty, Director (A) Laurie Berman, District 11 Director (A) Bill Figge, District 11 Deputy Director
METROPOLITAN TRANSIT SYSTEM Harry Mathis, Chair (A) Hon. Mona Rios
NORTH COUNTY TRANSIT DISTRICT Hon. Mark Packard, Chair (A) Hon. Ed Gallo (A) Hon. Mike Nichols
U.S. DEPARTMENT OF DEFENSE CAPT John J. Adametz, CEC, USN, Commanding Officer Naval Facilities Engineering Command Southwest (A) CAPT Daniel P. Turner, CEC, USN, Executive Officer Naval Facilities Engineering Command Southwest
SAN DIEGO UNIFIED PORT DISTRICT Hon. Garry Bonelli, Commissioner (A) Hon. Marshall Merrifield, Chair
SAN DIEGO COUNTY WATER AUTHORITY Mark Muir, Vice Chair (A) Jim Madaffer, Director (A) Christy Guerin, Director
SOUTHERN CALIFORNIA TRIBAL CHAIRMEN’S ASSOCIATION Hon. Allen Lawson, Chairman, San Pasqual Band of Diegueño Indians Hon. Robert Smith, Chairman, Pala Band of Mission Indians
MEXICO Hon. Remedios Gómez-Arnau, Cónsul General of Mexico (A) Hon Rafael Laveaga Deputy Cónsul General of Mexico (A) Vice Consul Ruth Alicia López
Thirty-Six Years of Crime in the San Diego Region: 1980 through 2015 3
FAST FACTS
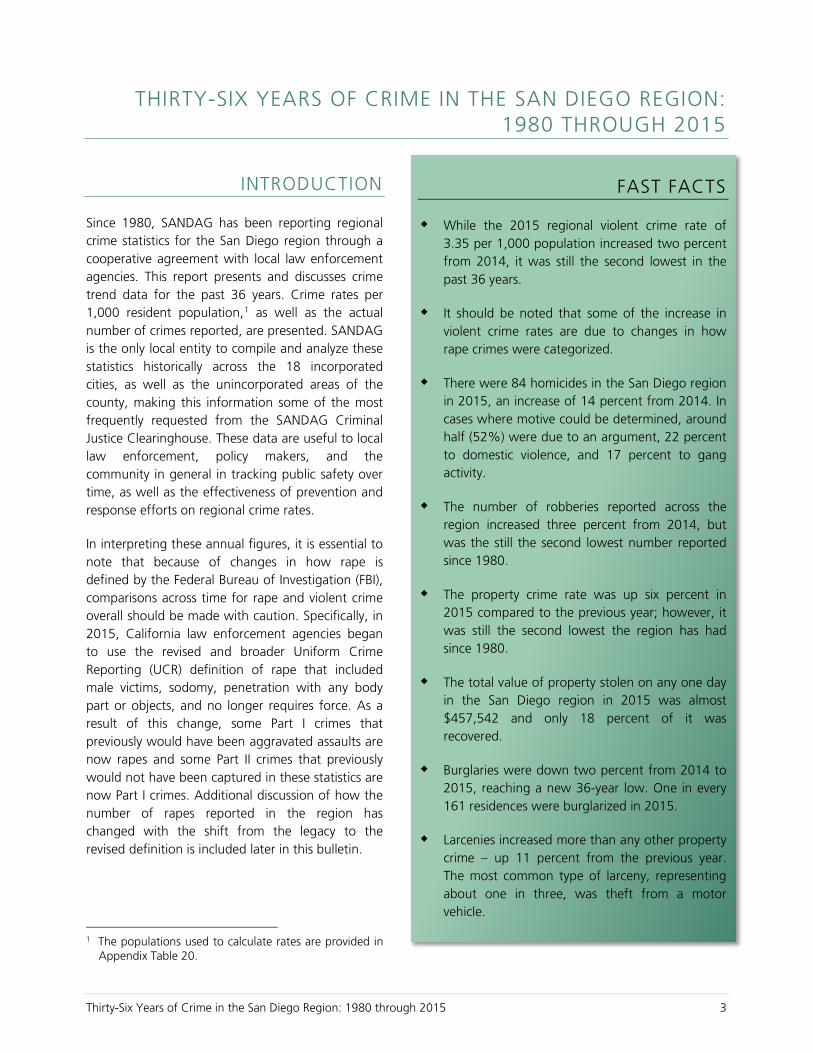
While the 2015 regional violent crime rate of 3.35 per 1,000 population increased two percent from 2014, it was still the second lowest in the past 36 years.
It should be noted that some of the increase in violent crime rates are due to changes in how rape crimes were categorized.
There were 84 homicides in the San Diego region in 2015, an increase of 14 percent from 2014. In cases where motive could be determined, around half (52%) were due to an argument, 22 percent to domestic violence, and 17 percent to gang activity.
The number of robberies reported across the region increased three percent from 2014, but was the still the second lowest number reported since 1980.
The property crime rate was up six percent in 2015 compared to the previous year; however, it was still the second lowest the region has had since 1980.
The total value of property stolen on any one day in the San Diego region in 2015 was almost $457,542 and only 18 percent of it was recovered.
Burglaries were down two percent from 2014 to 2015, reaching a new 36-year low. One in every 161 residences were burglarized in 2015.
Larcenies increased more than any other property crime – up 11 percent from the previous year. The most common type of larceny, representing about one in three, was theft from a motor vehicle.
THIRTY-SIX YEARS OF CRIME IN THE SAN DIEGO REGION: 1980 THROUGH 2015
INTRODUCTION
Since 1980, SANDAG has been reporting regional crime statistics for the San Diego region through a cooperative agreement with local law enforcement agencies. This report presents and discusses crime trend data for the past 36 years. Crime rates per 1,000 resident population,1 as well as the actual number of crimes reported, are presented. SANDAG is the only local entity to compile and analyze these statistics historically across the 18 incorporated cities, as well as the unincorporated areas of the county, making this information some of the most frequently requested from the SANDAG Criminal Justice Clearinghouse. These data are useful to local law enforcement, policy makers, and the community in general in tracking public safety over time, as well as the effectiveness of prevention and response efforts on regional crime rates.
In interpreting these annual figures, it is essential to note that because of changes in how rape is defined by the Federal Bureau of Investigation (FBI), comparisons across time for rape and violent crime overall should be made with caution. Specifically, in 2015, California law enforcement agencies began to use the revised and broader Uniform Crime Reporting (UCR) definition of rape that included male victims, sodomy, penetration with any body part or objects, and no longer requires force. As a result of this change, some Part I crimes that previously would have been aggravated assaults are now rapes and some Part II crimes that previously would not have been captured in these statistics are now Part I crimes. Additional discussion of how the number of rapes reported in the region has changed with the shift from the legacy to the revised definition is included later in this bulletin.
1 The populations used to calculate rates are provided in
Appendix Table 20.
Thirty-Six Years of Crime in the San Diego Region: 1980 through 2015 4
OVERALL CRIME
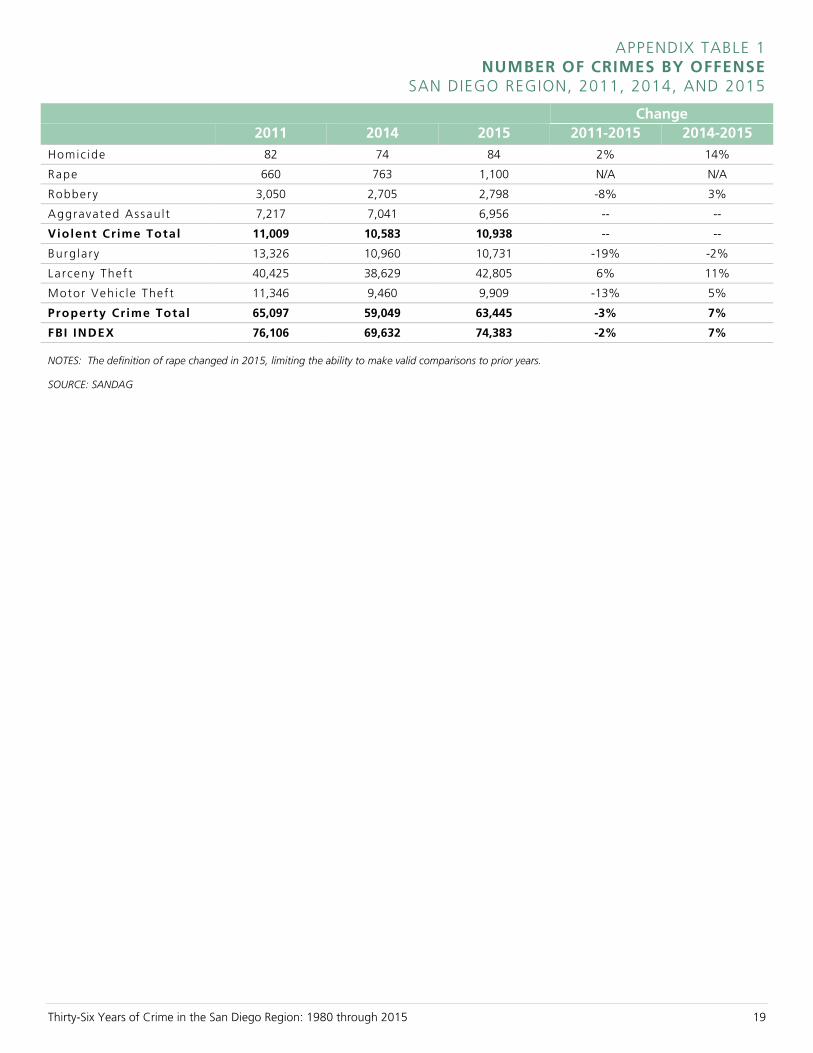
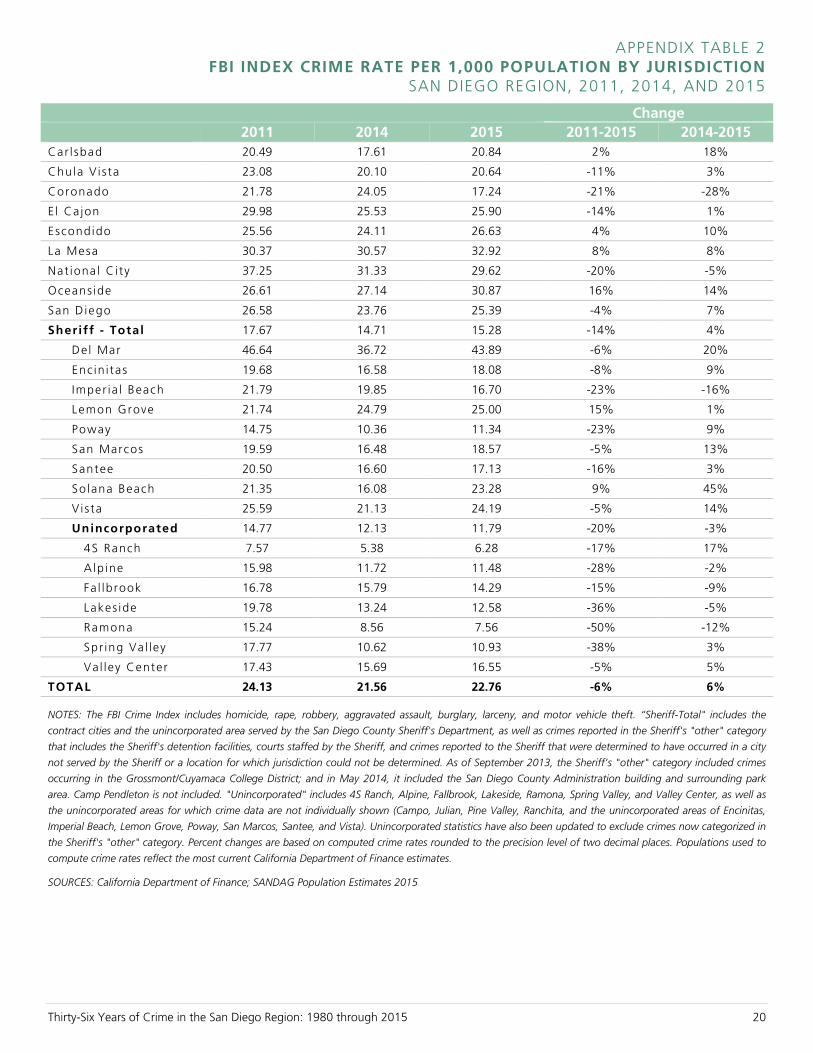
There was a total of 74,383 Part I crimes in the San Diego region in 2015 (Appendix Tables 1 and 5), which equated to 22.76 crimes per 1,000 population (Appendix Table 2). Part I crimes include four violent offenses (homicide, rape, robbery, and aggravated assault) and three property offenses (burglary, larceny, and motor vehicle theft) that are tracked nationwide in a standardized manner by the FBI, with agencies submitting crime data through the UCR system. Other crimes, such as drug-related offenses, vandalism, and fraud, also are documented by local law enforcement as Part II crimes. However, because categorization schemes can vary across agencies, standardized numbers for Part II crimes are not available, even though these crimes may be sizeable in number and require substantial attention and resources from law enforcement.
VIOLENT CRIME
In 2015, there were 10,938 Part I violent crimes reported to law enforcement in the San Diego region (Appendix Tables 1 and 6).2 The most common type was aggravated assault, which represented just under two-thirds (64%) of all violent crime in 2015; robbery represented 26 percent, rape 10 percent, and homicide 1 percent. According to statistics from the National Crime Victimization Survey,3 46 percent of violent crime was reported to law enforcement nationwide in 2014 (not shown).
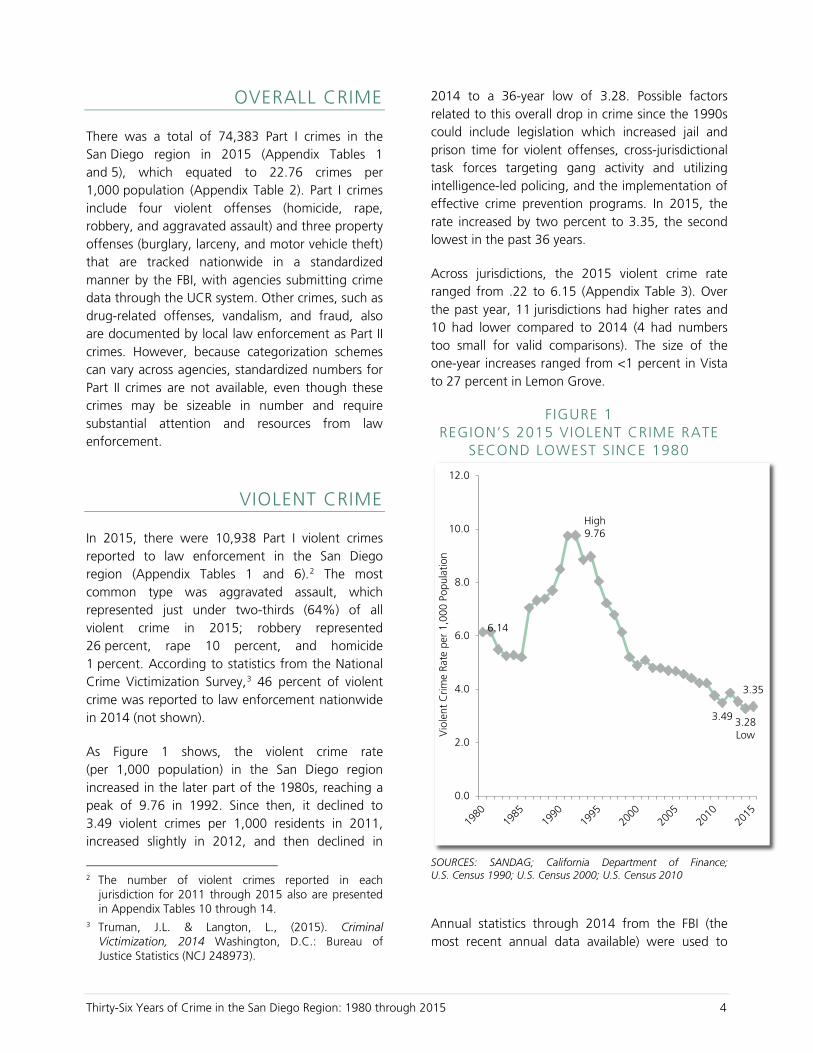
As Figure 1 shows, the violent crime rate (per 1,000 population) in the San Diego region increased in the later part of the 1980s, reaching a peak of 9.76 in 1992. Since then, it declined to 3.49 violent crimes per 1,000 residents in 2011, increased slightly in 2012, and then declined in
2 The number of violent crimes reported in each
jurisdiction for 2011 through 2015 also are presented in Appendix Tables 10 through 14.
3 Truman, J.L. & Langton, L., (2015). Criminal Victimization, 2014 Washington, D.C.: Bureau of Justice Statistics (NCJ 248973).
2014 to a 36-year low of 3.28. Possible factors related to this overall drop in crime since the 1990s could include legislation which increased jail and prison time for violent offenses, cross-jurisdictional task forces targeting gang activity and utilizing intelligence-led policing, and the implementation of effective crime prevention programs. In 2015, the rate increased by two percent to 3.35, the second lowest in the past 36 years.
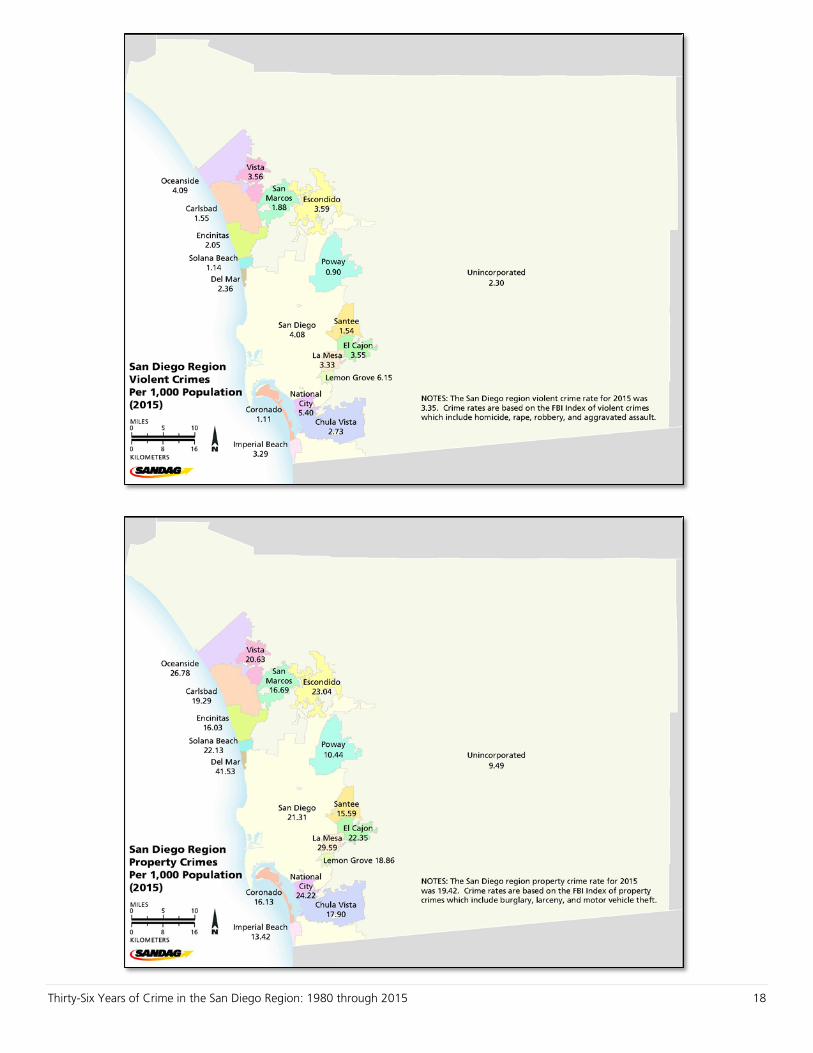
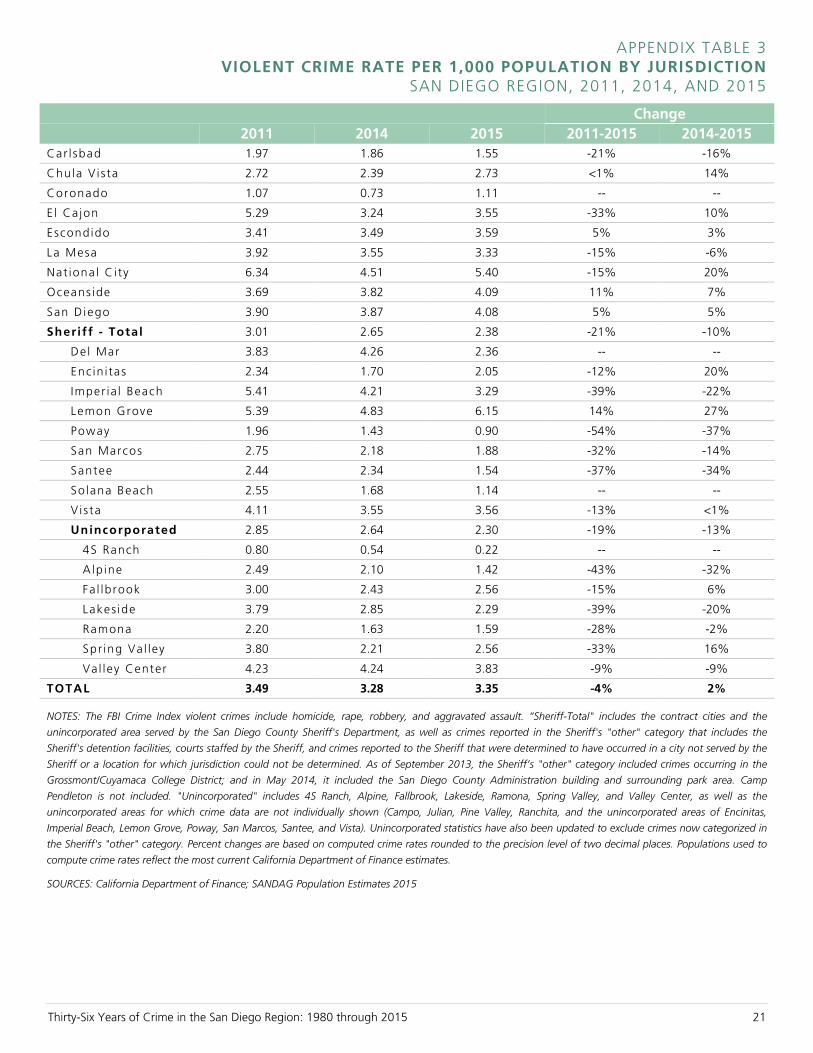
Across jurisdictions, the 2015 violent crime rate ranged from .22 to 6.15 (Appendix Table 3). Over the past year, 11 jurisdictions had higher rates and 10 had lower compared to 2014 (4 had numbers too small for valid comparisons). The size of the one-year increases ranged from <1 percent in Vista to 27 percent in Lemon Grove.
FIGURE 1 REGION’S 2015 VIOLENT CRIME RATE
SECOND LOWEST SINCE 1980
SOURCES: SANDAG; California Department of Finance; U.S. Census 1990; U.S. Census 2000; U.S. Census 2010
Annual statistics through 2014 from the FBI (the most recent annual data available) were used to
6.14
High9.76
3.49 3.28Low
3.35
0.0
2.0
4.0
6.0
8.0
10.0
12.0
Vio
lent
Crim
e Ra
te p
er 1
,000
Pop
ulat
ion
Thirty-Six Years of Crime in the San Diego Region: 1980 through 2015 5
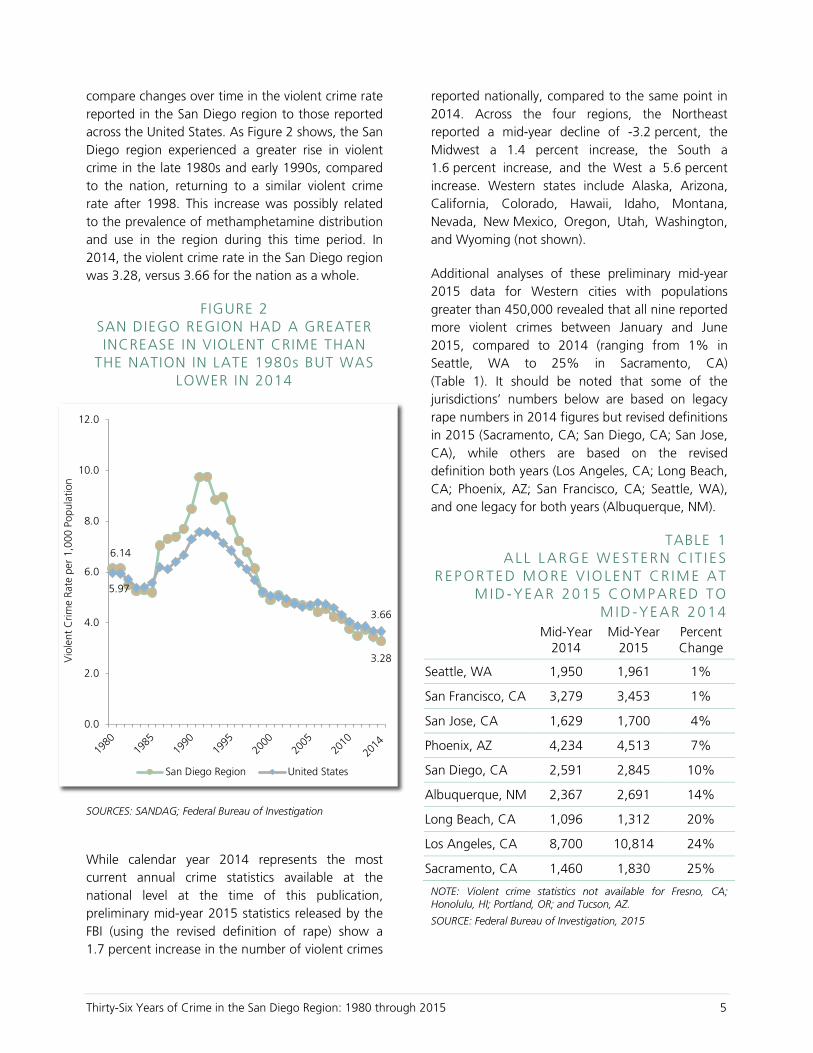
compare changes over time in the violent crime rate reported in the San Diego region to those reported across the United States. As Figure 2 shows, the San Diego region experienced a greater rise in violent crime in the late 1980s and early 1990s, compared to the nation, returning to a similar violent crime rate after 1998. This increase was possibly related to the prevalence of methamphetamine distribution and use in the region during this time period. In 2014, the violent crime rate in the San Diego region was 3.28, versus 3.66 for the nation as a whole.
F IGURE 2 SAN DIEGO REGION HAD A GREATER INCREASE IN VIOLENT CRIME THAN
THE NATION IN LATE 1980s BUT WAS LOWER IN 2014
SOURCES: SANDAG; Federal Bureau of Investigation
While calendar year 2014 represents the most current annual crime statistics available at the national level at the time of this publication, preliminary mid-year 2015 statistics released by the FBI (using the revised definition of rape) show a 1.7 percent increase in the number of violent crimes
reported nationally, compared to the same point in 2014. Across the four regions, the Northeast reported a mid-year decline of -3.2 percent, the Midwest a 1.4 percent increase, the South a 1.6 percent increase, and the West a 5.6 percent increase. Western states include Alaska, Arizona, California, Colorado, Hawaii, Idaho, Montana, Nevada, New Mexico, Oregon, Utah, Washington, and Wyoming (not shown).
Additional analyses of these preliminary mid-year 2015 data for Western cities with populations greater than 450,000 revealed that all nine reported more violent crimes between January and June 2015, compared to 2014 (ranging from 1% in Seattle, WA to 25% in Sacramento, CA) (Table 1). It should be noted that some of the jurisdictions’ numbers below are based on legacy rape numbers in 2014 figures but revised definitions in 2015 (Sacramento, CA; San Diego, CA; San Jose, CA), while others are based on the revised definition both years (Los Angeles, CA; Long Beach, CA; Phoenix, AZ; San Francisco, CA; Seattle, WA), and one legacy for both years (Albuquerque, NM).
TABLE 1 ALL L AR GE W EST ERN C IT I ES
R EP OR TE D MORE V IOLE NT CR IM E AT M ID -YE AR 20 15 COMP AR ED TO
M ID -YE AR 20 14
Mid-Year
2014 Mid-Year
2015 Percent Change
Seattle, WA 1,950 1,961 1%
San Francisco, CA 3,279 3,453 1%
San Jose, CA 1,629 1,700 4%
Phoenix, AZ 4,234 4,513 7%
San Diego, CA 2,591 2,845 10%
Albuquerque, NM 2,367 2,691 14%
Long Beach, CA 1,096 1,312 20%
Los Angeles, CA 8,700 10,814 24%
Sacramento, CA 1,460 1,830 25%
NOTE: Violent crime statistics not available for Fresno, CA; Honolulu, HI; Portland, OR; and Tucson, AZ.
SOURCE: Federal Bureau of Investigation, 2015
6.14
3.28
5.97
3.66
0.0
2.0
4.0
6.0
8.0
10.0
12.0
Vio
lent
Crim
e Ra
te p
er 1
,000
Pop
ulat
ion
San Diego Region United States
Thirty-Six Years of Crime in the San Diego Region: 1980 through 2015 6
Homicide
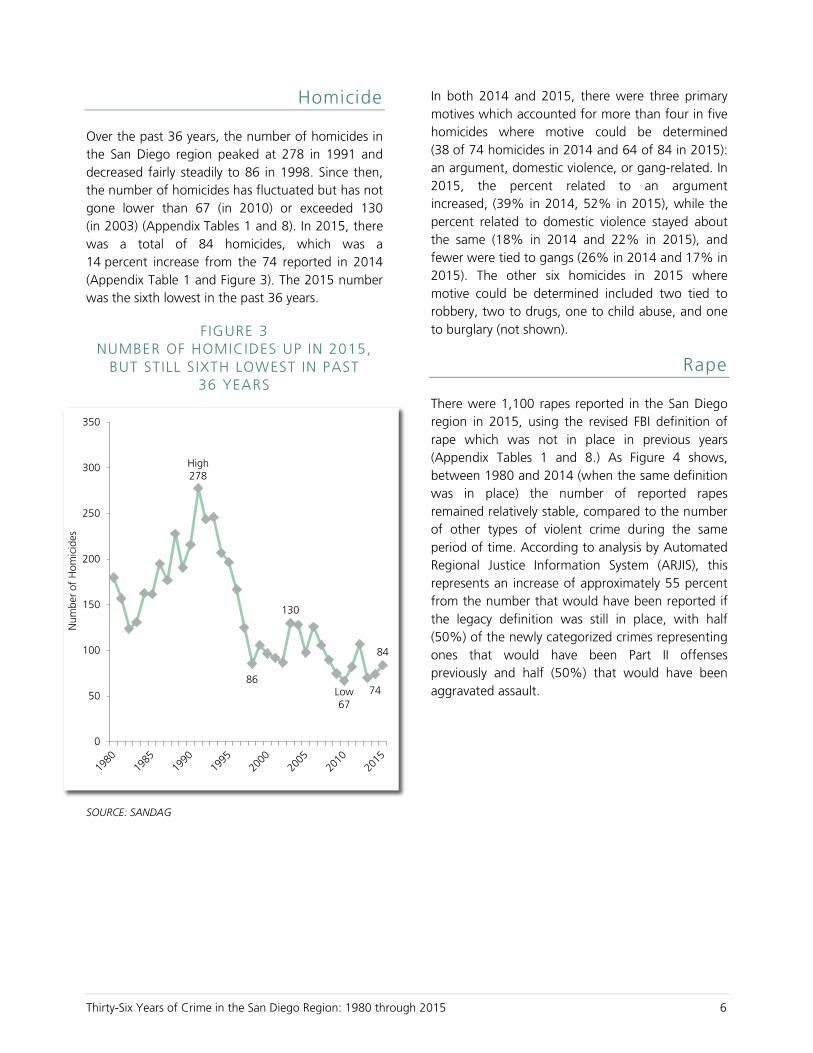
Over the past 36 years, the number of homicides in the San Diego region peaked at 278 in 1991 and decreased fairly steadily to 86 in 1998. Since then, the number of homicides has fluctuated but has not gone lower than 67 (in 2010) or exceeded 130 (in 2003) (Appendix Tables 1 and 8). In 2015, there was a total of 84 homicides, which was a 14 percent increase from the 74 reported in 2014 (Appendix Table 1 and Figure 3). The 2015 number was the sixth lowest in the past 36 years.
F IGURE 3 NUMBER OF HOMICIDES UP IN 2015,
BUT STILL S IXTH LOWEST IN PAST 36 YEARS
SOURCE: SANDAG
In both 2014 and 2015, there were three primary motives which accounted for more than four in five homicides where motive could be determined (38 of 74 homicides in 2014 and 64 of 84 in 2015): an argument, domestic violence, or gang-related. In 2015, the percent related to an argument increased, (39% in 2014, 52% in 2015), while the percent related to domestic violence stayed about the same (18% in 2014 and 22% in 2015), and fewer were tied to gangs (26% in 2014 and 17% in 2015). The other six homicides in 2015 where motive could be determined included two tied to robbery, two to drugs, one to child abuse, and one to burglary (not shown).
Rape
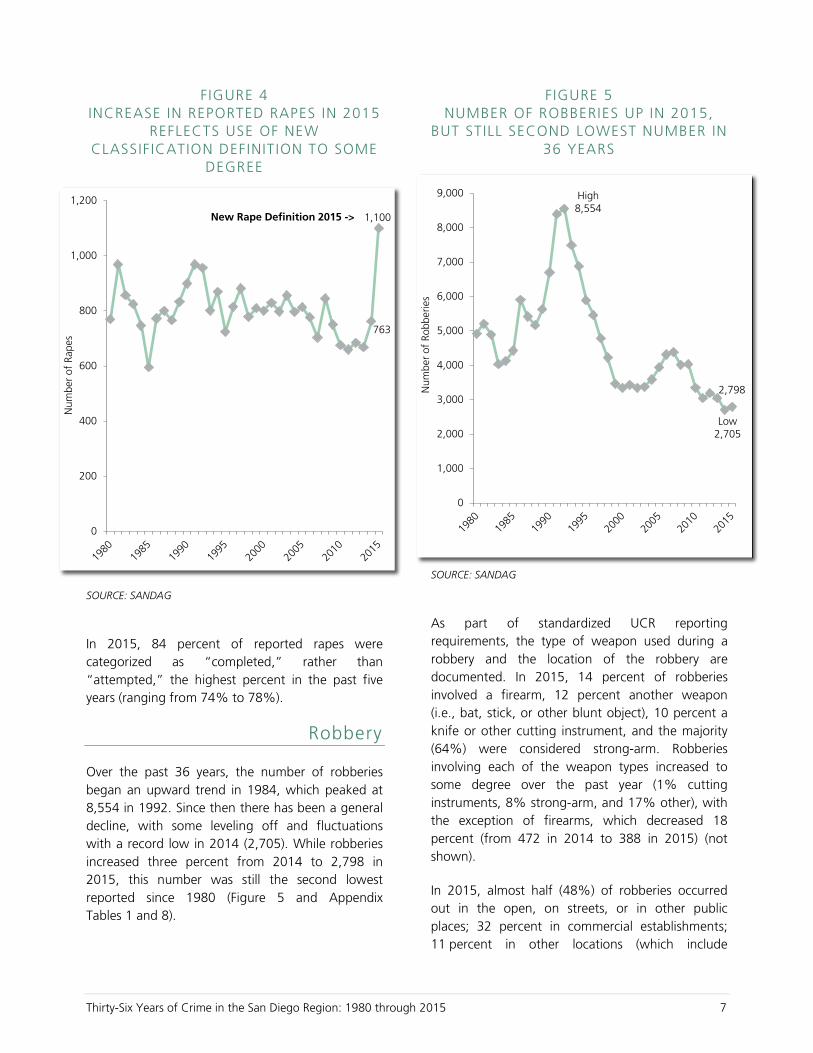
There were 1,100 rapes reported in the San Diego region in 2015, using the revised FBI definition of rape which was not in place in previous years (Appendix Tables 1 and 8.) As Figure 4 shows, between 1980 and 2014 (when the same definition was in place) the number of reported rapes remained relatively stable, compared to the number of other types of violent crime during the same period of time. According to analysis by Automated Regional Justice Information System (ARJIS), this represents an increase of approximately 55 percent from the number that would have been reported if the legacy definition was still in place, with half (50%) of the newly categorized crimes representing ones that would have been Part II offenses previously and half (50%) that would have been aggravated assault.
High278
86
130
Low67
74
84
0
50
100
150
200
250
300
350
Num
ber o
f H
omic
ides
Thirty-Six Years of Crime in the San Diego Region: 1980 through 2015 7
FIGURE 4 INCREASE IN REPORTED RAPES IN 2015
REFLECTS USE OF NEW CLASSIF ICATION DEFINITION TO SOME
DEGREE
SOURCE: SANDAG
In 2015, 84 percent of reported rapes were categorized as “completed,” rather than “attempted,” the highest percent in the past five years (ranging from 74% to 78%).
Robbery
Over the past 36 years, the number of robberies began an upward trend in 1984, which peaked at 8,554 in 1992. Since then there has been a general decline, with some leveling off and fluctuations with a record low in 2014 (2,705). While robberies increased three percent from 2014 to 2,798 in 2015, this number was still the second lowest reported since 1980 (Figure 5 and Appendix Tables 1 and 8).
F IGURE 5 NUMBER OF ROBBERIES UP IN 2015,
BUT STILL SECOND LOWEST NUMBER IN 36 YEARS
SOURCE: SANDAG
As part of standardized UCR reporting requirements, the type of weapon used during a robbery and the location of the robbery are documented. In 2015, 14 percent of robberies involved a firearm, 12 percent another weapon (i.e., bat, stick, or other blunt object), 10 percent a knife or other cutting instrument, and the majority (64%) were considered strong-arm. Robberies involving each of the weapon types increased to some degree over the past year (1% cutting instruments, 8% strong-arm, and 17% other), with the exception of firearms, which decreased 18 percent (from 472 in 2014 to 388 in 2015) (not shown).
In 2015, almost half (48%) of robberies occurred out in the open, on streets, or in other public places; 32 percent in commercial establishments; 11 percent in other locations (which include
763
1,100
0
200
400
600
800
1,000
1,200
Num
ber o
f Ra
pes
New Rape Definition 2015 ->
High8,554
Low2,705
2,798
0
1,000
2,000
3,000
4,000
5,000
6,000
7,000
8,000
9,000
Num
ber o
f Ro
bber
ies
Thirty-Six Years of Crime in the San Diego Region: 1980 through 2015 8
wooded areas, churches, schools, and other public buildings); 8 percent in residences; and 2 percent in banks. Robberies in residences, on highways, and in businesses increased in 2015 (15%, 8% and 3%, respectively), but those in banks and in other locations decreased (-49% and -7%, respectively) (not shown).
For the 12 jurisdictions with robbery numbers large enough for comparison in 2014 and 2015, 6 experienced a decrease in the number of robberies (ranging from -6% in Vista to -20% in El Cajon), and 6 experienced an increase (from 5% in San Diego to 56% in Lemon Grove) (Appendix Tables 13 and 14).
Aggravated Assault
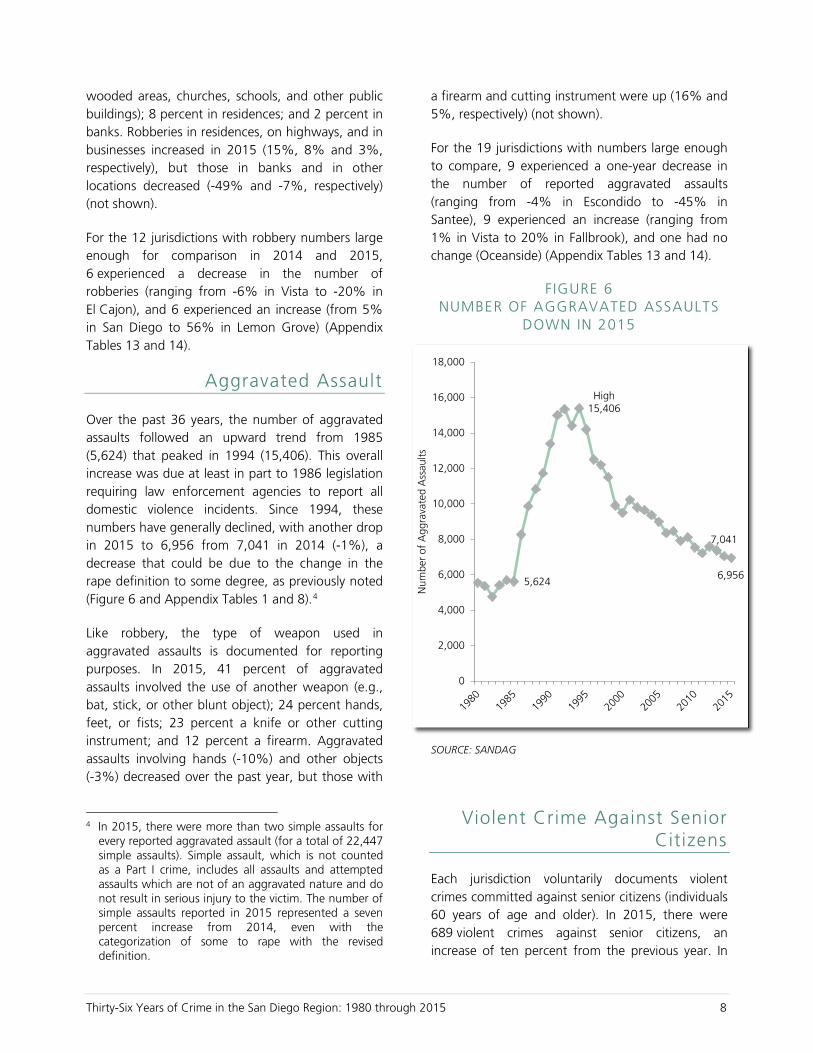
Over the past 36 years, the number of aggravated assaults followed an upward trend from 1985 (5,624) that peaked in 1994 (15,406). This overall increase was due at least in part to 1986 legislation requiring law enforcement agencies to report all domestic violence incidents. Since 1994, these numbers have generally declined, with another drop in 2015 to 6,956 from 7,041 in 2014 (-1%), a decrease that could be due to the change in the rape definition to some degree, as previously noted (Figure 6 and Appendix Tables 1 and 8).4
Like robbery, the type of weapon used in aggravated assaults is documented for reporting purposes. In 2015, 41 percent of aggravated assaults involved the use of another weapon (e.g., bat, stick, or other blunt object); 24 percent hands, feet, or fists; 23 percent a knife or other cutting instrument; and 12 percent a firearm. Aggravated assaults involving hands (-10%) and other objects (-3%) decreased over the past year, but those with
4 In 2015, there were more than two simple assaults for
every reported aggravated assault (for a total of 22,447 simple assaults). Simple assault, which is not counted as a Part I crime, includes all assaults and attempted assaults which are not of an aggravated nature and do not result in serious injury to the victim. The number of simple assaults reported in 2015 represented a seven percent increase from 2014, even with the categorization of some to rape with the revised definition.
a firearm and cutting instrument were up (16% and 5%, respectively) (not shown).
For the 19 jurisdictions with numbers large enough to compare, 9 experienced a one-year decrease in the number of reported aggravated assaults (ranging from -4% in Escondido to -45% in Santee), 9 experienced an increase (ranging from 1% in Vista to 20% in Fallbrook), and one had no change (Oceanside) (Appendix Tables 13 and 14).
F IGURE 6 NUMBER OF AGGRAVATED ASSAULTS
DOWN IN 2015
SOURCE: SANDAG
Violent Crime Against Senior Citizens
Each jurisdiction voluntarily documents violent crimes committed against senior citizens (individuals 60 years of age and older). In 2015, there were 689 violent crimes against senior citizens, an increase of ten percent from the previous year. In
5,624
High15,406
7,041
6,956
0
2,000
4,000
6,000
8,000
10,000
12,000
14,000
16,000
18,000
Num
ber o
f A
ggra
vate
d A
ssau
lts
Thirty-Six Years of Crime in the San Diego Region: 1980 through 2015 9
2015, these violent crimes against seniors included 13 homicides, 26 rapes, 184 robberies, and 466 aggravated assaults. Of the ten reporting agencies, only three had numbers large enough to compare over time. The San Diego Police Department reported an increase of 2 percent (from 345 in 2014 to 353 in 2015), the Sheriff reported an increase of 20 percent (from 128 to 154), and Oceanside had an increase of 29 percent (from 34 to 44) (not shown). Again, it is possible at least some of this change could be related to revised crime categories.
PROPERTY CRIME
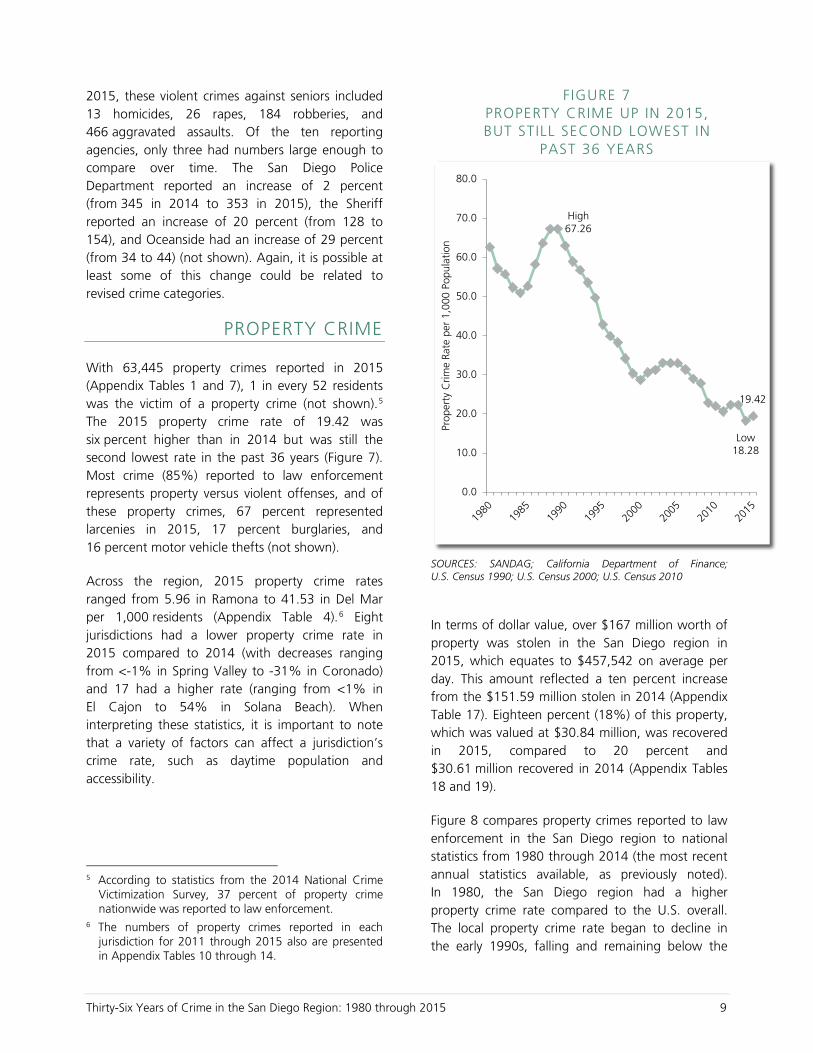
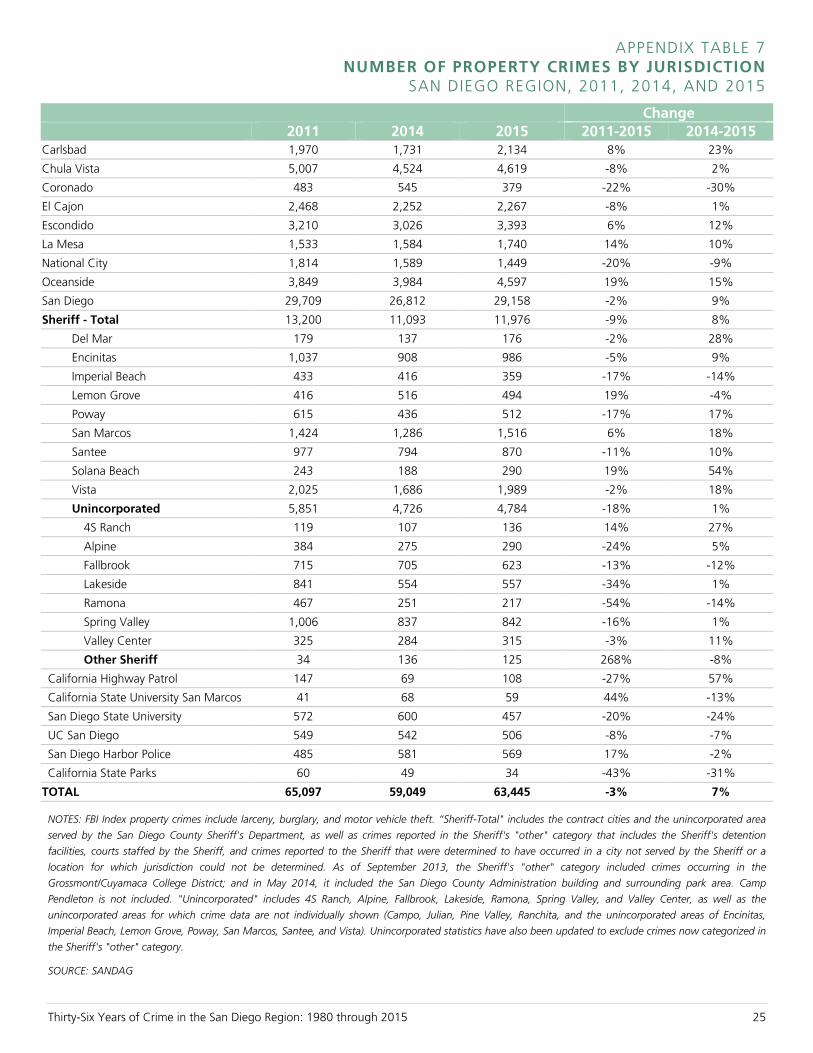
With 63,445 property crimes reported in 2015 (Appendix Tables 1 and 7), 1 in every 52 residents was the victim of a property crime (not shown).5 The 2015 property crime rate of 19.42 was six percent higher than in 2014 but was still the second lowest rate in the past 36 years (Figure 7). Most crime (85%) reported to law enforcement represents property versus violent offenses, and of these property crimes, 67 percent represented larcenies in 2015, 17 percent burglaries, and 16 percent motor vehicle thefts (not shown).
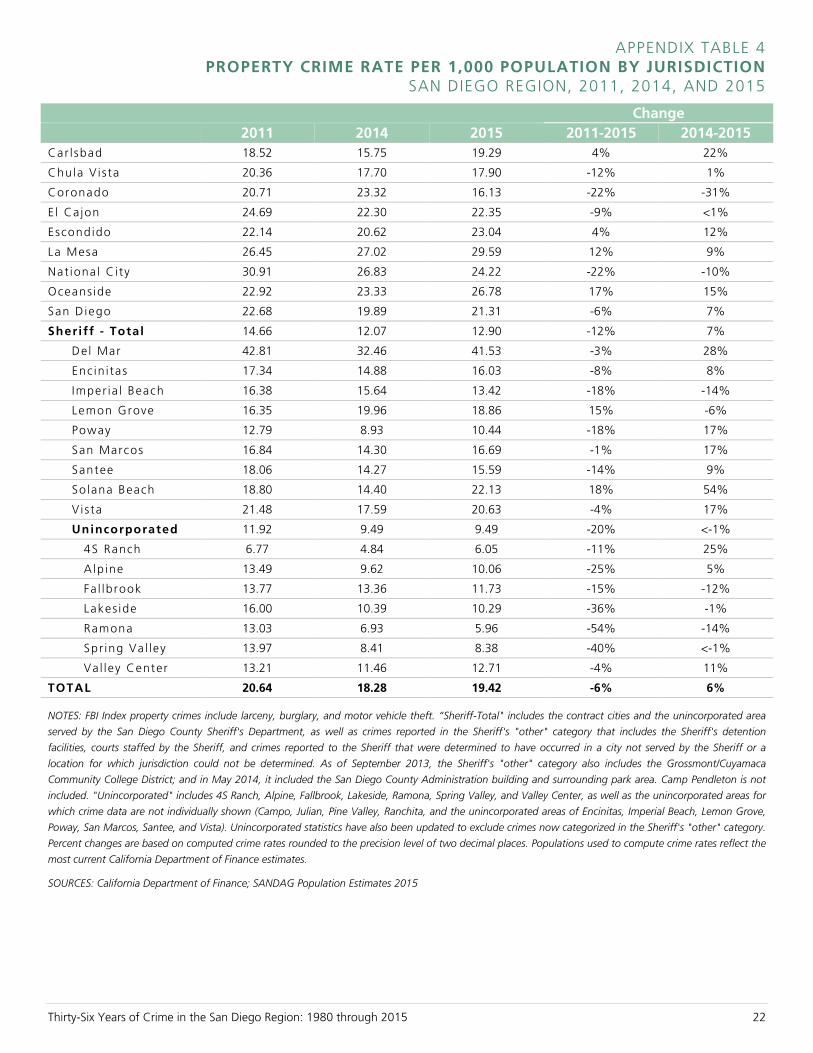
Across the region, 2015 property crime rates ranged from 5.96 in Ramona to 41.53 in Del Mar per 1,000 residents (Appendix Table 4).6 Eight jurisdictions had a lower property crime rate in 2015 compared to 2014 (with decreases ranging from <-1% in Spring Valley to -31% in Coronado) and 17 had a higher rate (ranging from <1% in El Cajon to 54% in Solana Beach). When interpreting these statistics, it is important to note that a variety of factors can affect a jurisdiction’s crime rate, such as daytime population and accessibility.
5 According to statistics from the 2014 National Crime
Victimization Survey, 37 percent of property crime nationwide was reported to law enforcement.
6 The numbers of property crimes reported in each jurisdiction for 2011 through 2015 also are presented in Appendix Tables 10 through 14.
F IGURE 7 PROPERTY CRIME UP IN 2015, BUT STILL SECOND LOWEST IN
PAST 36 YEARS
SOURCES: SANDAG; California Department of Finance; U.S. Census 1990; U.S. Census 2000; U.S. Census 2010
In terms of dollar value, over $167 million worth of property was stolen in the San Diego region in 2015, which equates to $457,542 on average per day. This amount reflected a ten percent increase from the $151.59 million stolen in 2014 (Appendix Table 17). Eighteen percent (18%) of this property, which was valued at $30.84 million, was recovered in 2015, compared to 20 percent and $30.61 million recovered in 2014 (Appendix Tables 18 and 19).
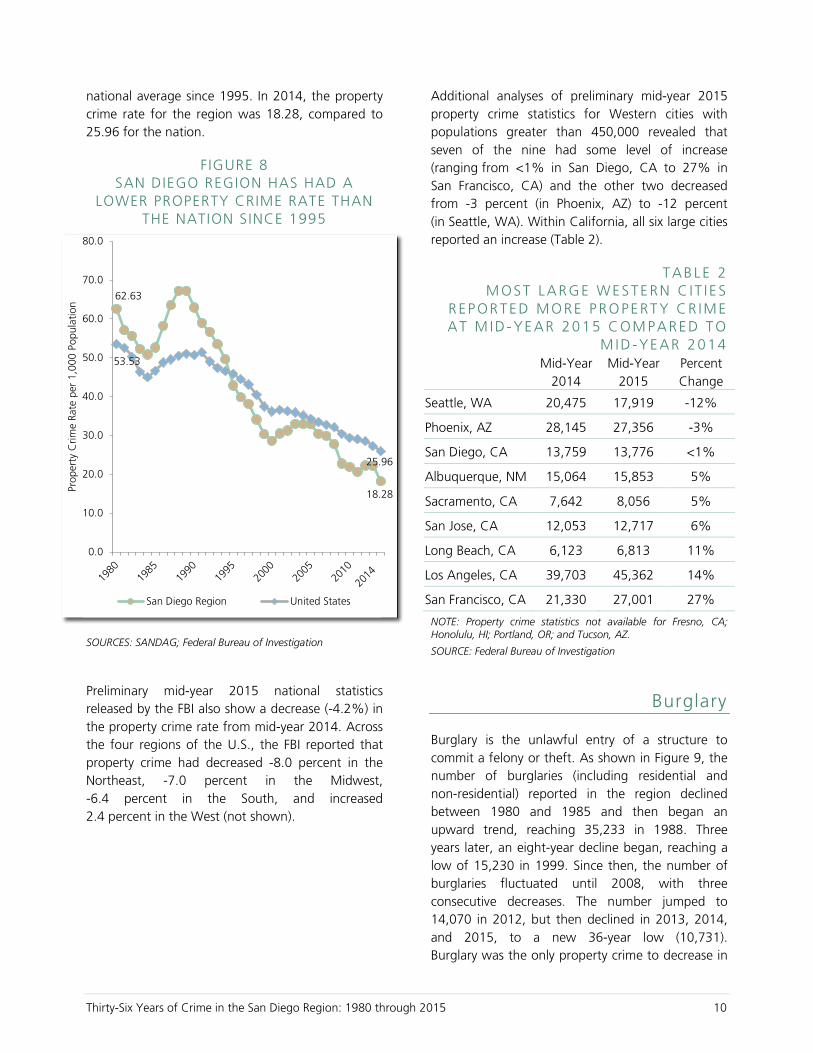
Figure 8 compares property crimes reported to law enforcement in the San Diego region to national statistics from 1980 through 2014 (the most recent annual statistics available, as previously noted). In 1980, the San Diego region had a higher property crime rate compared to the U.S. overall. The local property crime rate began to decline in the early 1990s, falling and remaining below the
High67.26
Low18.28
19.42
0.0
10.0
20.0
30.0
40.0
50.0
60.0
70.0
80.0
Prop
erty
Crim
e Ra
te p
er 1
,000
Pop
ulat
ion
Thirty-Six Years of Crime in the San Diego Region: 1980 through 2015 10
national average since 1995. In 2014, the property crime rate for the region was 18.28, compared to 25.96 for the nation.
FIGURE 8 SAN DIEGO REGION HAS HAD A
LOWER PROPERTY CRIME RATE THAN THE NATION SINCE 1995
SOURCES: SANDAG; Federal Bureau of Investigation
Preliminary mid-year 2015 national statistics released by the FBI also show a decrease (-4.2%) in the property crime rate from mid-year 2014. Across the four regions of the U.S., the FBI reported that property crime had decreased -8.0 percent in the Northeast, -7.0 percent in the Midwest, -6.4 percent in the South, and increased 2.4 percent in the West (not shown).
Additional analyses of preliminary mid-year 2015 property crime statistics for Western cities with populations greater than 450,000 revealed that seven of the nine had some level of increase (ranging from <1% in San Diego, CA to 27% in San Francisco, CA) and the other two decreased from -3 percent (in Phoenix, AZ) to -12 percent (in Seattle, WA). Within California, all six large cities reported an increase (Table 2).
T AB LE 2 M OST LARGE WES TE RN C IT I E S
R EP OR TE D MORE P ROPE RT Y CR IME AT M ID- YE AR 20 15 COM PARE D T O
M ID -YE AR 20 14
Mid-Year
2014 Mid-Year
2015 Percent Change
Seattle, WA 20,475 17,919 -12%
Phoenix, AZ 28,145 27,356 -3%
San Diego, CA 13,759 13,776 <1%
Albuquerque, NM 15,064 15,853 5%
Sacramento, CA 7,642 8,056 5%
San Jose, CA 12,053 12,717 6%
Long Beach, CA 6,123 6,813 11%
Los Angeles, CA 39,703 45,362 14%
San Francisco, CA 21,330 27,001 27%
NOTE: Property crime statistics not available for Fresno, CA; Honolulu, HI; Portland, OR; and Tucson, AZ.
SOURCE: Federal Bureau of Investigation
Burglary
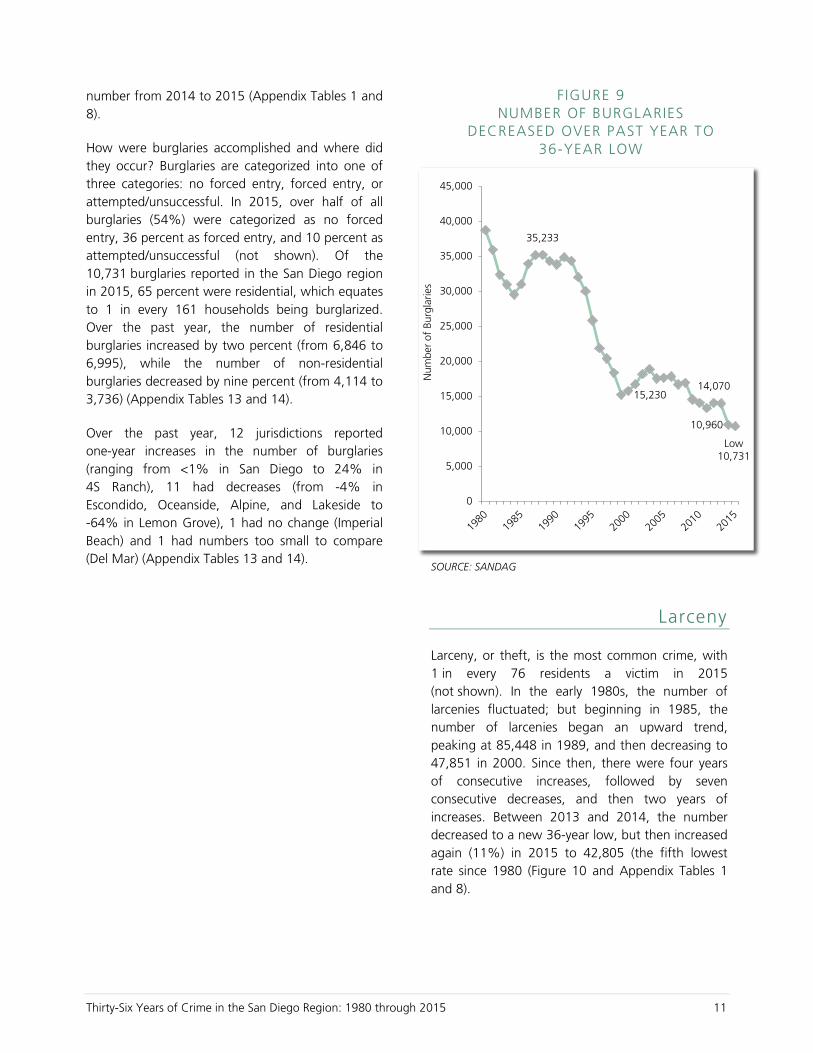
Burglary is the unlawful entry of a structure to commit a felony or theft. As shown in Figure 9, the number of burglaries (including residential and non-residential) reported in the region declined between 1980 and 1985 and then began an upward trend, reaching 35,233 in 1988. Three years later, an eight-year decline began, reaching a low of 15,230 in 1999. Since then, the number of burglaries fluctuated until 2008, with three consecutive decreases. The number jumped to 14,070 in 2012, but then declined in 2013, 2014, and 2015, to a new 36-year low (10,731). Burglary was the only property crime to decrease in
62.63
18.28
53.53
25.96
0.0
10.0
20.0
30.0
40.0
50.0
60.0
70.0
80.0
Prop
erty
Crim
e Ra
te p
er 1
,000
Pop
ulat
ion
San Diego Region United States
Thirty-Six Years of Crime in the San Diego Region: 1980 through 2015 11
number from 2014 to 2015 (Appendix Tables 1 and 8).
How were burglaries accomplished and where did they occur? Burglaries are categorized into one of three categories: no forced entry, forced entry, or attempted/unsuccessful. In 2015, over half of all burglaries (54%) were categorized as no forced entry, 36 percent as forced entry, and 10 percent as attempted/unsuccessful (not shown). Of the 10,731 burglaries reported in the San Diego region in 2015, 65 percent were residential, which equates to 1 in every 161 households being burglarized. Over the past year, the number of residential burglaries increased by two percent (from 6,846 to 6,995), while the number of non-residential burglaries decreased by nine percent (from 4,114 to 3,736) (Appendix Tables 13 and 14).
Over the past year, 12 jurisdictions reported one-year increases in the number of burglaries (ranging from <1% in San Diego to 24% in 4S Ranch), 11 had decreases (from -4% in Escondido, Oceanside, Alpine, and Lakeside to -64% in Lemon Grove), 1 had no change (Imperial Beach) and 1 had numbers too small to compare (Del Mar) (Appendix Tables 13 and 14).
F IGURE 9 NUMBER OF BURGLARIES
DECREASED OVER PAST YEAR TO 36-YEAR LOW
SOURCE: SANDAG
Larceny
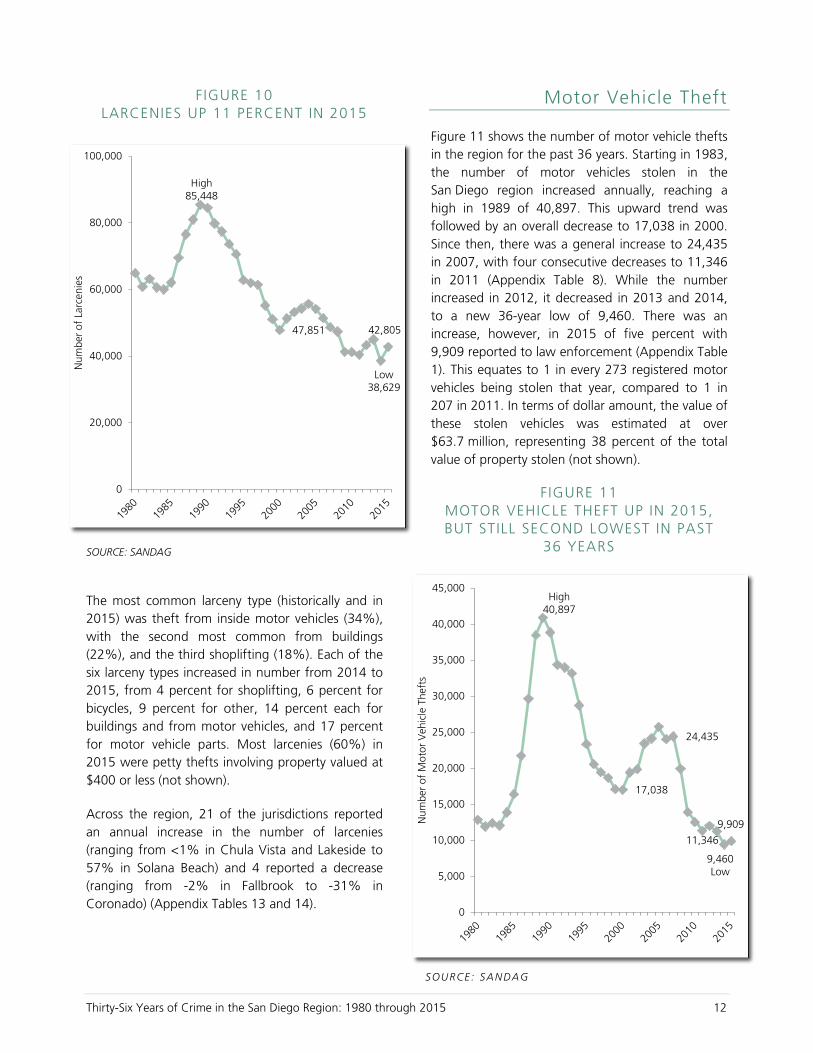
Larceny, or theft, is the most common crime, with 1 in every 76 residents a victim in 2015 (not shown). In the early 1980s, the number of larcenies fluctuated; but beginning in 1985, the number of larcenies began an upward trend, peaking at 85,448 in 1989, and then decreasing to 47,851 in 2000. Since then, there were four years of consecutive increases, followed by seven consecutive decreases, and then two years of increases. Between 2013 and 2014, the number decreased to a new 36-year low, but then increased again (11%) in 2015 to 42,805 (the fifth lowest rate since 1980 (Figure 10 and Appendix Tables 1 and 8).
35,233
15,23014,070
10,960
Low10,731
0
5,000
10,000
15,000
20,000
25,000
30,000
35,000
40,000
45,000
Num
ber o
f Bu
rgla
ries
Thirty-Six Years of Crime in the San Diego Region: 1980 through 2015 12
FIGURE 10 LARCENIES UP 11 PERCENT IN 2015
SOURCE: SANDAG
The most common larceny type (historically and in 2015) was theft from inside motor vehicles (34%), with the second most common from buildings (22%), and the third shoplifting (18%). Each of the six larceny types increased in number from 2014 to 2015, from 4 percent for shoplifting, 6 percent for bicycles, 9 percent for other, 14 percent each for buildings and from motor vehicles, and 17 percent for motor vehicle parts. Most larcenies (60%) in 2015 were petty thefts involving property valued at $400 or less (not shown).
Across the region, 21 of the jurisdictions reported an annual increase in the number of larcenies (ranging from <1% in Chula Vista and Lakeside to 57% in Solana Beach) and 4 reported a decrease (ranging from -2% in Fallbrook to -31% in Coronado) (Appendix Tables 13 and 14).
Motor Vehicle Theft
Figure 11 shows the number of motor vehicle thefts in the region for the past 36 years. Starting in 1983, the number of motor vehicles stolen in the San Diego region increased annually, reaching a high in 1989 of 40,897. This upward trend was followed by an overall decrease to 17,038 in 2000. Since then, there was a general increase to 24,435 in 2007, with four consecutive decreases to 11,346 in 2011 (Appendix Table 8). While the number increased in 2012, it decreased in 2013 and 2014, to a new 36-year low of 9,460. There was an increase, however, in 2015 of five percent with 9,909 reported to law enforcement (Appendix Table 1). This equates to 1 in every 273 registered motor vehicles being stolen that year, compared to 1 in 207 in 2011. In terms of dollar amount, the value of these stolen vehicles was estimated at over $63.7 million, representing 38 percent of the total value of property stolen (not shown).
F IGURE 11 MOTOR VEHICLE THEFT UP IN 2015, BUT STILL SECOND LOWEST IN PAST
36 YEARS
High85,448
47,851
Low38,629
42,805
0
20,000
40,000
60,000
80,000
100,000
Num
ber o
f La
rcen
ies
High40,897
17,038
24,435
11,346
9,460Low
9,909
0
5,000
10,000
15,000
20,000
25,000
30,000
35,000
40,000
45,000
Num
ber o
f M
otor
Veh
icle
The
fts
SOURCE : SANDAG
Thirty-Six Years of Crime in the San Diego Region: 1980 through 2015 13
Across the 19 jurisdictions, with more than 30 incidents of motor vehicle theft reported in 2014 and 2015, 14 reported one-year increases (ranging from 2% in San Diego to 36% in La Mesa) and 5 reported decreases (ranging from <-1% in Chula Vista to -31% in Imperial Beach) (Appendix Tables 13 and 14).
Arson
Unlike other FBI Index offenses, when arson is committed in concert with another FBI Index offense, both incidents must be reported, which is why arson is presented separately from other property crime statistics. There were 341 arsons reported in 2015, which was 13 percent less than the 392 in 2014 (Appendix Tables 13 and 14). Forty-one percent (41%) of arsons in 2015 were of structures and 59 percent were categorized as mobile and other non-structural property types (not shown).
DOMESTIC VIOLENCE
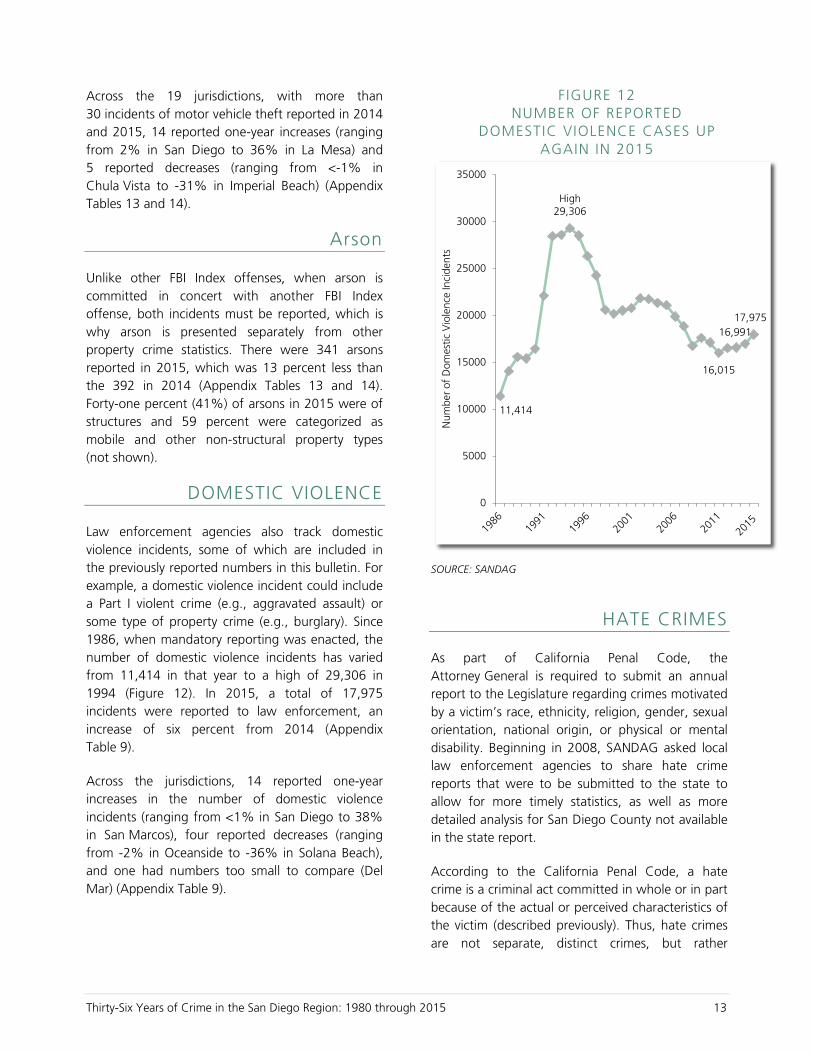
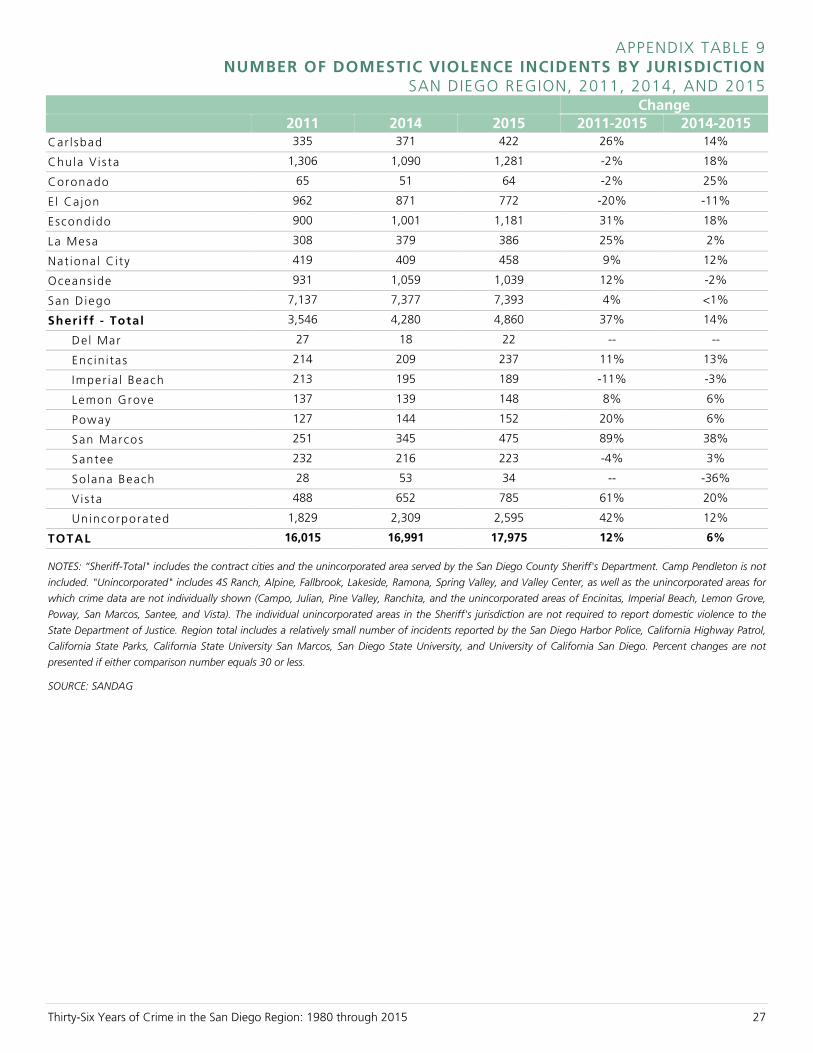
Law enforcement agencies also track domestic violence incidents, some of which are included in the previously reported numbers in this bulletin. For example, a domestic violence incident could include a Part I violent crime (e.g., aggravated assault) or some type of property crime (e.g., burglary). Since 1986, when mandatory reporting was enacted, the number of domestic violence incidents has varied from 11,414 in that year to a high of 29,306 in 1994 (Figure 12). In 2015, a total of 17,975 incidents were reported to law enforcement, an increase of six percent from 2014 (Appendix Table 9).
Across the jurisdictions, 14 reported one-year increases in the number of domestic violence incidents (ranging from <1% in San Diego to 38% in San Marcos), four reported decreases (ranging from -2% in Oceanside to -36% in Solana Beach), and one had numbers too small to compare (Del Mar) (Appendix Table 9).
F IGURE 12 NUMBER OF REPORTED
DOMESTIC VIOLENCE CASES UP AGAIN IN 2015
SOURCE: SANDAG
HATE CRIMES
As part of California Penal Code, the Attorney General is required to submit an annual report to the Legislature regarding crimes motivated by a victim’s race, ethnicity, religion, gender, sexual orientation, national origin, or physical or mental disability. Beginning in 2008, SANDAG asked local law enforcement agencies to share hate crime reports that were to be submitted to the state to allow for more timely statistics, as well as more detailed analysis for San Diego County not available in the state report.
According to the California Penal Code, a hate crime is a criminal act committed in whole or in part because of the actual or perceived characteristics of the victim (described previously). Thus, hate crimes are not separate, distinct crimes, but rather
11,414
High29,306
16,015
16,99117,975
0
5000
10000
15000
20000
25000
30000
35000
Num
ber o
f D
omes
tic V
iole
nce
Inci
dent
s
Thirty-Six Years of Crime in the San Diego Region: 1980 through 2015 14
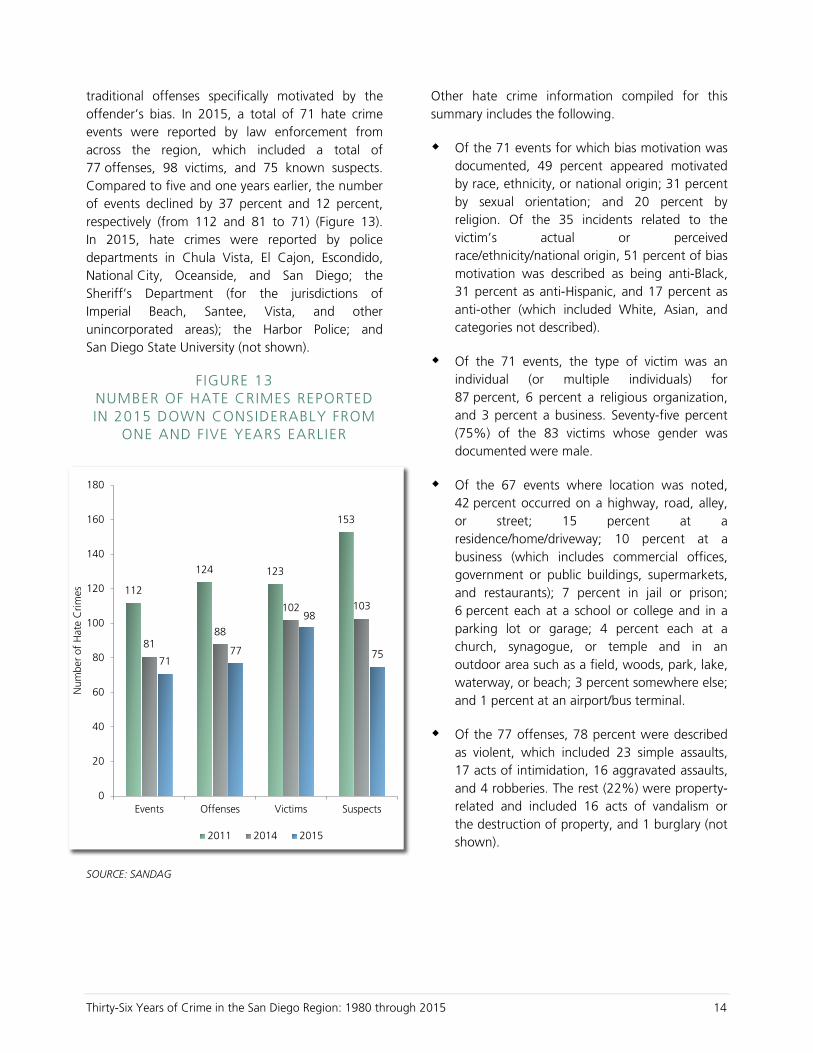
traditional offenses specifically motivated by the offender’s bias. In 2015, a total of 71 hate crime events were reported by law enforcement from across the region, which included a total of 77 offenses, 98 victims, and 75 known suspects. Compared to five and one years earlier, the number of events declined by 37 percent and 12 percent, respectively (from 112 and 81 to 71) (Figure 13). In 2015, hate crimes were reported by police departments in Chula Vista, El Cajon, Escondido, National City, Oceanside, and San Diego; the Sheriff’s Department (for the jurisdictions of Imperial Beach, Santee, Vista, and other unincorporated areas); the Harbor Police; and San Diego State University (not shown).
F IGURE 13 NUMBER OF HATE CRIMES REPORTED IN 2015 DOWN CONSIDERABLY FROM
ONE AND FIVE YEARS EARLIER
SOURCE: SANDAG
Other hate crime information compiled for this summary includes the following.
Of the 71 events for which bias motivation was documented, 49 percent appeared motivated by race, ethnicity, or national origin; 31 percent by sexual orientation; and 20 percent by religion. Of the 35 incidents related to the victim’s actual or perceived race/ethnicity/national origin, 51 percent of bias motivation was described as being anti-Black, 31 percent as anti-Hispanic, and 17 percent as anti-other (which included White, Asian, and categories not described).
Of the 71 events, the type of victim was an individual (or multiple individuals) for 87 percent, 6 percent a religious organization, and 3 percent a business. Seventy-five percent (75%) of the 83 victims whose gender was documented were male.
Of the 67 events where location was noted, 42 percent occurred on a highway, road, alley, or street; 15 percent at a residence/home/driveway; 10 percent at a business (which includes commercial offices, government or public buildings, supermarkets, and restaurants); 7 percent in jail or prison; 6 percent each at a school or college and in a parking lot or garage; 4 percent each at a church, synagogue, or temple and in an outdoor area such as a field, woods, park, lake, waterway, or beach; 3 percent somewhere else; and 1 percent at an airport/bus terminal.
Of the 77 offenses, 78 percent were described as violent, which included 23 simple assaults, 17 acts of intimidation, 16 aggravated assaults, and 4 robberies. The rest (22%) were property-related and included 16 acts of vandalism or the destruction of property, and 1 burglary (not shown).
112
124 123
153
8188
102 103
7177
98
75
0
20
40
60
80
100
120
140
160
180
Events Offenses Victims Suspects
Num
ber o
f H
ate
Crim
es
2011 2014 2015
Thirty-Six Years of Crime in the San Diego Region: 1980 through 2015 15
CLEARANCE RATES
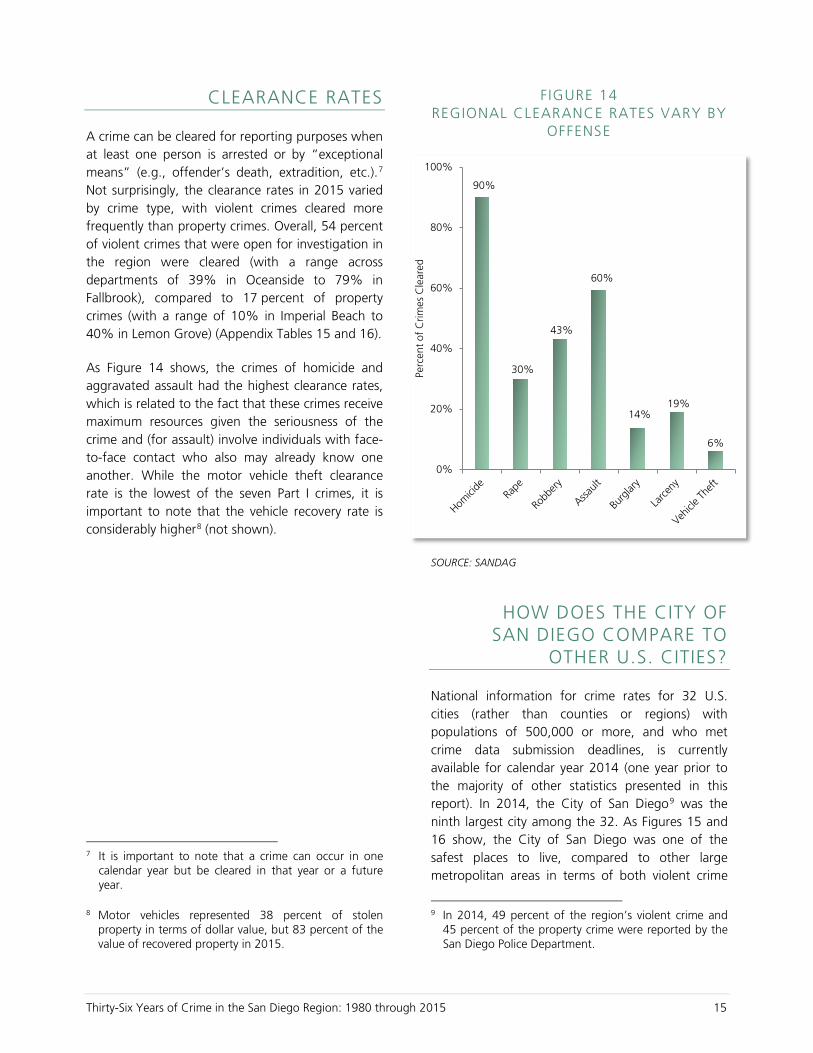
A crime can be cleared for reporting purposes when at least one person is arrested or by “exceptional means” (e.g., offender’s death, extradition, etc.).7 Not surprisingly, the clearance rates in 2015 varied by crime type, with violent crimes cleared more frequently than property crimes. Overall, 54 percent of violent crimes that were open for investigation in the region were cleared (with a range across departments of 39% in Oceanside to 79% in Fallbrook), compared to 17 percent of property crimes (with a range of 10% in Imperial Beach to 40% in Lemon Grove) (Appendix Tables 15 and 16).
As Figure 14 shows, the crimes of homicide and aggravated assault had the highest clearance rates, which is related to the fact that these crimes receive maximum resources given the seriousness of the crime and (for assault) involve individuals with face-to-face contact who also may already know one another. While the motor vehicle theft clearance rate is the lowest of the seven Part I crimes, it is important to note that the vehicle recovery rate is considerably higher8 (not shown).
7 It is important to note that a crime can occur in one
calendar year but be cleared in that year or a future year.
8 Motor vehicles represented 38 percent of stolen property in terms of dollar value, but 83 percent of the value of recovered property in 2015.
F IGURE 14 REGIONAL CLEARANCE RATES VARY BY
OFFENSE
SOURCE: SANDAG
HOW DOES THE CITY OF SAN DIEGO COMPARE TO
OTHER U.S. CITIES?
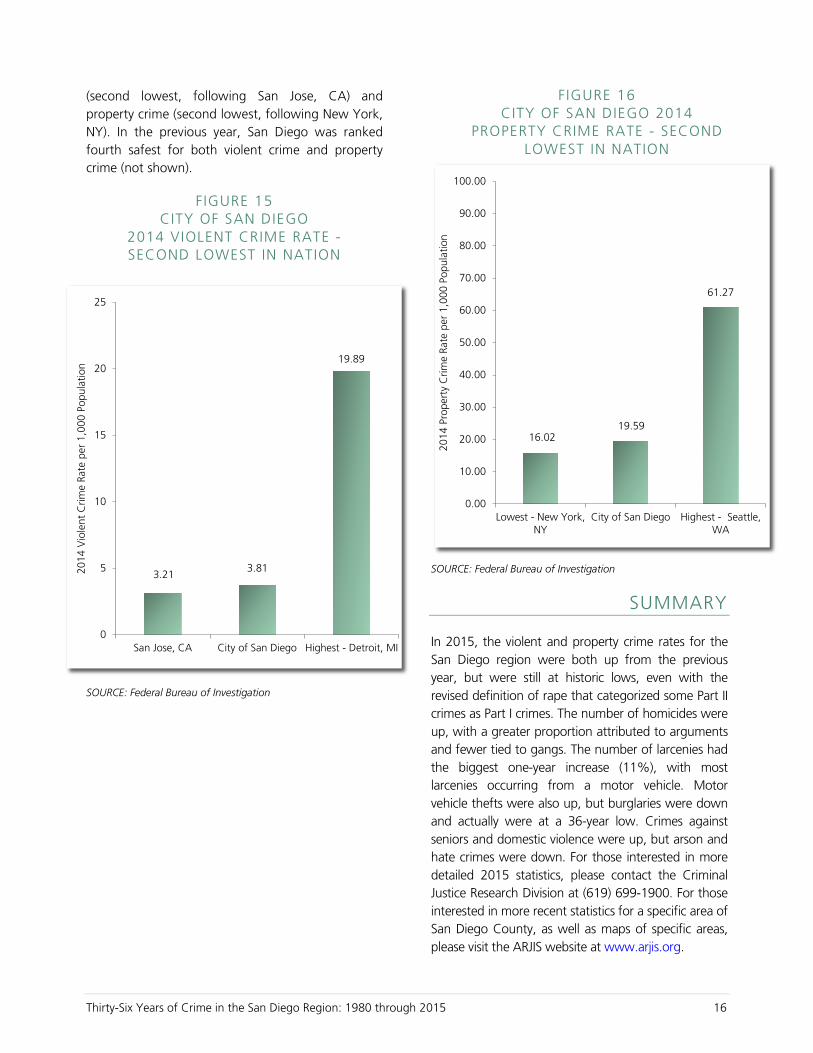
National information for crime rates for 32 U.S. cities (rather than counties or regions) with populations of 500,000 or more, and who met crime data submission deadlines, is currently available for calendar year 2014 (one year prior to the majority of other statistics presented in this report). In 2014, the City of San Diego9 was the ninth largest city among the 32. As Figures 15 and 16 show, the City of San Diego was one of the safest places to live, compared to other large metropolitan areas in terms of both violent crime
9 In 2014, 49 percent of the region’s violent crime and
45 percent of the property crime were reported by the San Diego Police Department.
90%
30%
43%
60%
14%19%
6%
0%
20%
40%
60%
80%
100%
Perc
ent o
f C
rimes
Cle
ared
Thirty-Six Years of Crime in the San Diego Region: 1980 through 2015 16
(second lowest, following San Jose, CA) and property crime (second lowest, following New York, NY). In the previous year, San Diego was ranked fourth safest for both violent crime and property crime (not shown).
F IGURE 15 CITY OF SAN DIEGO
2014 VIOLENT CRIME RATE - SECOND LOWEST IN NATION
SOURCE: Federal Bureau of Investigation
FIGURE 16 CITY OF SAN DIEGO 2014
PROPERTY CRIME RATE - SECOND LOWEST IN NATION
SOURCE: Federal Bureau of Investigation
SUMMARY
In 2015, the violent and property crime rates for the San Diego region were both up from the previous year, but were still at historic lows, even with the revised definition of rape that categorized some Part II crimes as Part I crimes. The number of homicides were up, with a greater proportion attributed to arguments and fewer tied to gangs. The number of larcenies had the biggest one-year increase (11%), with most larcenies occurring from a motor vehicle. Motor vehicle thefts were also up, but burglaries were down and actually were at a 36-year low. Crimes against seniors and domestic violence were up, but arson and hate crimes were down. For those interested in more detailed 2015 statistics, please contact the Criminal Justice Research Division at (619) 699-1900. For those interested in more recent statistics for a specific area of San Diego County, as well as maps of specific areas, please visit the ARJIS website at www.arjis.org.
16.0219.59
61.27
0.00
10.00
20.00
30.00
40.00
50.00
60.00
70.00
80.00
90.00
100.00
Lowest - New York,NY
City of San Diego Highest - Seattle,WA
2014
Pro
pert
y C
rime
Rate
per
1,0
00 P
opul
atio
n
3.213.81
19.89
0
5
10
15
20
25
San Jose, CA City of San Diego Highest - Detroit, MI
2014
Vio
lent
Crim
e Ra
te p
er 1
,000
Pop
ulat
ion

A P P E N D I X
Thirty-Six Years of Crime in the San Diego Region: 1980 through 2015 18
Thirty-Six Years of Crime in the San Diego Region: 1980 through 2015 19
APPENDIX TABLE 1 NUMBER OF CRIMES BY OFFENSE
SAN DIEGO REGION, 2011, 2014, AND 2015
Change
2011 2014 2015 2011-2015 2014-2015
Homic ide 82 74 84 2% 14%
Rape 660 763 1,100 N/A N/A
Robbery 3,050 2,705 2,798 -8% 3%
Aggravated Assau l t 7,217 7,041 6,956 -- --
Violent Crime Total 11,009 10,583 10,938 -- --
Burg lary 13,326 10,960 10,731 -19% -2%
Larceny Theft 40,425 38,629 42,805 6% 11%
Motor Vehic le Thef t 11,346 9,460 9,909 -13% 5%
Property Crime Total 65,097 59,049 63,445 -3% 7%
FBI INDEX 76,106 69,632 74,383 -2% 7%
NOTES: The definition of rape changed in 2015, limiting the ability to make valid comparisons to prior years.
SOURCE: SANDAG
Thirty-Six Years of Crime in the San Diego Region: 1980 through 2015 20
APPENDIX TABLE 2 FBI INDEX CRIME RATE PER 1,000 POPULATION BY JURISDICTION
SAN DIEGO REGION, 2011, 2014, AND 2015
Change
2011 2014 2015 2011-2015 2014-2015
Car l sbad 20.49 17.61 20.84 2% 18%
Chula V is ta 23.08 20.10 20.64 -11% 3%
Coronado 21.78 24.05 17.24 -21% -28%
E l Ca jon 29.98 25.53 25.90 -14% 1%
Escondido 25.56 24.11 26.63 4% 10%
La Mesa 30.37 30.57 32.92 8% 8%
Nat iona l C i ty 37.25 31.33 29.62 -20% -5%
Oceans ide 26.61 27.14 30.87 16% 14%
San Diego 26.58 23.76 25.39 -4% 7%
Sheri ff - Total 17.67 14.71 15.28 -14% 4%
De l Mar 46.64 36.72 43.89 -6% 20%
Enc in i tas 19.68 16.58 18.08 -8% 9%
Imper ia l Beach 21.79 19.85 16.70 -23% -16%
Lemon Grove 21.74 24.79 25.00 15% 1%
Poway 14.75 10.36 11.34 -23% 9%
San Marcos 19.59 16.48 18.57 -5% 13%
Santee 20.50 16.60 17.13 -16% 3%
So lana Beach 21.35 16.08 23.28 9% 45%
V is ta 25.59 21.13 24.19 -5% 14%
Unincorporated 14.77 12.13 11.79 -20% -3%
4S Ranch 7.57 5.38 6.28 -17% 17%
Alp ine 15.98 11.72 11.48 -28% -2%
Fa l lbrook 16.78 15.79 14.29 -15% -9%
Lakes ide 19.78 13.24 12.58 -36% -5%
Ramona 15.24 8.56 7.56 -50% -12%
Spr ing Va l ley 17.77 10.62 10.93 -38% 3%
Va l ley Center 17.43 15.69 16.55 -5% 5%
TOTAL 24.13 21.56 22.76 -6% 6%
NOTES: The FBI Crime Index includes homicide, rape, robbery, aggravated assault, burglary, larceny, and motor vehicle theft. “Sheriff-Total" includes the
contract cities and the unincorporated area served by the San Diego County Sheriff's Department, as well as crimes reported in the Sheriff's "other" category
that includes the Sheriff's detention facilities, courts staffed by the Sheriff, and crimes reported to the Sheriff that were determined to have occurred in a city
not served by the Sheriff or a location for which jurisdiction could not be determined. As of September 2013, the Sheriff’s "other" category included crimes
occurring in the Grossmont/Cuyamaca College District; and in May 2014, it included the San Diego County Administration building and surrounding park
area. Camp Pendleton is not included. "Unincorporated" includes 4S Ranch, Alpine, Fallbrook, Lakeside, Ramona, Spring Valley, and Valley Center, as well as
the unincorporated areas for which crime data are not individually shown (Campo, Julian, Pine Valley, Ranchita, and the unincorporated areas of Encinitas,
Imperial Beach, Lemon Grove, Poway, San Marcos, Santee, and Vista). Unincorporated statistics have also been updated to exclude crimes now categorized in
the Sheriff's "other" category. Percent changes are based on computed crime rates rounded to the precision level of two decimal places. Populations used to
compute crime rates reflect the most current California Department of Finance estimates.
SOURCES: California Department of Finance; SANDAG Population Estimates 2015
Thirty-Six Years of Crime in the San Diego Region: 1980 through 2015 21
APPENDIX TABLE 3 VIOLENT CRIME RATE PER 1,000 POPULATION BY JURISDICTION
SAN DIEGO REGION, 2011, 2014, AND 2015
Change
2011 2014 2015 2011-2015 2014-2015
Car l sbad 1.97 1.86 1.55 -21% -16%
Chula V is ta 2.72 2.39 2.73 <1% 14%
Coronado 1.07 0.73 1.11 -- --
E l Ca jon 5.29 3.24 3.55 -33% 10%
Escondido 3.41 3.49 3.59 5% 3%
La Mesa 3.92 3.55 3.33 -15% -6%
Nat iona l C i ty 6.34 4.51 5.40 -15% 20%
Oceans ide 3.69 3.82 4.09 11% 7%
San Diego 3.90 3.87 4.08 5% 5%
Sheri ff - Total 3.01 2.65 2.38 -21% -10%
De l Mar 3.83 4.26 2.36 -- --
Enc in i tas 2.34 1.70 2.05 -12% 20%
Imper ia l Beach 5.41 4.21 3.29 -39% -22%
Lemon Grove 5.39 4.83 6.15 14% 27%
Poway 1.96 1.43 0.90 -54% -37%
San Marcos 2.75 2.18 1.88 -32% -14%
Santee 2.44 2.34 1.54 -37% -34%
So lana Beach 2.55 1.68 1.14 -- --
V i s ta 4.11 3.55 3.56 -13% <1%
Unincorporated 2.85 2.64 2.30 -19% -13%
4S Ranch 0.80 0.54 0.22 -- --
Alp ine 2.49 2.10 1.42 -43% -32%
Fa l lbrook 3.00 2.43 2.56 -15% 6%
Lakes ide 3.79 2.85 2.29 -39% -20%
Ramona 2.20 1.63 1.59 -28% -2%
Spr ing Va l ley 3.80 2.21 2.56 -33% 16%
Val ley Center 4.23 4.24 3.83 -9% -9%
TOTAL 3.49 3.28 3.35 -4% 2%
NOTES: The FBI Crime Index violent crimes include homicide, rape, robbery, and aggravated assault. “Sheriff-Total" includes the contract cities and the
unincorporated area served by the San Diego County Sheriff's Department, as well as crimes reported in the Sheriff's "other" category that includes the
Sheriff's detention facilities, courts staffed by the Sheriff, and crimes reported to the Sheriff that were determined to have occurred in a city not served by the
Sheriff or a location for which jurisdiction could not be determined. As of September 2013, the Sheriff’s "other" category included crimes occurring in the
Grossmont/Cuyamaca College District; and in May 2014, it included the San Diego County Administration building and surrounding park area. Camp
Pendleton is not included. "Unincorporated" includes 4S Ranch, Alpine, Fallbrook, Lakeside, Ramona, Spring Valley, and Valley Center, as well as the
unincorporated areas for which crime data are not individually shown (Campo, Julian, Pine Valley, Ranchita, and the unincorporated areas of Encinitas,
Imperial Beach, Lemon Grove, Poway, San Marcos, Santee, and Vista). Unincorporated statistics have also been updated to exclude crimes now categorized in
the Sheriff's "other" category. Percent changes are based on computed crime rates rounded to the precision level of two decimal places. Populations used to
compute crime rates reflect the most current California Department of Finance estimates.
SOURCES: California Department of Finance; SANDAG Population Estimates 2015
Thirty-Six Years of Crime in the San Diego Region: 1980 through 2015 22
APPENDIX TABLE 4 PROPERTY CRIME RATE PER 1,000 POPULATION BY JURISDICTION
SAN DIEGO REGION, 2011, 2014, AND 2015
Change
2011 2014 2015 2011-2015 2014-2015
Car l sbad 18.52 15.75 19.29 4% 22%
Chula V is ta 20.36 17.70 17.90 -12% 1%
Coronado 20.71 23.32 16.13 -22% -31%
E l Ca jon 24.69 22.30 22.35 -9% <1%
Escondido 22.14 20.62 23.04 4% 12%
La Mesa 26.45 27.02 29.59 12% 9%
Nat iona l C i ty 30.91 26.83 24.22 -22% -10%
Oceans ide 22.92 23.33 26.78 17% 15%
San Diego 22.68 19.89 21.31 -6% 7%
Sheri ff - Total 14.66 12.07 12.90 -12% 7%
Del Mar 42.81 32.46 41.53 -3% 28%
Enc in i tas 17.34 14.88 16.03 -8% 8%
Imper ia l Beach 16.38 15.64 13.42 -18% -14%
Lemon Grove 16.35 19.96 18.86 15% -6%
Poway 12.79 8.93 10.44 -18% 17%
San Marcos 16.84 14.30 16.69 -1% 17%
Santee 18.06 14.27 15.59 -14% 9%
Solana Beach 18.80 14.40 22.13 18% 54%
Vis ta 21.48 17.59 20.63 -4% 17%
Unincorporated 11.92 9.49 9.49 -20% <-1%
4S Ranch 6.77 4.84 6.05 -11% 25%
Alp ine 13.49 9.62 10.06 -25% 5%
Fa l lbrook 13.77 13.36 11.73 -15% -12%
Lakes ide 16.00 10.39 10.29 -36% -1%
Ramona 13.03 6.93 5.96 -54% -14%
Spr ing Va l ley 13.97 8.41 8.38 -40% <-1%
Val ley Center 13.21 11.46 12.71 -4% 11%
TOTAL 20.64 18.28 19.42 -6% 6%
NOTES: FBI Index property crimes include larceny, burglary, and motor vehicle theft. “Sheriff-Total" includes the contract cities and the unincorporated area
served by the San Diego County Sheriff's Department, as well as crimes reported in the Sheriff's "other" category that includes the Sheriff's detention
facilities, courts staffed by the Sheriff, and crimes reported to the Sheriff that were determined to have occurred in a city not served by the Sheriff or a
location for which jurisdiction could not be determined. As of September 2013, the Sheriff's "other" category also includes the Grossmont/Cuyamaca
Community College District; and in May 2014, it included the San Diego County Administration building and surrounding park area. Camp Pendleton is not
included. "Unincorporated" includes 4S Ranch, Alpine, Fallbrook, Lakeside, Ramona, Spring Valley, and Valley Center, as well as the unincorporated areas for
which crime data are not individually shown (Campo, Julian, Pine Valley, Ranchita, and the unincorporated areas of Encinitas, Imperial Beach, Lemon Grove,
Poway, San Marcos, Santee, and Vista). Unincorporated statistics have also been updated to exclude crimes now categorized in the Sheriff's "other" category.
Percent changes are based on computed crime rates rounded to the precision level of two decimal places. Populations used to compute crime rates reflect the
most current California Department of Finance estimates.
SOURCES: California Department of Finance; SANDAG Population Estimates 2015
Thirty-Six Years of Crime in the San Diego Region: 1980 through 2015 23
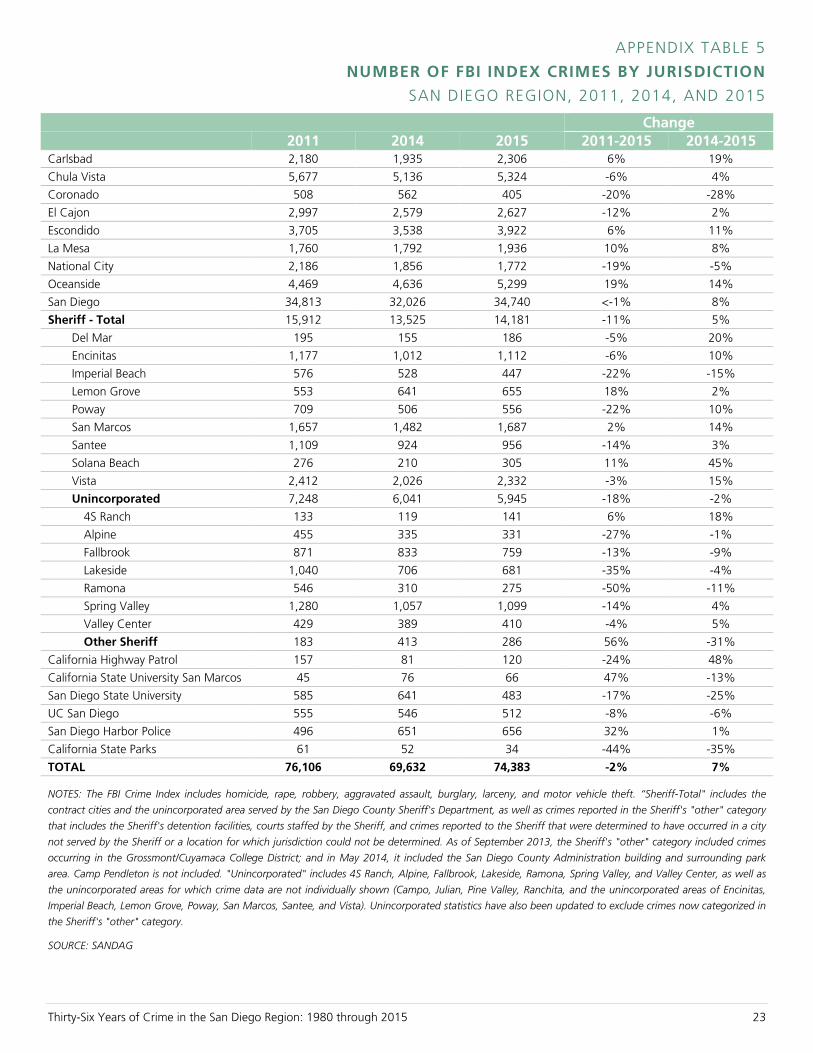
APPENDIX TABLE 5
NUMBER OF FBI INDEX CRIMES BY JURISDICTION
SAN DIEGO REGION, 2011, 2014, AND 2015
Change
2011 2014 2015 2011-2015 2014-2015
Carlsbad 2,180 1,935 2,306 6% 19%
Chula Vista 5,677 5,136 5,324 -6% 4%
Coronado 508 562 405 -20% -28%
El Cajon 2,997 2,579 2,627 -12% 2%
Escondido 3,705 3,538 3,922 6% 11%
La Mesa 1,760 1,792 1,936 10% 8%
National City 2,186 1,856 1,772 -19% -5%
Oceanside 4,469 4,636 5,299 19% 14%
San Diego 34,813 32,026 34,740 <-1% 8%
Sheriff - Total 15,912 13,525 14,181 -11% 5%
Del Mar 195 155 186 -5% 20%
Encinitas 1,177 1,012 1,112 -6% 10%
Imperial Beach 576 528 447 -22% -15%
Lemon Grove 553 641 655 18% 2%
Poway 709 506 556 -22% 10%
San Marcos 1,657 1,482 1,687 2% 14%
Santee 1,109 924 956 -14% 3%
Solana Beach 276 210 305 11% 45%
Vista 2,412 2,026 2,332 -3% 15%
Unincorporated 7,248 6,041 5,945 -18% -2%
4S Ranch 133 119 141 6% 18%
Alpine 455 335 331 -27% -1%
Fallbrook 871 833 759 -13% -9%
Lakeside 1,040 706 681 -35% -4%
Ramona 546 310 275 -50% -11%
Spring Valley 1,280 1,057 1,099 -14% 4%
Valley Center 429 389 410 -4% 5%
Other Sheriff 183 413 286 56% -31%
California Highway Patrol 157 81 120 -24% 48%
California State University San Marcos 45 76 66 47% -13%
San Diego State University 585 641 483 -17% -25%
UC San Diego 555 546 512 -8% -6%
San Diego Harbor Police 496 651 656 32% 1%
California State Parks 61 52 34 -44% -35%
TOTAL 76,106 69,632 74,383 -2% 7%
NOTES: The FBI Crime Index includes homicide, rape, robbery, aggravated assault, burglary, larceny, and motor vehicle theft. “Sheriff-Total" includes the
contract cities and the unincorporated area served by the San Diego County Sheriff's Department, as well as crimes reported in the Sheriff's "other" category
that includes the Sheriff's detention facilities, courts staffed by the Sheriff, and crimes reported to the Sheriff that were determined to have occurred in a city
not served by the Sheriff or a location for which jurisdiction could not be determined. As of September 2013, the Sheriff's "other" category included crimes
occurring in the Grossmont/Cuyamaca College District; and in May 2014, it included the San Diego County Administration building and surrounding park
area. Camp Pendleton is not included. "Unincorporated" includes 4S Ranch, Alpine, Fallbrook, Lakeside, Ramona, Spring Valley, and Valley Center, as well as
the unincorporated areas for which crime data are not individually shown (Campo, Julian, Pine Valley, Ranchita, and the unincorporated areas of Encinitas,
Imperial Beach, Lemon Grove, Poway, San Marcos, Santee, and Vista). Unincorporated statistics have also been updated to exclude crimes now categorized in
the Sheriff's "other" category.
SOURCE: SANDAG
Thirty-Six Years of Crime in the San Diego Region: 1980 through 2015 24
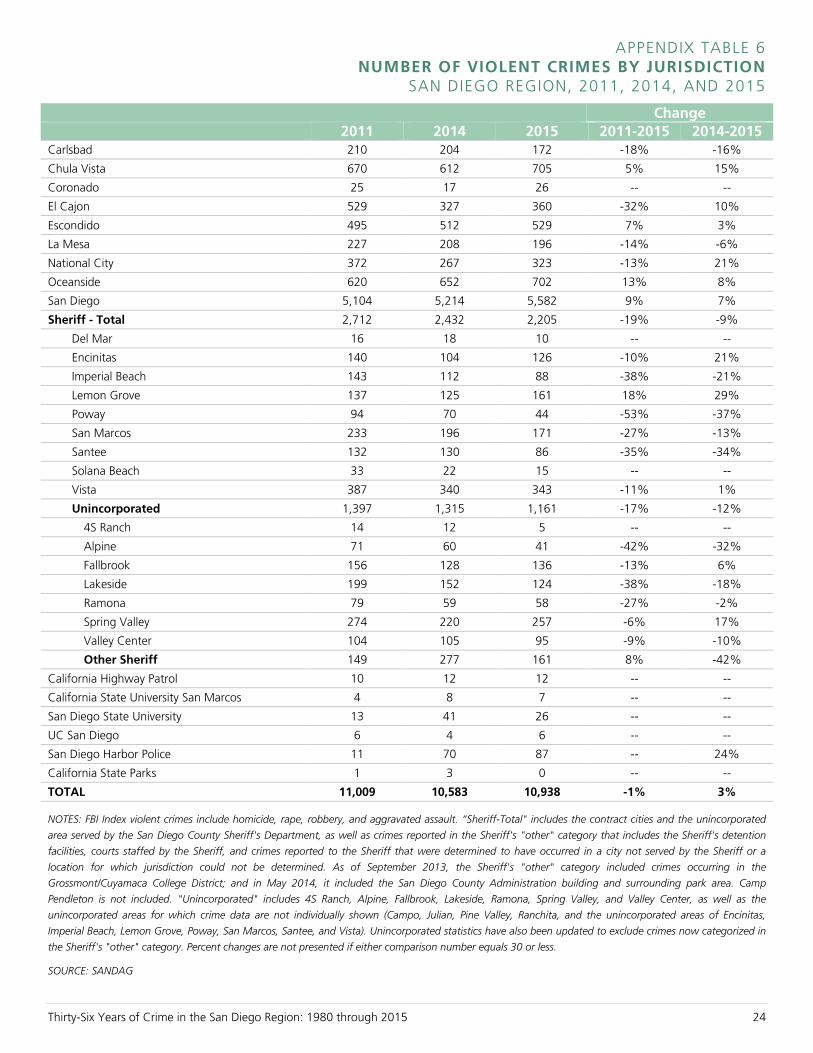
APPENDIX TABLE 6 NUMBER OF VIOLENT CRIMES BY JURISDICTION
SAN DIEGO REGION, 2011, 2014, AND 2015
Change
2011 2014 2015 2011-2015 2014-2015
Carlsbad 210 204 172 -18% -16%
Chula Vista 670 612 705 5% 15%
Coronado 25 17 26 -- --
El Cajon 529 327 360 -32% 10%
Escondido 495 512 529 7% 3%
La Mesa 227 208 196 -14% -6%
National City 372 267 323 -13% 21%
Oceanside 620 652 702 13% 8%
San Diego 5,104 5,214 5,582 9% 7%
Sheriff - Total 2,712 2,432 2,205 -19% -9%
Del Mar 16 18 10 -- --
Encinitas 140 104 126 -10% 21%
Imperial Beach 143 112 88 -38% -21%
Lemon Grove 137 125 161 18% 29%
Poway 94 70 44 -53% -37%
San Marcos 233 196 171 -27% -13%
Santee 132 130 86 -35% -34%
Solana Beach 33 22 15 -- --
Vista 387 340 343 -11% 1%
Unincorporated 1,397 1,315 1,161 -17% -12%
4S Ranch 14 12 5 -- --
Alpine 71 60 41 -42% -32%
Fallbrook 156 128 136 -13% 6%
Lakeside 199 152 124 -38% -18%
Ramona 79 59 58 -27% -2%
Spring Valley 274 220 257 -6% 17%
Valley Center 104 105 95 -9% -10%
Other Sheriff 149 277 161 8% -42%
California Highway Patrol 10 12 12 -- --
California State University San Marcos 4 8 7 -- --
San Diego State University 13 41 26 -- --
UC San Diego 6 4 6 -- --
San Diego Harbor Police 11 70 87 -- 24%
California State Parks 1 3 0 -- --
TOTAL 11,009 10,583 10,938 -1% 3%
NOTES: FBI Index violent crimes include homicide, rape, robbery, and aggravated assault. “Sheriff-Total" includes the contract cities and the unincorporated
area served by the San Diego County Sheriff's Department, as well as crimes reported in the Sheriff's "other" category that includes the Sheriff's detention
facilities, courts staffed by the Sheriff, and crimes reported to the Sheriff that were determined to have occurred in a city not served by the Sheriff or a
location for which jurisdiction could not be determined. As of September 2013, the Sheriff's "other" category included crimes occurring in the
Grossmont/Cuyamaca College District; and in May 2014, it included the San Diego County Administration building and surrounding park area. Camp
Pendleton is not included. "Unincorporated" includes 4S Ranch, Alpine, Fallbrook, Lakeside, Ramona, Spring Valley, and Valley Center, as well as the
unincorporated areas for which crime data are not individually shown (Campo, Julian, Pine Valley, Ranchita, and the unincorporated areas of Encinitas,
Imperial Beach, Lemon Grove, Poway, San Marcos, Santee, and Vista). Unincorporated statistics have also been updated to exclude crimes now categorized in
the Sheriff's "other" category. Percent changes are not presented if either comparison number equals 30 or less.
SOURCE: SANDAG
Thirty-Six Years of Crime in the San Diego Region: 1980 through 2015 25
APPENDIX TABLE 7 NUMBER OF PROPERTY CRIMES BY JURISDICTION
SAN DIEGO REGION, 2011, 2014, AND 2015
Change
2011 2014 2015 2011-2015 2014-2015
Carlsbad 1,970 1,731 2,134 8% 23%
Chula Vista 5,007 4,524 4,619 -8% 2%
Coronado 483 545 379 -22% -30%
El Cajon 2,468 2,252 2,267 -8% 1%
Escondido 3,210 3,026 3,393 6% 12%
La Mesa 1,533 1,584 1,740 14% 10%
National City 1,814 1,589 1,449 -20% -9%
Oceanside 3,849 3,984 4,597 19% 15%
San Diego 29,709 26,812 29,158 -2% 9%
Sheriff - Total 13,200 11,093 11,976 -9% 8%
Del Mar 179 137 176 -2% 28%
Encinitas 1,037 908 986 -5% 9%
Imperial Beach 433 416 359 -17% -14%
Lemon Grove 416 516 494 19% -4%
Poway 615 436 512 -17% 17%
San Marcos 1,424 1,286 1,516 6% 18%
Santee 977 794 870 -11% 10%
Solana Beach 243 188 290 19% 54%
Vista 2,025 1,686 1,989 -2% 18%
Unincorporated 5,851 4,726 4,784 -18% 1%
4S Ranch 119 107 136 14% 27%
Alpine 384 275 290 -24% 5%
Fallbrook 715 705 623 -13% -12%
Lakeside 841 554 557 -34% 1%
Ramona 467 251 217 -54% -14%
Spring Valley 1,006 837 842 -16% 1%
Valley Center 325 284 315 -3% 11%
Other Sheriff 34 136 125 268% -8%
California Highway Patrol 147 69 108 -27% 57%
California State University San Marcos 41 68 59 44% -13%
San Diego State University 572 600 457 -20% -24%
UC San Diego 549 542 506 -8% -7%
San Diego Harbor Police 485 581 569 17% -2%
California State Parks 60 49 34 -43% -31%
TOTAL 65,097 59,049 63,445 -3% 7%
NOTES: FBI Index property crimes include larceny, burglary, and motor vehicle theft. “Sheriff-Total" includes the contract cities and the unincorporated area
served by the San Diego County Sheriff's Department, as well as crimes reported in the Sheriff's "other" category that includes the Sheriff's detention
facilities, courts staffed by the Sheriff, and crimes reported to the Sheriff that were determined to have occurred in a city not served by the Sheriff or a
location for which jurisdiction could not be determined. As of September 2013, the Sheriff's "other" category included crimes occurring in the
Grossmont/Cuyamaca College District; and in May 2014, it included the San Diego County Administration building and surrounding park area. Camp
Pendleton is not included. "Unincorporated" includes 4S Ranch, Alpine, Fallbrook, Lakeside, Ramona, Spring Valley, and Valley Center, as well as the
unincorporated areas for which crime data are not individually shown (Campo, Julian, Pine Valley, Ranchita, and the unincorporated areas of Encinitas,
Imperial Beach, Lemon Grove, Poway, San Marcos, Santee, and Vista). Unincorporated statistics have also been updated to exclude crimes now categorized in
the Sheriff's "other" category.
SOURCE: SANDAG
Thirty-Six Years of Crime in the San Diego Region: 1980 through 2015 26
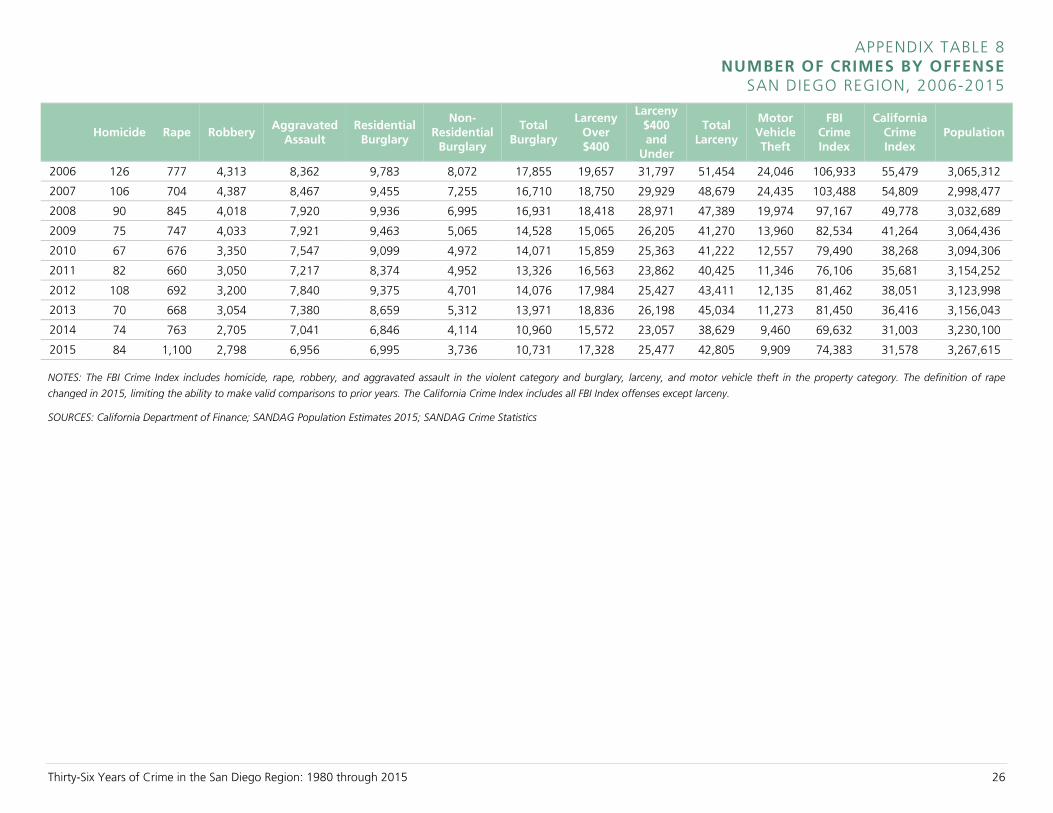
APPENDIX TABLE 8 NUMBER OF CRIMES BY OFFENSE
SAN DIEGO REGION, 2006-2015
Homicide Rape Robbery
Aggravated Assault
Residential Burglary
Non- Residential
Burglary
Total Burglary
Larceny Over $400
Larceny $400 and
Under
Total Larceny
Motor Vehicle Theft
FBI Crime Index
California Crime Index
Population
2006 126 777 4,313 8,362 9,783 8,072 17,855 19,657 31,797 51,454 24,046 106,933 55,479 3,065,312
2007 106 704 4,387 8,467 9,455 7,255 16,710 18,750 29,929 48,679 24,435 103,488 54,809 2,998,477
2008 90 845 4,018 7,920 9,936 6,995 16,931 18,418 28,971 47,389 19,974 97,167 49,778 3,032,689
2009 75 747 4,033 7,921 9,463 5,065 14,528 15,065 26,205 41,270 13,960 82,534 41,264 3,064,436
2010 67 676 3,350 7,547 9,099 4,972 14,071 15,859 25,363 41,222 12,557 79,490 38,268 3,094,306
2011 82 660 3,050 7,217 8,374 4,952 13,326 16,563 23,862 40,425 11,346 76,106 35,681 3,154,252
2012 108 692 3,200 7,840 9,375 4,701 14,076 17,984 25,427 43,411 12,135 81,462 38,051 3,123,998
2013 70 668 3,054 7,380 8,659 5,312 13,971 18,836 26,198 45,034 11,273 81,450 36,416 3,156,043
2014 74 763 2,705 7,041 6,846 4,114 10,960 15,572 23,057 38,629 9,460 69,632 31,003 3,230,100
2015 84 1,100 2,798 6,956 6,995 3,736 10,731 17,328 25,477 42,805 9,909 74,383 31,578 3,267,615
NOTES: The FBI Crime Index includes homicide, rape, robbery, and aggravated assault in the violent category and burglary, larceny, and motor vehicle theft in the property category. The definition of rape
changed in 2015, limiting the ability to make valid comparisons to prior years. The California Crime Index includes all FBI Index offenses except larceny.
SOURCES: California Department of Finance; SANDAG Population Estimates 2015; SANDAG Crime Statistics
Thirty-Six Years of Crime in the San Diego Region: 1980 through 2015 27
APPENDIX TABLE 9 NUMBER OF DOMESTIC VIOLENCE INCIDENTS BY JURISDICTION
SAN DIEGO REGION, 2011, 2014, AND 2015 Change
2011 2014 2015 2011-2015 2014-2015 Car l sbad 335 371 422 26% 14%
Chula V is ta 1,306 1,090 1,281 -2% 18%
Coronado 65 51 64 -2% 25%
E l Ca jon 962 871 772 -20% -11%
Escondido 900 1,001 1,181 31% 18%
La Mesa 308 379 386 25% 2%
Nat iona l C i ty 419 409 458 9% 12%
Oceans ide 931 1,059 1,039 12% -2%
San Diego 7,137 7,377 7,393 4% <1%
Sheri ff - Total 3,546 4,280 4,860 37% 14%
De l Mar 27 18 22 -- --
Enc in i tas 214 209 237 11% 13%
Imper ia l Beach 213 195 189 -11% -3%
Lemon Grove 137 139 148 8% 6%
Poway 127 144 152 20% 6%
San Marcos 251 345 475 89% 38%
Santee 232 216 223 -4% 3%
So lana Beach 28 53 34 -- -36%
V is ta 488 652 785 61% 20%
Unincorporated 1,829 2,309 2,595 42% 12%
TOTAL 16,015 16,991 17,975 12% 6%
NOTES: “Sheriff-Total" includes the contract cities and the unincorporated area served by the San Diego County Sheriff's Department. Camp Pendleton is not
included. "Unincorporated" includes 4S Ranch, Alpine, Fallbrook, Lakeside, Ramona, Spring Valley, and Valley Center, as well as the unincorporated areas for
which crime data are not individually shown (Campo, Julian, Pine Valley, Ranchita, and the unincorporated areas of Encinitas, Imperial Beach, Lemon Grove,
Poway, San Marcos, Santee, and Vista). The individual unincorporated areas in the Sheriff's jurisdiction are not required to report domestic violence to the
State Department of Justice. Region total includes a relatively small number of incidents reported by the San Diego Harbor Police, California Highway Patrol,
California State Parks, California State University San Marcos, San Diego State University, and University of California San Diego. Percent changes are not
presented if either comparison number equals 30 or less.
SOURCE: SANDAG
Thirty-Six Years of Crime in the San Diego Region: 1980 through 2015 28
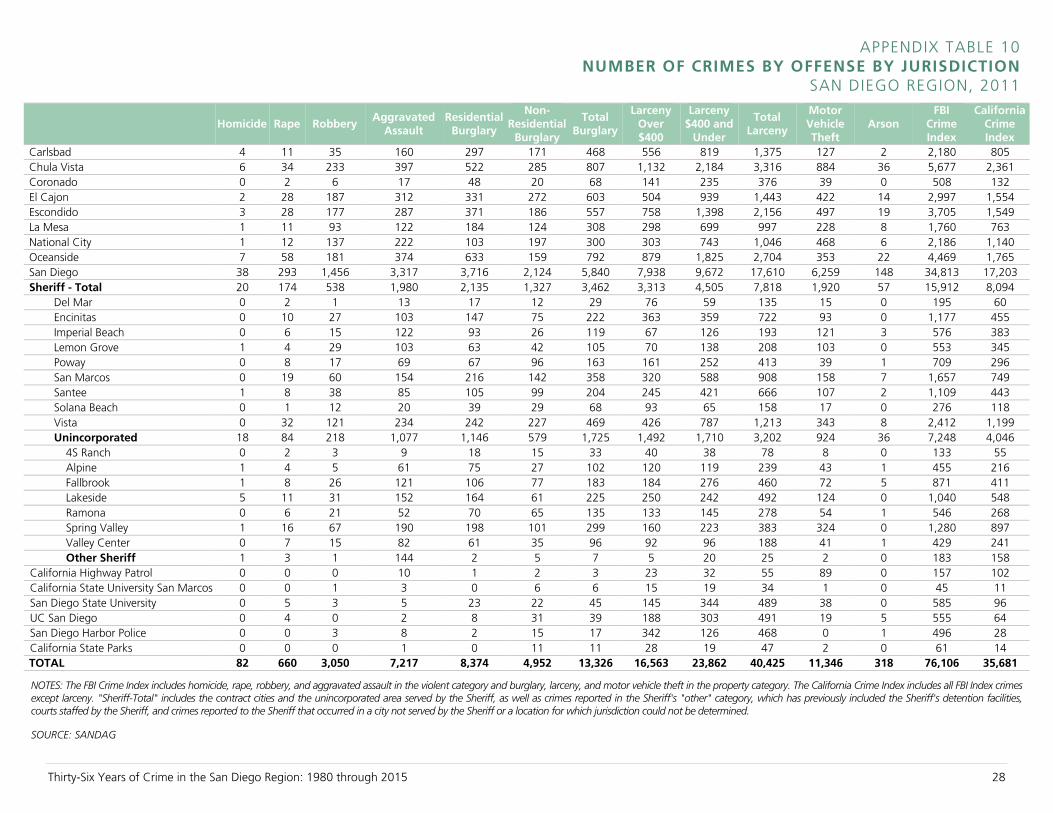
APPENDIX TABLE 10 NUMBER OF CRIMES BY OFFENSE BY JURISDICTION
SAN DIEGO REGION, 2011
Homicide Rape Robbery
Aggravated Assault
Residential Burglary
Non- Residential
Burglary
Total Burglary
Larceny Over $400
Larceny $400 and
Under
Total Larceny
Motor Vehicle Theft
Arson FBI
Crime Index
California Crime Index
Carlsbad 4 11 35 160 297 171 468 556 819 1,375 127 2 2,180 805 Chula Vista 6 34 233 397 522 285 807 1,132 2,184 3,316 884 36 5,677 2,361 Coronado 0 2 6 17 48 20 68 141 235 376 39 0 508 132 El Cajon 2 28 187 312 331 272 603 504 939 1,443 422 14 2,997 1,554 Escondido 3 28 177 287 371 186 557 758 1,398 2,156 497 19 3,705 1,549 La Mesa 1 11 93 122 184 124 308 298 699 997 228 8 1,760 763 National City 1 12 137 222 103 197 300 303 743 1,046 468 6 2,186 1,140 Oceanside 7 58 181 374 633 159 792 879 1,825 2,704 353 22 4,469 1,765 San Diego 38 293 1,456 3,317 3,716 2,124 5,840 7,938 9,672 17,610 6,259 148 34,813 17,203 Sheriff - Total 20 174 538 1,980 2,135 1,327 3,462 3,313 4,505 7,818 1,920 57 15,912 8,094
Del Mar 0 2 1 13 17 12 29 76 59 135 15 0 195 60 Encinitas 0 10 27 103 147 75 222 363 359 722 93 0 1,177 455 Imperial Beach 0 6 15 122 93 26 119 67 126 193 121 3 576 383 Lemon Grove 1 4 29 103 63 42 105 70 138 208 103 0 553 345 Poway 0 8 17 69 67 96 163 161 252 413 39 1 709 296 San Marcos 0 19 60 154 216 142 358 320 588 908 158 7 1,657 749 Santee 1 8 38 85 105 99 204 245 421 666 107 2 1,109 443 Solana Beach 0 1 12 20 39 29 68 93 65 158 17 0 276 118 Vista 0 32 121 234 242 227 469 426 787 1,213 343 8 2,412 1,199 Unincorporated 18 84 218 1,077 1,146 579 1,725 1,492 1,710 3,202 924 36 7,248 4,046
4S Ranch 0 2 3 9 18 15 33 40 38 78 8 0 133 55 Alpine 1 4 5 61 75 27 102 120 119 239 43 1 455 216 Fallbrook 1 8 26 121 106 77 183 184 276 460 72 5 871 411 Lakeside 5 11 31 152 164 61 225 250 242 492 124 0 1,040 548 Ramona 0 6 21 52 70 65 135 133 145 278 54 1 546 268 Spring Valley 1 16 67 190 198 101 299 160 223 383 324 0 1,280 897 Valley Center 0 7 15 82 61 35 96 92 96 188 41 1 429 241 Other Sheriff 1 3 1 144 2 5 7 5 20 25 2 0 183 158
California Highway Patrol 0 0 0 10 1 2 3 23 32 55 89 0 157 102 California State University San Marcos 0 0 1 3 0 6 6 15 19 34 1 0 45 11 San Diego State University 0 5 3 5 23 22 45 145 344 489 38 0 585 96 UC San Diego 0 4 0 2 8 31 39 188 303 491 19 5 555 64 San Diego Harbor Police 0 0 3 8 2 15 17 342 126 468 0 1 496 28 California State Parks 0 0 0 1 0 11 11 28 19 47 2 0 61 14 TOTAL 82 660 3,050 7,217 8,374 4,952 13,326 16,563 23,862 40,425 11,346 318 76,106 35,681
NOTES: The FBI Crime Index includes homicide, rape, robbery, and aggravated assault in the violent category and burglary, larceny, and motor vehicle theft in the property category. The California Crime Index includes all FBI Index crimes except larceny. "Sheriff-Total" includes the contract cities and the unincorporated area served by the Sheriff, as well as crimes reported in the Sheriff's "other" category, which has previously included the Sheriff's detention facilities, courts staffed by the Sheriff, and crimes reported to the Sheriff that occurred in a city not served by the Sheriff or a location for which jurisdiction could not be determined.
SOURCE: SANDAG
Thirty-Six Years of Crime in the San Diego Region: 1980 through 2015 29
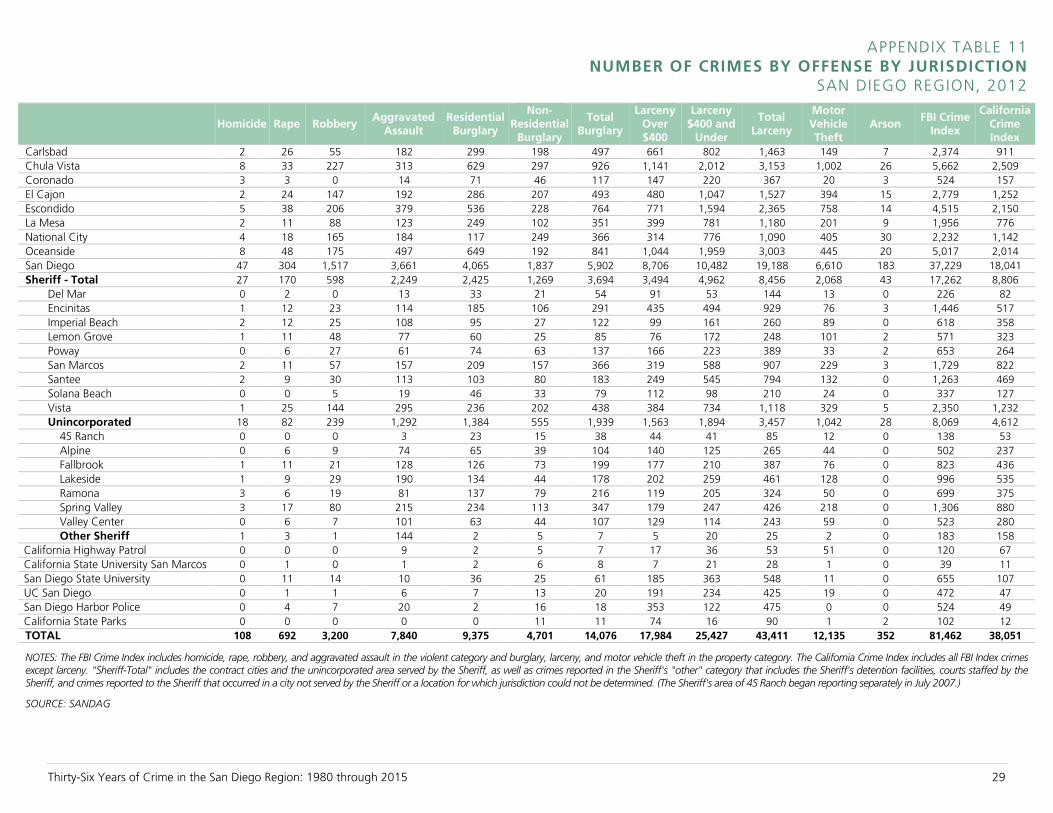
APPENDIX TABLE 11 NUMBER OF CRIMES BY OFFENSE BY JURISDICTION
SAN DIEGO REGION, 2012
Homicide Rape Robbery
Aggravated Assault
Residential Burglary
Non-Residential
Burglary
Total Burglary
Larceny Over $400
Larceny $400 and
Under
Total Larceny
Motor Vehicle Theft
Arson FBI Crime
Index
California Crime Index
Carlsbad 2 26 55 182 299 198 497 661 802 1,463 149 7 2,374 911 Chula Vista 8 33 227 313 629 297 926 1,141 2,012 3,153 1,002 26 5,662 2,509 Coronado 3 3 0 14 71 46 117 147 220 367 20 3 524 157 El Cajon 2 24 147 192 286 207 493 480 1,047 1,527 394 15 2,779 1,252 Escondido 5 38 206 379 536 228 764 771 1,594 2,365 758 14 4,515 2,150 La Mesa 2 11 88 123 249 102 351 399 781 1,180 201 9 1,956 776 National City 4 18 165 184 117 249 366 314 776 1,090 405 30 2,232 1,142 Oceanside 8 48 175 497 649 192 841 1,044 1,959 3,003 445 20 5,017 2,014 San Diego 47 304 1,517 3,661 4,065 1,837 5,902 8,706 10,482 19,188 6,610 183 37,229 18,041 Sheriff - Total 27 170 598 2,249 2,425 1,269 3,694 3,494 4,962 8,456 2,068 43 17,262 8,806
Del Mar 0 2 0 13 33 21 54 91 53 144 13 0 226 82 Encinitas 1 12 23 114 185 106 291 435 494 929 76 3 1,446 517 Imperial Beach 2 12 25 108 95 27 122 99 161 260 89 0 618 358 Lemon Grove 1 11 48 77 60 25 85 76 172 248 101 2 571 323 Poway 0 6 27 61 74 63 137 166 223 389 33 2 653 264 San Marcos 2 11 57 157 209 157 366 319 588 907 229 3 1,729 822 Santee 2 9 30 113 103 80 183 249 545 794 132 0 1,263 469 Solana Beach 0 0 5 19 46 33 79 112 98 210 24 0 337 127 Vista 1 25 144 295 236 202 438 384 734 1,118 329 5 2,350 1,232 Unincorporated 18 82 239 1,292 1,384 555 1,939 1,563 1,894 3,457 1,042 28 8,069 4,612
4S Ranch 0 0 0 3 23 15 38 44 41 85 12 0 138 53 Alpine 0 6 9 74 65 39 104 140 125 265 44 0 502 237 Fallbrook 1 11 21 128 126 73 199 177 210 387 76 0 823 436 Lakeside 1 9 29 190 134 44 178 202 259 461 128 0 996 535 Ramona 3 6 19 81 137 79 216 119 205 324 50 0 699 375 Spring Valley 3 17 80 215 234 113 347 179 247 426 218 0 1,306 880 Valley Center 0 6 7 101 63 44 107 129 114 243 59 0 523 280 Other Sheriff 1 3 1 144 2 5 7 5 20 25 2 0 183 158
California Highway Patrol 0 0 0 9 2 5 7 17 36 53 51 0 120 67 California State University San Marcos 0 1 0 1 2 6 8 7 21 28 1 0 39 11 San Diego State University 0 11 14 10 36 25 61 185 363 548 11 0 655 107 UC San Diego 0 1 1 6 7 13 20 191 234 425 19 0 472 47 San Diego Harbor Police 0 4 7 20 2 16 18 353 122 475 0 0 524 49 California State Parks 0 0 0 0 0 11 11 74 16 90 1 2 102 12 TOTAL 108 692 3,200 7,840 9,375 4,701 14,076 17,984 25,427 43,411 12,135 352 81,462 38,051
NOTES: The FBI Crime Index includes homicide, rape, robbery, and aggravated assault in the violent category and burglary, larceny, and motor vehicle theft in the property category. The California Crime Index includes all FBI Index crimes except larceny. "Sheriff-Total" includes the contract cities and the unincorporated area served by the Sheriff, as well as crimes reported in the Sheriff's "other" category that includes the Sheriff's detention facilities, courts staffed by the Sheriff, and crimes reported to the Sheriff that occurred in a city not served by the Sheriff or a location for which jurisdiction could not be determined. (The Sheriff's area of 4S Ranch began reporting separately in July 2007.)
SOURCE: SANDAG
Thirty-Six Years of Crime in the San Diego Region: 1980 through 2015 30
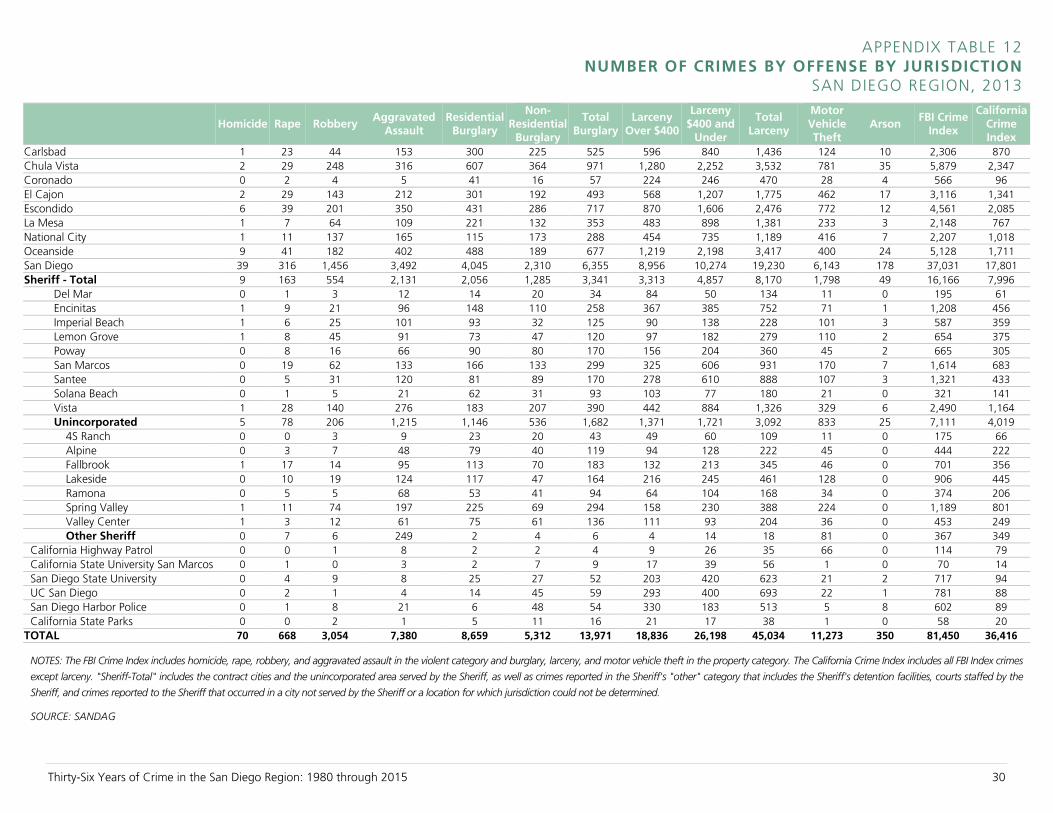
APPENDIX TABLE 12 NUMBER OF CRIMES BY OFFENSE BY JURISDICTION
SAN DIEGO REGION, 2013
Homicide Rape Robbery
Aggravated Assault
Residential Burglary
Non-Residential
Burglary
Total Burglary
Larceny Over $400
Larceny $400 and
Under
Total Larceny
Motor Vehicle Theft
Arson FBI Crime
Index
California Crime Index
Carlsbad 1 23 44 153 300 225 525 596 840 1,436 124 10 2,306 870 Chula Vista 2 29 248 316 607 364 971 1,280 2,252 3,532 781 35 5,879 2,347 Coronado 0 2 4 5 41 16 57 224 246 470 28 4 566 96 El Cajon 2 29 143 212 301 192 493 568 1,207 1,775 462 17 3,116 1,341 Escondido 6 39 201 350 431 286 717 870 1,606 2,476 772 12 4,561 2,085 La Mesa 1 7 64 109 221 132 353 483 898 1,381 233 3 2,148 767 National City 1 11 137 165 115 173 288 454 735 1,189 416 7 2,207 1,018 Oceanside 9 41 182 402 488 189 677 1,219 2,198 3,417 400 24 5,128 1,711 San Diego 39 316 1,456 3,492 4,045 2,310 6,355 8,956 10,274 19,230 6,143 178 37,031 17,801 Sheriff - Total 9 163 554 2,131 2,056 1,285 3,341 3,313 4,857 8,170 1,798 49 16,166 7,996
Del Mar 0 1 3 12 14 20 34 84 50 134 11 0 195 61 Encinitas 1 9 21 96 148 110 258 367 385 752 71 1 1,208 456 Imperial Beach 1 6 25 101 93 32 125 90 138 228 101 3 587 359 Lemon Grove 1 8 45 91 73 47 120 97 182 279 110 2 654 375 Poway 0 8 16 66 90 80 170 156 204 360 45 2 665 305 San Marcos 0 19 62 133 166 133 299 325 606 931 170 7 1,614 683 Santee 0 5 31 120 81 89 170 278 610 888 107 3 1,321 433 Solana Beach 0 1 5 21 62 31 93 103 77 180 21 0 321 141 Vista 1 28 140 276 183 207 390 442 884 1,326 329 6 2,490 1,164 Unincorporated 5 78 206 1,215 1,146 536 1,682 1,371 1,721 3,092 833 25 7,111 4,019
4S Ranch 0 0 3 9 23 20 43 49 60 109 11 0 175 66 Alpine 0 3 7 48 79 40 119 94 128 222 45 0 444 222 Fallbrook 1 17 14 95 113 70 183 132 213 345 46 0 701 356 Lakeside 0 10 19 124 117 47 164 216 245 461 128 0 906 445 Ramona 0 5 5 68 53 41 94 64 104 168 34 0 374 206 Spring Valley 1 11 74 197 225 69 294 158 230 388 224 0 1,189 801 Valley Center 1 3 12 61 75 61 136 111 93 204 36 0 453 249 Other Sheriff 0 7 6 249 2 4 6 4 14 18 81 0 367 349
California Highway Patrol 0 0 1 8 2 2 4 9 26 35 66 0 114 79 California State University San Marcos 0 1 0 3 2 7 9 17 39 56 1 0 70 14 San Diego State University 0 4 9 8 25 27 52 203 420 623 21 2 717 94 UC San Diego 0 2 1 4 14 45 59 293 400 693 22 1 781 88 San Diego Harbor Police 0 1 8 21 6 48 54 330 183 513 5 8 602 89 California State Parks 0 0 2 1 5 11 16 21 17 38 1 0 58 20
TOTAL 70 668 3,054 7,380 8,659 5,312 13,971 18,836 26,198 45,034 11,273 350 81,450 36,416
NOTES: The FBI Crime Index includes homicide, rape, robbery, and aggravated assault in the violent category and burglary, larceny, and motor vehicle theft in the property category. The California Crime Index includes all FBI Index crimes
except larceny. "Sheriff-Total" includes the contract cities and the unincorporated area served by the Sheriff, as well as crimes reported in the Sheriff's "other" category that includes the Sheriff's detention facilities, courts staffed by the
Sheriff, and crimes reported to the Sheriff that occurred in a city not served by the Sheriff or a location for which jurisdiction could not be determined.
SOURCE: SANDAG
Thirty-Six Years of Crime in the San Diego Region: 1980 through 2015 31
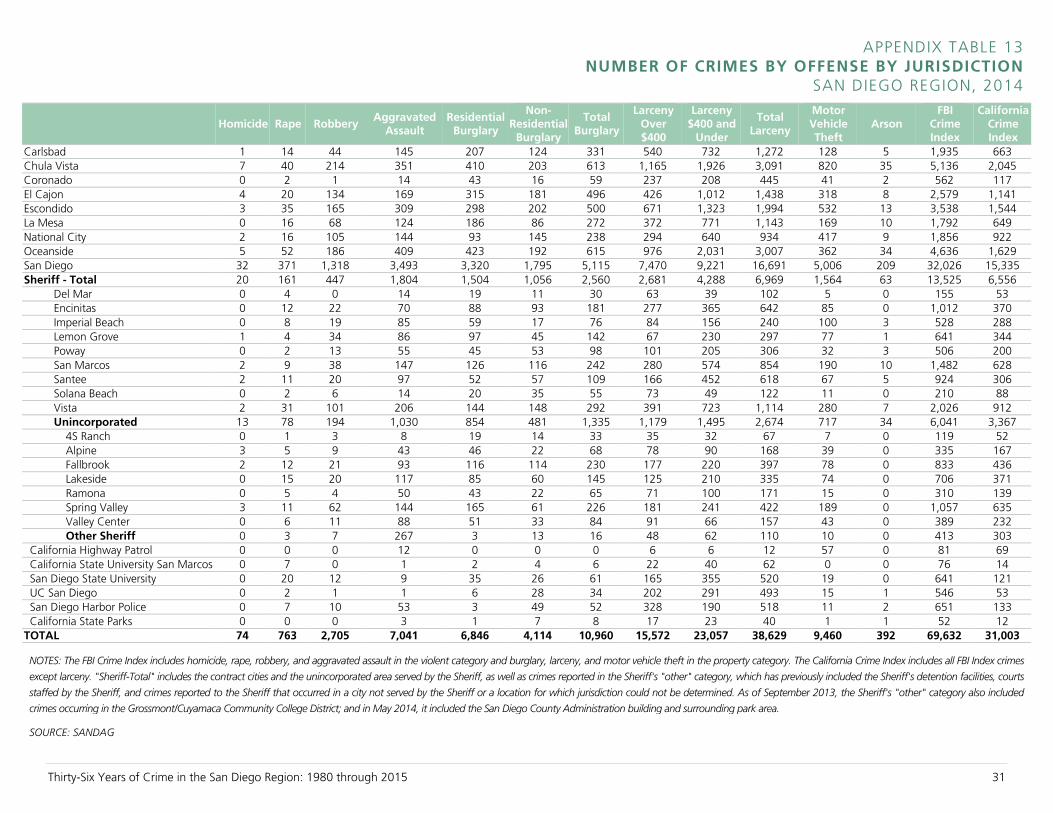
APPENDIX TABLE 13 NUMBER OF CRIMES BY OFFENSE BY JURISDICTION
SAN DIEGO REGION, 2014
Homicide Rape Robbery
Aggravated Assault
Residential Burglary
Non- Residential
Burglary
Total Burglary
Larceny Over $400
Larceny $400 and
Under
Total Larceny
Motor Vehicle Theft
Arson FBI
Crime Index
California Crime Index
Carlsbad 1 14 44 145 207 124 331 540 732 1,272 128 5 1,935 663 Chula Vista 7 40 214 351 410 203 613 1,165 1,926 3,091 820 35 5,136 2,045 Coronado 0 2 1 14 43 16 59 237 208 445 41 2 562 117 El Cajon 4 20 134 169 315 181 496 426 1,012 1,438 318 8 2,579 1,141 Escondido 3 35 165 309 298 202 500 671 1,323 1,994 532 13 3,538 1,544 La Mesa 0 16 68 124 186 86 272 372 771 1,143 169 10 1,792 649 National City 2 16 105 144 93 145 238 294 640 934 417 9 1,856 922 Oceanside 5 52 186 409 423 192 615 976 2,031 3,007 362 34 4,636 1,629 San Diego 32 371 1,318 3,493 3,320 1,795 5,115 7,470 9,221 16,691 5,006 209 32,026 15,335 Sheriff - Total 20 161 447 1,804 1,504 1,056 2,560 2,681 4,288 6,969 1,564 63 13,525 6,556
Del Mar 0 4 0 14 19 11 30 63 39 102 5 0 155 53 Encinitas 0 12 22 70 88 93 181 277 365 642 85 0 1,012 370 Imperial Beach 0 8 19 85 59 17 76 84 156 240 100 3 528 288 Lemon Grove 1 4 34 86 97 45 142 67 230 297 77 1 641 344 Poway 0 2 13 55 45 53 98 101 205 306 32 3 506 200 San Marcos 2 9 38 147 126 116 242 280 574 854 190 10 1,482 628 Santee 2 11 20 97 52 57 109 166 452 618 67 5 924 306 Solana Beach 0 2 6 14 20 35 55 73 49 122 11 0 210 88 Vista 2 31 101 206 144 148 292 391 723 1,114 280 7 2,026 912 Unincorporated 13 78 194 1,030 854 481 1,335 1,179 1,495 2,674 717 34 6,041 3,367
4S Ranch 0 1 3 8 19 14 33 35 32 67 7 0 119 52 Alpine 3 5 9 43 46 22 68 78 90 168 39 0 335 167 Fallbrook 2 12 21 93 116 114 230 177 220 397 78 0 833 436 Lakeside 0 15 20 117 85 60 145 125 210 335 74 0 706 371 Ramona 0 5 4 50 43 22 65 71 100 171 15 0 310 139 Spring Valley 3 11 62 144 165 61 226 181 241 422 189 0 1,057 635 Valley Center 0 6 11 88 51 33 84 91 66 157 43 0 389 232 Other Sheriff 0 3 7 267 3 13 16 48 62 110 10 0 413 303
California Highway Patrol 0 0 0 12 0 0 0 6 6 12 57 0 81 69 California State University San Marcos 0 7 0 1 2 4 6 22 40 62 0 0 76 14 San Diego State University 0 20 12 9 35 26 61 165 355 520 19 0 641 121 UC San Diego 0 2 1 1 6 28 34 202 291 493 15 1 546 53 San Diego Harbor Police 0 7 10 53 3 49 52 328 190 518 11 2 651 133 California State Parks 0 0 0 3 1 7 8 17 23 40 1 1 52 12
TOTAL 74 763 2,705 7,041 6,846 4,114 10,960 15,572 23,057 38,629 9,460 392 69,632 31,003
NOTES: The FBI Crime Index includes homicide, rape, robbery, and aggravated assault in the violent category and burglary, larceny, and motor vehicle theft in the property category. The California Crime Index includes all FBI Index crimes
except larceny. "Sheriff-Total" includes the contract cities and the unincorporated area served by the Sheriff, as well as crimes reported in the Sheriff's "other" category, which has previously included the Sheriff's detention facilities, courts
staffed by the Sheriff, and crimes reported to the Sheriff that occurred in a city not served by the Sheriff or a location for which jurisdiction could not be determined. As of September 2013, the Sheriff's "other" category also included
crimes occurring in the Grossmont/Cuyamaca Community College District; and in May 2014, it included the San Diego County Administration building and surrounding park area.
SOURCE: SANDAG
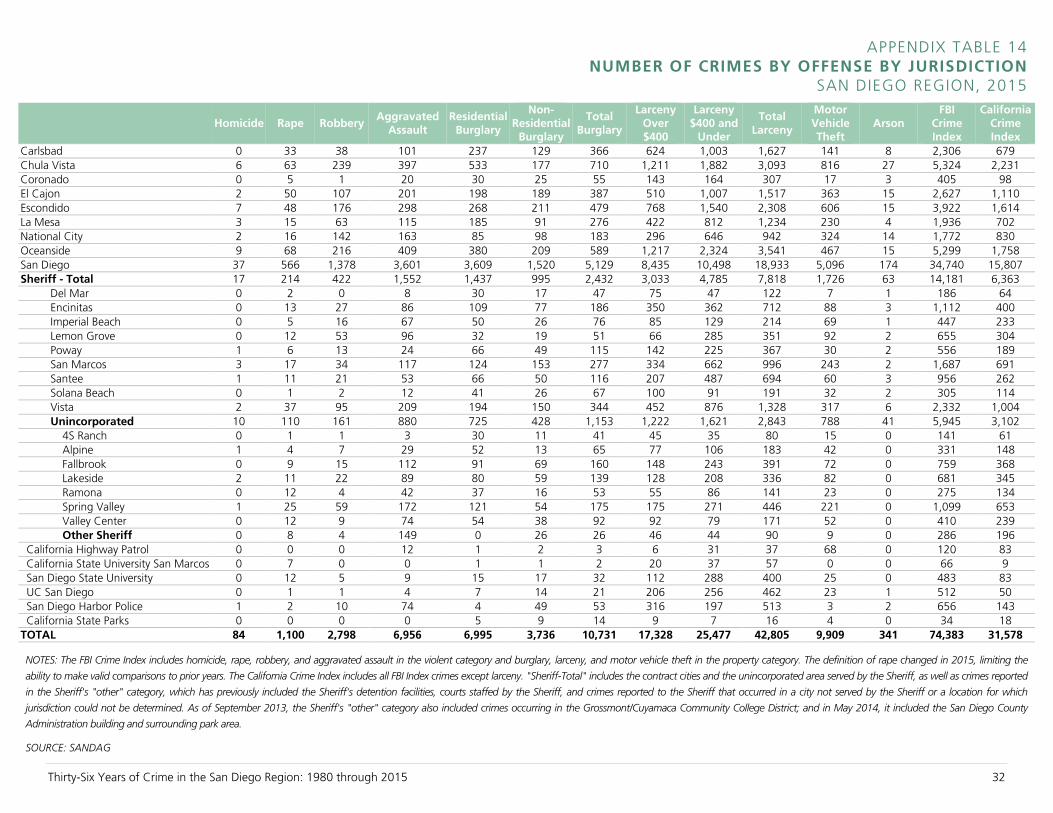
Thirty-Six Years of Crime in the San Diego Region: 1980 through 2015 32
APPENDIX TABLE 14 NUMBER OF CRIMES BY OFFENSE BY JURISDICTION
SAN DIEGO REGION, 2015
Homicide Rape Robbery
Aggravated Assault
Residential Burglary
Non- Residential
Burglary
Total Burglary
Larceny Over $400
Larceny $400 and
Under
Total Larceny
Motor Vehicle Theft
Arson FBI
Crime Index
California Crime Index
Carlsbad 0 33 38 101 237 129 366 624 1,003 1,627 141 8 2,306 679 Chula Vista 6 63 239 397 533 177 710 1,211 1,882 3,093 816 27 5,324 2,231 Coronado 0 5 1 20 30 25 55 143 164 307 17 3 405 98 El Cajon 2 50 107 201 198 189 387 510 1,007 1,517 363 15 2,627 1,110 Escondido 7 48 176 298 268 211 479 768 1,540 2,308 606 15 3,922 1,614 La Mesa 3 15 63 115 185 91 276 422 812 1,234 230 4 1,936 702 National City 2 16 142 163 85 98 183 296 646 942 324 14 1,772 830 Oceanside 9 68 216 409 380 209 589 1,217 2,324 3,541 467 15 5,299 1,758 San Diego 37 566 1,378 3,601 3,609 1,520 5,129 8,435 10,498 18,933 5,096 174 34,740 15,807 Sheriff - Total 17 214 422 1,552 1,437 995 2,432 3,033 4,785 7,818 1,726 63 14,181 6,363
Del Mar 0 2 0 8 30 17 47 75 47 122 7 1 186 64 Encinitas 0 13 27 86 109 77 186 350 362 712 88 3 1,112 400 Imperial Beach 0 5 16 67 50 26 76 85 129 214 69 1 447 233 Lemon Grove 0 12 53 96 32 19 51 66 285 351 92 2 655 304 Poway 1 6 13 24 66 49 115 142 225 367 30 2 556 189 San Marcos 3 17 34 117 124 153 277 334 662 996 243 2 1,687 691 Santee 1 11 21 53 66 50 116 207 487 694 60 3 956 262 Solana Beach 0 1 2 12 41 26 67 100 91 191 32 2 305 114 Vista 2 37 95 209 194 150 344 452 876 1,328 317 6 2,332 1,004 Unincorporated 10 110 161 880 725 428 1,153 1,222 1,621 2,843 788 41 5,945 3,102
4S Ranch 0 1 1 3 30 11 41 45 35 80 15 0 141 61 Alpine 1 4 7 29 52 13 65 77 106 183 42 0 331 148 Fallbrook 0 9 15 112 91 69 160 148 243 391 72 0 759 368 Lakeside 2 11 22 89 80 59 139 128 208 336 82 0 681 345 Ramona 0 12 4 42 37 16 53 55 86 141 23 0 275 134 Spring Valley 1 25 59 172 121 54 175 175 271 446 221 0 1,099 653 Valley Center 0 12 9 74 54 38 92 92 79 171 52 0 410 239 Other Sheriff 0 8 4 149 0 26 26 46 44 90 9 0 286 196
California Highway Patrol 0 0 0 12 1 2 3 6 31 37 68 0 120 83 California State University San Marcos 0 7 0 0 1 1 2 20 37 57 0 0 66 9 San Diego State University 0 12 5 9 15 17 32 112 288 400 25 0 483 83 UC San Diego 0 1 1 4 7 14 21 206 256 462 23 1 512 50 San Diego Harbor Police 1 2 10 74 4 49 53 316 197 513 3 2 656 143 California State Parks 0 0 0 0 5 9 14 9 7 16 4 0 34 18
TOTAL 84 1,100 2,798 6,956 6,995 3,736 10,731 17,328 25,477 42,805 9,909 341 74,383 31,578
NOTES: The FBI Crime Index includes homicide, rape, robbery, and aggravated assault in the violent category and burglary, larceny, and motor vehicle theft in the property category. The definition of rape changed in 2015, limiting the
ability to make valid comparisons to prior years. The California Crime Index includes all FBI Index crimes except larceny. "Sheriff-Total" includes the contract cities and the unincorporated area served by the Sheriff, as well as crimes reported
in the Sheriff's "other" category, which has previously included the Sheriff's detention facilities, courts staffed by the Sheriff, and crimes reported to the Sheriff that occurred in a city not served by the Sheriff or a location for which
jurisdiction could not be determined. As of September 2013, the Sheriff's "other" category also included crimes occurring in the Grossmont/Cuyamaca Community College District; and in May 2014, it included the San Diego County
Administration building and surrounding park area.
SOURCE: SANDAG
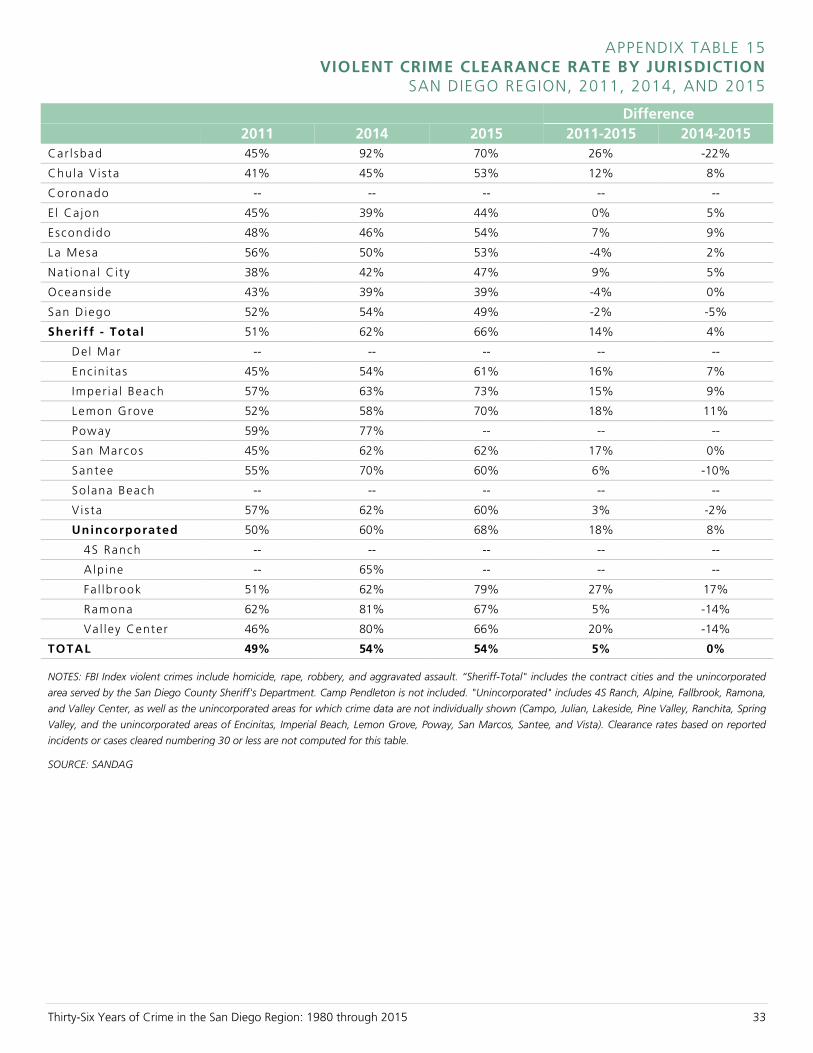
Thirty-Six Years of Crime in the San Diego Region: 1980 through 2015 33
APPENDIX TABLE 15 VIOLENT CRIME CLEARANCE RATE BY JURISDICTION
SAN DIEGO REGION, 2011, 2014, AND 2015
Difference
2011 2014 2015 2011-2015 2014-2015
Car l sbad 45% 92% 70% 26% -22%
Chula V is ta 41% 45% 53% 12% 8%
Coronado -- -- -- -- --
E l Ca jon 45% 39% 44% 0% 5%
Escondido 48% 46% 54% 7% 9%
La Mesa 56% 50% 53% -4% 2%
Nat iona l C i ty 38% 42% 47% 9% 5%
Oceans ide 43% 39% 39% -4% 0%
San Diego 52% 54% 49% -2% -5%
Sheri ff - Total 51% 62% 66% 14% 4%
De l Mar -- -- -- -- --
Enc in i tas 45% 54% 61% 16% 7%
Imper ia l Beach 57% 63% 73% 15% 9%
Lemon Grove 52% 58% 70% 18% 11%
Poway 59% 77% -- -- --
San Marcos 45% 62% 62% 17% 0%
Santee 55% 70% 60% 6% -10%
So lana Beach -- -- -- -- --
V i s ta 57% 62% 60% 3% -2%
Unincorporated 50% 60% 68% 18% 8%
4S Ranch -- -- -- -- --
A lp ine -- 65% -- -- --
Fa l lbrook 51% 62% 79% 27% 17%
Ramona 62% 81% 67% 5% -14%
Va l ley Center 46% 80% 66% 20% -14%
TOTAL 49% 54% 54% 5% 0%
NOTES: FBI Index violent crimes include homicide, rape, robbery, and aggravated assault. “Sheriff-Total" includes the contract cities and the unincorporated
area served by the San Diego County Sheriff's Department. Camp Pendleton is not included. "Unincorporated" includes 4S Ranch, Alpine, Fallbrook, Ramona,
and Valley Center, as well as the unincorporated areas for which crime data are not individually shown (Campo, Julian, Lakeside, Pine Valley, Ranchita, Spring
Valley, and the unincorporated areas of Encinitas, Imperial Beach, Lemon Grove, Poway, San Marcos, Santee, and Vista). Clearance rates based on reported
incidents or cases cleared numbering 30 or less are not computed for this table.
SOURCE: SANDAG
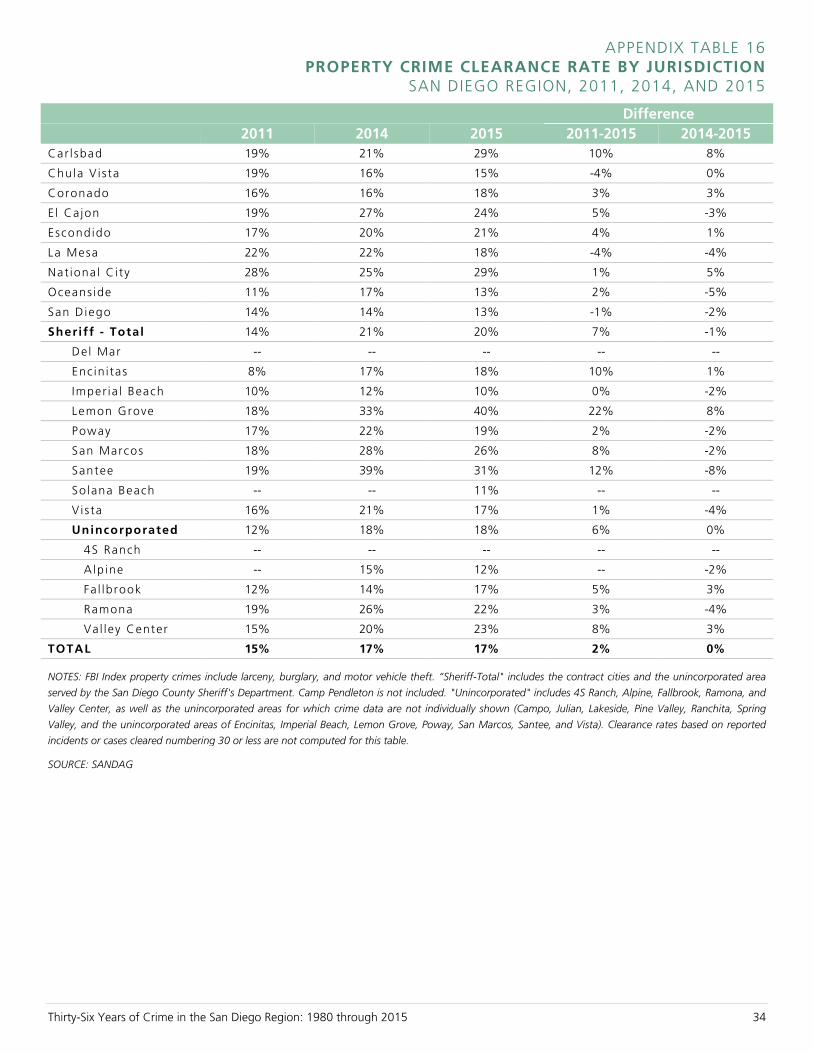
Thirty-Six Years of Crime in the San Diego Region: 1980 through 2015 34
APPENDIX TABLE 16 PROPERTY CRIME CLEARANCE RATE BY JURISDICTION
SAN DIEGO REGION, 2011, 2014, AND 2015
Difference
2011 2014 2015 2011-2015 2014-2015
Car l sbad 19% 21% 29% 10% 8%
Chula V is ta 19% 16% 15% -4% 0%
Coronado 16% 16% 18% 3% 3%
E l Ca jon 19% 27% 24% 5% -3%
Escondido 17% 20% 21% 4% 1%
La Mesa 22% 22% 18% -4% -4%
Nat iona l C i ty 28% 25% 29% 1% 5%
Oceans ide 11% 17% 13% 2% -5%
San Diego 14% 14% 13% -1% -2%
Sheri ff - Total 14% 21% 20% 7% -1%
De l Mar -- -- -- -- --
Enc in i tas 8% 17% 18% 10% 1%
Imper ia l Beach 10% 12% 10% 0% -2%
Lemon Grove 18% 33% 40% 22% 8%
Poway 17% 22% 19% 2% -2%
San Marcos 18% 28% 26% 8% -2%
Santee 19% 39% 31% 12% -8%
So lana Beach -- -- 11% -- --
V i s ta 16% 21% 17% 1% -4%
Unincorporated 12% 18% 18% 6% 0%
4S Ranch -- -- -- -- --
A lp ine -- 15% 12% -- -2%
Fa l lbrook 12% 14% 17% 5% 3%
Ramona 19% 26% 22% 3% -4%
Va l ley Center 15% 20% 23% 8% 3%
TOTAL 15% 17% 17% 2% 0%
NOTES: FBI Index property crimes include larceny, burglary, and motor vehicle theft. “Sheriff-Total" includes the contract cities and the unincorporated area
served by the San Diego County Sheriff's Department. Camp Pendleton is not included. "Unincorporated" includes 4S Ranch, Alpine, Fallbrook, Ramona, and
Valley Center, as well as the unincorporated areas for which crime data are not individually shown (Campo, Julian, Lakeside, Pine Valley, Ranchita, Spring
Valley, and the unincorporated areas of Encinitas, Imperial Beach, Lemon Grove, Poway, San Marcos, Santee, and Vista). Clearance rates based on reported
incidents or cases cleared numbering 30 or less are not computed for this table.
SOURCE: SANDAG
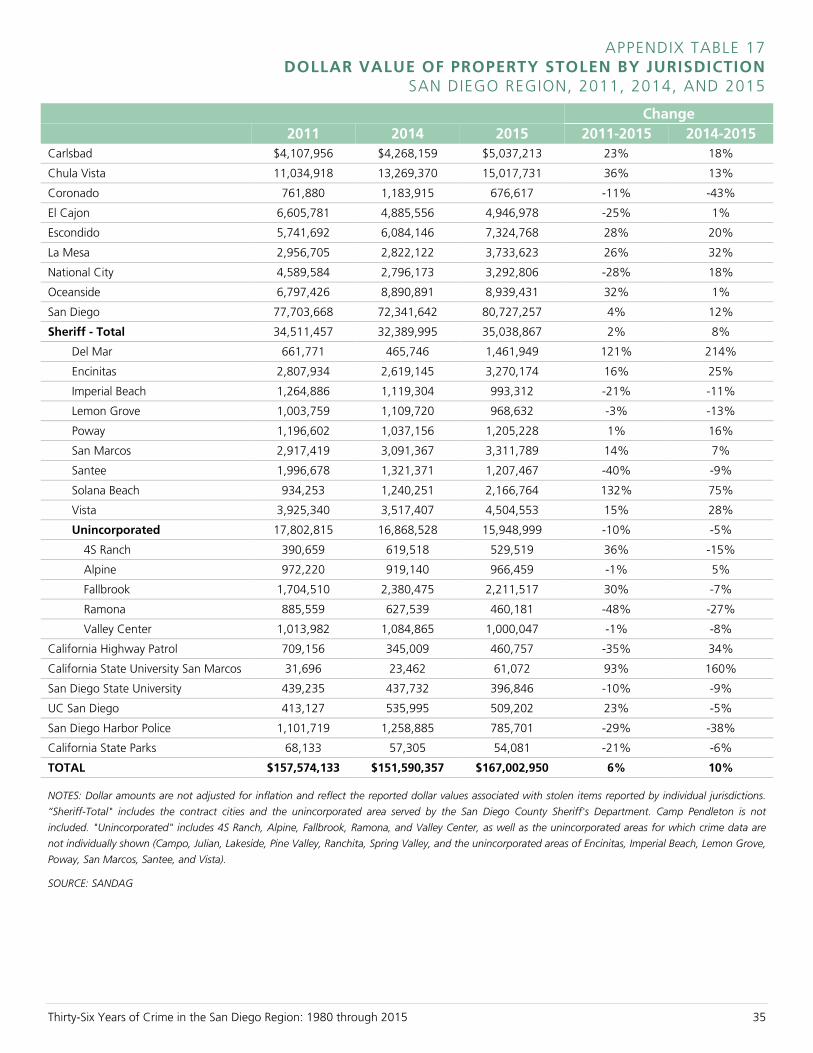
Thirty-Six Years of Crime in the San Diego Region: 1980 through 2015 35
APPENDIX TABLE 17 DOLLAR VALUE OF PROPERTY STOLEN BY JURISDICTION
SAN DIEGO REGION, 2011, 2014, AND 2015
Change
2011 2014 2015 2011-2015 2014-2015
Carlsbad $4,107,956 $4,268,159 $5,037,213 23% 18%
Chula Vista 11,034,918 13,269,370 15,017,731 36% 13%
Coronado 761,880 1,183,915 676,617 -11% -43%
El Cajon 6,605,781 4,885,556 4,946,978 -25% 1%
Escondido 5,741,692 6,084,146 7,324,768 28% 20%
La Mesa 2,956,705 2,822,122 3,733,623 26% 32%
National City 4,589,584 2,796,173 3,292,806 -28% 18%
Oceanside 6,797,426 8,890,891 8,939,431 32% 1%
San Diego 77,703,668 72,341,642 80,727,257 4% 12%
Sheriff - Total 34,511,457 32,389,995 35,038,867 2% 8%
Del Mar 661,771 465,746 1,461,949 121% 214%
Encinitas 2,807,934 2,619,145 3,270,174 16% 25%
Imperial Beach 1,264,886 1,119,304 993,312 -21% -11%
Lemon Grove 1,003,759 1,109,720 968,632 -3% -13%
Poway 1,196,602 1,037,156 1,205,228 1% 16%
San Marcos 2,917,419 3,091,367 3,311,789 14% 7%
Santee 1,996,678 1,321,371 1,207,467 -40% -9%
Solana Beach 934,253 1,240,251 2,166,764 132% 75%
Vista 3,925,340 3,517,407 4,504,553 15% 28%
Unincorporated 17,802,815 16,868,528 15,948,999 -10% -5%
4S Ranch 390,659 619,518 529,519 36% -15%
Alpine 972,220 919,140 966,459 -1% 5%
Fallbrook 1,704,510 2,380,475 2,211,517 30% -7%
Ramona 885,559 627,539 460,181 -48% -27%
Valley Center 1,013,982 1,084,865 1,000,047 -1% -8%
California Highway Patrol 709,156 345,009 460,757 -35% 34%
California State University San Marcos 31,696 23,462 61,072 93% 160%
San Diego State University 439,235 437,732 396,846 -10% -9%
UC San Diego 413,127 535,995 509,202 23% -5%
San Diego Harbor Police 1,101,719 1,258,885 785,701 -29% -38%
California State Parks 68,133 57,305 54,081 -21% -6%
TOTAL $157,574,133 $151,590,357 $167,002,950 6% 10%
NOTES: Dollar amounts are not adjusted for inflation and reflect the reported dollar values associated with stolen items reported by individual jurisdictions.
“Sheriff-Total" includes the contract cities and the unincorporated area served by the San Diego County Sheriff's Department. Camp Pendleton is not
included. "Unincorporated" includes 4S Ranch, Alpine, Fallbrook, Ramona, and Valley Center, as well as the unincorporated areas for which crime data are
not individually shown (Campo, Julian, Lakeside, Pine Valley, Ranchita, Spring Valley, and the unincorporated areas of Encinitas, Imperial Beach, Lemon Grove,
Poway, San Marcos, Santee, and Vista).
SOURCE: SANDAG
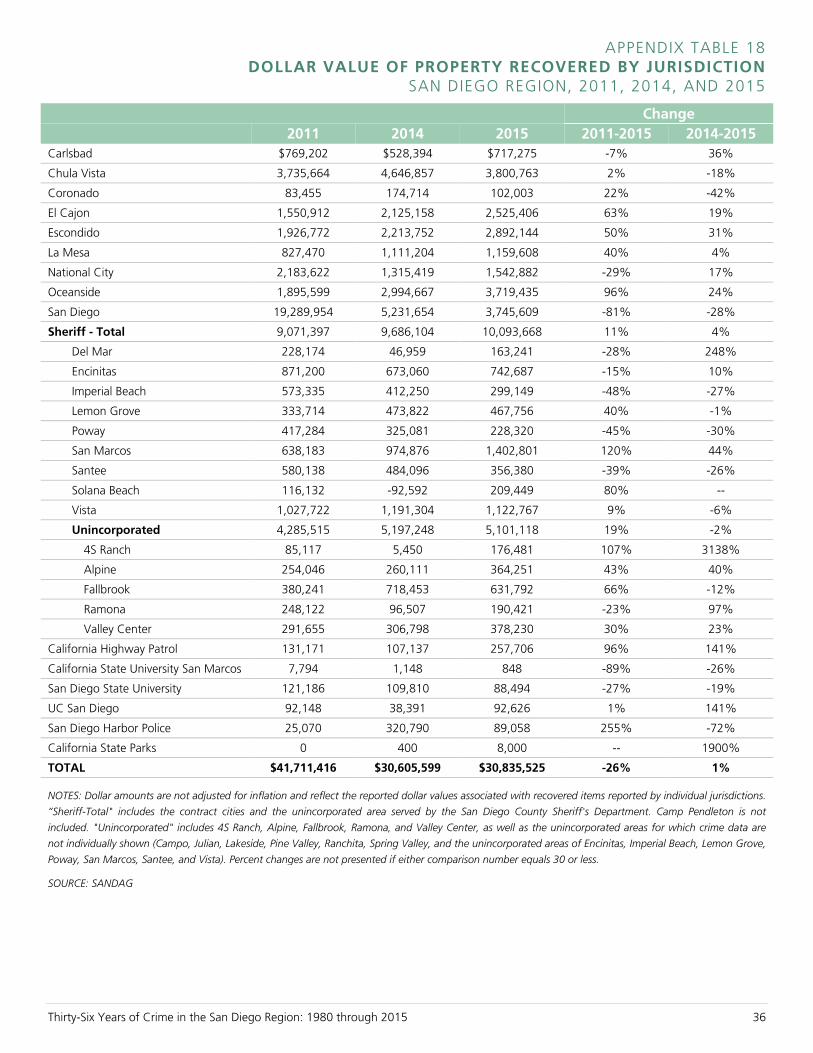
Thirty-Six Years of Crime in the San Diego Region: 1980 through 2015 36
APPENDIX TABLE 18 DOLLAR VALUE OF PROPERTY RECOVERED BY JURISDICTION
SAN DIEGO REGION, 2011, 2014, AND 2015
Change
2011 2014 2015 2011-2015 2014-2015
Carlsbad $769,202 $528,394 $717,275 -7% 36%
Chula Vista 3,735,664 4,646,857 3,800,763 2% -18%
Coronado 83,455 174,714 102,003 22% -42%
El Cajon 1,550,912 2,125,158 2,525,406 63% 19%
Escondido 1,926,772 2,213,752 2,892,144 50% 31%
La Mesa 827,470 1,111,204 1,159,608 40% 4%
National City 2,183,622 1,315,419 1,542,882 -29% 17%
Oceanside 1,895,599 2,994,667 3,719,435 96% 24%
San Diego 19,289,954 5,231,654 3,745,609 -81% -28%
Sheriff - Total 9,071,397 9,686,104 10,093,668 11% 4%
Del Mar 228,174 46,959 163,241 -28% 248%
Encinitas 871,200 673,060 742,687 -15% 10%
Imperial Beach 573,335 412,250 299,149 -48% -27%
Lemon Grove 333,714 473,822 467,756 40% -1%
Poway 417,284 325,081 228,320 -45% -30%
San Marcos 638,183 974,876 1,402,801 120% 44%
Santee 580,138 484,096 356,380 -39% -26%
Solana Beach 116,132 -92,592 209,449 80% --
Vista 1,027,722 1,191,304 1,122,767 9% -6%
Unincorporated 4,285,515 5,197,248 5,101,118 19% -2%
4S Ranch 85,117 5,450 176,481 107% 3138%
Alpine 254,046 260,111 364,251 43% 40%
Fallbrook 380,241 718,453 631,792 66% -12%
Ramona 248,122 96,507 190,421 -23% 97%
Valley Center 291,655 306,798 378,230 30% 23%
California Highway Patrol 131,171 107,137 257,706 96% 141%
California State University San Marcos 7,794 1,148 848 -89% -26%
San Diego State University 121,186 109,810 88,494 -27% -19%
UC San Diego 92,148 38,391 92,626 1% 141%
San Diego Harbor Police 25,070 320,790 89,058 255% -72%
California State Parks 0 400 8,000 -- 1900%
TOTAL $41,711,416 $30,605,599 $30,835,525 -26% 1%
NOTES: Dollar amounts are not adjusted for inflation and reflect the reported dollar values associated with recovered items reported by individual jurisdictions.
“Sheriff-Total" includes the contract cities and the unincorporated area served by the San Diego County Sheriff's Department. Camp Pendleton is not
included. "Unincorporated" includes 4S Ranch, Alpine, Fallbrook, Ramona, and Valley Center, as well as the unincorporated areas for which crime data are
not individually shown (Campo, Julian, Lakeside, Pine Valley, Ranchita, Spring Valley, and the unincorporated areas of Encinitas, Imperial Beach, Lemon Grove,
Poway, San Marcos, Santee, and Vista). Percent changes are not presented if either comparison number equals 30 or less.
SOURCE: SANDAG
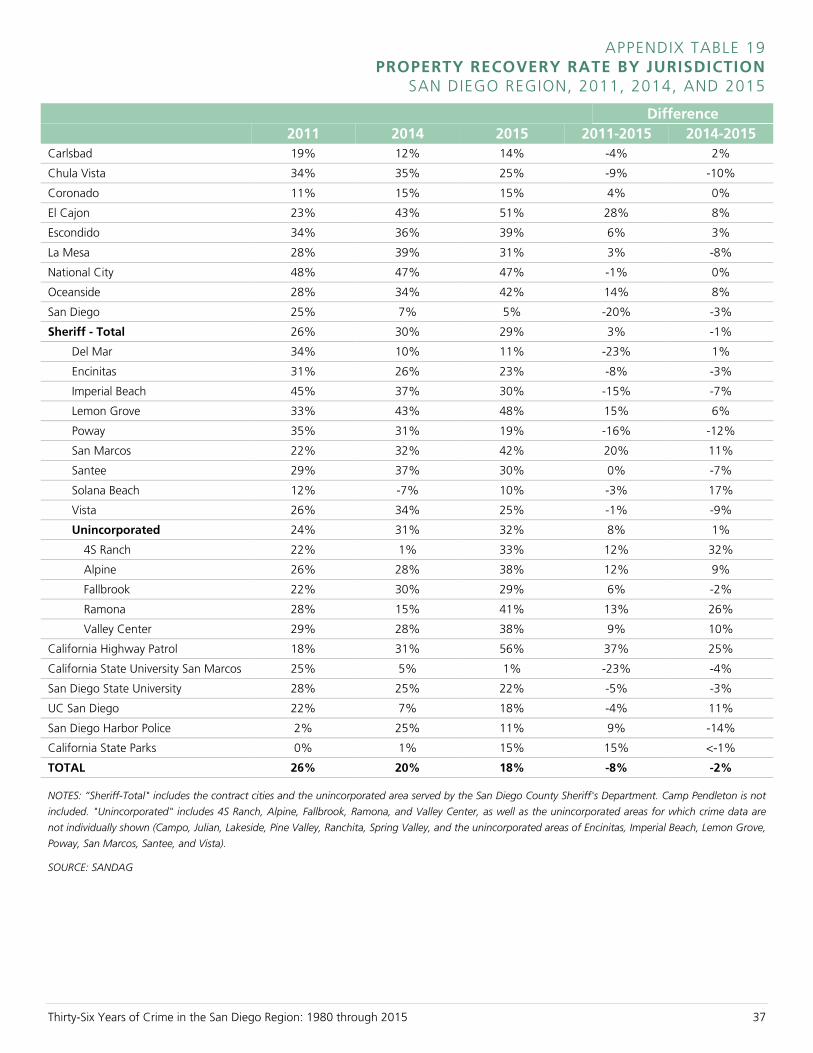
Thirty-Six Years of Crime in the San Diego Region: 1980 through 2015 37
APPENDIX TABLE 19 PROPERTY RECOVERY RATE BY JURISDICTION
SAN DIEGO REGION, 2011, 2014, AND 2015
Difference
2011 2014 2015 2011-2015 2014-2015
Carlsbad 19% 12% 14% -4% 2%
Chula Vista 34% 35% 25% -9% -10%
Coronado 11% 15% 15% 4% 0%
El Cajon 23% 43% 51% 28% 8%
Escondido 34% 36% 39% 6% 3%
La Mesa 28% 39% 31% 3% -8%
National City 48% 47% 47% -1% 0%
Oceanside 28% 34% 42% 14% 8%
San Diego 25% 7% 5% -20% -3%
Sheriff - Total 26% 30% 29% 3% -1%
Del Mar 34% 10% 11% -23% 1%
Encinitas 31% 26% 23% -8% -3%
Imperial Beach 45% 37% 30% -15% -7%
Lemon Grove 33% 43% 48% 15% 6%
Poway 35% 31% 19% -16% -12%
San Marcos 22% 32% 42% 20% 11%
Santee 29% 37% 30% 0% -7%
Solana Beach 12% -7% 10% -3% 17%
Vista 26% 34% 25% -1% -9%
Unincorporated 24% 31% 32% 8% 1%
4S Ranch 22% 1% 33% 12% 32%
Alpine 26% 28% 38% 12% 9%
Fallbrook 22% 30% 29% 6% -2%
Ramona 28% 15% 41% 13% 26%
Valley Center 29% 28% 38% 9% 10%
California Highway Patrol 18% 31% 56% 37% 25%
California State University San Marcos 25% 5% 1% -23% -4%
San Diego State University 28% 25% 22% -5% -3%
UC San Diego 22% 7% 18% -4% 11%
San Diego Harbor Police 2% 25% 11% 9% -14%
California State Parks 0% 1% 15% 15% <-1%
TOTAL 26% 20% 18% -8% -2%
NOTES: “Sheriff-Total" includes the contract cities and the unincorporated area served by the San Diego County Sheriff's Department. Camp Pendleton is not
included. "Unincorporated" includes 4S Ranch, Alpine, Fallbrook, Ramona, and Valley Center, as well as the unincorporated areas for which crime data are
not individually shown (Campo, Julian, Lakeside, Pine Valley, Ranchita, Spring Valley, and the unincorporated areas of Encinitas, Imperial Beach, Lemon Grove,
Poway, San Marcos, Santee, and Vista).
SOURCE: SANDAG
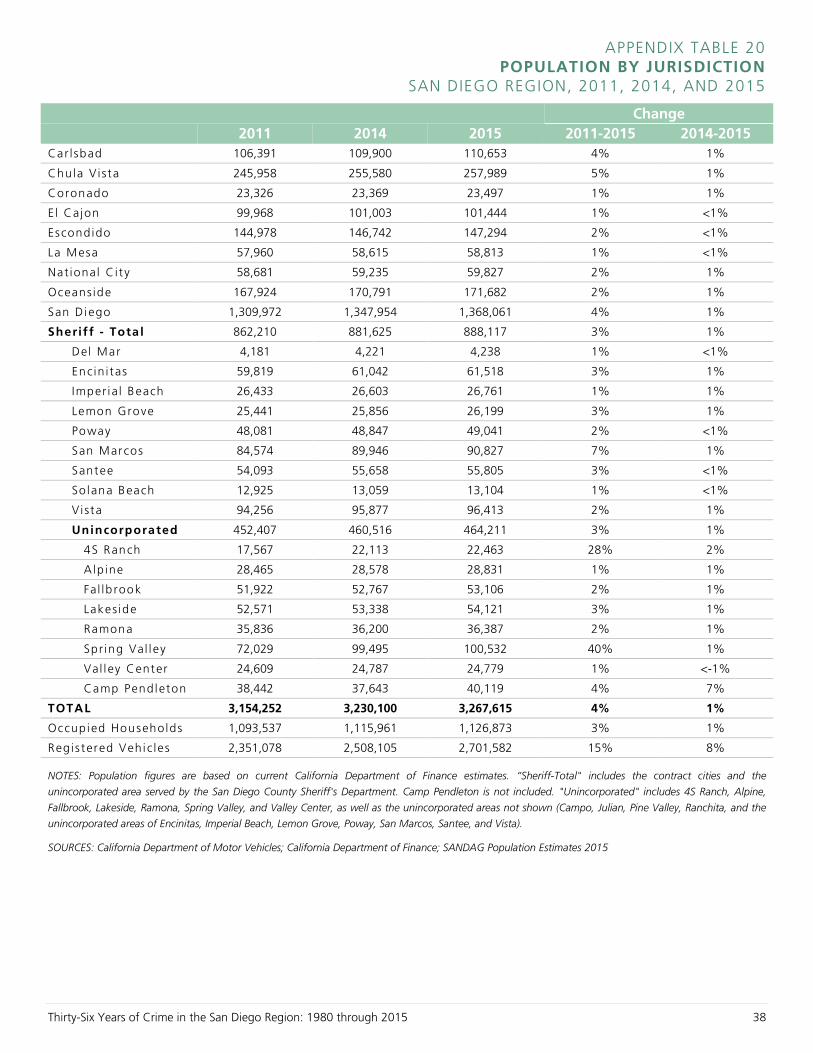
Thirty-Six Years of Crime in the San Diego Region: 1980 through 2015 38
APPENDIX TABLE 20 POPULATION BY JURISDICTION
SAN DIEGO REGION, 2011, 2014, AND 2015
Change
2011 2014 2015 2011-2015 2014-2015
Car l sbad 106,391 109,900 110,653 4% 1%
Chula V ista 245,958 255,580 257,989 5% 1%
Coronado 23,326 23,369 23,497 1% 1%
El Cajon 99,968 101,003 101,444 1% <1%
Escondido 144,978 146,742 147,294 2% <1%
La Mesa 57,960 58,615 58,813 1% <1%
Nat ional Ci t y 58,681 59,235 59,827 2% 1%
Oceans ide 167,924 170,791 171,682 2% 1%
San Diego 1,309,972 1,347,954 1,368,061 4% 1%
Sherif f - Tota l 862,210 881,625 888,117 3% 1%
Del Mar 4,181 4,221 4,238 1% <1%
Encin i tas 59,819 61,042 61,518 3% 1%
Imper i a l Beach 26,433 26,603 26,761 1% 1%
Lemon Grove 25,441 25,856 26,199 3% 1%
Poway 48,081 48,847 49,041 2% <1%
San Marcos 84,574 89,946 90,827 7% 1%
Santee 54,093 55,658 55,805 3% <1%
So lana Beach 12,925 13,059 13,104 1% <1%
Vista 94,256 95,877 96,413 2% 1%
Unincorporated 452,407 460,516 464,211 3% 1%
4S Ranch 17,567 22,113 22,463 28% 2%
Alp ine 28,465 28,578 28,831 1% 1%
Fal lb rook 51,922 52,767 53,106 2% 1%
Lakes ide 52,571 53,338 54,121 3% 1%
Ramona 35,836 36,200 36,387 2% 1%
Spr ing Val l ey 72,029 99,495 100,532 40% 1%
Val l ey Center 24,609 24,787 24,779 1% <-1%
Camp Pendleton 38,442 37,643 40,119 4% 7%
TOTAL 3,154,252 3,230,100 3,267,615 4% 1%
Occupied Households 1,093,537 1,115,961 1,126,873 3% 1%
Regis tered Vehi c les 2,351,078 2,508,105 2,701,582 15% 8%
NOTES: Population figures are based on current California Department of Finance estimates. “Sheriff-Total" includes the contract cities and the
unincorporated area served by the San Diego County Sheriff's Department. Camp Pendleton is not included. "Unincorporated" includes 4S Ranch, Alpine,
Fallbrook, Lakeside, Ramona, Spring Valley, and Valley Center, as well as the unincorporated areas not shown (Campo, Julian, Pine Valley, Ranchita, and the
unincorporated areas of Encinitas, Imperial Beach, Lemon Grove, Poway, San Marcos, Santee, and Vista).
SOURCES: California Department of Motor Vehicles; California Department of Finance; SANDAG Population Estimates 2015